Embed Size (px)
Citation preview

PROSPECTS IN DEVELOPMENT OF QUALITY RICE FOR HUMAN NUTRITION: A REVIEW 1Malays. Appl. Biol. (2015) 44(2): 1–31
* To whom correspondence should be addressed.
PROSPECTS IN DEVELOPMENT OF QUALITY RICE FORHUMAN NUTRITION
SE, C.H., KHOR, B.H. and KARUPAIAH, T.*
Dietetics Program, School of Healthcare Sciences, Faculty of Health Sciences,Universiti Kebangsaan Malaysia, Jalan Raja Muda Abdul Aziz,
50300 Kuala Lumpur, Malaysia.Telephone: +603-92897245. Fax: +603-26947621E-mail: [email protected] / [email protected]
ABSTRACT
Rice in the human diet serves underprivileged populations in Asia as a means of nutritional replenishment for energy andprotein as well serving as a vehicle for micronutrient fortification. About 85% of rice consumption is mainly white rice.A possible relationship between white rice consumption and health risk exists. The threat is real enough for the scientificcommunity to promote wholegrain consumption in place of refined grains. In the transitioning food environment, white riceis categorised as a refined grain and is thus implicated in the development of non-communicable diseases (NCDs). There isconsiderable interest in exploring glycaemic index (GI) in relation to the consumption of different rice varieties. The variableglycaemic response to rice types is better appreciated from the viewpoint of factors that moderate this response. Geneticmake-up, physicochemical properties, amylose and dietary fibre content, post-harvesting processing as well as cooking methodsare influential factors in determining GI variability. To date, new rice varieties bio-fortified with micronutrients such as iron,zinc and beta-carotene have been produced and useful in ameliorating the micronutrient deficiencies such as iron deficiencyanaemia, stunted growth and xerophthalmia affecting children or adults in developing countries. Rice breeding and improvementprograms play a major role in safeguarding the food environment, by taking into account traits that will improve rice qualityin terms of GI as well as micronutrient capacity.
Key words: Rice, non-communicable diseases, human nutrition, quality, glycaemic index
INTRODUCTION
Rice is a dietary staple, and for most Asianpopulations, serves as a food crop that is integralwith sociocultural identities. Indeed, if the historyof rice cultivation is traced, it’s rooting as a foodcrop was associated with the earliest civilizationsof Homo sapiens in China and India (Fuller, 2011;Callaway, 2014). The issue of ‘when, where andhow’ rice was brought into cultivation andeventually domesticated by humans has beencontroversial as Fuller et al. (2009) claim ‘becauserice is embedded within cultural identities withindifferent nations in Asia, everybody wants to havehad rice first’ (Liu et al., 2007; Fuller et al., 2009).Recently, similarities in the genomic patterns ofwild and domestic strains of japonica and indicarice subtypes were reported, suggesting earlydomestications in both China and India occurring
between 5000-4000 BC (Gross & Zhao, 2014). It wasonly in the 1st millennium BC that lowland indicarice types were brought to Southeast Asia via tradingand kept for cultivation (Fuller, 2011). Today in the21st century, more than half the global populationdepends on rice for energy sustenance, with almost90% of world rice production alone originating fromAsian countries, such as China, India, Bangladesh,Indonesia, Myanmar and Thailand (Khush, 2005).
Commercially, more than 2000 varieties of riceare cultivated around the globe (Deepa et al., 2008).About 85% of consumed rice is in the form ofpolished white rice, with pigmented rice making upthe remaining (Deng et al., 2013). Pigmented rice isthe dehusked grain, which exhibits a characteristicred, purple or black pigmentation attributable toanthocyanin compounds (Abdel-Aal et al., 2006;Deng et al., 2013). Alternately, brown rice may referto pigmented rice or non-pigmented rice with thebran intact (Deng et al., 2013).
2 PROSPECTS IN DEVELOPMENT OF QUALITY RICE FOR HUMAN NUTRITION: A REVIEW
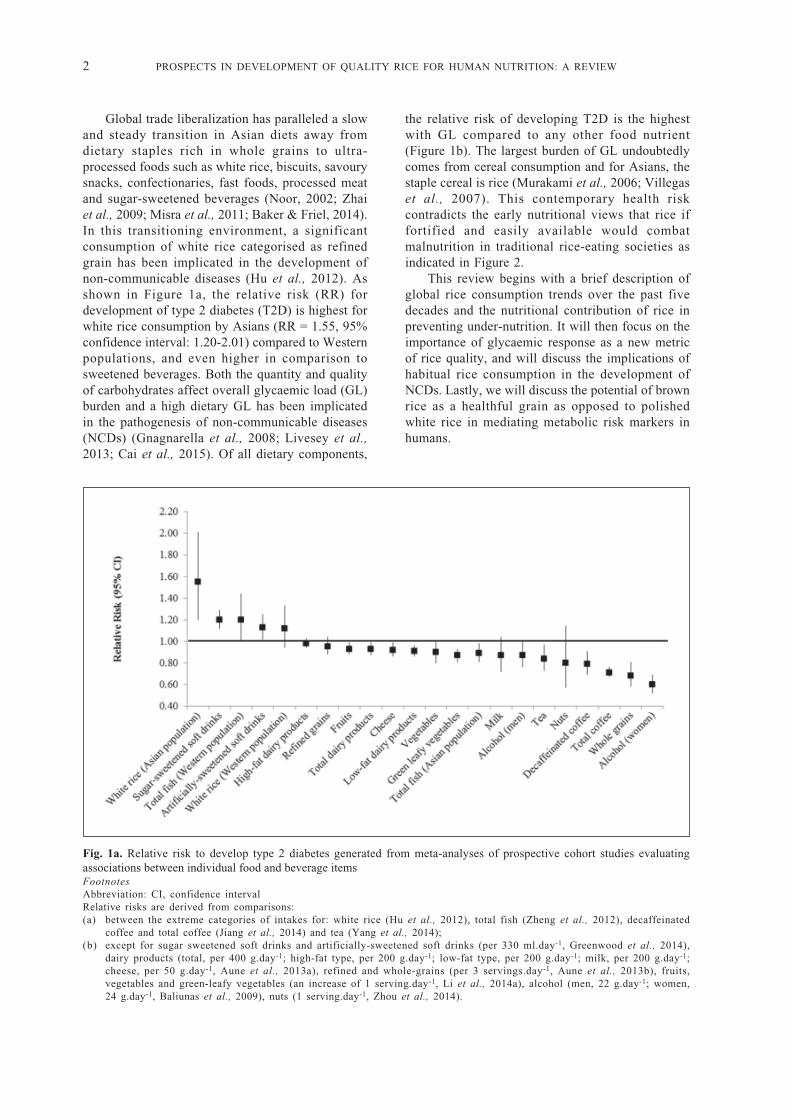
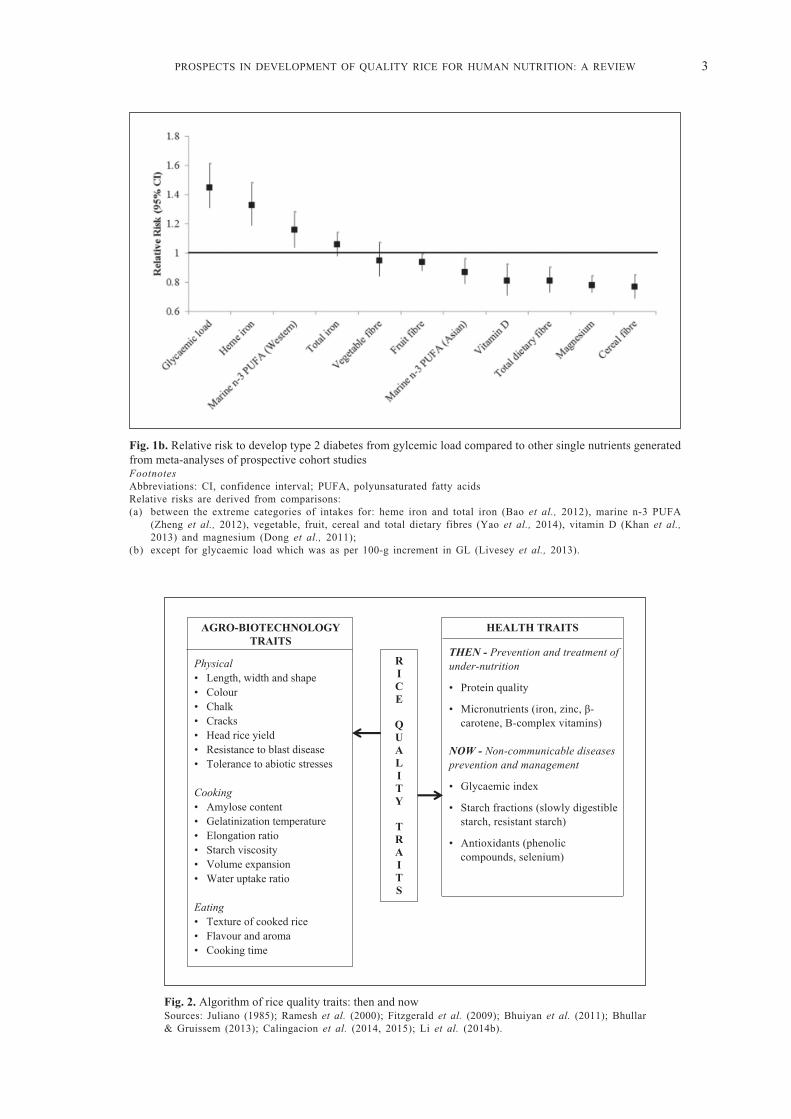
Global trade liberalization has paralleled a slowand steady transition in Asian diets away fromdietary staples rich in whole grains to ultra-processed foods such as white rice, biscuits, savourysnacks, confectionaries, fast foods, processed meatand sugar-sweetened beverages (Noor, 2002; Zhaiet al., 2009; Misra et al., 2011; Baker & Friel, 2014).In this transitioning environment, a significantconsumption of white rice categorised as refinedgrain has been implicated in the development ofnon-communicable diseases (Hu et al., 2012). Asshown in Figure 1a, the relative risk (RR) fordevelopment of type 2 diabetes (T2D) is highest forwhite rice consumption by Asians (RR = 1.55, 95%confidence interval: 1.20-2.01) compared to Westernpopulations, and even higher in comparison tosweetened beverages. Both the quantity and qualityof carbohydrates affect overall glycaemic load (GL)burden and a high dietary GL has been implicatedin the pathogenesis of non-communicable diseases(NCDs) (Gnagnarella et al., 2008; Livesey et al.,2013; Cai et al., 2015). Of all dietary components,
the relative risk of developing T2D is the highestwith GL compared to any other food nutrient(Figure 1b). The largest burden of GL undoubtedlycomes from cereal consumption and for Asians, thestaple cereal is rice (Murakami et al., 2006; Villegaset al., 2007). This contemporary health riskcontradicts the early nutritional views that rice iffortified and easily available would combatmalnutrition in traditional rice-eating societies asindicated in Figure 2.
This review begins with a brief description ofglobal rice consumption trends over the past fivedecades and the nutritional contribution of rice inpreventing under-nutrition. It will then focus on theimportance of glycaemic response as a new metricof rice quality, and will discuss the implications ofhabitual rice consumption in the development ofNCDs. Lastly, we will discuss the potential of brownrice as a healthful grain as opposed to polishedwhite rice in mediating metabolic risk markers inhumans.
Fig. 1a. Relative risk to develop type 2 diabetes generated from meta-analyses of prospective cohort studies evaluatingassociations between individual food and beverage itemsFootnotesAbbreviation: CI, confidence intervalRelative risks are derived from comparisons:(a) between the extreme categories of intakes for: white rice (Hu et al., 2012), total fish (Zheng et al., 2012), decaffeinated
coffee and total coffee (Jiang et al., 2014) and tea (Yang et al., 2014);(b) except for sugar sweetened soft drinks and artificially-sweetened soft drinks (per 330 ml.day-1, Greenwood et al., 2014),
dairy products (total, per 400 g.day-1; high-fat type, per 200 g.day-1; low-fat type, per 200 g.day-1; milk, per 200 g.day-1;cheese, per 50 g.day-1, Aune et al., 2013a), refined and whole-grains (per 3 servings.day-1, Aune et al., 2013b), fruits,vegetables and green-leafy vegetables (an increase of 1 serving.day-1, Li et al., 2014a), alcohol (men, 22 g.day-1; women,24 g.day-1, Baliunas et al., 2009), nuts (1 serving.day-1, Zhou et al., 2014).
PROSPECTS IN DEVELOPMENT OF QUALITY RICE FOR HUMAN NUTRITION: A REVIEW 3
Fig. 1b. Relative risk to develop type 2 diabetes from gylcemic load compared to other single nutrients generatedfrom meta-analyses of prospective cohort studiesFootnotesAbbreviations: CI, confidence interval; PUFA, polyunsaturated fatty acidsRelative risks are derived from comparisons:(a) between the extreme categories of intakes for: heme iron and total iron (Bao et al., 2012), marine n-3 PUFA
(Zheng et al., 2012), vegetable, fruit, cereal and total dietary fibres (Yao et al., 2014), vitamin D (Khan et al.,2013) and magnesium (Dong et al., 2011);
(b) except for glycaemic load which was as per 100-g increment in GL (Livesey et al., 2013).
Fig. 2. Algorithm of rice quality traits: then and nowSources: Juliano (1985); Ramesh et al. (2000); Fitzgerald et al. (2009); Bhuiyan et al. (2011); Bhullar& Gruissem (2013); Calingacion et al. (2014, 2015); Li et al. (2014b).
4 PROSPECTS IN DEVELOPMENT OF QUALITY RICE FOR HUMAN NUTRITION: A REVIEW
RICE CONSUMPTION TRENDS WORLDWIDE,ASIA AND MALAYSIA
Worldwide Trends on Rice ConsumptionThere is clear indication that the quantity of
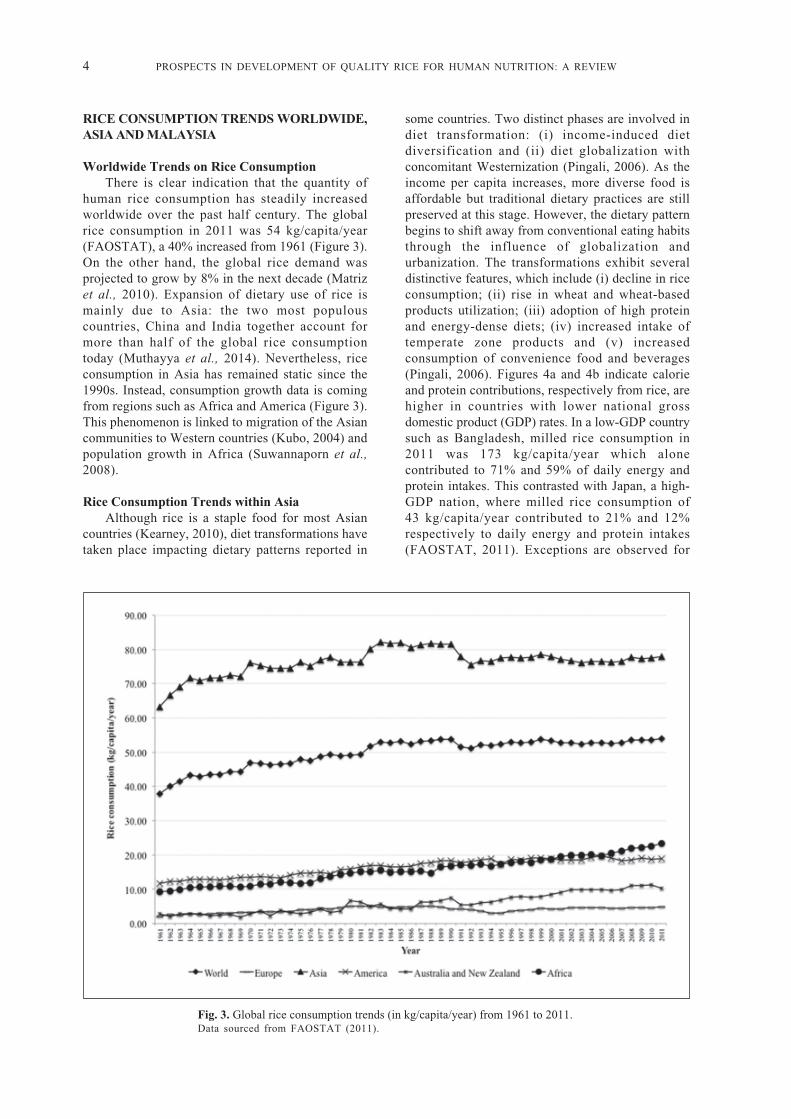
human rice consumption has steadily increasedworldwide over the past half century. The globalrice consumption in 2011 was 54 kg/capita/year(FAOSTAT), a 40% increased from 1961 (Figure 3).On the other hand, the global rice demand wasprojected to grow by 8% in the next decade (Matrizet al., 2010). Expansion of dietary use of rice ismainly due to Asia: the two most populouscountries, China and India together account formore than half of the global rice consumptiontoday (Muthayya et al., 2014). Nevertheless, riceconsumption in Asia has remained static since the1990s. Instead, consumption growth data is comingfrom regions such as Africa and America (Figure 3).This phenomenon is linked to migration of the Asiancommunities to Western countries (Kubo, 2004) andpopulation growth in Africa (Suwannaporn et al.,2008).
Rice Consumption Trends within AsiaAlthough rice is a staple food for most Asian
countries (Kearney, 2010), diet transformations havetaken place impacting dietary patterns reported in
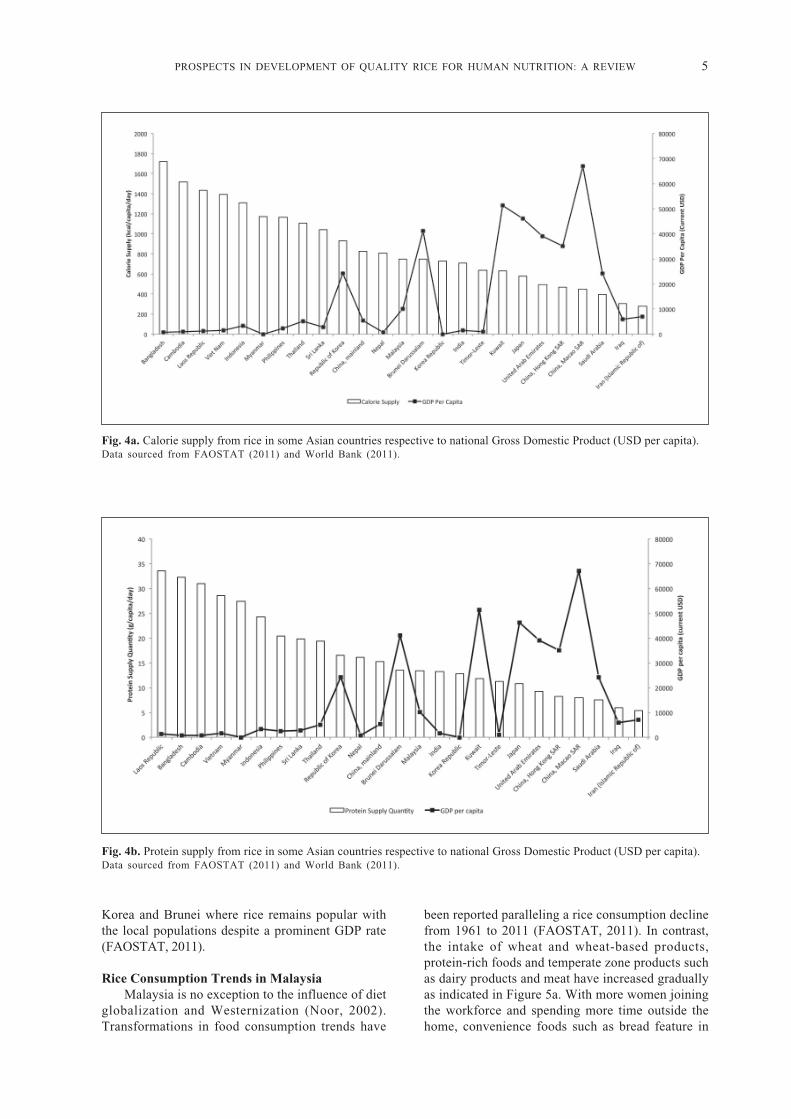
some countries. Two distinct phases are involved indiet transformation: (i) income-induced dietdiversification and (ii) diet globalization withconcomitant Westernization (Pingali, 2006). As theincome per capita increases, more diverse food isaffordable but traditional dietary practices are stillpreserved at this stage. However, the dietary patternbegins to shift away from conventional eating habitsthrough the influence of globalization andurbanization. The transformations exhibit severaldistinctive features, which include (i) decline in riceconsumption; (ii) rise in wheat and wheat-basedproducts utilization; (iii) adoption of high proteinand energy-dense diets; (iv) increased intake oftemperate zone products and (v) increasedconsumption of convenience food and beverages(Pingali, 2006). Figures 4a and 4b indicate calorieand protein contributions, respectively from rice, arehigher in countries with lower national grossdomestic product (GDP) rates. In a low-GDP countrysuch as Bangladesh, milled rice consumption in2011 was 173 kg/capita/year which alonecontributed to 71% and 59% of daily energy andprotein intakes. This contrasted with Japan, a high-GDP nation, where milled rice consumption of43 kg/capita/year contributed to 21% and 12%respectively to daily energy and protein intakes(FAOSTAT, 2011). Exceptions are observed for
Fig. 3. Global rice consumption trends (in kg/capita/year) from 1961 to 2011.Data sourced from FAOSTAT (2011).
PROSPECTS IN DEVELOPMENT OF QUALITY RICE FOR HUMAN NUTRITION: A REVIEW 5
Fig. 4a. Calorie supply from rice in some Asian countries respective to national Gross Domestic Product (USD per capita).Data sourced from FAOSTAT (2011) and World Bank (2011).
Fig. 4b. Protein supply from rice in some Asian countries respective to national Gross Domestic Product (USD per capita).Data sourced from FAOSTAT (2011) and World Bank (2011).
Korea and Brunei where rice remains popular withthe local populations despite a prominent GDP rate(FAOSTAT, 2011).
Rice Consumption Trends in MalaysiaMalaysia is no exception to the influence of diet
globalization and Westernization (Noor, 2002).Transformations in food consumption trends have
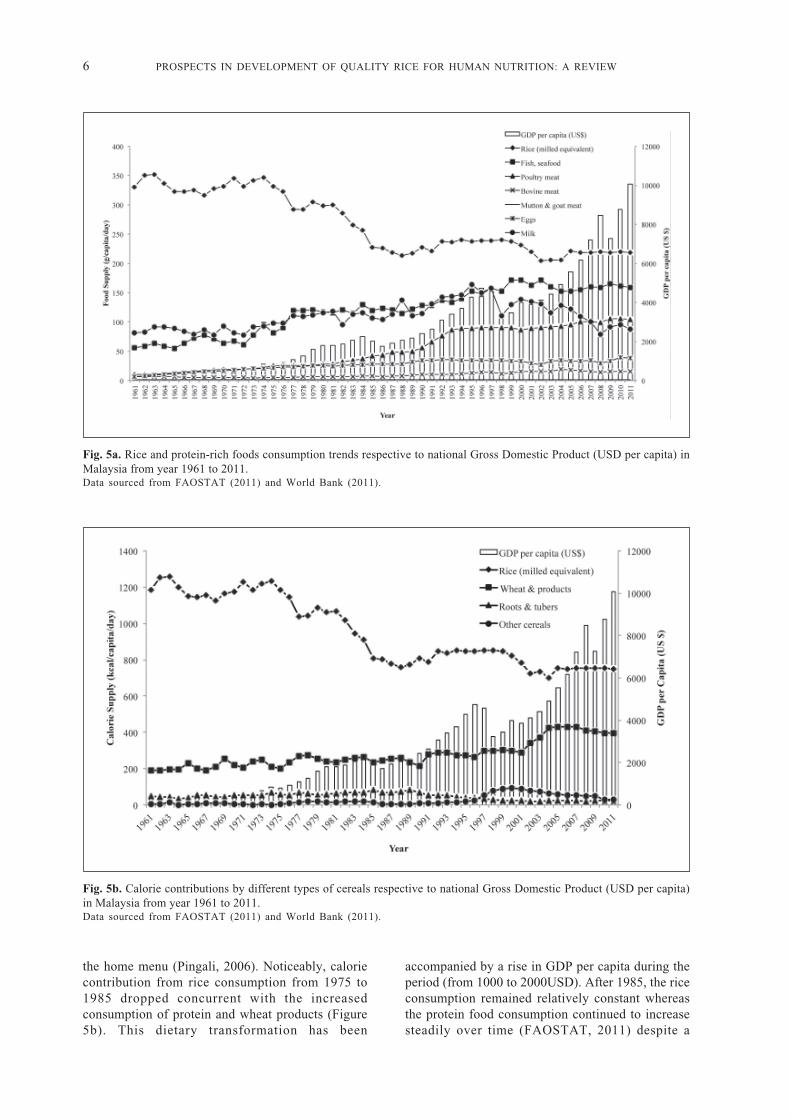
been reported paralleling a rice consumption declinefrom 1961 to 2011 (FAOSTAT, 2011). In contrast,the intake of wheat and wheat-based products,protein-rich foods and temperate zone products suchas dairy products and meat have increased graduallyas indicated in Figure 5a. With more women joiningthe workforce and spending more time outside thehome, convenience foods such as bread feature in
6 PROSPECTS IN DEVELOPMENT OF QUALITY RICE FOR HUMAN NUTRITION: A REVIEW
Fig. 5a. Rice and protein-rich foods consumption trends respective to national Gross Domestic Product (USD per capita) inMalaysia from year 1961 to 2011.Data sourced from FAOSTAT (2011) and World Bank (2011).
Fig. 5b. Calorie contributions by different types of cereals respective to national Gross Domestic Product (USD per capita)in Malaysia from year 1961 to 2011.Data sourced from FAOSTAT (2011) and World Bank (2011).
the home menu (Pingali, 2006). Noticeably, caloriecontribution from rice consumption from 1975 to1985 dropped concurrent with the increasedconsumption of protein and wheat products (Figure5b). This dietary transformation has been
accompanied by a rise in GDP per capita during theperiod (from 1000 to 2000USD). After 1985, the riceconsumption remained relatively constant whereasthe protein food consumption continued to increasesteadily over time (FAOSTAT, 2011) despite a
PROSPECTS IN DEVELOPMENT OF QUALITY RICE FOR HUMAN NUTRITION: A REVIEW 7
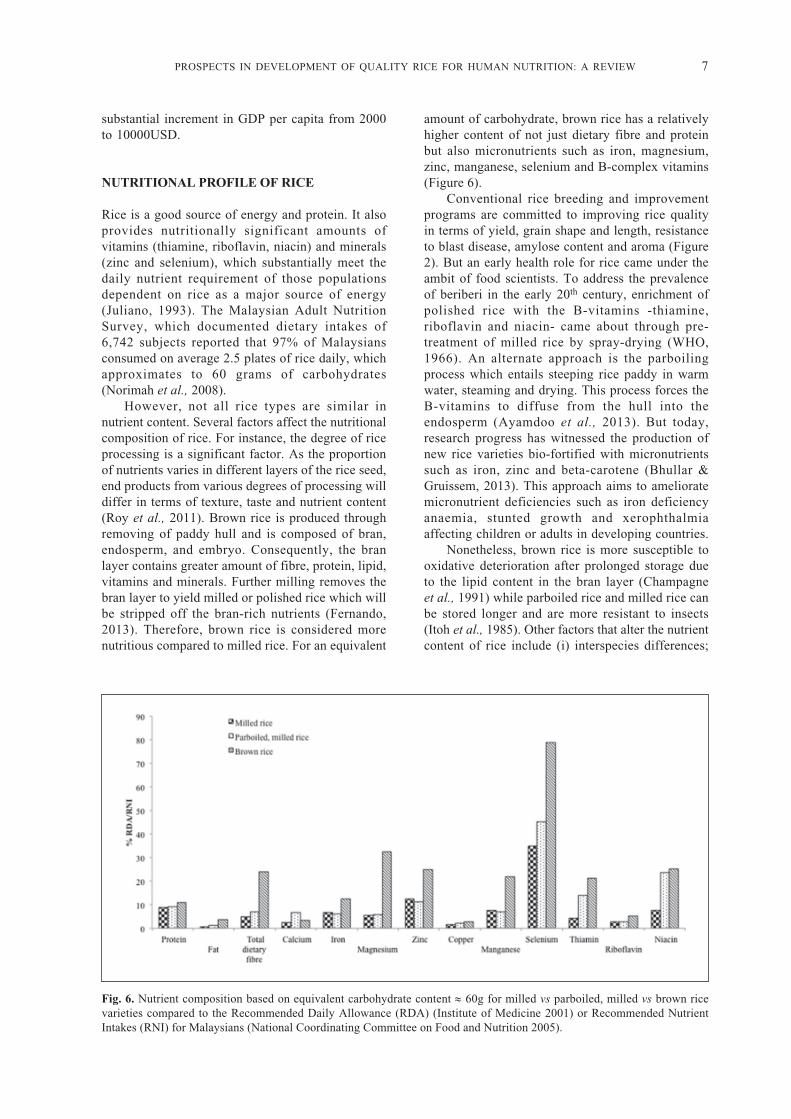
Fig. 6. Nutrient composition based on equivalent carbohydrate content ≈ 60g for milled vs parboiled, milled vs brown ricevarieties compared to the Recommended Daily Allowance (RDA) (Institute of Medicine 2001) or Recommended NutrientIntakes (RNI) for Malaysians (National Coordinating Committee on Food and Nutrition 2005).
substantial increment in GDP per capita from 2000to 10000USD.
NUTRITIONAL PROFILE OF RICE
Rice is a good source of energy and protein. It alsoprovides nutritionally significant amounts ofvitamins (thiamine, riboflavin, niacin) and minerals(zinc and selenium), which substantially meet thedaily nutrient requirement of those populationsdependent on rice as a major source of energy(Juliano, 1993). The Malaysian Adult NutritionSurvey, which documented dietary intakes of6,742 subjects reported that 97% of Malaysiansconsumed on average 2.5 plates of rice daily, whichapproximates to 60 grams of carbohydrates(Norimah et al., 2008).
However, not all rice types are similar innutrient content. Several factors affect the nutritionalcomposition of rice. For instance, the degree of riceprocessing is a significant factor. As the proportionof nutrients varies in different layers of the rice seed,end products from various degrees of processing willdiffer in terms of texture, taste and nutrient content(Roy et al., 2011). Brown rice is produced throughremoving of paddy hull and is composed of bran,endosperm, and embryo. Consequently, the branlayer contains greater amount of fibre, protein, lipid,vitamins and minerals. Further milling removes thebran layer to yield milled or polished rice which willbe stripped off the bran-rich nutrients (Fernando,2013). Therefore, brown rice is considered morenutritious compared to milled rice. For an equivalent
amount of carbohydrate, brown rice has a relativelyhigher content of not just dietary fibre and proteinbut also micronutrients such as iron, magnesium,zinc, manganese, selenium and B-complex vitamins(Figure 6).
Conventional rice breeding and improvementprograms are committed to improving rice qualityin terms of yield, grain shape and length, resistanceto blast disease, amylose content and aroma (Figure2). But an early health role for rice came under theambit of food scientists. To address the prevalenceof beriberi in the early 20th century, enrichment ofpolished rice with the B-vitamins -thiamine,riboflavin and niacin- came about through pre-treatment of milled rice by spray-drying (WHO,1966). An alternate approach is the parboilingprocess which entails steeping rice paddy in warmwater, steaming and drying. This process forces theB-vitamins to diffuse from the hull into theendosperm (Ayamdoo et al., 2013). But today,research progress has witnessed the production ofnew rice varieties bio-fortified with micronutrientssuch as iron, zinc and beta-carotene (Bhullar &Gruissem, 2013). This approach aims to amelioratemicronutrient deficiencies such as iron deficiencyanaemia, stunted growth and xerophthalmiaaffecting children or adults in developing countries.
Nonetheless, brown rice is more susceptible tooxidative deterioration after prolonged storage dueto the lipid content in the bran layer (Champagneet al., 1991) while parboiled rice and milled rice canbe stored longer and are more resistant to insects(Itoh et al., 1985). Other factors that alter the nutrientcontent of rice include (i) interspecies differences;
8 PROSPECTS IN DEVELOPMENT OF QUALITY RICE FOR HUMAN NUTRITION: A REVIEW
(ii) agriculture practices (soil nitrogen, solarradiation, application of fertilizer and etc.); (iii)storage; (iv) washing and (v) cooking practices (Royet al., 2011).
RICE BRAN OIL AND CARDIOVASCULARHEALTH
Rice bran oil (RBO) is oil extracted from the branof the rice seed (Cicero & Derosa, 2005). Globalconsumption of this oil has increased 10 times by2011 from 70000 tonnes in 1961 with most of thesupply coming predominantly from China (105000tonnes) and India (506207 tonnes) with minorproductions from Thailand and Vietnam (FAOSTAT,2011). The fatty acid composition (FAC) profileof RBO is dominated by unsaturated fatty acidssuch as oleic acid (38.4%), linoleic acid (34.4%)and α-linolenic acid (2.2%) with a smaller fractionfrom saturated fatty acids, such as palmitic (21.5%)and stearic (2.9%) acids (Cheruvanky & Thummala,1991). Both animal (Cheruvanky & Thummala,1991; Wilson et al., 2007) and human studiesinvolving mildly hypercholesterolemic (Lichtensteinet al., 1994; Berger et al., 2005) and type 2 diabetes(Lai et al., 2011) patients have highlightedcholesterol-lowering properties of rice bran oil. Inaddition, a plant sterol-based spread derived fromrice bran oil was efficacious in reducing plasma lipidlevels in mildly hypercholesterolemic patients(Eady et al., 2011).
Independent of its favourable FAC profile, thepolyphenol-rich content of RBO may also confercholesterol-lowering effects (Most et al., 2005),namely γ-oryzanol, phytosterols, tocopherols andtocotrienols (Cicero & Derosa, 2005). It ishypothesized that phystosterols and γ-oryzanolreduce cholesterol absorption in the intestines andincrease excretion of bile acids, which indirectlyresults in plasma cholesterol reduction (Cicero &Derosa, 2005; Chou et al., 2009). On the other hand,tocotrienols are reported to regulate cholesterolsynthesis and catabolism at transcriptional level byincreasing hepatic HMG-CoA reductase, CYP7A1and LDL-receptor expressions in animal studies(Cicero & Derosa, 2005; Chen & Cheng, 2006).Overall, the application of rice polyphenols tohuman health remains to be studied.
GLYCAEMIC VARIABILITY OF RICEVARIETIES
Glycaemic index (GI) is a metrological approach toquantifying the human postprandial glucoseresponse immediately after consuming fixedamounts of carbohydrate-rich foods (Jenkins et al.,
1981). As rice is a major global staple, there isconsiderable interest in exploring postprandialglycaemia in relation to the consumption ofdifferent rice varieties. The GI values derived frommany studies have been published in TheInternational Tables of GI and GL Values (Foster-Powell et al., 2002; Atkinson et al., 2008).Epidemiological studies describing thecarbohydrate quality in diets consumed by differentpopulations have utilized the GI tables to quantifydaily dietary GI and GL to elucidate the diet-diseaserelationship (Murakami et al., 2006; Villegas et al.,2007; Oba et al., 2010).
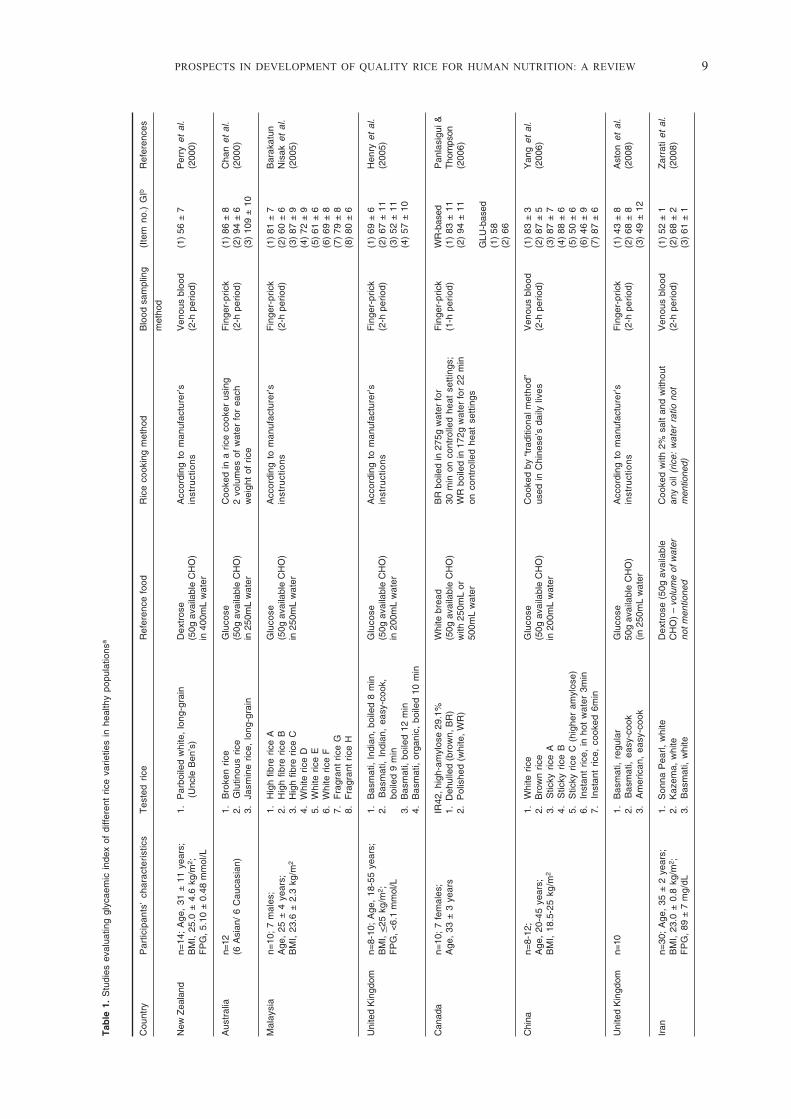
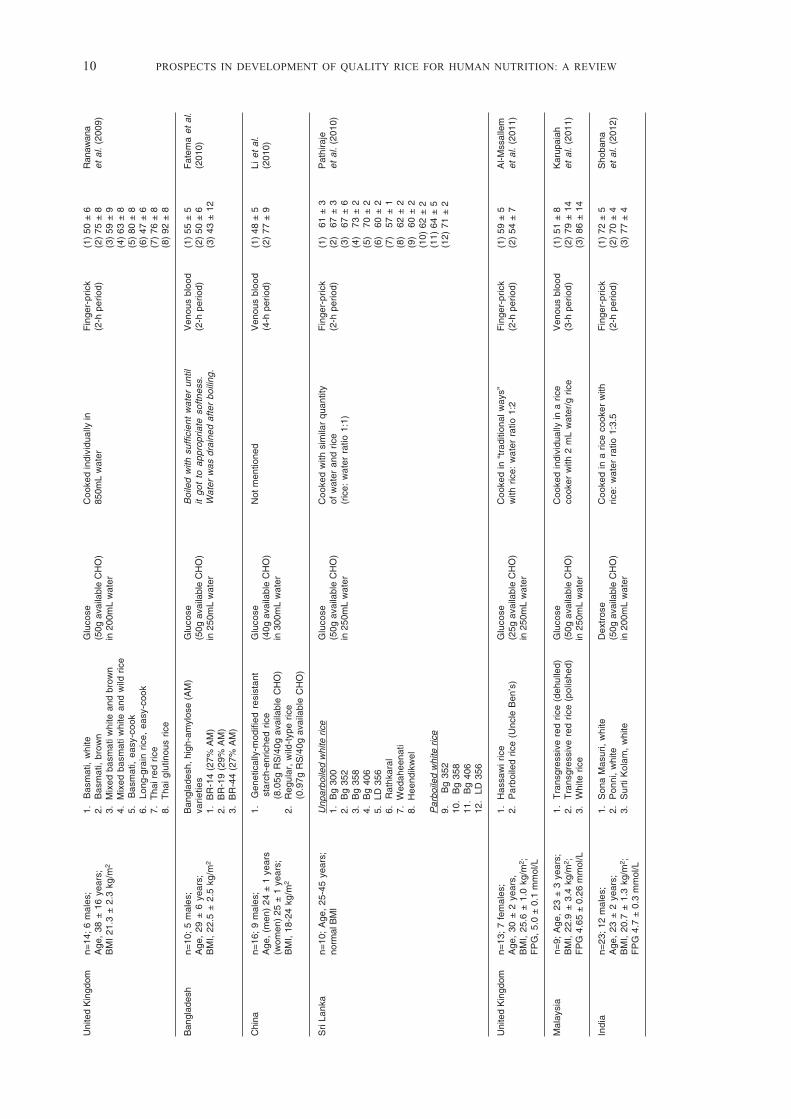
There is a wide range in GI values for the sametype of rice (Table 1). For instance, the 10 entriesfor jasmine rice ranged from 48 to 109, whereas sixentries for basmati rice ranged from 43 to 69 (Foster-Powell et al., 2002; Atkinson et al., 2008).Generally, GI values for brown rice and white riceaveraged 68 and 72, respectively (Foster-Powell etal., 2002). The differences in reported GI valuescould be attributed to rice preparation techniques(e.g. rice-to-water ratio, cooking time and heatintensity), blood collection method (finger-prick vsvenous blood) or prandial blood event samplingtime frame (Table 1). Therefore, the clinicalrelevance and application of GI have beenquestioned (Coulston & Reaven, 1997; Pi-Sunyer,2002; Wolever, 2013).
A better differentiation of rice characteristicsbased on extrinsic and intrinsic factors which affectgrain digestibility and mediate resultant glycaemicresponse, would be important in the developmentof new rice varieties with low GI potential. Newbrown rice varieties have been reported with low GIsuch as produced by cross-breeding programs(Karupaiah et al., 2011; Trinidad et al., 2013) orincreasing resistant starch content via geneticmodification (Li et al., 2010). Therefore, geneticmake-up, physicochemical properties, amylose anddietary fibre content, post-harvesting processing aswell as cooking methods (Table 1) are influentialfactors in determining GI variability and will bediscussed in the following sections.
Amylose to Amylopectin RatioCommon to all cereals, rice starch is
differentiated into two starch subtypes, the longerstraight, minimally-branched chain amylosepolymer and the relatively shorter and highly-branched amylopectin (Juliano, 2003); but it is theirdistributional content that determines rice eatingand cooking qualities (Tan & Corke, 2002). Milledrice can be grouped into waxy (1-2% amylose), verylow (2-9% amylose), low (10-20% amylose),intermediate (20-25%) and high (25-33% amylose)categories (Juliano, 2003). A higher amylose contentin rice translates into greater volume expansion and
PROSPECTS IN DEVELOPMENT OF QUALITY RICE FOR HUMAN NUTRITION: A REVIEW 9
Tab
le 1
. S
tudi
es e
valu
atin
g gl
ycae
mic
ind
ex o
f di
ffere
nt r
ice
varie
ties
in h
ealth
y po
pula
tions
a
Cou
ntry
Par
ticip
ants
’ ch
arac
teri
stic
sT
este
d ric
eR
efer
ence
foo
dR
ice
cook
ing
met
hod
Blo
od s
ampl
ing
(Ite
m n
o.)
GIb
Ref
eren
ces
met
hod
New
Zea
land
n=14
; A
ge,
31 ±
11
year
s;1.
P
arbo
iled
whi
te,
long
-gra
inD
extr
ose
Acc
ordi
ng t
o m
anuf
actu
rer’s
Ven
ous
bloo
d(1
) 56
± 7
Per
ry e
t al
.B
MI,
25.0
± 4
.6 k
g/m
2 ;
(
Unc
le B
en’s
)(5
0g a
vaila
ble
CH
O)
inst
ruct
ion
s(2
-h p
erio
d)(2
000)
FP
G, 5
.10
± 0
.48
mm
ol/L
in 4
00m
L w
ater
Aus
tral
ian=
121.
B
roke
n ric
eG
luco
seC
ooke
d in
a r
ice
cook
er u
sing
Fin
ger-
pric
k(1
) 86
± 8
Cha
n et
al.
(6 A
sian
/ 6
Cau
casi
an)
2.
Glu
tinou
s ric
e(5
0g a
vaila
ble
CH
O)
2 vo
lum
es o
f w
ater
for
eac
h(2
-h p
erio
d)(2
) 94
± 6
(200
0)3.
Ja
smin
e ric
e, lo
ng-g
rain
in 2
50m
L w
ater
wei
ght
of r
ice
(3)
109
± 1
0
Mal
aysi
an=
10;
7 m
ales
;1.
H
igh
fibre
ric
e A
Glu
cose
Acc
ordi
ng t
o m
anuf
actu
rer’s
Fin
ger-
pric
k(1
) 81
± 7
Bar
akat
unA
ge,
25 ±
4 y
ears
;2.
H
igh
fibre
ric
e B
(50g
ava
ilabl
e C
HO
)in
stru
ctio
ns
(2-h
per
iod)
(2)
60 ±
6N
isak
et
al.
BM
I, 23
.6 ±
2.3
kg/
m2
3.
Hig
h fib
re r
ice
Cin
250
mL
wat
er(3
) 87
± 9
(200
5)4.
W
hite
ric
e D
(4)
72 ±
95.
W
hite
ric
e E
(5)
61 ±
66.
W
hite
ric
e F
(6)
69 ±
87.
F
ragr
ant
rice
G(7
) 79
± 8
8.
Fra
gran
t ric
e H
(8)
80 ±
6
Uni
ted
Kin
gdom
n=8-
10;
Age
, 18
-55
year
s;1.
B
asm
ati,
Indi
an,
boile
d 8
min
Glu
cose
Acc
ordi
ng t
o m
anuf
actu
rer’s
Fin
ger-
pric
k(1
) 69
± 6
Hen
ry e
t al
.B
MI,
<25
kg/
m2 ;
2.
Bas
mat
i, In
dian
, ea
sy-c
ook,
(50g
ava
ilabl
e C
HO
)in
stru
ctio
ns
(2-h
per
iod)
(2)
67 ±
11
(200
5)F
PG
, <6.
1 m
mol
/L
b
oile
d 9
min
in 2
00m
L w
ater
(3)
52 ±
11
3.
Bas
mat
i, bo
iled
12 m
in(4
) 57
± 1
04.
B
asm
ati,
orga
nic,
boi
led
10 m
in
Can
ada
n=10
; 7
fem
ales
;IR
42, h
igh-
amyl
ose
29.1
%W
hite
bre
adB
R b
oile
d in
275
g w
ater
for
Fin
ger-
pric
kW
R-b
ased
Pan
lasi
gui &
Age
, 33
± 3
yea
rs1.
Deh
ulle
d (b
row
n, B
R)
(50g
ava
ilabl
e C
HO
)30
min
on
cont
rolle
d he
at s
ettin
gs;
(1-h
per
iod)
(1)
83 ±
11
Tho
mps
on2.
P
olis
hed
(whi
te,
WR
)w
ith 2
50m
L or
WR
boi
led
in 1
72g
wat
er fo
r 22
min
(2)
94 ±
11
(200
6)50
0mL
wat
eron
con
trol
led
heat
set
tings
GLU
-bas
ed(1
) 58
(2)
66
Chi
nan=
8-12
;1.
W
hite
ric
eG
luco
seC
ooke
d by
“tr
aditi
onal
met
hod”
Ven
ous
bloo
d(1
) 83
± 3
Yan
g et
al.
Age
, 20
-45
year
s;2.
B
row
n ric
e(5
0g a
vaila
ble
CH
O)
used
in C
hine
se’s
dai
ly li
ves
(2-h
per
iod)
(2)
87 ±
5(2
006)
BM
I, 18
.5-2
5 kg
/m2
3.
Stic
ky r
ice
Ain
200
mL
wat
er(3
) 87
± 7
4.
Stic
ky r
ice
B(4
) 88
± 6
5.
Stic
ky r
ice
C (
high
er a
myl
ose)
(5)
50 ±
66.
In
stan
t ric
e, i
n ho
t w
ater
3m
in(6
) 46
± 9
7.
Inst
ant
rice,
coo
ked
6min
(7)
87 ±
6
Uni
ted
Kin
gdom
n=10
1.
Bas
mat
i, re
gula
rG
luco
seA
ccor
ding
to
man
ufac
ture
r’sF
inge
r-pr
ick
(1)
43 ±
8A
ston
et
al.
2.
Bas
mat
i, ea
sy-c
ook
50g
avai
labl
e C
HO
)in
stru
ctio
ns
(2-h
per
iod)
(2)
68 ±
8(2
008)
3.
Am
eric
an,
easy
-coo
k(in
250
mL
wat
er(3
) 49
± 1
2
Iran
n=30
; A
ge,
35 ±
2 y
ears
;1.
S
onna
Pea
rl, w
hite
Dex
tros
e (5
0g a
vaila
ble
Coo
ked
with
2%
sal
t an
d w
ithou
tV
enou
s bl
ood
(1)
52 ±
1Z
arra
ti et
al.
BM
I, 23
.0 ±
0.8
kg/
m2 ;
2.
Kaz
ema,
whi
teC
HO
) –
volu
me
of w
ater
any
oil
(ric
e: w
ater
rat
io n
ot(2
-h p
erio
d)(2
) 68
± 2
(200
8)F
PG
, 89
± 7
mg/
dL3.
B
asm
ati,
whi
teno
t men
tione
dm
entio
ned)
(3)
61 ±
1
10 PROSPECTS IN DEVELOPMENT OF QUALITY RICE FOR HUMAN NUTRITION: A REVIEW
Uni
ted
Kin
gdom
n=14
; 6
mal
es;
1.
Bas
mat
i, w
hite
Glu
cose
Coo
ked
indi
vidu
ally
inF
inge
r-pr
ick
(1)
50 ±
6R
anaw
ana
Age
, 38
± 1
6 ye
ars;
2.
Bas
mat
i, br
own
(50g
ava
ilabl
e C
HO
)85
0mL
wat
er(2
-h p
erio
d)(2
) 75
± 8
et a
l. (2
009)
BM
I 21
.3 ±
2.3
kg/
m2
3.
Mix
ed b
asm
ati w
hite
and
bro
wn
in 2
00m
L w
ater
(3)
59 ±
94.
M
ixed
bas
mat
i whi
te a
nd w
ild r
ice
(4)
63 ±
85.
B
asm
ati,
easy
-coo
k(5
) 80
± 8
6.
Long
-gra
in r
ice,
eas
y-co
ok(6
) 47
± 6
7.
Tha
i red
ric
e(7
) 76
± 8
8.
Tha
i glu
tinou
s ric
e(8
) 92
± 8
Ban
glad
esh
n=10
; 5
mal
es;
Ban
glad
esh,
hig
h-am
ylos
e (A
M)
Glu
cose
Boi
led
with
suf
ficie
nt w
ater
unt
ilV
enou
s bl
ood
(1)
55 ±
5F
atem
a et
al.
Age
, 29
± 6
yea
rs;
vari
etie
s(5
0g a
vaila
ble
CH
O)
it go
t to
app
ropr
iate
sof
tnes
s.(2
-h p
erio
d)(2
) 50
± 6
(201
0)B
MI,
22.5
± 2
.5 k
g/m
21.
B
R-1
4 (2
7% A
M)
in 2
50m
L w
ater
Wat
er w
as d
rain
ed a
fter
boili
ng.
(3)
43 ±
12
2.
BR
-19
(29%
AM
)3.
B
R-4
4 (2
7% A
M)
Chi
nan=
16;
9 m
ales
;1.
G
enet
ical
ly-m
odifi
ed r
esis
tant
Glu
cose
Not
men
tione
dV
enou
s bl
ood
(1)
48 ±
5Li
et
al.
Age
, (m
en)
24 ±
1 y
ears
sta
rch-
enric
hed
rice
(40g
ava
ilabl
e C
HO
)(4
-h p
erio
d)(2
) 77
± 9
(201
0)(w
omen
) 25
± 1
yea
rs;
(8.
05g
RS
/40g
ava
ilabl
e C
HO
)in
300
mL
wat
erB
MI,
18-2
4 kg
/m2
2.
Reg
ular
, w
ild-t
ype
rice
(0.
97g
RS
/40g
ava
ilabl
e C
HO
)
Sri
Lank
an=
10;
Age
, 25
-45
year
s;U
npar
boile
d w
hite
ric
eG
luco
seC
ooke
d w
ith s
imila
r qu
antit
yF
inge
r-pr
ick
(1)
61
± 3
Pat
hira
jeno
rmal
BM
I1.
B
g 30
0(5
0g a
vaila
ble
CH
O)
of w
ater
and
ric
e(2
-h p
erio
d)(2
)
67 ±
3et
al.
(201
0)2.
B
g 35
2in
250
mL
wat
er(r
ice:
wat
er r
atio
1:1
)(3
)
67 ±
63.
B
g 35
8(4
)
73 ±
24.
B
g 40
6(5
)
70 ±
25.
LD
356
(6)
60
± 2
6.
Rat
hkar
al(7
)
57 ±
17.
W
edah
eena
ti(8
)
62 ±
28.
Hee
ndik
wel
(9)
60
± 2
(10)
62
± 2
Par
boile
d w
hite
ric
e(1
1) 6
4 ±
59.
Bg
352
(12)
71
± 2
10.
Bg
358
11.
Bg
406
12.
LD
356
Uni
ted
Kin
gdom
n=13
; 7
fem
ales
;1.
H
assa
wi r
ice
Glu
cose
Coo
ked
in “
trad
ition
al w
ays”
Fin
ger-
pric
k(1
) 59
± 5
Al-M
ssal
lem
Age
, 30
± 2
yea
rs,
2.
Par
boile
d ric
e (U
ncle
Ben
’s)
(25g
ava
ilabl
e C
HO
)w
ith r
ice:
wat
er r
atio
1:2
(2-h
per
iod)
(2)
54 ±
7et
al.
(201
1)B
MI,
25.6
± 1
.0 k
g/m
2 ;in
250
mL
wat
erF
PG
, 5.
0 ±
0.1
mm
ol/L
Mal
aysi
an=
9; A
ge,
23 ±
3 y
ears
;1.
T
rans
gres
sive
red
ric
e (d
ehul
led)
Glu
cose
Coo
ked
indi
vidu
ally
in a
ric
eV
enou
s bl
ood
(1)
51 ±
8K
arup
aiah
BM
I, 22
.9 ±
3.4
kg/
m2 ;
2.
Tra
nsgr
essi
ve r
ed r
ice
(pol
ishe
d)(5
0g a
vaila
ble
CH
O)
cook
er w
ith 2
mL
wat
er/g
ric
e(3
-h p
erio
d)(2
) 79
± 1
4et
al.
(201
1)F
PG
4.6
5 ±
0.2
6 m
mol
/L3.
W
hite
ric
ein
250
mL
wat
er(3
) 86
± 1
4
Indi
an=
23;
12 m
ales
;1.
S
ona
Mas
uri,
whi
teD
extr
ose
Coo
ked
in a
ric
e co
oker
with
Fin
ger-
pric
k(1
) 72
± 5
Sho
bana
Age
, 23
± 2
yea
rs;
2.
Pon
ni,
whi
te(5
0g a
vaila
ble
CH
O)
rice:
wat
er r
atio
1:3
.5(2
-h p
erio
d)(2
) 70
± 4
et a
l. (2
012)
BM
I, 20
.7 ±
1.3
kg/
m2 ;
3.
Sur
ti K
olam
, w
hite
in 2
00m
L w
ater
(3)
77 ±
4F
PG
4.7
± 0
.3 m
mol
/L

PROSPECTS IN DEVELOPMENT OF QUALITY RICE FOR HUMAN NUTRITION: A REVIEW 11
Uni
ted
Sta
tes
n=21
; 12
mal
es;
1.
Hig
h re
sist
ant
star
ch r
ice
Glu
cose
Hig
h R
S r
ice
Fin
ger-
pric
k(1
) 84
± 7
Chi
u &
of A
mer
ica
Age
, 22
-57
year
s;
(
4.4g
RS
/50g
ava
ilabl
e C
HO
)(5
0g a
vaila
ble
CH
O)
–R
efrig
erat
ed lo
ng g
rain
ric
e pr
epar
ed(2
-h p
erio
d)(2
) 78
± 1
1S
tew
art
BM
I, 18
.5-3
0.1
kg/m
22.
Lo
w r
esis
tant
sta
rch
rice
volu
me
of w
ater
not
with
ric
e co
oker
for
20-
30 m
in(2
013)
(0.
4g R
S/5
0g a
vaila
ble
CH
O)
men
tione
d(r
ice:
wat
er r
atio
1:1
.5)
Low
RS
ric
eR
efrig
erat
ed s
hort
gra
in r
ice
prep
ared
with
pre
ssur
e co
oker
for
6 m
in(r
ice:
wat
er r
atio
1:4
)–
exce
ss w
ater
was
dra
ined
New
Zea
land
Chi
nese
gro
up1.
Ja
smin
e w
hite
, S
un R
ice
Car
bote
st 5
0-g
Coo
ked
in a
ric
e co
oker
with
the
Fin
ger-
pric
kC
hine
seK
atao
kan=
32;
17 m
ales
;2.
B
asm
ati,
Sun
Ric
egl
ucos
e dr
ink
sam
e ric
e: w
ater
rat
io –
(2-h
per
iod)
(1)
80 ±
1et
al.
(201
3)A
ge,
33 ±
8 y
ears
;3.
B
row
n, S
un R
ice
not
spec
ified
(2)
67 ±
1B
MI,
22.9
± 2
.7 k
g/m
2 ;4.
D
oong
ara,
Sun
Ric
e(3
) 78
± 1
FP
G, 4
.80
± 0
.38
mm
ol/L
5.
Par
boile
d, U
ncle
Ben
’s(4
) 67
± 1
(5)
72 ±
1E
urop
ean
grou
pn=
31;
15 m
ales
;E
urop
ean
Age
, 34
± 8
yea
rs;
(1)
68 ±
1B
MI,
25.8
± 4
.8 k
g/m
2 ;(2
) 57
± 1
FP
G, 4
.80
± 0
.44
mm
ol/L
(3)
65 ±
1(4
) 55
± 1
(5)
57 ±
1
Indi
an=
83 (
only
70
was
1.
The
rmal
ly t
reat
ed b
asm
ati
Dex
tros
eC
ooke
d in
a r
ice
cook
er w
ithF
inge
r-pr
ick
(1)
55 ±
1S
riniv
asa
incl
uded
in
final
ana
lysi
s);
(50g
ava
ilabl
e C
HO
)ric
e: w
ater
rat
io 1
:1.5
(2-h
per
iod)
et a
l. (2
013)
64 m
ales
; A
ge,
26 ±
5 y
ears
in 2
00m
L w
ater
Phi
lippi
nes
n=10
; A
ge,
27-5
5 ye
ars
Mill
ed r
ice
Glu
cose
drin
kM
illed
ric
eF
inge
r-pr
ick
(1)
75 ±
4T
rinid
ad1.
Sin
ando
men
g(M
edic
Ora
nge)
Coo
ked
in r
ice
cook
er(2
-h p
erio
d)(2
) 57
± 3
et a
l. (2
013)
2.
IR64
50g
gluc
ose
in 2
40m
Lw
ith w
ater
: ric
e ra
tio f
rom
(3)
63 ±
23.
IM
S 2
1.2-
1.8
to a
chie
ve s
imila
r(4
) 70
± 4
4.
NS
IC R
c160
Intr
on h
ardn
ess
(5)
59 ±
45.
P
SB
Rc1
8(6
) 63
± 3
6.
PS
B R
c12
Bro
wn
rice
(7)
50 ±
37.
P
SB
rc1
0U
ses
ratio
1.7
5-2.
0 an
d(8
) 55
± 2
pre-
soak
ed f
or 3
0min
to
(9)
51 ±
1B
row
n ric
eac
hiev
e si
mila
r In
tron
8. S
inan
dom
eng
hard
ness
9.
IR64
Uni
ted
Sta
tes
n=12
; 9
fem
ales
;1.
Del
la U
S ja
smin
eG
luco
seC
ooke
d in
divi
dual
ly in
aF
inge
r-pr
ick
(1)
96 ±
17
Tru
ong
of A
mer
ica
Age
, 29
± 6
yea
rs;
2.
Jazz
men
US
jasm
ine
(50g
ava
ilabl
e C
HO
)ric
e co
oker
with
ric
e:(2
-h p
erio
d)(2
) 10
6 ±
13
et a
l. (2
014)
BM
I, 23
± 3
kg/
m2 ;
3. R
eind
eer
Tha
i jas
min
ein
250
mL
wat
erw
ater
rat
io 1
:1(3
) 11
5 ±
11
FP
G,
93.4
± 1
0.3
mg/
dL4.
Mah
atm
a T
hai j
asm
ine
(4)
116
± 7
BM
I, bo
dy m
ass
inde
x; C
HO
, car
bohy
drat
e; F
PG
, fas
ting
plas
ma
gluc
ose;
RS
, res
ista
nt s
tarc
h.
12 PROSPECTS IN DEVELOPMENT OF QUALITY RICE FOR HUMAN NUTRITION: A REVIEW
flakiness but cook dry, are less fluffy and turn hardafter cooling. On the contrary, cooked low-amyloserice grains are moist and sticky. Intermediate-amylose rice is therefore preferred in most rice-cultivating areas of the world, except where low-amylose japonica varieties are grown (Calingacionet al., 2014).
The relationship between amylose content ofrice and postprandial glycaemia is inconsistent.Goddard et al. (1984) reported that consumption ofhigh-amylose (23-25%) rice resulted in significantlylower glycaemic and insulin responses compared tolow (14-17%) and waxy (0%) rice varieties. Thisobservation was attributed to greater amylose-lipidcomplex in high-amylose rice, which resulted indelayed starch hydrolysis. Amylose-lipid complexhas been shown to restrict granule swelling duringcooking (Tester & Morrison 1990), which impedesthe accessibility of amylase enzymes into thegranules. However, Panlasigui et al. (1991) reportedthat three high-amylose (26.7–27.0%) rice varietiesdiffered significantly in in vitro starch digestion rateand in vivo glycaemic response (GI, 55 vs 65 vs 81).Despite having similar amylose content, these ricevarieties exhibited varied physicochemicalproperties relating to gel consistency, gelatinizationtemperature and amylograph viscosity. This findingconcurred with Dhital et al. (2015) who showedclearly that amylose content is not a rate-limitingfactor to assess in vitro starches’ susceptibilitiesto amylase enzymes. Other rice propertiesrelating to morphology or presence of intact non-polysaccharides (fibre) or lipid and protein matrices,could potentially encapsulate starch granules andthus lower starch digestibility (Dhital et al., 2015).
In a pooled analysis of 235 varieties of riceevaluating GI, Fitzgerald et al. (2011) concludedthat amylose is the major grain constituent whichnegatively associates with its GI. But this analysiscould not explain as to why GI variability wasevident within each category of amylose content.Fitzgerald et al. (2011) hypothesize that rice GIeffect would be best attributed to the interactionbetween other loci within the Waxy gene of thegrain.
Post-Harvesting Technologies and ThermalProcessing
Rice can be prepared for human consumptionusing a wide range of cooking methods, dependingon the country of origin, culinary and culturalbackgrounds. These include boiling, parboiling,steaming, pressure cooking, straining, baking aswell as techniques inherent to the recipes such asthe Chinese-styled stir-frying, Middle Eastern-styledpilaf and Italian-styled risotto (Rashmi & Urooj,2003; Hensperger & Kaufmann, 2012). Basically,
during cooking, rice starch undergoes gelatinization,loses its crystalline structure and organization andbecomes susceptible to hydrolysis by α-amylases.Steamed rice has the lowest rapidly digestible starch(RDS) and highest slowly digestible starch (SDS)contents whilst boiling and pressure cookingsignificantly elevates RDS values irrespective ofrice type (Rashmi & Urooj, 2003). In vitrodigestibility of rice starch with higher resistantstarch (RS) and SDS content produces lower rapidlyavailable glucose (RAG) and a lower starchdigestible index (SDI) (Rashmi & Urooj, 2003).These metrics have been proposed as a surrogateindicator of rice GI (Englyst et al., 1996).
A greater degree of gelatinization occurs incooked rice after pressure cooking compared tocooking by either electric cooker or microwaveoven (Lee et al., 2005). Greater gelatinizationconsequently led to greater in vitro starchhydrolysis rates and postprandial plasma glucose inrats (Lee et al., 2005). Further, reducing therice:water ratio from 1:2 to 1:1 significantlyincreased the RS content in both freshly preparedand cooled after cooking rice samples (Kim et al.,2006). Additional water used in cooking allows agreater swelling and disruption of the starchgranules, which contributes to greater RS formationwhen starch retrogrades (Sagum & Arcot, 2000).Reed et al. (2013) reported that compared tosteamed and pilaf rice, stir-frying rice resulted in theslowest starch hydrolysis rates and this could beattributed increased amounts of retrograded starchafter chilling as well as formation of amylose-lipidcomplexes and lipid coating of the starch after stir-frying with oil. The utility of the in vitro approachin determining starch digestibility suggests avalidation process should compare this methodwith the in vivo approach of human postprandialglycaemic testing.
Anti-nutrientsAnti-nutrients are the natural or synthetic
compounds which potentially impede or reduce theabsorption of other nutrients in the gastrointestinaltract (Zhou & Erdman, 1995). Phytic acid, or inositolhexophosphate (IP6) is often deemed as an anti-nutrient due to its strong affinity to chelate divalentmetal cations (calcium, zinc, iron, copper),precipitate and form insoluble salts which rendersthese minerals unavailable for absorption (Zhou &Erdman, 1995). A cross-sectional analysis of phytatecontent in several Malaysian rice samples reporteda range of 36-92 mg/100g raw rice (Norhaizan & NorFaizadatul Ain, 2009). These values are lower thanvalues reported in China [55-183 mg/100g] (Ma etal., 2005) and Korea [160-955 mg/100g] (Joung etal., 2004).
PROSPECTS IN DEVELOPMENT OF QUALITY RICE FOR HUMAN NUTRITION: A REVIEW 13
Yoon et al. (1983) found that increased phytateintake from cereal and leguminous foods negativelycorrelated with GI. Phytate alters starch digestibilityvia three mechanisms: [i] binding to starch byhydrogen bonding; [ii] indirectly bonding to starchproteins or [iii] binding to α-amylase or enzymecofactors such as calcium which would delaydigestion and absorption of ingested starch (Jenab& Thompson, 2002). In fact, phytate has been shownto inhibit the α-glucosidase and α-amylase in adose-dependent manner (in vitro) as well as loweringglycated haemoglobin and lipid peroxidation indiabetic rats (in vivo) after treatment with IP6 ricefor 28 days (Kuppusamy et al., 2011). In line withthis, Omoruyi et al. (2013) highlight a reduction inintestinal amylase activity in diabetic rats fed withphytate supplement (4% of rodent chow) comparedto a control group.
Although the direction of research indicates thepotential of higher phytate in modulating glycaemicresponse to rice, its interference with micronutrientabsorption should be considered from the point ofoverall health. In fact, crop science has expandedto developing new rice varieties with low phytatecontent (Feng & Yoshida, 2004; Ali et al., 2013).
Non-starch polysaccharides (Dietary fibre)Non-starch polysaccharides (NSPs) or
commonly known as dietary fibre relates to theedible parts of plants or analogous carbohydratesthat are resistant to digestion and absorption in thehuman small intestine with complete or partialfermentation in the large intestine (AmericanAssociation of Cereal Chemists, 2001). Dietary fibreincludes two major classes based on solubilitywhich are [i] soluble fibre such as pectins, gums andβ-glucans and [ii] insoluble fibre, which includescellulose, lignin and hemicelluloses. Fibre itself doesnot have a GI value as it does not contain anyglycaemic carbohydrate, but addition of fibre tocarbohydrate-rich foods contributes to the GI-lowering effect of the food (Jenkins et al., 1986).Jenkins et al. (2002) proposed a model calledGlycemic Reduction Index Potential (GRIP) toquantify the anticipated reduction in GI units/gramof fibre, when fibre is added to a food.
Panlasigui and Thompson (2006) compared thein vitro digestion rate and postprandial glycaemicresponse of brown and polished rice of the samevariety in healthy and diabetic subjects. The GIs ofbrown rice were significantly lowered by 12.1% inhealthy volunteers whilst in diabetic patients, thereduction approximated 36%. Similarly, removingthe bran layer was found to increase the GI valueof a crossbred red rice variant from 51 (dehusked)to 79 (polished) (Karupaiah et al., 2011). InPhilippines, a brown rice variant calledSinandomeng was categorised as low GI (=55) whilst
the milled version had a high GI value (=75)(Trinidad et al., 2013). These studies suggest thatthe bran which encapsulates the rice kernels servesas a physical barrier which deters water absorptionand delays the swelling of starch granules duringthermal processing (Panlasigui & Thompson, 2006;Karupaiah et al., 2011; Trinidad et al., 2013) as wellas reduces the accessibility of hydrolytic enzymes(Sasaki & Kohyama, 2011; Dhital et al., 2015).Some studies, however, could not establish a linkbetween GI and dietary fibre in rice (BarakatunNisak et al., 2005; Yang et al., 2006; Ranawana etal., 2009).
PolyphenolsPolyphenols include phenolic acids, flavonoids,
anthocyanins, stilbenes, lignans and polymericlignin found in plant-based foods, such as wholegrains, cereals, fruits, vegetables, legumes, cocoa,tea, coffee and wine (Pandey & Rizvi, 2009). Plant-based polyphenols have been hypothesized toregulate and improve glycaemia through 4mechanisms [i] inhibition of intestinal α-amylaseand α-glucosidase; [ii] reduction of gluconeogenesisand increase of glycogenesis and glycolysis; [iii]increase of peripheral insulin sensitivity and glucoseuptake and [iv] exerting anti-oxidative propertieswhich improve β-cell function and insulin secretion(Hanhineva et al., 2010; Bahadoran et al., 2013).
Ferulic acid, a predominant phenolic acid foundin most rice types (Sompong et al., 2011; Fasahatet al., 2012; Deng et al., 2013) suppresses bloodglucose by enhancing glucokinase activity,promoting glycogenesis and stimulating plasmainsulin secretions in diabetic rats (Jung et al., 2007).A 4-week intervention using anthocyanin-richextract derived from black rice ameliorated glucoseintolerance and insulin resistance in rats fed withhigh-fructose diet (Guo et al., 2007). In addition,black rice exhibited the highest α-glucosidaseinhibitory activity compared to red and purple rice,and this was attributed to the relatively greater totalphenolic and anthocyanin contents in black rice(Yao et al., 2010).
Current evidence based on in vitro and animalstudies indicate the potential of polyphenols toretard starch digestion and delay postprandialglycaemia. Extrapolation with human clinicalstudies is needed to confirm if polyphenol-richpigmented rice is able to regulate postprandialglucose homeostasis. Further, a dose-responserelationship of polyphenols should be explored inthese studies.
Organic AcidThe use of organic acids is common in some
Asian culinary practices, such as adding vinegar insushi (Japan) or tamarind in puliyodharai (India).
14 PROSPECTS IN DEVELOPMENT OF QUALITY RICE FOR HUMAN NUTRITION: A REVIEW
Sugiyama et al. (2003) observed a GI-lowering effectwhen acetic acid (the main component of vinegar)was added to white rice (GI = 80) in the making ofsushi (GI = 67), even at low concentrations (0.2-1.5g.100g-1). An initially proposed mechanism was,addition of acetic acid in a meal could delay thegastric emptying, and hence decelerate postprandialglucose release (Liljeberg & Bjorck, 1998). But itwas recently reported that acid and heat-moisturetreated rice starches, irrespective of amylose content,had significantly greater RS content (30.1-39.0%)compared to native rice starches (6.3-10.2%) or heat-moisture treated rice starches (18.5-23.9%); and thiseffect became enhanced with acid treatment in theorder of citric > lactic > acetic acids (Hung et al.,2015). An explanation is that the production of low-molecular-weight starch fractions from acidhydrolysis promotes retrogradation and realignmentof starch to form double helices during heat-moisturetreatment (Chung et al., 2009). Further, the cross-linkages and novel crystallites formed as a result ofesterification between organic acids and rice starchmay render a greater resistance to enzymaticdigestion (Shin et al., 2009; Hung et al., 2015),which in turn leads to lower starch digestibility.Future studies should explore the mechanisms offood acid addition to rice preparation in relation tohuman postprandial glycaemic response.
Chewing DegreeChewing or mastication is a process in which
ingested foods are ground and broken down by teethinto smaller particles to prepare for further digestionin the gastrointestinal tract (Pereira et al., 2007).This process increases the surface area of the chewedbolus, allowing greater accessibility to digestiveenzymes, therefore resulting in an increased rate ofdigestion (Read et al., 1986; Hoebler et al., 2000;Ranawana et al., 2010).
The relationship between chewing rate andpostprandial glycaemia was first tested and reportedby Read et al. (1986). Ingesting and swallowingrice whole, instead of chewing thoroughly,significantly reduced peak glucose response (5.3 vs7.1 mmol.L-1) and area under the blood glucosecurve (86 vs 244 mmol.min-1) in healthy, youngadults (Read et al., 1986). This study suggestedparticle size of rice is partly accountable forpostprandial digestibility. However, these findingslack clinical practicality as swallowing foods wholeincreases choking risk, reduces the pleasure ofeating as well as potentiates abdominal discomfortand distension due to incomplete digestion. It wasthen reported that habitual mastication and eatingbehaviour differs between individuals, and thesemay account for individual variability inpostprandial glycaemic response (Ranawana et al.,2010). In a recent study by Ranawana et al. (2014),
chewing rice thoroughly (30 chews per mouthful,CPM) significantly elicited greater overallglycaemic response (184 vs 155 mmol min.L-1),peak glucose concentration (2.8 vs 2.4 mmol.L-1)and GI (88 vs 68) compared to usual chewing (15CPM). Interestingly, in an exploratory, crossoverstudy evaluating the impact of eating methods onglycaemic response, Sun et al. (2015) discoveredthat glycaemic response to white rice eating withchopsticks (GI, 68) was significantly lower thanusing spoon (GI, 81), but not with using fingers.Eating with chopsticks lowers the GI of rice by 16%due to smaller mouthfuls, increased chewing andlonger time taken to consume the entire portionof rice. Another study reports that compared tousual chewing (10 CPM), thorough chewing (31CPM) resulted in lower food ingestion rate (24 vs11 g.min-1), voluntary food intake (358 vs 313 g)and longer meal duration (15 vs 29 min) (Smit et al.,2011).
These findings, however, may not be applicablein individuals with glucose tolerance abnormalities.Suzuki et al. (2005) compared the effects of usualand thorough mastication on 3-hour postprandialplasma glucose (PPG) concentrations in subjectswith normal glucose tolerance (NGT) or predisposedto type 2 diabetes using a crossover design trial.Thorough mastication lowered PPG at 90- and 120-min in the NGT group, which could be partlyexplained by an early-phase insulin secretion, asindicated by higher insulinogenic index (ratio ofincremental serum insulin to plasma glucoseconcentration 30-min post-meal). However early-phase insulin secretion was not observed in thepredisposed group after thorough masticationand this led to significantly elevated PPGconcentrations.
HABITUAL RICE CONSUMPTION ANDCHRONIC DISEASE DEVELOPMENT
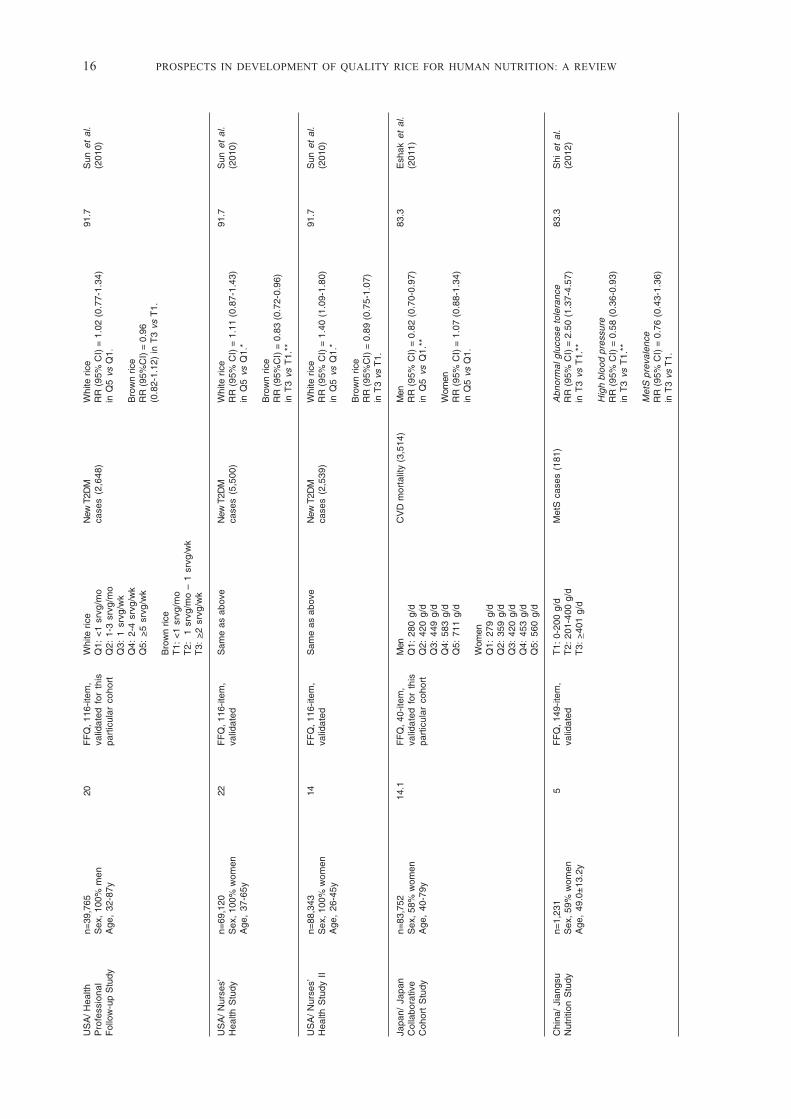
A large-scale epidemiological study of middle-agedChinese women (n=64277) showed a 78% greaterrisk of developing type 2 diabetes (T2D) in thehighest quartile of cooked rice intake (>750g.day-1) compared with the lowest quartile (<500g.day-1) (Villegas et al., 2007) (Table 2). In Japan,a 65% increase in risk of T2D was noted only inwomen (n= 33794) and not men (n=25494) (Nanriet al., 2010). These observations are also consistentwith Caucasian populations in the United Stateswith the highest quartile of white rice eaters been17% more likely to develop T2D than those in thelowest intake quartile (Sun et al., 2010). It must benoted that Asians consume more rice thanCaucasians (>113 g.day-1) in these studies (Table 2).A meta-analysis concluded pooled relative risk for
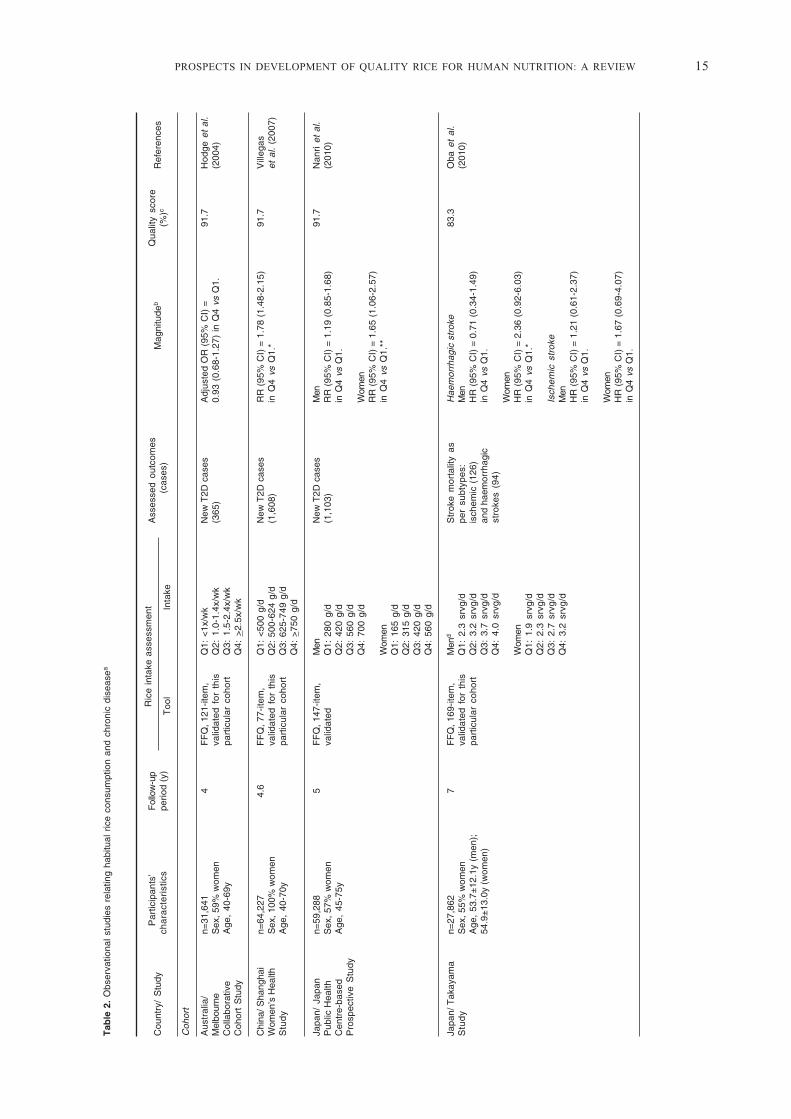
PROSPECTS IN DEVELOPMENT OF QUALITY RICE FOR HUMAN NUTRITION: A REVIEW 15
Tab
le 2
. O
bser
vatio
nal
stud
ies
rela
ting
habi
tual
ric
e co
nsum
ptio
n an
d ch
roni
c di
seas
ea
Cou
ntry
/ S
tudy
P
artic
ipan
ts’
Fol
low
-up
Ric
e in
take
ass
essm
ent
Ass
esse
d ou
tcom
es
M
agni
tude
bQ
ualit
y sc
ore
Ref
eren
ces
cha
ract
eri
stic
spe
riod
(y)
T
ool
In
take
(ca
ses)
(%)c
Coh
ort
Aus
tral
ia/
n=31
,641
4F
FQ
, 121
-item
,Q
1: <
1x/w
kN
ew T
2D c
ases
Adj
uste
d O
R (
95%
CI)
=91
.7H
odge
et
al.
Mel
bour
neS
ex, 5
9% w
omen
valid
ated
for
thi
sQ
2: 1
.0-1
.4x/
wk
(365
)0.
93 (
0.68
-1.2
7) in
Q4
vs Q
1.(2
004)
Col
labo
rativ
eA
ge,
40-6
9ypa
rtic
ular
coh
ort
Q3:
1.5
-2.4
x/w
kC
ohor
t S
tudy
Q4:
>2.
5x/w
k
Chi
na/ S
hang
hai
n=64
,227
4.6
FF
Q, 7
7-ite
m,
Q1:
<50
0 g/
dN
ew T
2D c
ases
RR
(95
% C
I) =
1.7
8 (1
.48-
2.15
)91
.7V
illeg
asW
omen
’s H
ealth
Sex
, 100
% w
omen
valid
ated
for
thi
sQ
2: 5
00-6
24 g
/d(1
,608
)in
Q4
vs Q
1.*
et a
l. (2
007)
Stu
dy
Age
, 40
-70y
part
icul
ar c
ohor
tQ
3: 6
25-7
49 g
/dQ
4: >
750
g/d
Japa
n/ J
apan
n=59
,288
5F
FQ
, 147
-item
,M
enN
ew T
2D c
ases
Men
91.7
Nan
ri et
al.
Pub
lic H
ealth
Sex
, 57%
wom
enva
lidat
edQ
1: 2
80 g
/d(1
,103
)R
R (
95%
CI)
= 1
.19
(0.8
5-1.
68)
(201
0)C
entr
e-ba
sed
Age
, 45
-75y
Q2:
420
g/d
in Q
4 vs
Q1.
Pro
spec
tive
Stu
dyQ
3: 5
60 g
/dQ
4: 7
00 g
/dW
omen
RR
(95
% C
I) =
1.6
5 (1
.06-
2.57
)W
omen
in Q
4 vs
Q1.
**Q
1: 1
65 g
/dQ
2: 3
15 g
/dQ
3: 4
20 g
/dQ
4: 5
60 g
/d
Japa
n/ T
akay
ama
n=27
,862
7F
FQ
, 169
-item
,M
end
Str
oke
mor
talit
y as
Hae
mor
rhag
ic s
trok
e83
.3O
ba e
t al
.S
tud
yS
ex, 5
5% w
omen
valid
ated
for
thi
sQ
1: 2
.3 s
rvg/
dpe
r su
btyp
es:
Men
(201
0)A
ge,
53.7
±12
.1y
(men
);pa
rtic
ular
coh
ort
Q2:
3.2
srv
g/d
isch
emic
(12
6)H
R (
95%
CI)
= 0
.71
(0.3
4-1.
49)
54.9
±13
.0y
(wom
en)
Q3:
3.7
srv
g/d
and
haem
orrh
agic
in Q
4 vs
Q1.
Q4:
4.0
srv
g/d
stro
kes
(94)
Wom
enW
omen
HR
(95
% C
I) =
2.3
6 (0
.92-
6.03
)Q
1: 1
.9 s
rvg/
din
Q4
vs Q
1.*
Q2:
2.3
srv
g/d
Q3:
2.7
srv
g/d
Isch
emic
str
oke
Q4:
3.2
srv
g/d
Men
HR
(95
% C
I) =
1.2
1 (0
.61-
2.37
)in
Q4
vs Q
1.
Wom
enH
R (
95%
CI)
= 1
.67
(0.6
9-4.
07)
in Q
4 vs
Q1.
16 PROSPECTS IN DEVELOPMENT OF QUALITY RICE FOR HUMAN NUTRITION: A REVIEW
US
A/ H
ealth
n=39
,765
20F
FQ
, 116
-item
,W
hite
ric
eN
ew T
2DM
Whi
te r
ice
91.7
Sun
et
al.
Pro
fess
iona
lS
ex,
100%
men
valid
ated
for
thi
sQ
1: <
1 sr
vg/m
oca
ses
(2,6
48)
RR
(95
% C
I) =
1.0
2 (0
.77-
1.34
)(2
010)
Fol
low
-up
Stu
dyA
ge,
32-8
7ypa
rtic
ular
coh
ort
Q2:
1-3
srv
g/m
oin
Q5
vs Q
1.Q
3: 1
srv
g/w
kQ
4: 2
-4 s
rvg/
wk
Bro
wn
rice
Q5:
>5
srvg
/wk
RR
(95
%C
I) =
0.9
6(0
.82-
1.12
) in
T3
vs T
1.B
row
n ric
eT
1: <
1 sr
vg/m
oT
2:
1 sr
vg/m
o –
1 sr
vg/w
kT
3: >
2 sr
vg/w
k
US
A/
Nur
ses’
n=69
,120
22F
FQ
, 116
-item
,S
ame
as a
bove
New
T2D
MW
hite
ric
e91
.7S
un e
t al
.H
ealth
Stu
dyS
ex, 1
00%
wom
enva
lidat
edca
ses
(5,5
00)
RR
(95
% C
I) =
1.1
1 (0
.87-
1.43
)(2
010)
Age
, 37
-65y
in Q
5 vs
Q1.
*
Bro
wn
rice
RR
(95
%C
I) =
0.8
3 (0
.72-
0.96
)in
T3
vs T
1.**
US
A/
Nur
ses’
n=88
,343
14F
FQ
, 116
-item
,S
ame
as a
bove
New
T2D
MW
hite
ric
e91
.7S
un e
t al
.H
ealth
Stu
dy I
IS
ex, 1
00%
wom
enva
lidat
edca
ses
(2,5
39)
RR
(95
% C
I) =
1.4
0 (1
.09-
1.80
)(2
010)
Age
, 26
-45y
in Q
5 vs
Q1.
*
Bro
wn
rice
RR
(95
%C
I) =
0.8
9 (0
.75-
1.07
)in
T3
vs T
1.
Japa
n/ J
apan
n=83
,752
14.1
FF
Q, 4
0-ite
m,
Men
CV
D m
orta
lity
(3,5
14)
Men
83.3
Esh
ak e
t al
.C
olla
bora
tive
Sex
, 58%
wom
enva
lidat
ed f
or t
his
Q1:
280
g/d
RR
(95
% C
I) =
0.8
2 (0
.70-
0.97
)(2
011)
Coh
ort
Stu
dyA
ge,
40-7
9ypa
rtic
ular
coh
ort
Q2:
420
g/d
in Q
5 vs
Q1.
**Q
3: 4
49 g
/dQ
4: 5
83 g
/dW
omen
Q5:
711
g/d
RR
(95
% C
I) =
1.0
7 (0
.88-
1.34
)in
Q5
vs Q
1.W
omen
Q1:
279
g/d
Q2:
359
g/d
Q3:
420
g/d
Q4:
453
g/d
Q5:
560
g/d
Chi
na/
Jian
gsu
n=1,
231
5F
FQ
, 149
-item
,T
1: 0
-200
g/d
Met
S c
ases
(18
1)A
bnor
mal
glu
cose
tol
eran
ce83
.3S
hi e
t al
.N
utrit
ion
Stu
dyS
ex, 5
9% w
omen
valid
ated
T2:
201
-400
g/d
RR
(95
% C
I) =
2.5
0 (1
.37-
4.57
)(2
012)
Age
, 49
.0±
13.2
yT
3: >
401
g/d
in T
3 vs
T1.
**
Hig
h bl
ood
pres
sure
RR
(95
% C
I) =
0.5
8 (0
.36-
0.93
)in
T3
vs T
1.**
Met
S p
reva
lenc
eR
R (
95%
CI)
= 0
.76
(0.4
3-1.
36)
in T
3 vs
T1.

PROSPECTS IN DEVELOPMENT OF QUALITY RICE FOR HUMAN NUTRITION: A REVIEW 17
Iran
/ T
ehra
nn=
1,47
63
FF
Q, 1
68-it
em,
Q1:
93
± 5
9 g/
dM
etS
cas
es (
253)
RR
(95
% C
I) =
1.6
6 (1
.48-
2.15
)83
.3B
ahad
oran
Lipi
d an
dS
ex, 6
1% w
omen
valid
ated
Q2:
209
± 5
8 g/
din
Q4
vs Q
1.*
et a
l. (2
014)
Glu
cose
Stu
dyA
ge,
37.8
±12
.3y
Q3:
262
± 6
0 g/
dQ
4: 4
32 ±
224
g/d
Japa
n/ J
apan
n=92
,223
10F
FQ
, 138
-item
,Q
1: 2
51 ±
83
g/d
New
str
oke
(4,3
95)
and
CV
D in
cide
nce
91.7
Esh
ak e
t al
.P
ublic
Hea
lthS
ex, 5
3% w
omen
valid
ated
Q2:
326
± 8
9 g/
dIH
D (
1,08
8) c
ases
and
Tot
al s
trok
e(2
014)
Cen
tre-
base
dA
ge,
40-6
9yQ
3: 3
77 ±
88
g/d
CV
D m
orta
lity
(2,7
05)
HR
(95
% C
I) =
1.0
1 (0
.90-
1.14
)Q
4: 4
30 ±
89
g/d
in Q
5 vs
Q1.
Q5:
542
± 1
27 g
/dIH
DH
R (
95%
CI)
= 1
.08
(0.8
4-1.
38)
in Q
5 vs
Q1.
CV
D m
orta
lity
Tot
al s
trok
eH
R (
95%
CI)
= 1
.03
(0.8
2-1.
30)
in Q
5 vs
Q1.
Tot
al C
VD
HR
(95
% C
I) =
0.9
7(0
.84-
1.13
) in
Q5
vs Q
1.
US
A/
NH
S I
,n=
207,
556
NH
S: 2
6F
FQ
, 118
- ite
m,
Q1:
<1
serv
ings
/wk
New
CV
DA
djus
ted
HR
(95
% C
I) =
91.7
Mur
aki
et a
l.N
HS
II, H
PF
SS
ex, 8
0% w
omen
NH
SII:
20
valid
ated
Q2:
1 s
ervi
ngs/
wk
case
s (1
2,39
1)0.
98 (
0.84
-1.1
4) f
or w
hite
ric
e;(2
015)
HP
FS
: 24
Q3:
2-4
ser
ving
s/w
k1.
01 (
0.79
-1.2
8) f
or b
row
n ric
e;Q
4: >
5 se
rvin
gs/w
k0.
99 (
0.90
-1.0
8) f
or t
otal
ric
ein
Q5
vs Q
1.
Cas
e-co
ntro
l
Chi
nan=
838
–F
FQ
, 125
-item
,Q
1: <
1100
g/w
kIn
cide
nt i
sche
mic
Adj
uste
d O
R (
95%
CI)
=76
.9Li
ang
et a
l.S
ex, 4
3% w
omen
valid
ated
Q2:
110
0-14
49 g
/wk
stro
ke c
ases
(37
4)2.
73 (
1.31
-5.6
9) i
n(2
010)
Age
, 69
.6±
8.0y
(ca
ses)
;Q
3: 1
450-
2449
Q4
vs Q
1.**
68.7
±7.
0y (
cont
rols
)Q
4: >
2450
g/w
k
Cro
ss-s
ectio
nal
Iran
n=3,
006
–F
FQ
, 49-
item
,G
1: <
7x/w
kM
etS
cas
ese
Adj
uste
d O
R (
95%
CI)
=62
.5K
hosr
avi-
Sex
, 10
0% m
enva
lidat
edG
2: 7
-14x
/wk
1.25
(0.
72-2
.18)
in
Bor
ouje
niA
ge,
39.0
±15
.2y
G2
vs G
1.et
al.
(201
3)(W
R in
take
<7x
/w
k);
34.5
±13
.2y
(WR
inta
ke 7
-14x
/wk)
Sin
gapo
ren=
2,72
8–
FF
Q, 1
69-it
em,
Q1:
0.9
8 po
rtio
ns/d
Deg
ree
of in
sulin
% c
hang
e pe
r po
rtio
n87
.5Z
unig
a et
al.
Age
, 48
.7±
11.5
yva
lidat
edQ
2: 1
.40
port
ions
/dre
sist
ance
Adj
uste
d O
R (
95%
CI)
=(2
014)
Q3:
1.7
5 po
rtio
ns/d
(HO
MA
-IR)
4.62
(1.
29-8
.07)
Q4:
2.1
5 po
rtio
ns/d
Q5:
2.7
9 po
rtio
ns/d
a C
I, co
nfid
ence
inte
rval
; C
VD
, ca
rdio
vasc
ular
dis
ease
; d,
day
; F
FQ
, fo
od f
requ
ency
que
stio
nnai
re;
HO
MA
-IR
, ho
meo
stat
ic m
odel
ass
essm
ent
– in
sulin
res
ista
nce;
HP
FS
, H
ealth
Pro
fess
iona
ls F
ollo
w-u
p S
tudy
; H
R,
haza
rd r
atio
; IH
D,
isch
emic
hea
rt d
isea
se;
Met
S, m
etab
olic
syn
drom
e; O
R, o
dds
ratio
; RR
, rel
ativ
e ris
k; T
2D, t
ype
2 di
abet
es; w
k, w
eek;
y, y
ears
. b
P-f
or-t
rend
, *<0
.05,
**<
0.01
c T
he q
ualit
y of
the
stud
ies
wer
e as
sess
ed b
y ad
aptin
g a
scor
ing
syst
em b
y Li
even
se e
t al.
(200
1).
d C
lass
ifica
tion
was
bas
ed o
n qu
artil
es o
f die
tary
GI.
e
Pre
vale
nce
of M
etS
in th
e st
udie
d po
pula
tion
was
not
rep
orte
d.
18 PROSPECTS IN DEVELOPMENT OF QUALITY RICE FOR HUMAN NUTRITION: A REVIEW
T2D was 1.55 for Asian populations compared to1.12 for Western populations (Hu et al., 2012). Adose-response analysis further indicated an 11%greater risk of T2D for each serving per dayincrement of white rice intake (Hu et al., 2012).Particularly, one study noted women consuming>2 servings of brown rice weekly were 17% lesslikely to develop T2D compared to infrequent brownrice consumers (<1 serving.month-1) (Sun et al.,2010).
Rice consumption and cardiovascular death riskhas also been explored. In the Japan CollaborativeCohort Study (n=83752), middle-aged Japanese menin the highest quintile had an 18% lower risk forCVD mortality compared to the lowest quintile(Eshak et al., 2011). However, in the Japan PublicHealth Centre-based Study (n=92223), Eshak et al.(2014) reported rice consumption was not associatedwith risk of CVD morbidity or mortality. Thesefindings contrasted with those of Oba et al. (2010),who found a positive trend between rice andhaemorrhagic stroke in Japanese women (adjustedHR = 2.36; 95% CI 0.92-6.03). A more recentanalysis of pooled data from three US cohort studiesfound no association between white and brown riceconsumption with CVD incidence (Muraki et al.,2015). This could be partly explained by the higherproportion of women (>80%) and relatively lowerintake of rice in the Caucasian populations. In arecent meta-analysis which included 7 prospectivecohort studies (n=225000), higher dietary glycaemicload, rather than glycaemic index and totalcarbohydrate intake was significantly associatedwith 19% greater risk for stroke (Cai et al., 2015).
Metabolic syndrome (MetS), as characterizedby insulin resistance and systemic inflammation(DeFronzo, 2010), was suggested as an underlyingpathway contributory to T2D and CVD (Wilson etal., 2005; Meigs et al., 2006). The Jiangsu NutritionStudy in China documented significantly greaterrisk for abnormal glucose tolerance and lowerrisk for blood pressure were associated with >401g.day-1 of cooked rice consumption (Shi et al.,2012). However, MetS prevalence was not linked torice intake in this Chinese population. In contrast,Iranian data (Bahadoran et al., 2014) showed apositive link between higher white rice intake andrisk of MetS. However, the results were not adjustedfor confounders such as baseline serum high-densitylipoprotein cholesterol, systolic and diastolic bloodpressure, which were reported to be significantlydifferent across the white rice intake quartiles.
Overall the form in which rice is habituallyconsumed may explain the development of chronicdisease. In China, increased consumption of cookedrice (adjusted odds ratio [aOR] = 2.73, 95% CI 1.31-5.69), congee (aOR = 2.93, 95% CI 1.68-5.13) andrice noodle (aOR = 2.03, 95% CI 1.40-2.94) were
associated with a higher risk for ischemic stroke ina case-control study involving 374 incidentischemic stroke patients and 464 hospital-basedcontrols (Liang et al., 2010). Further, there ispreliminary evidence on the gender differences inmediating the possible beneficial or detrimentaleffects of rice consumption on glycaemic and lipidmarkers (Nanri et al., 2010; Sun et al., 2010; Eshaket al., 2011).
Given these limited observations, a possiblerelationship between white rice consumption andhealth risks exists. Most studies do not specify thetype of rice consumed respective to white, brownor pigmented rice varieties. Furthermore, thehypothetical detrimental effects of habitual riceconsumption appear to be offset when rice isincluded as part of a “balanced and healthy” prudentdietary pattern, which typically reflects adequateintakes of fruits, vegetables, legumes and leanprotein choices (Dugee et al., 2009; Yu et al., 2011;Ahn et al., 2013; Khosravi-Boroujeni et al., 2013).Therefore, a well-designed, randomized controlledtrial may serve to answer the health-mediatingeffects of long-term polished white rice consumptionor substitution with minimally-processed pigmentedrice in humans.
TARGETING RICE QUALITY FOR DISEASEPREVENTION AND MANAGEMENT
Current evidence from epidemiological studiessuggests that adhering to diets high in whole grainsis postulated to lower risk of developing obesity,T2D and cardiovascular disease (Ye et al., 2012;Aune et al., 2013b; Cho et al., 2013; Parker et al.,2013). In recognition of the association between dietand non-communicable diseases, the resonatingmessage of most national dietary guidelines is toadvocate the choice of whole grains over refinedgrains (Malaysian Dietary Guidelines, 2010;Australian Dietary Guidelines, 2013; DietaryGuidelines for Americans, 2015). The paradigm shiftfor healthy eating in the 21st century shoulddeliberately focus on the overall diet quality ratherthan single-nutrient (such as fat or carbohydrate) orfood group intakes (Willett & Stampfer, 2013). Dietquality is assessed using a scoring system whichreflects a person’s general food intake pattern inalignment with national dietary guidelines anddiversity of healthy choices within each individualfood group (Wirt & Collins, 2009).The deliberatechoice of whole grains, for example, has beenshown to improve diet quality of U.S. adults (O’Neilet al., 2010). Further, by using a 10-year predictivemathematical model, Sar and Marks (2015)projected that increment in Cambodian diabetesincidence will be reduced by 27% if the population
PROSPECTS IN DEVELOPMENT OF QUALITY RICE FOR HUMAN NUTRITION: A REVIEW 19
switches from a high-GI rice type (Phka Rumduol;GI, 88) to a low-GI type (IR66; GI, 54). Similarly,reducing 25% of current rice consumption levelswas also predicted to reduce diabetes burden by 26%(Sar & Marks, 2015).
However, evidence is inconsistent in relation toclinical benefits from replacing white rice withbrown rice (Table 3). Replacing half of the usualportion of white rice (total dietary fibre, TDF 1.9g.100g-1) with high-fibre rice (TDF 4 g.100g-1) for4 weeks significantly reduced body weight, bodymass index, low-density lipoprotein cholesterol(LDL-C) and triacylglycerol in Korean overweightadults (Lee et al., 2006). Substituting white rice withbrown rice for 16 weeks in middle-aged Chinese menand women did not result in favourable reductionsin serum glycaemic and lipid markers (Zhang etal., 2011). Reductions in body weight and LDL-Clevel and improvement in antioxidant status ofoverweight and obese Korean women were achievedwith brown or black rice substitution in a very-lowcalorie diet (~800 kcal.day-1) (Kim et al., 2008). Aslight reduction in high-sensitivity C-reactiveprotein, an inflammatory marker, occurred in non-diabetic overweight women 6 weeks after replacingbrown rice for white rice without changing fastingblood glucose and lipid profile (Kazemzadeh et al.,2014). Comparatively, consumption of >80 g wholegrains per day led to lower but non-significant trendsin interleukin-10 and C-reactive protein levels inadults with low habitual whole grains (<24 g.day-1) intake (Ampatzoglou et al., 2015).
The mixed meal or lente effect in moderatingmetabolic outcome is an important approach inimproving diet quality. In addition to rice, pulsesand legumes contribute about 8% of daily energyintake for Indians in Southern India (Radhika et al.,2010). The addition of legumes to a brown rice dietsignificantly lowered the overall 24-h glycaemicand insulin responses compared to the brown orwhite rice only diets consumed by diabetes-free,overweight Indians (Mohan et al., 2014). Thisechoes the findings of another Indian study wherebya traditional dietary pattern rich in pulses and ricewas inversely associated with diabetes incidence(Daniel et al., 2011). Similarly in Korea, eating ricewith beans significantly lowered the risk for centralobesity and abnormal fasting glucose in womencompared to eating white rice alone (Ahn et al.,2013). Reductions in fasting plasma glucose, insulinand lipid peroxidation markers (malondialdehyde,homocysteine) and improved β-cell function werereported in Korean patients with coronary arterydisease after replacing breakfast with a whole-grainrice and legume (brown rice, barley, black beans)(Jang et al., 2001). Further, Asian diabetic patientsin Australia consuming a diet with 60% white riceand 40% of mixed legumes, nuts and seeds, achieved
significantly lower postprandial blood glucoselevels compared to consuming white rice alone(Zhang et al., 2015).
Aside from brown rice, pre-germinated brownrice (PGBR) has generated interest in Japan as ahealth approach to disease prevention. PGBR, alsocalled as “sprouted brown rice”, is produced byrepeatedly soaking brown rice at 35 to 40°C for24 to 36 hours until a 0.5 to 1-mm long sprout isformed from the brown rice seed (Roohinejad etal., 2010, 2011). Brown rice when subjected togermination will undergo enhancement of itsnutritional and functional properties such as protein,gamma-amino butyric acid (GABA), phenolic acids,γ-oryzanol and total dietary fibre (Patil & Khan,2011). By consuming PGBR in place of white rice,subjects with impaired glucose tolerance or T2Dbenefit with increased HDL-C but decreased serumtriglycerides, LDL-C and glycaemic markers (Hsu etal., 2008; Bui et al., 2014). The hypocholesterolemiceffects of PGBR may be attributed to its greaterGABA (Roohinejad et al., 2010), oryzanol andtocopherols (Esa et al., 2011) content as well as up-regulation of the LDL and Apolipoprotein A1receptor genes (Imam et al., 2013), as demonstratedin animal models.
Overall, these results should be interpreted withcaution as the lack of positive findings could beattributed to underpowered observation from smallsampling size, administration of non-isocaloricintervention meals or negligible GI differencesbetween the white and brown rice types.
CONCLUSIONS AND FUTURE DIRECTIONS
Rice in the human diet serves underprivilegedpopulations in Asia as a means of nutritionalreplenishment for energy and protein as well servingas a vehicle for micronutrient fortification. Buttoday, the prospect of rice in human nutrition hastaken on the additional role of safeguarding againstNCDs development. Malaysia has witnessed atremendous economic advancement with nationalGDP per capita growing from ~500USD in 1961 to~10000 USD in 2011. In line with this wealth growthis the high prevalence of NCDs. The threat is realenough for the scientific community to promotewhole grain consumption in place of refined grains.However, the interpretation of whole grainconsumption as a choice of brown over polishedwhite rice is to be cautioned as clearly not all ricetypes could be classified as low GI. For now moreresearch is warranted to elucidate if there is any safe,gender-specific tolerable level of daily riceconsumption or would partial or total replacementof white rice with brown rice offer additionalhealth benefits. Additionally, nutrition education
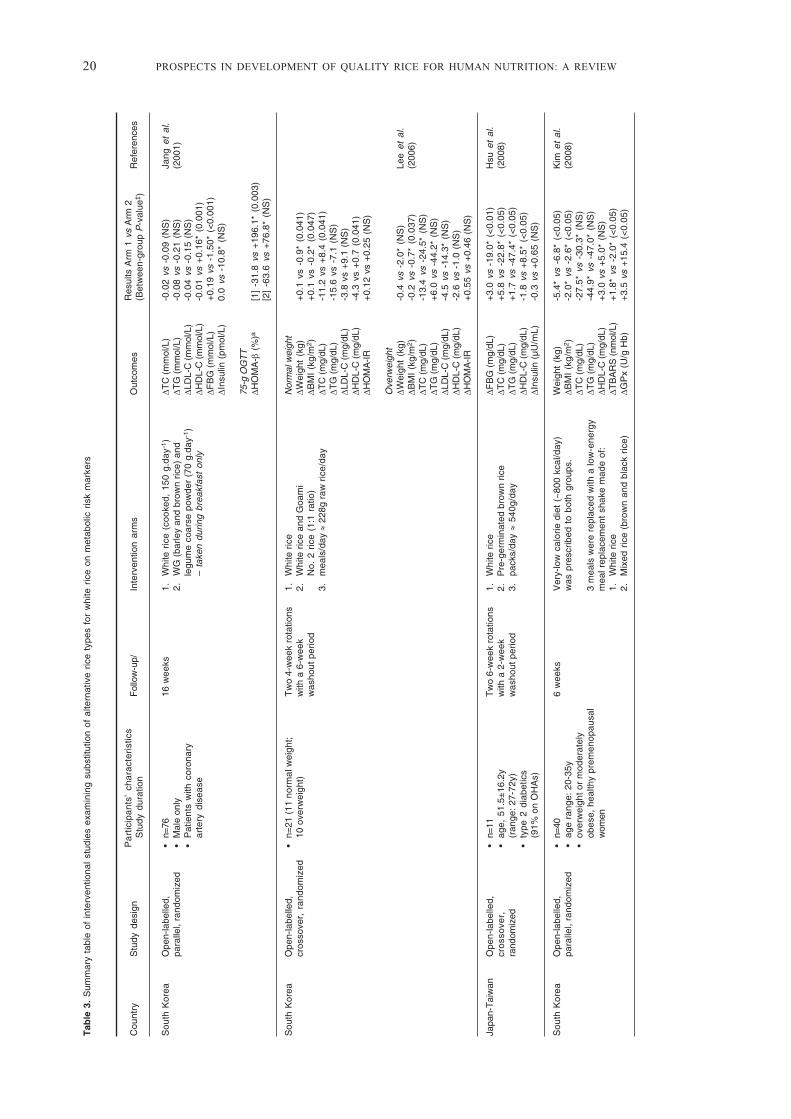
20 PROSPECTS IN DEVELOPMENT OF QUALITY RICE FOR HUMAN NUTRITION: A REVIEW
Tab
le 3
. S
umm
ary
tabl
e of
int
erve
ntio
nal
stud
ies
exam
inin
g su
bstit
utio
n of
alte
rnat
ive
rice
type
s fo
r w
hite
ric
e on
met
abol
ic r
isk
mar
kers
Cou
ntry
Stu
dy d
esig
nP
artic
ipan
ts’
char
acte
rist
ics
Fol
low
-up/
Inte
rven
tion
arm
sO
utco
mes
Res
ults
Arm
1 v
s A
rm 2
Ref
eren
ces
Stu
dy d
urat
ion
(Bet
wee
n-gr
oup
P-v
alue
‡ )
Sou
th K
orea
Ope
n-la
belle
d,•
n=76
16 w
eeks
1.
Whi
te r
ice
(coo
ked,
150
g.d
ay-1
)ΔT
C (
mm
ol/L
)-0
.02
vs -
0.09
(N
S)
Jang
et
al.
para
llel,
rand
omiz
ed•
Mal
e on
ly2
.W
G (
barle
y an
d br
own
rice)
and
ΔTG
(m
mol
/L)
-0.0
8 vs
-0.
21 (
NS
)(2
001)
•P
atie
nts
with
cor
onar
yle
gum
e co
arse
pow
der
(70
g.da
y-1)
ΔLD
L-C
(m
mol
/L)
-0.0
4 vs
-0.
15 (
NS
)ar
tery
dis
ease
– ta
ken
durin
g br
eakf
ast
only
ΔHD
L-C
(m
mol
/L)
-0.0
1 vs
+0.
16*
(0.0
01)
ΔFB
G (
mm
ol/L
)+
0.19
vs
-1.5
0* (
<0.
001)
ΔIns
ulin
(pm
ol/L
)0.
0 vs
-10
.8*
(NS
)
75-g
OG
TT
ΔHO
MA
-β (
%)a
[1]
-31.
8 vs
+19
6.1*
(0.
003)
[2]
-63.
6 vs
+76
.8*
(NS
)
Sou
th K
orea
Ope
n-la
belle
d,•
n=21
(11
nor
mal
wei
ght;
Tw
o 4-
wee
k ro
tatio
ns1
.W
hite
ric
eN
orm
al w
eigh
tcr
osso
ver,
ran
dom
ized
10 o
verw
eigh
t)w
ith a
6-w
eek
2.
Whi
te r
ice
and
Goa
mi
ΔWei
ght
(kg)
+0.
1 vs
-0.
9* (
0.04
1)w
asho
ut p
erio
dN
o. 2
ric
e (1
:1 r
atio
)ΔB
MI
(kg/
m2 )
+0.
1 vs
-0.
2* (
0.04
7)3
.m
eals
/day
≈ 2
28g
raw
ric
e/da
yΔT
C (
mg/
dL)
-11.
2 vs
+8.
4 (0
.041
)ΔT
G (
mg/
dL)
-15.
6 vs
-7.
1 (N
S)
ΔLD
L-C
(m
g/dL
)-3
.8 v
s +
9.1
(NS
)ΔH
DL-
C (
mg/
dL)
-4.3
vs
+0.
7 (0
.041
)ΔH
OM
A-IR
+0.
12 v
s +
0.25
(N
S)
Ove
rwei
ght
ΔWei
ght
(kg)
-0.4
vs
-2.0
* (N
S)
Lee
et a
l.ΔB
MI
(kg/
m2 )
-0.2
vs
-0.7
* (0
.037
)(2
006)
ΔTC
(m
g/dL
)-1
3.4
vs -
24.5
* (N
S)
ΔTG
(m
g/dL
)+
6.0
vs -
44.2
* (N
S)
ΔLD
L-C
(m
g/dL
)-4
.5 v
s -1
4.3*
(N
S)
ΔHD
L-C
(m
g/dL
)-2
.6 v
s -1
.0 (
NS
)ΔH
OM
A-IR
+0.
55 v
s +
0.46
(N
S)
Japa
n-T
aiw
anO
pen-
labe
lled,
•n=
11T
wo
6-w
eek
rota
tions
1.
Whi
te r
ice
ΔFB
G (
mg/
dL)
+3.
0 vs
-19
.0*
(<0.
01)
Hsu
et
al.
cro
sso
ver,
•ag
e, 5
1.5±
16.2
yw
ith a
2-w
eek
2.
Pre
-ger
min
ated
bro
wn
rice
ΔTC
(m
g/dL
)+
5.8
vs -
22.8
* (<
0.05
)(2
008)
rand
omiz
ed(r
ange
: 27
-72y
)w
asho
ut p
erio
d3
.pa
cks/
day ≈
540g
/day
ΔTG
(m
g/dL
)+
1.7
vs -
47.4
* (<
0.05
)•
type
2 d
iabe
tics
ΔHD
L-C
(m
g/dL
)-1
.8 v
s +
8.5*
(<
0.05
)(9
1% o
n O
HA
s)ΔI
nsul
in (
µU/m
L)-0
.3 v
s +
0.65
(N
S)
Sou
th K
orea
Ope
n-la
belle
d,•
n=40
6 w
eeks
Ver
y-lo
w c
alor
ie d
iet
(~80
0 kc
al/d
ay)
Wei
ght
(kg)
-5.4
* vs
-6.
8* (
<0.
05)
Kim
et
al.
para
llel,
rand
omiz
ed•
age
rang
e: 2
0-35
yw
as p
resc
ribed
to
both
gro
ups.
ΔBM
I (k
g/m
2 )-2
.0*
vs -
2.6*
(<
0.05
)(2
008)
•ov
erw
eigh
t or
mod
erat
ely
ΔTC
(m
g/dL
)-2
7.5*
vs
-30.
3* (
NS
)ob
ese,
hea
lthy
prem
enop
ausa
l3
mea
ls w
ere
repl
aced
with
a lo
w-e
nerg
yΔT
G (
mg/
dL)
-44.
9* v
s -4
7.0*
(N
S)
wom
enm
eal r
epla
cem
ent
shak
e m
ade
of:
ΔHD
L-C
(m
g/dL
)+
3.0
vs +
5.0*
(N
S)
1.
Whi
te r
ice
ΔTB
AR
S (
nmol
/L)
+1.
8* v
s -2
.0*
(<0.
05)
2.
Mix
ed r
ice
(bro
wn
and
blac
k ric
e)ΔG
Px
(U/g
Hb)
+3.
5 vs
+15
.4 (
<0.
05)

PROSPECTS IN DEVELOPMENT OF QUALITY RICE FOR HUMAN NUTRITION: A REVIEW 21
Chi
naO
pen-
labe
lled,
•n=
202
16 w
eeks
1.
Whi
te r
ice
ΔHbA
1c (
%)
+0.
20*
vs +
0.13
* (N
S)
Zha
ng e
t al
.pa
ralle
l, ra
ndom
ized
• m
ean
age,
49y
2.
Bro
wn
rice
ΔTC
(m
mol
/L)
-0.4
0* v
s -0
.10
(0.0
5)(2
011)
•ty
pe 2
dia
betic
s or
at
high
ΔLD
L-C
(m
mol
/L)
-0.3
3* v
s -0
.03
(0.0
2)ris
k fo
r di
abet
es2
pack
s/da
y ≈
450g
/day
ΔHD
L-C
(m
mol
/L)
-0.1
2**
vs -
0.03
(0.
09)
ΔTC
:HD
L+
0.09
* vs
-0.
02 (
NS
)ΔH
OM
A-IR
+0.
07 v
s +
0.03
(N
S)
Vie
tnam
Ope
n-la
belle
d,•
n=60
16 w
eeks
1.
Whi
te r
ice
ΔFB
G (
mg/
dL)b
+0.
16 v
s -0
.74*
*B
ui e
t al
.pa
ralle
l, ra
ndom
ized
•ag
e, 5
6.9±
5.8
(PG
BR
gro
up);
2.
Pre
-ger
min
ated
bro
wn
rice
ΔHbA
1c (
%)
+0.
16 v
s -0
.72*
(201
4)56
.6±
5.0
(WR
gro
up)
ΔTC
(m
mol
/L)
+0.
61**
vs
-0.2
7•
Sub
ject
s w
ith im
paire
dW
R w
as g
radu
ally
rep
lace
d by
PG
BR
ΔLD
L-C
(m
mol
/L)
+0.
08 v
s -0
.39*
gluc
ose
tole
ranc
ew
ithin
a m
onth
.ΔH
DL-
C (
mm
ol/L
)+
0.28
** v
s +
0.41
**ΔT
G (
mm
ol/L
)-0
.60
vs -
1.27
*
Iran
Ope
n-la
belle
d,•
n=35
Tw
o 6-
wee
k ro
tatio
ns1
.W
hite
ric
eΔF
BG
(m
g/dL
)-7
vs
-1 (
NS
)K
azem
zade
hcr
oss
ove
r,•
age,
32.
6±6y
with
a 2
-wee
k2
.B
row
n ric
eΔT
C (
mg/
dL)
-2 v
s -6
(N
S)
et a
l. (2
014)
rand
omiz
ed•
Fre
e-liv
ing,
non
-dia
betic
was
hout
per
iod
ΔLD
L-C
(m
g/dL
)+
0.5
vs +
1.0
(NS
)ov
erw
eigh
t wom
enT
o co
nsum
e 15
0g c
ooke
d ric
e/da
yΔH
DL-
C (
mg/
dL)
-0.5
vs
-3.5
(N
S)
ΔTG
(m
g/dL
)+
1.0
vs +
1.0
(NS
)Δh
sCR
P (
mg/
L)+
1.2
vs -
0.7
(0.0
1)
Indi
aO
pen-
labe
lled,
•n=
152
test
mea
ls1
.W
hite
ric
eΔ%
iAU
Cgl
uB
R v
s W
RM
ohan
et
al.
cro
sso
ver,
•A
ge,
25-4
5y(b
reak
fast
and
lun
ch)
2.
Bro
wn
rice
(>20
0g r
epla
ced)
Δ% f
astin
g in
sulin
-19.
8%*
(201
4)ra
ndom
ized
•F
ree-
livin
g, n
on-d
iabe
ticpr
ovid
ed f
or 5
3.
Bro
wn
rice
+ le
gum
es (
50g/
day)
-57.
0%**
over
wei
ght
adul
tsco
nsec
utiv
e da
ys w
ith9-
day
was
hout
per
iod
y, y
ears
; BR
, bro
wn
rice;
FB
G, f
astin
g bl
ood
gluc
ose;
HbA
1c, g
lyco
syla
ted
haem
oglo
bin;
HD
L-C
, hig
h-de
nsity
lipo
prot
ein
chol
este
rol;
HO
MA
-IR
, hom
eost
atic
mod
el a
sses
smen
t – in
sulin
res
ista
nce;
hsC
RP
, hig
h-se
nsiti
vity
C-r
eact
ive
prot
ein;
LD
L-C
, low
-den
sity
lipop
rote
in c
hole
ster
ol; N
S, n
ot s
igni
fican
t; O
HA
, ora
l hyp
ogly
caem
ic a
gent
s; T
C, t
otal
cho
lest
erol
; TG
, trig
lyce
ride;
WR
, whi
te r
ice
Sig
nific
ant w
ithin
-gro
up d
iffer
ence
s, *
P<0
.05,
**P
<0.0
01a
Ana
lyse
s w
ere
stra
tifie
d ac
cord
ing
to n
on-d
iabe
tic (
1) a
nd d
iabe
tic (
2) C
AD
pat
ient
s.b
Sig
nific
ance
of b
etw
een-
grou
p ch
ange
s w
ere
not i
ndic
ated
.

22 PROSPECTS IN DEVELOPMENT OF QUALITY RICE FOR HUMAN NUTRITION: A REVIEW
programs should focus on disseminating health-promoting traits of brown rice to consumers as astrategy in promoting whole grain consumption. Inthe meantime, rice breeding and improvementprograms need to take into account traits that willimprove rice quality in terms of GI as well asmicronutrient capacity.
ACKNOWLEDGEMENTS
The authors declare that they have no competinginterests. Ideas in this paper came from a presentationby TK at the IRRI South Asia Breeding Hub,International Crops Research Institute for the Semi-Arid Tropics (ICRISAT) in Hyderabad, India on 25th
November 2014.
LIST OF ABBREVIATIONS
aOR: adjusted odd ratio; BC: Before Christ; CI:confidence interval; BR: brown rice; CPM: chewsper mouthful; CVD: cardiovascular disease; FAO:Food and Agriculture Organization; g: grams;GABA: gamma-amino butyric acid; GDP: grossdomestic product; GI: glycaemic index; GL:glycaemic load; HDL-C: high-density lipoproteincholesterol; IP6: inositol hexophosphate; IRRI:International Rice Research Institute; LDL-C: low-density lipoprotein cholesterol; MetS: metabolicsyndrome; mins: minutes; mg: milligrams; NCD:non-communicable diseases; NGT: normal glucosetolerance; NSP: non-starch polysaccharides; PGBR:pre-germinated brown rice; PPG: postprandialglucose; RAG: rapidly available glucose; RDS:rapidly digestible starch; RR: relative risk; RS:resistant starch; SDI: starch digestible index; SDS,slowly digestible starch; T2D: type 2 diabetes; TDF:total dietary fibre; USD: United States dollar.
REFERENCES
Abdel-Aal, E.M., Young, J.C. & Rabalski, I. 2006.Anthocyanin composition in black, blue, pink,purple, and red cereal grains. Journal ofAgricultural and Food Chemistry, 54: 4696-4704.
Ahn, Y., Park, S.J., Kwack, H.K., Kim, M.K., Ko, K.P.& Kim, S.S. 2013. Rice-eating pattern and therisk of metabolic syndrome especially waistcircumference in Korean Genome andEpidemiology Study (KoGES). BMC PublicHealth, 13: 61.
Ali, N., Paul, S., Gayen, D., Sarkar, S.N., Datta, S.K.& Datta, K. 2013. RNAi mediated downregulation of myo-inositol-3-phosphate synthaseto generate low phytate rice. Rice, 6: 12.
Al-Mssallem, M.Q., Hampton, S.M., Frost, G.S. &Brown, J.E. 2011. A study of Hassawi rice(Oryza sativa L.) in terms of its carbohydatehydrolysis (in vitro) and glycaemic andinsulinaemic indices (in vivo). EuropeanJournal of Clinical Nutrition, 65(5): 627-634.
American Association of Cereal Chemists (AACC).2001. The definition of dietary fiber. Report ofthe Dietary Fiber Definition Committee to theBoard of Directors of the American Associationof Cereal Chemists. Cereal Foods World, 46(3):112-126. http://www.aaccnet.org/initiatives/definitions/Documents/DietaryFiber/DFDef.pdf[Last accessed on 10 January 2015].
Ampatzoglou, A., Williams, C.L., Atwal, K.K.,Maidens, C.M., Ross, A.B., Thielecke, F.,Jonnalagadda, S.S., Kennedy, O.B. & Yaqoob,P. 2015. Effects of increased wholegrainconsumption on immune and inflammatorymarkers in healthy low habitual wholegrainconsumers. European Journal of Nutrition, [inpress].
Aston, L.M., Gambell, J.M., Lee, D.M., Bryant, S.P.,& Jebb, S.A. 2008. Determination of theglycaemic index of various staple carbohydrate-rich foods in the UK diet. European Journal ofClinical Nutrition, 62(2): 279-285.
Atkinson, F.S., Foster-Powell, K. & Brand-Miller,J.C. 2008. International tables of GlycemicIndex and Glycemic Load values: 2008.Diabetes Care, 31: 2281-2283.
Aune, D., Norat, T., Romundstad, P. & Vatten, L.J.2013a. Dairy products and the risk of type 2diabetes: a systematic review and dose-responsemeta-analysis of cohort studies. AmericanJournal of Clinical Nutrition, 98(4): 1066-1083.
Aune, D., Norat, T., Romundstad, P. & Vatten, L.J.2013b. Whole grain and refined grainconsumption and the risk of type 2 diabetes: asystematic review and dose-response meta-analysis of cohort studies. European Journal ofEpidemiology, 28(11): 845-858.
Australian Dietary Guidelines. 2013. Canberra:National Health and Medical Research Council.
Ayamdoo, J.A., Demuyakor, B., Dogbe, W. &Owusu, R. 2013. Parboiling of paddy rice, thescience and perceptions of it as practiced inNorthern Ghana. International Journal ofScientific & Technology Research, 2(4): 13-18.
PROSPECTS IN DEVELOPMENT OF QUALITY RICE FOR HUMAN NUTRITION: A REVIEW 23
Bahadoran, Z., Mirmiran, P. & Azizi, F. 2013.Dietary polyphenols as potential nutraceuticalsin management of diabetes: a review. Journalof Diabetes and Metabolic Disorders, 12: 43.
Bahadoran, Z., Mirmiran, P., Delshad, H. & Azizi,F. 2014. White rice consumption is a risk factorfor metabolic syndrome in Tehrani adults: aprospective approach in Tehran Lipid andGlucose Study. Archives of Iranian Medicine,17(6): 435-440.
Baker, P. & Friel, S. 2014. Processed foods and thenutrition transition: evidence from Asia. ObesityReviews, 15(7): 564-577.
Baliunas, D.O., Taylor, B.J., Irving, H., Roerecke,M., Patra, J., Mohapatra, S. & Rehm, J. 2009.Alcohol as a risk factor for type 2 diabetes.Diabetes Care, 32: 2123-2132.
Bao, W., Rong, Y., Rong, S. & Liu, L.G. 2012.Dietary iron intake, body iron stores, and therisk of type 2 diabetes: a systematic review andmeta-analysis. BMC Medicine, 10: 119.
Barakatun Nisak, M.Y., Ruzita, A.T. & Norimah,A.K. 2005. Glycaemic index of eight types ofcommercial rice in Malaysia. Malaysian Journalof Nutrition, 11(2): 151-163.
Berger, A., Rein, D., Schäfer, A., Monnard, I.,Gremaud, G., Lambelet, P. & Bertoli, C. 2005.Similar cholesterol-lowering properties of ricebran oil, with varied ã-oryzanol, in mildlyhypercholesterolemic men. European Journalof Nutrition, 44: 163-173.
Bhuiyan, M.A.R., Narimah, M.K., Abdul Rahim, H.,Abdullah, M.Z. & Wickneswari, R. 2011.Transgressive variants for red pericarp grain withhigh yield potential derived from Oryzarufipogon x Oryza sativa: Field evaluation,screening for blast disease, QTL validation andbackground marker analysis for agronomic traits.Field Crop Research, 121: 232-239.
Bhullar, N.K. & Gruissem, W. 2013. Nutritionalenhancement of rice for human health: thecontribution of biotechnology. BiotechnologyAdvances, 31: 50-57.
Bui, T.N., Le, T.H., Nguyen, D.H., Tran, Q.B.,Nguyen, T.L., Le, D.T., Nguyen, D.V.A., Vu,A.L., Aoto, H., Okuhara, Y., Ito, Y., Yamamoto,S. & Kise, M. 2014. Pre-germinated brown ricereduced both blood glucose concentration andbody weight in Vietnamese women withimpaired glucose tolerance. Journal ofNutritional Science and Vitaminology, 60: 183-187.
Cai, X.L., Wang, C., Wang, S., Cao, G.Y., Jin, C., Yu,J.W., Li, X.Y., Yan, J., Wang, F.D., Yu, W. &Ding, F. 2015. Carbohydrate intake, glycemicindex, glycemic load, and stroke: a meta-analysis of prospective cohort studies. AsiaPacific Journal of Public Health, doi: 10.1177/1010539514566742.
Calingacion, M., Fang, L., Quiatchon-Baeza, L.,Mumm, R., Riedel, A., Hall, R.D. & Fitzgerald,M. 2015. Delving deeper into technologicalinnovations to understand differences in ricequality. Rice, 8: 6.
Calingacion, M., Laborte, A., Nelson, A.,Resurreccion, A., Concepcion, J.C., Daygon,V.D., Mumm, R., Reinke, R., Dipti, S.,Bassinello, P.Z., Manful, J., Sophany, S., Lara,K.C., Bao, J.S., Xie, L.H., Loaiza, K., Ei-hissewy,A., Gayin, J., Sharma, N., Rajeswari, S.,Manonmani, S., Rani, N.S., Kota, S., Indrasari,S.D., Habibi, F., Hosseini, M., Tavasoli, F.,Suzuki, K., Umemoto, T., Boualaphanh, C., Lee,H.H., Hung, Y.P., Ramli, A., Aung, P.P., Ahmad,R., Wattoo, J.I., Bandonill, E., Romero, M.,Brites, C.M., Hafeel, R., Lur, H.S., Cheaupun, K.,Jongdee, S., Blanco, P., Bryant, R., Lang, N.T.,Hall, R.D. & Fitzgerald, M. 2014. Diversity ofglobal rice markets and the science required forconsumer-targeted rice breeding. PLoS ONE,9(1): e85106.
Callaway, E. 2014. Domestication: the birth of rice.Nature, 514: S58-S59.
Champagne, E.T., Hron, R.J. SR. & Abraham, G.1991. Stabilizing brown rice products byaqueous ethanol extraction. Cereal Chemistry,68(3): 267-271.
Chan, H.M.S., Brand-Miller, J.C., Holt, S.H.A.,Wilson, D., Rozman, M. & Petocz, P. 2001. Theglycaemic index values of Vietnamese foods.European Journal of Clinical Nutrition. 55:1076-1083.
Chen, C.W. & Cheng, H.H. 2006. A rice bran oil dietincreases LDL-receptor and HMG-CoAreductase mRNA expressions and insulinsensitivity in rats with streptozotocin/nicotinamide-induced type 2 diabetes. Journalof Nutrition, 136: 1472-1476.
Cheruvanky, R. & Thummala, R.C. 1991.Nutritional and biochemical aspects of thehypolipidemic action of rice bran oil: A review.Journal of the American College of Nutrition,10(4): 593-601.
24 PROSPECTS IN DEVELOPMENT OF QUALITY RICE FOR HUMAN NUTRITION: A REVIEW
Chiu, Y.T. & Stewart, M.L. 2013. Effect of varietyand cooking method on resistant starch contentof white rice and subsequent postprandialglucose response and appetite in humans. AsiaPacific Journal of Clinical Nutrition, 22(3):372-379.
Cho, S.S., Qi, L., Fahey Jr., G.C. & Klurfeld, D.M.2013. Consumption of cereal fiber, mixtures ofwhole grains and bran, and whole grains andrisk reduction in type 2 diabetes, obesity, andcardiovascular disease. American Journal ofClinical Nutrition, 98: 594-619.
Chou, T.W., Ma, C.Y., Cheng, H.H., Chen, Y.Y. &Lai, M.H. 2009. A rice bran oil diet improveslipid abnormalities and suppress hyper-insulinemic responses in rats withstreptozotocin/nicotinamide-induced type 2diabetes. Journal of Clinical Biochemistry andNutrition, 45: 29-36.
Chung, H.J., Liu, Q. & Hoover, R. 2009. Impact ofannealing and heat-moisture treatment onrapidly digestible, slowly digestible andresistant starch levels in native and gelatinizedcorn, pea and lentil starches. CarbohydratePolymers, 75: 436-447.
Cicero, A.F.R. & Derosa, G. 2005. Rice bran and itsmain components: potential role in themanagement of coronary risk factors. CurrentTopics in Nutraceutical Research, 3(1): 29-46.
Coulston, A.M. & Reaven, G.M. 1997. Much adoabout (almost) nothing. Diabetes Care, 20(3):241-243.
Daniel, C.R., Prabhakaran, D., Kapur, K., Graubard,B.I., Devasenapathy, N., Ramakrishnan, L.,George, P.S., Shetty, H., Ferrucci, L.M.,Yurgalevitch, S., Chatterjee, N., Reddy, K.S.,Rastogi, T., Gupta, P.C., Mathew, A. & Sinha,R. 2011. A cross-sectional investigation ofregional patterns of diet and cardio-metabolicrisk in India. Nutrition Journal, 10: 12.
Deepa, G., Singh, V. & Naidu, K.A. 2008. Nutrientcomposition and physicochemical properties ofIndian medicinal rice – Njavara. FoodChemistry, 106: 165-171.
DeFronzo, R.A. 2010. Insulin resistance,lipotoxicity, type 2 diabetes andatherosclerosis: the missing links. The ClaudeBernard Lecture 2009. Diabetologia, 53: 1270-1287.
Deng, G.F., Xu, X.R., Zhang, Y., Li, D., Gan, R.Y. &Li, H.B. 2013. Phenolic compounds andbioactivities of pigmented rice. CriticalReviews in Food Science and Nutrition, 53:296-306.
Dhital, S., Dabit, L., Zhang, B., Flanagan, B. &Shrestha, A.K. 2015. In vitro digestibility andphysicochemical properties of milled rice. FoodChemistry, 172: 757-765.
Dietary Guidelines for Americans. 2015.Washington, DC: US Departments of Agricultureand Health and Human Services.
Dong, J.Y., Xun, P.C., He, K. & Qin, L.Q. 2011.Magnesium intake and risk of type 2 diabetes.Diabetes Care, 34: 2116-2122.
Dugee, O., Khor, G.L., Lye, M.S., Luvsannyam, L.,Janchiv, O., Jamyan, B. & Esa, N. 2009.Association of major dietary patterns withobesity risk among Mongolian men and women.Asia Pacific Journal of Clinical Nutrition.18(3): 433-440.
Eady, S., Wallace, A., Willis, J., Scott, R. &Frampton, C. 2011. Consumption of a plantsterol-based spread derived from rice bran oil iseffective at reducing plasma lipid levels inmildly hypercholesterolaemic individuals.British Journal of Nutrition, 105: 1808-1818.
Englyst, H.N. & Hudson, G.J. 1996. Theclassification and measurement of dietarycarbohydrates. Food Chemistry, 57(1): 15-21.
Esa, N.M., Kadir, K.K.A., Amom, Z. & Azlan, A.2011. Improving the lipid profile inhypercholesterolemia-induced rabbit bysupplementation of germinated brown rice.Journal of Agricultural and Food Chemistry,59(14): 7985-7991.
Eshak, E.S., Iso, H., Date, C., Yamagishi, K., Kikuchi,S., Watanabe, Y., Wada, Y., Tamakoshi, A. andJACC Study Group. 2011. Rice intake isassociated with reduced risk of mortality fromcardiovascular disease in Japanese men but notwomen. Journal of Nutrition, 141: 595-602.
Eshak, E.S., Iso, H., Yamagishi, K., Kokubo, Y.,Saito, I., Yatsuya, H., Sawada, N., Inoue, M. &Tsugane, S. 2014. Rice consumption is notassociated with risk of cardiovascular diseasemorbidity or mortality in Japanese men andwomen: a large population-based, prospectivecohort study. American Journal of ClinicalNutrition, 100(1): 199-207.
FAOSTAT, Food and Agriculture Organization ofthe United Nations. 2011. Food Supply - CropsPrimary Equivalent. http://faostat3.fao.org/download/FB/CC/E. [Last accessed on 24February 2015].
PROSPECTS IN DEVELOPMENT OF QUALITY RICE FOR HUMAN NUTRITION: A REVIEW 25
Fasahat, P., Aminah, A., Kharidah, M., Karupaiah, T.& Wickneswari, R. 2012. Red pericarpadvanced breeding lines derived from Oryzarufipogon x Oryza sativa: physicochemicalproperties, total antioxidant activity, phenoliccompounds and vitamin E content. AdvanceJournal of Food Science and Technology, 4:155-165.
Fatema, K., Rahman, F., Sumi, N., Kobura, K. & Ali,L. 2010. Glycemic index of three commonvarieties of Bangladeshi rice in healthy subjects.African Journal of Food Science, 4(8): 531-535.
Feng, X.G. & Yoshida, K.T. 2004. Molecularapproaches for producing low-phytic-acid grainsin rice. Plant Biotechnology, 21(3): 183-189.
Fernando, B. 2013. Rice as a source of fiber. Journalof Rice Research. 1: e101.
Fitzgerald, M.A., McCouch, S.R. & Hall, R.D. 2009.Not just a grain of rice: the quest for quality.Trends in Plant Science, 14(3): 133-139.
Fitzgerald, M.A., Rahman, S., Resurreccion, A.P.,Concepcion, J., Daygon, V.D., Dipti, S.S., Kabir,K.A., Klingner, B., Morell, M.K. & Bird, A.R.2011. Identification of a major geneticdeterminant of glycaemic index in rice. Rice. 4:66-74.
Foster-Powell, K., Holt, S.H.A. & Brand-Miller, J.C.2002. International table of glycemic index andglycemic load values: 2002. American Journalof Clinical Nutrition, 76(1): 5-56.
Fuller, D.Q. 2011. Pathways to Asian civilizations:tracing the origins and spread of rice and ricecultures. Rice, 4: 78-92.
Fuller, D.Q., Qin, L., Zheng, Y.F., Zhao, Z.J., Chen,X.G., Hosoya, L.A. & Sun, G.P. 2009. Thedomestication process and domestication rate inrice: spikelet bases from the lower Yangtze.Science, 323: 1607-1610.
Gnagnarella, P., Gandini, S., La Vecchia, C. &Maisonneuve, P. 2008. Glycemic index,glycemic load, and cancer risk: a meta-analysis.American Journal of Clinical Nutrition, 87(6):1793-1801.
Goddard, M.S., Yong, G. & Marcus, R. 1984. Theeffect of amylose content on insulin andglucose responses to ingested rice. AmericanJournal of Clinical Nutrition, 39: 388-392.
Greenwood, D.C., Threapleton, D.E., Evans, C.E.,Cleghorn, C.L., Nykjaer, C., Woodhead, C. &Burley, V.J. 2014. Association between sugar-sweetened and artificially sweetened soft drinksand type 2 diabetes: systematic review anddose-response meta-analysis of prospectivestudies. British Journal of Nutrition, 112(5):725-734.
Gross, B.L. & Zhao, Z.J. 2014. Archaeologicaland genetic insights into the origins ofdomesticated rice. Proceedings of the NationalAcademy of Sciences of the United States ofAmerica, 111(17): 6190-6197.
Guo, H., Ling, W., Wang, Q., Liu, C., Hu, Y., Xia,M., Feng, X. & Xia, X. 2007. Effect ofanthocyanin-rich extract from black rice (Oryzasativa L. indica) on hyperlipidemia and insulinresistance in fructose-fed rats. Plant Foods forHuman Nutrition, 62(1): 1-6.
Hanhineva, K., Torronen, R., Bondia-Pons, I.,Pekkinen, J., Kolehmainen, M., Mykkanen, H.& Poutanen, K. 2010. Impact of dietarypolyphenols on carbohydrate metabolism.International Journal of Molecular Sciences,11: 1365-1402.
Henry, C.J.K., Lightowler, H.J., Strik, C.M., Renton,H. & Hails, S. 2005. Glycaemic index andglycaemic load values of commerciallyavailable products in the UK. British Journalof Nutrition, 94: 922-930.
Hensperger, B. & Kaufmann, J. 2012. The ultimaterice cooker cookbook. 2nd Ed. The HarvardCommon Press: Massachusetts, United States ofAmerica.
Hodge, A.M., English, D.R., O’Dea, K. & Giles, G.G.2004. Glycemic index and dietary fiber and therisk of type 2 diabetes. Diabetes Care, 27: 2701-2706.
Hoebler, C., Devaux, M.F., Karinthi, A., Belleville,C. & Barry, J.L. 2000. Particle size of solid foodafter human mastication and in vitro simulationof oral breakdown. International Journal ofFood Sciences and Nutrition, 51: 353-366.
Hsu, T.F., Kise, M., Wang, M.F., Ito, Y., Yang, M.D.,Aoto, H., Yoshihara, R., Yokoyama, J., Kunii, D.& Yamamoto, S. 2008. Effects of pre-germinatedbrown rice on blood glucose and lipid levels infree-living patients with impaired fastingglucose or type 2 diabetes. Journal ofNutritional Science and Vitaminology, 54: 163-168.
Hu, E.A., Pan, A., Malik, V. & Sun, Q. 2012. Whiterice consumption and risk of type 2 diabetes:meta-analysis and systematic review. BMJ, 344:doi: http://dx.doi.org/10.1136/bmj.e1454
Hung, P.V., Vien, N.L. & Phi, N.T.L. 2015. Resistantstarch improvement of rice starches under acombination of acid and heat-moisturetreatments. Food Chemistry, [in press].
Imam, M.U., Ismail, M., Omar, A.R. & Ithnin, H.2013. The hypocholesterolemic effect ofgerminated brown rice involves theupregulation of the Apolipoprotein A1 and low-density lipoprotein receptor genes. Journal ofDiabetes Research, Article ID 134694.
26 PROSPECTS IN DEVELOPMENT OF QUALITY RICE FOR HUMAN NUTRITION: A REVIEW
Institute of Medicine, Food and Nutrition Board.2001. Dietary reference intakes: vitamin A,vitamin K, arsenic, boron, chromium, copper,iodine, iron, manganese, molybdenum, nickel,silicon, vanadium, and zinc. Washington DC:National Academy Press.
Itoh, K., Kawamura, S. & Ikeuchi, Y. 1985.Processing and milling of parboiled rice.Journal of the Faculty of Agriculture, HokkaidoUniversity, 62: 312-324.
Jang, Y.S., Lee, J.H., Kim, O.H., Park, H.Y. & Lee,S.Y. 2001. Consumption of whole grain andlegume powder reduces insulin demand, lipidperoxidation, and plasma homocysteineconcentrations in patients with coronary arterydisease: randomized controlled clinical trial.Arteriosclerosis, Thrombosis, and VascularBiology, 21: 2065-2071.
Jenab, M. & Thompson, L.U. 2002. Role of phyticacid in cancer and other diseases. In. FoodPhytates. Eds. Reddy, N.R. & Sathe, S.K.Florida, USA: CRC Press.
Jenkins, D.J., Jenkins, A.L., Wolever, T.M., Rao,A.V. & Thompson, L.U. 1986. Fiber and starchyfoods: gut function and implications in disease.American Journal of Gastroenterology, 81(10):920-930.
Jenkins, A.L., Jenkins, D.J., Zdravkovic, U., Wursch,P. & Vuksan, V. 2002. Depression of theglycemic index by high levels of beta-glucanfiber in two functional foods tested in type 2diabetes. European Journal of ClinicalNutrition, 56: 622-628.
Jenkins, D.J.A., Wolever, T.M.S., Taylor, R.H.,Barker, H., Fielden, H., Baldwin, J.M., Bowling,A.C., Newman, H.C., Jenkins, A.L. & Goff, D.V.1981. Glycemic index of foods: a physiologicalbasis for carbohydrate exchange. AmericanJournal of Clinical Nutrition, 34(3): 362-366.
Jiang, X.B., Zhang, D.F. & Jiang, W.J. 2014. Coffeeand caffeine intake and incidence of type 2diabetes mellitus: a meta-analysis of prospectivestudies. European Journal of Nutrition, 53(1):25-38.
Joung, H., Nam, G., Yoon, S., Lee, J., Shim, J.E. &Paik, H.Y. 2004. Bioavailable zinc intake ofKorean adults in relation to the phytate contentof Korean foods. Journal of Food Compositionand Analysis, 17: 713-724.
Juliano, B.O. 1985. Criteria and tests for rice grainqualities. In: Juliano, B.O. Eds. Rice chemistryand Technology. 2nd Ed. American Associationof Cereal Chemists: St. Paul, MN.
Juliano, B.O. 1993. Rice in Human Nutrition. Foodand Agriculture Organization of the UnitedNation. United States.
Juliano, B.O. 2003. Rice. In Cabalerro, B. Ed.Encyclopedia of Food Science and Nutrition.London: Academic Press.
Jung, E.H., Kim, S.R., Hwang, I.K. & Ha, T.Y. 2007.Hypoglycemic effects of a phenolic acidfraction of rice bran and ferulic acid in C57BL/KsJ-db/db mice. Journal of Agriculture andFood Chemistry, 55: 9800-9804.
Karupaiah, T., Aik, C.K., Heen, T.C., Subramaniam,S., Bhuiyan, A.R., Fasahat, P., Zain, A.M. &Wickneswari, R. 2011. A transgressive brownrice mediates favourable glycaemic and insulinresponses. Journal of the Science of Food andAgriculture, 91: 1951-1956.
Kataoka, M., Venn, B.J., Williams, S.M., TeMorenga, L.A., Heemels, I.M. & Mann, J.I. 2013.Glycaemic responses to glucose and rice inpeople of Chinese and European ethnicity.Diabetic Medicine, 30: 101-107.
Kazemzadeh, M., Safayi, S.M., Nematollahi, S. &Nourieh, Z. 2014. Effect of brown riceconsumption on inflammatory marker andcardiovascular risk factors among overweightand obese non-menopausal female adults.International Journal of Preventive Medicine,5(4): 478-488.
Kearney, J. 2010. Food consumption trends anddrives. Philosophical Transactions of the RoyalSociety B, 365: 2793-2807.
Khan, H., Kunutsor, S., Franco, O.H. & Chowdhury,R. 2013. Vitamin D, type 2 diabetes and othermetabolic outcomes: a systematic review andmeta-analysis of prospective studies.Proceedings of the Nutrition Society, 72: 89-97.
Khosravi-Boroujeni, H., Sarrafzadegan, N.,Mohammadifard, N., Sajjadi, F., Maghroun, M.,Asgari, S., Rafieian-kopaei, M. & Azadbakht, L.2013. White rice consumption and CVD riskfactors among Iranian population. Journal ofHealth, Population and Nutrition. 31(2): 252-261.
Khush, G.S. 2005. What it will take to feed 5.0billion rice consumers in 2030. Plant MolecularBiology, 59: 1-6.
Kim, J.C., Mullan, B.P., Hampson, D.J. & Pluske, J.R.2006. Effects of amylose content, autoclaving,parboiling, extrusion, and post-cookingtreatments on resistant starch content of differentrice cultivars. Australian Journal ofAgricultural Research, 57: 1291-1296.
Kim, J.Y., Kim, J.H., Lee, D.H., Kim, S.H. & Lee, S.S.2008. Meal replacement with mixed rice is moreeffective than white rice in weight control, whileimproving antioxidant enzyme activity in obesewomen. Nutrition Research, 28: 66-71.
PROSPECTS IN DEVELOPMENT OF QUALITY RICE FOR HUMAN NUTRITION: A REVIEW 27
Kubo, M. & Purevdorj, M. 2004. The future of riceproduction and consumption. Journal of FoodDistribution Research, 35(1): 128-142.
Kuppusamy, A., Muthusamy, U., Thirumalaisamy,S.A., Varadharajan, S., Ramasamy, K. &Ramanathan, S. 2011. In vitro (α-glucosidaseand α-amylase inhibition) and in vivoantidiabetic property of phytic acid (IP6) instreptozotocin-nicotinamide-induced type 2diabetes mellitus (NIDDM) rats. Journal ofComplementary and Integrative Medicine, doi:10.2202/1553-3840.1483.
Lai, M.H., Chen, Y.T., Chen, Y.Y., Chang, J.H. &Cheng, H.H. 2011. Effects of rice bran oil on theblood lipids profiles and insulin resistance intype 2 diabetes patients. Journal of ClinicalBiochemistry and Nutrition, 51(1): 15-18.
Lee, K.W., Song, K.E., Lee, H.S., Kim, Y.K., Lee,S.W., Kim, D.J., Hwang, W.S., Choe, S.J., Kim,Y.S. & Kim, T.Y. 2006. The effects of Gaomi No.2 rice, a natural fiber-rich rice, on body weightand lipid metabolism. Obesity, 14(3): 423-430.
Lee, S.W., Lee, J.H., Han, S.H., Lee, J.W. & Rhee, C.2005. Effect of various processing methods onthe physical properties of cooked rice and onin vitro starch hydrolysis and blood glucoseresponse in rats. Starch, 57: 531-539.
Li, M., Fan, Y.L., Zhang, X.W., Hou, W.S. & Tang,Z.Y. 2014a. Fruit and vegetable intake and riskof type 2 diabetes mellitus: meta-analysis ofprospective cohort studies. BMJ Open, 4:e005497.
Li, M., Piao, J.H., Tian, Y., Li, W.D., Li, K.J. &Yang, X.G. 2010. Postprandial glycaemic andinsulinaemic responses to GM-resistant starch-enriched rice and the production offermentation-related H2 in healthy Chineseadults. British Journal of Nutrition, 103: 1029-1034.
Li, Y.Y., Tao, H.J., Zhao, X.Q., Xu, J., Li, G.M., Hu,S.K., Dong, G.J., Shi, Z.Y., Wu, L.W., Hu, J.,Ye, G.Y. & Guo, L.B. 2014b. Molecularimprovement of grain weight and yield in riceby using GW6 gene. Rice Science, 21(3): 127-132.
Liang W., Lee, A.H. & Binns, C.W. 2010. White rice-based food consumption and ischemic strokerisk: a case-control study in southern China.Journal of Stroke and CerebrovascularDiseases, 19(6): 480-484.
Lichtenstein, A.H., Ausman, L.M., Carrasco, W.,Gualtieri, L.J., Jenner, J.L., Ordovas, J.M.,Nicolosi, R.J., Goldin, B.R. & Schaefer, E.J.1994. Rice bran oil consumption and plasmalipid levels in moderately hypercholesterolemichumans. Arteriosclerosis, Thrombosis, andVascular Biology, 14: 549-556.
Lievense, A., Bierma-Zeinstra, S.M.A., Verhagen,A.P., Verhaar, J.A.N. & Koes, B.W. 2001.Influence of work on the development ofosteoarthritis of the hip: a systematic review.Journal of Rheumatology, 28: 2520-2528.
Liljeberg, H. & Bjorck, I. 1998. Delayed gastricemptying rate may explain improved glycaemiain healthy subjects to a starchy meal with addedvinegar. European Journal of ClinicalNutrition, 52(5): 368-371.
Liu, L., Lee, G., Jiang, L. & Zhang, J. 2007. Evidencefor the early beginning (c. 9000 cal. BP) of ricedomestication in China: a response. Holocene,17: 1059-1068.
Livesey, G., Taylor, R., Livesey, H. & Liu, S.M.2013. Is there a dose-response relation of dietaryglycemic load to risk of type 2 diabetes? Meta-analysis of prospective cohort studies. AmericanJournal of Clinical Nutrition, 97: 584-596.
Ma, G., Jin, Y., Piao, J., Kok, F., Guusje, B. &Jacobsen, E. 2005. Phytate, calcium, iron, andzinc contents and their molar ratios in foodscommonly consumed in China. Journal ofAgriculture and Food Chemistry, 53(26):10285-10290.
Malaysian Dietary Guidelines. 2010. KualaLumpur: National Coordinating Committee onFood and Nutrition, Ministry of HealthMalaysia.
Matriz, M.J., Molina, I., Valera, H.G., Mohanty, S.& Jamora, N. 2010. Global rice demand: Is ricereally becoming an inferior good. 28th
International Rice Research Conference. Hanoi,Vietnam.
Meigs, J.B., Wilson, P.W.F., Fox, C.S., Vasan, R.S.Nathan, D.M., Sullivan, L.M. & D’Agostino,R.B. 2006. Body mass index, metabolicsyndrome, and risk of type 2 diabetes orcardiovascular disease. The Journal of ClinicalEndocrinology & Metabolism, 91(8): 2906-2912.
Misra, A., Singhal, N., Sivakumar, B., Bhagat, N.,Jaiswal, A. & Khurana, L. 2011. Nutritiontransition in India: secular trends in dietaryintake and their relationship to diet-related non-communicable diseases. Journal of Diabetes,3(4): 278-292.
Mohan, V., Spiegelman, D., Sudha, V., Gayathri, R.,Hong, B., Praseena, K., Anjana, R.M., Wedick,N.M., Arumugam, K., Malik, V., Ramachandran,S., Bai, M.R., Henry, J.K., Hu, F.B., Willet, W.& Krishnaswamy, K. 2014. Effect of brown rice,white rice and brown rice with legumes on bloodglucose and insulin responses in overweightAsian Indians: a randomized controlled trial.Diabetes Technology and Therapeutics, 16(5):317-325.
28 PROSPECTS IN DEVELOPMENT OF QUALITY RICE FOR HUMAN NUTRITION: A REVIEW
Most, M.M., Tulley, R., Morales, S. & Lefevre, M.2005. Rice bran oil, not fiber, lowers cholesterolin humans. American Journal of ClinicalNutrition, 81: 64-68.
Murakami, K., Sasaki, S., Takahashi, Y., Okubo, H.,Hosoi, Y., Horiguchi, H., Oguma, E. & Kayama,F. 2006. Dietary glycemic index and load inrelation to metabolic risk factors in Japanesefemale farmers with traditional dietary habits.American Journal of Clinical Nutrition, 83(5):1161-1169.
Muraki, I., Wu, H., Imamura, F., Laden, F., Rimm,E.B., Hu, F.B., Willett, W.C. & Sun, Q. 2015.Rice consumption and risk of cardiovasculardisease: results from a pooled analysis of 3 U.S.cohorts. American Journal of ClinicalNutrition, 101(1): 164-172.
Muthayya, S., Sugimoto, J.D., Montgomery, S. &Maberly, G.F. 2014. An overview of global riceproduction, supply, trade, and consumption.Annals of the New York Academy of Sciences,1324: 7-14.
Nanri, A., Mizoue, T., Noda, M., Takahashi, Y., Kato,M., Inoue, M., Tsugane, S. For the Japan PublicHealth Center-based Prospective Study Group.2010. Rice intake and type 2 diabetes inJapanese men and women: the Japan PublicHealth Center-based Prospective Study.American Journal of Clinical Nutrition, 92:1468-1477.
National Coordinating Committee on Food andNutrition (NCCFN). 2005. RecommendedNutrient Intakes for Malaysia. NationalCoordinating Committee on Food and Nutrition,Ministry of Health Malaysia, Putrajaya.
Noor, M.I. 2002. The nutrition and health transitionin Malaysia. Public Health Nutrition, 5(1A):191-195.
Norhaizan, M.E. & Nor Faizadatul Ain, A.W. 2009.Determination of phytate, iron, zinc, calciumcontents and their molar ratios in commonlyconsumed raw and prepared food in Malaysia.Malaysian Journal of Nutrition, 15(2): 213-222.
Norimah, A.K., Safiah, M., Jamal, K., Siti Haslinda,Zuhaida, H., Rohida, S., Fatimah, S., SitiNorazlin, Poh, B.K., Kandiah, M., Zalilah, M.S.,Wan Manan, W.M., Fatimah, S. & Azmi, M.Y.2008. Food consumption patterns: findings fromthe Malaysian Adult Nutrition Survey (MANS).Malaysia Journal of Nutrition, 14(1): 25-39.
O’Neil, C.E., Nicklas, T.A., Zanovec, M. & Cho, S.2010. Whole-grain consumption is associatedwith diet quality and nutrient intake in adults:the National Health and Nutrition ExaminationSurvey, 1999-2004. Journal of the AmericanDietetic Association, 110: 1461-1468.
Oba, S., Nagata, C., Nakamura, K., Fujii, K., Kawachi,T., Takatsuka, N. & Shimizu, H. 2010. Dietaryglycemic index, glycemic load, and intake ofcarbohydrate and rice in relation to risk ofmortality from stroke and its subtypes inJapanese men and women. Metabolism, Clinicaland Experimental, 59: 1574-1582.
Omoruyi, F.O., Budiaman, A., Eng, Y., Olumese, F.E.,Hoesel, J.L., Ejilemele, A. & Okorodudu, A.O.2013. The potential benefits and adverse effectsof phytic acid supplement in streptozotocin-induced diabetic rats. Advances in Pharma-cological Sciences, Article ID: 172494doi:10.1155/2013/172494
Pandey, K.B. & Rizvi, S.I. 2009. Plant polyphenolsas dietary antioxidants in human health anddisease. Oxidative Medicine and CellularLongevity, 2(5): 270-278.
Panlasigui, L.N. & Thompson, L.U. 2006. Bloodglucose lowering effects of brown rice in normaland diabetic subjects. International Journal ofFood Sciences and Nutrition, 57(3/4): 151-158.
Panlasigui, L.N., Thompson, L.U., Juliano, B.O.,Perez, C.M., Yiu, S.H. & Greenberg, G.R. 1991.Rice varieties with similar amylose contentdiffer in starch digestibility and glycemicresponse in humans. American Journal ofClinical Nutrition, 54: 871-877.
Parker, E.D., Liu, S., Van Horn, L., Tinker, L.F.,Shikany, J.M., Eaton, C.B. & Margolis, K.L.2013. The association of whole grainconsumption with incident type 2 diabetes: theWomen’s Health Initiative Observational Study.Annals of Epidemiology, 23(6): 321-327.
Pathiraje, P.M.H.D., Madhujith, W.M.T.,Chandrasekara, A. & Nissanka, S.P. 2010. Theeffect of rice variety and parboiling on in vivoglycemic response. Tropical AgriculturalResearch, 22(1): 26-33.
Patil, S.B. & Khan, M.K. 2011. Germinated brownrice as a value added rice product: a review.Journal of Food Science and Technology,48(6): 661-667.
Pereira, L.J., Gaviao, M.B., Engelen, L. & Van derBilt, A. 2007. Mastication and swallowing:influence of fluid addition to foods. Journal ofApplied Oral Science, 15(1): 55-60.
Perry, T., Mann, J., Mehalski, K., Gayya, C., Wilson,J. & Thompson, C. 2000. Glycaemic index ofNew Zealand foods. New Zealand MedicalJournal. 113: 140-142.
Pingali, P. 2006. Westernization of Asian diets andthe transformation of food systems: implicationsfor research and policy. Food Policy, 32: 281-298.
PROSPECTS IN DEVELOPMENT OF QUALITY RICE FOR HUMAN NUTRITION: A REVIEW 29
Pi-Sunyer, F.X. 2002. Glycemic index and disease.American Journal of Clinical Nutrition, 76(1):290S-298S.
Radhika, G., Sathya, R.M., Ganesan, A., Saroja, R.,Vijayalakshmi, P., Sudha, V. & Mohan, V. 2010.Dietary profile of urban adult population inSouth India in the context of chronic diseaseepidemiology (CURES-68). Public HealthNutrition, 14(4): 591-598.
Ramesh, M., Bhattacharya, K.R. & Mitchell, J.R.2000. Developments in understanding the basisof cooked-rice texture. Critical Reviews in FoodScience and Nutrition, 40(6): 449-60.
Ranawana, D.V., Henry, C.J.K., Lightowler, H.J. &Wang, D. 2009. Glycaemic index of somecommercially available rice and rice productsin Great Britian. International Journal of FoodSciences and Nutrition, 60(S4): 99-110.
Ranawana, V., Leow, M.K.S. & Henry, C.J.K. 2014.Mastication effects on the glycaemic index:impact on variability and practical implications.European Journal of Clinical Nutrition, 68:137-139.
Ranawana, V., Monro, J.A., Mishra, S. & Henry,C.J.K. 2010. Degree of particle size breakdownduring mastication may be a possible cause ofinterindividual glycemic variability. NutritionResearch, 30: 246-254.
Rashmi, S. & Urooj, A. 2003. Effect of processingon nutritionally important starch fractions inrice varieties. International Journal of FoodSciences and Nutrition, 54: 27-36.
Read, N.W., Welch, I.M., Austen, C.J., Barnish, C.E.,Baxter, A.J., Brown, G., Compton, M.E., Hume,K.E. & Storie, I. 1986. Swallowing food withoutchewing; a simple way to reduce postprandialglycaemia. British Journal of Nutrition, 55(1):43-47.
Reed, M.O., Ai, Y.F., Leutcher, J.L. & Jane, J.L.2013. Effects of cooking methods and starchstructures on starch hydrolysis rates of rice.Journal of Food Science, 78(7): H1076-H1081.
Roohinejad, S., Omidizadeh, A., Mirhosseini, H.,Saari, N., Mustafa, S., Hussin, A.S.M., Hamid, A.& Abd Manap, M.Y. 2011. Effect of pre-germination time on amino acid profile andgamma amino butyric acid (GABA) contents indifferent varieties of Malaysian brown rice.International Journal of Food Properties,14(6): 1386-1399.
Roohinejad, S., Omidizadeh, A., Mirhosseini, H.,Saari, N., Mustafa, S., Yusof, R.M., Hussin,A.S.M., Hamid, A. & Abd Manap, M.Y. 2010.Effect of pre-germination time of brown riceon serum cholesterol levels of hyper-cholesterolaemic rats. Journal of Science of theFood and Agriculture, 90: 245-251.
Roy, P., Orikasa, T., Okadome, H., Nakamura, N. &Shiina, T. 2011. Processing conditions, riceproperties, health and environment.International Journal of EnvironmentalResearch and Public Health, 8: 1957-1976.
Sagum, R. & Arcot, J. 2000. Effect of domesticprocessing methods on the starch, non-starchpolysaccharides and in vitro starch and proteindigestibility of three varieties of rice withvarying levels of amylase. Food Chemistry, 70:107-111.
Sar, S. & Marks, G.C. 2015. Estimated effects ofwhite rice consumption and rice varietyselection on incidence of type 2 diabetes inCambodia. Public Health Nutrition, [in press].
Sasaki, T. & Kohyama, K. 2011. Effect of non-starchpolysaccharides on the in vitro digestibility andrheological properties of rice starch gel. FoodChemistry, 127: 541-546.
Shi, Z., Taylor, A.W., Hu, G., Gill, T. & Wittert, G.A.2012. Rice intake, weight change and risk ofthe metabolic syndrome development amongChinese adults: the Jiangsu Nutrition Study(JIN). Asia Pacific Journal of ClinicalNutrition, 21(1): 35-43.
Shin, S.I., Lee, C.J., Kim, M.J., Choi, S.J., Choi, H.J.,Kim, Y. & Moon, T.W. 2009. Structuralcharacteristics of low-glycemic response ricestarch produced by citric acid treatment.Carbohydrate Polymers, 78: 588-595.
Shobana, S., Kokila, A., Lakshmipriya, N.,Subhashini, S., Ramya Bai, M., Mohan, V.,Malleshi, N.G., Anjana, R.M., Henry, C.J.K. &Sudha, V. 2012. Glycaemic index of threeIndian rice varieties. International Journal ofFood Sciences and Nutrition, 63(2): 178-183.
Smit, H.J., Kemsley, E.K., Tapp, H.S. & Henry, C.J.K.2011. Does prolonged chewing reduce foodintake? Fletcherism revisited. Appetite, 57(1):295-298.
Sompong, R., Siebenhandl-Ehn, S., Linsberger-Martin, G. & Berghofer, E. 2011. Physico-chemical and antioxidative properties of red andblack rice varieties from Thailand, China andSri Lanka. Food Chemistry, 124: 132-140.
Srinivasa, D., Raman, A., Meena, P., Chitale, G.,Marwaha, A. & Jainani, K.J. 2013. Glycaemicindex (GI) of an Indian branded thermallytreated basmati rice variety: a multi centricstudy. Journal of the Association of Physiciansof India, 61: 716-720.
Sugiyama, M., Tang, A.C., Wakaki, Y. & Koyama,W. 2003. Glycemic index of single and mixedmeal foods among common Japanese foods withwhite rice as a reference food. European Journalof Clinical Nutrition, 57: 743-752.
30 PROSPECTS IN DEVELOPMENT OF QUALITY RICE FOR HUMAN NUTRITION: A REVIEW
Sun, L., Ranawana, D.V., Tan, W.J.K., Quek, Y.C.R.,& Henry, C.J. 2015. The impact of eatingmethods on eating rate and glycemic responsein healthy adults. Physiology & Behavior, 139:505-510.
Sun, Q., Spigelman, D., van Dam, R.B., Holmes,M.D., Malik, V.S., Willett, W.C. & Hu, F.B.2010. White rice, brown rice, and risk of type 2diabetes in US men and women. Archives ofInternal Medicine, 170(11): 961-969.
Suwannaporn, P., Linnemann, A. & Chaveesuk, R.2008. Consumer preference mapping for riceproduct concepts. British Food Journal, 110(6):595-606.
Suzuki, H., Fukushima, M., Okamoto, S., Takahashi,O., Shimbo, T. & Kurose, T. 2005. Effects ofthorough mastication on postprandial plasmaglucose concentrations in nonobese Japanesesubjects. Metabolism, 54(12): 1593-1599.
Tan, Y.F. & Corke, H. 2002. Factor analysis ofphysicochemical properties of 63 rice varieties.Journal of the Science of Food and Agriculture,82(7): 745-752.
Tester, R.F. & Morrison, W.R. 1990. Swelling andgelatinization of cereal starches. I. Effects ofamylopectin, amylose and lipids. CerealChemistry, 67: 551-557.
Trinidad, T.P., Mallillin, A.C. Encabo, R.R., Sagum,R.S., Felix, A.D. & Juliano, B.O. 2013. The effectof apparent amylose content and dietary fibreon the glycemic response of different varietiesof cooked milled and brown rice. InternationalJournal of Food Sciences and Nutrition, 64(1):89-93.
Truong, T.H., Yuet, W.C. & Hall, M.D. 2014.Glycemic index of American-grown jasmine riceclassified as high. International Journal of FoodSciences and Nutrition, 65(4): 436-439.
Villegas, R., Liu, S., Gao, Y.T., Yang, G., Li, H.,Zheng, W. & Shu, X.O. 2007. Prospective studyof dietary carbohydrates, glycemic index,glycemic load, and incidence of type 2 diabetesmellitus in middle-aged Chinese women.Archives of Internal Medicine, 167(21): 2310-2316.
Willett, W.C. & Stampfer, M.J. 2013. Currentevidence on healthy eating. Annual Reviews onPublic Health, 34: 77-95.
Wilson, P.W.F., D’Agostino, R.B.D., Parise, H.,Sullivan, L. & Meigs, J.B. 2005. Metabolicsyndrome as a precursor of cardiovasculardisease and type 2 diabetes mellitus.Circulation, 112: 3066-3072.
Wilson, T.A., Nicolosi, R.J., Woolfrey, B. &Kritchevsky, D. 2007. Rice bran oil andoryzanol reduce plasma lipid and lipoproteincholesterol concentrations and aortoic
cholesterol ester accumulation to a greaterextent than ferulic acid in hypercholesterolemichamsters. The Journal of NutritionalBiochemistry, 18(2): 105-112.
Wirt, A. & Collins, C.E. 2009. Diet quality – whatis it and does it matter? Public Health Nutrition,12(12): 2473-2492.
Wolever, T.M. 2013. Is glycaemic index (GI) a validmeasure of carbohydrate quality? EuropeanJournal of Clinical Nutrition, 67(5): 522-531.
World Bank. 2011. GDP (current USD) in Asiancountries. http://databank.worldbank.org/data/views/reports/tableview.aspx?isshared=true#.[Last accessed on 25 February 2015]
World Health Organization. 1966. The healthaspects of food and nutrition. Manila,Philippines: Western Pacific Regional Office.
Yang, J., Mao, Q.X., Xu, H.X., Ma, X. & Zeng, C.Y.2014. Tea consumption and risk of type 2diabetes mellitus: a systematic review and meta-analysis update. BMJ Open, 4: e005632.
Yang, Y.X., Wang, H.W., Cui, H.M., Wang, Y., Yu,L.D., Xiang, S.X. & Zhou, S.Y. 2006. Glycemicindex of cereals and tubers produced in China.World Journal of Gastroenterology, 12(21):3430-3433.
Yao, B.D., Fang, H., Xu, W.H., Yan, Y.J., Xu, H.L.,Liu, Y.N., Mo, M., Zhang, H. & Zhao, Y.P. 2014.Dietary fiber intake and risk of type 2 diabetes:a dose-response analysis of prospective studies.European Journal of Epidemiology, 29(2): 79-88.
Yao, Y., Sang, W., Zhou, M. & Ren, G. 2010.Antioxidant and alpha-glucosidase inhibitoryactivity of colored grains in China. Journal ofAgriculture & Food Chemistry, 58(2): 770-774.
Ye, E.Q., Chacko, S.A., Chou, E.L., Kugizaki, M. &Liu, S. 2012. Greater whole-grain intake isassociated with lower risk of type 2 diabetes,cardiovascular disease, and weight gain.Journal of Nutrition, 142(7): 1304-1313.
Yoon, J.H., Thompson, L.U. & Jenkins, D.J.A. 1983.The effect of phytic acid on in vitro rate ofstarch digestibility and blood glucose response.American Journal of Clinical Nutrition, 38:835-842.
Yu, R., Woo, J., Chan, R., Sham, A., Ho, S., Tso, A.,Cheung, B., Lam, T.H. & Lam, K. 2011.Relationship between dietary intake and thedevelopment of type 2 diabetes in a Chinesepopulation: the Hong Kong dietary survey.Public Health Nutrition, 14(7): 1133-1141.
Zarrati, M., Pirali, M., Mirmiran, P., Noori, N.,Nakhoda, K., Najafi, H. & Hoseini, H. 2008.Glycemic index of various brands of rice inhealthy individuals. International Journal ofEndocrinology and Metabolism, 4: 200-204.
PROSPECTS IN DEVELOPMENT OF QUALITY RICE FOR HUMAN NUTRITION: A REVIEW 31
Zhai, F.Y., Wang, H.J., Du, S.F., He, Y.N., Wang,Z.H., Ge, K.Y. & Popkin, B.M. 2009.Prospective study on nutrition transition inChina. Nutrition Reviews, 67(Suppl. 1): S56-S61.
Zhang, G., Pan, A., Zong, G., Yu, Z., Wu, H., Chen,X., Tang, L., Feng, Y., Zhou, H., Chen, X., Li,H., Hong, B., Malik, V.S., Willett, W.C.,Spigelman, D., Hu, F.B. & Lin, X. 2011.Substituting white rice with brown rice for 16weeks did not substantially affect metabolic riskfactors in middle-aged Chinese men and womenwith diabetes or a high risk for diabetes. Journalof Nutrition, 141(9): 1685-1690.
Zhang, Z., Kane, J., Liu, A.Y. & Venn, B.J. 2015.Benefits of a ricemix on glycaemic control inAsian people with type 2 diabetes: Arandomised trial. Nutrition & Dietetics, [inpress].
Zheng, J.S., Huang, T., Yang, J., Fu, Y.Q. & Li, D.2012. Marine n-3 polyunsaturated fatty acidsare inversely associated with risk of type 2diabetes in Asians: a systematic review andmeta-analysis. PLoS ONE, 7(9): e44525.
Zhou, D., Yu, H., He, F., Reilly, K.H., Zhang, J., Li,S., Zhang, T., Wang, B., Ding, Y. & Xi, B. 2014.Nut consumption in relation to cardiovasculardisease risk and type 2 diabetes: a systematicreview and meta-analysis of prospective studies.American Journal of Clinical Nutrition, 100(1):270-277.
Zhou, J.R. & Erdman Jr., J.W. 1995. Phytic acid inhealth and disease. Critical Reviews in FoodScience and Nutrition, 35(6): 495-508.
Zuniga, Y.L.M., Rebello, S.A., Oi, P.L., Zheng, H.,Lee, J., Tai, E.S. & van Dam, R.M. 2014. Riceand noodle consumption is associated withinsulin resistance and hyperglycaemia in anAsian population. British Journal of Nutrition,111: 1118-1128.