Embed Size (px)
Citation preview
Prostate Cancer Histopathology Using Label-freeMultispectral Deep-UV Microscopy Quanti�esPhenotypes of Tumor Aggressiveness and EnablesMultiple Diagnostic Virtual StainsSoheil Soltani
Georgia Institute of Technology and Emory UniversityAshkan Ojaghi
Georgia Institute of Technology and Emory UniversityHui Qiao
Tsinghua UniversityNischita Kaza
Georgia Institute of TechnologyXinyang Li
Tsinghua UniversityQionghai Dai
Tsinghua UniversityAdeboye O Osunkoya
Emory School of MedicineFrancisco E Robles ( [email protected] )
Georgia Institute of Technology and Emory University
Research Article
Keywords: Multispectral Deep UV Microscopy, Prostate Cancer Prostate Imaging, Cancer Grading,Prostate Cancer Phenotyping, Prostate Cancer histopathology, Prostate Cancer Molecular Imaging
Posted Date: November 10th, 2021
DOI: https://doi.org/10.21203/rs.3.rs-1022155/v1
License: This work is licensed under a Creative Commons Attribution 4.0 International License. Read Full License

Prostate cancer histopathology using label-free multispectral deep-UV
microscopy quantifies phenotypes of tumor aggressiveness and enables
multiple diagnostic virtual stains
Authors
Soheil Soltani1, Ashkan Ojaghi1, Hui Qiao2, Nischita Kaza3, Xinyang Li2, Qionghai Dai2, Adeboye O Osunkoya4, 5, Francisco E Robles1,3,5*
Affiliations
1Wallace H. Coulter Dept. of Biomedical Engineering, Georgia Institute of Technology and Emory University, Atlanta, GA 30332, USA
2Department of Automation, Tsinghua University, Beijing 100084, China
3School of Electrical and Computer Engineering, Georgia Institute of Technology, Atlanta, Georgia 30313, USA
4Departments of Pathology and Urology, Emory University School of Medicine, Atlanta, GA 30322
5Winship Cancer Institute of Emory University, Atlanta, GA 30322
*Corresponding author Email: [email protected]
Abstract
Identifying prostate cancer patients that are harboring aggressive forms of prostate cancer remains a
significant clinical challenge. Here we develop an approach based on multispectral deep-ultraviolet
(UV) microscopy that provides novel quantitative insight into the aggressiveness and grade of this
disease, thus providing a new tool to help address this important challenge. We find that UV spectral
signatures from endogenous molecules give rise to a phenotypical continuum that provides unique
structural insight (i.e., molecular maps or “optical stains") of thin tissue sections with subcellular
(nanoscale) resolution. We show that this phenotypical continuum can also be applied as a surrogate
biomarker of prostate cancer malignancy, where patients with the most aggressive tumors show a
ubiquitous glandular phenotypical shift. In addition to providing several novel “optical stains” with
contrast for disease, we also adapt a two-part Cycle-consistent Generative Adversarial Network to
translate the label-free deep-UV images into virtual hematoxylin and eosin (H&E) stained images,
thus providing multiple stains (including the gold-standard H&E) from the same unlabeled specimen.
Agreement between the virtual H&E images and the H&E-stained tissue sections is evaluated by a
panel of pathologists who find that the two modalities are in excellent agreement. This work has
significant implications towards improving our ability to objectively quantify prostate cancer grade

and aggressiveness, thus improving the management and clinical outcomes of prostate cancer patients.
This same approach can also be applied broadly in other tumor types to achieve low-cost, stain-free,
quantitative histopathological analysis.
Keywords
Multispectral Deep UV Microscopy, Prostate Cancer Prostate Imaging, Cancer Grading, Prostate
Cancer Phenotyping, Prostate Cancer histopathology, Prostate Cancer Molecular Imaging,
Introduction
Prostate cancer (PCa) is the most commonly diagnosed (non-cutaneous) cancer among men in the
United States [1]. According to the National Institute of Health SEER report, over 3.25 million men
in the US are currently living with this disease, and ~1 in 6 men will be diagnosed with it over their
lifetime [2]. Other estimates, however, suggest that the prevalence of PCa may actually be much
higher. Studies using autopsy analyses indicate that over half of all men above the age of 50 harbor
some form of PCa, increasing the estimate of the number of men living with this disease to over 20
million in the US [3]. This staggering prevalence makes it clear that, in a significant number of cases,
PCa follows an indolent course; nevertheless, PCa is still the second leading cause of cancer death in
men, with over 33,000 deaths in the US in 2020 [4]. Thus, while early and accurate PCa detection is
critical, so too is the ability to objectively assess the tumors’ aggressiveness. Unfortunately, this
remains a significant clinical challenge which has profound implications. On the one hand, there are a
vast number of PCa patients harboring indolent tumors who are either (i) under a ‘watchful waiting’
category (i.e., wait and see if the cancer progresses) and have to live with the uncertainty of potentially
having an unsampled aggressive tumor, or (ii) deemed high risk but are ultimately over-diagnosed and
over-treated. On the other hand, there are many PCa patients harboring aggressive tumors who are at
risk of being under-diagnosed and under-treated—for these patients an incorrect diagnosis may be
fatal.
In the current standard of care, once a diagnosis of PCa has been established, one of the most important
factors in assessing tumor aggressiveness is the Gleason score (this also largely dictates treatment
course) [5-7]. Here a histopathologist visually inspects hematoxylin and eosin (H&E) stained thin
tissue sections and determines the two most common glandular/architectural patterns, which are
assigned a grade from 3 to 5 (grades of 1 and 2 are not diagnosed on needle core biopsies, and are non-
cancerous). While accepted as the gold standard, the Gleason score (the sum of the two grades) is
qualitative and subject to intra- and inter-observer variability. Some studies have reported inter-
observer agreement (kappa values) ranging from ~40% to 70%, with a significant portion of the

discordant values dictating different treatment paths [8-10]. H&E staining can also be highly variable
and laboratory dependent, which undoubtedly contributes to observer variability, but also makes it
challenging to extract quantitative parameters. Thus, there is a significant need for novel technologies
that can provide pathologists and clinicians with additional quantitative information regarding the
aggressiveness of PCa, and thus prognosis for individual patients.
Advanced methods using genetic profiling, for example, provide a wealth of information but have
shown limited success in predicting the prognosis of cancer patients [11, 12]. The poor predictive
power may be attributed to the vast genetic heterogeneity of tumors, which makes it extremely difficult
to identify a unique set of mutations that provide reliable prognostic information. Alternatively, recent
efforts have shifted towards exploring phenotypical “common-denominators” to the countless genetic
and epigenetic alterations that lead to cancer [13-29]. Phenotypical changes, including changes in
metabolites, nuclear morphology, and nano-architecture, are more consistent across patients than the
myriad of individual mutations and disrupted pathways underlying the disease, and can potentially
better characterize tumors. This approach has shown very promising results for early cancer detection
[13-26], and—to a more limited extent—assessing cancer aggressiveness [27-29].
In this work we introduce multispectral deep-UV microscopy as a novel tool for phenotyping PCa
tissue sections, resulting in multiple virtual diagnostic stains and a unique quantitative biomarker that
is predictive of disease aggressiveness. Multispectral deep-UV microscopy offers rich endogenous,
label-free, molecular information of important tissue biomolecules with subcellular spatial resolution
using a fast, low-cost imaging configuration [30-35]. To define this novel biomarker (or phenotypical
continuum), we couple deep-UV microscopy with an unsupervised analysis of the molecular
signatures [28]. Importantly, we find that patients with the most aggressive forms of prostate cancer
express a ubiquitous glandular phenotypical shift, even in glands that appear to be less aggressive. We
further introduce multiple virtual “optical stains” (or “biochemical stains”) of tissue slides that
highlight important components for disease diagnosis such as nuclei, cytoplasm, stroma, basal layer,
nerves, and inflammation. The unique insight provided by the method is not available with current
histological methods. In addition, we leverage recent advances in deep learning to translate our multi-
spectral deep UV images into virtual H&E-stained images which show a high degree of correlation
with the gold-standard H&E histopathological images of prostate tissue. These capabilities are
important because they show that multiple types of “stains” can be rendered from a single unstained
section, including novel diagnostics maps and the gold standard H&E. This is potentially time and
resource-wise efficient as it would obviate the need for chemical reagents, time consuming processes,

multiple scans, or trained personnel. Plus, the unstained tissue sections remain available for any
additional profiling (e.g., immunostaining, RNA labeling, etc.) or archiving without alterations.
Results from this work have significant implications towards improving diagnosis and management
of prostate cancer. Further, this same approach may be widely applicable to improve histopathological
analysis in many other tissue types and diseases.
Results
Deep-UV microscopy of prostate tissue sections
Details of the multispectral deep-UV microscope are provided in the methods and materials section.
Images were acquired from unlabeled fixed radical prostatectomy tissue samples, which were sliced
(~5µm thick) and mounted on quartz microscope slides. Images were acquired from histologically
important regions containing structures with benign tissue, inflammation, stroma, high grade prostatic
intraepithelial neoplasia (HGPIN), and glands with various grades of prostate cancer (Gleason grades
3, 4, and 5). Eighty-seven regions of interest were acquired from 15 patients. Each region was ~1mm
X 1.5mm, acquired with a spatial resolution of ~300nm. Multispectral images were taken at four key
wavelengths, including 220nm, 255nm, and 280nm (see Fig 1b), which correspond to strong
absorption peaks of proteins and nucleic acids [35]. We also included 300nm which does not
correspond to an absorption peak of any endogenous biomolecule but serves as an indicator of tissue
scattering, which has been applied as a surrogate biomarker of tissue nano-architecture [24, 26, 35-
42].
The multispectral data were processed using a geometrical representation of principal component
analysis (PCA), an unsupervised method [28]. In this process, approximately 130 million spectra from
select representative regions were used to calculate the principal components (PCs). Figure 1a shows
the resulting orthogonal PCs. It is important to note that these vectors, while purely mathematical in
nature, in fact resemble the absorption and scattering spectral behavior of biological tissues [35]. For
example, the first principal component, PC1, shows a unipolar, monotonically decreasing behavior
that is consistent with the expected response of tissue scattering. PC2 and PC4 show peak responses
that correspond to protein absorption, while PC3 shows an inverted peak that is in agreement with the
absorption from nucleic acid [35]. Nevertheless, projections of the spectra onto these PCs do not
uniquely correspond to these molecules, and do not prominently highlight important tissue structures
alone, as seen in Fig 1c.
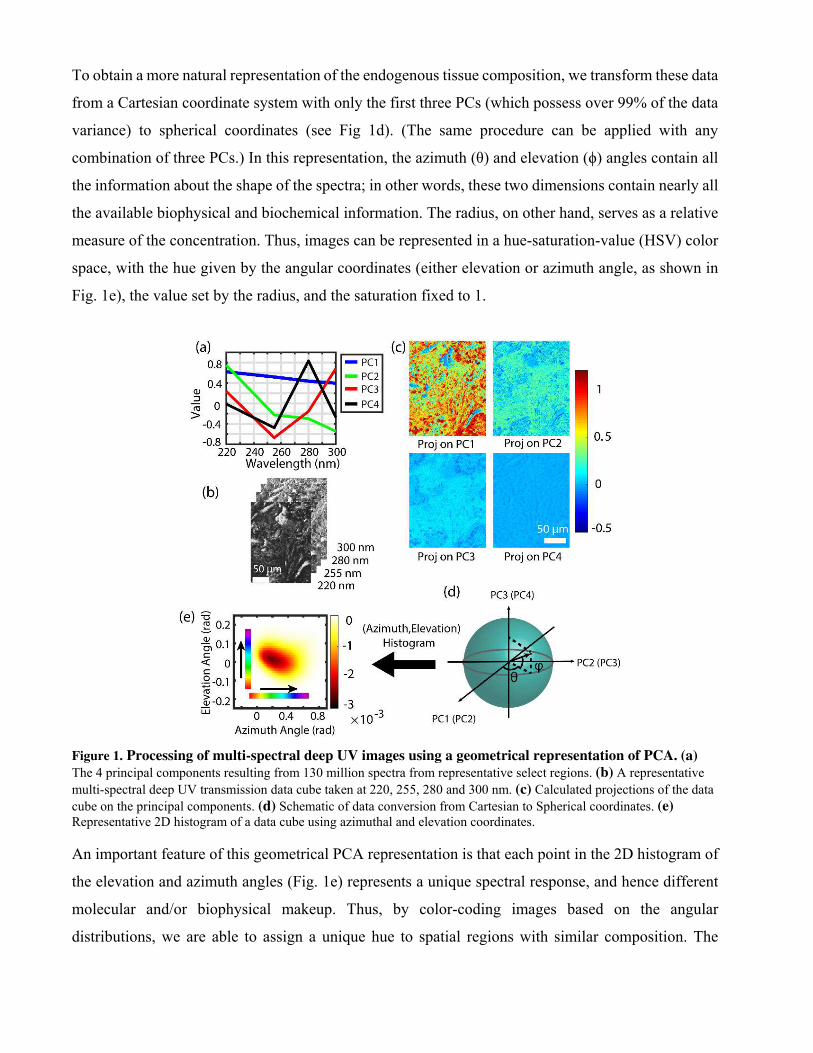
To obtain a more natural representation of the endogenous tissue composition, we transform these data
from a Cartesian coordinate system with only the first three PCs (which possess over 99% of the data
variance) to spherical coordinates (see Fig 1d). (The same procedure can be applied with any
combination of three PCs.) In this representation, the azimuth (θ) and elevation (ϕ) angles contain all
the information about the shape of the spectra; in other words, these two dimensions contain nearly all
the available biophysical and biochemical information. The radius, on other hand, serves as a relative
measure of the concentration. Thus, images can be represented in a hue-saturation-value (HSV) color
space, with the hue given by the angular coordinates (either elevation or azimuth angle, as shown in
Fig. 1e), the value set by the radius, and the saturation fixed to 1.
Figure 1. Processing of multi-spectral deep UV images using a geometrical representation of PCA. (a)
The 4 principal components resulting from 130 million spectra from representative select regions. (b) A representative
multi-spectral deep UV transmission data cube taken at 220, 255, 280 and 300 nm. (c) Calculated projections of the data
cube on the principal components. (d) Schematic of data conversion from Cartesian to Spherical coordinates. (e) Representative 2D histogram of a data cube using azimuthal and elevation coordinates.
An important feature of this geometrical PCA representation is that each point in the 2D histogram of
the elevation and azimuth angles (Fig. 1e) represents a unique spectral response, and hence different
molecular and/or biophysical makeup. Thus, by color-coding images based on the angular
distributions, we are able to assign a unique hue to spatial regions with similar composition. The

resulting “optical stains” enhance contrast among various structures in prostate tissue sections which
can be leveraged, along with H&E, for diagnostic applications.
Figure 2. A representative demonstration of two “optical stains”. Colorization scheme using (a) principal components 1,2 and 3 in Elevation direction and (b) principal components 2,3 and 4 in Azimuth direction. Scale bar: 150 μm. Comparison of the two color-coding schemes for (c) a nerve, (d) a region with inflammation (e) an entrapped benign prostate gland surrounded by Gleason Grade 3 and 4 cancer glands. (f) Prostate cancer glands with Gleason Grade 3 next to a Gleason Grade 4 glomeruloid gland. All rectangles are 210µm x260µm
Figure 2 shows two types of “optical stains” that highlight important tissue structures. In the first (Fig.
2a), the elevation angle is used to encode hue which yields the most prominent contrast for cell nuclei,
depicted in green. This is consistent with the general behavior of the PCs, as the elevation angle in this
case corresponds to a ratio of the 3rd PC (which resembles the inverted absorption peak from nucleic
acids) relative to both the 1st and 2nd PCs (which correlate with scattering and protein spectral
signatures, respectively). Thus, nuclei are mapped to regions with negative elevation angles. Further,
in this representation, the stroma shows a dark purple color (and has a positive elevation angle). In the
second colorization scheme (Fig. 2b), we encode hue based on the azimuthal angle derived from a 3D
space from the 2nd, 3rd and 4th principal components. Here the hue encodes differences between
proteins and nucleic acid, without contributions from scattering (1st PC). The resulting images (Fig
2b) exhibit some degree of nuclear contrast (depicted in red), but most prominently show the stroma
in bright yellow. Figures 2c-f highlight selected regions from a nerve surrounded by prostate cancer
glands (Fig. 2c), a highly inflamed region (Fig. 2d), an entrapped benign prostate gland next to cancer
glands (Fig. 2e), and prostate cancer glands (Fig. 2f).
Figure 3 shows additional examples that emphasize the ability of these label-free optical stains to
provide unique contrast among different structures, including benign tissues (Fig. 3a), HGPIN (Fig.
3b), Gleason grades3-5 (Fig. 3c,3d,3e), necrosis (Fig. 3f), inflammation (Fig. 3g), and even red blood
cells (Fig. 3h). Images from H&E-stained tissues (from adjacent sections) are also shown for
comparison. While not in perfect one-to-one agreement, in general, the overall tissue structure
observed with H&E is preserved in the label-free UV images, including clear contrast between nuclei
and stroma. An important distinction, however, is that the information derived from UV microscopy
is quantitative. Further, with the UV images, subtle differences in hue can be observed in the various
structures, including glands with different Gleason grades, inflammation, necrosis, and HGPIN.

Figure 3. Comparison of the two “optical stains” with corresponding H&E-stained tissue scans from various
prostate tissue structures. (a) Benign gland. (b) High grade Prostatic intraepithelial neoplasia (PIN) region. (c) Cancer region with Gleason Grade 3 glands. (d) Cancer region with Cribriform Gleason Grade 4 region. (e) Region with

Gleason Grade 5. (f) Region with necrosis inside a Gleason Grade 5 cancer gland. Necrosis is clearly distinguishable from the cancer cells on the left side of the image. (g) Inflammation. (h) Red blood cells.
Prostate cancer diagnosis and grading using deep-UV microscopy
Using a 3D space defined by the first three PCs, we defined a third “optical stain” by encoding hue
using the azimuth angle (Fig. 4). These maps highlight contributions from light scattering (from PC1)
relative to both proteins and nucleic acid (PC2 and PC3, respectively). We note that scattering
variations arise from genetic and epigenetic perturbations that results in micro and/or nano-scale
alterations in intracellular milieu, such as the cytoskeleton, ribosomes, chromatin, mitochondria, and
collagen fibrils that are known to be altered in field carcinogenesis [36-41]. Furthermore, protein and
nucleic acid alterations have also been well documented throughout the progression of prostate cancer
[43-51].
The resulting image representation (i.e., optical stain) does not exhibit contrast to structures
conventionally used in histopathology (e.g., nuclei, cytoplasm, stroma, etc.); instead, we find that this
representation encodes for a glandular phenotype that correlated with malignancy. Figure 4 shows two
examples from patients with intermediate-grade cancer. Here benign glands possess a blue hue, while
glands with cancer (Gleason grades 3 or 4) exhibit a relative shift captured in green to red hues which
represents an increase in nucleic acid and protein content, potentially from cell overgrowth byproducts
[43-46, 49, 52-54]. In these maps, the glands were segmented for clarity (performed manually for
simplicity here, though this process can be automated [55, 56]). Again, the change in color represents
alterations in the scattering properties relative to protein and nucleic acid content, all of which have
been implicated in early-stage alterations of cancer, as well as metastatic disease [36, 37, 39, 41, 48] .
Thus, the azimuth angle from a geometrical representation of the first three PCs effectively yields a
phenotypical continuum that can be applied as a surrogate biomarker of prostate cancer malignancy.
It is worth highlighting important features in Fig. 4. Figures 4a-b show a set of pseudo-neoplastic
benign glands (blue arrows) that are not well formed, meaning they express slight cytological and
morphological variations such as cytoplasm clearing that classifies them as a mimicker of prostatic
adenocarcinoma (typically of Gleason grade 3). However, the existence of basal cells around the
glands as well as the papillary infoldings of the gland differentiates them from carcinoma. And indeed,
the malignancy optical stain clearly indicates that these glands are benign and distinct from Gleason
grade 3 and 4 glands (green and red arrows, respectively). Figures 4c-d show benign central zone
histology glands (blue arrows) surrounded by Gleason Grade 3 cancer glands (green arrows). Central
zone histology glands are potential mimickers of HGPIN and Gleason Grade 4 cancer glands
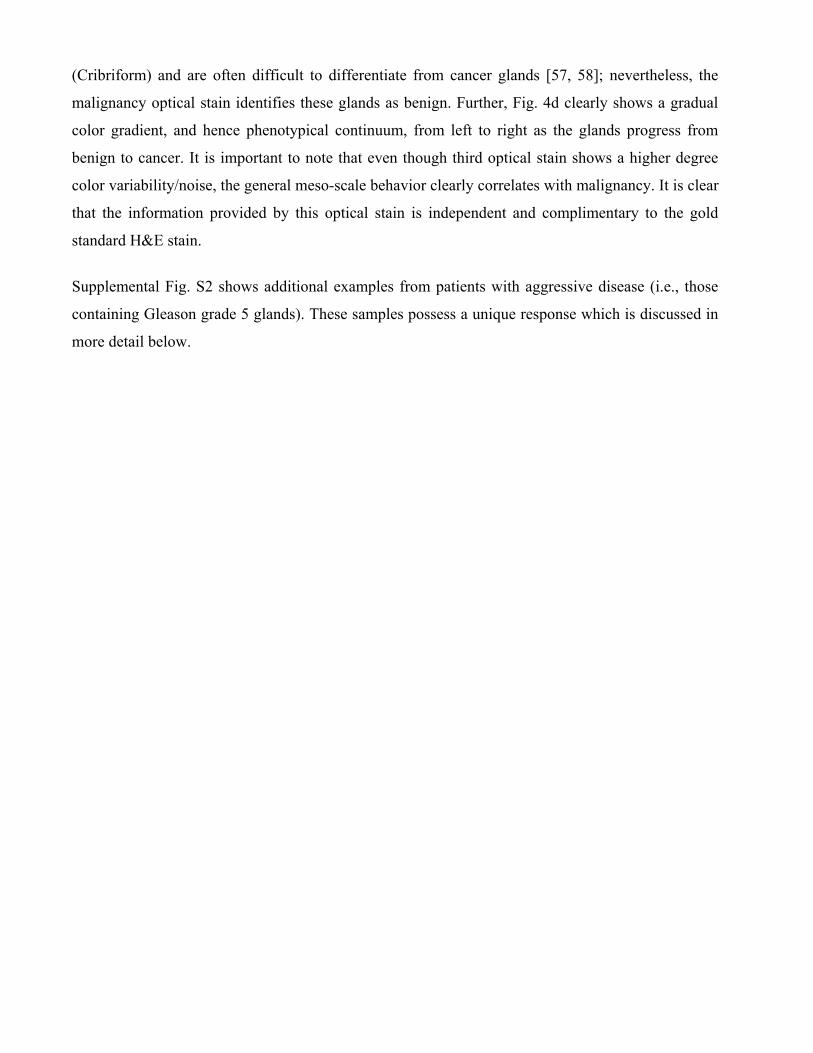
(Cribriform) and are often difficult to differentiate from cancer glands [57, 58]; nevertheless, the
malignancy optical stain identifies these glands as benign. Further, Fig. 4d clearly shows a gradual
color gradient, and hence phenotypical continuum, from left to right as the glands progress from
benign to cancer. It is important to note that even though third optical stain shows a higher degree
color variability/noise, the general meso-scale behavior clearly correlates with malignancy. It is clear
that the information provided by this optical stain is independent and complimentary to the gold
standard H&E stain.
Supplemental Fig. S2 shows additional examples from patients with aggressive disease (i.e., those
containing Gleason grade 5 glands). These samples possess a unique response which is discussed in
more detail below.

Figure 4. Comparison of malignancy maps from different prostate regions with corresponding H&E scans. Insets show the 2D histograms for comparison. As clearly evident from Fig. 4 the malignancy optical stain shows diagnostic capabilities complimentary to H&E, where only morphological parameters are considered. In Fig. 4 (b) and (d) we have manually removed stroma and inflammation regions to aid visibility. The cell-size red regions on the edges of the glands are originating from two sources: 1-ill-formed fused type Gleason Grade 4 regions have spread around benign glands and in fact it is an indicative of existence of cancer. These regions are sometimes missed by pathologists in H&E analysis 2- Existence of inflammation cells that were impossible to remove with manual segmentation. These inflammation cells are

limited in number and do not contain any diagnostically important information and they are mostly in stromal region. (Scale bar: 200 μm)
Figure 5. Absolute and relative CoM azimuthal angles serves as a personalized malignancy biomarker and reveal
unique glandular phenotypes. (a) Comparison of absolute maximum peak azimuthal coordinates of integrated histograms of benign regions for 15 patients. (b) Cumulative boxplots for calculated relative azimuthal shift for different prostate cancer grades in 15 patients. (c) Barplots for calculated relative azimuthal shift for different prostate cancer grades in 15 patients with the benign region used as reference for each patient. In Figs. 5(b) and (c) it is clear that the more aggressive phenotypes have an opposite shift even for lower grades of cancer. In Fig. 5 (b) the red dotted line is the threshold of the shift for the more aggressive cancer regions on the opposite direction.
To investigate the properties of this phenotypical shift further, we analyze the cumulative behavior of
benign glands and cancerous glands with the same Gleason grade for each patient. In this process,
cumulative 2D histograms were generated for each type of gland (benign and Gleason grades 3-5) for
each patient, then data were integrated across elevation angle, and finally the center of mass (CoM) of
the resulting azimuth angle distributions were computed. This value effectively quantifies the hues in
the malignancy optical stain shown in Fig. 4. Figure 5 shows the results, with Fig. 5a showing the
absolute azimuthal CoM for all the benign glands for each patient. This value is then taken as a basis
for all other (cancerous) gland types for each patient, thus providing a personalized reference point for
a malignancy biomarker.

Figures 5b-c show the relative shifts in the CoM of cancerous glands relative to the benign glands of
each patient (absolute shifts are shown in Fig. S3). Self-calibration with respect to benign gland of
each patient is necessary to reduce significant inter-patient variability which can be very large and, if
unaccounted, can potentially obscure signals of interest. A remarkable result of this personalized
biomarker is that patients with the most aggressive form of prostate cancer (i.e., those containing
Gleason grade 5 glands) exhibit a ubiquitous glandular phenotypical shift in the opposite direction as
patients with less aggressive forms of prostate cancer. That is, for patients with aggressive cancer,
both Gleason grade 5 regions and lower Gleason grade regions (3 and 4) show a negative azimuth
CoM shift, which is the opposite behavior compared to patients with less aggressive tumors. This
unique and ubiquitous shift—only present in aggressive prostate cancer—may be attributed to higher
contributions from scattering which is indicative of changes in tissue organization at the nanoscale
level. Similar behavior has been reported in other studies of the scattering properties of cancerous
tissues [36-41] and is likely related to the field effect of carcinogenesis.
UTOM for label-free H&E colorization with UV microscopy
The novel optical stains presented above provide unique insight into tissue structures based on
endogenous molecular composition, nanoscale structures, and PCa aggressiveness; nevertheless,
H&E-contrast is imperative for PCa diagnosis and grading. While additional tissue can be stained with
H&E, it is also possible to translate the UV images into virtual H&E images to enable visualization of
the same exact specimens, down to the subcellular level, in different diagnostic formats/stains. This
label-free pipeline also avoids cumbersome, time-consuming, and complex procedures, avoids stain
artifacts and variations that are common with H&E, and finally, the original unstained tissue can be
preserved for further processing or archiving.
To translate the label-free UV images into virtual H&E images, we apply a recently developed
unsupervised content-preserving transformation for optical microscopy (UTOM) deep neural network
[59]. UTOM adapts the general framework of cycle-consistent generative adversarial networks
(Cycle-GAN) which can transform images from one domain into another without requiring pixel-level
paired data. In UTOM, a forward and backward GAN are trained simultaneously to learn a pair of
opposite mappings between the UV and H&E image domains, as shown in Fig 6a. In this process, a
cycle-consistency loss constrain, and a pair of saliency constraints are imposed to correct for mapping
direction, which avoids distortions (Fig. 6a) [59]. In the training process, the overall network
converges when the discriminators cannot differentiate between images produced by their generators
(i.e., when the two GANs reach equilibrium; see Fig. 6b). Once trained, new images can be fed into

the network and transformed into the desired domain (Fig 6c). This approach has been used for image
restoration (e.g., resolution enhancement, removing distortions), for virtual fluorescence labeling of
label-free phase images, and H&E virtual staining of autofluorescence images [60-62]. The training
set for this work comprised of 54 regions from 10 patients, while the test set (transformation group)
contained 21 regions from the remaining 5 distinct patients. More details on the training process and
final image translation are provided in methods and materials section.
Figure 6. Schematic of colorization process and the UTOM method. For the transformation from UV to HE, input channels N=4, and output channels M=3. Each coral rectangle represents a feature map extracted by corresponding convolutional kernels. The generator is a multi-layer residual network with downsampling input layers and upsampling output layers. The discriminator (PatchGAN classifier) uses multiple strided convolution for abstract representation. It generates a matrix, in which each element corresponds to a patch in the input image. The ultimate output is the average of the loss over all patches.
Figures 7a-d show two representative examples of UV translated (virtual H&E) prostate tissue images
from the test set, along with their corresponding adjacent H&E-stained sections. The figures clearly
show that the UV translated images are nearly identical to the H&E-stained tissues sections, with the
most marked differences arising from the fact that the images are from adjacent sections. Specifically,
the virtual H&E images preserve or improve several important features that play an important role in
PCa diagnosis: First, as shown in Figs. 7b,7f,7j and 7n the UV translated images successfully
recapitulate the appearance of basal cells and basal cell lamina around benign glands (The
corresponding glands on H&E image are shown in Figs. 7e,7i and 7m for comparison) which are of

utmost importance for PCa diagnosis. This feature is also observed in Fig. 7l where an entrapped
benign gland is clearly differentiated from surrounding cancer regions (Compared to the same gland
on H&E image in Fig. 7k). Second, PCa regions shown in Figs. 7g ,7h, 7o and 7p depict luminal
epithelial nuclei with more consistent (and arguably improved) contrast in the UV translated images
compared to their corresponding H&E-stained sections. These types of structures are especially
important in differentiating cancer glands from other mimickers of cancer where the structure of the
gland is slightly disrupted. Finally, the appearance of the clear or pale eosinophilic cytoplasm as well
as hyperchromatic nuclei are well preserved, which in some cases can be indicative of PCa Gleason
Grade 4.
Figure 7. Comparison of translated virtual H&E images and corresponding H&E stained scans. Examples of (b)-
(d) Two predicted output virtual images (a) and (c) along with their reference H&E images. (e)-(p) show three selected

zoomed regions for each area. These regions have been selected to compare features on both H&E and translated virtual H&E images.
Virtual H&E evaluation
To assess the quality of the UV translated, virtual H&E images compared to the gold standard H&E-
stained images, we conducted a panel study with 4 board-certified/board-eligible histopathologists.
Here the pathologists evaluated a total of 42 large area images (~1mmX1.5mm), half of the images
(21) were images of H&E-stained tissue sections and the other half (21) were virtual H&E from the
same regions (adjacent slices), all from the UTOM test set. Two pathologists (group 1) were assigned
a set of 21 images comprising a mixture of virtual and stained H&E images, and the other two
pathologists (group 2) were assigned the complimentary set, meaning images from the same regions
but switching virtual H&E images with the images of stained H&E sections, and vice versa (no
pathologist viewed the same region in virtual H&E and H&E-stained formats). While reviewing the
images, pathologists were asked a series of questions regarding the quality of the images, with
numerical scores ranging from 1 (poor) to 3 (excellent). They were also asked to provide a Gleason
score for each region.
Results of the panel study are summarized in Table 1. Data show that the UV translated virtual H&E
images and the H&E-stained tissue section images have very similar quality as assessed by the
pathologist panel. With the exception of the nucleolus quality, which was evaluated slightly lower in
the virtual H&E format, all other structures were assessed to have the same quality between the two
modalities, with no statistically significant differences. The gland quality, which is of particular
importance for PCa diagnosis, was deemed nearly identical between the two methods, as was the
cytoplasm quality. Most importantly, the pathologists’ diagnostic confidence was very similar for both
methods (and not statistically different). We attribute the small difference in nucleus quality to the
presence of lipid-laden macrophages (Xanthoma), mesonephric remnants, and hyperchromatic nuclei
in a few regions with inflammation, which have a slightly disrupted visible quality in the translated
images. However, (1) these are not diagnostically meaningful (which is likely why the diagnostic
confidence remained the same between the two groups, even though the nucleus quality was slightly
lower in the UV translated images), and (2) the nucleus quality can be improved with additional
training.

Table 1. Comparison of translated UV images with H&E scans
Parameter H&E Virtual H&E Statistical
significance
Nucleus Quality (scale of 3) 2.57 2.32 *
Cytoplasm Quality (scale of 3) 2.45 2.42 N.S.
Gland Quality (scale of 3) 2.60 2.57 N.S.
Diagnosis Confidence (scale of 3) 2.26 2.16 N.S.
Inter-group concordance for gro
1
81.82% 85% -
Inter-group concordance for gro
2
60% 50% -
N.S.: not statistically significant, * p-val <0.05
We also calculate the inter-group concordance for grade group decisions using the H&E and virtual
H&E images. The results (Table 1) show inter-observer variability at similar levels to what has been
reported in previous studies [63-66]. Importantly, however, the concordance in Gleason grade
decisions is very similar between the UV translated virtual H&E images and the H&E-stained tissue
section images within each group. These results strongly suggest that the format of the images (virtual
H&E and H&E stained) did not play a role in the concordance levels. It is also worth noting that the
agreement between the two most senior, board-certified pathologists was very high—they agreed in
17 out 21 regions even though they were viewing each region in different formats (one was in group
1 and the other in group 2). The 4 regions of discordance were between boarder line Gleason grades 3
and 4.
Finally, we calculate the accuracy of the Gleason scores provided by the pathologists for both the H&E
and virtual H&E images. For this task, we first select a “ground truth” given by the decision of one of
the two senior board-certified pathologists (whichever one of the two whose decision was based on
the stained H&E section for a particular region was selected). Results show that the accuracy of the
Gleason grades using H&E and virtual H&E images are similar (i.e., not statistically significant), with
72.5% accuracy for H&E and a slightly higher 77.45% accuracy for virtual H&E (p-value = 0.24).
Alternatively, only using the regions where both senior, board-certified pathologists agree (17 out 21)
and using their assessment as “ground truth”, we find an accuracy for Gleason grade of 73.6% for
H&E and 81.6% for the UV translated, virtual H&E images (again, differences not statistically
significant, p-value=0.42).
Discussion
In this study, we have introduced multi-spectral deep UV microscopy as a novel, fast and reliable
method to capture quantitative molecular and nano-scale information from unlabeled prostate tissue
sections. We have utilized the unique UV spectral signature combined with an unsupervised spectral
analysis to transform the multi-spectral data cubes into phenotypical maps or “optical stains” with
subcellular spatial resolution. The spectral analysis suggests that the main contributing factors to these
maps arise from scattering which serves as an indicator of tissue nano-architecture, and from proteins
and nucleic acids. However, we do not rule out contributions from other molecules [35]. Maps derived
primarily from spectral signatures that correlate with proteins and nucleic acids provide high contrast
among various critical tissue components, including nuclei, cytoplasm, basal layer, stroma, and
glandular tissue, which can enhance our ability to recognize anomalies in prostate tissues.
While the “optical stains” derived from proteins and nucleic acids correlate well with the overall
structures observed with the gold standard H&E stains, completely new structures are observed when
incorporating the scattering signatures in conjunction with proteins and nucleic acids. These maps are
likely indicative of micro and/or nano-scale alterations in the intracellular milieu, such as the
cytoskeleton, ribosomes, chromatin, mitochondria, and collagen fibrils [36-41]. Along with protein
and nucleic acid alterations [43-51], changes in these structures have been implicated in the field effect
of carcinogenesis. Indeed, here we observe that these structures map benign glands to different hues
compared to cancerous glands, effectively yielding a “malignancy map.” By quantifying these relative
phenotypical shifts, we also find that cancer patients with the most aggressive forms of prostate cancer
(those with Gleason grade 5 glands) possess a ubiquitous and unique phenotypical shift compared to
patients with less aggrieve cancers.
These results have significant implications. Because less aggressive cancer glands (e.g., Gleason grade
3) possess a different phenotypical shift in patient harboring an aggressive cancer (those with Gleason
grade 5 glands), this phenotype or biomarker may help identify patients with aggressive forms of
prostate cancer even if initial biopsies miss the more aggressive regions. These results could have
profound implications for the analysis of random prostate tissue biopsies which cannot cover the entire
organ and are hence susceptible to missing cancer regions. It is worth emphasizing that this is achieved
by defining a continuous quantitative marker, that evaluates the malignancy level of each gland with
respect to benign glands of the same patient, and avoids the use of Gleason grade (though we use
Gleason grade to establish a correlation to this accepted standard).

While this continuous biomarker does not show appreciable differences between Gleason grade glands
3 and 4, incorporating morphological features along with this biomarker may potentially improve our
ability in identifying/grading prostate cancer. For instance, quantitative information from the UV
spectra and derived optical maps can help differentiate anomalous benign glands that mimic cancer
and can be difficult to detect. Furthermore, all the images, supported by their histograms of the
molecular signatures, show that healthy tissue, disease regions and their underlying composition span
a continuum rather than a discrete distribution. This is in line with our understanding of disease
progression[67-70] and may help better characterize prostate cancer compared to discrete labels (as
with Gleason grades). This new information may also help assess a more ideal personalized treatment
course for patients.
These results, while from a small sample size, lead to more fundamental questions: Do patients need
to have this unique malignant phenotype to develop the aggressive form of PCa? If so, can it be
detected even before aggressive cancer develops? How early? Or is there a ubiquitous switch across
the gland that occurs once the disease progresses to this more aggressive form? The answer to these
questions requires further understanding of this malignant phenotype and will guide our future work
as a larger sample size is analyzed.
Finally, using a state-of-the-art deep learning algorithm, UTOM, we showed that the UV images can
be readily translated into virtual H&E images that accurately mimic the structures and colors present
in the gold standard bright-field microscopy images of H&E-stained prostate tissue sections. This
process is advantageous from a histopathology viewpoint because multiple diagnostic (virtual) stains
can be produces from the same exact regions. The process also avoids the need for laborious, time-
consuming, and costly chemical staining procedures, avoids staining viability, and preserved tissue
for other uses. A panel of board-certified/board-eligible pathologists assessed the quality and
diagnostic potential of the UV translated images to be equivalent to the gold-standard H&E-stained
tissue section images.
Indeed other optical technologies have shown very promising results to help improve histopathology,
using methods such as UV excited florescence/auto-florescence [60, 71, 72], infrared [13, 16, 18] and
Raman Scattering [73, 74]. However, there are important limitations associated with each approach.
For instance, infrared imaging technologies provide rich molecular information, but have complex and
expensive equipment, are relatively slow, and lack critical subcellular and cellular level resolution.
UV excited florescence methods have demonstrated rapid visualization of subcellular H&E level
histology in thin or thick tissues and have garnered a lot of attention [71, 75]. However, these methods

are (1) not quantitative, (2) often require exogenous agents, and (3) to our knowledge have not been
shown to provide novel diagnostic information. Similarly, auto-florescence based methods have been
encouraging to generate label-free H&E-like images but auto-florescence intensity differs from patient
to patient, the signal to noise ratio is low, and level of endogenous molecular contrast is limited, all of
which increases uncertainty and hence the number of misdiagnosed disease cases [60, 72, 76, 77].
Raman microscopy/spectroscopy methods provide rich molecular content and allow differentiation of
malignant tissue. However, Raman scattering is a weak process that requires long acquisition times
and signal can easily be obscured by fluorescence. Nonlinear coherent Raman imaging is much faster
but systems are complex and expensive.
The label-free multi-spectral deep UV microscopy approach proposed here shows unique capabilities
which overcomes many of the limitations of other methods described above or which can be
complimentary to help improve diagnosis and grading of prostate cancer. This approach is high-
resolution (~300nm), provides rich molecular and nanoscale quantitative information, and it is simple
and low-cost (~$20k; and the UV transparent quartz slides used here could also be replaced by cheap
UV transparent polymers). The approach is also widefield with exposures of ~100ms per field of view
(~170 μm × 230 μm) making it relatively fast. This approach could also be combined with other state-
of-the-art structure-based neural networks recently introduced to help automate diagnosis [66, 78].
In conclusion, we have introduced label-free multispectral deep-UV miscopy to help analyze prostate
cancer histopathology. We have demonstrated the unique capabilities of this method, which can help
improve diagnosis and management of prostate cancer. Finally, this same quantitative approach can
be applied broadly across histopathological analysis of many tissue types and diseases.
Materials and Methods
Deep-UV multispectral microscopy set up
The deep UV transmission images were obtained using a microscopy system that consists of a plasma-
driven broadband light source (Energetiq, EQ-99X) that provides a continuous spectrum from 200 nm
to 2 μm. The output light from the source is focused on the sample using an off-axis parabolic mirror
(Newport). A long-pass dichroic mirror is used to filter out the wavelengths of light above ~ 550 nm.
For each region of interest, a multispectral data cube is captured using bandpass filters (bandwidth =
10nm) centered at 220, 255, 280 and 300 nm. The filters are placed on a filter wheel to change the
imaging wavelength of the system. A 0.5 N.A. UV objective (Thorlabs LMU-40X-UVB) is used to
collect the transmitted light and a biconvex (f=150 mm) lens is used to relay light onto a UV camera

(PCO. Ultraviolet). A schematic of the setup is shown in Fig. S1. For each acquisition, the camera
integration time was ~100 ms. Each captured region of interest represents a field of view of about
~170 μm × 230 μm. The resolution of our system is ~300 nm. In this work, we studied regions that
were comprised of 64 tiles in the form of an 8 by 8 mosaic image. To enable reliable stitching, each
tile has ~15% overlap with its neighbors. The final resulting region is approximately ~1 mm × 1.5
mm.
Sample collection and preparation
Paraffin-embedded formalin-fixed blocks from radical prostatectomy specimens were obtained from
15 prostate cancer patients. All the patients had not received any neoadjuvant therapy prior to radical
prostatectomy. The Gleason scores (Grade groups) and tumor stages were assigned by Urologic
Pathologists in all cases. Next thin slices (~5 microns thick) of the tissue blocks were mounted on
quartz slides and were deparaffinized by incubating the slides in Xylene bath for 5 minutes. The
samples were then placed in 95% Ethanol for 3 minutes to remove Xylene and washed with dionized
water. One section was used for UV imaging and a second section was stained with H&E and imaged
with a bright field microscope.
All tissues are de-identified from archived tissue block for Emory University Hospital (n = 10) or a
commercial vendor (Biomax) (n = 5). The Institutional Review Board of Georgia Institute of
Technology reviewed and approved all protocols (H16343 protocol). Informed consent was obtained
from all patinets and/or their legal guardian(s). All methods were carried out in accordance with
relevant guidelines and regulations.
Data Processing
To study the molecular content of the imaged tissue slides, different wavelengths in each captured
multispectral data cube were registered in MATLAB (Mathworks) Environment. Next, in order to
have a single wide-field UV image we used an image stitching code (MIST)[79], developed by
National Institute of Standards to stitch the 64 tiles captured separately.
To calculate the principal components (PCs) of the multispectral prostate tissue images, we selected
90 regions that yielded approximately ~130 million spectra which represented all biologically
important structures in prostate tissue. Next, we performed PCA in MATLAB to calculate the 4
principal components of the selected regions.
To generate color-coded images, we calculated the projections of the multispectral UV data on PC 1,
2, 3, and 4, respectively. Next, we converted the resulting projection vectors (Proj 1, Proj 2, Proj 3)
and (Proj 2, Proj 3, Proj 4) from Cartesian coordinates to Spherical coordinates (Azimuth (θ), Elevation
(ϕ), Radius (R)), where Proj i represents the projection of UV data on PCi. Finally, to get the

geometrical representation of the PCA, we calculated a two-dimensional histogram of the azimuth (θ)
and elevation (ϕ) angles for each case. Lastly, colorized the images using a Hue-Saturation-Value
(HSV) color space, where the hues are assigned based on either azimuth or elevation angle, the value
is set by the radius and the saturation is set to 1.
Calculation of the azimuthal shifts
To calculate the azimuthal shifts that are correlated with prostate cancer grades, first we annotated all
the corresponding H&E images with appropriate Gleason grades. The annotations were reviewed and
approved by a board-certified Urologic pathologist. Next, for each patient, the multispectral UV data
were manually segmented according to the approved H&E annotations to extract all the pixel spectra
that have the same Gleason grade. Once all the grade specified spectra were collected, we calculated
cumulative 2D histograms using Principal components 1, 2, and 3 for each Gleason grade category as
described in the data processing section. Finally, we integrated each 2D histogram in elevation
direction to generate the azimuth dependent graph of molecular content, and recorded the Azimuth
coordinates center of mass. We repeated this procedure for all the captured regions from all the
patients.
Virtual H&E Colorization using UV microscopy images
To perform machine learning process, we used the label-free UV images of the unstained tissue
sections from 15 patients from all 4 wavelengths (220,255,280 and 300 nm). For each captured region
the corresponding H&E-stained image from adjacent slice were used as a reference. All the UV and
H&E images were scaled to the same pixel size (90 nm). Next, we used 54 regions from 10 patients
that contained representative biologically structures in prostate tissue, as the training data-set for our
model (~13.5 billion spectra). The remaining regions (21) from the other 5 patients were used as the
testing data set to evaluate the color transformation model. The important point about the testing data
set is that the regions come from completely independent patients and no regions from testing patients
are used in the training process. In the training dataset, the 4-channel UV data and H&E images (RGB
channels) were randomly cropped into 512×512 patches. The total numbers of UV and H&E patches
are 64336 and 81667, respectively (Fig. 6. (a)). During the test phase, the UV images were first
partitioned into small patches with 25% overlaps. After a model was trained, patches from the
previously unseen 5 patients were then fed into the model to generate the corresponding H&E patches.
To finally form a large area virtual H&E image (each ~1mmX1.5mm), we cut out the boundaries (half
of the overlap) of the generated patches and stitched the remaining parts together one by one.
Virtual H&E Color normalization
To remove undesirable color variations of the H&E-stained histological images, which result from
differences in staining protocols, slide scanners and other factors, we adopted the structure-preserving
color normalization (SPCN) method proposed by Vahadane et al [80]. For a given image, we first
estimated its stain density maps and color appearances via sparse non-negative matrix factorization.
Then, we combined the stain density maps with a stain color basis of an arbitrary target H&E image
so as to change only the color appearances while preserving the structure of the source image.
UTOM method
To produce virtual H&E colorized images, a forward GAN and a backward GAN are trained
simultaneously to learn a pair of opposite mappings between two image domains. Along with the
cycle-consistency loss, a saliency constraint is imposed to correct the mapping direction and avoid
distortions of the image content. For each domain, a discriminator is trained to judge whether an image
is generated by the generator or from the target domain (Fig. 6 (b)). When the loss converges, the two
GANs reach their equilibriums, which means that the discriminators cannot distinguish images
produced by their generators from the target images. An image could be mapped back to itself through
the sequential processing of the two generators, and more importantly for biomedical images, the
saliency map keeps high fidelity after each transformation (Fig. 6 (a)). The well-trained generator G
of the forward GAN is used for transformation task from UV images to H&E images (Fig. 6(c)).
The architectures of the generator and the discriminator are visualized in Fig. 6b. The first three layers
of the generator are downsampling layers implemented by strided convolution to extract low-level
abstract representations. Nine stacked residual blocks are followed to extract high-level features. The
number of residual blocks reflects the model capacity. More residual blocks are recommended for
more complex tasks. The last three upsampling layers are also implemented by strided convolution.
They are used to integrate extracted features and rescale the image to its original size. The
discriminator is a relatively shallow CNN. Each layer downsamples the feature maps but doubles the
channel number. The last convolution layer generates a single-channel feature map and classification
is performed on each element of this feature map (PatchGAN classifier). The final true or false label
is generated by averaging individual labels of all elements. Each convolution layer in both the
generator and the discriminator contains a nonlinear activation unit. Whether to use the sigmoid
function or rectified linear unit (ReLU) is marked with corresponding arrows in Fig. 6b.
The Adam optimizer was used to optimize network parameters [59]. The initial learning rate is 0.0002,
which decays linearly every 50 iterations with a rate of 0.99. The batch size was set to 1 and the images
were flipped randomly for data augmentation. We trained the network for about 5 epochs, with about
80000 iterations in each epoch. On a single NVIDIA GEFORCE RTX 2080 Ti GPU (11GB memory),

the whole training prcess took approximately 48h. After training, UTOM took 21ms to generate a
512x512 H&E patch and cost 3s to produce a whole-slide HE image.
We used a PC system with an Ubuntu 16.04 LTS operating system and a CPU Intel(R) Xeon(R) CPU
E5-2683 processing unit. Also a PyTorch 1.6 was used as the Deep Learning Framework and Python
3.7 for image processing.
Virtual H&E evaluation methodology
We prepared a web-based survey including 21 unidentified, mixed H&E and virtual H&E regions
(group 1, 10 H&E and 11 Virtual H&E and group 2, 11 H&E and 10 virtual H&E images of the same
regions) and asked 2 board-certified and 2 board-eligible pathologists to submit their evaluations of
the quality of parameters such as nucleus, cytoplasm and gland quality. Further, we asked them to
submit a Gleason Score for each region to compare the accuracy of diagnosis for both H&E and virtual
H&E images. Each question was based on the scale of 1 to 3 (1 for poor, 2 for moderate and 3 for very
good quality). The responses were downloaded and used for statistical analysis. This clinical panel
review protocol (no. H19389) was Institutional Review Board-exempt.
Acknowledgments
We thank Dr Fengming Chen, MD, PhD , Dr Patrick Mullane, MD and Dr Oluwaseun Ogunbona ,MD
from Emory Hospital for evaluating the H&E translated UV images. We thank Steven Marzec for
helping with the panel study web-page.
Author contributions
S.S contributed to the experimental design, performed experiments and data acquisition, performed
data processing and computational data analysis, histopathological analysis and evaluation and tissue
annotation, wrote the manuscript and prepared the figures. A.O contributed to the experimental design
and data acquisition. H.Q. developed the machine learning model and performed deep learning image
translations. N.K. contributed in data acquisition. X.L. contributed to machine learning modeling.
A.O.O. was the histopathology supervisor, approved prostate tissue annotations and contributed to
translated UV image evaluation. Q.D. supervised the machine learning processes. F.E.R was project
supervisor (Principal investigator), designed experiments, wrote the manuscript, and supervised all
steps. All the authors contributed to final approval of the manuscript. F.E.R and S.S performed
manuscript submission and review process.
Competing interests
The authors declare no potential conflicts of interest..
Data availability

Additional Colorized Images along with the corresponding H&E references are available at:
https://zenodo.org/record/5140334.
REFERENCES
1. M. B. Culp, I. Soerjomataram, J. A. Efstathiou, F. Bray, and A. Jemal, "Recent Global Patterns
in Prostate Cancer Incidence and Mortality Rates," European Urology 77, 38-52 (2020).
2. "Surveillance,Epidemiology, and End Results (SEER) Program,National Cancer Institute: Cancer
Stat Facts: Prostate Cancer," (2021).
3. W. A. Sakr, D. J. Grignon, J. D. Crissman, L. K. Heilbrun, B. J. Cassin, J. J. Pontes, and G. P.
Haas, "High grade prostatic intraepithelial neoplasia (HGPIN) and prostatic adenocarcinoma between
the ages of 20-69: an autopsy study of 249 cases," In Vivo 8, 439-443 (1994).
4. "American Cancer Society. Cancer facts and figures," (2020).
5. J. I. Epstein, M. J. Zelefsky, D. D. Sjoberg, J. B. Nelson, L. Egevad, C. Magi-Galluzzi, A. J.
Vickers, A. V. Parwani, V. E. Reuter, S. W. Fine, J. A. Eastham, P. Wiklund, M. Han, C. A. Reddy,
J. P. Ciezki, T. Nyberg, and E. A. Klein, "A Contemporary Prostate Cancer Grading System: A
Validated Alternative to the Gleason Score," European Urology 69, 428-435 (2016).
6. A. G. Zhou, D. C. Salles, I. V. Samarska, and J. I. Epstein, "How Are Gleason Scores Categorized
in the Current Literature: An Analysis and Comparison of Articles Published in 2016–2017," European
Urology 75, 25-31 (2019).
7. L. Cheng, R. Mazzucchelli, T. D. Jones, A. Lopez-Beltran, and R. Montironi, "Chapter 3 - The
Pathology of Prostate Cancer," in Early Diagnosis and Treatment of Cancer Series: Prostate Cancer,
L.-M. Su, ed. (W.B. Saunders, Philadelphia, 2010), pp. 45-83.
8. W. C. Allsbrook, K. A. Mangold, M. H. Johnson, R. B. Lane, C. G. Lane, and J. I. Epstein,
"Interobserver reproducibility of Gleason grading of prostatic carcinoma: General pathologist,"
Human Pathology 32, 81-88 (2001).
9. M. Goodman, K. C. Ward, A. O. Osunkoya, M. W. Datta, D. Luthringer, A. N. Young, K. Marks,
V. Cohen, J. C. Kennedy, M. J. Haber, and M. B. Amin, "Frequency and determinants of disagreement
and error in gleason scores: A population-based study of prostate cancer," The Prostate 72, 1389-1398
(2012).
10. M. T. Cicerone and C. H. Camp, "Histological coherent Raman imaging: a prognostic review,"
Analyst 143, 33-59 (2018).
11. S. Michiels, S. Koscielny, and C. Hill, "Prediction of cancer outcome with microarrays: a multiple
random validation strategy," The Lancet 365, 488-492 (2005).
12. B. A. Lidbury and M. S., "Gene Profiles in Drug Design," (1st ed.). CRC Press (2008).
13. R. Bhargava, D. C. Fernandez, S. M. Hewitt, and I. W. Levin, "High throughput assessment of
cells and tissues: Bayesian classification of spectral metrics from infrared vibrational spectroscopic
imaging data," Biochimica et Biophysica Acta (BBA) - Biomembranes 1758, 830-845 (2006).
14. M. J. German, A. Hammiche, N. Ragavan, M. J. Tobin, L. J. Cooper, S. S. Matanhelia, A. C.
Hindley, C. M. Nicholson, N. J. Fullwood, H. M. Pollock, and F. L. Martin, "Infrared Spectroscopy
with Multivariate Analysis Potentially Facilitates the Segregation of Different Types of Prostate Cell,"
Biophysical Journal 90, 3783-3795 (2006).
15. M. Schnell, S. Mittal, K. Falahkheirkhah, A. Mittal, K. Yeh, S. Kenkel, A. Kajdacsy-Balla, P. S.
Carney, and R. Bhargava, "All-digital histopathology by infrared-optical hybrid microscopy,"
Proceedings of the National Academy of Sciences 117, 3388 (2020).

16. M. J. Baker, E. Gazi, M. D. Brown, J. H. Shanks, P. Gardner, and N. W. Clarke, "FTIR-based
spectroscopic analysis in the identification of clinically aggressive prostate cancer," British Journal of
Cancer 99, 1859-1866 (2008).
17. S. Mittal, K. Yeh, L. S. Leslie, S. Kenkel, A. Kajdacsy-Balla, and R. Bhargava, "Simultaneous
cancer and tumor microenvironment subtyping using confocal infrared microscopy for all-digital
molecular histopathology," Proceedings of the National Academy of Sciences 115, E5651 (2018).
18. M. J. Baker, E. Gazi, M. D. Brown, J. H. Shanks, N. W. Clarke, and P. Gardner, "Investigating
FTIR based histopathology for the diagnosis of prostate cancer," Journal of Biophotonics 2, 104-113
(2009).
19. D. C. Fernandez, R. Bhargava, S. M. Hewitt, and I. W. Levin, "Infrared spectroscopic imaging
for histopathologic recognition," Nature Biotechnology 23, 469-474 (2005).
20. J. T. Kwak, S. M. Hewitt, A. A. Kajdacsy-Balla, S. Sinha, and R. Bhargava, "Automated prostate
tissue referencing for cancer detection and diagnosis," BMC Bioinformatics 17, 227 (2016).
21. H. K. Roy, C. B. Brendler, H. Subramanian, D. Zhang, C. Maneval, J. Chandler, L. Bowen, K. L.
Kaul, B. T. Helfand, C.-H. Wang, M. Quinn, J. Petkewicz, M. Paterakos, and V. Backman,
"Nanocytological Field Carcinogenesis Detection to Mitigate Overdiagnosis of Prostate Cancer: A
Proof of Concept Study," PLOS ONE 10, e0115999 (2015).
22. D. A. Gaul, R. Mezencev, T. Q. Long, C. M. Jones, B. B. Benigno, A. Gray, F. M. Fernández,
and J. F. McDonald, "Highly-accurate metabolomic detection of early-stage ovarian cancer,"
Scientific Reports 5, 16351 (2015).
23. F. E. Robles, Y. Zhu, J. Lee, S. Sharma, and A. Wax, "Detection of early colorectal cancer
development in the azoxymethane rat carcinogenesis model with Fourier domain low coherence
interferometry," Biomed. Opt. Express 1, 736-745 (2010).
24. V. Backman, M. B. Wallace, L. T. Perelman, J. T. Arendt, R. Gurjar, M. G. Müller, Q. Zhang, G.
Zonios, E. Kline, T. McGillican, S. Shapshay, T. Valdez, K. Badizadegan, J. M. Crawford, M.
Fitzmaurice, S. Kabani, H. S. Levin, M. Seiler, R. R. Dasari, I. Itzkan, J. Van Dam, and M. S. Feld,
"Detection of preinvasive cancer cells," Nature 406, 35-36 (2000).
25. N. G. Terry, Y. Zhu, M. T. Rinehart, W. J. Brown, S. C. Gebhart, S. Bright, E. Carretta, C. G.
Ziefle, M. Panjehpour, J. Galanko, R. D. Madanick, E. S. Dellon, D. Trembath, A. Bennett, J. R.
Goldblum, B. F. Overholt, J. T. Woosley, N. J. Shaheen, and A. Wax, "Detection of Dysplasia in
Barrett's Esophagus With In Vivo Depth-Resolved Nuclear Morphology Measurements,"
Gastroenterology 140, 42-50 (2011).
26. S. Uttam, H. V. Pham, J. LaFace, B. Leibowitz, J. Yu, R. E. Brand, D. J. Hartman, and Y. Liu,
"Early Prediction of Cancer Progression by Depth-Resolved Nanoscale Mapping of Nuclear
Architecture from Unstained Tissue Specimens," Cancer Research 75, 4718 (2015).
27. S. Sridharan, V. Macias, K. Tangella, A. Kajdacsy-Balla, and G. Popescu, "Prediction of Prostate
Cancer Recurrence Using Quantitative Phase Imaging," Scientific Reports 5, 9976 (2015).
28. F. E. Robles, S. Deb, J. W. Wilson, C. S. Gainey, M. A. Selim, P. J. Mosca, D. S. Tyler, M. C.
Fischer, and W. S. Warren, "Pump-probe imaging of pigmented cutaneous melanoma primary lesions
gives insight into metastatic potential," Biomed. Opt. Express 6, 3631-3645 (2015).
29. F. E. Robles, S. Deb, M. C. Fischer, W. S. Warren, and M. A. Selim, "Label-Free Imaging of
Female Genital Tract Melanocytic Lesions With Pump-Probe Microscopy: A Promising Diagnostic
Tool," Journal of Lower Genital Tract Disease 21, 137-144 (2017).

30. B. J. Zeskind, C. D. Jordan, W. Timp, L. Trapani, G. Waller, V. Horodincu, D. J. Ehrlich, and P.
Matsudaira, "Nucleic acid and protein mass mapping by live-cell deep-ultraviolet microscopy," Nature
Methods 4, 567-569 (2007).
31. B. J. Zeskind, "Deep Ultraviolet Microscopy and its Application to Cancer Immunology,"
Microscopy and Microanalysis 14, 740-741 (2008).
32. A. Ojaghi, G. Carrazana, C. Caruso, A. Abbas, D. R. Myers, W. A. Lam, and F. E. Robles, "Label-
free hematology analysis using deep-ultraviolet microscopy," Proceedings of the National Academy
of Sciences 117, 14779 (2020).
33. A. Ojaghi, M. E. Fay, W. A. Lam, and F. E. Robles, "Ultraviolet Hyperspectral Interferometric
Microscopy," Scientific Reports 8, 9913 (2018).
34. N. Kaza, A. Ojaghi, and F. E. Robles, "Ultraviolet hyperspectral microscopy using chromatic-
aberration-based iterative phase recovery," Opt. Lett. 45, 2708-2711 (2020).
35. S. Soltani, A. Ojaghi, and F. E. Robles, "Deep UV dispersion and absorption spectroscopy of
biomolecules," Biomed. Opt. Express 10, 487-499 (2019).
36. V. Backman, V. Gopal, M. Kalashnikov, K. Badizadegan, R. Gurjar, A. Wax, I. Georgakoudi, M.
Mueller, C. W. Boone, R. R. Dasari, and M. S. Feld, "Measuring cellular structure at submicrometer
scale with light scattering spectroscopy," IEEE Journal of Selected Topics in Quantum Electronics 7,
887-893 (2001).
37. S. Gladstein, D. Damania, L. M. Almassalha, L. T. Smith, V. Gupta, H. Subramanian, D. K. Rex,
H. K. Roy, and V. Backman, "Correlating colorectal cancer risk with field carcinogenesis progression
using partial wave spectroscopic microscopy," Cancer Medicine 7, 2109-2120 (2018).
38. N. N. Mutyal, A. Radosevich, A. K. Tiwari, Y. Stypula, R. Wali, D. Kunte, H. K. Roy, and V.
Backman, "Biological Mechanisms Underlying Structural Changes Induced by Colorectal Field
Carcinogenesis Measured with Low-Coherence Enhanced Backscattering (LEBS) Spectroscopy,"
PLOS ONE 8, e57206 (2013).
39. R. S. Gurjar, V. Backman, L. T. Perelman, I. Georgakoudi, K. Badizadegan, I. Itzkan, R. R.
Dasari, and M. S. Feld, "Imaging human epithelial properties with polarized light-scattering
spectroscopy," Nature Medicine 7, 1245-1248 (2001).
40. G. L. C. Spicer, S. M. Azarin, J. Yi, S. T. Young, R. Ellis, G. M. Bauer, L. D. Shea, and V.
Backman, "Detection of extracellular matrix modification in cancer models with inverse spectroscopic
optical coherence tomography," Physics in Medicine and Biology 61, 6892-6904 (2016).
41. M. B. Wallace, L. T. Perelman, V. Backman, J. M. Crawford, M. Fitzmaurice, M. Seiler, K.
Badizadegan, S. J. Shields, I. Itzkan, R. R. Dasari, J. Van Dam, and M. S. Feld, "Endoscopic detection
of dysplasia in patients with Barrett's esophagus using light-scattering spectroscopy,"
Gastroenterology 119, 677-682 (2000).
42. H. Subramanian, H. K. Roy, P. Pradhan, M. J. Goldberg, J. Muldoon, R. E. Brand, C. Sturgis, T.
Hensing, D. Ray, A. Bogojevic, J. Mohammed, J.-S. Chang, and V. Backman, "Nanoscale Cellular
Changes in Field Carcinogenesis Detected by Partial Wave Spectroscopy," Cancer Research 69, 5357
(2009).
43. N. Höti, P. Shah, Y. Hu, S. Yang, and H. Zhang, "Proteomics analyses of prostate cancer cells
reveal cellular pathways associated with androgen resistance," PROTEOMICS 17, 1600228 (2017).
44. E.-C. Hsu, M. A. Rice, A. Bermudez, F. J. G. Marques, M. Aslan, S. Liu, A. Ghoochani, C. A.
Zhang, Y.-S. Chen, A. Zlitni, S. Kumar, R. Nolley, F. Habte, M. Shen, K. Koul, D. M. Peehl, A.
Zoubeidi, S. S. Gambhir, C. A. Kunder, S. J. Pitteri, J. D. Brooks, and T. Stoyanova, "Trop2 is a driver

of metastatic prostate cancer with neuroendocrine phenotype via PARP1," Proceedings of the National
Academy of Sciences 117, 2032 (2020).
45. D. Harjanto, J. S. Maffei, and M. H. Zaman, "Quantitative Analysis of the Effect of Cancer
Invasiveness and Collagen Concentration on 3D Matrix Remodeling," PLOS ONE 6, e24891 (2011).
46. M. Ojalill, N. Virtanen, P. Rappu, E. Siljamäki, P. Taimen, and J. Heino, "Interaction between
prostate cancer cells and prostate fibroblasts promotes accumulation and proteolytic processing of
basement membrane proteins," The Prostate 80, 715-726 (2020).
47. C. E. Massie, I. G. Mills, and A. G. Lynch, "The importance of DNA methylation in prostate
cancer development," The Journal of Steroid Biochemistry and Molecular Biology 166, 1-15 (2017).
48. A. Sita-Lumsden, C. E. Fletcher, D. A. Dart, G. N. Brooke, J. Waxman, and C. L. Bevan,
"Circulating nucleic acids as biomarkers of prostate cancer," Biomarkers in Medicine 7, 867-877
(2013).
49. G. Wang, D. Zhao, D. J. Spring, and R. A. DePinho, "Genetics and biology of prostate cancer,"
Genes & Development 32, 1105-1140 (2018).
50. Z. Chen, L. Wang, Q. Wang, and W. Li, "Histone modifications and chromatin organization in
prostate cancer," Epigenomics 2, 551-560 (2010).
51. J. R. Packer and N. J. Maitland, "The molecular and cellular origin of human prostate cancer,"
Biochimica et Biophysica Acta (BBA) - Molecular Cell Research 1863, 1238-1260 (2016).
52. G. Ayala, A. Frolov, D. Chatterjee, D. He, S. Hilsenbeck, and M. Ittmann, "Expression of ERG
protein in prostate cancer: variability and biological correlates," Endocrine-Related Cancer 22, 277
(2015).
53. S. P. Balk, Y.-J. Ko, and G. J. Bubley, "Biology of Prostate-Specific Antigen," Journal of Clinical
Oncology 21, 383-391 (2003).
54. N. Burns-cox, N. C. Avery, J. C. Gingell, and A. J. Bailey, "Canges in Collagen metabolism in
prostate cancer: A host response that may alter progression," Journal of Urology 166, 1698-1701
(2001).
55. S. Rashid, G. Nir, L. Fazli, A. H. Boag, D. R. Siemens, S. L. Goldenberg, P. Abolmaesumi, and
S. E. Salcudean, "Automatic pathology of prostate cancer in whole mount slides incorporating
individual gland classification," Computer Methods in Biomechanics and Biomedical Engineering:
Imaging & Visualization 7, 336-347 (2019).
56. C.-M. Chen, Y.-S. Huang, P.-W. Fang, C.-W. Liang, and R.-F. Chang, "A computer-aided
diagnosis system for differentiation and delineation of malignant regions on whole-slide prostate
histopathology image using spatial statistics and multidimensional DenseNet," Medical Physics 47,
1021-1033 (2020).
57. Y. X. Kitzing, A. Prando, C. Varol, G. S. Karczmar, F. Maclean, and A. Oto, "Benign Conditions
That Mimic Prostate Carcinoma: MR Imaging Features with Histopathologic Correlation,"
RadioGraphics 36, 162-175 (2016).
58. M. Srodon and J. I. Epstein, "Central zone histology of the prostate: A mimicker of high-grade
prostatic intraepithelial neoplasia," Human Pathology 33, 518-523 (2002).
59. X. Li, G. Zhang, H. Qiao, F. Bao, Y. Deng, J. Wu, Y. He, J. Yun, X. Lin, H. Xie, H. Wang, and
Q. Dai, "Unsupervised content-preserving transformation for optical microscopy," Light: Science &
Applications 10, 44 (2021).
60. Y. Rivenson, H. Wang, Z. Wei, K. de Haan, Y. Zhang, Y. Wu, H. Günaydın, J. E. Zuckerman, T.
Chong, A. E. Sisk, L. M. Westbrook, W. D. Wallace, and A. Ozcan, "Virtual histological staining of

unlabelled tissue-autofluorescence images via deep learning," Nature Biomedical Engineering 3, 466-
477 (2019).
61. C. Ounkomol, S. Seshamani, M. M. Maleckar, F. Collman, and G. R. Johnson, "Label-free
prediction of three-dimensional fluorescence images from transmitted-light microscopy," Nature
Methods 15, 917-920 (2018).
62. M. E. Kandel, Y. R. He, Y. J. Lee, T. H.-Y. Chen, K. M. Sullivan, O. Aydin, M. T. A. Saif, H.
Kong, N. Sobh, and G. Popescu, "Phase imaging with computational specificity (PICS) for measuring
dry mass changes in sub-cellular compartments," Nature Communications 11, 6256 (2020).
63. G. Tozbikian, E. Brogi, C. E. Vallejo, D. Giri, M. Murray, J. Catalano, C. Olcese, K. J. Van Zee,
and H. Y. Wen, "Atypical Ductal Hyperplasia Bordering on Ductal Carcinoma In Situ:Interobserver
Variability and Outcomes in 105 Cases," International Journal of Surgical Pathology 25, 100-107
(2017).
64. A. Rana, A. Lowe, M. Lithgow, K. Horback, T. Janovitz, A. Da Silva, H. Tsai, V. Shanmugam,
A. Bayat, and P. Shah, "Use of Deep Learning to Develop and Analyze Computational Hematoxylin
and Eosin Staining of Prostate Core Biopsy Images for Tumor Diagnosis," JAMA Network Open 3,
e205111-e205111 (2020).
65. P. Camparo, L. Egevad, F. Algaba, D. M. Berney, L. Boccon-Gibod, E. Compérat, A. J. Evans,
R. Grobholz, G. Kristiansen, C. Langner, A. Lopez-Beltran, R. Montironi, P. Oliveira, B. Vainer, and
M. Varma, "Utility of whole slide imaging and virtual microscopy in prostate pathology," APMIS 120,
298-304 (2012).
66. K. Nagpal, D. Foote, Y. Liu, P.-H. C. Chen, E. Wulczyn, F. Tan, N. Olson, J. L. Smith, A.
Mohtashamian, J. H. Wren, G. S. Corrado, R. MacDonald, L. H. Peng, M. B. Amin, A. J. Evans, A.
R. Sangoi, C. H. Mermel, J. D. Hipp, and M. C. Stumpe, "Development and validation of a deep
learning algorithm for improving Gleason scoring of prostate cancer," npj Digital Medicine 2, 48
(2019).
67. C. J. Logothetis, G. E. Gallick, S. N. Maity, J. Kim, A. Aparicio, E. Efstathiou, and S.-H. Lin,
"Molecular Classification of Prostate Cancer Progression: Foundation for Marker-Driven Treatment
of Prostate Cancer," Cancer Discovery 3, 849-861 (2013).
68. C. J. Ryan, A. Smith, P. Lal, J. Satagopan, V. Reuter, P. Scardino, W. Gerald, and H. I. Scher,
"Persistent prostate-specific antigen expression after neoadjuvant androgen depletion: An early
predictor of relapse or incomplete androgen suppression," Urology 68, 834-839 (2006).
69. A. Aparicio, R. B. Den, and K. E. Knudsen, "Time to stratify? The retinoblastoma protein in
castrate-resistant prostate cancer," Nature Reviews Urology 8, 562-568 (2011).
70. J. Gandhi, A. Afridi, S. Vatsia, G. Joshi, G. Joshi, S. A. Kaplan, N. L. Smith, and S. A. Khan,
"The molecular biology of prostate cancer: current understanding and clinical implications," Prostate
Cancer and Prostatic Diseases 21, 22-36 (2018).
71. F. Fereidouni, Z. T. Harmany, M. Tian, A. Todd, J. A. Kintner, J. D. McPherson, A. D. Borowsky,
J. Bishop, M. Lechpammer, S. G. Demos, and R. Levenson, "Microscopy with ultraviolet surface
excitation for rapid slide-free histology," Nature Biomedical Engineering 1, 957-966 (2017).
72. Y. Zhang, K. de Haan, Y. Rivenson, J. Li, A. Delis, and A. Ozcan, "Digital synthesis of
histological stains using micro-structured and multiplexed virtual staining of label-free tissue," Light:
Science & Applications 9, 78 (2020).
73. K. Kong, C. J. Rowlands, S. Varma, W. Perkins, I. H. Leach, A. A. Koloydenko, H. C. Williams,
and I. Notingher, "Diagnosis of tumors during tissue-conserving surgery with integrated

autofluorescence and Raman scattering microscopy," Proceedings of the National Academy of
Sciences 110, 15189 (2013).
74. W. Lei, H. Dalin, Z. Jin, F. Zhenfeng, D. Qiang, W. Xinyang, W. Jun, H. Liqing, C. Peilong, Z.
Guanjun, H. JerTong, and F. Jinhai, "Raman spectroscopy, a potential tool in diagnosis and prognosis
of castration-resistant prostate cancer," Journal of Biomedical Optics 18, 1-8 (2013).
75. X. Weisi, C. Ye, W. Yu, W. Linpeng, Y. Chengbo, K. G. Adam, E. F. Mark, J. S. Eric, M. D.
Suzanne, C. V. Joshua, P. R. Nicholas, and T. C. L. Jonathan, "Microscopy with ultraviolet surface
excitation for wide-area pathology of breast surgical margins," Journal of Biomedical Optics 24, 1-11
(2019).
76. F. De Leeuw, I. Breuskin, M. Abbaci, O. Casiraghi, H. Mirghani, A. Ben Lakhdar, C. Laplace-
Builhé, and D. Hartl, "Intraoperative Near-infrared Imaging for Parathyroid Gland Identification by
Auto-fluorescence: A Feasibility Study," World Journal of Surgery 40, 2131-2138 (2016).
77. W. Liddy, J. Bonilla-Velez, F. Triponez, D. Kamani, and G. Randolph, "31 - Principles in Thyroid
Surgery," in Surgery of the Thyroid and Parathyroid Glands (Third Edition), G. W. Randolph, ed.
(Elsevier, 2021), pp. 272-293.e275.
78. A. H. M. Linkon, M. M. Labib, T. Hasan, M. Hossain, and M.-E. Jannat, "Deep learning in
prostate cancer diagnosis and Gleason grading in histopathology images: An extensive study,"
Informatics in Medicine Unlocked 24, 100582 (2021).
79. J. Chalfoun, M. Majurski, T. Blattner, K. Bhadriraju, W. Keyrouz, P. Bajcsy, and M. Brady,
"MIST: Accurate and Scalable Microscopy Image Stitching Tool with Stage Modeling and Error
Minimization," Scientific Reports 7, 4988 (2017).
80. A. Vahadane, T. Peng, A. Sethi, S. Albarqouni, L. Wang, M. Baust, K. Steiger, A. M. Schlitter,
I. Esposito, and N. Navab, "Structure-Preserving Color Normalization and Sparse Stain Separation for
Histological Images," IEEE Transactions on Medical Imaging 35, 1962-1971 (2016).

Supplementary Files
This is a list of supplementary �les associated with this preprint. Click to download.
prostatecancermanuscriptSRsupplementaryinformation.pdf