Embed Size (px)
Citation preview
1
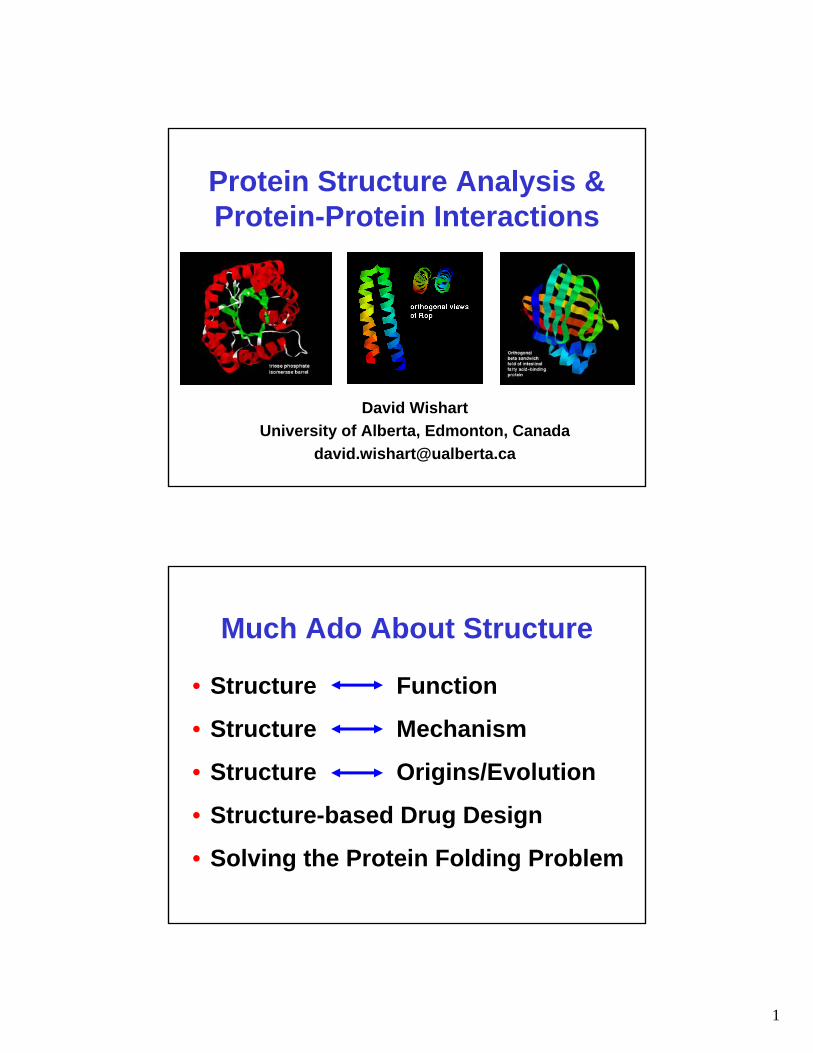
Protein Structure Analysis & Protein-Protein Interactions
David WishartUniversity of Alberta, Edmonton, Canada
Much Ado About Structure
• Structure Function
• Structure Mechanism
• Structure Origins/Evolution
• Structure-based Drug Design
• Solving the Protein Folding Problem
2
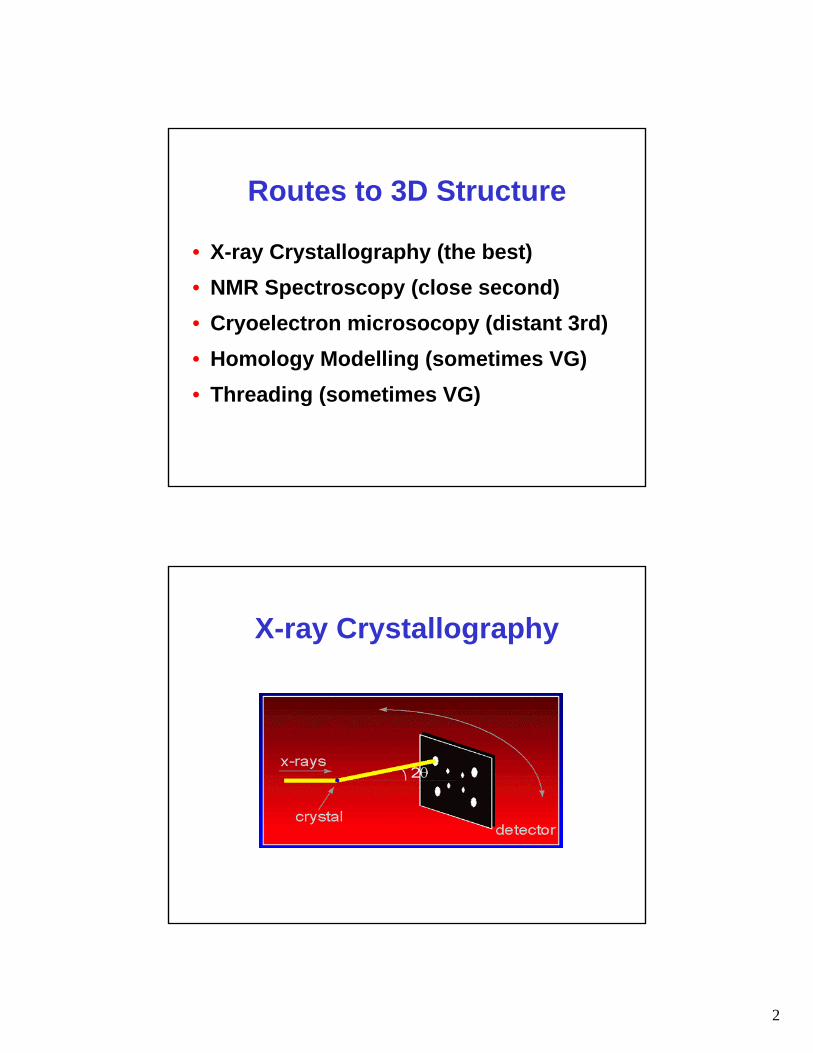
Routes to 3D Structure
• X-ray Crystallography (the best)• NMR Spectroscopy (close second)• Cryoelectron microsocopy (distant 3rd)• Homology Modelling (sometimes VG)• Threading (sometimes VG)
X-ray Crystallography
3
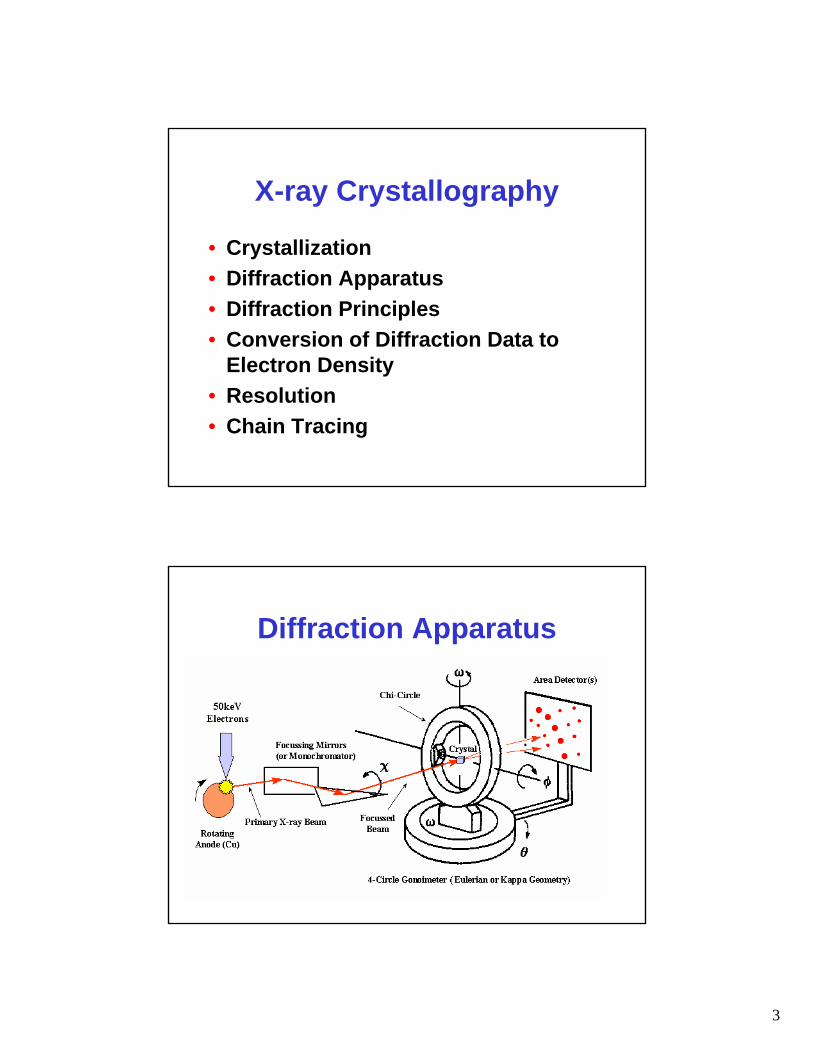
X-ray Crystallography
• Crystallization• Diffraction Apparatus• Diffraction Principles• Conversion of Diffraction Data to
Electron Density• Resolution• Chain Tracing
Diffraction Apparatus
4
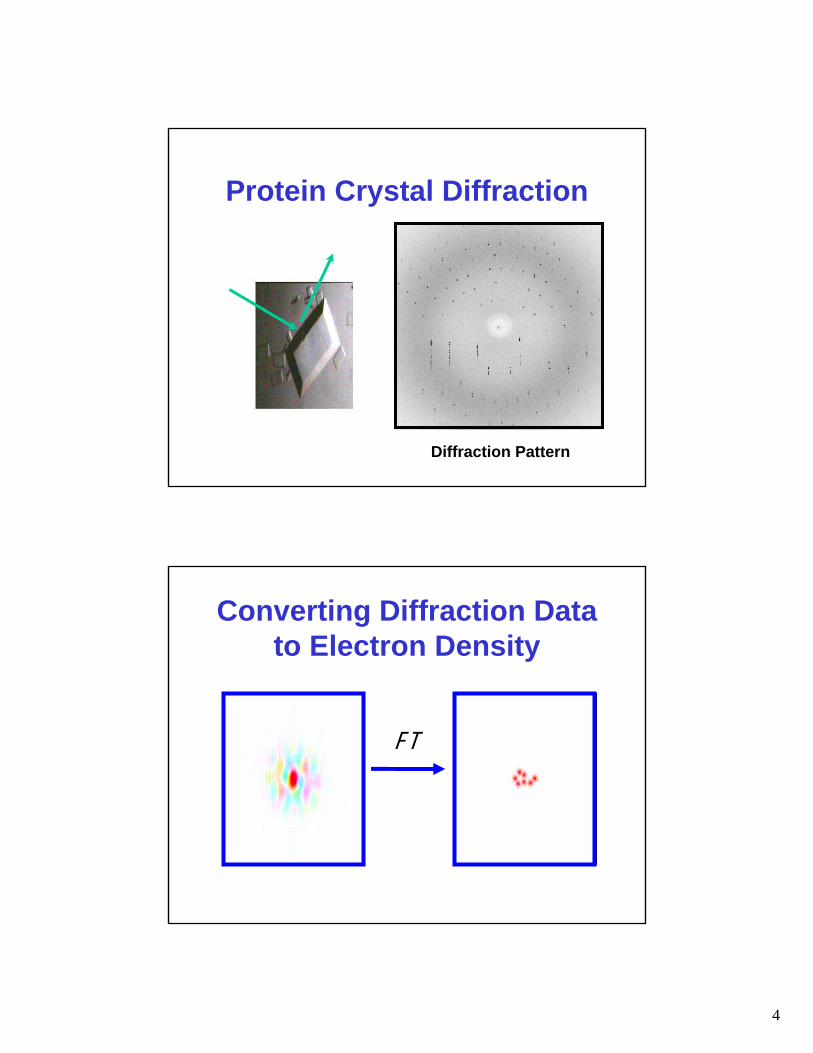
Diffraction Pattern
Protein Crystal Diffraction
F T
Converting Diffraction Data to Electron Density
5
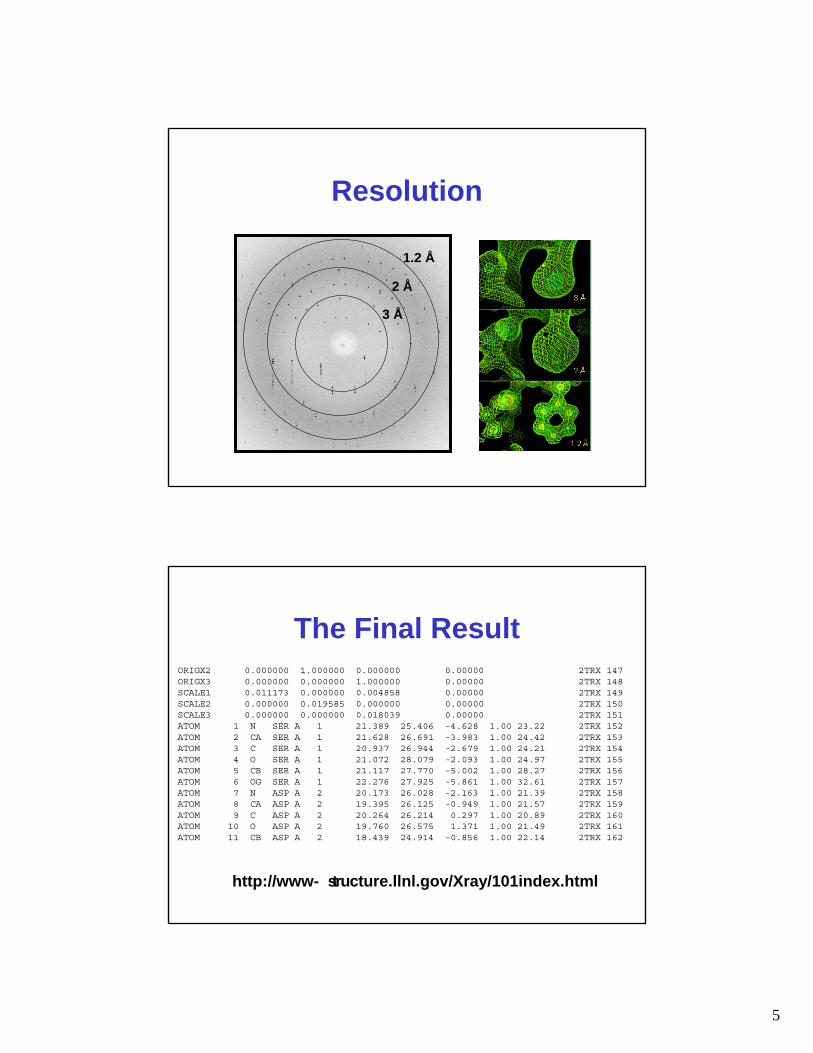
Resolution
1.2 Å
2 Å
3 Å
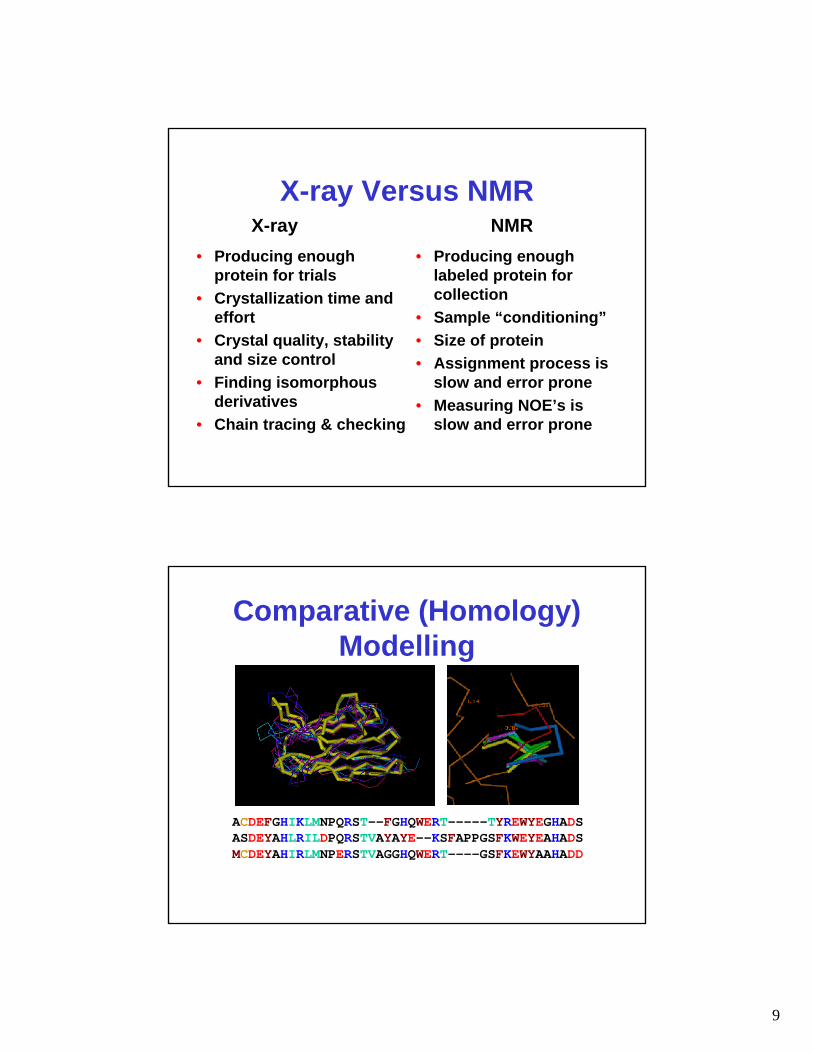
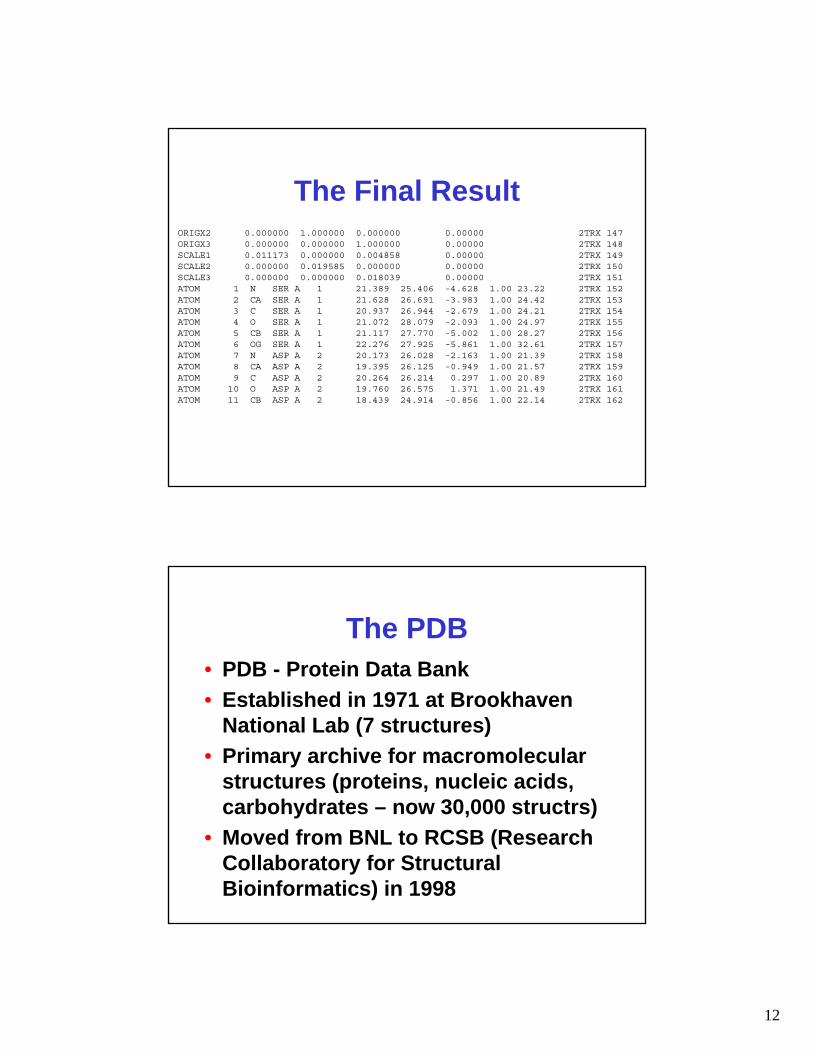
The Final Result
http://www- structure.llnl.gov/Xray/101index.html
ORIGX2 0.000000 1.000000 0.000000 0.00000 2TRX 147ORIGX3 0.000000 0.000000 1.000000 0.00000 2TRX 148SCALE1 0.011173 0.000000 0.004858 0.00000 2TRX 149SCALE2 0.000000 0.019585 0.000000 0.00000 2TRX 150SCALE3 0.000000 0.000000 0.018039 0.00000 2TRX 151ATOM 1 N SER A 1 21.389 25.406 -4.628 1.00 23.22 2TRX 152ATOM 2 CA SER A 1 21.628 26.691 -3.983 1.00 24.42 2TRX 153ATOM 3 C SER A 1 20.937 26.944 -2.679 1.00 24.21 2TRX 154ATOM 4 O SER A 1 21.072 28.079 -2.093 1.00 24.97 2TRX 155ATOM 5 CB SER A 1 21.117 27.770 -5.002 1.00 28.27 2TRX 156ATOM 6 OG SER A 1 22.276 27.925 -5.861 1.00 32.61 2TRX 157ATOM 7 N ASP A 2 20.173 26.028 -2.163 1.00 21.39 2TRX 158ATOM 8 CA ASP A 2 19.395 26.125 -0.949 1.00 21.57 2TRX 159ATOM 9 C ASP A 2 20.264 26.214 0.297 1.00 20.89 2TRX 160ATOM 10 O ASP A 2 19.760 26.575 1.371 1.00 21.49 2TRX 161ATOM 11 CB ASP A 2 18.439 24.914 -0.856 1.00 22.14 2TRX 162
6
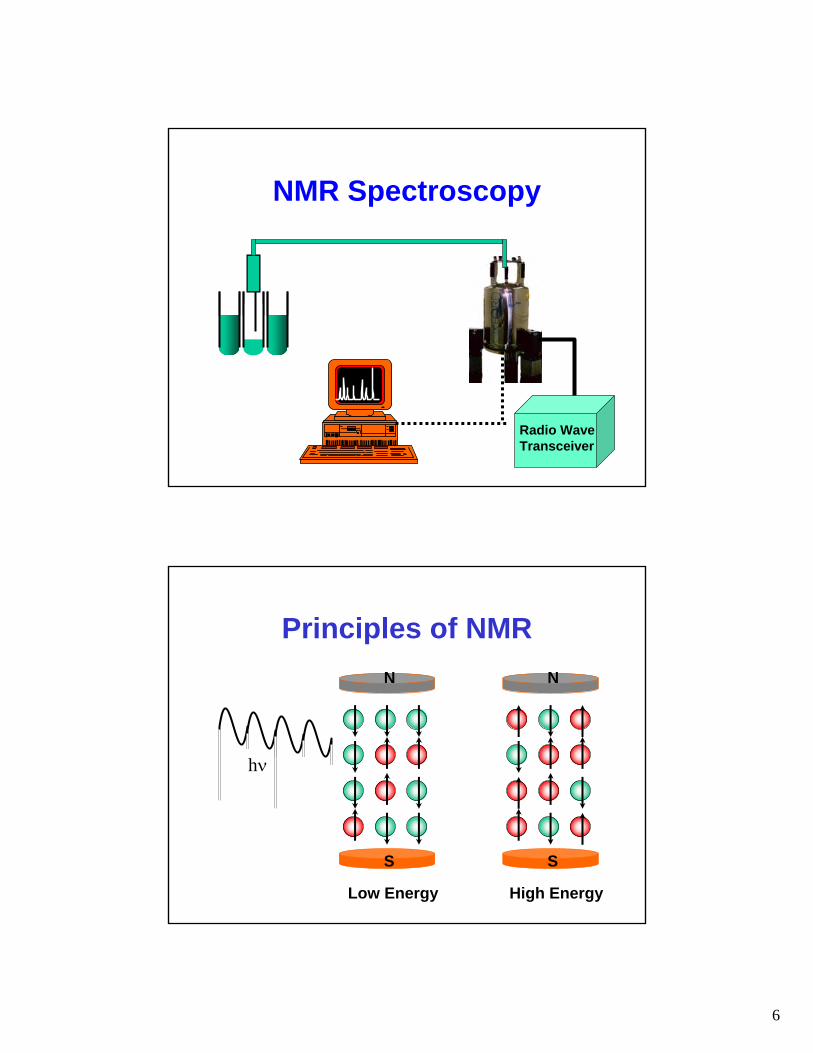
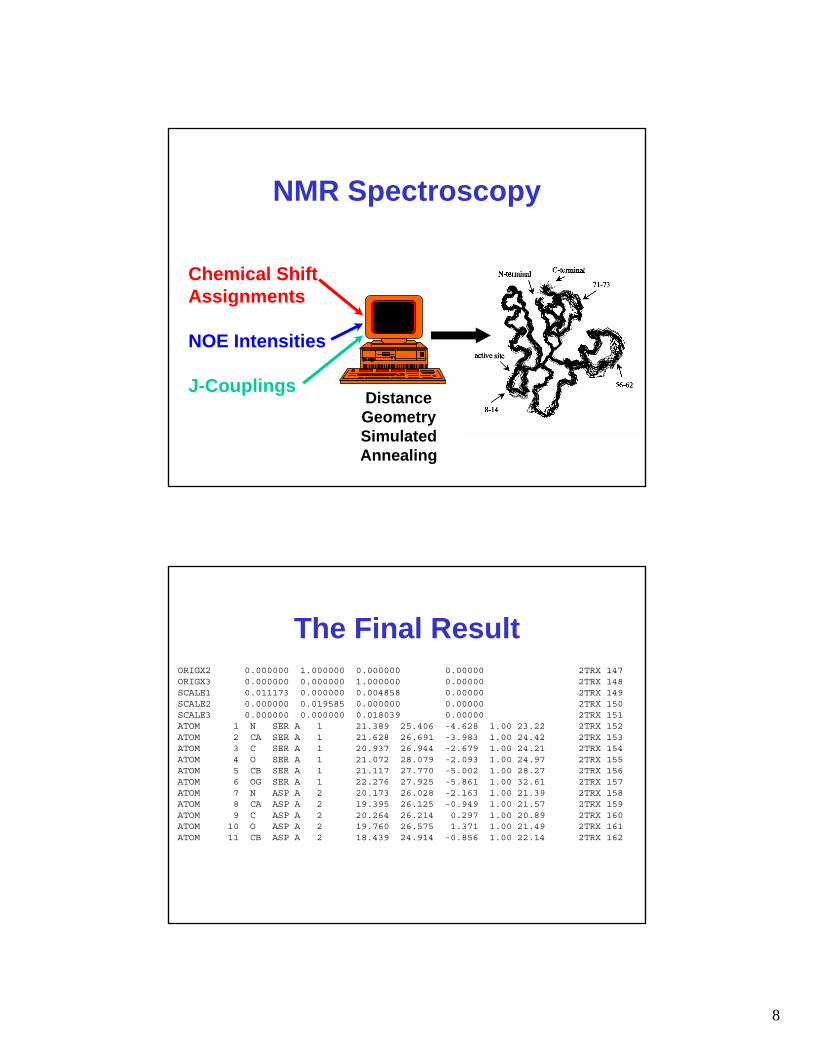
NMR Spectroscopy
Radio WaveTransceiver
Principles of NMR
hν
Low Energy High Energy
N N
SS
7
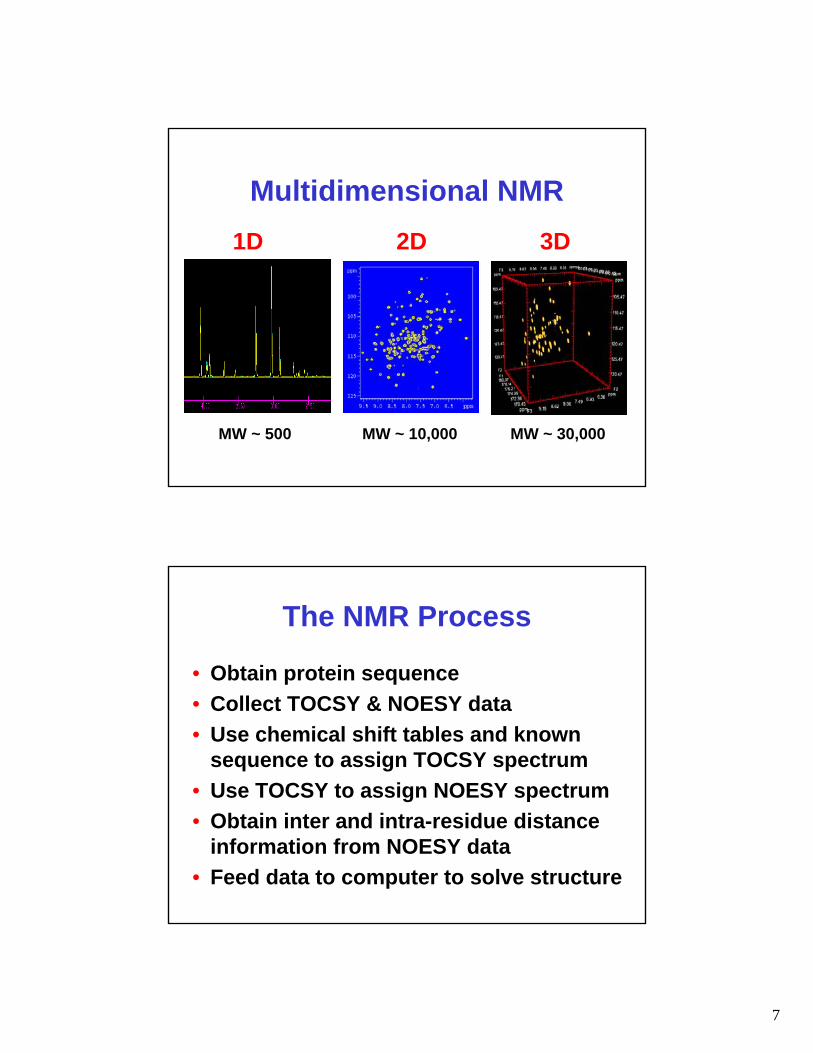
Multidimensional NMR1D 2D 3D
MW ~ 500 MW ~ 10,000 MW ~ 30,000
The NMR Process
• Obtain protein sequence• Collect TOCSY & NOESY data• Use chemical shift tables and known
sequence to assign TOCSY spectrum• Use TOCSY to assign NOESY spectrum• Obtain inter and intra-residue distance
information from NOESY data• Feed data to computer to solve structure
8
NMR Spectroscopy
Chemical ShiftAssignments
NOE Intensities
J-CouplingsDistanceGeometrySimulatedAnnealing
The Final ResultORIGX2 0.000000 1.000000 0.000000 0.00000 2TRX 147ORIGX3 0.000000 0.000000 1.000000 0.00000 2TRX 148SCALE1 0.011173 0.000000 0.004858 0.00000 2TRX 149SCALE2 0.000000 0.019585 0.000000 0.00000 2TRX 150SCALE3 0.000000 0.000000 0.018039 0.00000 2TRX 151ATOM 1 N SER A 1 21.389 25.406 -4.628 1.00 23.22 2TRX 152ATOM 2 CA SER A 1 21.628 26.691 -3.983 1.00 24.42 2TRX 153ATOM 3 C SER A 1 20.937 26.944 -2.679 1.00 24.21 2TRX 154ATOM 4 O SER A 1 21.072 28.079 -2.093 1.00 24.97 2TRX 155ATOM 5 CB SER A 1 21.117 27.770 -5.002 1.00 28.27 2TRX 156ATOM 6 OG SER A 1 22.276 27.925 -5.861 1.00 32.61 2TRX 157ATOM 7 N ASP A 2 20.173 26.028 -2.163 1.00 21.39 2TRX 158ATOM 8 CA ASP A 2 19.395 26.125 -0.949 1.00 21.57 2TRX 159ATOM 9 C ASP A 2 20.264 26.214 0.297 1.00 20.89 2TRX 160ATOM 10 O ASP A 2 19.760 26.575 1.371 1.00 21.49 2TRX 161ATOM 11 CB ASP A 2 18.439 24.914 -0.856 1.00 22.14 2TRX 162
9
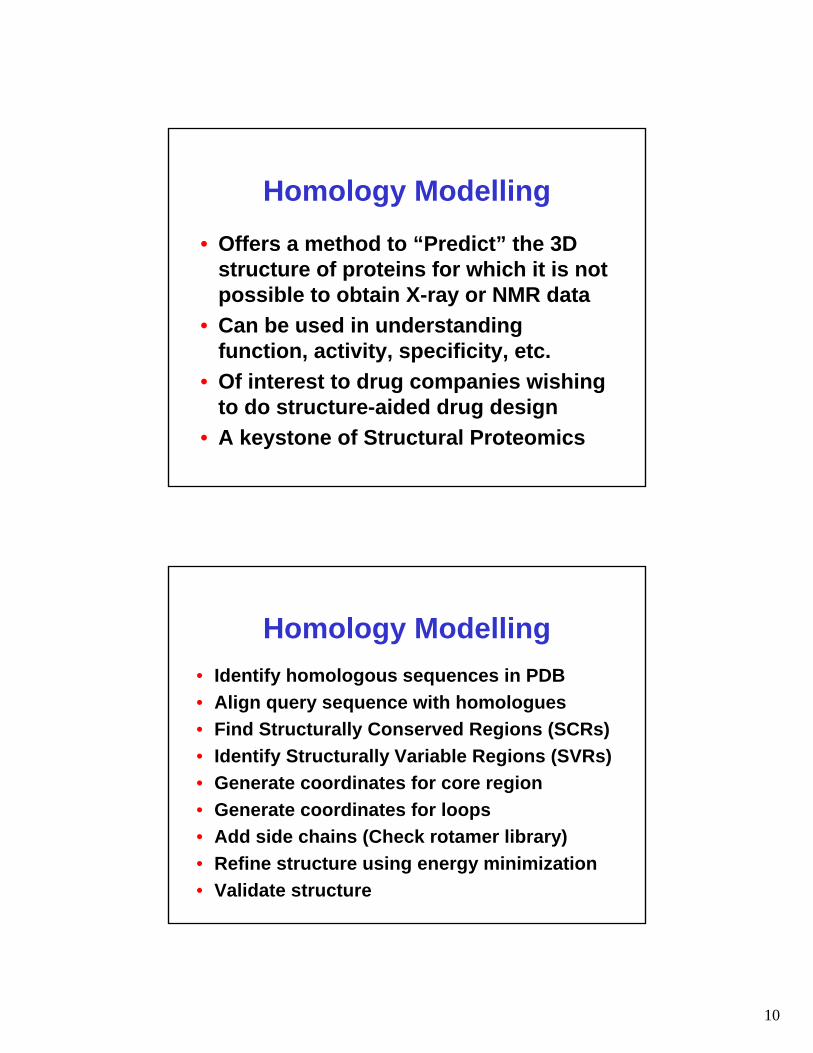
X-ray Versus NMR
• Producing enough protein for trials
• Crystallization time and effort
• Crystal quality, stability and size control
• Finding isomorphous derivatives
• Chain tracing & checking
• Producing enough labeled protein for collection
• Sample “conditioning”• Size of protein• Assignment process is
slow and error prone• Measuring NOE’s is
slow and error prone
X-ray NMR
Comparative (Homology) Modelling
ACDEFGHIKLMNPQRST--FGHQWERT-----TYREWYEGHADSASDEYAHLRILDPQRSTVAYAYE--KSFAPPGSFKWEYEAHADSMCDEYAHIRLMNPERSTVAGGHQWERT----GSFKEWYAAHADD
10
Homology Modelling• Offers a method to “Predict” the 3D
structure of proteins for which it is not possible to obtain X-ray or NMR data
• Can be used in understanding function, activity, specificity, etc.
• Of interest to drug companies wishing to do structure-aided drug design
• A keystone of Structural Proteomics
Homology Modelling• Identify homologous sequences in PDB• Align query sequence with homologues• Find Structurally Conserved Regions (SCRs)• Identify Structurally Variable Regions (SVRs)• Generate coordinates for core region• Generate coordinates for loops• Add side chains (Check rotamer library)• Refine structure using energy minimization• Validate structure
11
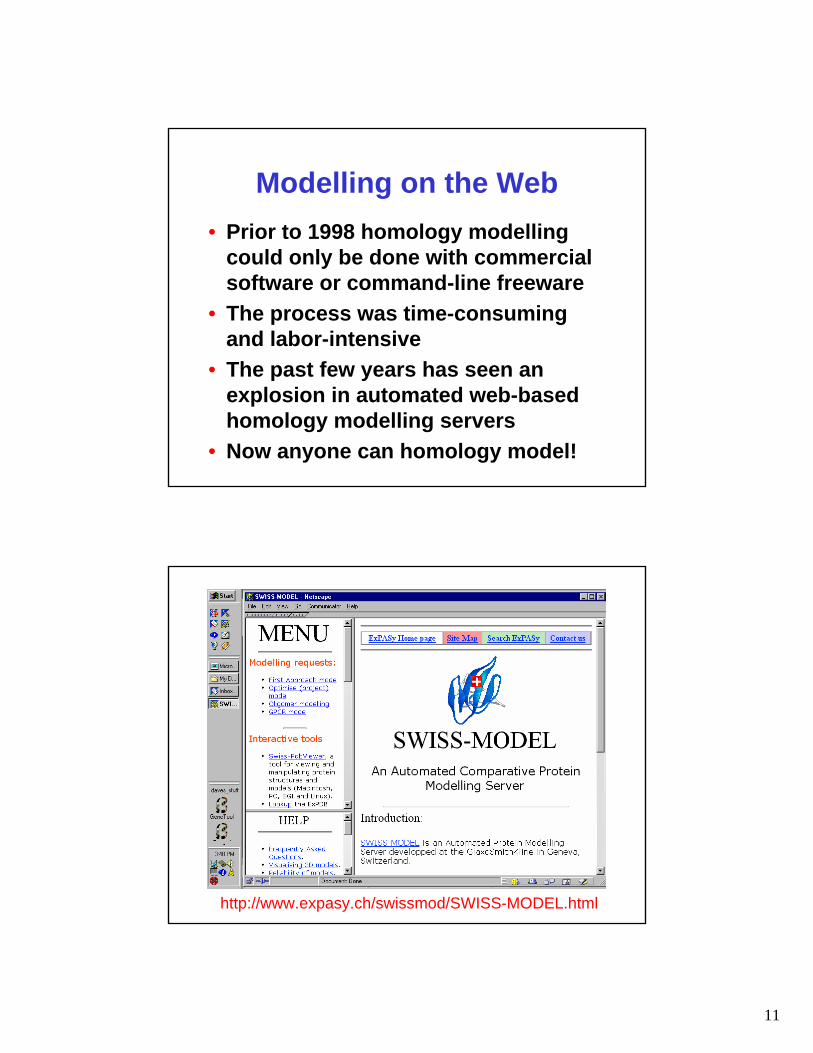
Modelling on the Web• Prior to 1998 homology modelling
could only be done with commercial software or command-line freeware
• The process was time-consuming and labor-intensive
• The past few years has seen an explosion in automated web-based homology modelling servers
• Now anyone can homology model!
http://www.expasy.ch/swissmod/SWISS-MODEL.html
12
The Final ResultORIGX2 0.000000 1.000000 0.000000 0.00000 2TRX 147ORIGX3 0.000000 0.000000 1.000000 0.00000 2TRX 148SCALE1 0.011173 0.000000 0.004858 0.00000 2TRX 149SCALE2 0.000000 0.019585 0.000000 0.00000 2TRX 150SCALE3 0.000000 0.000000 0.018039 0.00000 2TRX 151ATOM 1 N SER A 1 21.389 25.406 -4.628 1.00 23.22 2TRX 152ATOM 2 CA SER A 1 21.628 26.691 -3.983 1.00 24.42 2TRX 153ATOM 3 C SER A 1 20.937 26.944 -2.679 1.00 24.21 2TRX 154ATOM 4 O SER A 1 21.072 28.079 -2.093 1.00 24.97 2TRX 155ATOM 5 CB SER A 1 21.117 27.770 -5.002 1.00 28.27 2TRX 156ATOM 6 OG SER A 1 22.276 27.925 -5.861 1.00 32.61 2TRX 157ATOM 7 N ASP A 2 20.173 26.028 -2.163 1.00 21.39 2TRX 158ATOM 8 CA ASP A 2 19.395 26.125 -0.949 1.00 21.57 2TRX 159ATOM 9 C ASP A 2 20.264 26.214 0.297 1.00 20.89 2TRX 160ATOM 10 O ASP A 2 19.760 26.575 1.371 1.00 21.49 2TRX 161ATOM 11 CB ASP A 2 18.439 24.914 -0.856 1.00 22.14 2TRX 162
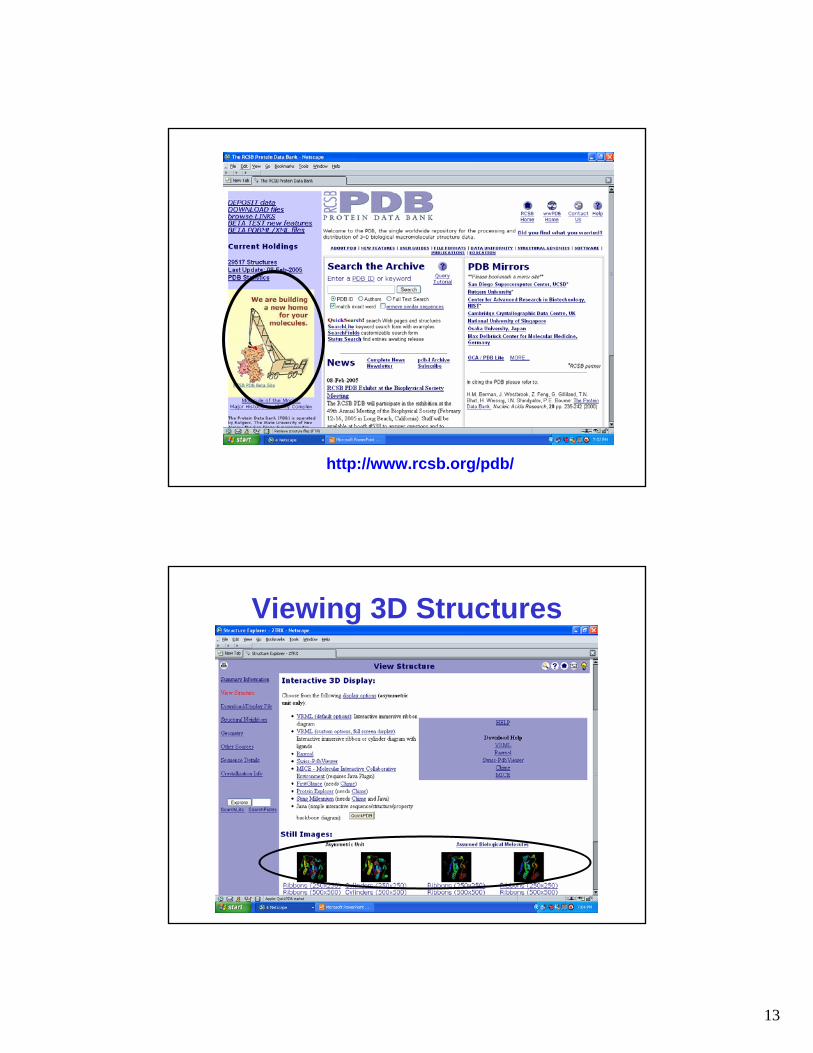
The PDB• PDB - Protein Data Bank• Established in 1971 at Brookhaven
National Lab (7 structures)• Primary archive for macromolecular
structures (proteins, nucleic acids, carbohydrates – now 30,000 structrs)
• Moved from BNL to RCSB (Research Collaboratory for Structural Bioinformatics) in 1998
13
The PDB
http://www.rcsb.org/pdb/
Viewing 3D Structures
14
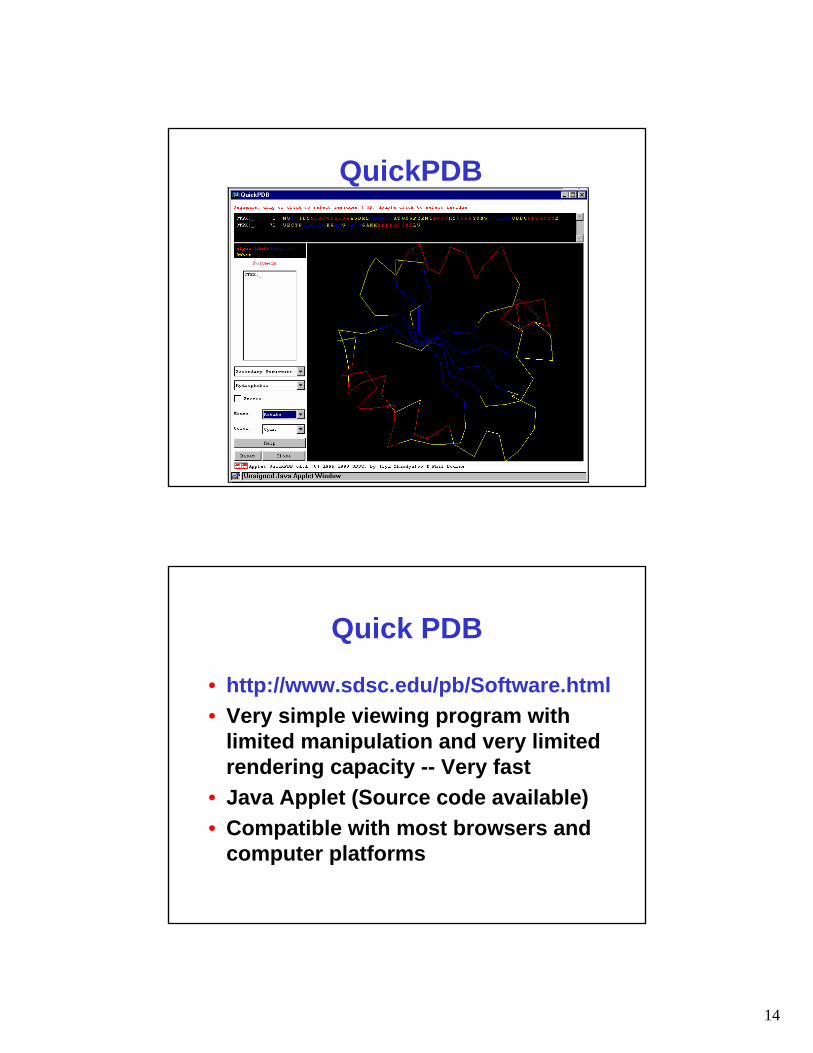
QuickPDB
Quick PDB
• http://www.sdsc.edu/pb/Software.html• Very simple viewing program with
limited manipulation and very limited rendering capacity -- Very fast
• Java Applet (Source code available)• Compatible with most browsers and
computer platforms
15
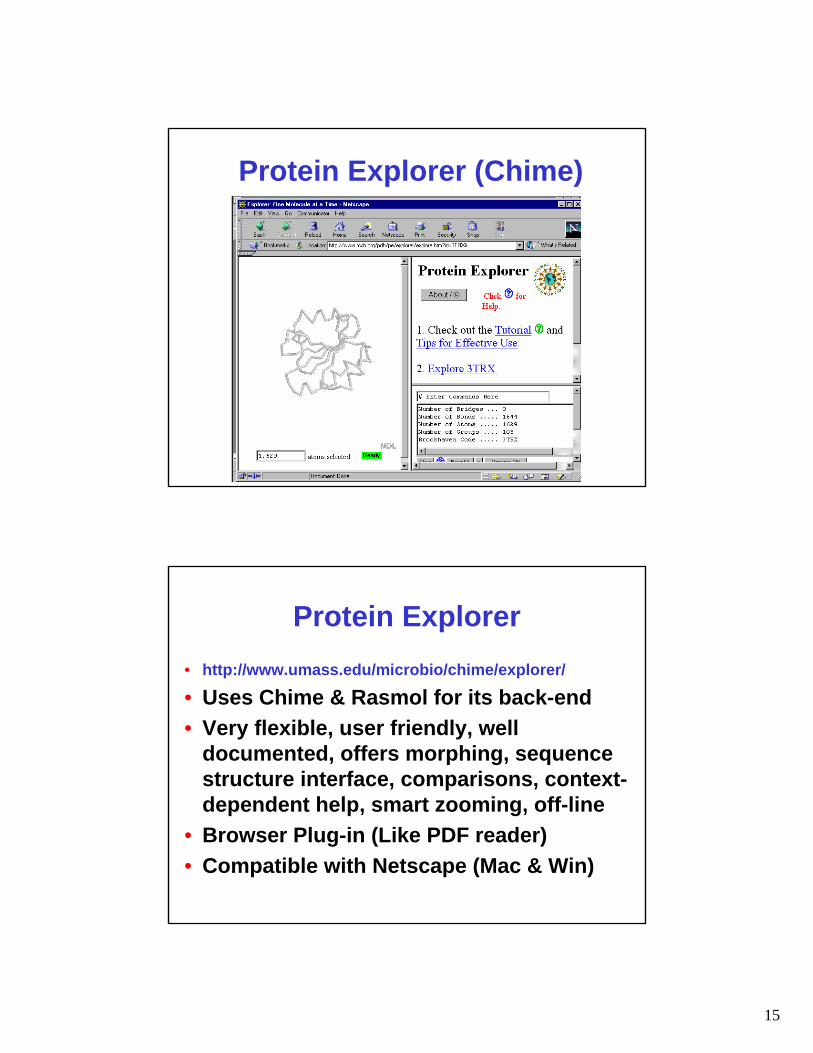
Protein Explorer (Chime)
Protein Explorer• http://www.umass.edu/microbio/chime/explorer/
• Uses Chime & Rasmol for its back-end• Very flexible, user friendly, well
documented, offers morphing, sequence structure interface, comparisons, context-dependent help, smart zooming, off-line
• Browser Plug-in (Like PDF reader)• Compatible with Netscape (Mac & Win)
16
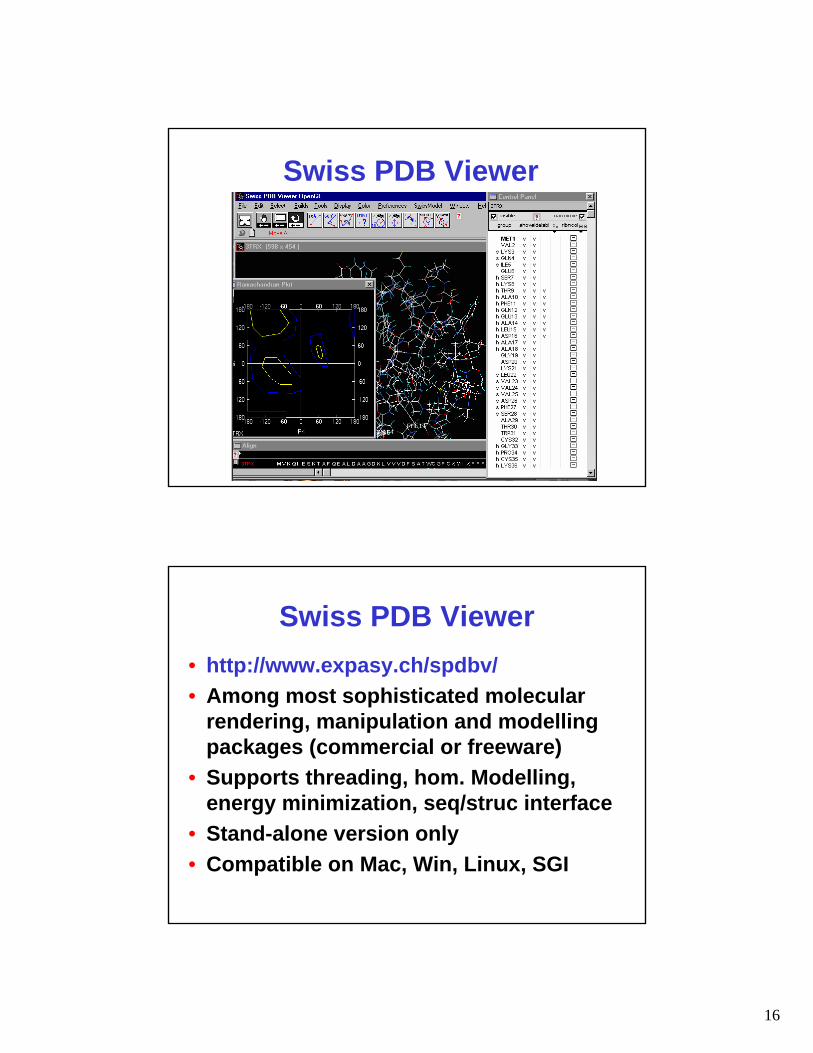
Swiss PDB Viewer
Swiss PDB Viewer• http://www.expasy.ch/spdbv/• Among most sophisticated molecular
rendering, manipulation and modellingpackages (commercial or freeware)
• Supports threading, hom. Modelling, energy minimization, seq/struc interface
• Stand-alone version only• Compatible on Mac, Win, Linux, SGI
17
Swiss PDB Tutorial
http://www.usm.maine.edu/~rhodes/SPVTut/
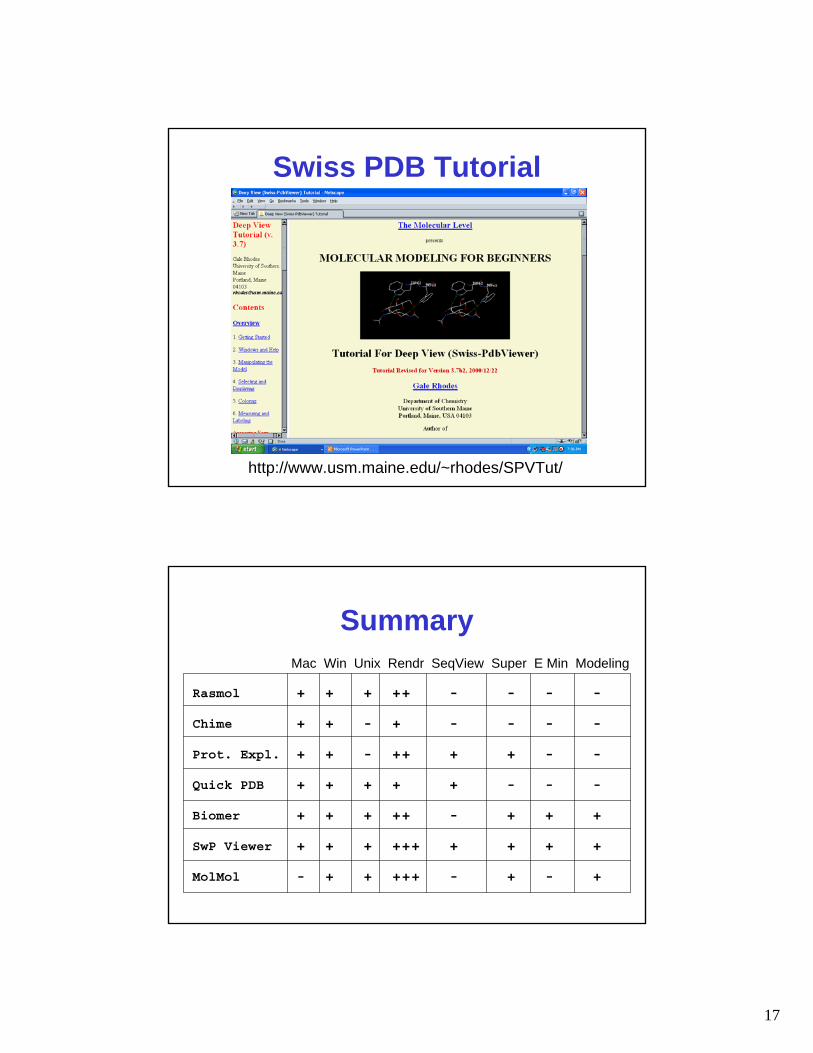
Summary
Rasmol + + + ++ - - - -
Chime + + - + - - - -
Prot. Expl. + + - ++ + + - -
Quick PDB + + + + + - - -
Biomer + + + ++ - + + +
SwP Viewer + + + +++ + + + +
MolMol - + + +++ - + - +
Mac Win Unix Rendr SeqView Super E Min Modeling
18
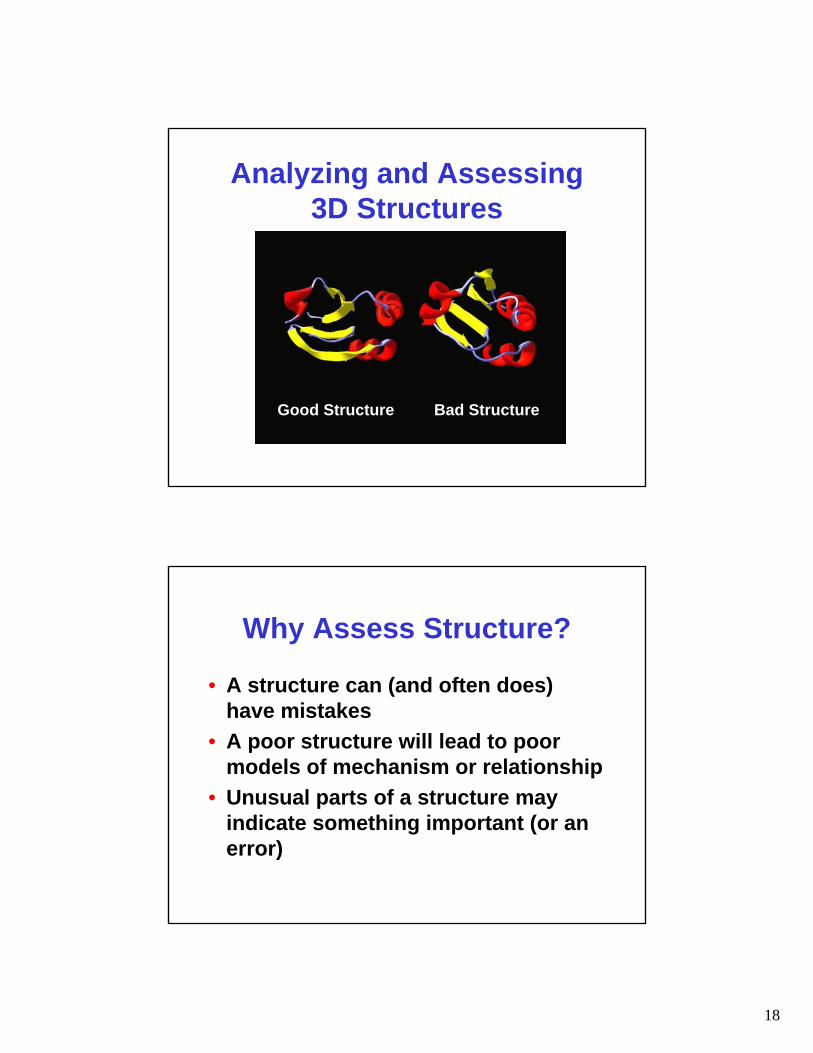
Analyzing and Assessing 3D Structures
Good Structure Bad Structure
Why Assess Structure?
• A structure can (and often does) have mistakes
• A poor structure will lead to poor models of mechanism or relationship
• Unusual parts of a structure may indicate something important (or an error)
19
Famous “bad” structures
• Azobacter ferredoxin (wrong space group)• Zn-metallothionein (mistraced chain)• Alpha bungarotoxin (poor stereochemistry)• Yeast enolase (mistraced chain)• Ras P21 oncogene (mistraced chain)• Gene V protein (poor stereochemistry)
How to Assess Structure?
• Assess experimental fit (look at R factor {X-ray} or rmsd {NMR})
• Assess correctness of overall fold (look at disposition of hydrophobes, location of charged residues)
• Assess structure quality (packing, stereochemistry, bad contacts, etc.)
20
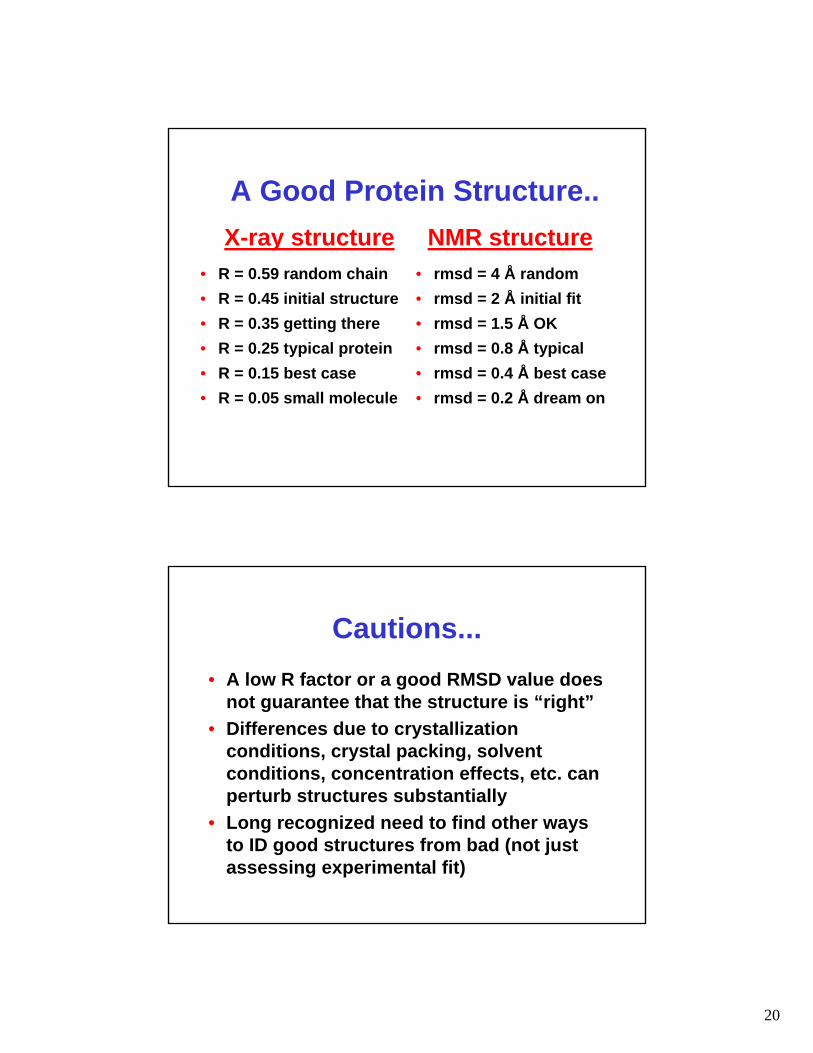
• R = 0.59 random chain• R = 0.45 initial structure• R = 0.35 getting there• R = 0.25 typical protein• R = 0.15 best case• R = 0.05 small molecule
• rmsd = 4 Å random• rmsd = 2 Å initial fit• rmsd = 1.5 Å OK• rmsd = 0.8 Å typical• rmsd = 0.4 Å best case• rmsd = 0.2 Å dream on
A Good Protein Structure..X-ray structure NMR structure
Cautions...• A low R factor or a good RMSD value does
not guarantee that the structure is “right”• Differences due to crystallization
conditions, crystal packing, solvent conditions, concentration effects, etc. can perturb structures substantially
• Long recognized need to find other ways to ID good structures from bad (not just assessing experimental fit)
21
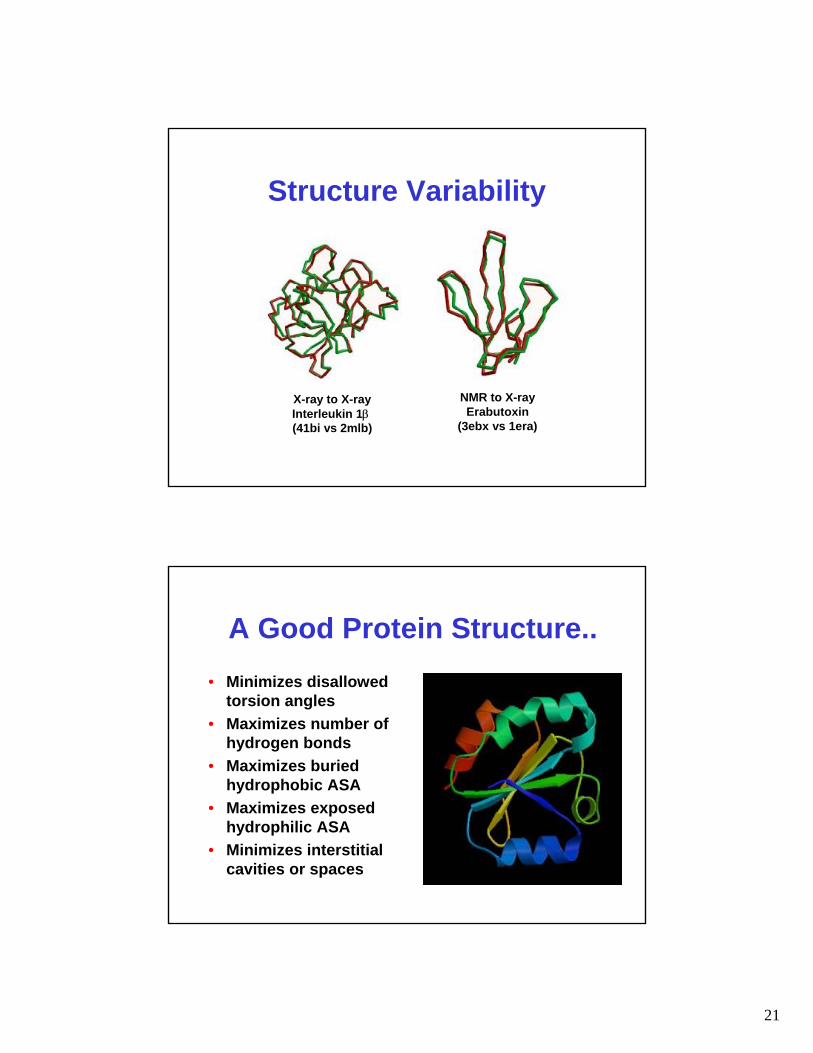
X-ray to X-rayInterleukin 1β(41bi vs 2mlb)
NMR to X-rayErabutoxin
(3ebx vs 1era)
Structure Variability
A Good Protein Structure..• Minimizes disallowed
torsion angles• Maximizes number of
hydrogen bonds• Maximizes buried
hydrophobic ASA• Maximizes exposed
hydrophilic ASA• Minimizes interstitial
cavities or spaces
22
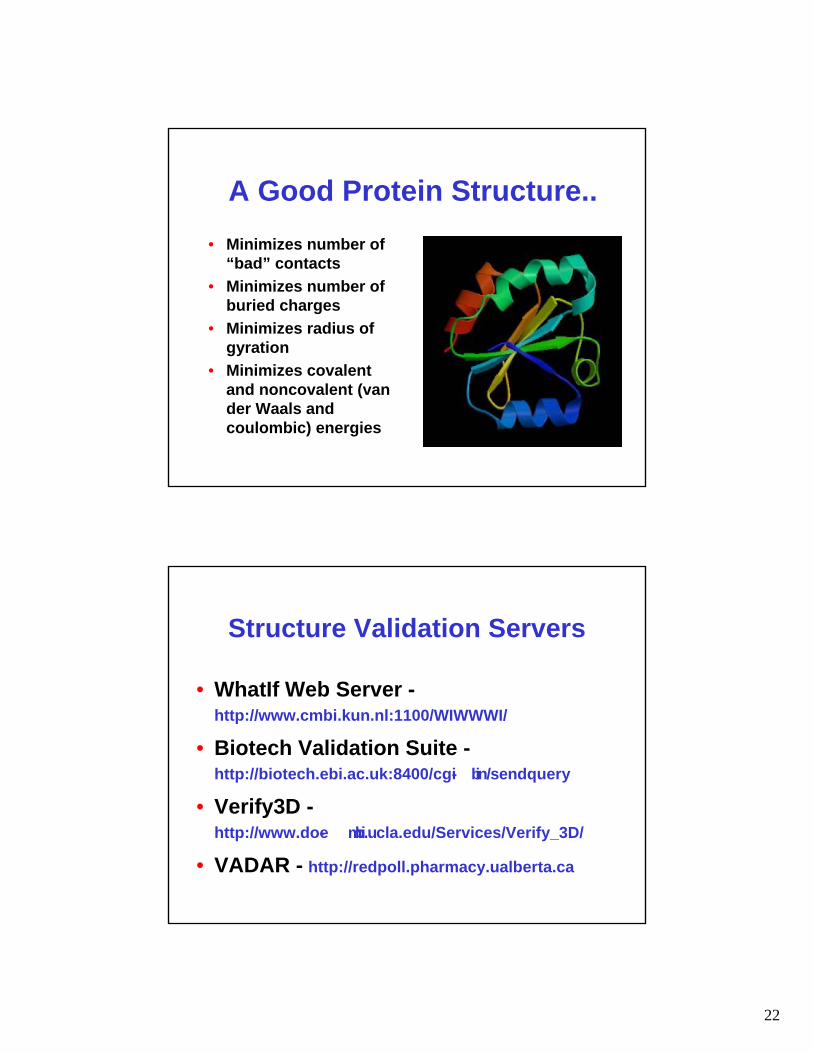
A Good Protein Structure..• Minimizes number of
“bad” contacts• Minimizes number of
buried charges• Minimizes radius of
gyration• Minimizes covalent
and noncovalent (van der Waals and coulombic) energies
Structure Validation Servers
• WhatIf Web Server -http://www.cmbi.kun.nl:1100/WIWWWI/
• Biotech Validation Suite -http://biotech.ebi.ac.uk:8400/cgi- bin/sendquery
• Verify3D -http://www.doe- mbi.ucla.edu/Services/Verify_3D/
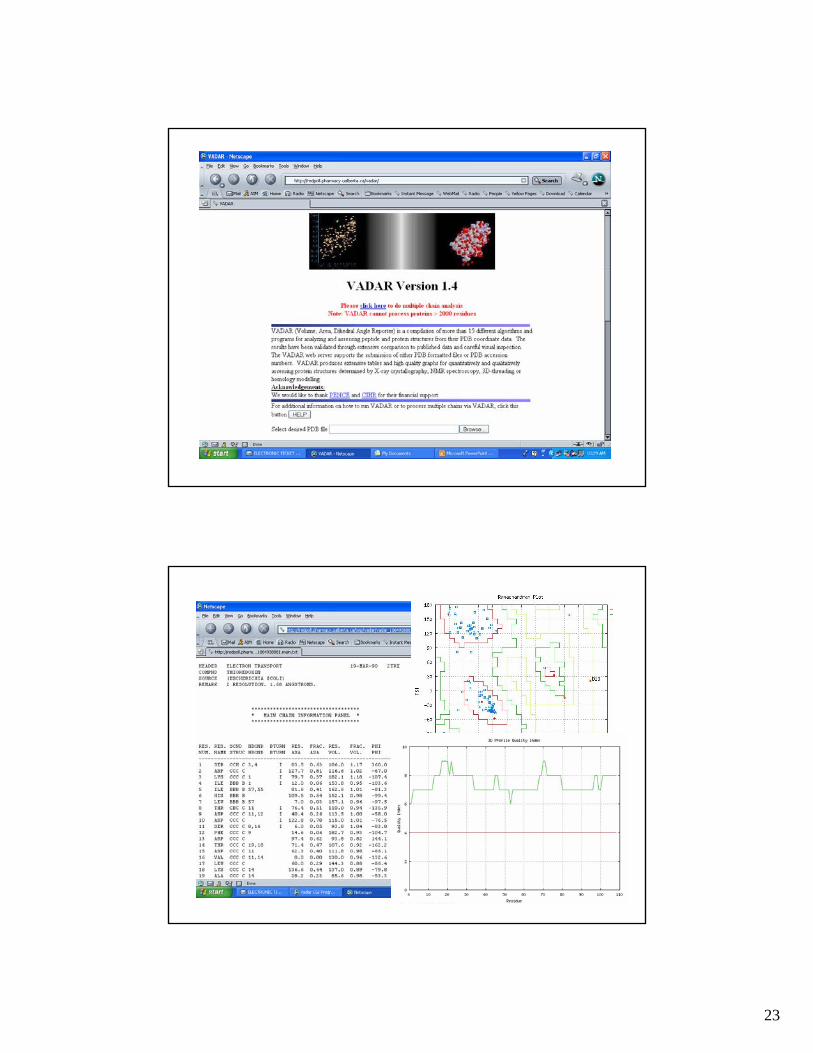
• VADAR - http://redpoll.pharmacy.ualberta.ca
23
24
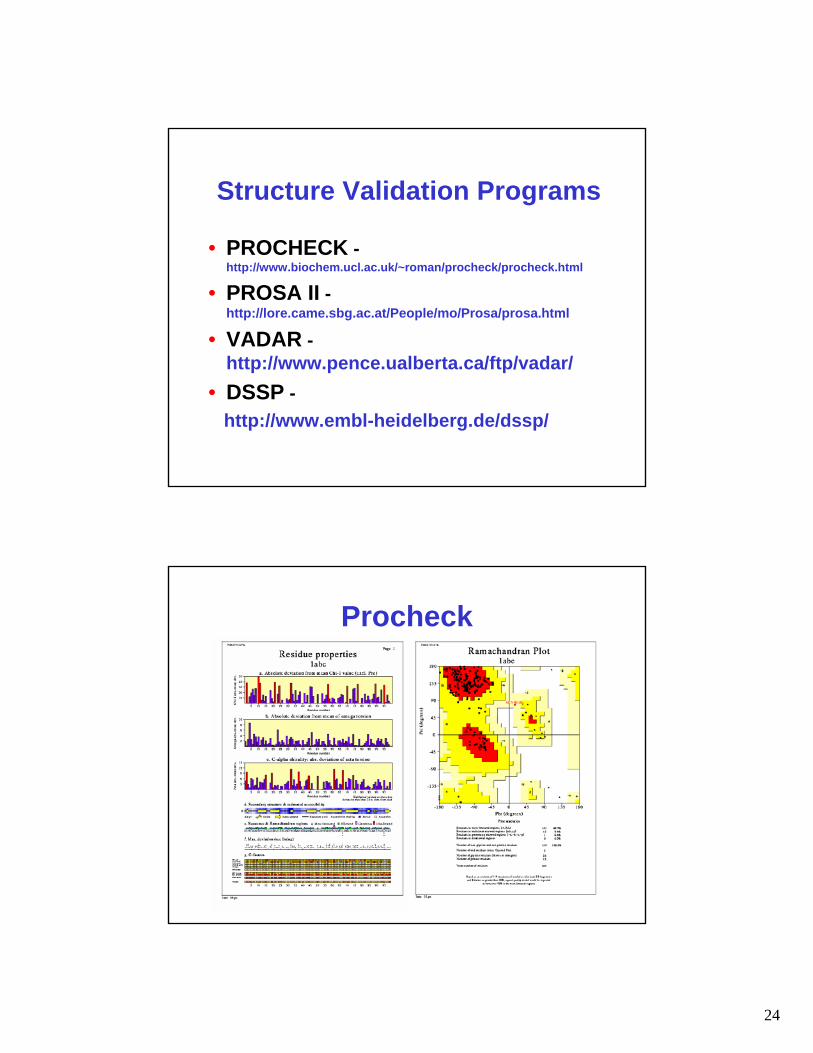
Structure Validation Programs
• PROCHECK -http://www.biochem.ucl.ac.uk/~roman/procheck/procheck.html
• PROSA II -http://lore.came.sbg.ac.at/People/mo/Prosa/prosa.html
• VADAR -http://www.pence.ualberta.ca/ftp/vadar/
• DSSP -http://www.embl-heidelberg.de/dssp/
Procheck
25
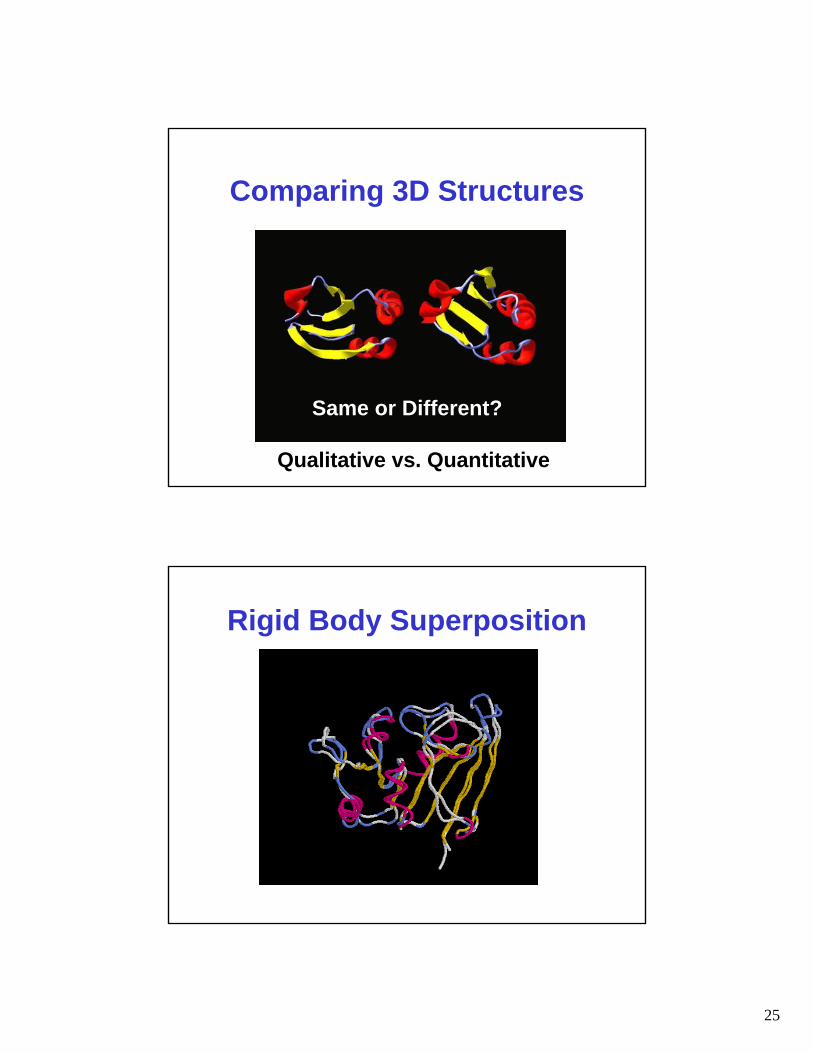
Comparing 3D Structures
Same or Different?
Qualitative vs. Quantitative
Rigid Body Superposition
26
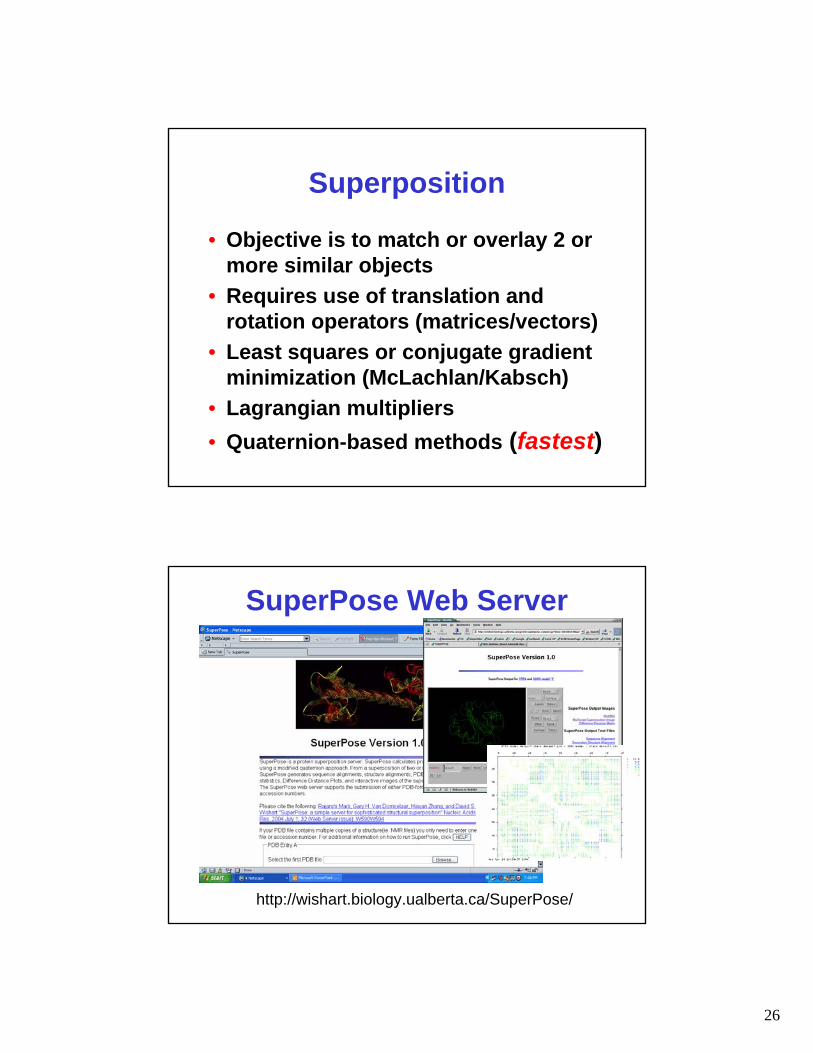
Superposition
• Objective is to match or overlay 2 or more similar objects
• Requires use of translation and rotation operators (matrices/vectors)
• Least squares or conjugate gradient minimization (McLachlan/Kabsch)
• Lagrangian multipliers• Quaternion-based methods (fastest)
SuperPose Web Server
http://wishart.biology.ualberta.ca/SuperPose/
27
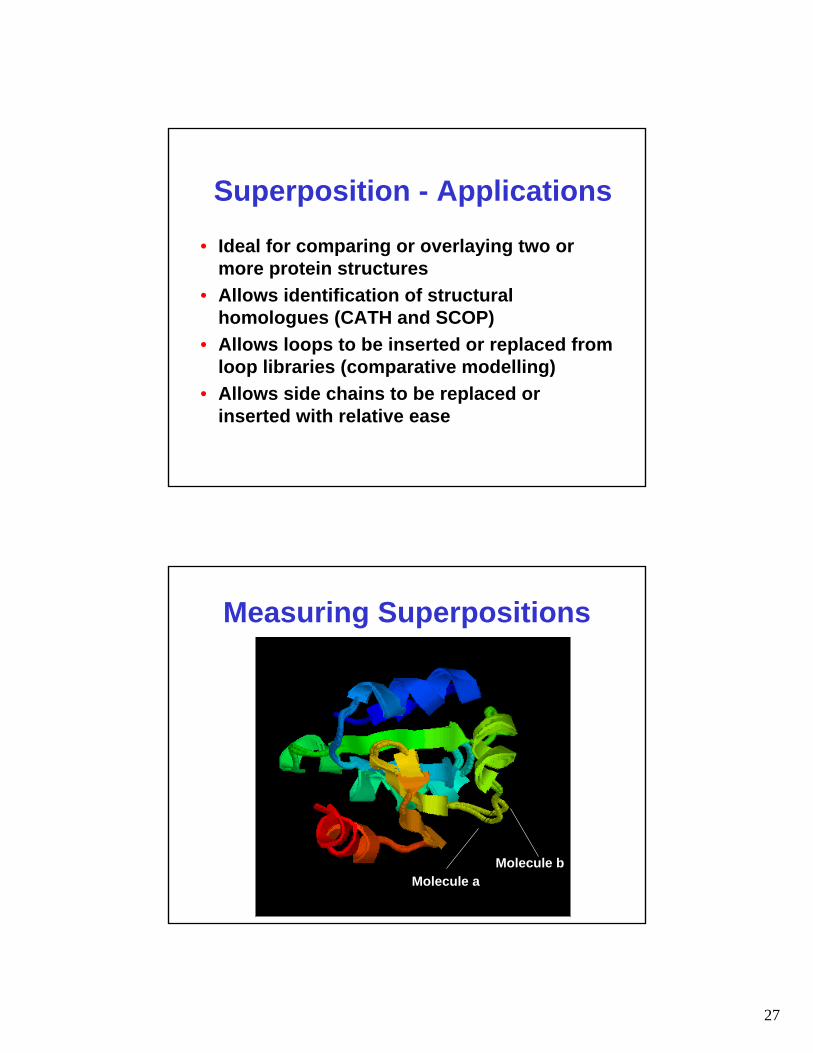
Superposition - Applications
• Ideal for comparing or overlaying two or more protein structures
• Allows identification of structural homologues (CATH and SCOP)
• Allows loops to be inserted or replaced from loop libraries (comparative modelling)
• Allows side chains to be replaced or inserted with relative ease
Molecule aMolecule b
Measuring Superpositions
28
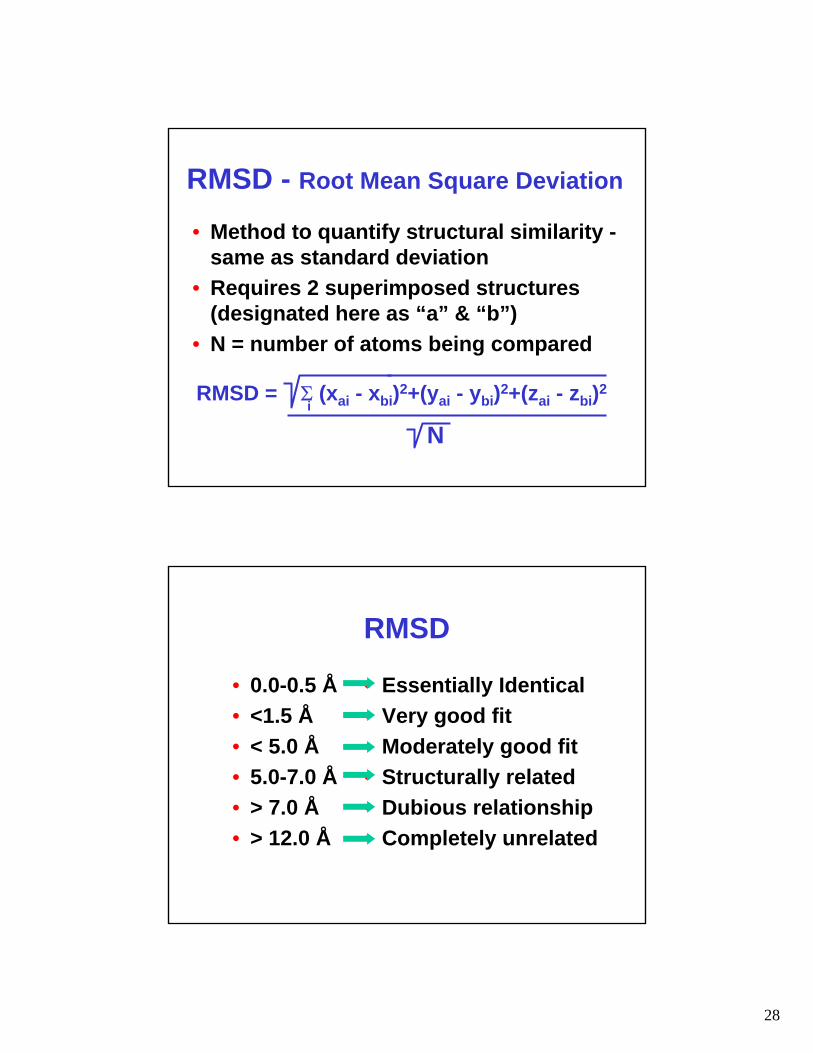
RMSD - Root Mean Square Deviation
• Method to quantify structural similarity -same as standard deviation
• Requires 2 superimposed structures (designated here as “a” & “b”)
• N = number of atoms being compared
RMSD = Σ (xai - xbi)2+(yai - ybi)2+(zai - zbi)2i
N
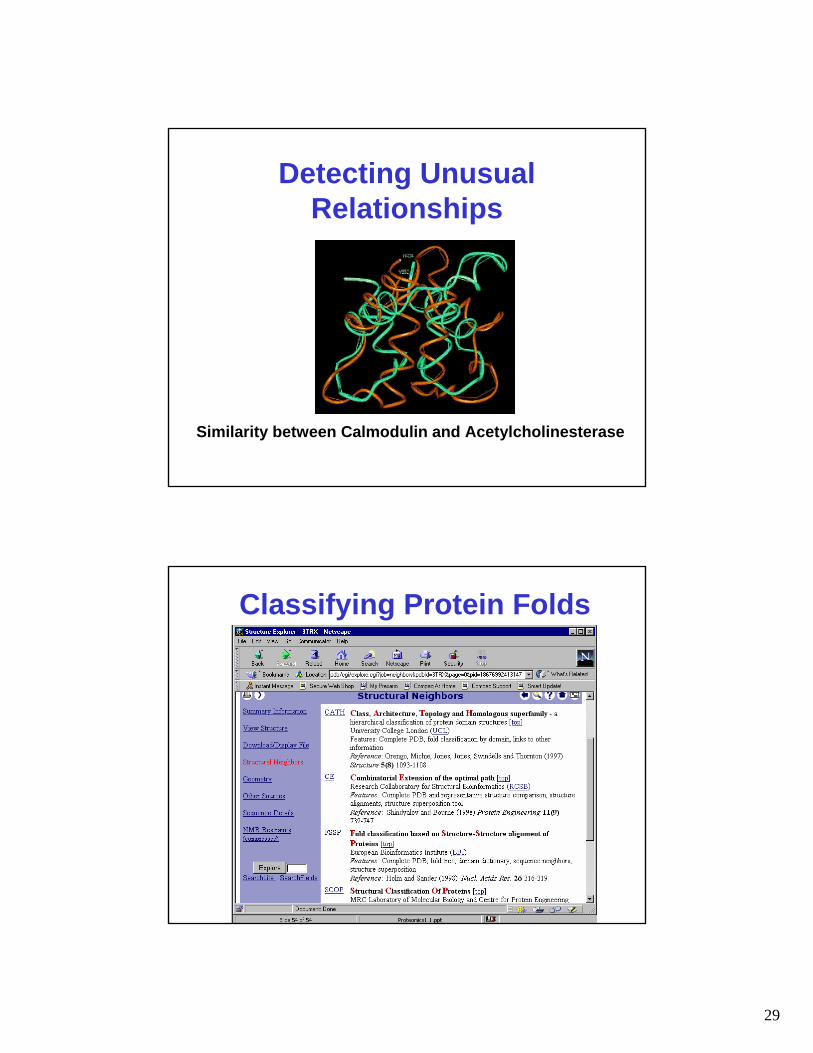
RMSD
• 0.0-0.5 Å• <1.5 Å• < 5.0 Å• 5.0-7.0 Å• > 7.0 Å• > 12.0 Å
• Essentially Identical• Very good fit• Moderately good fit• Structurally related• Dubious relationship• Completely unrelated
29
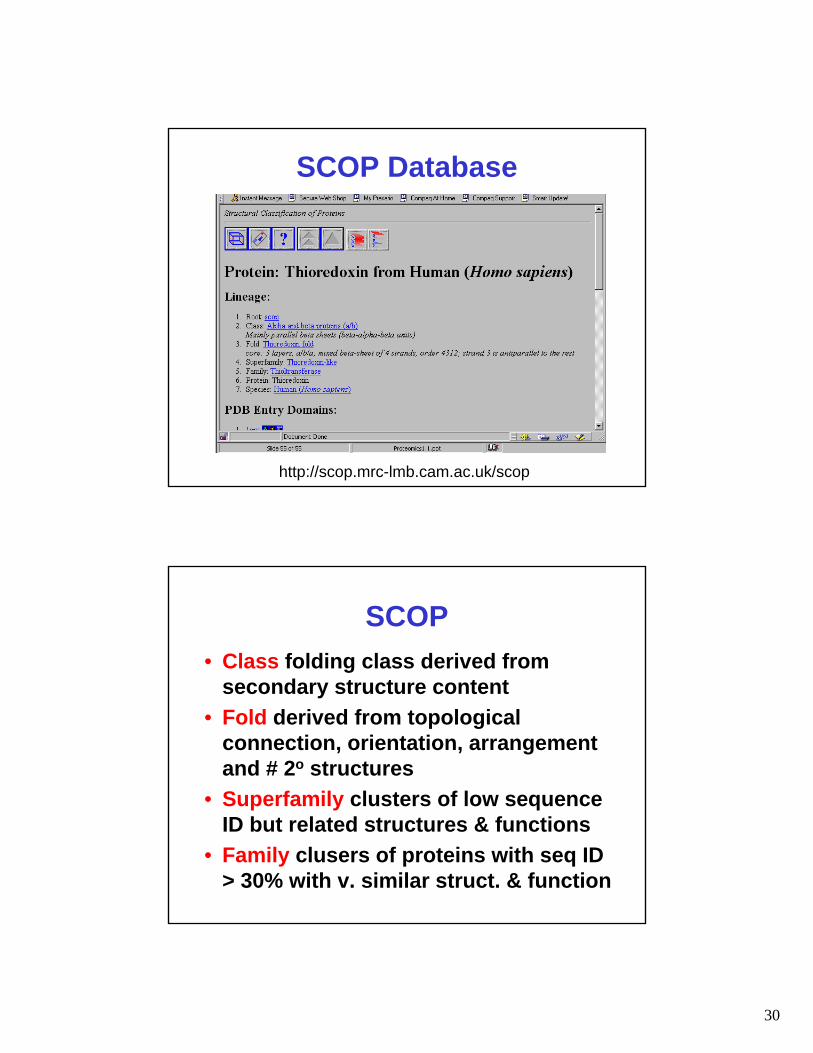
Detecting Unusual Relationships
Similarity between Calmodulin and Acetylcholinesterase
Classifying Protein Folds
30
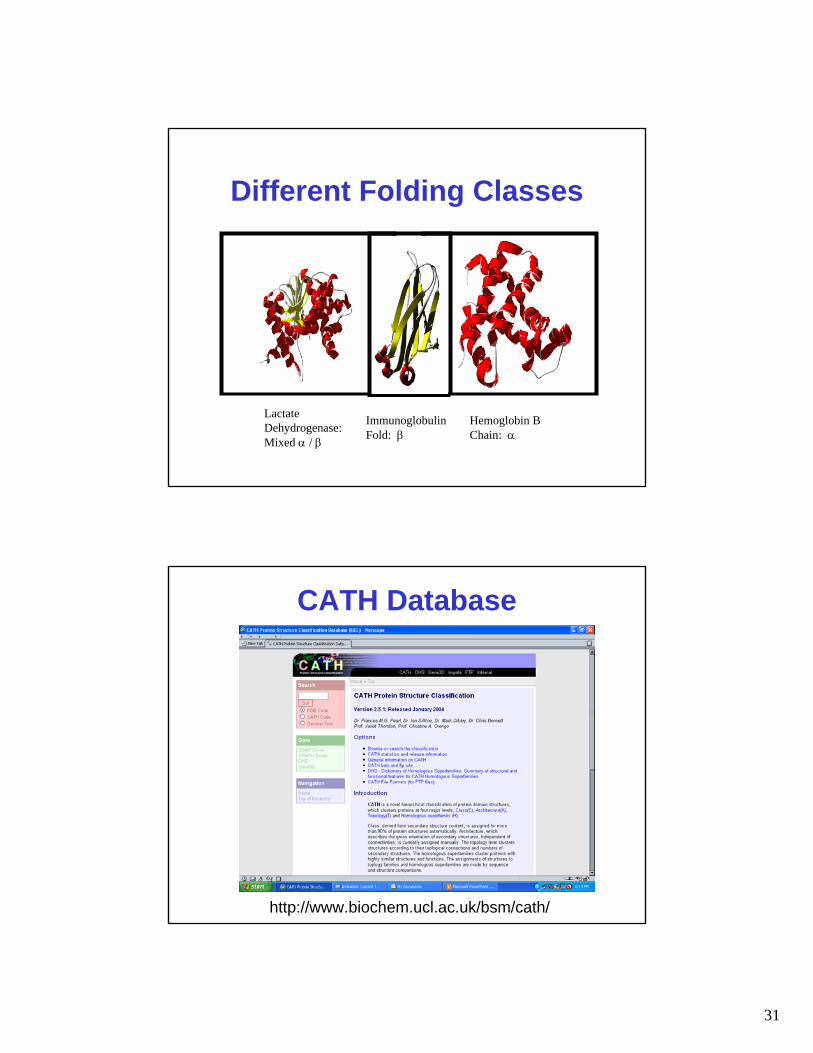
SCOP Database
http://scop.mrc-lmb.cam.ac.uk/scop
SCOP• Class folding class derived from
secondary structure content• Fold derived from topological
connection, orientation, arrangement and # 2o structures
• Superfamily clusters of low sequence ID but related structures & functions
• Family clusers of proteins with seq ID > 30% with v. similar struct. & function
31
Different Folding Classes
Lactate Dehydrogenase: Mixed α / β
Immunoglobulin Fold: β
Hemoglobin B Chain: α
CATH Database
http://www.biochem.ucl.ac.uk/bsm/cath/
32
CATH
• Class [C] derived from secondary structure content (automatic)
• Architecture (A) derived from orientation of 2o structures (manual)
• Topology (T) derived from topological connection and # 2o structures
• Homologous Superfamily (H) clusters of similar structures & functions
Other Servers/Databases
• Dali - http://www.ebi.ac.uk/dali/
• VAST - http://www.ncbi.nlm.nih.gov/Structure/VAST/vast.shtml
• CE - http://cl.sdsc.edu/ce.html
• FSSP - http://www.ebi.ac.uk/dali/fssp/fssp.html
• PDBsum - www.biochem.ucl.ac.uk/bsm/pdbsum/
33
Protein Interactions
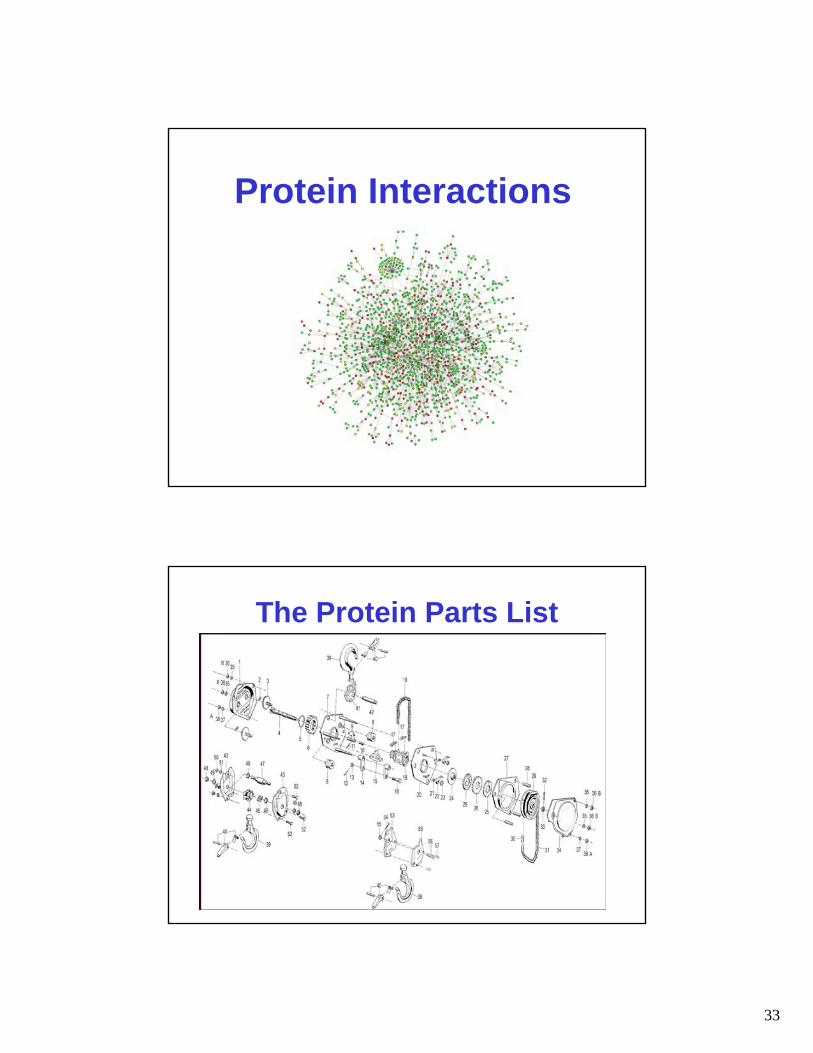
The Protein Parts List
34
The Parts List
• Sequencing gives “serial number”• Sequence alignment gives a name• Microarrays give # of parts• X-ray and NMR give a picture• However, having a collection of parts
and names doesn’t tell you how to put something together or how things connect -- this is biology
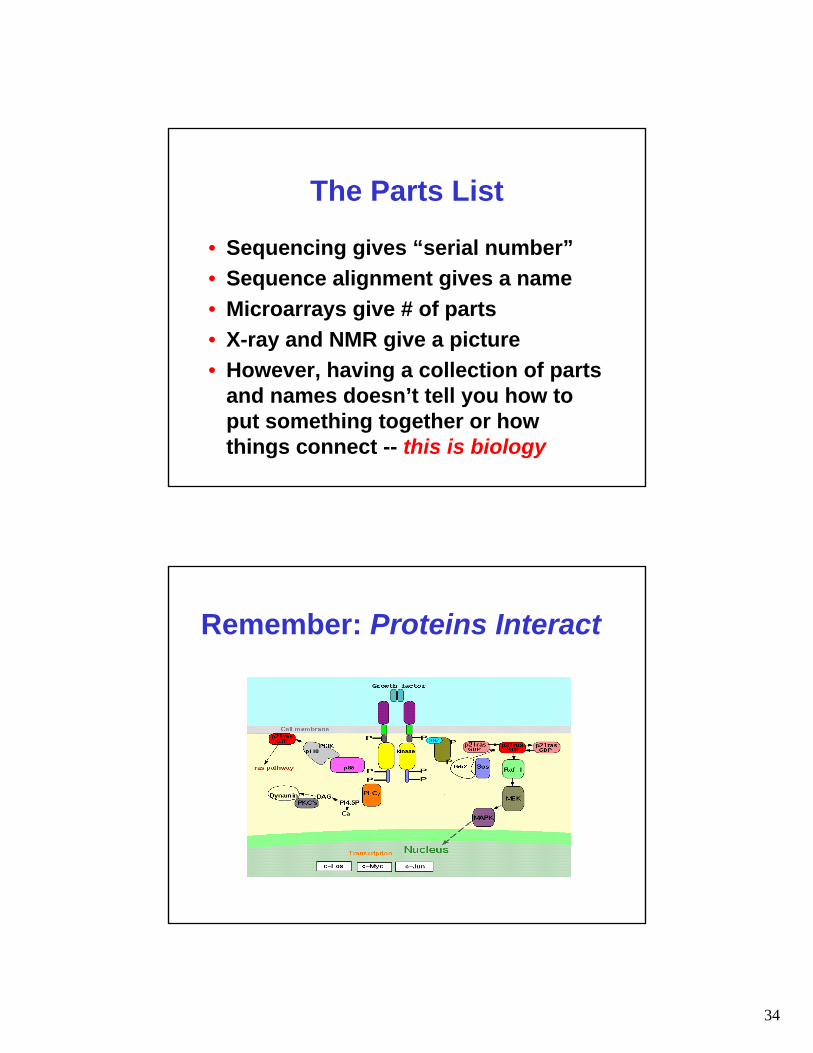
Remember: Proteins Interact
35
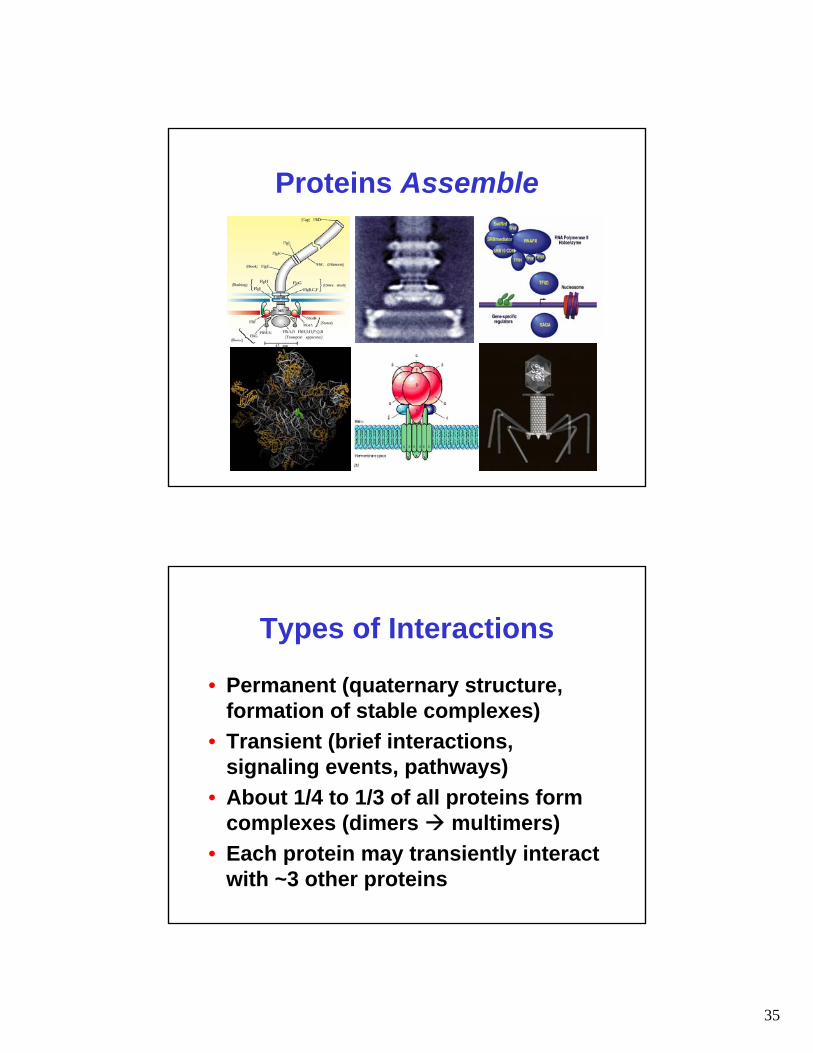
Proteins Assemble
Types of Interactions
• Permanent (quaternary structure, formation of stable complexes)
• Transient (brief interactions, signaling events, pathways)
• About 1/4 to 1/3 of all proteins form complexes (dimers multimers)
• Each protein may transiently interact with ~3 other proteins

36
Protein Interaction Tools and Techniques -
Experimental Methods
3D Structure Determination• X-ray crystallography
– grow crystal– collect diffract. data– calculate e- density– trace chain
• NMR spectroscopy– label protein– collect NMR spectra– assign spectra & NOEs– calculate structure
using distance geom.
37
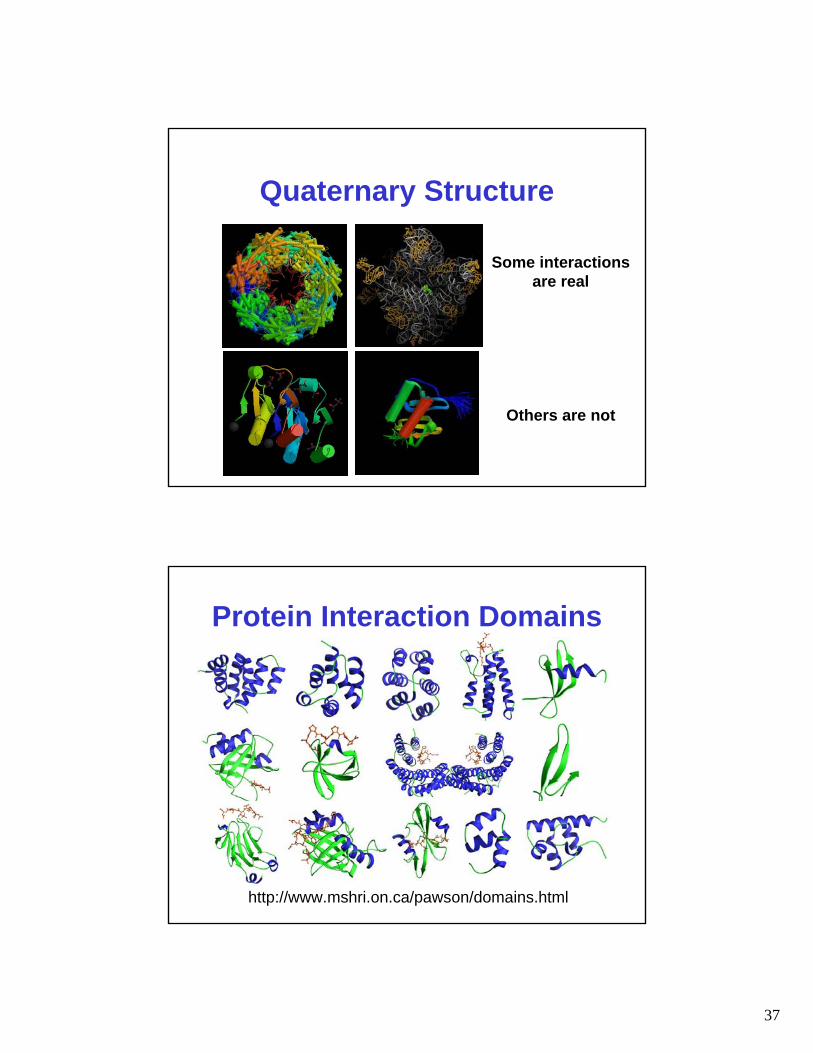
Quaternary Structure
Some interactionsare real
Others are not
Protein Interaction Domains
http://www.mshri.on.ca/pawson/domains.html
38
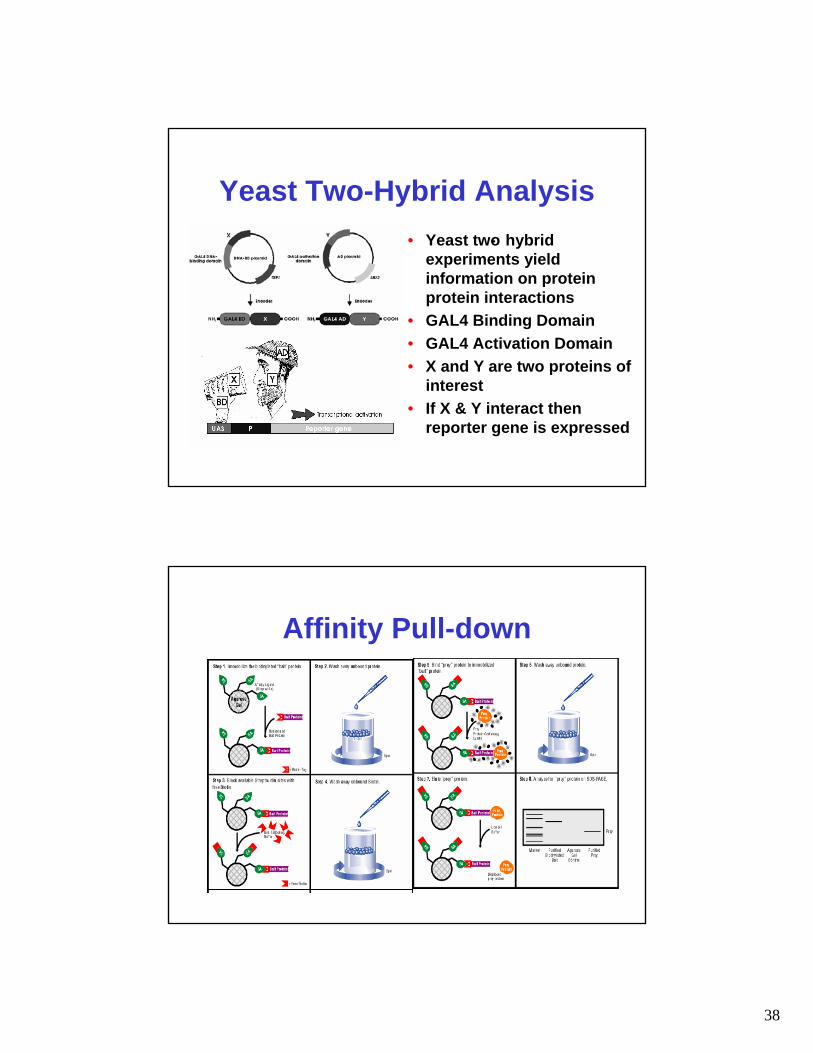
Yeast Two-Hybrid Analysis• Yeast two- hybrid
experiments yield information on protein protein interactions
• GAL4 Binding Domain• GAL4 Activation Domain• X and Y are two proteins of
interest• If X & Y interact then
reporter gene is expressed
Affinity Pull-down
39
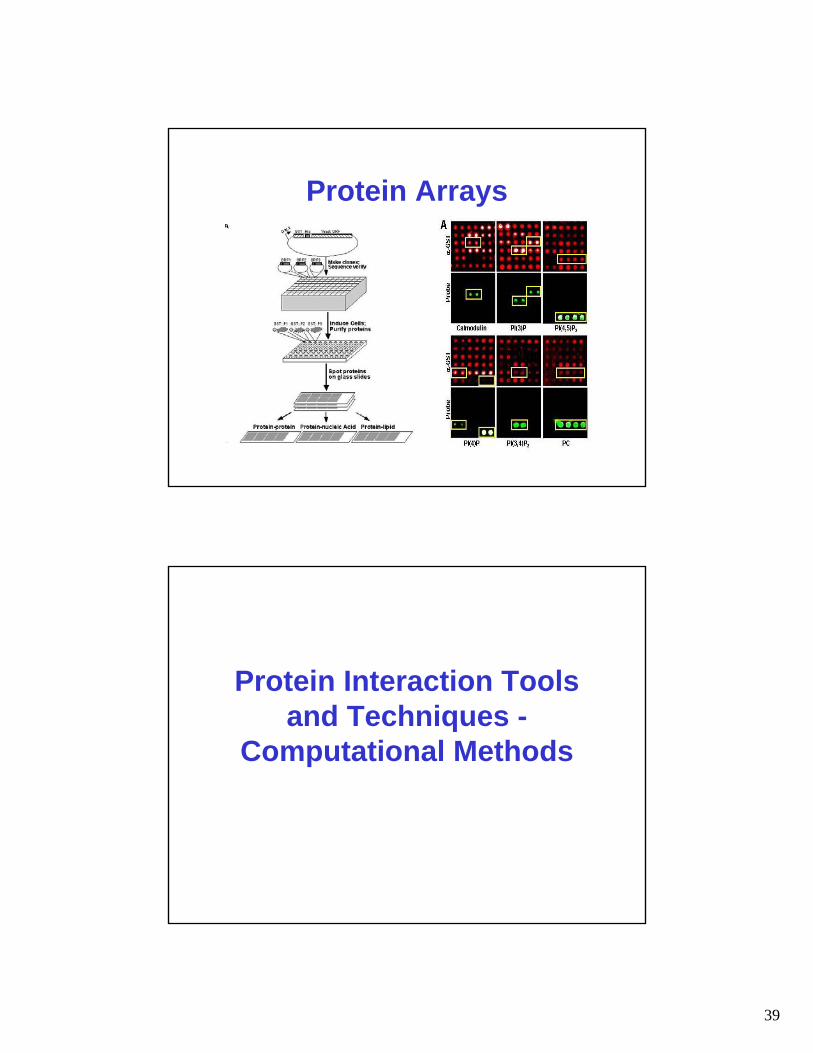
Protein Arrays
Protein Interaction Tools and Techniques -
Computational Methods
40
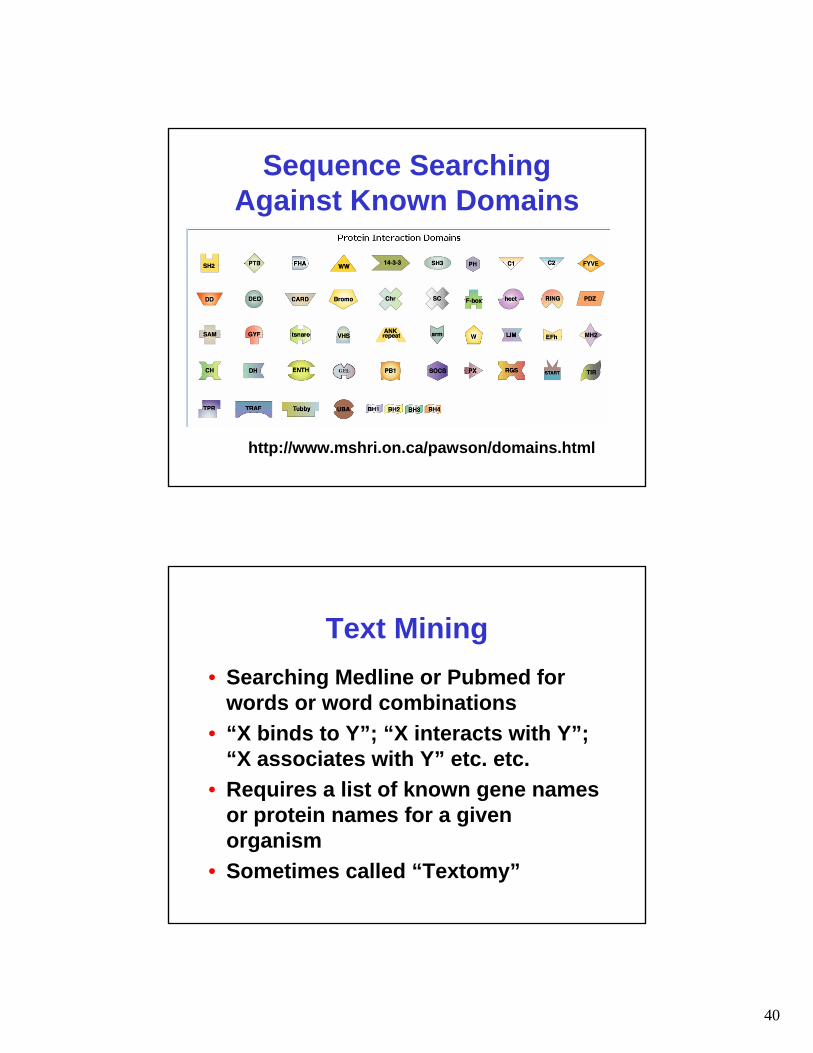
Sequence Searching Against Known Domains
http://www.mshri.on.ca/pawson/domains.html
Text Mining• Searching Medline or Pubmed for
words or word combinations• “X binds to Y”; “X interacts with Y”;
“X associates with Y” etc. etc.• Requires a list of known gene names
or protein names for a given organism
• Sometimes called “Textomy”
41
http://textomy.iit.nrc.ca/
Pre-BIND• Donaldson et al. BMC Bioinformatics 2003 4:11
• Used Support Vector Machine (SVM) to scan literature for protein interactions
• Precision, accuracy and recall of 92% for correctly classifying PI abstracts
• Estimated to capture 60% of all abstracted protein interactions for a given organism
42
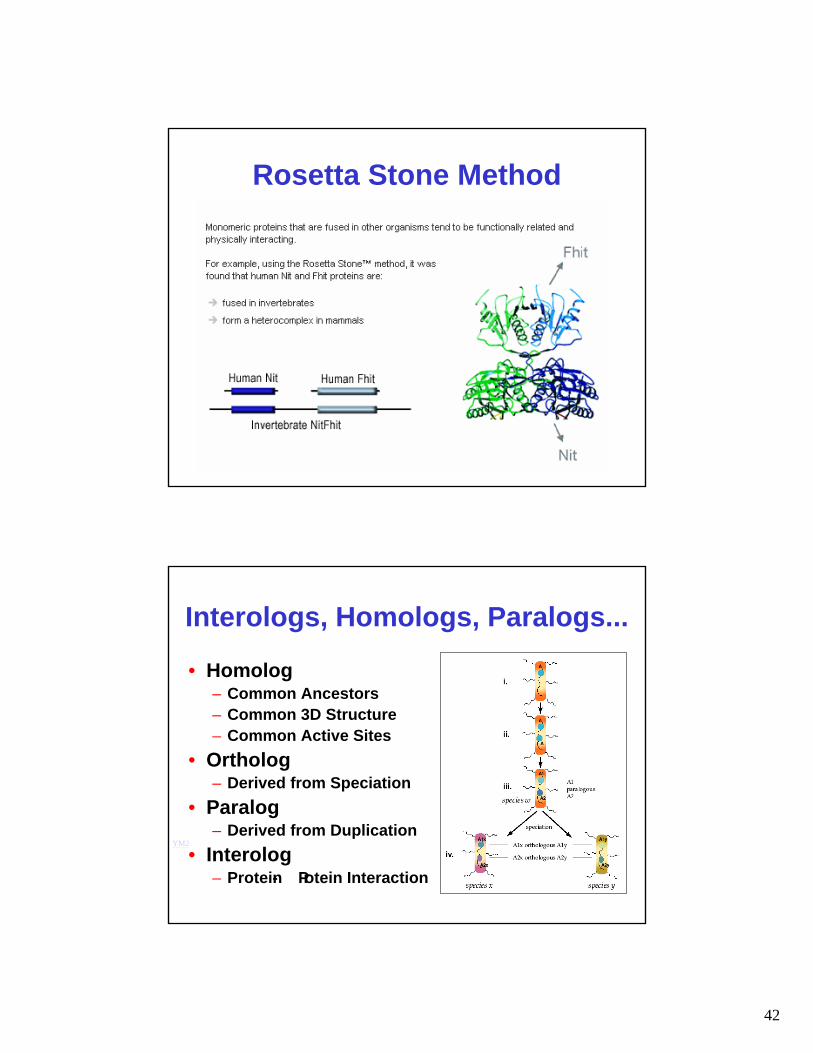
Rosetta Stone Method
Interologs, Homologs, Paralogs...
• Homolog– Common Ancestors– Common 3D Structure– Common Active Sites
• Ortholog– Derived from Speciation
• Paralog– Derived from Duplication
• Interolog– Protein- Protein Interaction
YM2
43
A Flood of Data• High throughput techniques are
leading to more and more data on protein interactions
• Very high level of false positives –need tools to sort and rationalize
• This is where bioinformatics can play a key role
• Some suggest that this is the “future” for bioinformatics
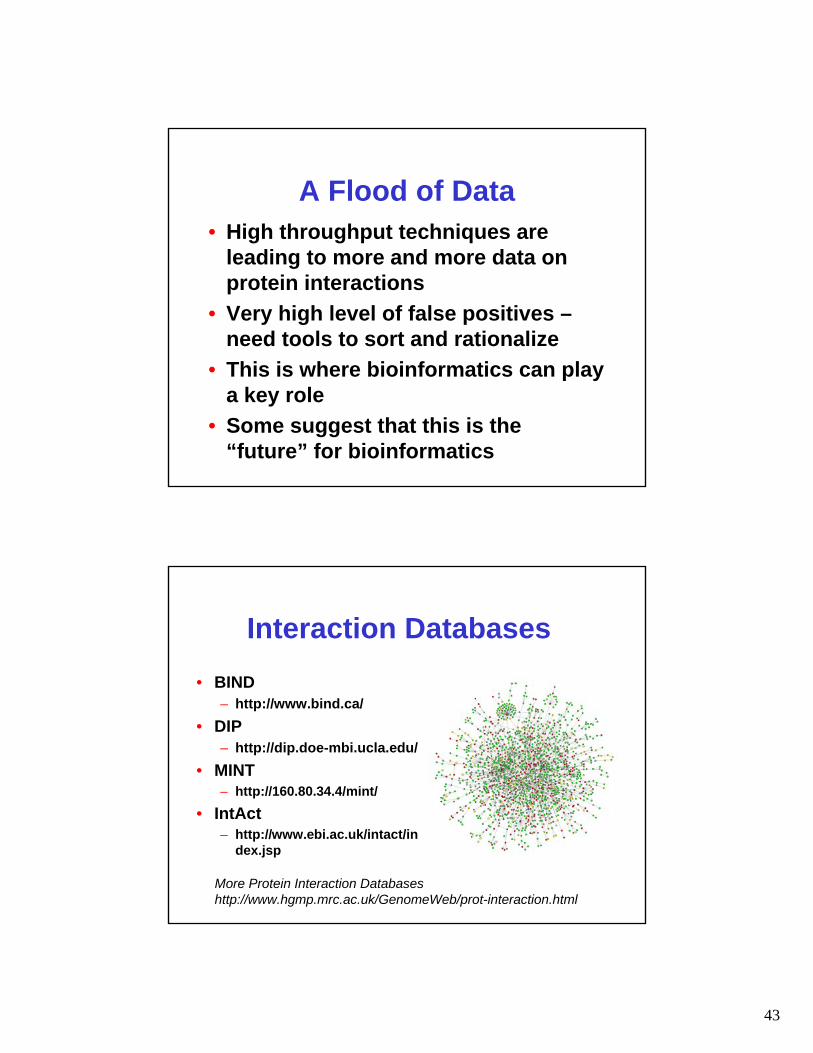
Interaction Databases• BIND
– http://www.bind.ca/• DIP
– http://dip.doe-mbi.ucla.edu/• MINT
– http://160.80.34.4/mint/
• IntAct– http://www.ebi.ac.uk/intact/in
dex.jsp
More Protein Interaction Databaseshttp://www.hgmp.mrc.ac.uk/GenomeWeb/prot-interaction.html
44
The BIND Database• BIND - Biomolecular Interaction Network
Database• Designed to capture almost all
interactions between biomolecules (large and small)
• Largest database of its kind -- 135,000 interactions recorded to date
BIND Can Encode...• Simple binary interactions• Enzymes, substrates and
conformational changes• Restriction enzymes• Limited proteolysis• Phosphorylation (reversible)• Glycosylation• Intron splicing• Transcriptional factors
45
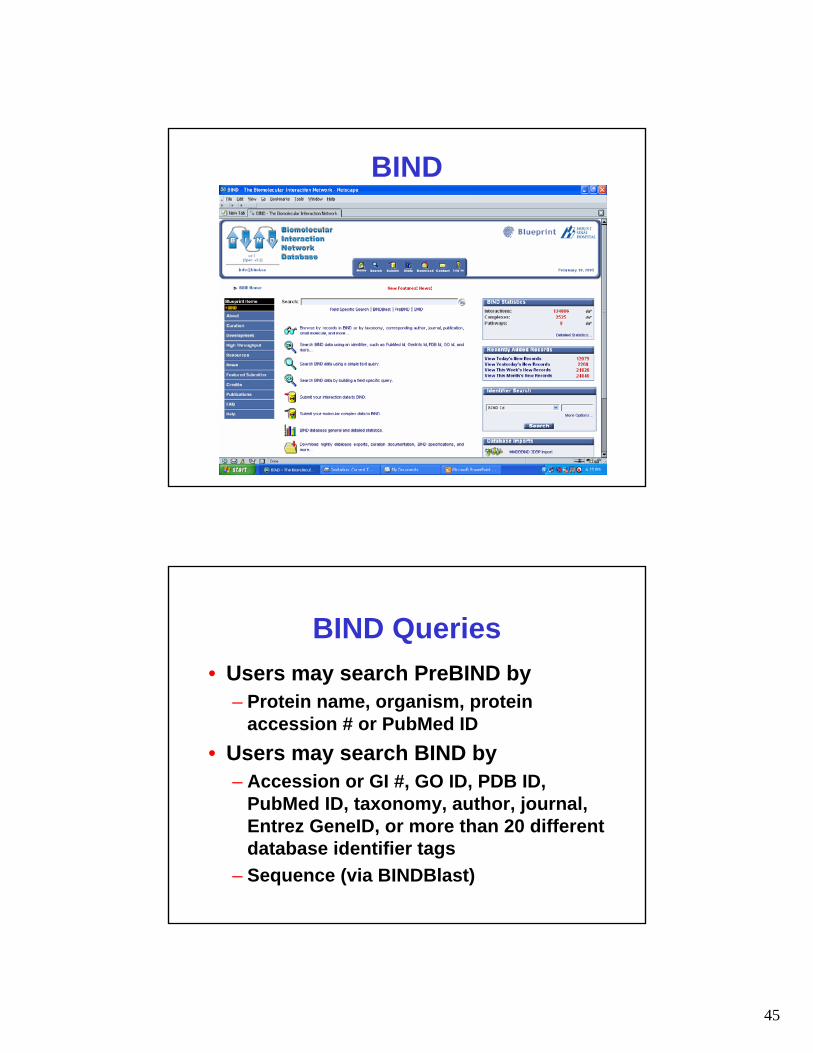
BIND
BIND Queries• Users may search PreBIND by
– Protein name, organism, protein accession # or PubMed ID
• Users may search BIND by– Accession or GI #, GO ID, PDB ID,
PubMed ID, taxonomy, author, journal, Entrez GeneID, or more than 20 different database identifier tags
– Sequence (via BINDBlast)
46
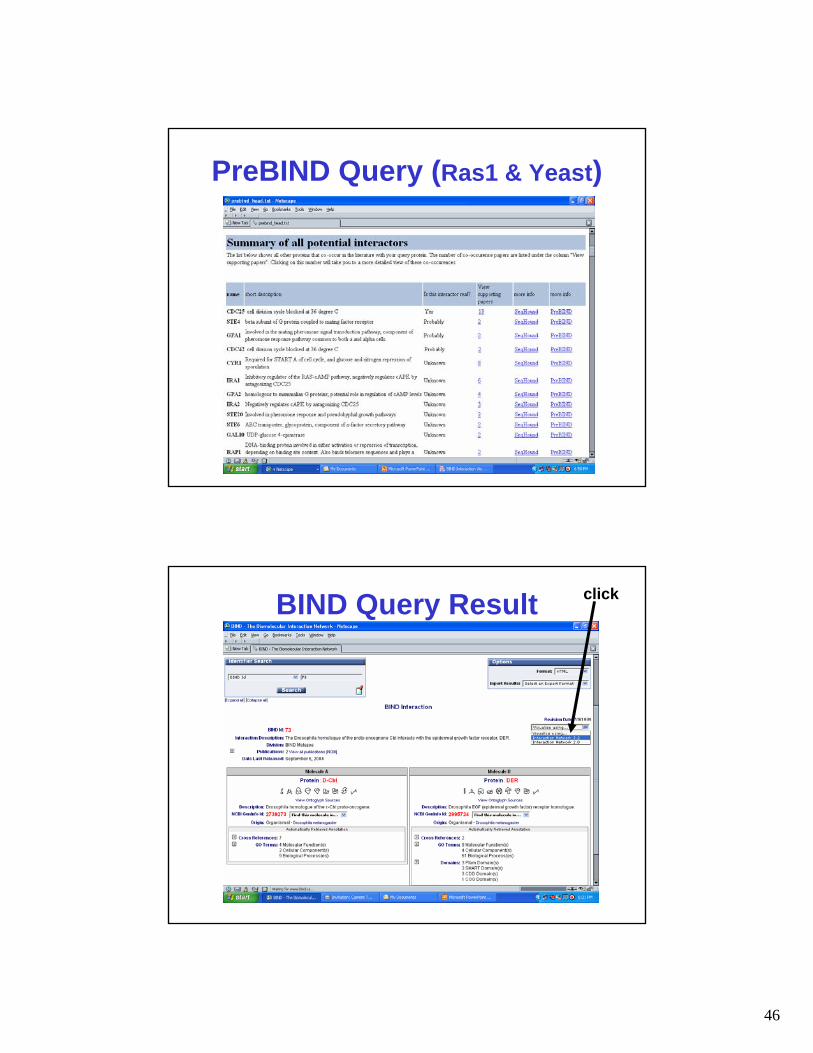
PreBIND Query (Ras1 & Yeast)
BIND Query Result click
47
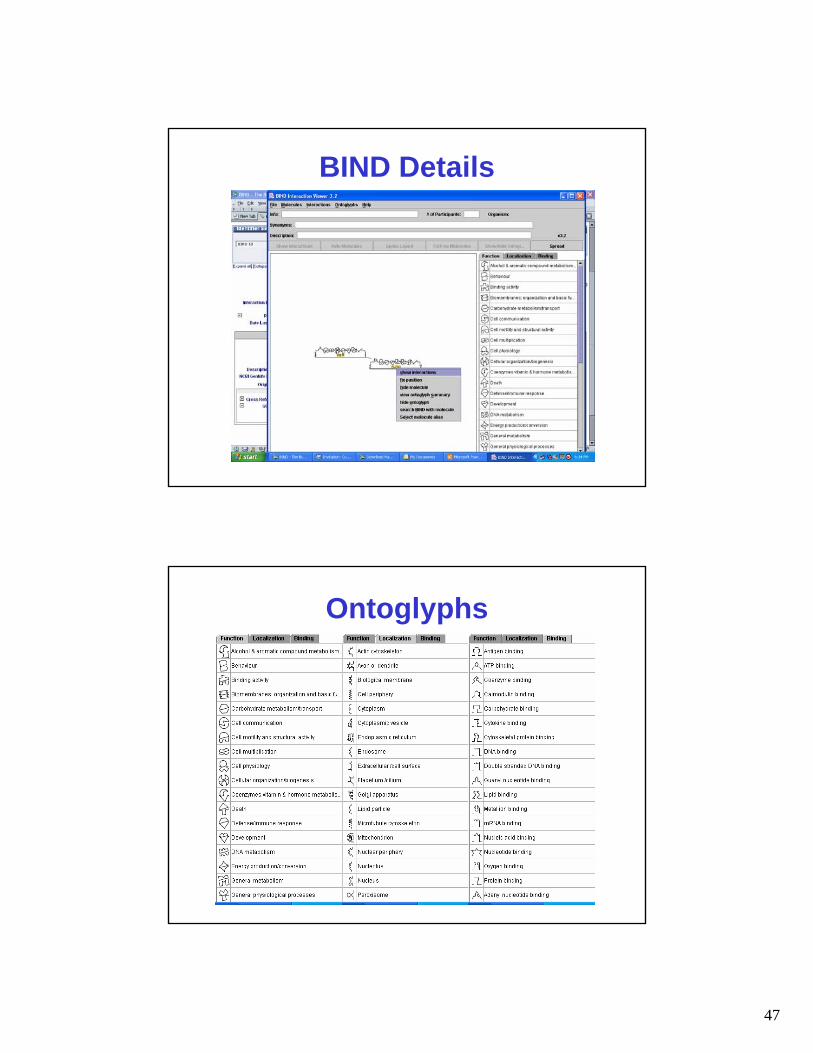
BIND Details
Ontoglyphs
48
Summary• First application of bioinformatics
was probably in protein structure (the PDB)
• Structural biology continues to be a rich source for bioinformatics innovation and bioinformaticians
• Next “big” step in bioinformatics is to go from the “parts list” to figuring out how to put it all together