Embed Size (px)
Citation preview
IMAGE HERE
Hi-Tech Pipes LimitedProviding Innovative Solutions
Investor Presentation – Q1FY22
July 2021
2
This presentation and the accompanying slides (the “Presentation”), which have been prepared by Hitech Pipes Ltd. (the “Company”), have been prepared solely for information
purposes and do not constitute any offer, recommendation or invitation to purchase or subscribe for any securities, and shall not form the basis or be relied on in connection with
any contract or binding commitment whatsoever. No offering of securities of the Company will be made except by means of a statutory offering document containing detailed
information about the Company.
This Presentation has been prepared by the Company based on information and data which the Company considers reliable, but the Company makes no representation or warranty,
express or implied, whatsoever, and no reliance shall be placed on, the truth, accuracy, completeness, fairness and reasonableness of the contents of this Presentation. This
Presentation may not be all inclusive and may not contain all of the information that you may consider material. Any liability in respect of the contents of, or any omission from, this
Presentation is expressly excluded.
This presentation contains certain forward-looking statements concerning the Company’s future business prospects and business profitability, which are subject to a number of risks
and uncertainties and the actual results could materially differ from those in such forward-looking statements. The risks and uncertainties relating to these statements include, but
are not limited to, risks and uncertainties regarding fluctuations in earnings, our ability to manage growth, competition (both domestic and international), economic growth in India
and abroad, ability to attract and retain highly skilled professionals, time and cost over runs on contracts, our ability to manage our international operations, government policies
and actions regulations, interest and other fiscal costs generally prevailing in the economy. The Company does not undertake to make any announcement in case any of these
forward-looking statements become materially incorrect in future or update any forward-looking statements made from time to time by or on behalf of the Company
Disclaimer
Q1FY22 Highlights
4
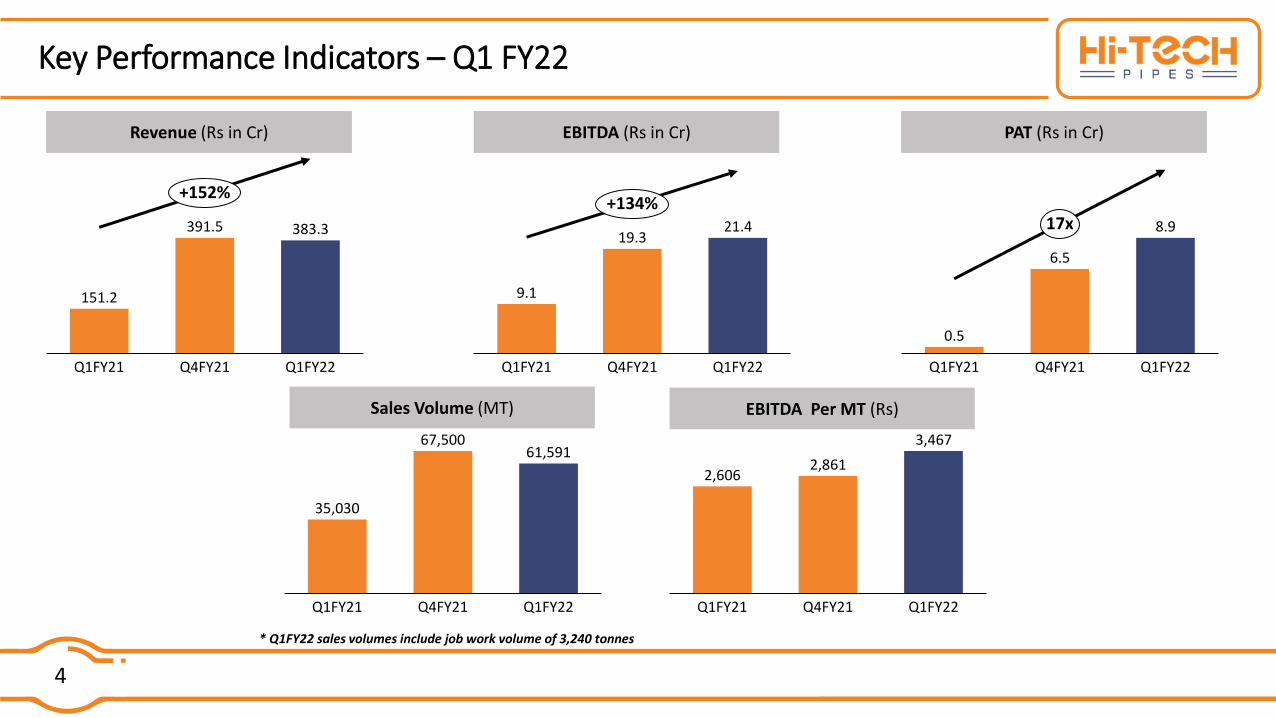
Key Performance Indicators – Q1 FY22
Revenue (Rs in Cr) PAT (Rs in Cr)EBITDA (Rs in Cr)Revenue (Rs in Cr) PAT (Rs in Cr)EBITDA (Rs in Cr)
Sales Volume (MT) EBITDA Per MT (Rs)
151.2
391.5 383.3
Q1FY21 Q4FY21 Q1FY22
+152%
9.1
19.321.4
Q4FY21Q1FY21 Q1FY22
+134%
0.5
6.5
8.9
Q4FY21Q1FY21 Q1FY22
17x
35,030
67,50061,591
Q4FY21Q1FY21 Q1FY22
2,6062,861
3,467
Q1FY22Q1FY21 Q4FY21
* Q1FY22 sales volumes include job work volume of 3,240 tonnes
5
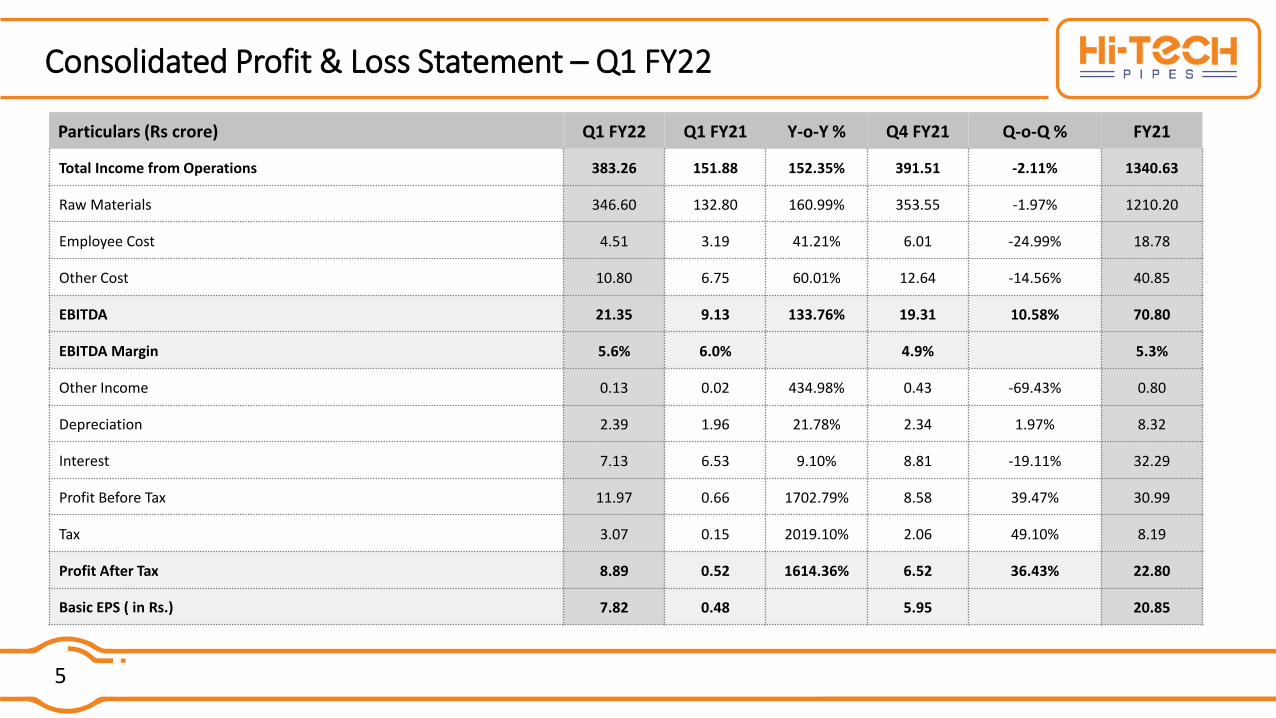
Consolidated Profit & Loss Statement – Q1 FY22
Particulars (Rs crore) Q1 FY22 Q1 FY21 Y-o-Y % Q4 FY21 Q-o-Q % FY21
Total Income from Operations 383.26 151.88 152.35% 391.51 -2.11% 1340.63
Raw Materials 346.60 132.80 160.99% 353.55 -1.97% 1210.20
Employee Cost 4.51 3.19 41.21% 6.01 -24.99% 18.78
Other Cost 10.80 6.75 60.01% 12.64 -14.56% 40.85
EBITDA 21.35 9.13 133.76% 19.31 10.58% 70.80
EBITDA Margin 5.6% 6.0% 4.9% 5.3%
Other Income 0.13 0.02 434.98% 0.43 -69.43% 0.80
Depreciation 2.39 1.96 21.78% 2.34 1.97% 8.32
Interest 7.13 6.53 9.10% 8.81 -19.11% 32.29
Profit Before Tax 11.97 0.66 1702.79% 8.58 39.47% 30.99
Tax 3.07 0.15 2019.10% 2.06 49.10% 8.19
Profit After Tax 8.89 0.52 1614.36% 6.52 36.43% 22.80
Basic EPS ( in Rs.) 7.82 0.48 5.95 20.85
6
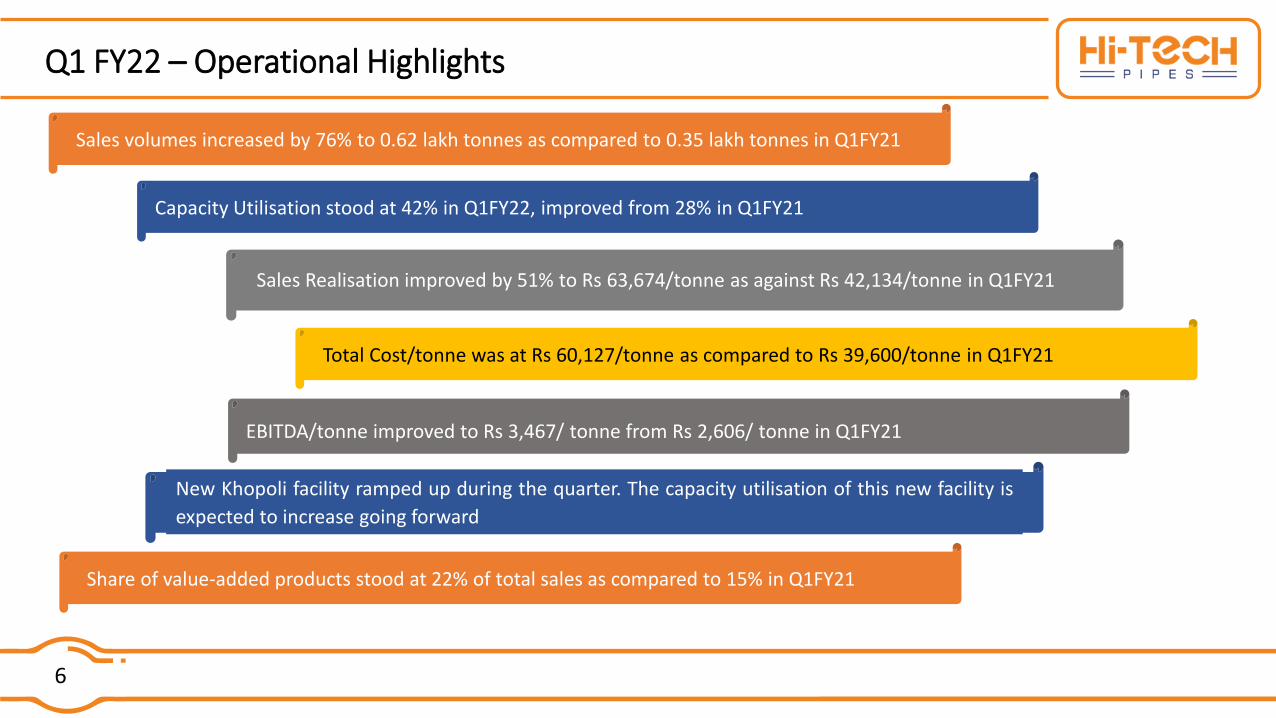
Q1 FY22 – Operational Highlights
Share of value-added products stood at 22% of total sales as compared to 15% in Q1FY21
Capacity Utilisation stood at 42% in Q1FY22, improved from 28% in Q1FY21
Sales Realisation improved by 51% to Rs 63,674/tonne as against Rs 42,134/tonne in Q1FY21
Total Cost/tonne was at Rs 60,127/tonne as compared to Rs 39,600/tonne in Q1FY21
EBITDA/tonne improved to Rs 3,467/ tonne from Rs 2,606/ tonne in Q1FY21
New Khopoli facility ramped up during the quarter. The capacity utilisation of this new facility is
expected to increase going forward
Sales volumes increased by 76% to 0.62 lakh tonnes as compared to 0.35 lakh tonnes in Q1FY21
CompanyOverview
8
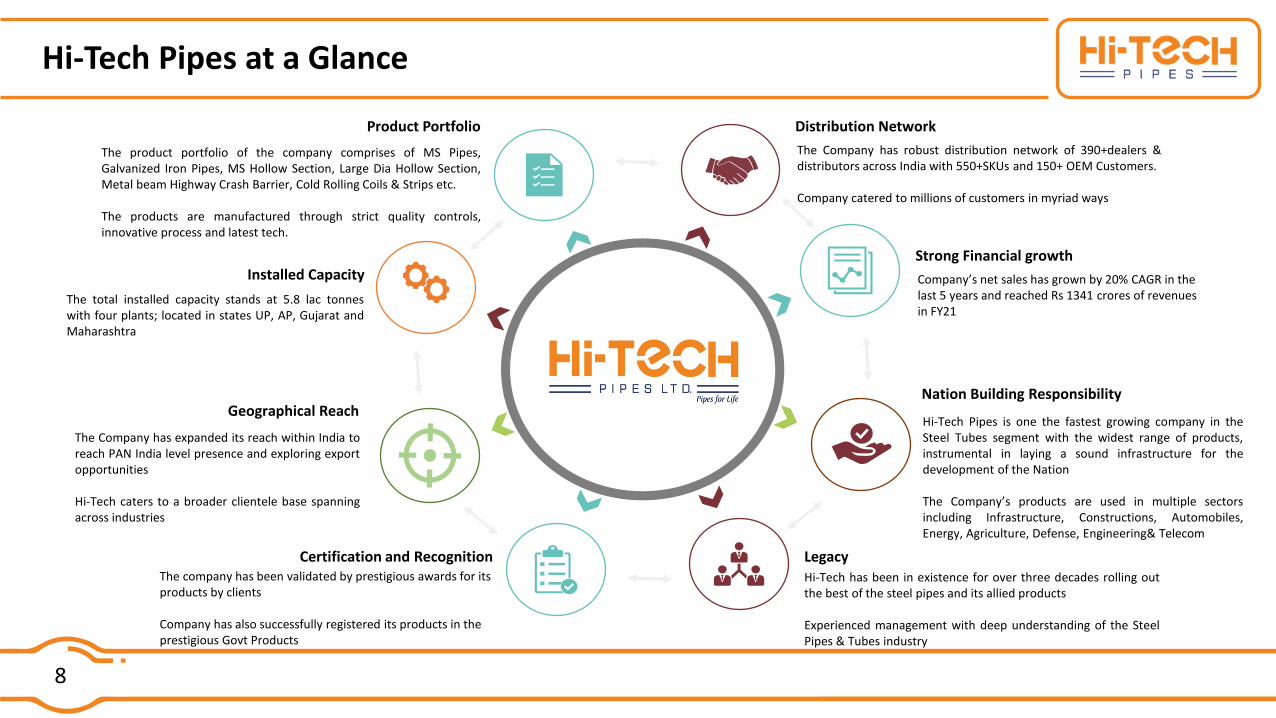
Hi-Tech Pipes at a Glance
Distribution Network
The Company has robust distribution network of 390+dealers &distributors across India with 550+SKUs and 150+ OEM Customers.
Company catered to millions of customers in myriad ways
Geographical Reach
The Company has expanded its reach within India toreach PAN India level presence and exploring exportopportunities
Hi-Tech caters to a broader clientele base spanningacross industries
Nation Building Responsibility
Hi-Tech Pipes is one the fastest growing company in theSteel Tubes segment with the widest range of products,instrumental in laying a sound infrastructure for thedevelopment of the Nation
The Company’s products are used in multiple sectorsincluding Infrastructure, Constructions, Automobiles,Energy, Agriculture, Defense, Engineering& Telecom
LegacyHi-Tech has been in existence for over three decades rolling outthe best of the steel pipes and its allied products
Experienced management with deep understanding of the SteelPipes & Tubes industry
Certification and RecognitionThe company has been validated by prestigious awards for its products by clients
Company has also successfully registered its products in the prestigious Govt Products
Strong Financial growth
Company’s net sales has grown by 20% CAGR in the last 5 years and reached Rs 1341 crores of revenues in FY21
Installed Capacity
The total installed capacity stands at 5.8 lac tonneswith four plants; located in states UP, AP, Gujarat andMaharashtra
Product Portfolio
The product portfolio of the company comprises of MS Pipes,Galvanized Iron Pipes, MS Hollow Section, Large Dia Hollow Section,Metal beam Highway Crash Barrier, Cold Rolling Coils & Strips etc.
The products are manufactured through strict quality controls,innovative process and latest tech.
9
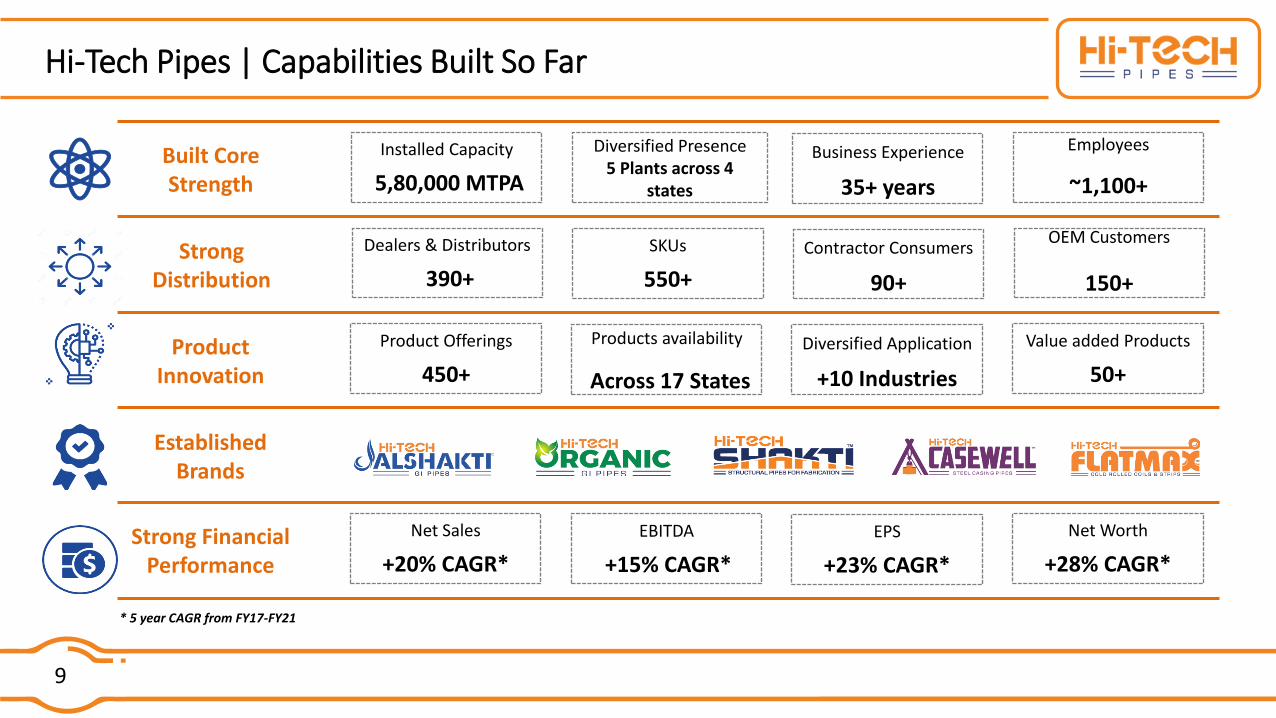
Hi-Tech Pipes | Capabilities Built So Far
Installed Capacity
5,80,000 MTPA
Diversified Presence5 Plants across 4
states
Business Experience
35+ years
Dealers & Distributors
390+
SKUs
550+
Contractor Consumers
90+
OEM Customers
150+
Product Innovation
Product Offerings
450+
Products availability
Across 17 States
Value added Products
50+
Established Brands
Strong Financial Performance
Net Worth
+28% CAGR*
* 5 year CAGR from FY17-FY21
Built Core Strength
Strong Distribution
Diversified Application
+10 Industries
Net Sales
+20% CAGR*
EBITDA
+15% CAGR*
EPS
+23% CAGR*
Employees
~1,100+
10
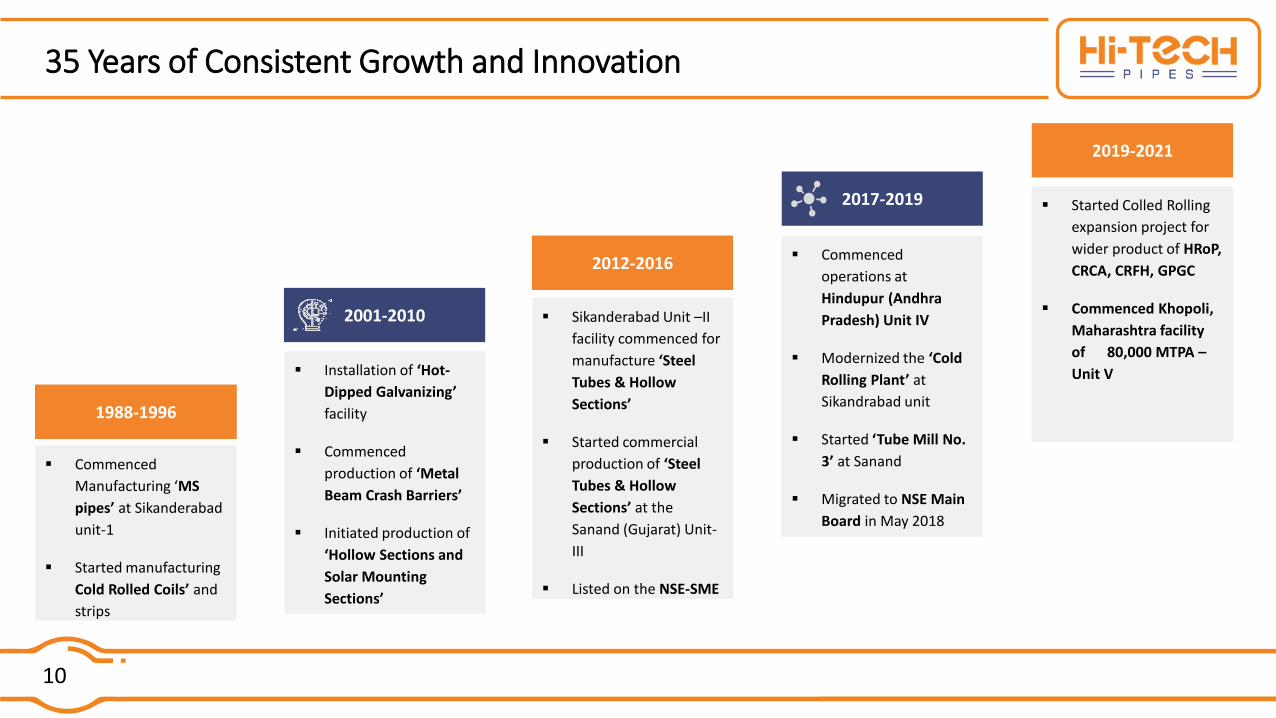
35 Years of Consistent Growth and Innovation
1988-1996
▪ Commenced
Manufacturing ‘MS
pipes’ at Sikanderabad
unit-1
▪ Started manufacturing
Cold Rolled Coils’ and
strips
2001-2010
▪ Installation of ‘Hot-
Dipped Galvanizing’
facility
▪ Commenced
production of ‘Metal
Beam Crash Barriers’
▪ Initiated production of
‘Hollow Sections and
Solar Mounting
Sections’
2012-2016
▪ Sikanderabad Unit –II
facility commenced for
manufacture ‘Steel
Tubes & Hollow
Sections’
▪ Started commercial
production of ‘Steel
Tubes & Hollow
Sections’ at the
Sanand (Gujarat) Unit-
III
▪ Listed on the NSE-SME
2017-2019
▪ Commenced
operations at
Hindupur (Andhra
Pradesh) Unit IV
▪ Modernized the ‘Cold
Rolling Plant’ at
Sikandrabad unit
▪ Started ‘Tube Mill No.
3’ at Sanand
▪ Migrated to NSE Main
Board in May 2018
2019-2021
▪ Started Colled Rolling
expansion project for
wider product of HRoP,
CRCA, CRFH, GPGC
▪ Commenced Khopoli,
Maharashtra facility
of 80,000 MTPA –
Unit V
1988-1996
2012-2016
11
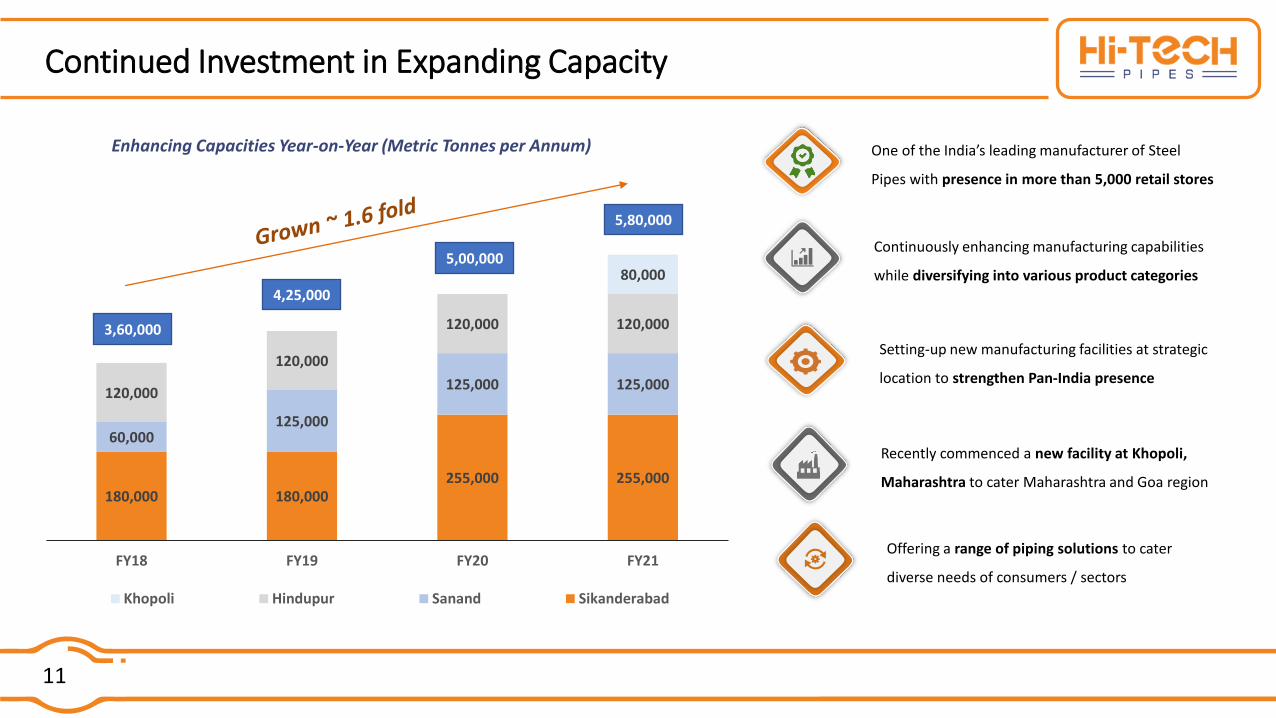
Continued Investment in Expanding Capacity
Recently commenced a new facility at Khopoli,
Maharashtra to cater Maharashtra and Goa region
One of the India’s leading manufacturer of Steel
Pipes with presence in more than 5,000 retail stores
Continuously enhancing manufacturing capabilities
while diversifying into various product categories
Setting-up new manufacturing facilities at strategic
location to strengthen Pan-India presence
Offering a range of piping solutions to cater
diverse needs of consumers / sectors
180,000 180,000255,000 255,000
60,000125,000
125,000 125,000120,000
120,000
120,000 120,000
80,000
FY18 FY19 FY20 FY21
Khopoli Hindupur Sanand Sikanderabad
4,25,000
5,00,000
5,80,000
Enhancing Capacities Year-on-Year (Metric Tonnes per Annum)
3,60,000
12
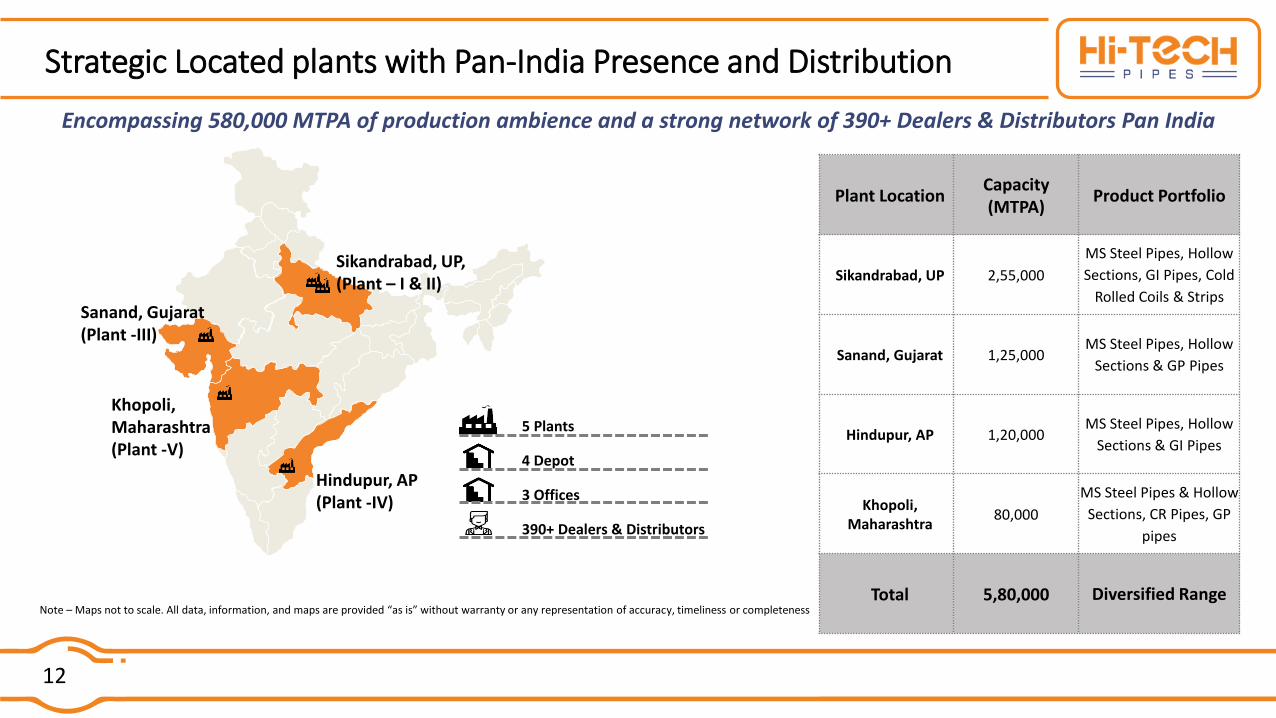
Strategic Located plants with Pan-India Presence and Distribution
Encompassing 580,000 MTPA of production ambience and a strong network of 390+ Dealers & Distributors Pan India
Hindupur, AP (Plant -IV)
Sikandrabad, UP, (Plant – I & II)
Khopoli, Maharashtra(Plant -V)
Sanand, Gujarat(Plant -III)
5 Plants
4 Depot
3 Offices
390+ Dealers & Distributors
Plant LocationCapacity (MTPA)
Product Portfolio
Sikandrabad, UP 2,55,000
MS Steel Pipes, Hollow
Sections, GI Pipes, Cold
Rolled Coils & Strips
Sanand, Gujarat 1,25,000MS Steel Pipes, Hollow
Sections & GP Pipes
Hindupur, AP 1,20,000MS Steel Pipes, Hollow
Sections & GI Pipes
Khopoli, Maharashtra
80,000
MS Steel Pipes & Hollow
Sections, CR Pipes, GP
pipes
Total 5,80,000 Diversified RangeNote – Maps not to scale. All data, information, and maps are provided “as is” without warranty or any representation of accuracy, timeliness or completeness
13
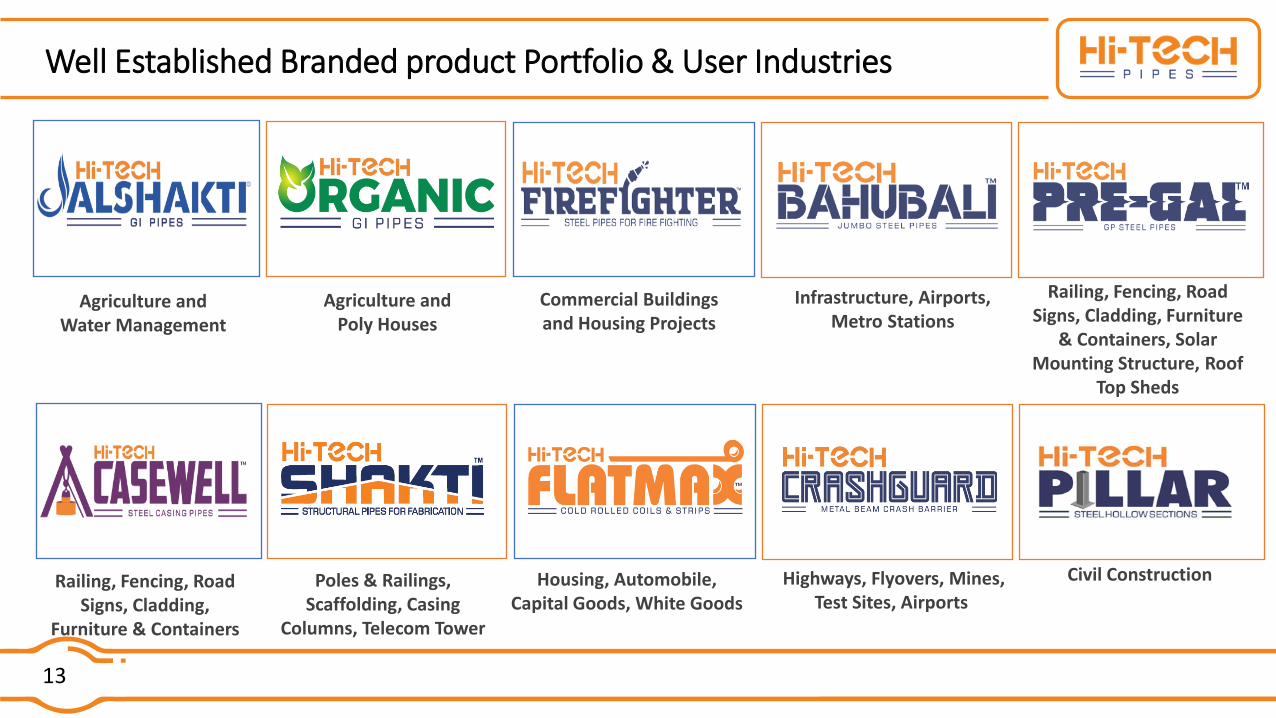
Well Established Branded product Portfolio & User Industries
Agriculture and Water Management
Agriculture and Poly Houses
Commercial Buildings and Housing Projects
Infrastructure, Airports, Metro Stations
Railing, Fencing, Road Signs, Cladding, Furniture
& Containers, Solar Mounting Structure, Roof
Top Sheds
Railing, Fencing, Road Signs, Cladding,
Furniture & Containers
Poles & Railings, Scaffolding, Casing
Columns, Telecom Tower
Housing, Automobile, Capital Goods, White Goods
Highways, Flyovers, Mines, Test Sites, Airports
Civil Construction
14
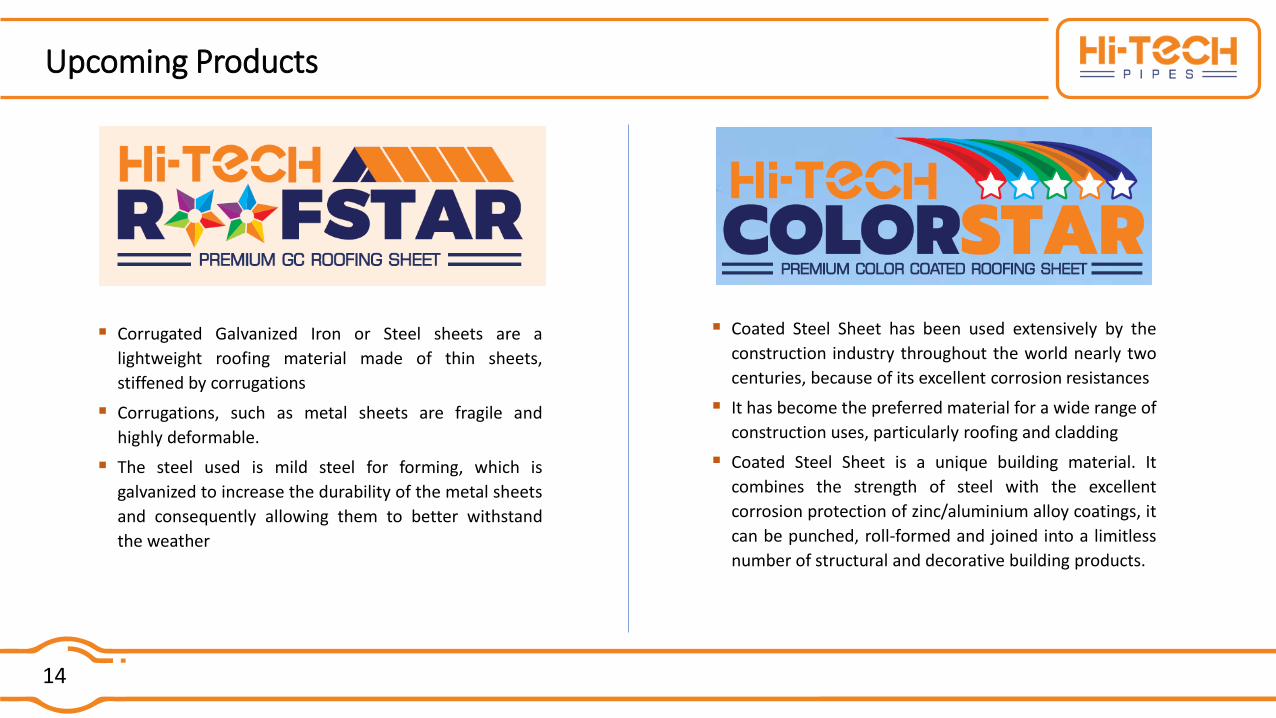
Upcoming Products
▪ Coated Steel Sheet has been used extensively by the
construction industry throughout the world nearly two
centuries, because of its excellent corrosion resistances
▪ It has become the preferred material for a wide range of
construction uses, particularly roofing and cladding
▪ Coated Steel Sheet is a unique building material. It
combines the strength of steel with the excellent
corrosion protection of zinc/aluminium alloy coatings, it
can be punched, roll-formed and joined into a limitless
number of structural and decorative building products.
▪ Corrugated Galvanized Iron or Steel sheets are a
lightweight roofing material made of thin sheets,
stiffened by corrugations
▪ Corrugations, such as metal sheets are fragile and
highly deformable.
▪ The steel used is mild steel for forming, which is
galvanized to increase the durability of the metal sheets
and consequently allowing them to better withstand
the weather
15
Mr. Ajay Kumar BansalChairman & Managing Director
Mr. Anish BansalWhole-Time Director
▪ An Industry stalwart with over 36 years of experience in the
steel industry
▪ Chairman of the FII (Steel tube Panel); Represented industry at
various National & International forums
▪ Played an instrumental role in the Company’s expansion over
the years
▪ B.Sc. (Economics) in Banking & Finance from the Cardiff University,
England, with over 15 years of experience in Business
Development & Administration
▪ His area of expertise includes corporate finance, strategy,
marketing, product development, project implementation,
international trade and finance along with other corporate matters
Board of Directors
Mr. P.K. SaxenaNon-Executive Independent Director
▪ Master’s in physics and finance and is also a Certified Associate
of Indian Institute of Bankers (CAIIB)
▪ Has significant experience in the field of Operational Control,
Credit Management, Business Analysis, Pre/Post Sanction
Follow up, Data Analytics, Foreign Exchange loan syndication,
NPA recovery management, monitoring etc.
Mr. Vivek GoyalNon-Executive Independent Director
▪ Has a Masters degree in Finance and Control, and is a member of the
Institute of the Chartered Accountants of India (ICAI)
▪ Over two decades of experience in handling large and mid-size
clients across several industries in the field of Audit, Taxation,
Corporate Finance, Corporate Advisory, Risk Management,
Corporate Governance, M&A and restructuring initiatives.
Mrs. Neerja KumarNon-Executive Independent Director
▪ Did M.Sc., M.Phil. (Botany). Retired as General Manager-
(MSME) Punjab National Bank
▪ Having almost four decades of experience in PNB Bank in
various discipline.
▪ Worked as, Deputy General Manager in Mumbai handling HR,
Planning and development, Credit, Inspection and audit.
Mr. Mukesh Kumar GargNon-Executive Independent Director
▪ Had joined Indian Railway as an IRSE Officer in July 1984 and retired
from Railway on 30th June 2019. Worked at several posts over
Northern and North Central Railway
▪ Having a vast experience of planning of works, handling of large
tenders, Contract Management and execution, both for
maintenance works as well as Railway Construction Projects
16
Mar
qu
ee
Clie
nts
Mar
qu
ee
Pro
ject
s w
hic
h u
sed
H
i-Te
ch P
rod
uct
s
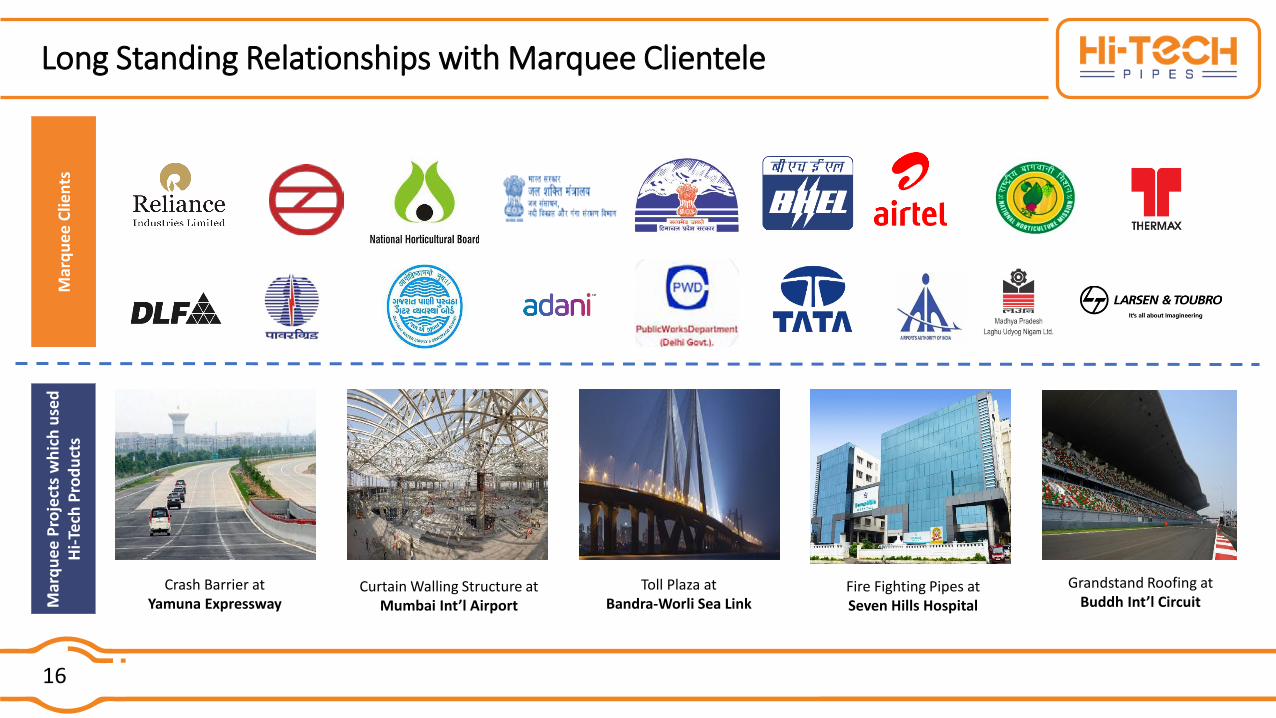
Crash Barrier atYamuna Expressway
Curtain Walling Structure atMumbai Int’l Airport
Toll Plaza atBandra-Worli Sea Link
Fire Fighting Pipes atSeven Hills Hospital
Grandstand Roofing atBuddh Int’l Circuit
Long Standing Relationships with Marquee Clientele
17
DNV BUSINESS
ASSURANCE
CERTIFICATE
CERTIFICATE OF
RECOGNITION
MINISTRY OF COMMERCE INDUSTRY
EXEMPLARY GROWTH & INNOVATION AWARD
SUPER SME
AMONG TOP 100 SMEs
SKOCH GROUP
BEST COMPANY OF
THE YEAR AWARD
IBC CORPORATION,
USA
PERFORMANCE EXCELLENCE AWARDMINISRY OF STEEL, GOVERNMENT OF
INDIA
TOP PERFORMER AWARD
FROM SAIL
Quality Certifications and Client Awards

RecentDevelopments
19
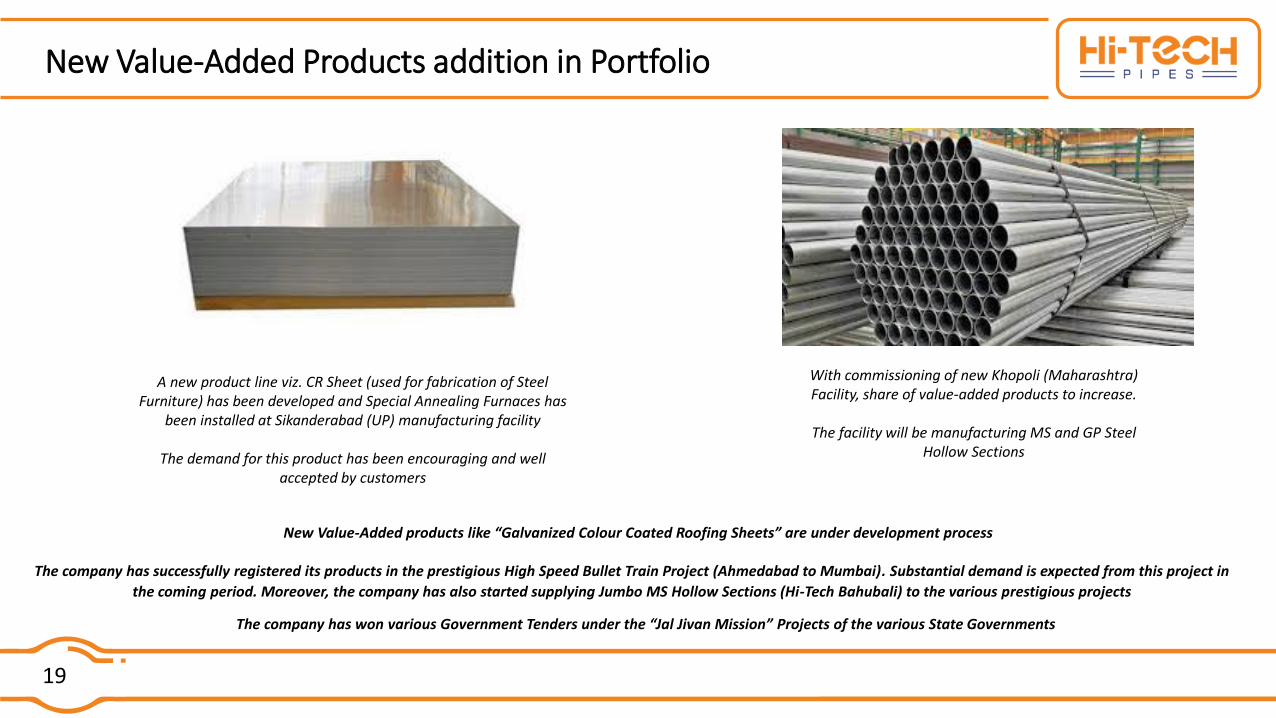
New Value-Added Products addition in Portfolio
A new product line viz. CR Sheet (used for fabrication of Steel Furniture) has been developed and Special Annealing Furnaces has
been installed at Sikanderabad (UP) manufacturing facility
The demand for this product has been encouraging and well accepted by customers
With commissioning of new Khopoli (Maharashtra) Facility, share of value-added products to increase.
The facility will be manufacturing MS and GP Steel Hollow Sections
New Value-Added products like “Galvanized Colour Coated Roofing Sheets” are under development process
The company has successfully registered its products in the prestigious High Speed Bullet Train Project (Ahmedabad to Mumbai). Substantial demand is expected from this project in
the coming period. Moreover, the company has also started supplying Jumbo MS Hollow Sections (Hi-Tech Bahubali) to the various prestigious projects
The company has won various Government Tenders under the “Jal Jivan Mission” Projects of the various State Governments
20
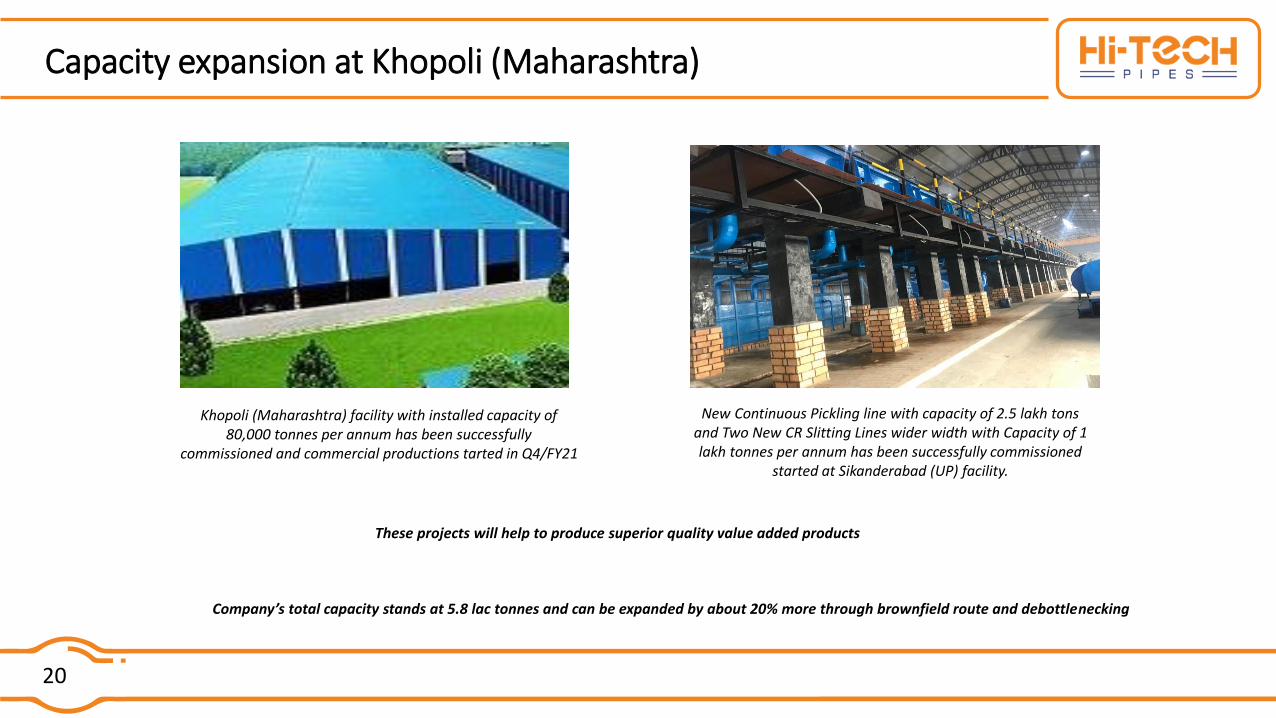
Capacity expansion at Khopoli (Maharashtra)
Khopoli (Maharashtra) facility with installed capacity of 80,000 tonnes per annum has been successfully
commissioned and commercial productions tarted in Q4/FY21
New Continuous Pickling line with capacity of 2.5 lakh tons and Two New CR Slitting Lines wider width with Capacity of 1 lakh tonnes per annum has been successfully commissioned
started at Sikanderabad (UP) facility.
Company’s total capacity stands at 5.8 lac tonnes and can be expanded by about 20% more through brownfield route and debottlenecking
These projects will help to produce superior quality value added products
21
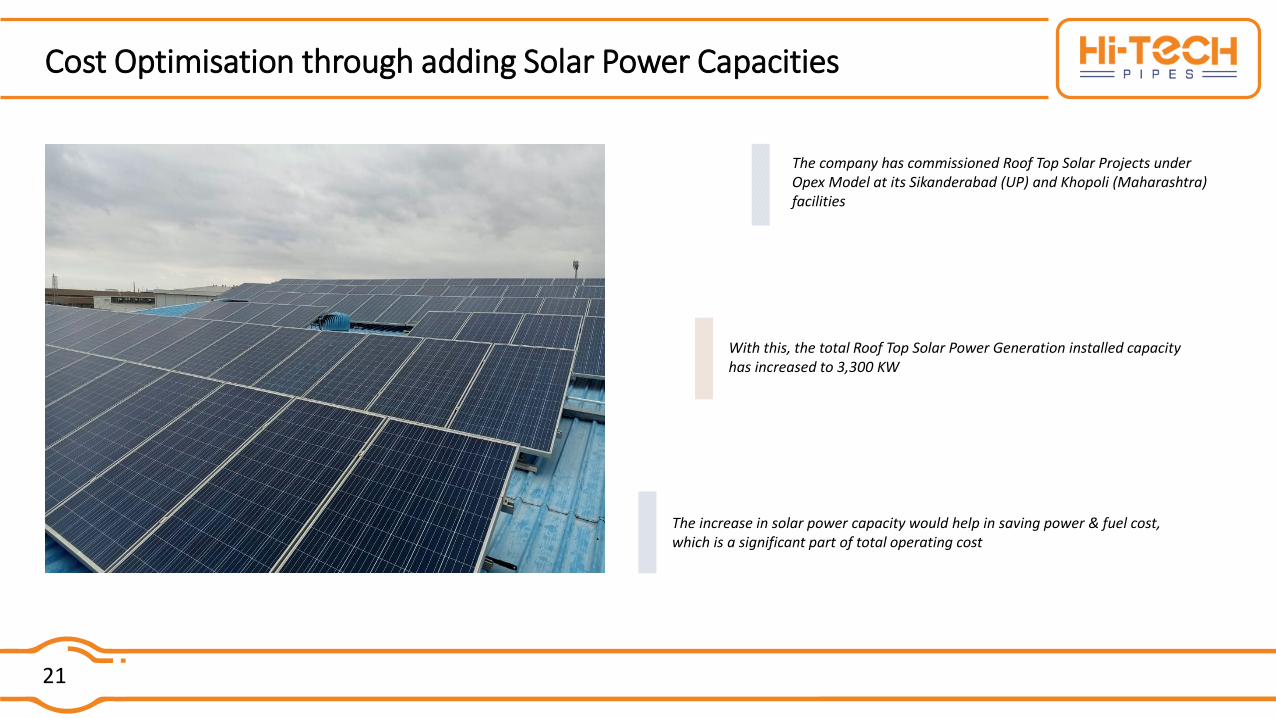
Cost Optimisation through adding Solar Power Capacities
The company has commissioned Roof Top Solar Projects under Opex Model at its Sikanderabad (UP) and Khopoli (Maharashtra) facilities
With this, the total Roof Top Solar Power Generation installed capacity has increased to 3,300 KW
The increase in solar power capacity would help in saving power & fuel cost, which is a significant part of total operating cost

Strategic Focus
23
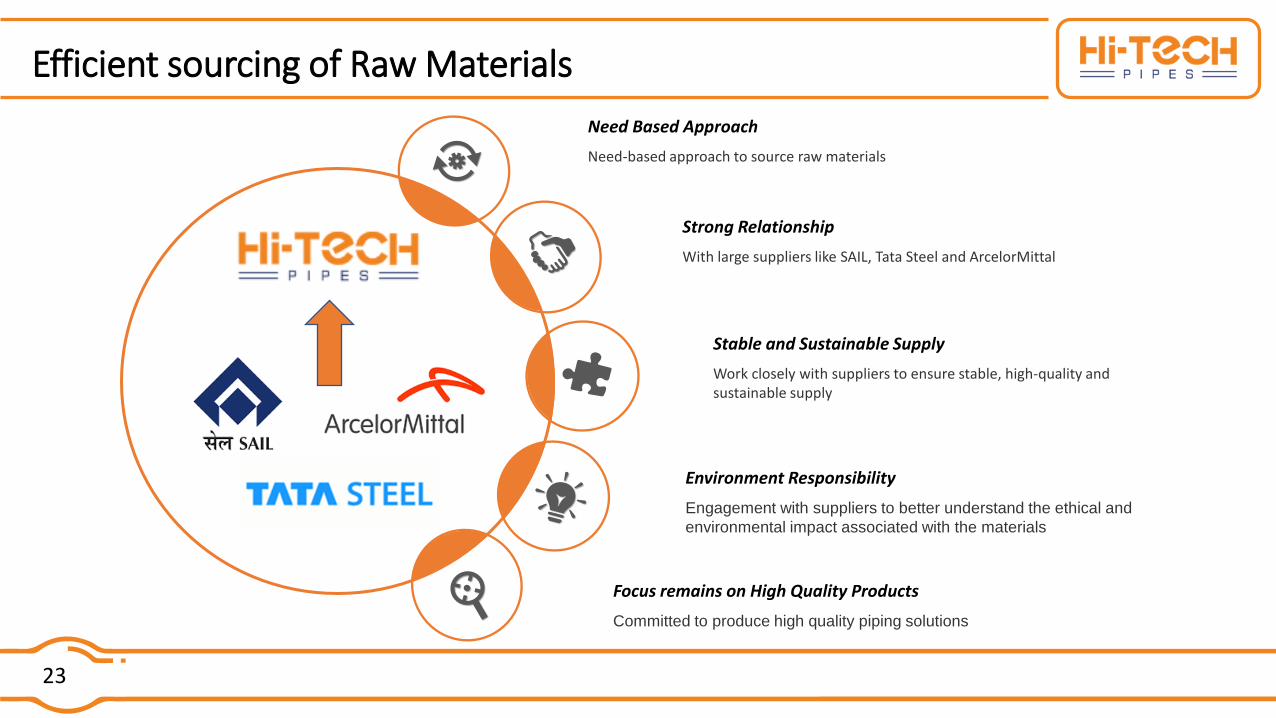
Efficient sourcing of Raw Materials
Environment Responsibility
Engagement with suppliers to better understand the ethical and
environmental impact associated with the materials
Strong Relationship
With large suppliers like SAIL, Tata Steel and ArcelorMittal
Need Based Approach
Need-based approach to source raw materials
Stable and Sustainable Supply
Work closely with suppliers to ensure stable, high-quality and sustainable supply
Focus remains on High Quality Products
Committed to produce high quality piping solutions
24
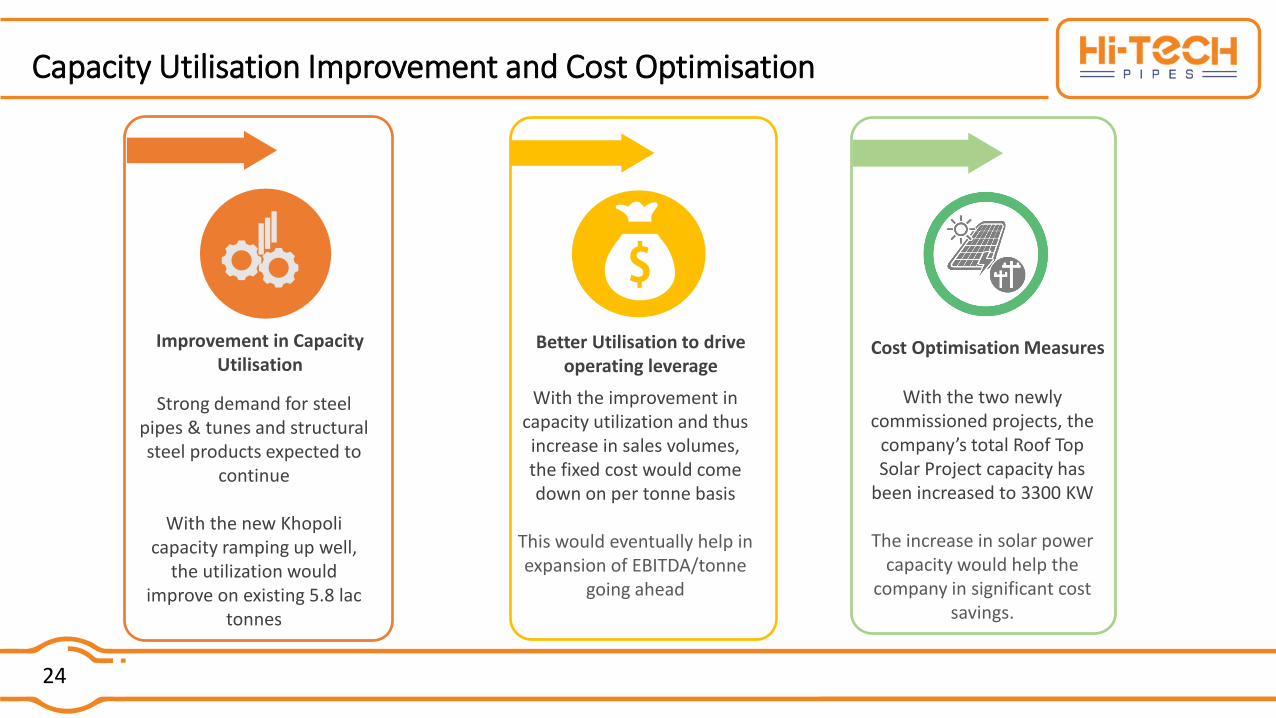
Capacity Utilisation Improvement and Cost Optimisation
Improvement in Capacity Utilisation
Strong demand for steel pipes & tunes and structural steel products expected to
continue
With the new Khopoli capacity ramping up well,
the utilization would improve on existing 5.8 lac
tonnes
Better Utilisation to drive operating leverage
With the improvement in capacity utilization and thus increase in sales volumes, the fixed cost would come down on per tonne basis
This would eventually help in expansion of EBITDA/tonne
going ahead
Cost Optimisation Measures
With the two newly commissioned projects, the
company’s total Roof Top Solar Project capacity has
been increased to 3300 KW
The increase in solar power capacity would help the
company in significant cost savings.
25
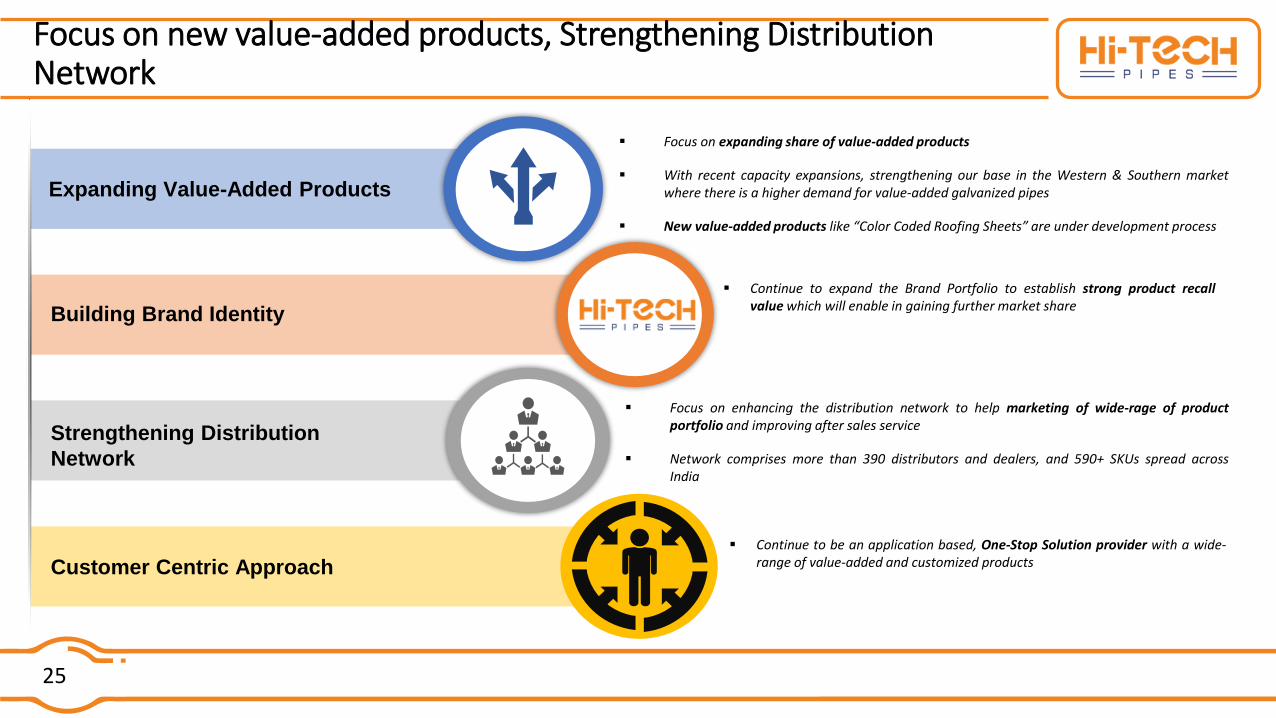
Focus on new value-added products, Strengthening Distribution Network
Expanding Value-Added Products
▪ Focus on expanding share of value-added products
▪ With recent capacity expansions, strengthening our base in the Western & Southern marketwhere there is a higher demand for value-added galvanized pipes
▪ New value-added products like “Color Coded Roofing Sheets” are under development process
Strengthening Distribution
Network
▪ Focus on enhancing the distribution network to help marketing of wide-rage of productportfolio and improving after sales service
▪ Network comprises more than 390 distributors and dealers, and 590+ SKUs spread acrossIndia
Customer Centric Approach
▪ Continue to be an application based, One-Stop Solution provider with a wide-range of value-added and customized products
Building Brand Identity
▪ Continue to expand the Brand Portfolio to establish strong product recallvalue which will enable in gaining further market share
26
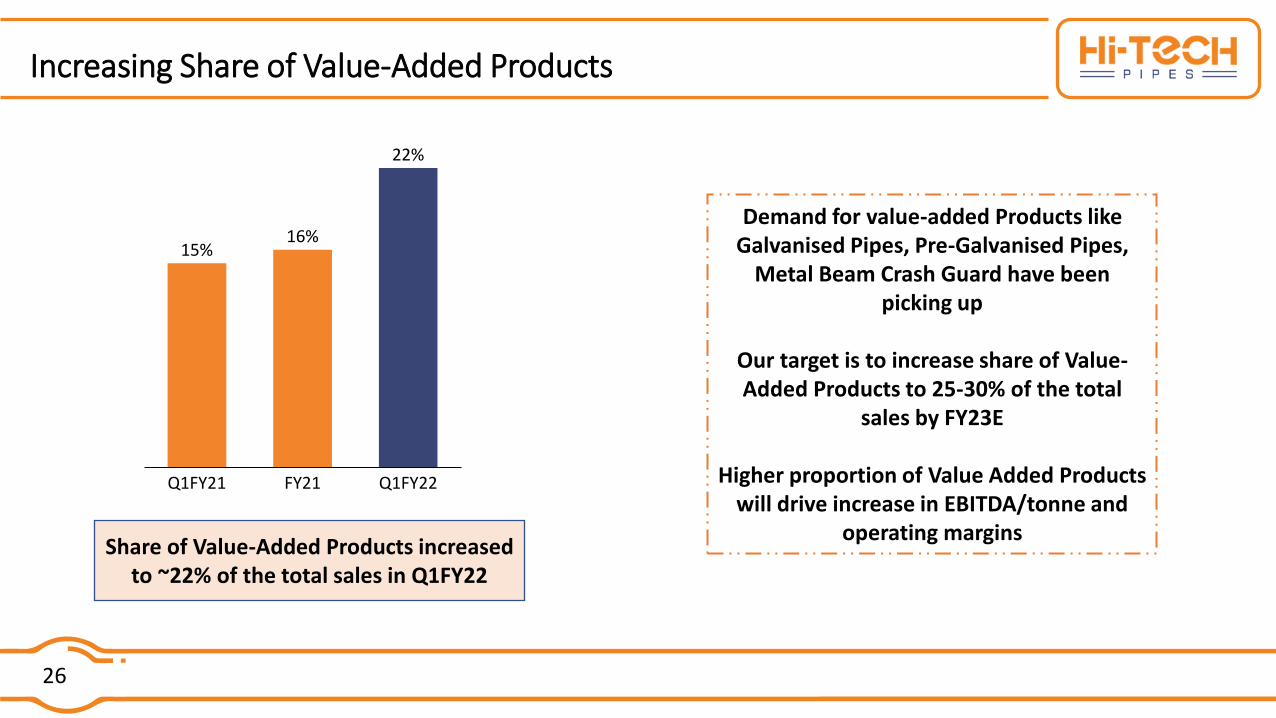
Increasing Share of Value-Added Products
22%
FY21Q1FY21 Q1FY22
15%16%
Share of Value-Added Products increased to ~22% of the total sales in Q1FY22
Demand for value-added Products like Galvanised Pipes, Pre-Galvanised Pipes,
Metal Beam Crash Guard have been picking up
Our target is to increase share of Value-Added Products to 25-30% of the total
sales by FY23E
Higher proportion of Value Added Products will drive increase in EBITDA/tonne and
operating margins
27
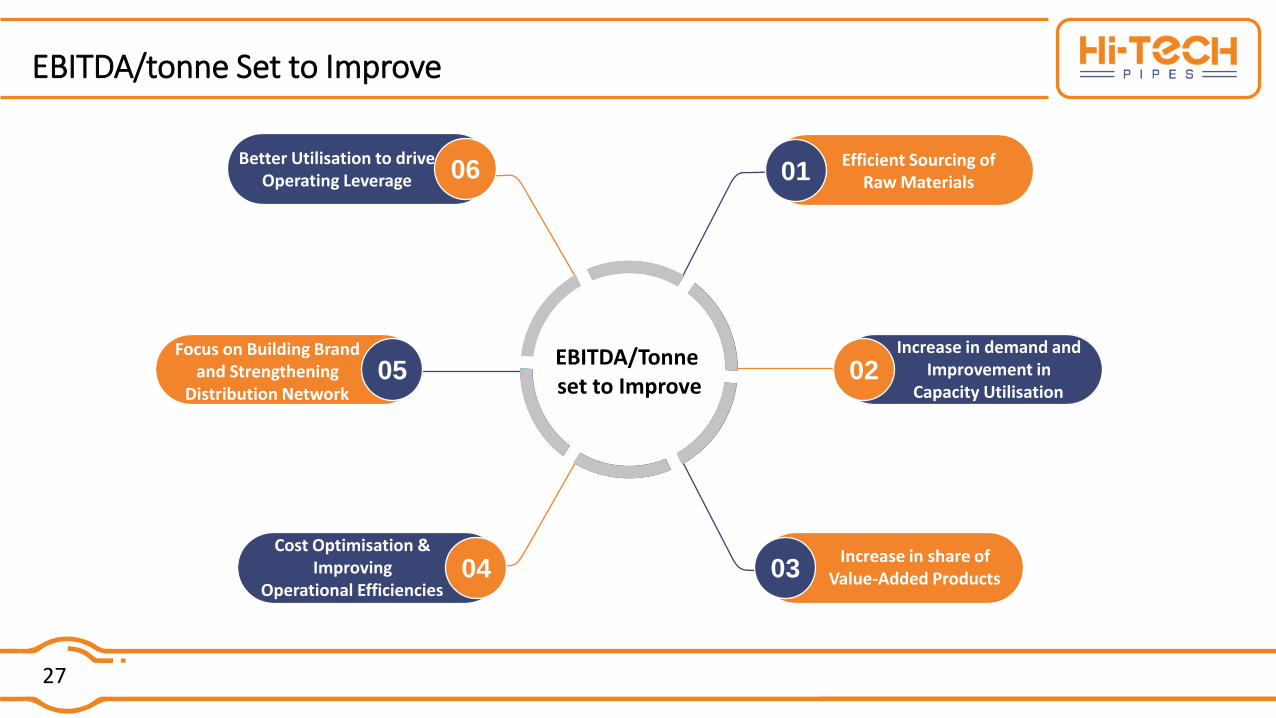
EBITDA/tonne Set to Improve
EBITDA/Tonne set to Improve
Increase in share of Value-Added Products03
Cost Optimisation & Improving
Operational Efficiencies04
Increase in demand and Improvement in
Capacity Utilisation02
Focus on Building Brand and Strengthening
Distribution Network05
Efficient Sourcing of Raw Materials01
Better Utilisation to drive Operating Leverage 06
28
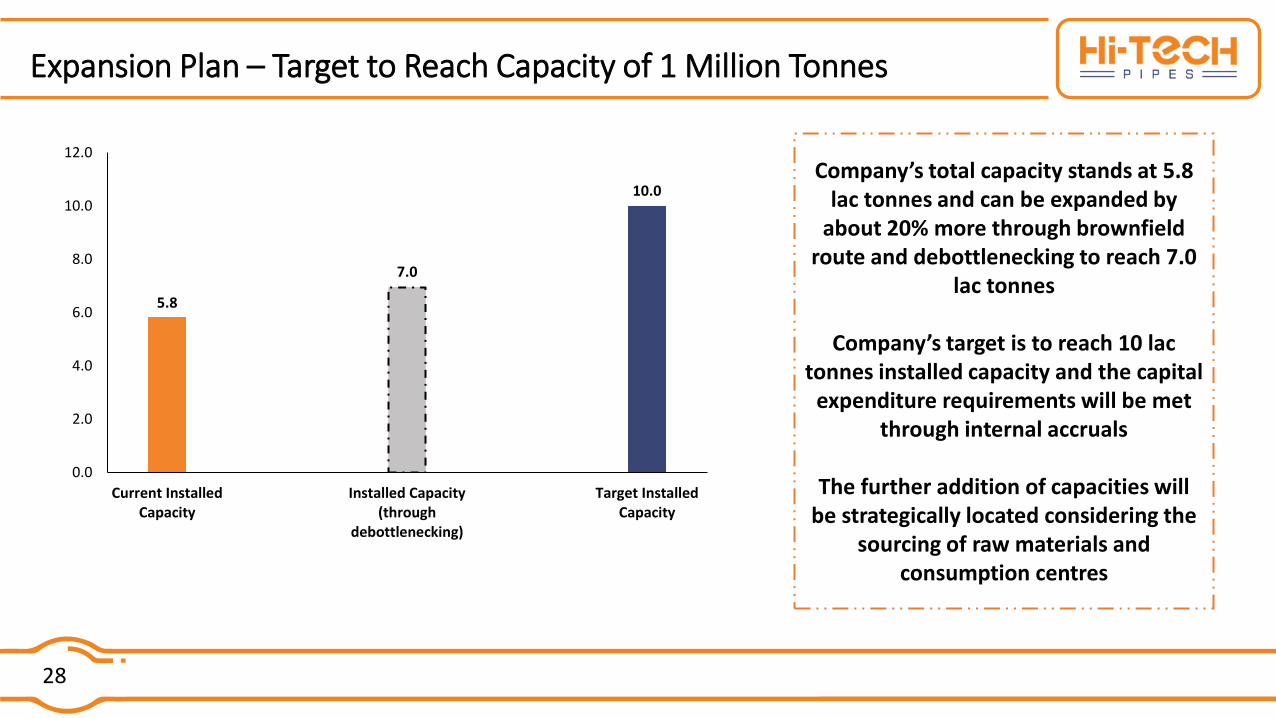
Expansion Plan – Target to Reach Capacity of 1 Million Tonnes
Company’s total capacity stands at 5.8 lac tonnes and can be expanded by
about 20% more through brownfield route and debottlenecking to reach 7.0
lac tonnes
Company’s target is to reach 10 lac tonnes installed capacity and the capital
expenditure requirements will be met through internal accruals
The further addition of capacities will be strategically located considering the
sourcing of raw materials and consumption centres
5.8
7.0
10.0
0.0
2.0
4.0
6.0
8.0
10.0
12.0
Current InstalledCapacity
Installed Capacity(through
debottlenecking)
Target InstalledCapacity
Industry Overview & Demand Drivers
30
208
568
75140
Global Rest of the World
China India
21
57
614
Global China India Rest of the World
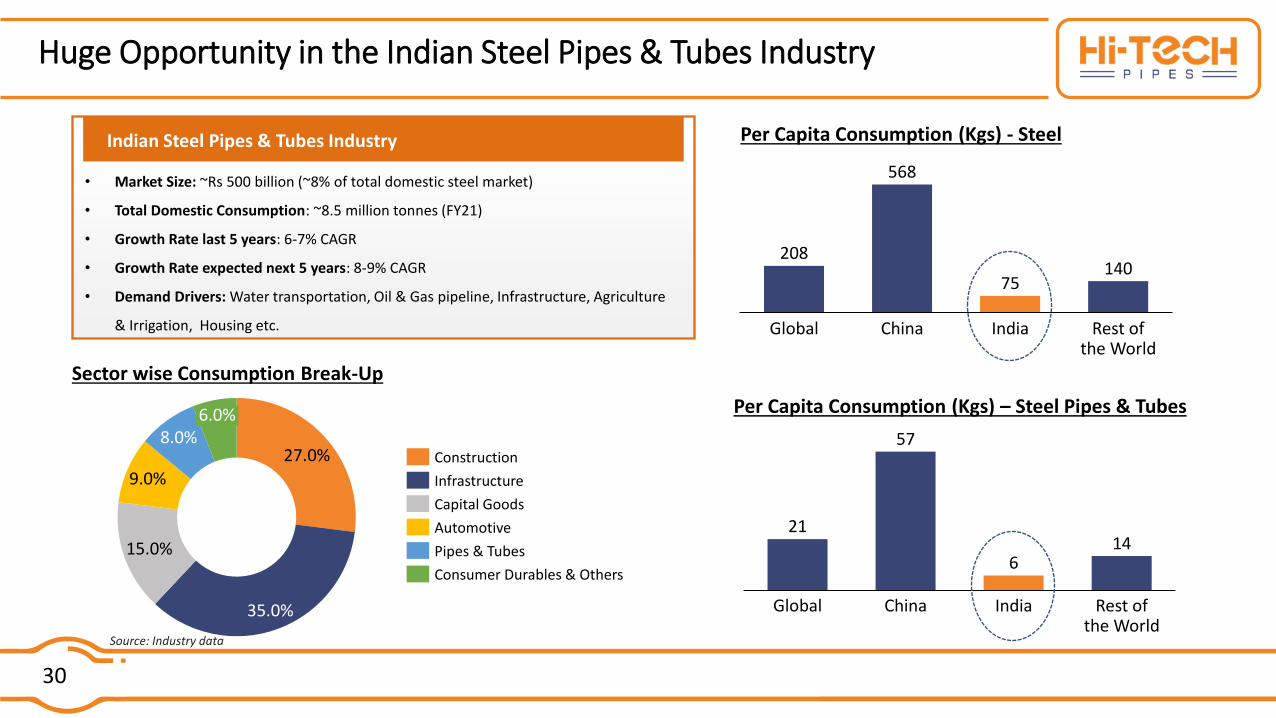
Per Capita Consumption (Kgs) - Steel
Per Capita Consumption (Kgs) – Steel Pipes & Tubes
27.0%
35.0%
15.0%
9.0%
8.0%6.0%
Construction
Infrastructure
Capital Goods
Pipes & Tubes
Automotive
Consumer Durables & Others
Sector wise Consumption Break-Up
Source: Industry data
Huge Opportunity in the Indian Steel Pipes & Tubes Industry
• Market Size: ~Rs 500 billion (~8% of total domestic steel market)
• Total Domestic Consumption: ~8.5 million tonnes (FY21)
• Growth Rate last 5 years: 6-7% CAGR
• Growth Rate expected next 5 years: 8-9% CAGR
• Demand Drivers: Water transportation, Oil & Gas pipeline, Infrastructure, Agriculture
& Irrigation, Housing etc.
Indian Steel Pipes & Tubes Industry
31
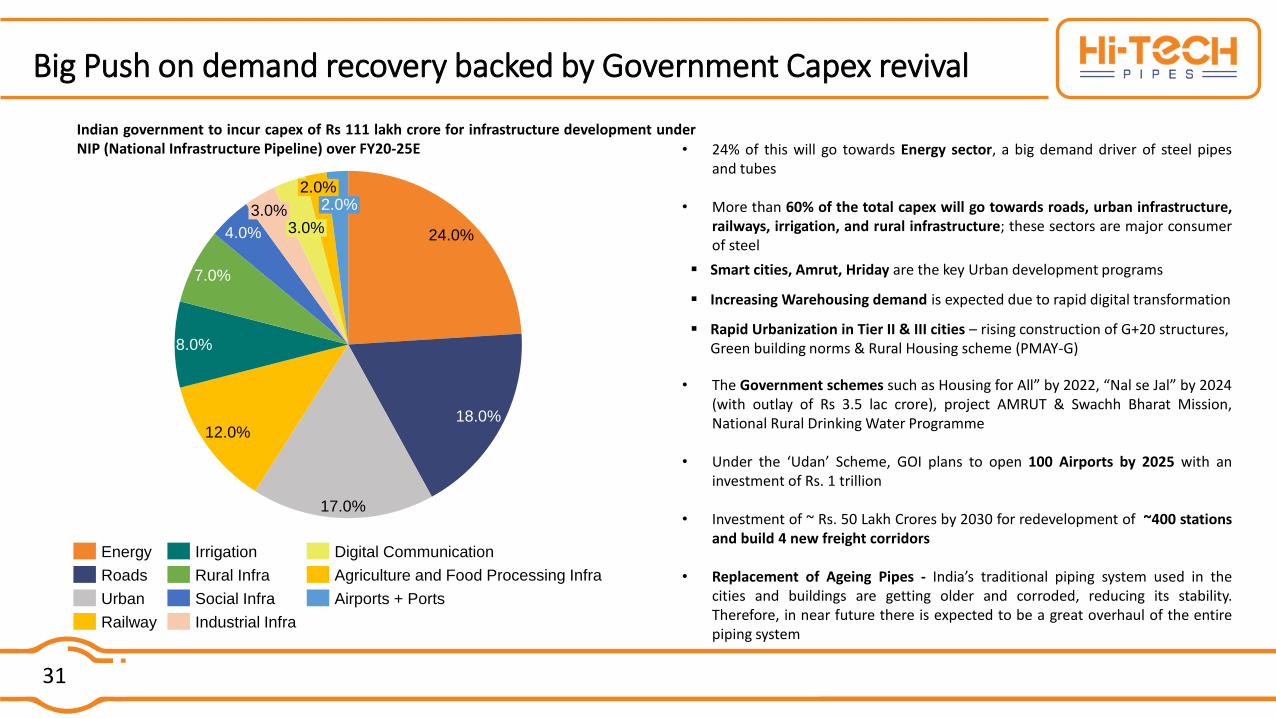
Big Push on demand recovery backed by Government Capex revival
24.0%
18.0%
17.0%
12.0%
8.0%
7.0%
4.0%
3.0% 2.0%
3.0%
2.0%
Social Infra
Energy
Railway
Roads
Urban
Irrigation
Rural Infra
Industrial Infra
Digital Communication
Agriculture and Food Processing Infra
Airports + Ports
• 24% of this will go towards Energy sector, a big demand driver of steel pipesand tubes
• More than 60% of the total capex will go towards roads, urban infrastructure,railways, irrigation, and rural infrastructure; these sectors are major consumerof steel
▪ Smart cities, Amrut, Hriday are the key Urban development programs
▪ Increasing Warehousing demand is expected due to rapid digital transformation
▪ Rapid Urbanization in Tier II & III cities – rising construction of G+20 structures, Green building norms & Rural Housing scheme (PMAY-G)
• The Government schemes such as Housing for All” by 2022, “Nal se Jal” by 2024(with outlay of Rs 3.5 lac crore), project AMRUT & Swachh Bharat Mission,National Rural Drinking Water Programme
• Under the ‘Udan’ Scheme, GOI plans to open 100 Airports by 2025 with aninvestment of Rs. 1 trillion
• Investment of ~ Rs. 50 Lakh Crores by 2030 for redevelopment of ~400 stationsand build 4 new freight corridors
• Replacement of Ageing Pipes - India’s traditional piping system used in thecities and buildings are getting older and corroded, reducing its stability.Therefore, in near future there is expected to be a great overhaul of the entirepiping system
Indian government to incur capex of Rs 111 lakh crore for infrastructure development underNIP (National Infrastructure Pipeline) over FY20-25E
32
Revival in Private Capex to drive demand of steel products
• Considerable improvement in external balance position (including Current Account Deficit turning surplus in FY21 at 0.9% of GDP and steep rise in RBI’s forex buffer at USD 610 bn)
• Favorable financial conditions have enabled fund raising by many sectors
• Deleveraging of corporate balance sheets, reflected in the sharp decline in debt/equity ratio of the non-financial sector
• Higher capital base of banks, lower NPAs (Non-Performing Assets) and deleveraged corporate balance sheets are necessary buffer for private capex revival and ability of banks to fund it
• Revival in Corporate Capex is expected to drive demand for steel pipes & tubes and other structural steel products going ahead
Annual Financials
34
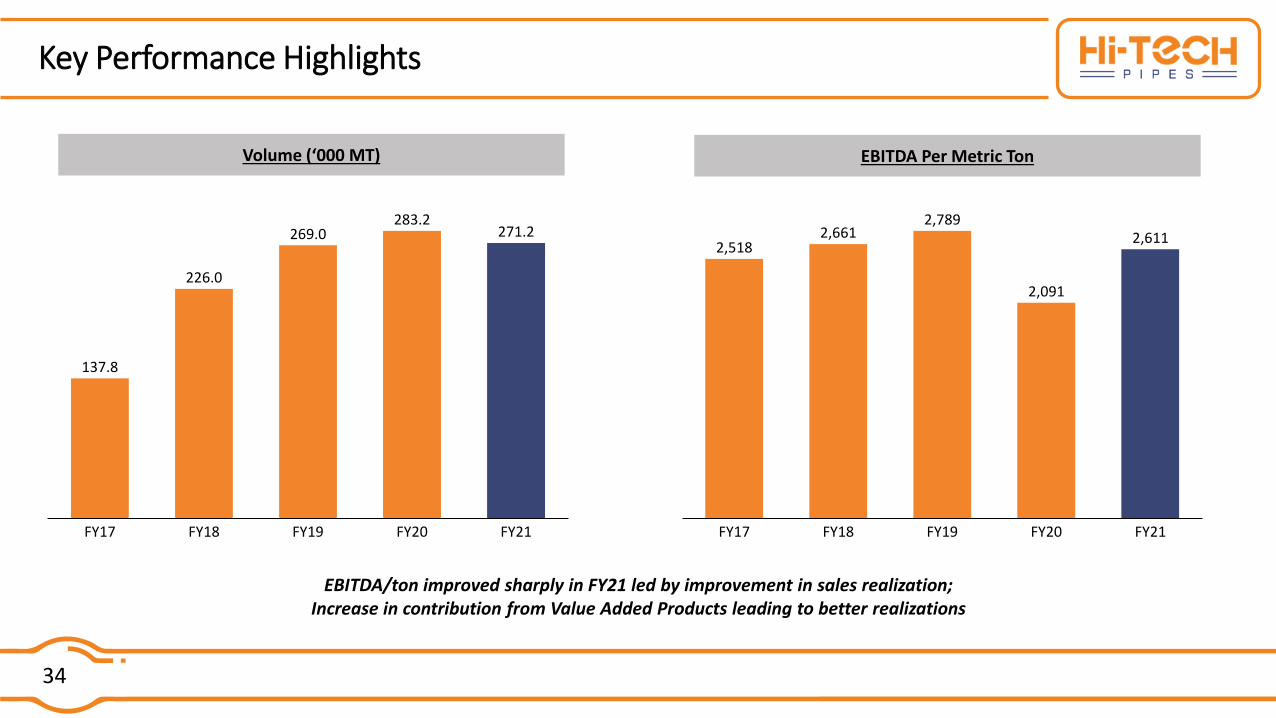
Key Performance Highlights
137.8
226.0
269.0283.2
271.2
FY19FY18FY17 FY20 FY21
EBITDA/ton improved sharply in FY21 led by improvement in sales realization; Increase in contribution from Value Added Products leading to better realizations
2,5182,661
2,789
2,091
2,611
FY18FY17 FY21FY19 FY20
Volume (‘000 MT) EBITDA Per Metric Ton
35
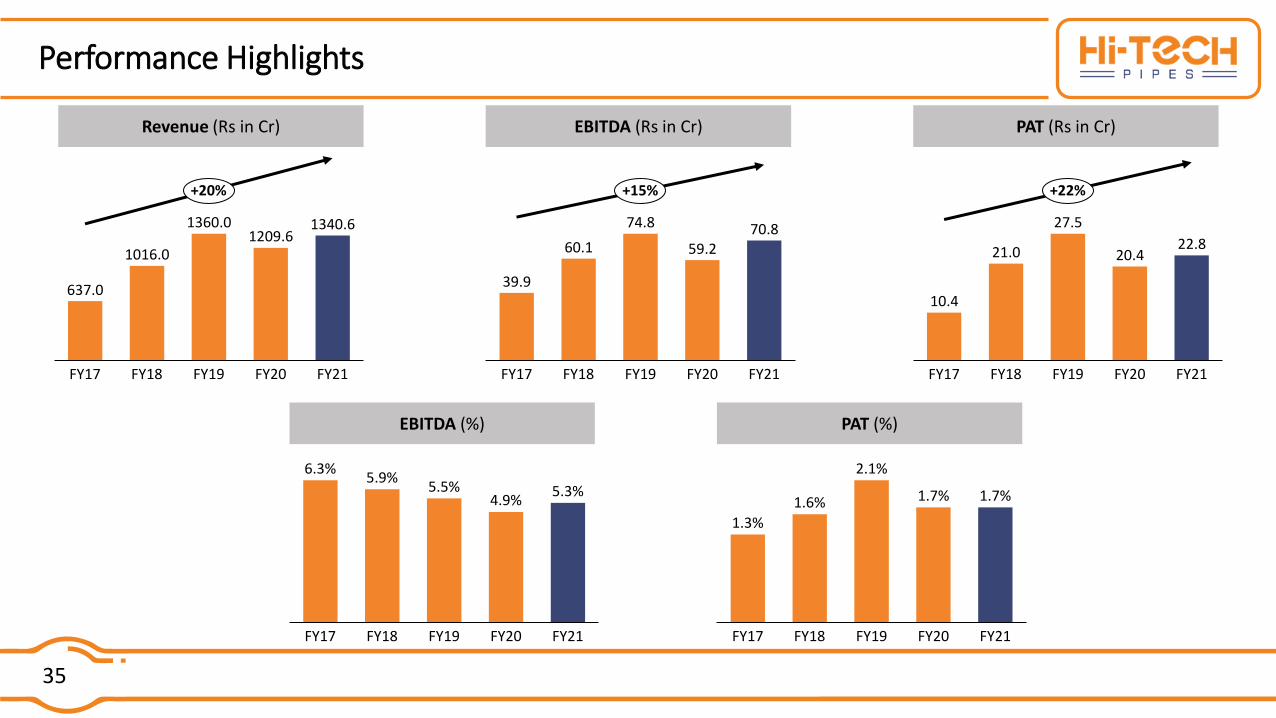
Performance Highlights
Revenue (Rs in Cr) PAT (Rs in Cr)EBITDA (Rs in Cr)
637.0
1016.0
1360.01209.6
1340.6
FY21FY19FY18FY17 FY20
+20%
39.9
60.1
74.8
59.270.8
FY19 FY20FY17 FY18 FY21
+15%
10.4
21.0
27.5
20.422.8
FY17 FY20FY18 FY19 FY21
+22%
EBITDA (%) PAT (%)
FY18 FY20
5.3%
FY17 FY19
5.9%
FY21
5.5%6.3%
4.9%
FY17 FY18 FY19
1.6%
FY21FY20
1.3%
2.1%
1.7% 1.7%
36
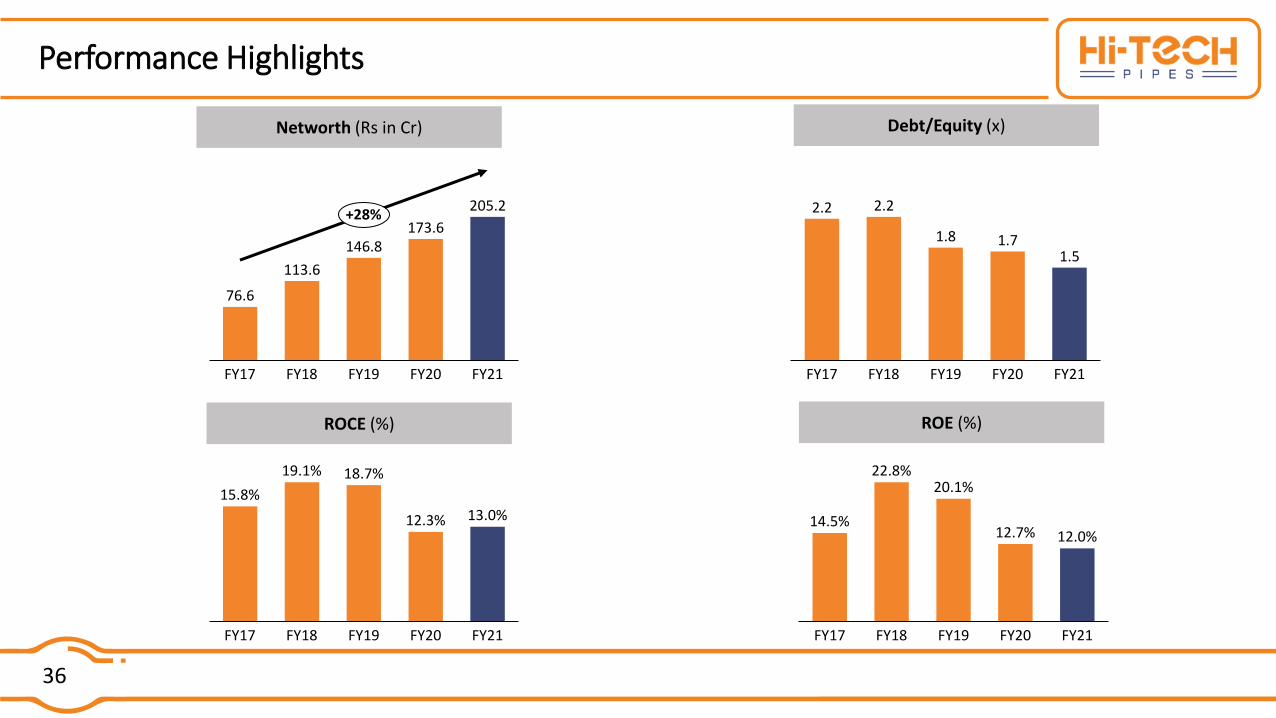
Performance Highlights
Networth (Rs in Cr) Debt/Equity (x)
76.6
113.6
146.8173.6
205.2
FY17 FY18 FY19 FY21FY20
+28% 2.2 2.2
1.8 1.71.5
FY20FY17 FY18 FY19 FY21
ROCE (%) ROE (%)
FY20
15.8%
FY17 FY21FY18
18.7%19.1%
FY19
12.3% 13.0%
FY17
20.1%
FY18 FY19 FY20 FY21
14.5%
22.8%
12.7% 12.0%
37
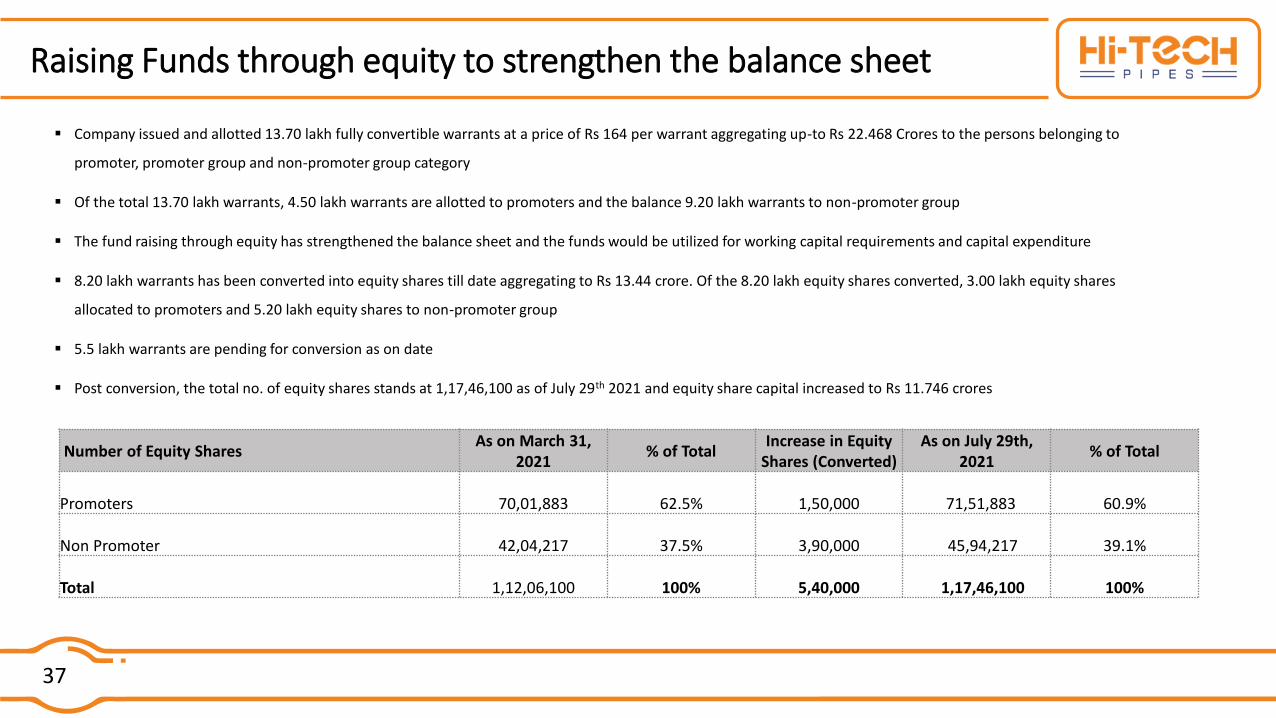
Raising Funds through equity to strengthen the balance sheet
▪ Company issued and allotted 13.70 lakh fully convertible warrants at a price of Rs 164 per warrant aggregating up-to Rs 22.468 Crores to the persons belonging to
promoter, promoter group and non-promoter group category
▪ Of the total 13.70 lakh warrants, 4.50 lakh warrants are allotted to promoters and the balance 9.20 lakh warrants to non-promoter group
▪ The fund raising through equity has strengthened the balance sheet and the funds would be utilized for working capital requirements and capital expenditure
▪ 8.20 lakh warrants has been converted into equity shares till date aggregating to Rs 13.44 crore. Of the 8.20 lakh equity shares converted, 3.00 lakh equity shares
allocated to promoters and 5.20 lakh equity shares to non-promoter group
▪ 5.5 lakh warrants are pending for conversion as on date
▪ Post conversion, the total no. of equity shares stands at 1,17,46,100 as of July 29th 2021 and equity share capital increased to Rs 11.746 crores
Number of Equity SharesAs on March 31,
2021% of Total
Increase in Equity Shares (Converted)
As on July 29th, 2021
% of Total
Promoters 70,01,883 62.5% 1,50,000 71,51,883 60.9%
Non Promoter 42,04,217 37.5% 3,90,000 45,94,217 39.1%
Total 1,12,06,100 100% 5,40,000 1,17,46,100 100%
38
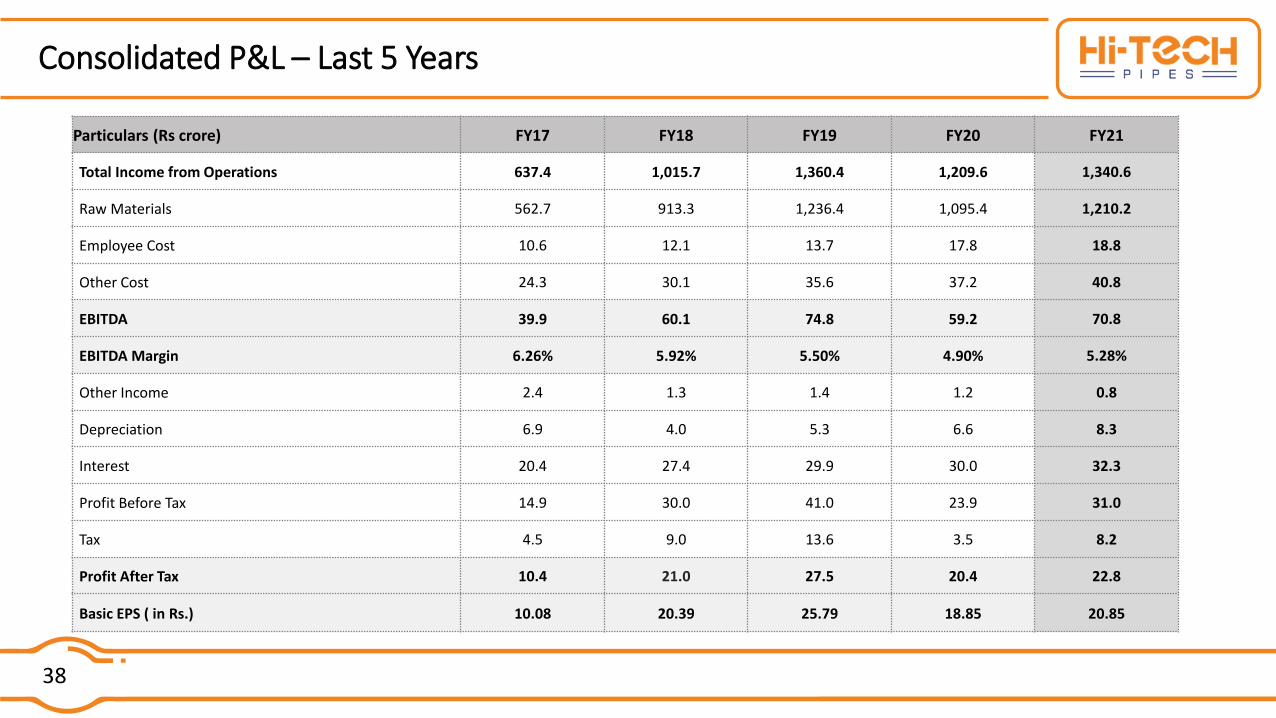
Particulars (Rs crore) FY17 FY18 FY19 FY20 FY21
Total Income from Operations 637.4 1,015.7 1,360.4 1,209.6 1,340.6
Raw Materials 562.7 913.3 1,236.4 1,095.4 1,210.2
Employee Cost 10.6 12.1 13.7 17.8 18.8
Other Cost 24.3 30.1 35.6 37.2 40.8
EBITDA 39.9 60.1 74.8 59.2 70.8
EBITDA Margin 6.26% 5.92% 5.50% 4.90% 5.28%
Other Income 2.4 1.3 1.4 1.2 0.8
Depreciation 6.9 4.0 5.3 6.6 8.3
Interest 20.4 27.4 29.9 30.0 32.3
Profit Before Tax 14.9 30.0 41.0 23.9 31.0
Tax 4.5 9.0 13.6 3.5 8.2
Profit After Tax 10.4 21.0 27.5 20.4 22.8
Basic EPS ( in Rs.) 10.08 20.39 25.79 18.85 20.85
Consolidated P&L – Last 5 Years
39
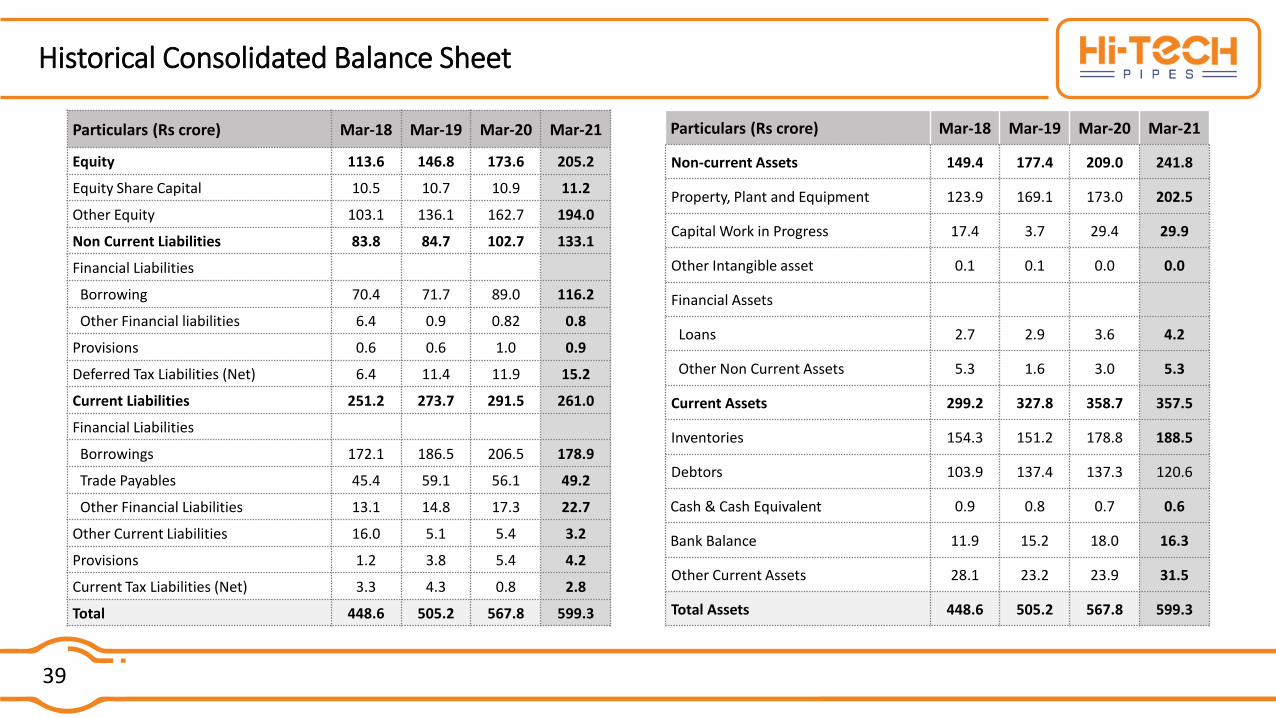
Particulars (Rs crore) Mar-18 Mar-19 Mar-20 Mar-21
Equity 113.6 146.8 173.6 205.2
Equity Share Capital 10.5 10.7 10.9 11.2
Other Equity 103.1 136.1 162.7 194.0
Non Current Liabilities 83.8 84.7 102.7 133.1
Financial Liabilities
Borrowing 70.4 71.7 89.0 116.2
Other Financial liabilities 6.4 0.9 0.82 0.8
Provisions 0.6 0.6 1.0 0.9
Deferred Tax Liabilities (Net) 6.4 11.4 11.9 15.2
Current Liabilities 251.2 273.7 291.5 261.0
Financial Liabilities
Borrowings 172.1 186.5 206.5 178.9
Trade Payables 45.4 59.1 56.1 49.2
Other Financial Liabilities 13.1 14.8 17.3 22.7
Other Current Liabilities 16.0 5.1 5.4 3.2
Provisions 1.2 3.8 5.4 4.2
Current Tax Liabilities (Net) 3.3 4.3 0.8 2.8
Total 448.6 505.2 567.8 599.3
Particulars (Rs crore) Mar-18 Mar-19 Mar-20 Mar-21
Non-current Assets 149.4 177.4 209.0 241.8
Property, Plant and Equipment 123.9 169.1 173.0 202.5
Capital Work in Progress 17.4 3.7 29.4 29.9
Other Intangible asset 0.1 0.1 0.0 0.0
Financial Assets
Loans 2.7 2.9 3.6 4.2
Other Non Current Assets 5.3 1.6 3.0 5.3
Current Assets 299.2 327.8 358.7 357.5
Inventories 154.3 151.2 178.8 188.5
Debtors 103.9 137.4 137.3 120.6
Cash & Cash Equivalent 0.9 0.8 0.7 0.6
Bank Balance 11.9 15.2 18.0 16.3
Other Current Assets 28.1 23.2 23.9 31.5
Total Assets 448.6 505.2 567.8 599.3
Historical Consolidated Balance Sheet
40
For more details, please contact:
Company: Investor Relations Advisors:
Hi-Tech Pipes Limited.
CIN: L27202DL1985PLC019750
Mr. Arvind Bansal, CFO
Phone: 011-48440050
www.hitechpipes.in
Strategic Growth Advisors Pvt. Ltd.
CIN: U74140MH2010PTC204285
Mr. Vijay Goel / Mr. Aakash Mehta
[email protected] / [email protected]
+91 9920124357 / +91 9870679263
www.sgapl.net
Contact Us