Embed Size (px)
Citation preview
Pablo Garcia Arabehety,
Claudia McKay, and Peter Zetterli
May 2018
Proximity Matters:
Five Case Studies in Closing the CICO Gap

© CGAP 2017
5.3 million mobile money agents
in 90 countries globally*
2
Cash-in, Cash-out (CICO) still matters for financial inclusion
*GSMA State of the Mobile Money Industry Report, 2017.
Of the 5.3m agents, 55% have performed one transaction in the last 30 days.
In the last 5 years, a growing
body of evidence has shown
that adoption and use of
financial services are strongly
correlated with the proximity of
physical cash access points
(see Appendix).
Providers of Digital Financial
Services (DFS) have deployed
massive numbers of agents in a
growing number of countries
around the world to meet
customer demand.
However the deployment of
these agents has been uneven
within markets, with large areas
and population segments still
lacking physical access.
Increased proximity is needed
in these frontier – hard-to-serve
- areas.
?

© CGAP 2017
3
CICO agents in frontier areas face increased challenges
Agents in these areas face increased challenges compared with
their urban counterparts including lower demand, more expensive
liquidity management and limited working capital availability. This
means that even when agents are present in rural areas, the
quality of these agents may be poorer.
Through five case studies, this paper highlights innovative
approaches that providers and policymakers are
implementing that could address some of the challenges
faced by frontier agents.
Full versions of 4 of the 5 case studies can be found on the Microfinance Gateway:
https://www.microfinancegateway.org/library/frontier-agents-case-studies-brazil-india-mexico-and-tanzania
*GSMA State of the Mobile Money Industry Report, 2017.
Of the 5.3m agents, 55% have performed one transaction in the last 30 days.

© CGAP 2017
Contents
1 Proximity matters for financial inclusion
2
Case Studies
Analytics: Oxxo, Mexico
Aggregation: Selcom, Tanzania
Deployment model tiers: Oxigen, India
Public policy interventions: Brazil
PAYGo as super agents: OGE, Tanzania
4

© CGAP 2017
1. Proximity MattersSubheadfor Financial Inclusion

© CGAP 2017
6
Financial services use without proximity is rare
0
100
200
300
400
500
600
700
800
0 5000 10000 15000 20000 25000 30000 35000 40000 45000
Bangladesh Botswana
Cambodia Ghana
Kenya Pakistan
Philippines Rwanda
Zambia 2015
2016
2015
2016
Mo
bile M
on
ey a
gen
tsp
er
100.0
00 a
du
lts
Mobile Money transactions per 1000 adults
2014
2012
2014
Source: CGAP based on IMF-FAS data, 2017. Selection based on data availability. The reporting methodology might duplicate
some access points for mobile money, see CGAP 2016 and Helix 2017.
In 9 leading DFS markets, mobile money use tracks closely with agent proximity

© CGAP 2017
7
Even in Kenya, demand for agents is still growing
0
5
10
15
20
25
30
35
0
20,000
40,000
60,000
80,000
100,000
120,000
140,000
160,000
180,000
200,000
Mar
-07
Jul-
07
No
v-0
7
Mar
-08
Jul-
08
No
v-0
8
Mar
-09
Jul-
09
No
v-0
9
Mar
-10
Jul-
10
No
v-1
0
Mar
-11
Jul-
11
No
v-1
1
Mar
-12
Jul-
12
No
v-1
2
Mar
-13
Jul-
13
No
v-1
3
Mar
-14
Jul-
14
No
v-1
4
Mar
-15
Jul-
15
No
v-1
5
Mar
-16
Jul-
16
No
v-1
6
Mar
-17
Jul-
17
Agents
Accounts, millions, right axis
Traditional access
point
2015: 4,351
Evolution of mobile money accounts and agents in Kenya
Source: CGAP based on Central Bank of Kenya and IMF-FAS. The reporting methodology might duplicate some
access points for mobile money, so its absolute value is less relevant than its trend.
Although almost 70% of the population already uses mobile money, agent growth
continues to track closely with account growth.Accounts,
millions

© CGAP 2017
CICO network expansion often
remains sub-optimal in reaching
rural areas.

© CGAP 2017
CGAP conducted geospatial research in Tanzania to explore the link between agent proximity and financial inclusion
It found both poor and
non-poor households in
rural areas are twice as
likely to be active
mobile money users if
they live within 5km of a
mobile money agent.
Source: CGAP 2018, upcoming publication.
Based on a heavy data-mining and analysis
exercise on a variety of supply and demand-side
data from 2013 (the last year all the data was
collected), including FII, Findex, ANA and FSP
Maps. Although the data is five years old, CGAP
used it to test hypotheses on how supply and
demand interrelate to predict frontiers in DFS in
Tanzania. This analysis is still highly relevant.
9
Active MM user (90 days) in rural areas: predicted probability
Non-Poor Poor

© CGAP 2017
10
Number of agents doesn’t matter… if all agents are in the same places
Tanzania 2013: Agent networks are
skewed towards the same areas
Despite 9x more access points, agent
networks cover a far smaller share of
the population than schools and
health centers
This is a matter of distribution
strategy, not absolute numbers of
agents
SERVICES
<5 KM AWAY NUMBER
%AGE OF POP.
<5 KM AWAY
Health Facility ~7,000 58%
School ~5,000 69%
MM agent ~45,000 44%
Source: CGAP 2018, upcoming publication.

© CGAP 2017
11
Lack of coverage may not be due to lack of demand
CGAP identified frontier areas with latent
demand but no agents (orange)
Despite latent demand in frontier areas,
providers continue to expand agent
networks in more heavily served areas
2013–’14 footprint, ~45.000 access points
Viable areas with no agent presence
Short-term, business-as-usual expansion
National parks and protected areas

© CGAP 2017
Agent network challenges
extend beyond deployment.

© CGAP 2017
13
Persistent challenges exist across agent networks
Revenue Challenges:
• Commission structures
provide inadequate
incentives
• Low demand, especially
in frontier areas
• Unclear assessment of
adjacencies or indirect
revenue for retailers
Operational Challenges:
• Expensive and time-
consuming liquidity
management
• Limited working capital
availability and cost
• Hardware/connectivity
cost and system reliability
• Lack of provider support
• Lack of infrastructure
Business Model Interaction
Challenges:
• Product design: use
cases, transactional mix
and interfaces
• Balance between
exclusivity and
aggregation
Agent Revenues ≥ Agent Expenditures
These challenges are often exacerbated in frontier areas
The following case studies demonstrate ways providers and
policymakers have sought to address one or more of these
challenges.

© CGAP 2017
2. Case StudiesSubheadFive innovative approaches that could improve the viability of frontier agents.

© CGAP 2017
Each case study addresses one or more of the challenges to agent viability
15
Low
demand
Indirect
revenue
Liquidity
mgmt.
Capital
scarcity
System
reliability
Provider
support
Lack of
infra.
Analytics
Oxxo, Mexico
Aggregation
Selcom, Tanzania
Deployment Model
Tiering
Oxigen, India
Public Policy
Intervention
Brazil
PAYGO solar as
super agents
Tanzania
Revenue side challenges Operations side challenges
Full versions of the case studies can be found at:
https://www.microfinancegateway.org/library/frontier-agents-case-studies-brazil-india-mexico-
and-tanzania

Case Study 1Analytics: Oxxo, Mexico

© CGAP 2017
Oxxo’s experience shows that rigorous data
tracking and analytics of agent operations
provides insight into the customer experience
and can help optimize liquidity levels and
indirect revenue.
Doing this remotely has significant implications
for cheaper and effective management of rural
agents.

© CGAP 2017
18
OXXO is Mexico’s largest corner store retail chain and agent network
Background
Data as of May 2017
4 million
registered
mobile
numbers
Payment platform for more
than 900 service providers
Offering 1,100 products,
480 of which have national coverage.
Agent for
11 banks
2 million financial transactions per day
Includes transactions processed on behalf
of financial services providers and others
(e.g. mobile top-ups, bus tickets)
11 million
daily customers
110,000+
employees
15,500
stores
Simplified account offered in
partnership with Citibanamex.
Activity rate: Positive balance
in the account or at least 1 trx
(monetary or non monetary)
in the last 8 weeks.
7.3 million
Saldazo accounts sold
Percentage
of active
accounts
66%

© CGAP 2017
For OXXO, the use of analytics was central to its expansion strategy when it
entered the Agent Network Management business in 2010.
Borrowing from its retail expertise, Oxxo applied rigorous analytics
and metrics to its agent business from the beginning.
OXXO’s use of analytics has mostly focused on increasing operational
efficiency of its store network, including the agent banking business.
• Aimed at guaranteeing “time optimization” as the core
value for customers.
• Real-time monitoring systems of data patterns, especially
risk related.
• Oxxo’s analytics are focused in four areas:
customer experience, risk management, sales and
operational savings.
19
Oxxo’s use of analytics

© CGAP 2017
20
• Cashier training
• System interface
simplification
• Shorter wait times
• Better match with
customer needs
Example: Banking transaction times at cashier and acceptable wait times for customers
Banking transactions
should not take more than
1 minute in order to keep
customer wait times at
acceptable “time
optimization” levels
Online monitoring and
survey of average cashier
time per transaction type,
conducted every 6 months
Data pattern discovery/insight
Indicator creation and monitoring
Corrective/improvement actions
Impact on operational efficiency
Agent banking
services
40 sec – 1 min
Saldazo
account opening
3.5 min
Long distance
bus tickets
4.5 min

© CGAP 2017
Revenue side:
Analytics provide deep
insight into direct and
indirect revenue, as well as
associated behavioral
patterns. Oxxo’s
unparalleled visibility into
these metrics drives both its
core retail business and
agent banking operations.
How Oxxo’s analytics contribute to addressing agent viability challenges
Expenditure side:
The multiple metrics that
Oxxo monitors enable agile
responses when agents
deviate from the desired
operational ranges. This is
key when managing issue
such as cash levels at tills,
and associated risk
exposure.
21

Case Study 2Agent Aggregation: Selcom, Tanzania

© CGAP 2017
Frontier agents struggle with inadequate
transaction volumes to justify the level of
working capital required. Selcom aggregates
agents and pools transactions across several
providers, increasing revenue per agent and
decreasing working capital costs (as the
agent operates from a single, pooled float
account).

© CGAP 2017
Selcom is an agent aggregator in Tanzania with 17,000+
agent locations, around 25% of market share.
Selcom agents have become de-facto shared agents,
enabling an efficient use of the same financial infrastructure
across more than 35 MNOs, banks and utility companies.
24
Agent Aggregation: Selcom, Tanzania
Background

© CGAP 2017
25
+30 providers aggregated on the back end and 17,000 retailers on the front end*
Selcom Agent Network Management business
MNOs/Telco: 7
Banks: 12Utilities &
Payees: +16
Merchants
Smartphone
App
USSD Retail POS
Back-end
aggregation
* Retrieved from selcom.net, June 2017.
Selcom’s Agent Network
Management (ANM)
business aggregates
retailers, which process
transactions for providers
that are also aggregated
at the back end.
Front-end
aggregation

© CGAP 2017
Payment Aggregation
• Selcom integrates the payment instrument provider
(banks, MNOs) with the back end of third parties (i.e. utilities)
• Without an aggregator, each integration could cost the
bank/MNO $10K-$30K
Account-to-Account (A2A) Aggregation
• Switching to integrate MNOs and banks and a turn-key offering
to enable the mobile banking offering
• Enables end customers to push between mobile wallets and
bank accounts
• Provides for seamless collection, disbursement, and circulation
of digital payments
• Some banks absorb the A2A costs while others pass a portion
on to the end customer
Value Added Services
• Pre-funding, reconciliation, settlement, reversals, connectivity,
uptime
26
Selcom’s back-end aggregation
Bank
or MNO
Third
Parties
Source: See CGAP’s Payment aggregation research for further insight

© CGAP 2017
• Selcom-branded agents are non-exclusive by definition:
• 17,000 agents using either a mobile or retail POS device to process transaction son
behalf of the wide range of entities aggregated in the back end.
• Selcom also actively develops the agent network, seeking to acquire new retailers in
order to maximize the transactional volume and the overall efficiency of the
business.
• Over half are concentrated in Dar es Salaam. Remaining network covers the next 5
largest urban centers in Tanzania (Arusha, Mwanza, Mbeya, Morogoro, Moshi).
27
Thousands of retailers are acquired as agents by connecting to Selcom’s platform
Selcom’s front-end aggregation
END CUSTOMER
Time to pay
my utility bill.
Customer walks into
Selcom agent location…
…and uses the Selcom POS
menu or smartphone app at the
agent outlet to pay the utility bill
via cash.
UTILITY
BILL PAID
IN FULL
Example of Selcom’s front-end aggregation
Source: CGAP 2016, ‘Aggregators: The Secret Sauce to Digital Financial Expansion.”
SELCOM AGENT

© CGAP 2017
Revenue side:
Aggregation enables Selcom
to maximize the portion
of the transaction pool
in a given location that
their agents can process,
increasing their viability.
.
How Selcom’s aggregation contributes to addressing agent viability challenges
Expenditure side:
Selcom agents spend less
on start-up and working
capital costs as a single
float account covers
multiple providers.

Case Study 3Deployment Model Tiers:
Oxigen, India

© CGAP 2017
Most providers operate a single agent model
across all geographies in their market.
Oxigen’s tiered deployment model enables it
to better match local supply and demand.
Where transaction volumes are low and
uncertain, agents can start with a less
expensive deployment model and move up
as transaction volumes increase.

© CGAP 2017
Oxigen India has implemented an innovative strategy to expand its
200,000 agents network: Deployment Model Tiers
Oxigen’s 7 different Deployment Models (DM) allow it to choose the model
best suited to local demand. Initial investments range from USD $8 to
$385.
Lighter DMs are better suited to locations with shallow demand and
therefore lower returns. They comprise 94% of the agents and 77% of the
transactions volume of Oxigen’s network.
Heavier DMs are suitable for locations that require a wider range of
services, including banking services. These are deployed in a more limited
number of locations, but they drive 23% of transaction value.
Deployment Model Tiers as growth strategy: Oxigen, India
Background

© CGAP 2017
Oxigen operates a technological platform and manages a network of
independent retailers (also known as agents) that perform financial transactions
on behalf of multiple third parties, who pay a fee for the service.
Sources: Oxigen: Ushering the Fintech Revolution; The DQ Week: Oxigen Micro ATM
Oxigen’s business model
32

© CGAP 2017
Oxigen’s 7 deployment models:
33
This contrasts with most agent network managers who usually work
with a single one
Oxigen operates multiple deployment models
Setup fees not applicable:
Set-up fee: charged by Oxigen to new agents. Includes training and
branding, in some cases hardware.
Mobile
Agent
Web
App
Basic
POS
Micro
ATM
Banking
Portal
Corporate
Retail Chains
Consumer
Wallet
Cheaper setup fees or lighter development models:

© CGAP 2017
34Data accurate as of September 2016.
Oxigen’s deployment models

© CGAP 2017
Note: INR 700,000 = USD $10,000 35
This flexibility enables a better match between an agent and the local demand
Each of Oxigen’s deployment models targets very different demand levels
₹ 9,000₹ 40,000
₹ 150,000
₹ 193,746
₹ 602,000
Mobile Agent Basic POS Web App MicroATM Banking Portal
Transactional value per deployment
model, agent monthly average, 2016.

© CGAP 2017
How Oxigen’s deployment model tiers can contribute to addressing agent viability challenges
Revenue side:
Lighter deployment models
are well suited for frontier
areas, where transaction
volumes might be low.
Expenditure side:
Lighter DMs can be operated
at a low cost and in areas with
reduced electricity and
infrastructure.
36

Case Study 4Public Policy Interventions: Brazil

© CGAP 2017
Brazil achieved 100% financial access
through regulation and leveraging of state-
owned banks and infrastructure (post
offices). In order for agent networks to reach
the last mile, Brazil illustrates that
governments may need to become more
involved by offering of incentives or other
levers.

© CGAP 2017
With 250,000 access points at its peak, agents cover 100%
of municipalities in Brazil
Public policy intervention, channeled through regulation and state-owned
financial institutions, played a central role in this achievement:
• Regulation struck an adequate balance between growth first and,
a decade later, stricter risk management.
• State owned banks and the national post were smart and aggressive
in pursuing their financial inclusion objectives in partnership with
the private sector, especially in the initial scale-up phase in the early
2000s. Extensive coverage was a specific policy objective.
39
Background
Public Policy Interventions: Brazil

© CGAP 2017
40
Defined as municipalities with at least one agent
Brazil reached 100% financial access coverage in 2010
Source: Link to information
Access points per 10,000 municipality inhabitants
In 2013 there were 245,075 agents equaling half of financial access points

© CGAP 2017
Regulation through the central bank:
An appropriate balance was achieved between innovation and risk
management, which was addressed at a later stage in 2011.
State-owned financial institutions’ investments:
Aggressively pursued their mandates of financial inclusion but articulated
these goals in partnerships with the private sector, turning them into profitable
businesses overall:
41
Extensive coverage was an explicit policy objective
Two main conduits for universal coverage policies in Brazil
Correios: National Post
Launched Postal Bank in 2001,
which focused on making each
postal office an agent location.
Caixa: National Savings Bank
Leveraged its existing lottery network
in 2000 to make the outlets also
financial access points. It also utilized
G2P to increase transactional
volumes through the agent network*
*Bolsa Familia, 2004

© CGAP 2017
42
2000 marked the scaling up of the model, while de-risking arrived in 2011
Brazil was an early adopter of agents, starting in 1973
1973 1989 1999 2000 2004 2011
Banks authorized to hire
agents for payment
transactions on their
behalf.
Credit and payment agents
consolidated under one
rule, in cities without
branches
Banks authorized
to freely set
agreements for
payments
Requirement of hiring
agents only
in cities without
bank branches
is eliminated
Banks allowed to
open simplified
accounts with
proportionate KYC
requirements
Agents required to be firms,
rather than individuals.
Monitoring/auditing becomes
mandatory for agent networks

© CGAP 2017
0
50,000
100,000
150,000
200,000
250,000
300,000
2007 2008 2009 2010 2011 2012 2013 2014 2015 2016
Number of Agents
Converging causes:
43
Absolute volume of transactions still grows, but overall share of transactions
conducted at agents decreased from 10% to 7%.
Agents peaked in Brazil in 2013
-
1,000
2,000
3,000
4,000
5,000
2008 2009 2010 2011 2012 2013 2014 2015 2016
Agent Transactions (millions)
Sources:
BCB: Series Temporais (24905); Relatorio de Inclusao Financeira (2015); Estatisticas Pagamentos de Varejo
Agent saturation,
less so in lower
income areas
Tighter
regulation
Channel’s
decreasing use
relative to mobile

© CGAP 2017
44
As agents peak, mobile transactions take the lead
-
10,000
20,000
30,000
40,000
50,000
60,000
2008 2009 2010 2011 2012 2013 2014 2015 2016
Number of Transactions, in millions
Other Full/partial service Branches
ATM Internet Banking
Mobile Banking Agents7.0%
27.6%
33.4%
16.8%
13.4%
1.8%
Source: BCB:Estatisticas Pagamentos de Varejo

© CGAP 2017
Public policy interventions such as those implemented in
Brazil prioritized coverage as an objective rather than leaving
it purely to market dynamics.
As the Brazilian agent market goes into a consolidation
phase, it is time to revisit operational models to avoid losing
coverage in some municipalities, especially underserved
ones. Deployment model tiering and aggregation could have
a positive impact for this new phase.
45
How Brazil’s public policy interventions can address key challenges (1 of 2)

© CGAP 2017
In other markets, various potential approaches to public support
could be useful, particularly if governments want to focus on
specific areas:
• A time bound, declining subsidy
• Leveraging state-owned or state-affiliated assets
• A Universal Coverage Access Fund, modelled on those
for GSM networks.
These decisions should be informed by analytics, for example
geospatial analytics and an agent census.
46
Government support could also be targeted towards specific areas
How Brazil’s public policy interventions can address key challenges (2 of 2)

Case Study 5:PAYGo suppliers as master agents: Tanzania

© CGAP 2017
Poor density of mobile money agents has a
significant impact on customer experience
and the weekly payment collections of
PAYGo solar companies. Off-Grid Electric in
Tanzania conducted a small pilot to explore
becoming a master agent in order to ease
the payment friction challenges of its rural
customers –while also expanding the agent frontier in rural Tanzania.

© CGAP 2017
Off-Grid Electric (OGE) is a start-up that provides solar home systems in
Ivory Coast, Rwanda and Tanzania. Tanzania is its biggest market with
over 100,000 off-grid customers.
Rural distribution is one of the biggest challenges to serving off-grid
markets. OGE leverages informal supply chains to deliver items (solar
home kits plus TVs and other items) cost effectively to the “last mile.”
OGE uses the pay-as-you-go (PAYGo) model with mobile money, which
gives customers control over how and when to pay for the service.
Customers can either pay via a wallet (most likely requiring an agent for
cash-in) or over-the-counter at an agent. This means that OGE is reliant
on the agent networks of mobile money providers to determine where to
expand.
49
Background
PAYGo suppliers as master agents: Tanzania

© CGAP 2017
50
How PAYGo solar might address agent distribution and viability
The Problem
• Target customers for PAYGo solar tend
to live in rural and remote areas, off
the electricity grid.
• The dearth of agents in areas of
operation for PAYGo companies is a
real problem: if customers can’t cash
in, they can’t pay.
• In East Africa, solar providers indicate
that up to 30% of their users report
payment issues, while in West Africa
this number is as high as 50%.
• Some providers are resorting to
building cash collection points to
address these payment frictions.
Potential Solution
There may be a business case for PAYGo
providers to be MM agents, leading to a win-win
situation:
1. Cash flow for the solar business runs
opposite to the typical net cash out pattern
for rural agents, as customers are cashing in
to pay for the solar service. This lowers the
rebalancing cost.
2. Periodic solar payments ensure a steady
agent transaction volume.
3. Commissions for non-solar related CICO
yields ancillary revenue for agent and
PAYGo alike.
4. For mobile network operators this means
increased footprint and increased revenues.
© CGAP 2017
51
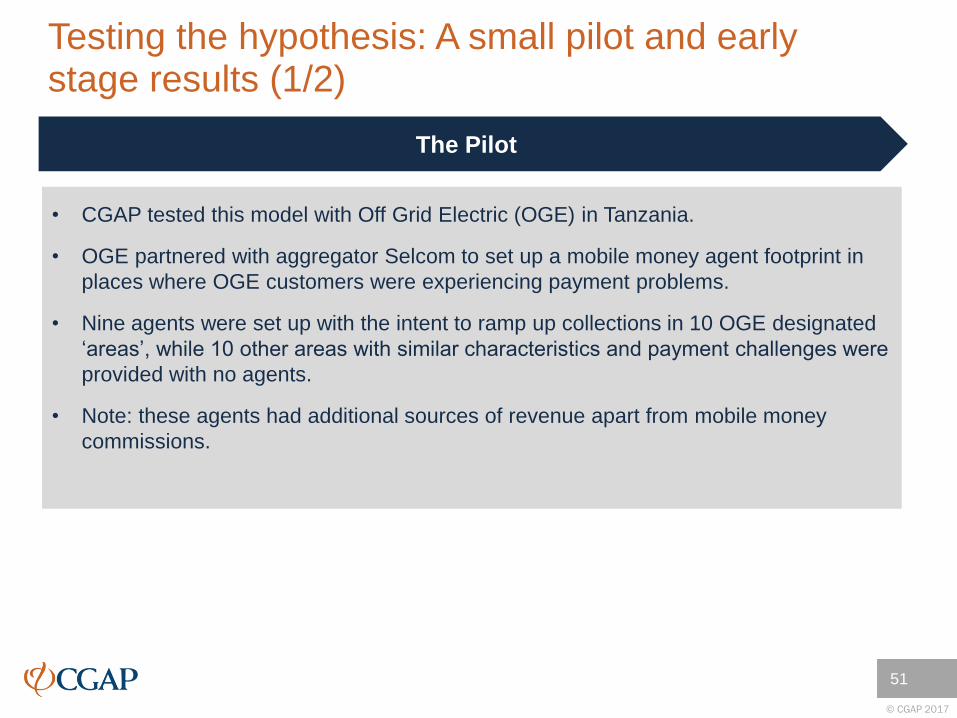
Testing the hypothesis: A small pilot and early stage results (1/2)
The Pilot
• CGAP tested this model with Off Grid Electric (OGE) in Tanzania.
• OGE partnered with aggregator Selcom to set up a mobile money agent footprint in
places where OGE customers were experiencing payment problems.
• Nine agents were set up with the intent to ramp up collections in 10 OGE designated
‘areas’, while 10 other areas with similar characteristics and payment challenges were
provided with no agents.
• Note: these agents had additional sources of revenue apart from mobile money
commissions.

© CGAP 2017
52
Testing the hypothesis: a small pilot and early stage results (2/2)
For the PAYGo provider
4 – 7%Increase in customer payment
rate in areas with agents vs.
no agents.
Initial results
For the Agents
1,178Total number of transactions1
in a 4-month period over 9
agents.
$2,780Value transacted by the agents
over the 4-month period2.
• The model had a distinct positive impact on OGE’s
key metrics of payment rates and cost savings.
• This boost grew clearly over time & may rise further.
• OGE now plans to scale this up, to capitalize on that
impact and get more data on the overall economics.
Bottom line
1This was a very basic pilot, with agents accepting only CI and bill payment transactions. Cash-Out transactions, which are typically higher margin,
were not part of this initial pilot. 2Two agents barely performed due to various reasons. If the outliers are removed then the average txn. volume / agent jumps to 167. The median
transaction volume is 59 over a 4-month period.

© CGAP 2017
From pilot to scale: what could this look like?
Hypothetical PAYGo provider, with 50K customers, that chooses to become a
master agent
10-18
Percentage point incremental bump in annual revenues collected via a master agent
model compared to the current payment collection work-arounds deployed by PAYGo
providers.
PAYGO providers can capture up to or more than $1MN in lost revenue annually caused
by payment frictions (depending on the growth rate of the business and the level of
payment friction faced).
Impact on PAYGo provider
1201
Minimum volume of monthly transactions (Cash-In2, Cash-Out, Airtime, and Solar bill
payments) needed to make a a stand-alone agent business viable in a frontier setting.
This is a very conservative scenario. On average, agents in Tanzania do around 30
transactions a day (900 transactions a month)3.
In the case of this small pilot, where agents were allowed to offer only select transactions
the average transaction volumes / agent were around 32 per month. However, OGE and
Selcom are confident of pushing greater volume of customers to these agent outlets in
the future, significantly boosting their viability.
Source: CGAP Analysis and financial model, forthcoming.1. 120 – this transaction volume is assumed if the agency business is stand-alone. However, it is likely that the mobile
money business is supplementary to the core business of the agent. 2. Average Value of CI = $25, CO = $20, Airtime =
$2. 3. Microsave Agent Network Accelerator Survey, 2013.
Impact on Agent Viability

© CGAP 2017
How the PAYGo as master agent model can contribute to addressing key challenges
The Off-Grid experiment aimed to explore the question of what types of
partnerships could improve agent viability in frontier areas, while
addressing the payment friction challenges solar companies faced.
The geographical expansion of solar companies into off-grid frontier
areas presents a real opportunity for mobile network operators and
aggregators looking to expand distribution rails. The presence of solar
companies increases the number of cash-in / bill payment transaction
volumes per agent, reducing time to break even on the business. In
some cases, solar companies might choose to become master agents
themselves in order to expand into currently underserved areas.

© CGAP 2017
Despite large-scale agent networks in an increasing number of countries,
growth is uneven. CGAP’s research in Tanzania reveals that business-as-
usual expansion would have only a minimal impact on financial inclusion.
Agents in frontier areas face similar challenges to those their urban
counterparts face (liquidity management, working capital, connectivity)
but they are accentuated. They also face unique challenges (low demand
and transactional volume). This means that people living in frontier areas
might experience both low proximity to financial access points and poor
quality.
New approaches led by both private and public sector actors
are needed. Rigorous analytics, agent aggregation, deployment model
tiers, public policy interventions and partnerships with off-grid solar
companies are five models that could be applied to other markets.
55
Conclusion

© CGAP 2017
www.cgap.org