Embed Size (px)
DESCRIPTION
Psyc 235: Introduction to Statistics. DON’T FORGET TO SIGN IN FOR CREDIT!. http://www.psych.uiuc.edu/~jrfinley/p235/. Announcements (1of2). Early Informal Feedback https://webtools.uiuc.edu/formBuilder/Secure?id=9748379 Open until Sat March 15th - PowerPoint PPT Presentation
Citation preview

Psyc 235:Introduction to Statistics
DON’T FORGET TO SIGN IN FOR CREDIT!
http://www.psych.uiuc.edu/~jrfinley/p235/
Announcements (1of2)
• Early Informal Feedback https://webtools.uiuc.edu/formBuilder/Secure?id=9748379
Open until Sat March 15th• Special Lecture Thurs March 13th:
Conditional Probability (incl. Law of Total Prob., Bayes’ Theorem)Mandatory for invited studentsAnyone can comeNo OH; Go to lab for Qs/help.
Announcements (2of2)
• Target Dates: STAY ON TARGET! You should be finishing the Distributions
sliceVoD “5. Normal Calculations, 17.
Binomial Distributions,” and “18. The Sample Mean and Control Charts,”
• Quiz 3: Thurs-Fri March 13th-14th
€
X
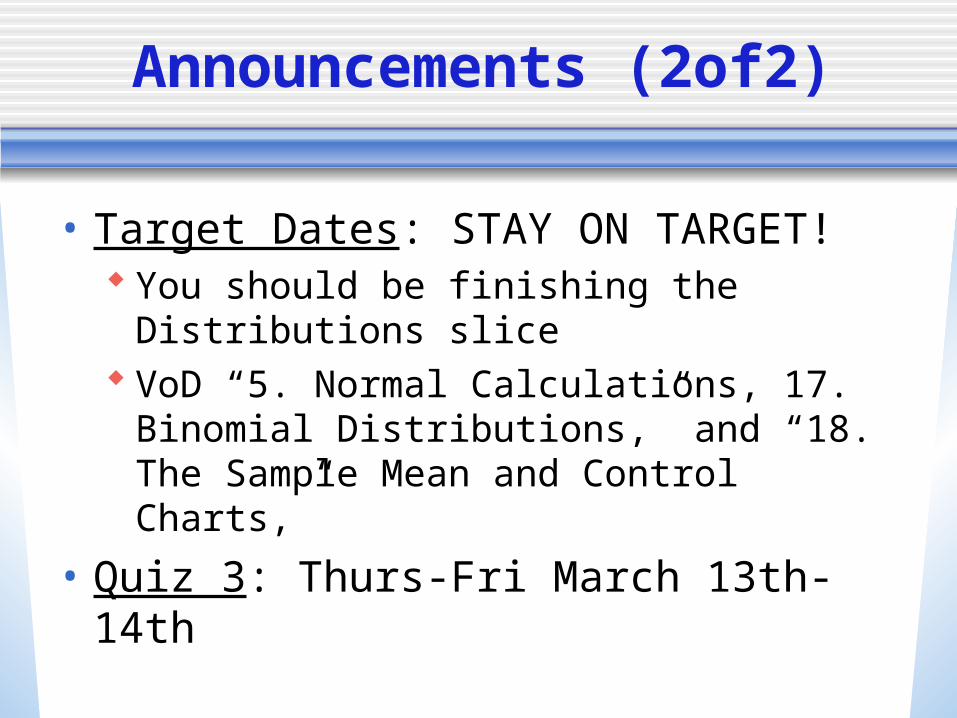
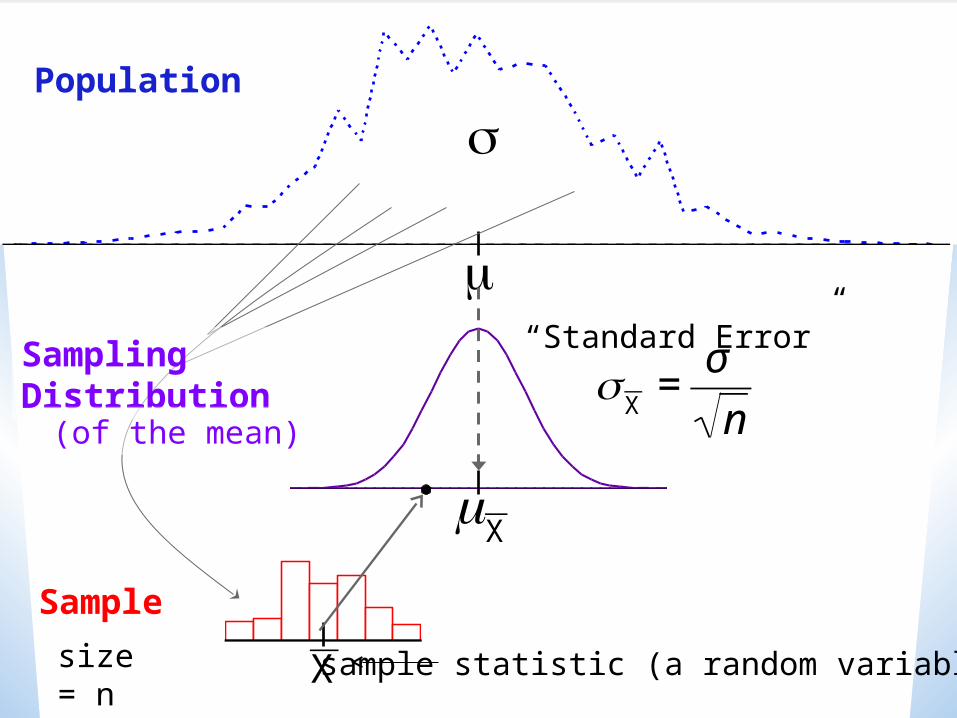
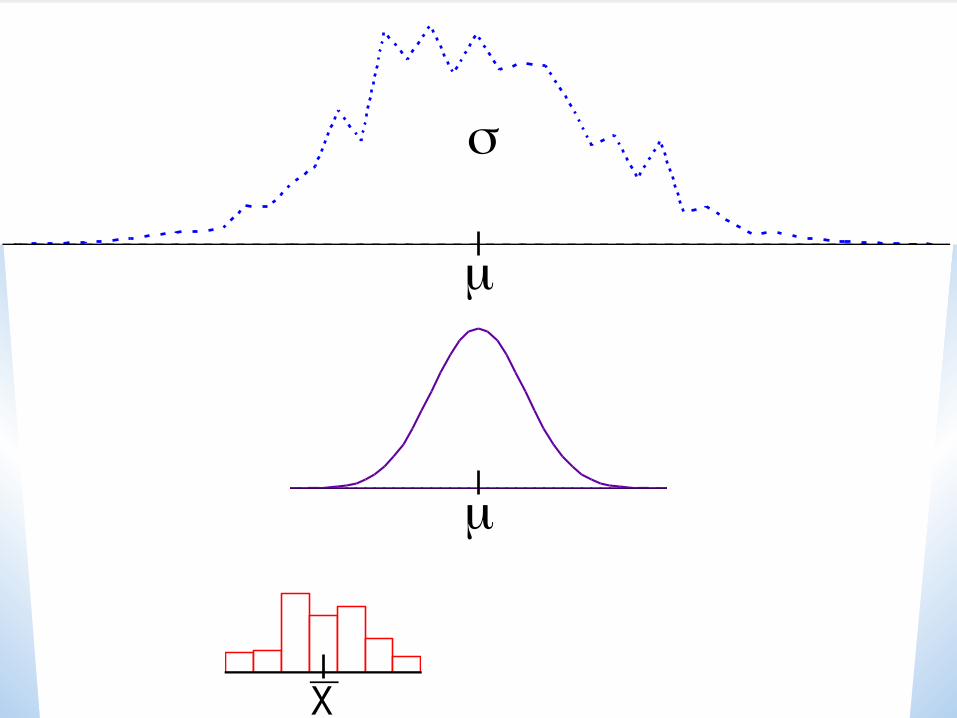
Population
Sample
SamplingDistribution
€
X
size = n
€
X
=σ
n
“Standard Error”
sample statistic (a random variable!)
(of the mean)
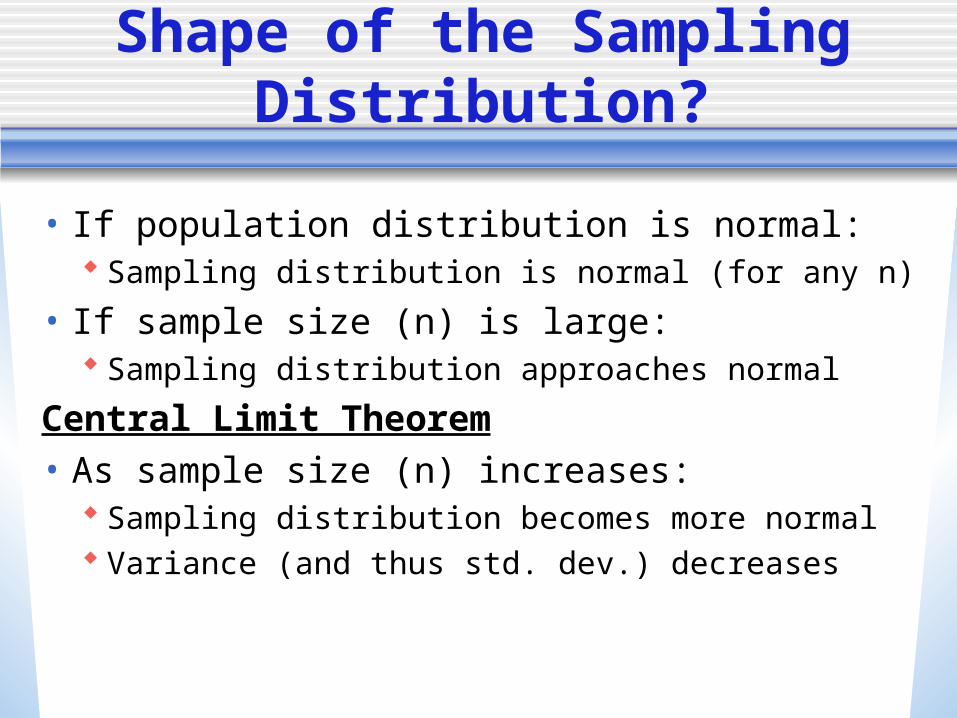
Shape of the Sampling Distribution?
• If population distribution is normal: Sampling distribution is normal (for any n)
• If sample size (n) is large: Sampling distribution approaches normal
Central Limit Theorem• As sample size (n) increases:
Sampling distribution becomes more normalVariance (and thus std. dev.) decreases
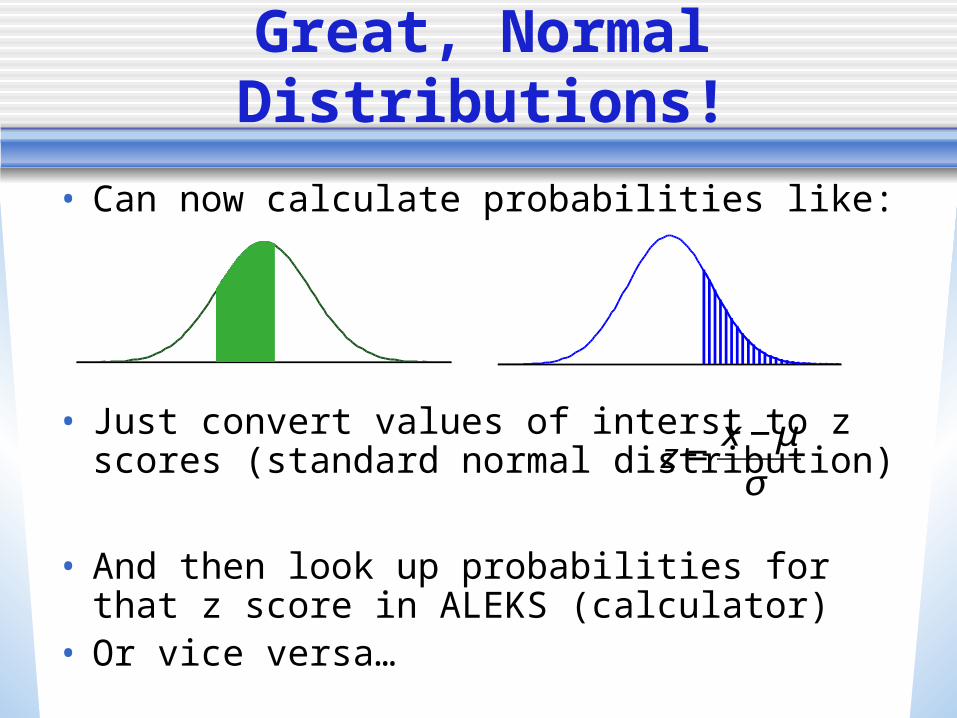
Great, Normal Distributions!
• Can now calculate probabilities like:
• Just convert values of interst to z scores (standard normal distribution)
• And then look up probabilities for that z score in ALEKS (calculator)
• Or vice versa… €
z =x − μ
σ
So far…
• We’ve been doing things like:Given a certain population, what’s prob
of getting a sample statistic above/below a certain value?
Population--->Sample
• How can we shift to …Using our Sample to reason about the
POPULATION? Sample--->Population
INFERENTIAL STATISTICS!
• Estimating a population parameter (e.g., the mean of the pop.: )
• How to do it: Take a random sample from the pop.Calculate sample statistic (e.g., the
mean of the sample: ) That’s your estimate.
• Class dismissed.€
X
No, wait!
• The sample statisticis a point estimate of
the population parameter • It could be off, by a little, or by a lot!€
X
€
X
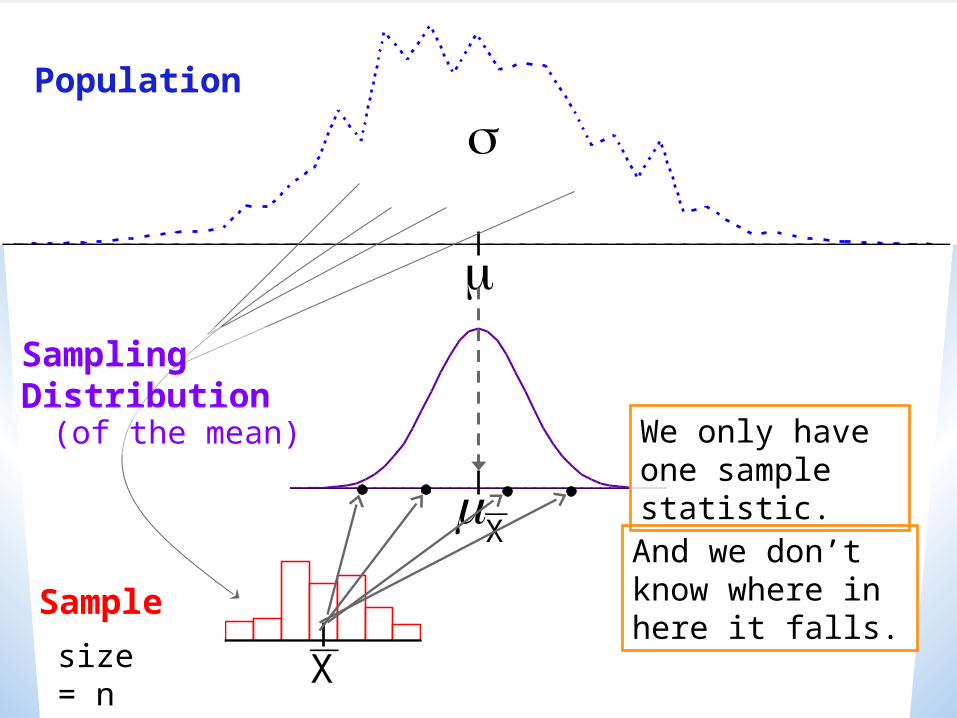
Population
Sample
SamplingDistribution
€
X
size = n
(of the mean) We only have one sample statistic.
And we don’t know where in here it falls.
Interval Estimate
• Point estimate (sample statistic) gives us no idea of how close we might be to the true population parameter.
• We want to be able to specify some interval around our point estimate that will have a high prob. of containing the true pop parameter.
Confidence Interval
• An interval around the sample statistic that would capture the true population parameter a certain percent of the time (e.g., 95%) in the long run. (i.e., over all samples of the same size,
from the same population)
€
X
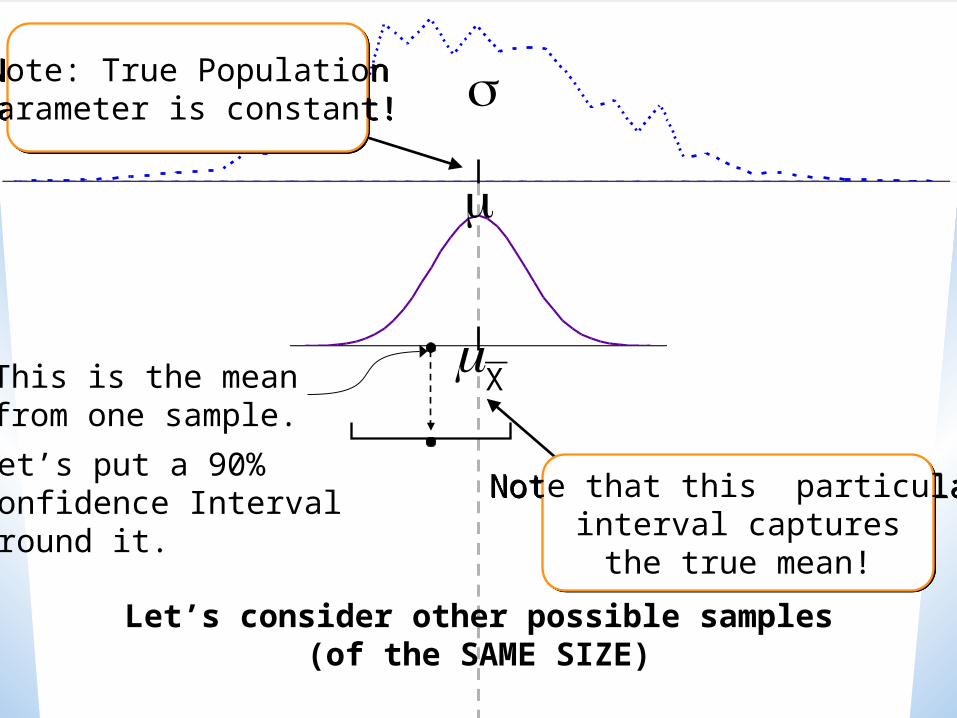
This is the meanfrom one sample.
Let’s put a 90% Confidence Intervalaround it.
Note: True PopulationParameter is constant!Note: True PopulationParameter is constant!
Note that this particularinterval capturesthe true mean!
Note that this particularinterval capturesthe true mean!
Let’s consider other possible samples(of the SAME SIZE)
€
X
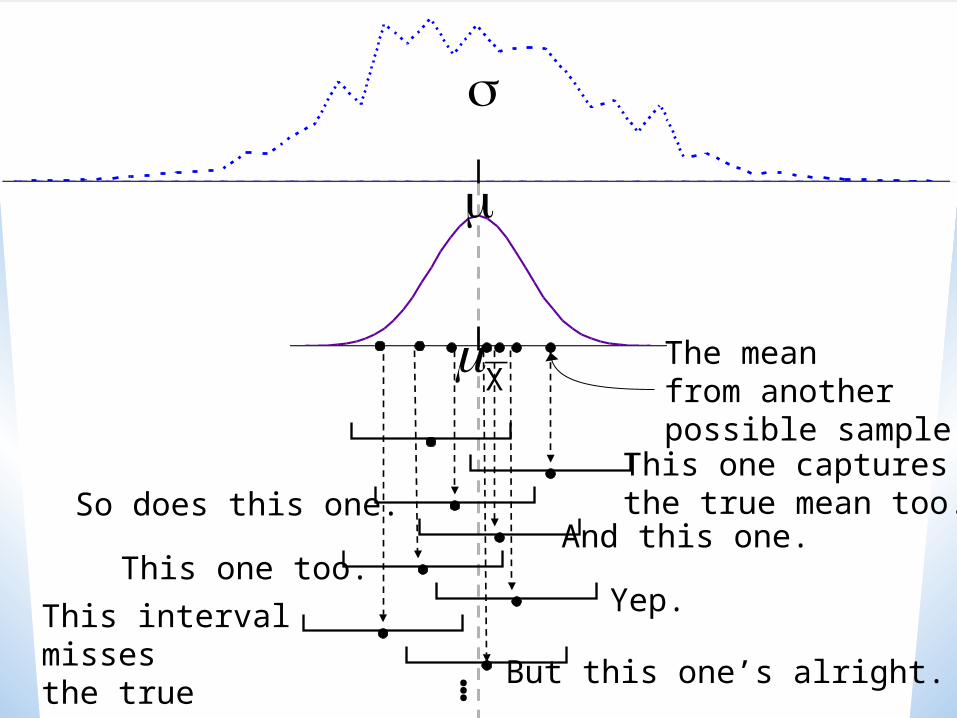
The meanfrom another possible sample.
This one capturesthe true mean too.So does this one.
And this one.This one too.
Yep.This interval missesthe true mean! But this one’s alright.…
€
X
…
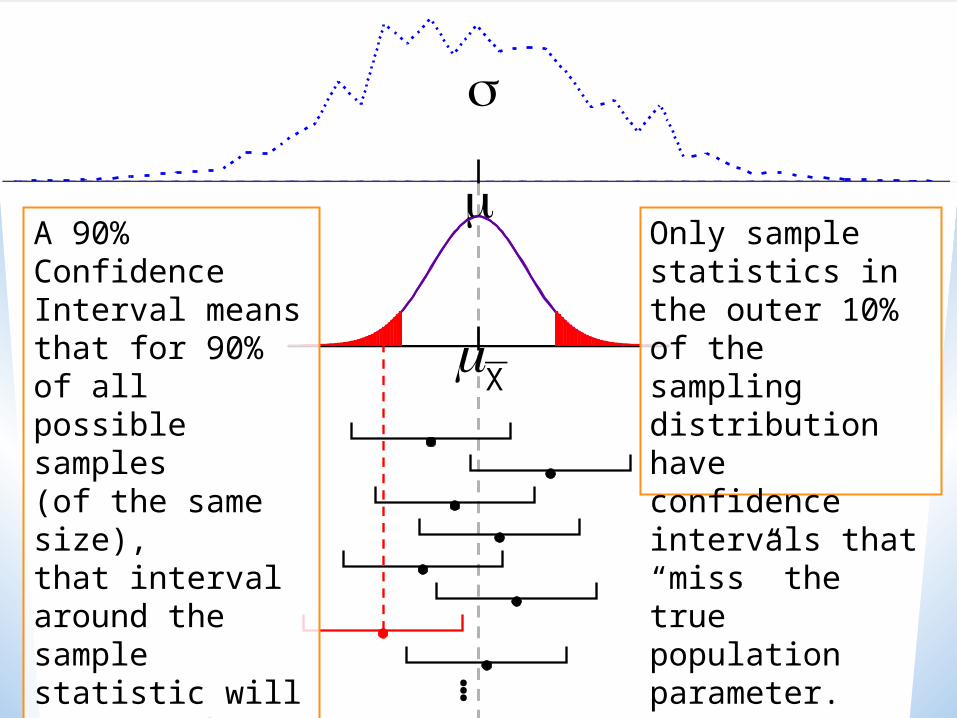
A 90% Confidence Interval means that for 90% of all possible samples(of the same size),that interval around the sample statistic will capture the true population parameter(e.g., mean).
Only sample statistics in the outer 10% of the sampling distribution have confidence intervals that “miss” the true population parameter.
€
X
…
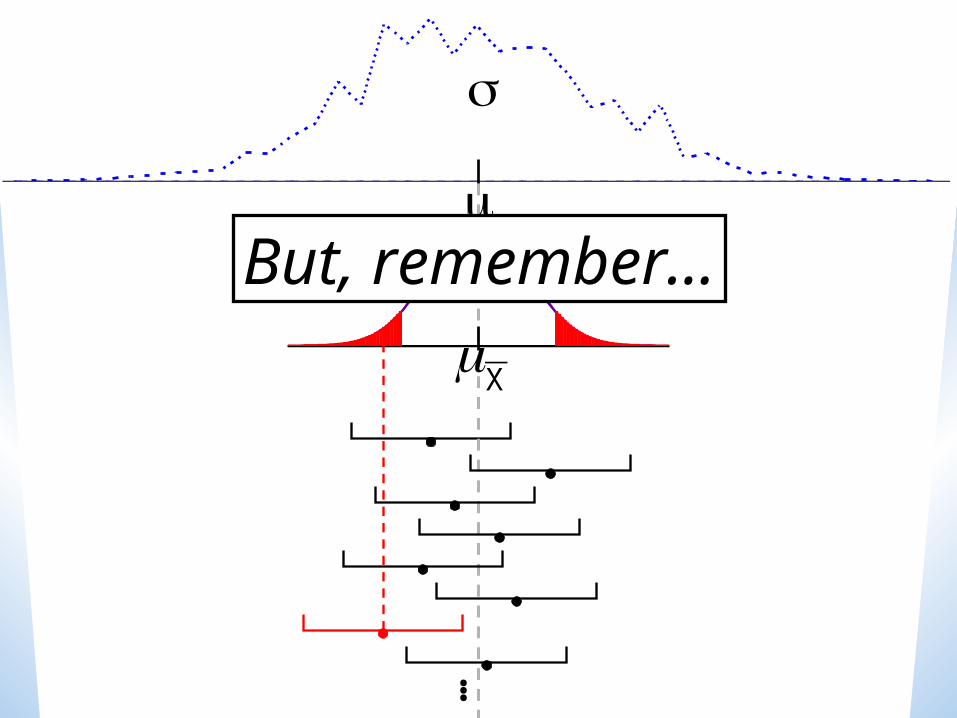
But, remember…
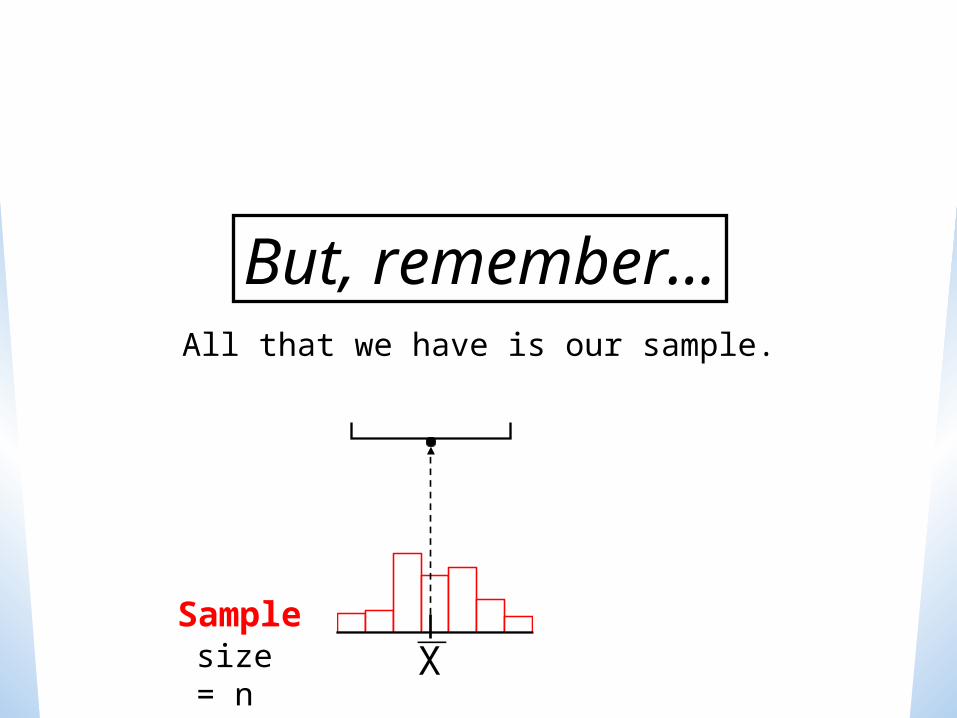
But, remember…
€
X Sample
size = n
All that we have is our sample.
€
X Sample
size = n
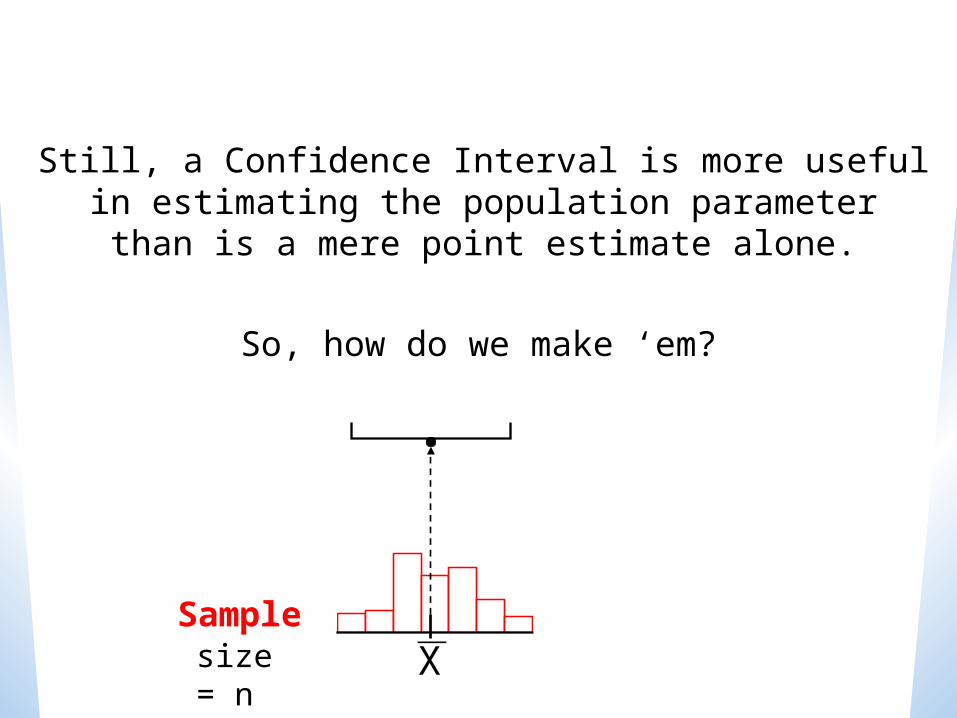
Still, a Confidence Interval is more usefulin estimating the population parameter
than is a mere point estimate alone.
So, how do we make ‘em?
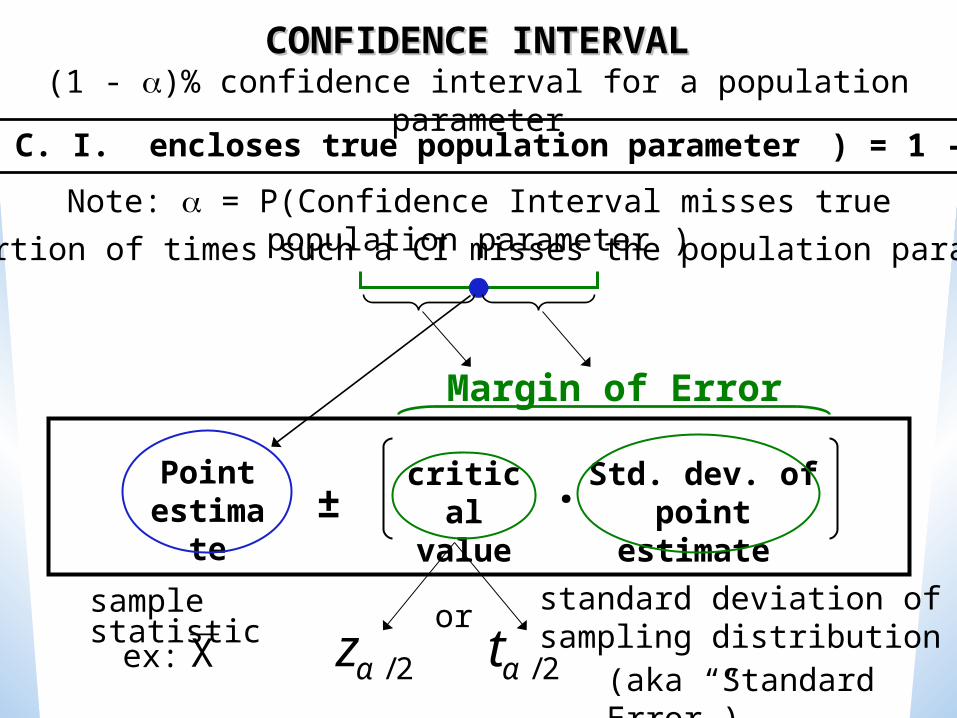
CONFIDENCE INTERVALCONFIDENCE INTERVAL(1 - )% confidence interval for a population parameter
Note: = P(Confidence Interval misses true population parameter )
Pointestimate ±
criticalvalue
Std. dev. ofpoint estimate ·
P( C. I. encloses true population parameter ) = 1 -
“Proportion of times such a CI misses the population parameter”
sample statistic
Margin of Error
ex:
€
X (aka “Standard Error”)
standard deviation ofsampling distribution
€
zα / 2
€
tα / 2
or
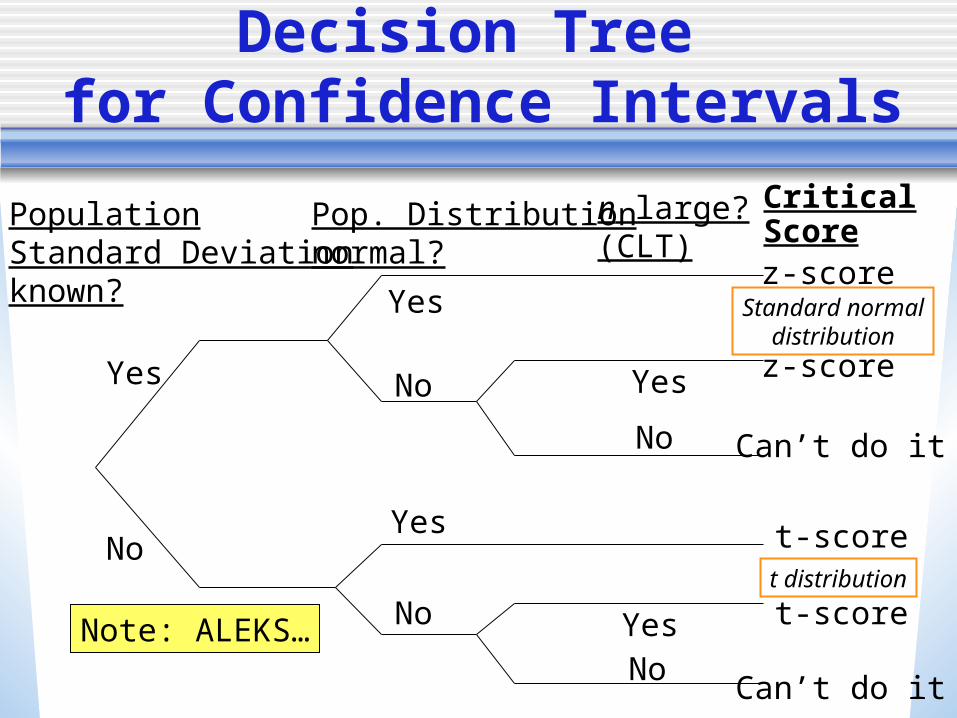
Decision Tree for Confidence Intervals
PopulationStandard Deviationknown?
Yes
No
Pop. Distributionnormal?
n large?(CLT)
Yes
No Yes
No
Yes
No YesNo
z-score
z-score
Can’t do it
Can’t do it
t-score
t-score
CriticalScore
Note: ALEKS…
Standard normaldistribution
t distribution
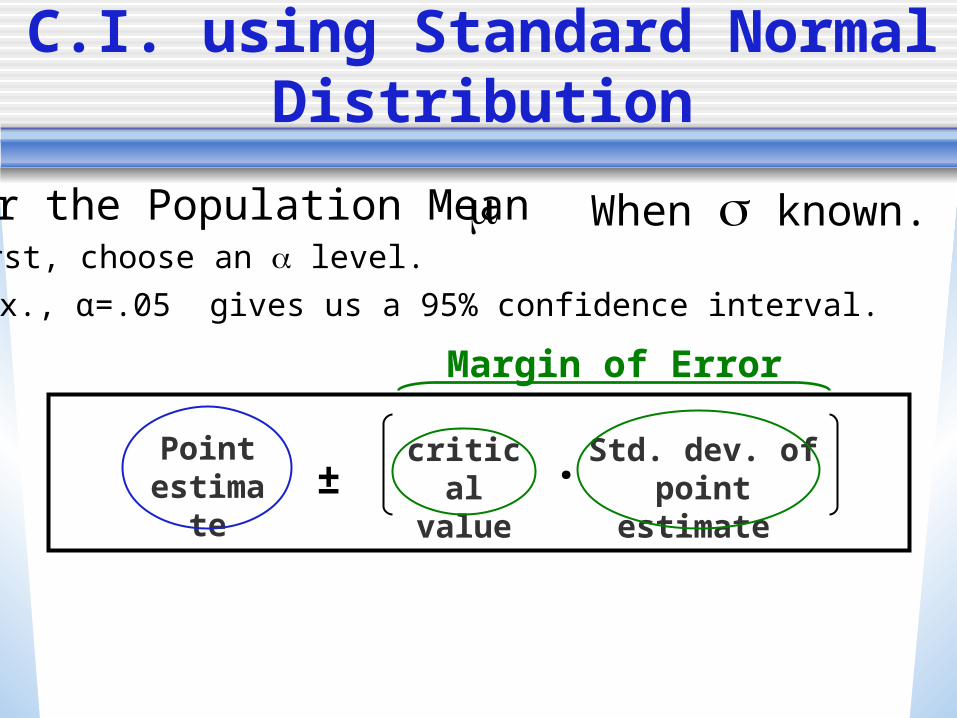
C.I. using Standard Normal Distribution
For the Population Mean First, choose an level.
For ex., α=.05 gives us a 95% confidence interval.
Pointestimate ±
criticalvalue
Std. dev. ofpoint estimate ·
Margin of Error
When known.
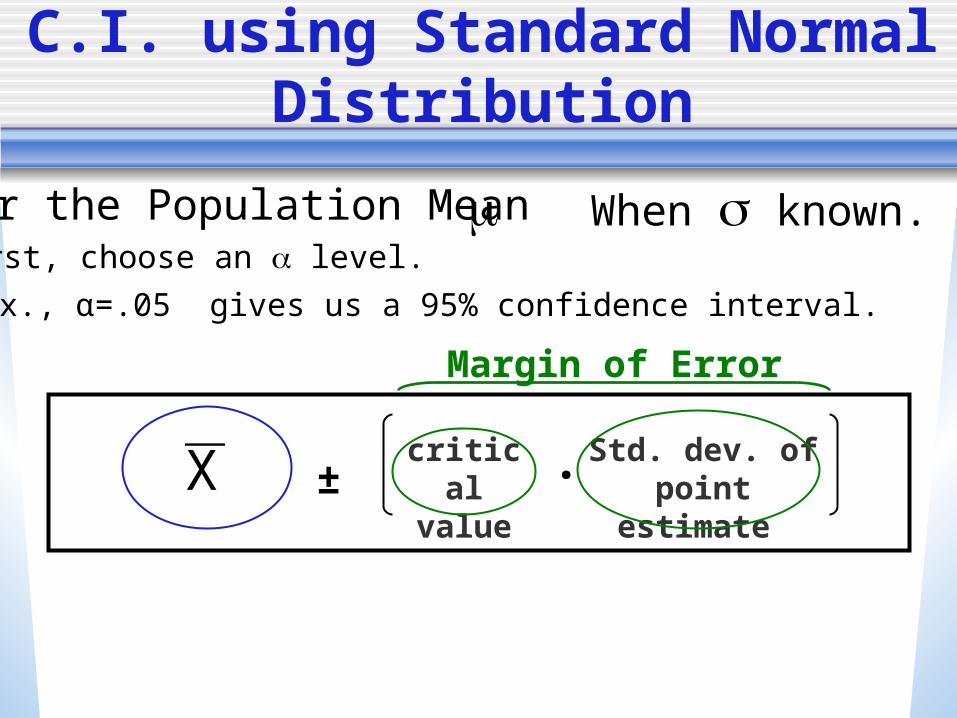
C.I. using Standard Normal Distribution
For the Population Mean First, choose an level.
For ex., α=.05 gives us a 95% confidence interval.
±criticalvalue
Std. dev. ofpoint estimate ·
Margin of Error
€
X
When known.
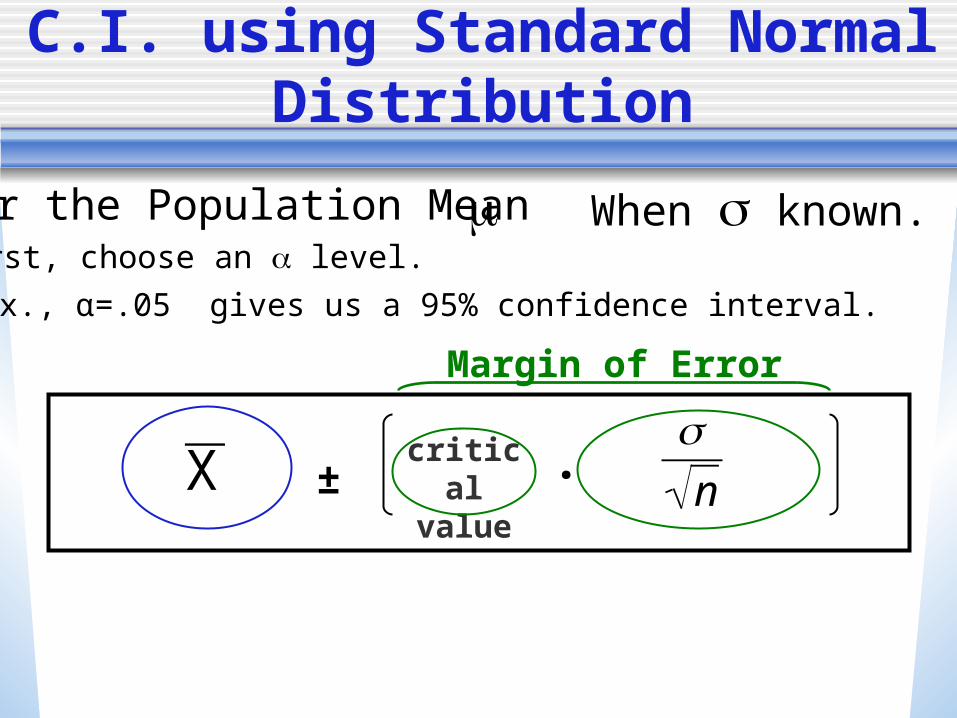
C.I. using Standard Normal Distribution
For the Population Mean First, choose an level.
For ex., α=.05 gives us a 95% confidence interval.
±criticalvalue ·
Margin of Error
€
X
€
n
When known.
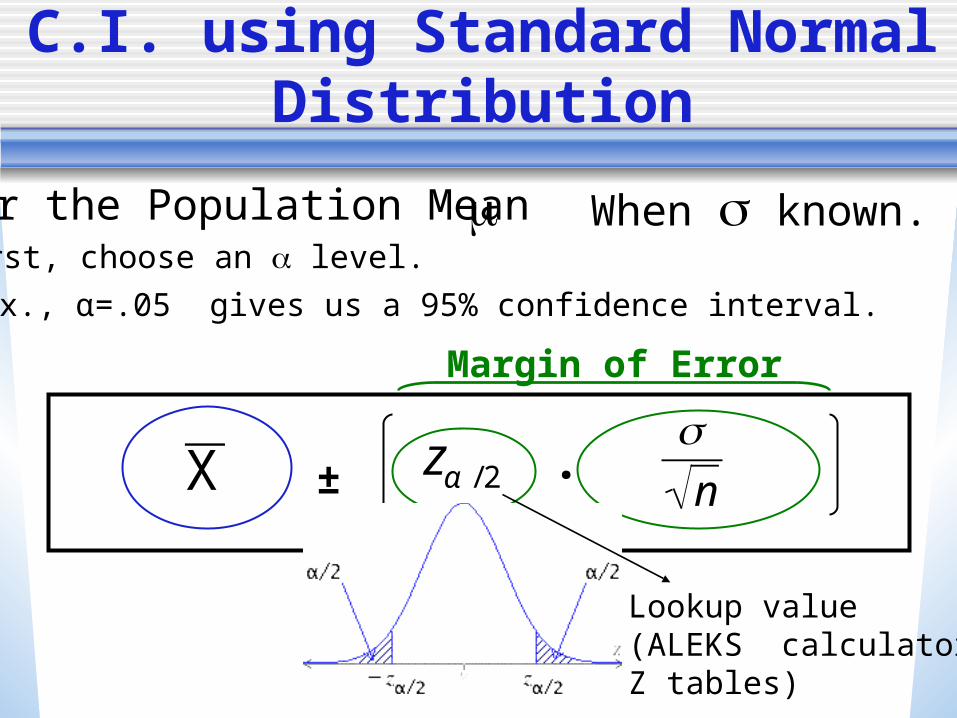
C.I. using Standard Normal Distribution
For the Population Mean First, choose an level.
For ex., α=.05 gives us a 95% confidence interval.
± ·
Margin of Error
€
X
€
n
When known.
€
zα / 2
Lookup value(ALEKS calculator,Z tables)
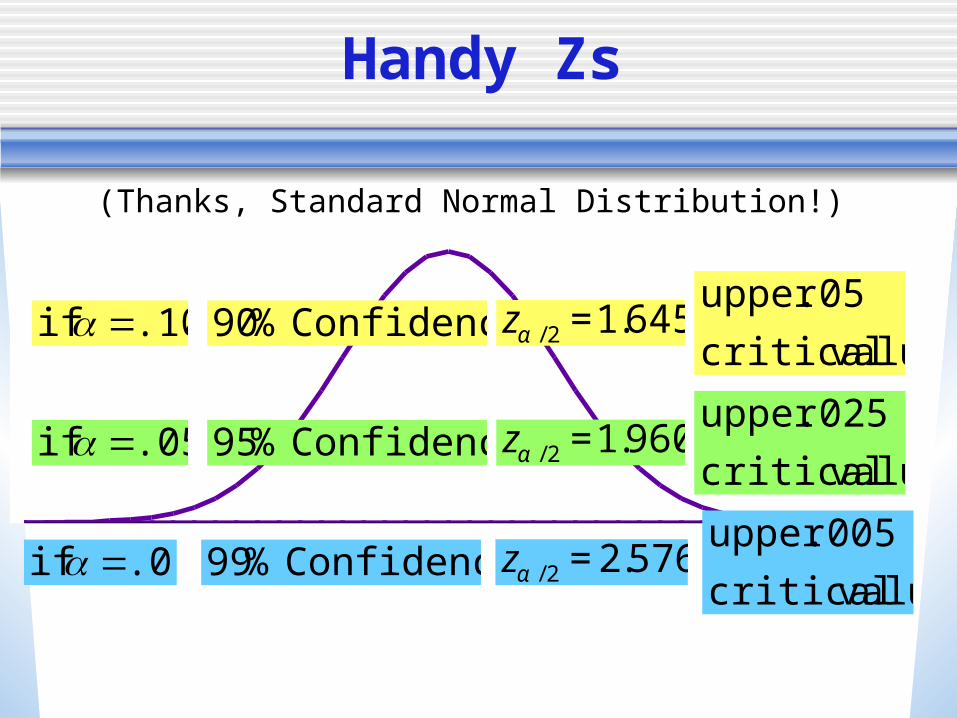
.10 if =
.05 if =
.01 if =
Confidence %90
Confidence %95
Confidence %99
€
zα / 2 =1.645
€
zα / 2 =1.960
€
zα / 2 = 2.576
valuecritical
.05upper
valuecritical
.025upper
valuecritical
.005upper
Handy Zs
(Thanks, Standard Normal Distribution!)
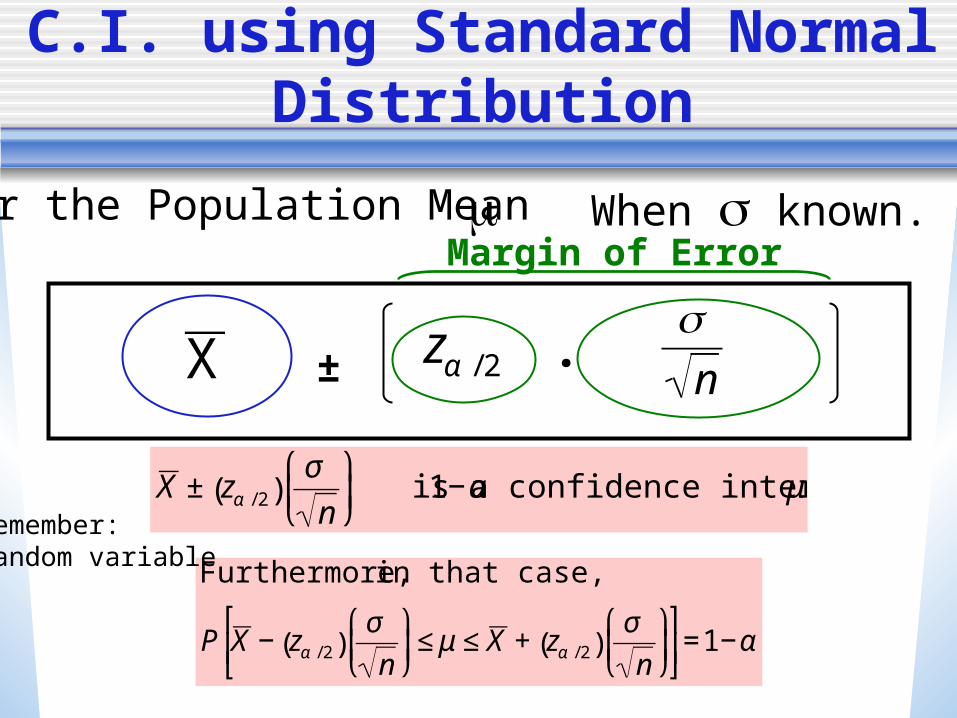
C.I. using Standard Normal Distribution
For the Population Mean
± ·
Margin of Error
€
X
€
n
When known.
€
zα / 2
€
X ± zα / 2( )σ
n
⎛
⎝ ⎜
⎞
⎠ ⎟ is a 1−α confidence interval of μ
€
Furthermore, in that case,
P X − zα / 2( )σ
n
⎛
⎝ ⎜
⎞
⎠ ⎟≤ μ ≤ X + zα / 2( )
σ
n
⎛
⎝ ⎜
⎞
⎠ ⎟
⎡
⎣ ⎢
⎤
⎦ ⎥=1−α
Remember:random variable
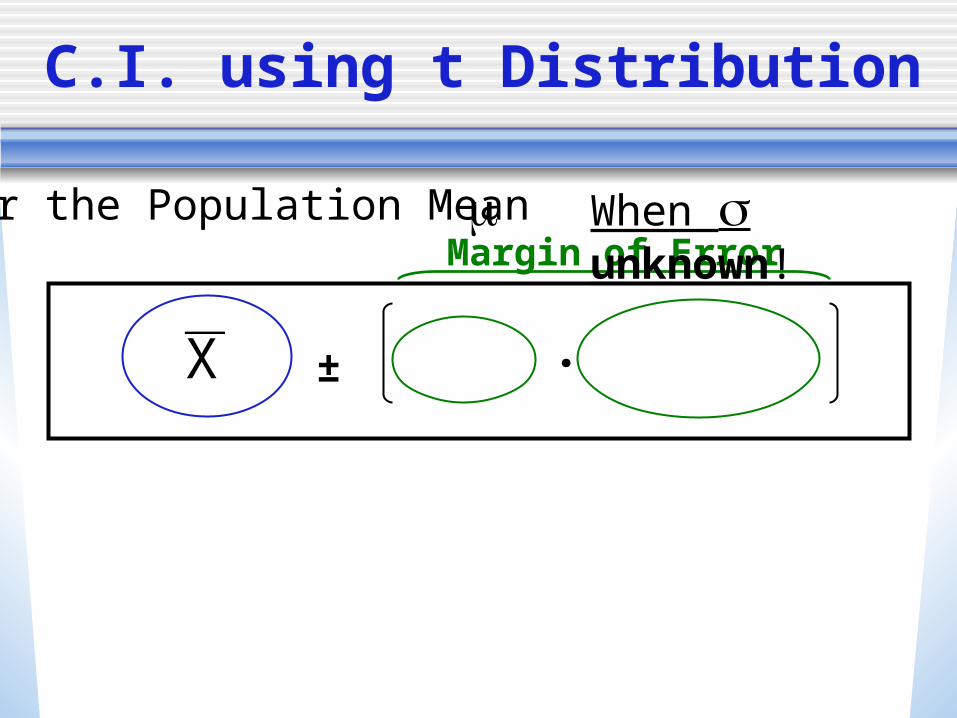
C.I. using t Distribution
For the Population Mean
± ·
Margin of Error
€
X
When unknown!

C.I. using t Distribution
For the Population Mean
± ·
Margin of Error
€
X
€
s
n
When unknown!
We use the standard deviation from our sample (s)to estimate the population std. dev. ().
€
s =x i − x ( )
2∑n −1
The “n-1” is an adjustment tomake s an unbiased estimatorof the population std. dev.
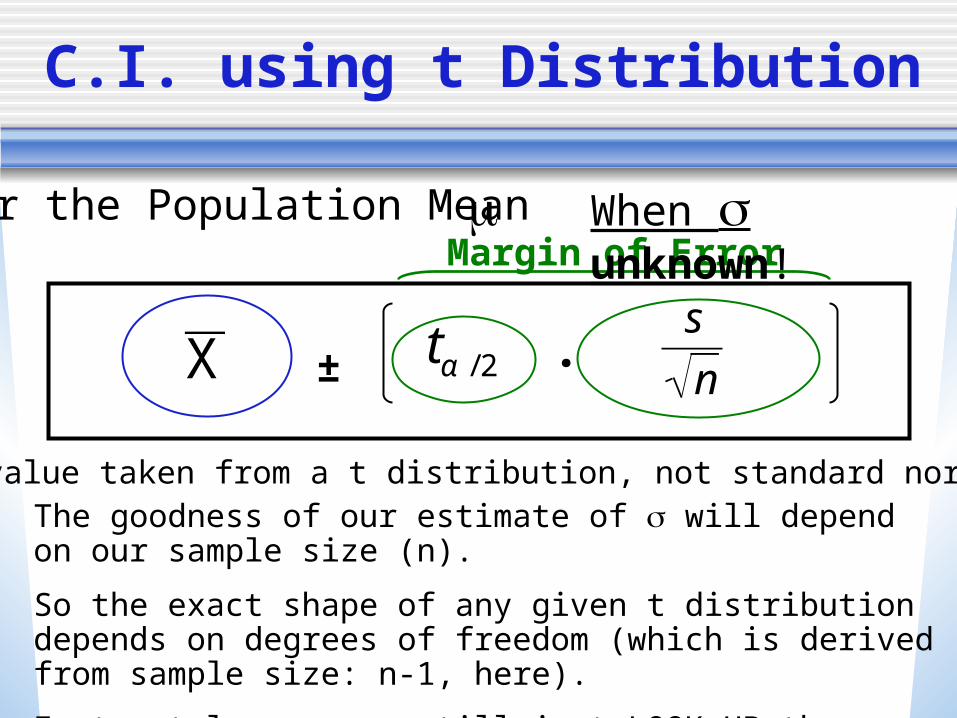
C.I. using t Distribution
For the Population Mean
± ·
Margin of Error
€
X
€
s
n
When unknown!
€
tα / 2
Critical value taken from a t distribution, not standard normal. The goodness of our estimate of will depend on our sample size (n).
So the exact shape of any given t distribution depends on degrees of freedom (which is derived from sample size: n-1, here).
Fortunately, we can still just LOOK UP the critical values…(just need to additionally plug in degrees freedom)
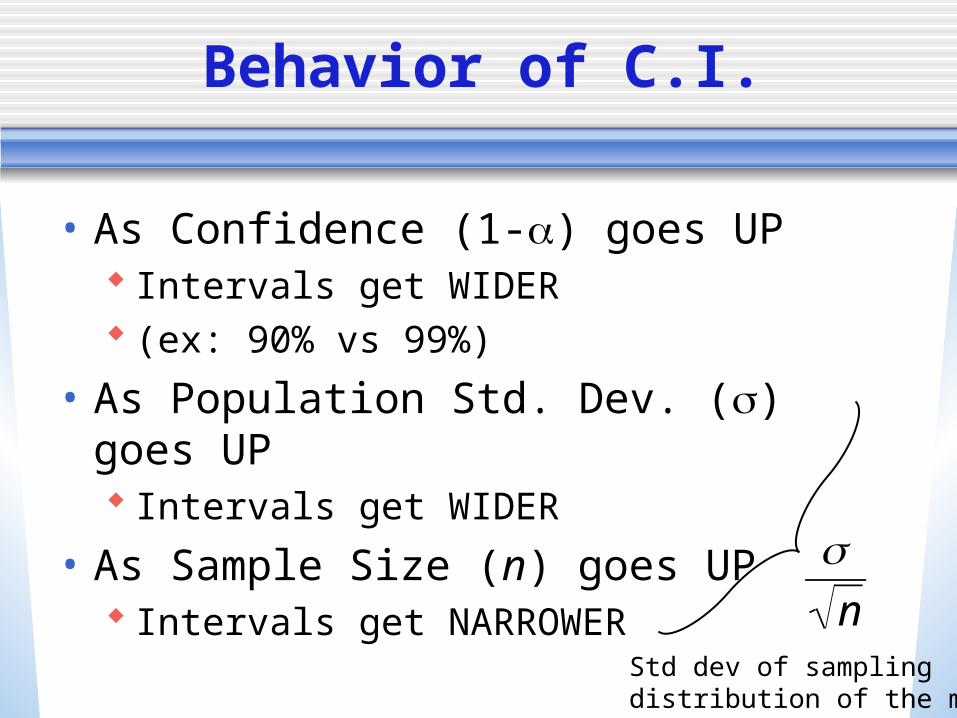
Behavior of C.I.
• As Confidence (1-) goes UP Intervals get WIDER (ex: 90% vs 99%)
• As Population Std. Dev. () goes UP Intervals get WIDER
• As Sample Size (n) goes UP Intervals get NARROWER
€
n
Std dev of samplingdistribution of the mean
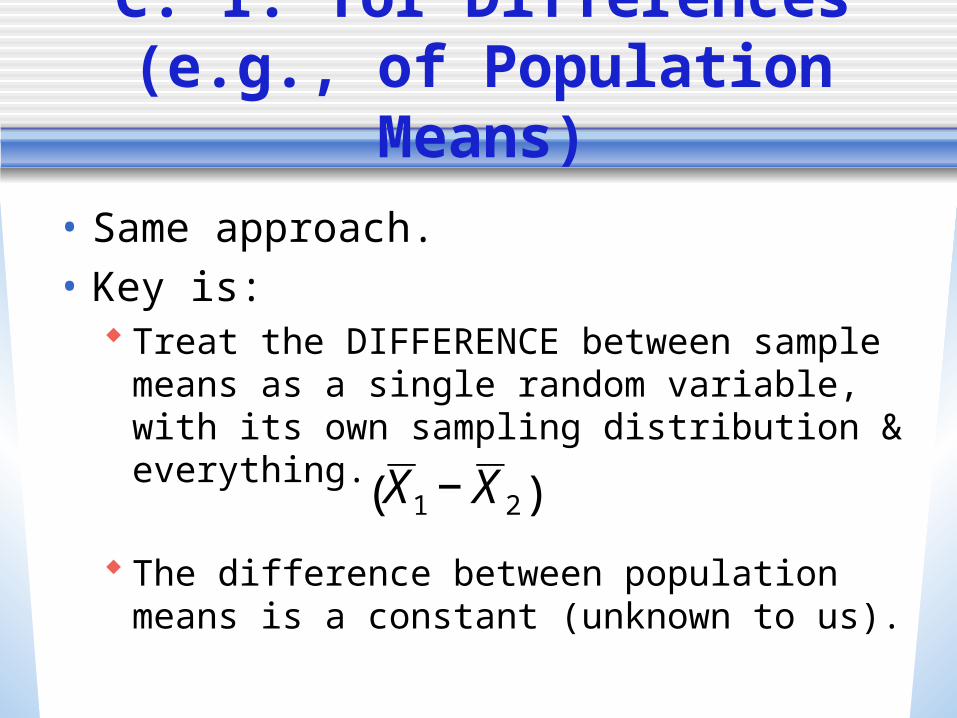
C. I. for Differences(e.g., of Population Means)
• Same approach.• Key is:
Treat the DIFFERENCE between sample means as a single random variable, with its own sampling distribution & everything.
The difference between population means is a constant (unknown to us).
€
X 1 − X 2( )
Remember
• Early Informal Feedback• Special Lecture Thursday
No OH; Go to lab for Qs/help.
• Stay on target Finish DistributionsVoDs
• Quiz 3
€
X