Embed Size (px)
Citation preview
PT BUKIT ASAM TbkCorporate Presentation 9M 2019
1
1. Introduction
2. 9M 2019 Update
3. Company Overview
Outline
1. Introduction
2
Investment
3
Mining Trading Power Logistics Gas Investment
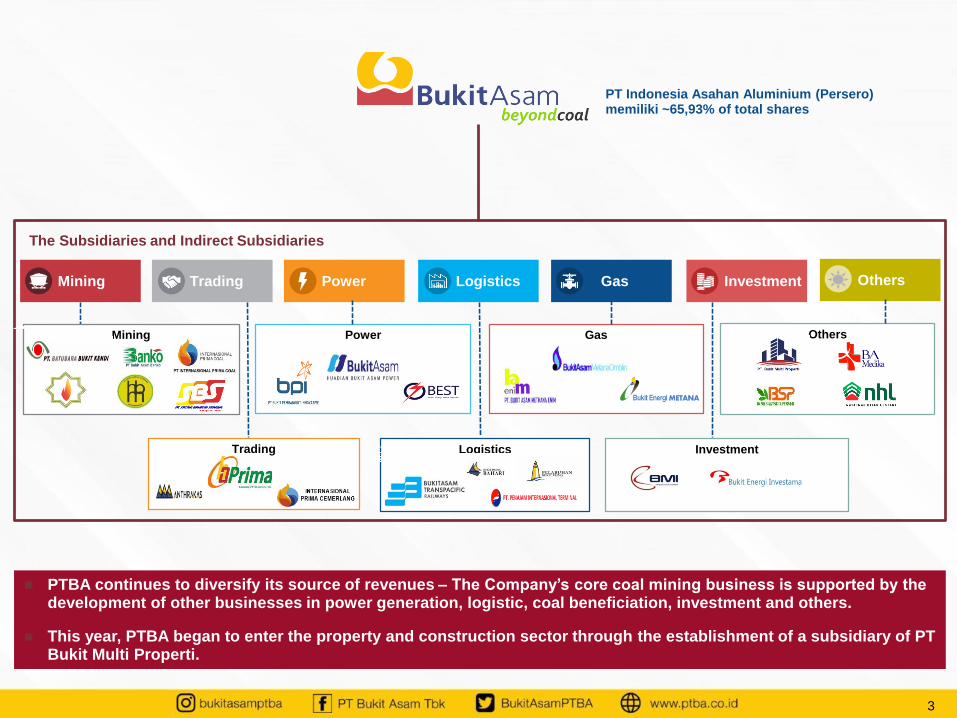
The Subsidiaries and Indirect Subsidiaries
PT Indonesia Asahan Aluminium (Persero) memiliki ~65,93% of total shares
PTBA continues to diversify its source of revenues – The Company’s core coal mining business is supported by the development of other businesses in power generation, logistic, coal beneficiation, investment and others.
This year, PTBA began to enter the property and construction sector through the establishment of a subsidiary of PT Bukit Multi Properti.
Trading
Power
Logistics
Gas OthersMining
Others
4
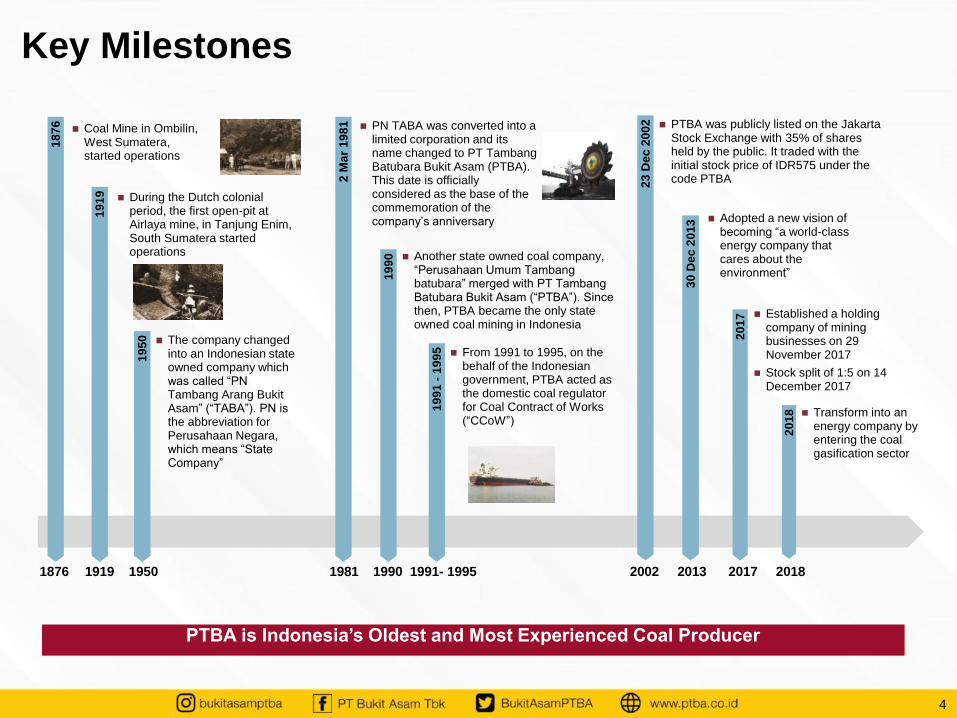
Key Milestones
PTBA is Indonesia’s Oldest and Most Experienced Coal Producer
Coal Mine in Ombilin, West Sumatera, started operations
During the Dutch colonial period, the first open-pit at Airlaya mine, in Tanjung Enim, South Sumatera started operations
The company changed into an Indonesian state owned company which was called “PN Tambang Arang Bukit Asam” (“TABA”). PN is the abbreviation for Perusahaan Negara, which means “State Company”
PN TABA was converted into a limited corporation and its name changed to PT Tambang Batubara Bukit Asam (PTBA). This date is officially considered as the base of the commemoration of the company’s anniversary
Another state owned coal company, “Perusahaan Umum Tambang batubara” merged with PT Tambang Batubara Bukit Asam (“PTBA”). Since then, PTBA became the only state owned coal mining in Indonesia
From 1991 to 1995, on the behalf of the Indonesian government, PTBA acted as the domestic coal regulator for Coal Contract of Works (“CCoW”)
PTBA was publicly listed on the Jakarta Stock Exchange with 35% of shares held by the public. It traded with the initial stock price of IDR575 under the code PTBA
Adopted a new vision of becoming “a world-class energy company that cares about the environment”
19
19
19
50
18
76
2 M
ar
19
81
19
90
19
91
-1
99
5
23
Dec
20
02
30
Dec
20
13
20
17
1876 1919 1950 1981 1990 1991- 1995 2002 2013 2017 2018
Established a holding company of mining businesses on 29 November 2017
Stock split of 1:5 on 14 December 2017
20
18 Transform into an
energy company by entering the coal gasification sector
5
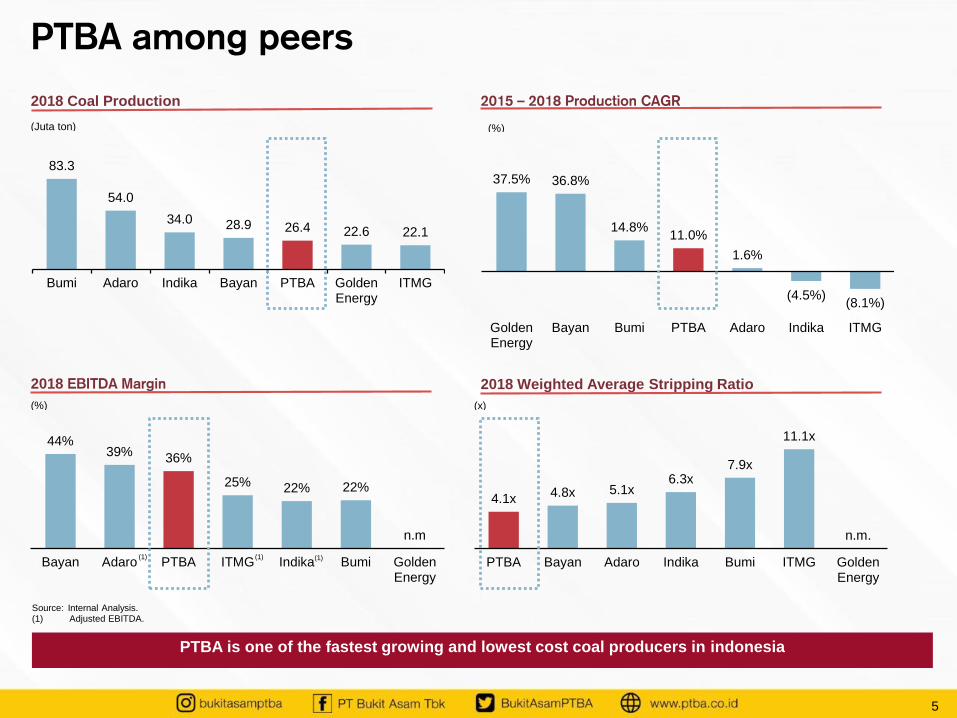
2018 Coal Production 2015 – 2018 Production CAGR
2018 EBITDA Margin 2018 Weighted Average Stripping Ratio
4.1x 4.8x 5.1x
6.3x 7.9x
11.1x
n.m.
PTBA Bayan Adaro Indika Bumi ITMG GoldenEnergy
(x)
Source: Internal Analysis.(1) Adjusted EBITDA.
37.5% 36.8%
14.8% 11.0%
1.6%
(4.5%)(8.1%)
GoldenEnergy
Bayan Bumi PTBA Adaro Indika ITMG
(%)
44% 39%
36%
25% 22% 22%
n.m
Bayan Adaro PTBA ITMG Indika Bumi GoldenEnergy
(%)
83.3
54.0
34.0 28.9 26.4 22.6 22.1
Bumi Adaro Indika Bayan PTBA GoldenEnergy
ITMG
(Juta ton)
(1) (1)(1)
PTBA among peers
PTBA is one of the fastest growing and lowest cost coal producers in indonesia

2. 9M 2019 Update
6
7
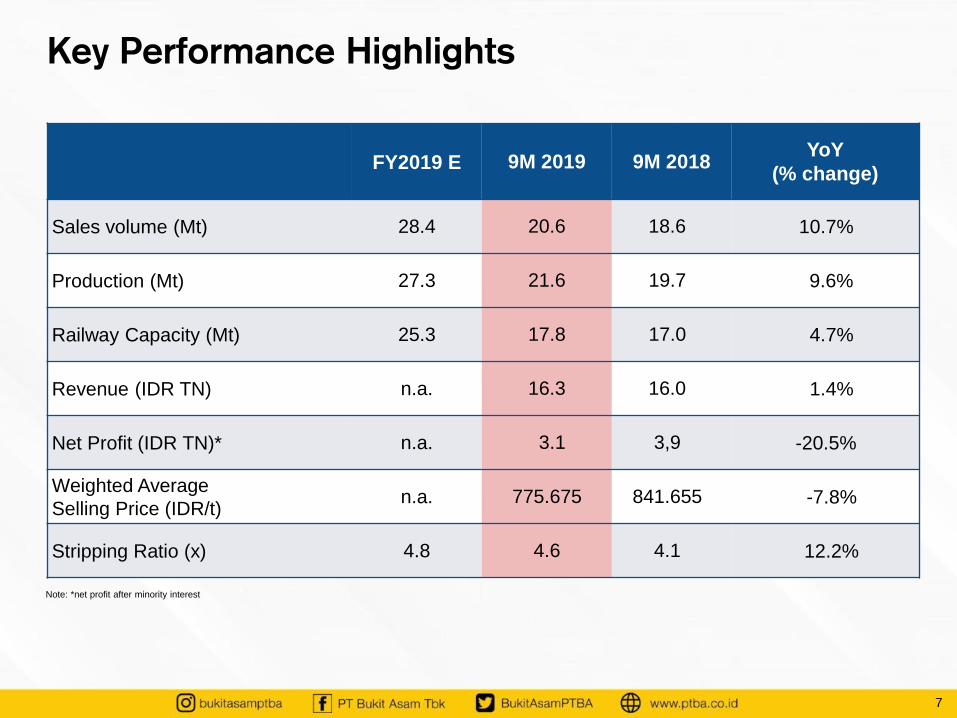
Key Performance Highlights
FY2019 E 9M 2019 9M 2018YoY
(% change)
Sales volume (Mt) 28.4 20.6 18.6 10.7%
Production (Mt) 27.3 21.6 19.7 9.6%
Railway Capacity (Mt) 25.3 17.8 17.0 4.7%
Revenue (IDR TN) n.a. 16.3 16.0 1.4%
Net Profit (IDR TN)* n.a. 3.1 3,9 -20.5%
Weighted Average
Selling Price (IDR/t) n.a. 775.675 841.655 -7.8%
Stripping Ratio (x) 4.8 4.6 4.1 12.2%
Note: *net profit after minority interest

8
Production and Sales Volume Railway Capacity
Weighted Average Selling PriceWeighted Average Stripping Ratio
658,018
808,690 835,155 841,655 775,675
FY2016 FY2017 FY2018 9M 2018 9M 2019
(IDR/t)
4.9
3.6 4.1 4.1
4.6
FY2016 FY2017 FY2018 9M 2018 9M 2019
(x)
Key Operational Highlights
(Mt)
17.7
21.4 22.7
17.0 17.8
FY2016 FY2017 FY2018 9M 2018 9M 2019
(Mt)
19.6
24.226.4
19.721.620.8
23.6 24.7
18.620.6
FY2016 FY2017 FY2018 9M 2018 9M 2019
Production (Mt) Sales Volume (Mt)
PTBA’s 9M-2019 achievement is still on track

9
Revenue and Growth Gross Profit and Margins
Operating Profit and Margins Net Profit and Margins
Key Financial Highlights
14,059
19,471 21,167
16,036 16,254
1.5% 38.5% 8.7% 20.7% 1.4%
FY2016 FY2017 FY2018 9M 2018 9M 2019
Revenue (IDR bn) Growth (%)
(IDR bn)
4,401
8,507 8,546
6,667 5,705
31.3% 43.7% 40.4% 41.6% 35.1%
FY2016 FY2017 FY2018 9M 2018 9M 2019
Gross profit (IDR bn) Gross profit margin (%)
(IDR bn)
2,531
5,899 6,283 5,174
4,082
18.0% 30.3% 29.7% 32.3% 25.1%
FY2016 FY2017 FY2018 9M 2018 9M 2019
Operating profit (IDR bn) Operating profit margin (%)
(IDR bn)
2,006
4,476 5,024
3,930 3,101
14.3% 23.0% 23.7% 24.5% 19.1%
FY2016 FY2017 FY2018 9M 2018 9M 2019
Net profit (IDR bn) Net profit margin (%)
(IDR bn)
Note: net profit after minority interest
10
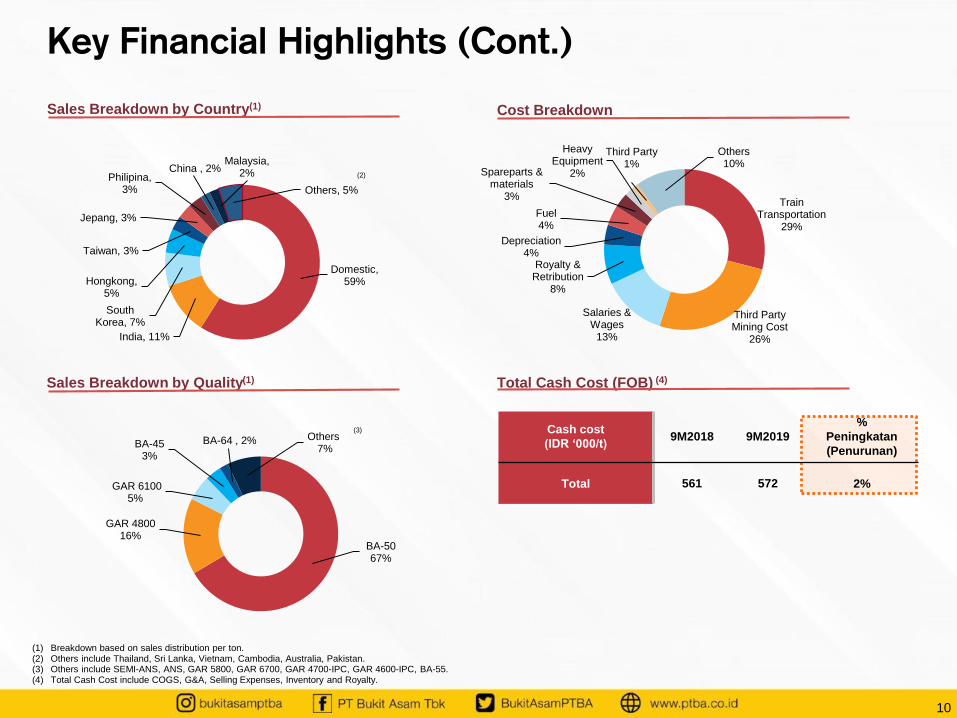
Cash cost
(IDR ‘000/t)9M2018 9M2019
%
Peningkatan
(Penurunan)
Total 561 572 2%
Domestic, 59%
India, 11%
South Korea, 7%
Hongkong, 5%
Taiwan, 3%
Jepang, 3%
Philipina, 3%
China , 2%Malaysia,
2%
Others, 5%
BA-50 67%
GAR 4800 16%
GAR 6100 5%
BA-45 3%
BA-64 , 2% Others 7%
Train Transportation
29%
Third Party Mining Cost
26%
Salaries & Wages
13%
Royalty & Retribution
8%
Depreciation4%
Fuel 4%
Spareparts & materials
3%
Heavy Equipment
2%
Third Party1%
Others 10%
Sales Breakdown by Country(1)
(1) Breakdown based on sales distribution per ton.(2) Others include Thailand, Sri Lanka, Vietnam, Cambodia, Australia, Pakistan.(3) Others include SEMI-ANS, ANS, GAR 5800, GAR 6700, GAR 4700-IPC, GAR 4600-IPC, BA-55.(4) Total Cash Cost include COGS, G&A, Selling Expenses, Inventory and Royalty.
Cost Breakdown
Total Cash Cost (FOB) (4)Sales Breakdown by Quality(1)
(3)
(2)
Key Financial Highlights (Cont.)

3. Company Overview
11

12
Company Overview
Captive Market for Domestic Market
Expanding Railways Capacity and New Ports
Development Projects
Financial Strength and High DividendPayout Ratio
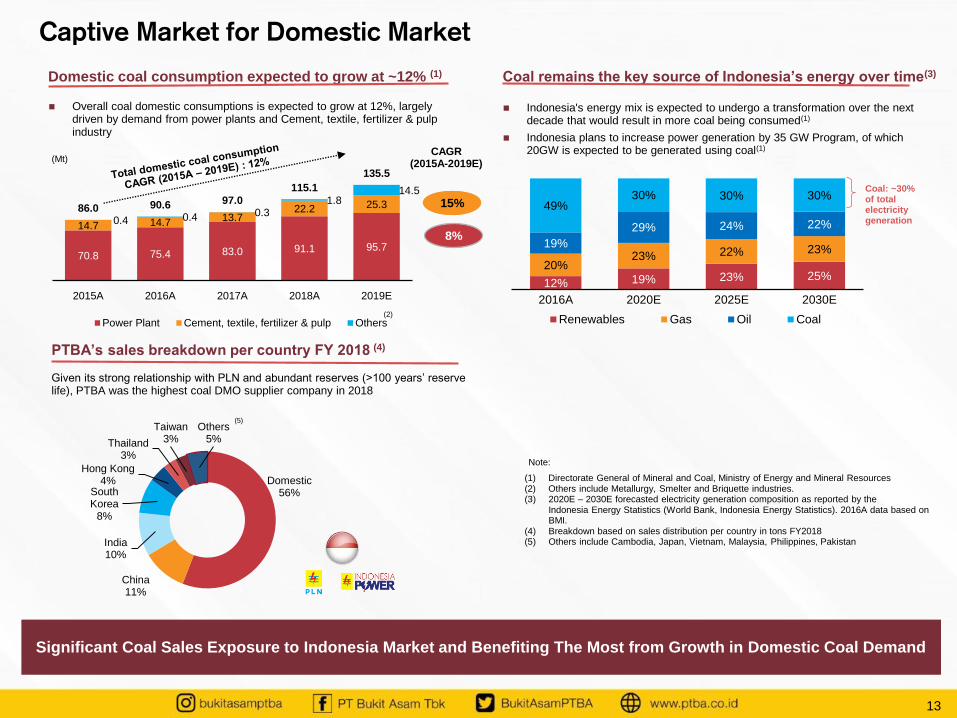
70.8 75.4 83.0 91.1 95.7
14.7 14.7 13.722.2 25.3
0.4 0.4 0.31.8
14.5
86.0 90.6 97.0
115.1
135.5
2015A 2016A 2017A 2018A 2019E
Power Plant Cement, textile, fertilizer & pulp Others
(Mt)
Captive Market for Domestic Market
13
Overall coal domestic consumptions is expected to grow at 12%, largely driven by demand from power plants and Cement, textile, fertilizer & pulp industry
(1) Directorate General of Mineral and Coal, Ministry of Energy and Mineral Resources(2) Others include Metallurgy, Smelter and Briquette industries.(3) 2020E – 2030E forecasted electricity generation composition as reported by the
Indonesia Energy Statistics (World Bank, Indonesia Energy Statistics). 2016A data based on BMI.
(4) Breakdown based on sales distribution per country in tons FY2018(5) Others include Cambodia, Japan, Vietnam, Malaysia, Philippines, Pakistan
12% 19% 23% 25% 20%
23% 22% 23% 19%
29% 24% 22%
49% 30% 30% 30%
2016A 2020E 2025E 2030E
Renewables Gas Oil Coal
Coal: ~30% of total electricity generation
Indonesia's energy mix is expected to undergo a transformation over the next decade that would result in more coal being consumed(1)
Indonesia plans to increase power generation by 35 GW Program, of which 20GW is expected to be generated using coal(1)
Given its strong relationship with PLN and abundant reserves (>100 years’ reserve life), PTBA was the highest coal DMO supplier company in 2018
CAGR(2015A-2019E)
15%
8%
PTBA’s sales breakdown per country FY 2018 (4)
Domestic coal consumption expected to grow at ~12% (1) Coal remains the key source of Indonesia’s energy over time(3)
(2)
Domestic 56%
China 11%
India 10%
South Korea
8%
Hong Kong 4%
Thailand 3%
Taiwan 3%
Others 5%
(5)
Note:
Significant Coal Sales Exposure to Indonesia Market and Benefiting The Most from Growth in Domestic Coal Demand

14
Tanjung Enim
Prajin Barging Port
KertapatiBarging Port
Muara Enim
Prabumulih
Baturaja
Phase 2 Tarahan
Tarahan Port
Railway Project (New)Development to Southern Lampung Tarahan (Tarahan-II)
Capacity: 20 Mtpa (2024)
Lahat
Railway Project (New)Development to Northern South Sumatera Option to Prajin Barging Port
Capacity: 10 Mtpa (2024)
Railway (Upgraded):
Capacity: up to 30 Mtpa
TE – Kertapati: 5 Mtpa (2019)
TE – Tarahan (Tarahan-I) : 20.3 Mtpa (2019); 25 Mtpa (2020)
Expanding Railway Capacity and New Ports
The Tanjung Enim Mine (27 Mtpa existing production capacity) and Tarahan Port (largest coal terminal in Sumatera, accommodating “Capesize” bulk carrier vessels of up to 210,000 DWT) are 100% owned and operated by PTBA
Indonesia
ShortcutTE - Baturaja
New Barging Port ProjectConstruction of Prajin Barging Port
Capacity : 10 Mtpa (2024)
New PortPhase 2 Tarahan Port Developmnet
Capacity : 20 Juta Mtpa (2024)
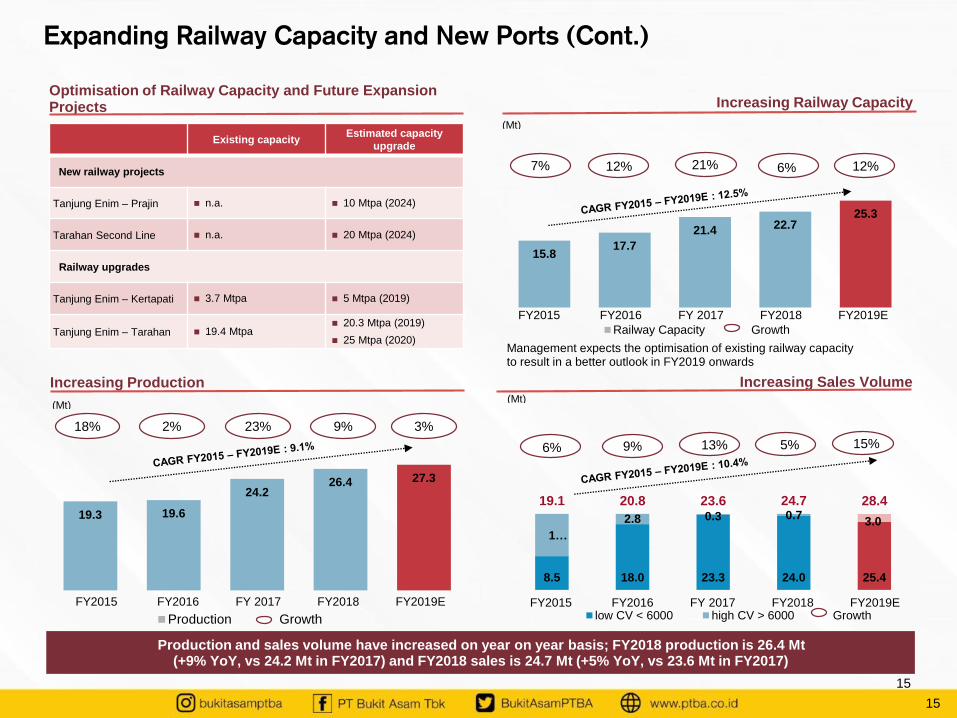
8.5 18.0 23.3 24.0 25.4
1…
2.8 0.3 0.73.0
19.1 20.8 23.6 24.7 28.4
6% 9% 13% 5% 15%
0%
10%
20%
30%
40%
50%
60%
70%
80%
90%
100%
low CV < 6000 high CV > 6000 Growth
(Mt)
FY2015 FY2016 FY 2017 FY2018 FY2019E
18%
Expanding Railway Capacity and New Ports (Cont.)
15
Increasing Production
Increasing Railway CapacityOptimisation of Railway Capacity and Future Expansion Projects
Management expects the optimisation of existing railway capacity to result in a better outlook in FY2019 onwards
Increasing Sales Volume
15.817.7
21.4 22.725.3
7% 12% 21% 6% 12%
0.0
5.0
10.0
15.0
20.0
25.0
30.0
Railway Capacity Growth
(Mt)
FY2015 FY2016 FY 2017 FY2018 FY2019E
19.3 19.6
24.226.4 27.3
0.0
5.0
10.0
15.0
20.0
25.0
30.0
Production Growth
(Mt)
FY2015 FY2016 FY 2017 FY2018 FY2019E
Existing capacityEstimated capacity
upgrade
New railway projects
Tanjung Enim – Prajin n.a. 10 Mtpa (2024)
Tarahan Second Line n.a. 20 Mtpa (2024)
Railway upgrades
Tanjung Enim – Kertapati 3.7 Mtpa 5 Mtpa (2019)
Tanjung Enim – Tarahan 19.4 Mtpa 20.3 Mtpa (2019)
25 Mtpa (2020)
Production and sales volume have increased on year on year basis; FY2018 production is 26.4 Mt (+9% YoY, vs 24.2 Mt in FY2017) and FY2018 sales is 24.7 Mt (+5% YoY, vs 23.6 Mt in FY2017)
2% 23% 9% 3%
15
16
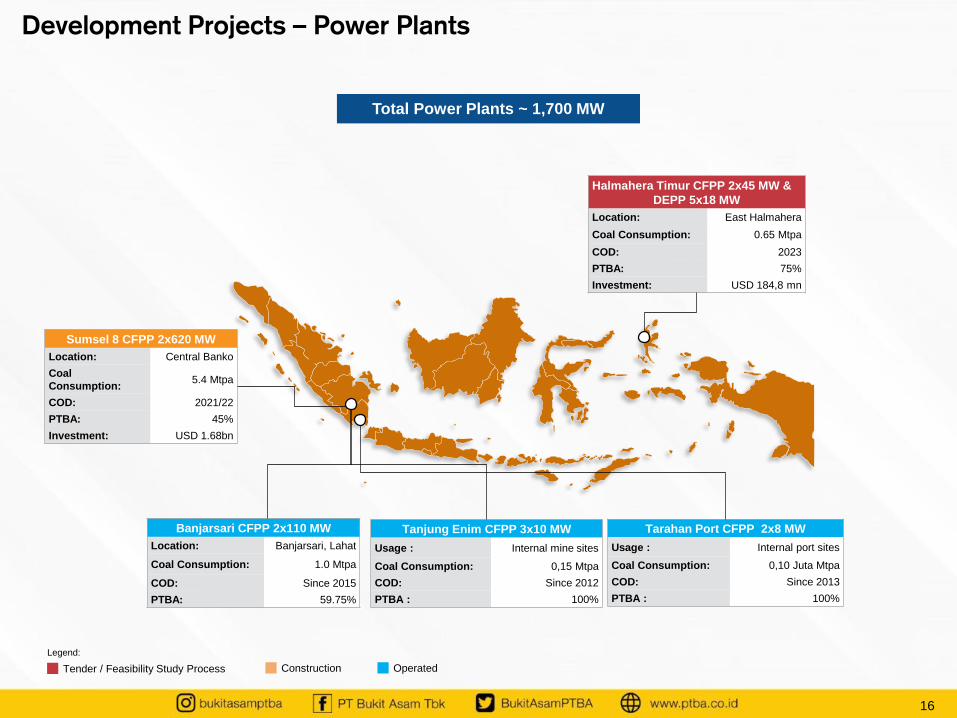
Development Projects – Power Plants
Legend:
Sumsel 8 CFPP 2x620 MW
Location: Central Banko
Coal
Consumption:5.4 Mtpa
COD: 2021/22
PTBA: 45%
Investment: USD 1.68bn
Halmahera Timur CFPP 2x45 MW &
DEPP 5x18 MW
Location: East Halmahera
Coal Consumption: 0.65 Mtpa
COD: 2023
PTBA: 75%
Investment: USD 184,8 mn
Banjarsari CFPP 2x110 MW
Location: Banjarsari, Lahat
Coal Consumption: 1.0 Mtpa
COD: Since 2015
PTBA: 59.75%
Tanjung Enim CFPP 3x10 MW
Usage : Internal mine sites
Coal Consumption: 0,15 Mtpa
COD: Since 2012
PTBA : 100%
Tarahan Port CFPP 2x8 MW
Usage : Internal port sites
Coal Consumption: 0,10 Juta Mtpa
COD: Since 2013
PTBA : 100%
Total Power Plants ~ 1,700 MW
Tender / Feasibility Study Process Construction Operated
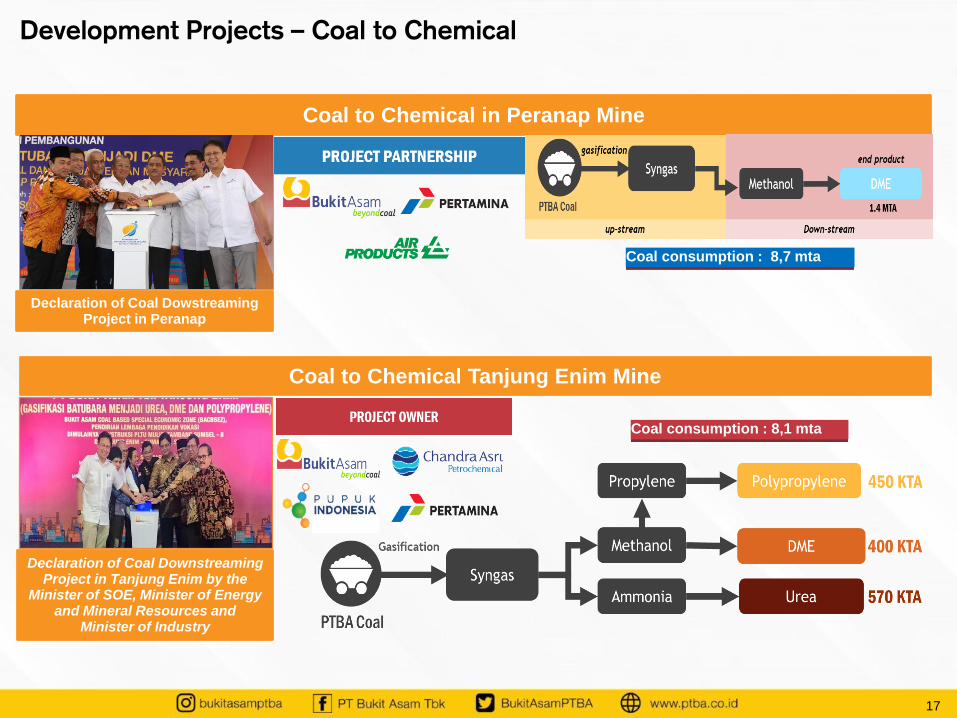
Coal to Chemical Tanjung Enim Mine
17
Coal to Chemical in Peranap Mine
Development Projects – Coal to Chemical
Coal consumption : 8,7 mta
Coal consumption : 8,1 mta
Declaration of Coal DowstreamingProject in Peranap
Declaration of Coal DownstreamingProject in Tanjung Enim by the
Minister of SOE, Minister of Energy and Mineral Resources and
Minister of Industry
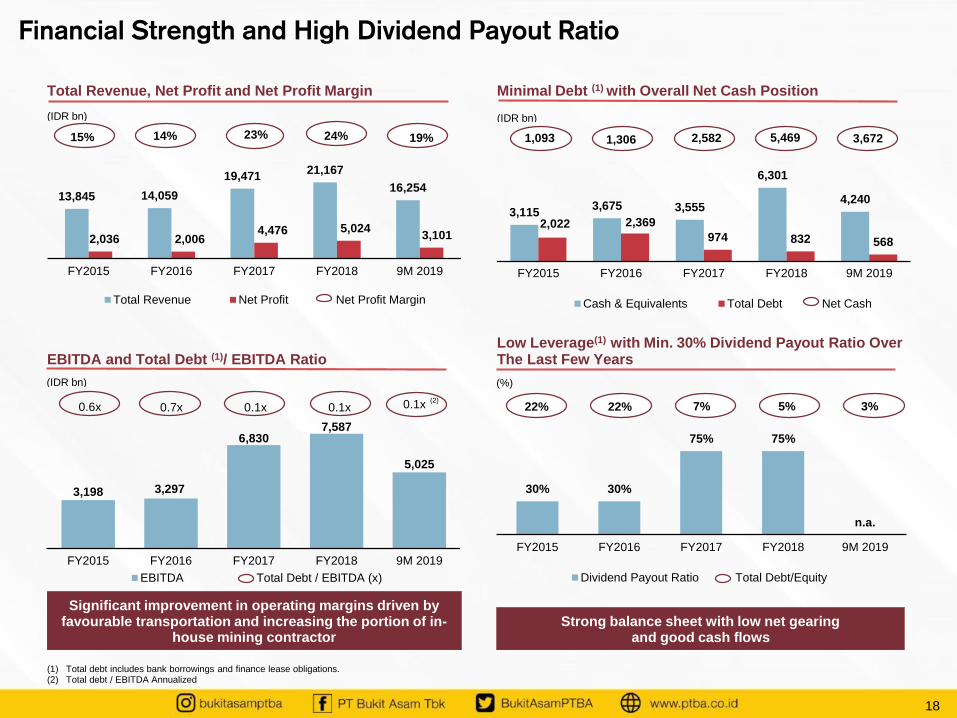
13,845 14,059
19,471 21,167
16,254
2,036 2,006 4,476 5,024
3,101
15% 14% 23% 24% 19%
FY2015 FY2016 FY2017 FY2018 9M 2019
Total Revenue Net Profit Net Profit Margin
(IDR bn)
30% 30%
75% 75%
n.a.
22% 22% 7% 5% 3%
FY2015 FY2016 FY2017 FY2018 9M 2019
Dividend Payout Ratio Total Debt/Equity
(%)
18
Total Revenue, Net Profit and Net Profit Margin
(1) Total debt includes bank borrowings and finance lease obligations.(2) Total debt / EBITDA Annualized
Minimal Debt (1) with Overall Net Cash Position
EBITDA and Total Debt (1)/ EBITDA RatioLow Leverage(1) with Min. 30% Dividend Payout Ratio Over The Last Few Years
Strong balance sheet with low net gearing and good cash flows
Financial Strength and High Dividend Payout Ratio
3,198 3,297
6,830 7,587
5,025
0.6x 0.7x 0.1x 0.1x 0.1x
FY2015 FY2016 FY2017 FY2018 9M 2019
EBITDA Total Debt / EBITDA (x)
(IDR bn)
Significant improvement in operating margins driven by favourable transportation and increasing the portion of in-
house mining contractor
3,115 3,675 3,555
6,301
4,240
2,022 2,369
974 832 568
1,093 1,306 2,582 5,469 3,672
FY2015 FY2016 FY2017 FY2018 9M 2019
Cash & Equivalents Total Debt Net Cash
(IDR bn)
(2)
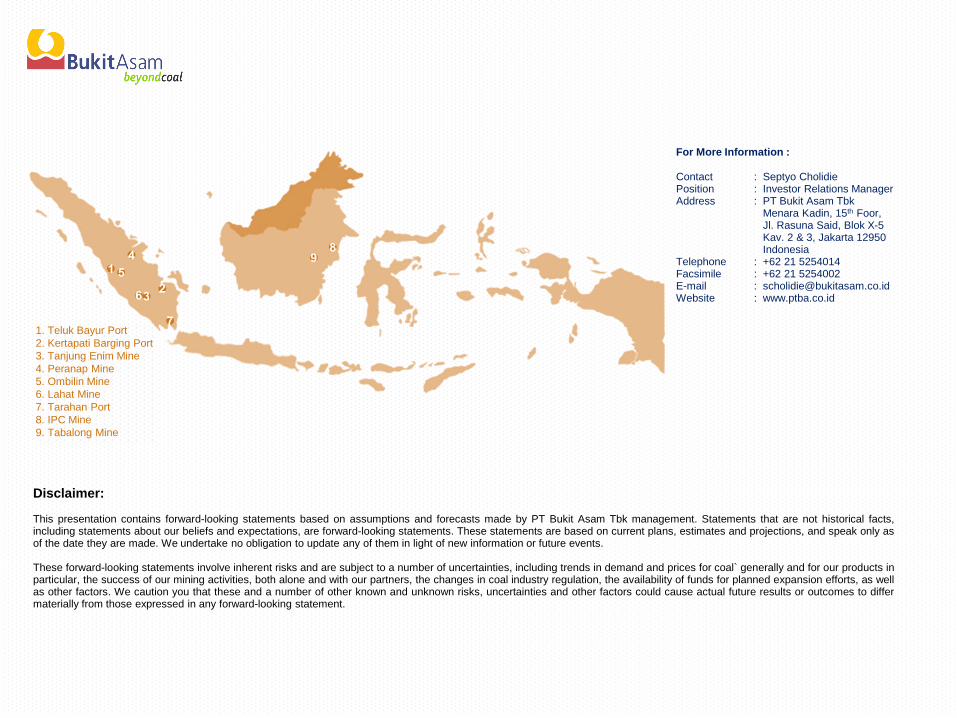
For More Information :
Contact : Septyo CholidiePosition : Investor Relations ManagerAddress : PT Bukit Asam Tbk
Menara Kadin, 15th Foor, Jl. Rasuna Said, Blok X-5 Kav. 2 & 3, Jakarta 12950 Indonesia
Telephone : +62 21 5254014Facsimile : +62 21 5254002E-mail : [email protected] : www.ptba.co.id
Disclaimer:
This presentation contains forward-looking statements based on assumptions and forecasts made by PT Bukit Asam Tbk management. Statements that are not historical facts,including statements about our beliefs and expectations, are forward-looking statements. These statements are based on current plans, estimates and projections, and speak only asof the date they are made. We undertake no obligation to update any of them in light of new information or future events.
These forward-looking statements involve inherent risks and are subject to a number of uncertainties, including trends in demand and prices for coal` generally and for our products inparticular, the success of our mining activities, both alone and with our partners, the changes in coal industry regulation, the availability of funds for planned expansion efforts, as wellas other factors. We caution you that these and a number of other known and unknown risks, uncertainties and other factors could cause actual future results or outcomes to differmaterially from those expressed in any forward-looking statement.
1. Teluk Bayur Port
2. Kertapati Barging Port
3. Tanjung Enim Mine
4. Peranap Mine
5. Ombilin Mine
6. Lahat Mine
7. Tarahan Port
8. IPC Mine
9. Tabalong Mine