Embed Size (px)
Citation preview

OPTOPOL Technology S.A. ul. Żabia 42 42-400 Zawiercie Polska tel./fax. +48 32 6709173 www.optopol.com email: [email protected]
PTS1000 automated perimeter
Instruction manual
ver.4.1
revision C
PTS1000 Instruction Manual
2
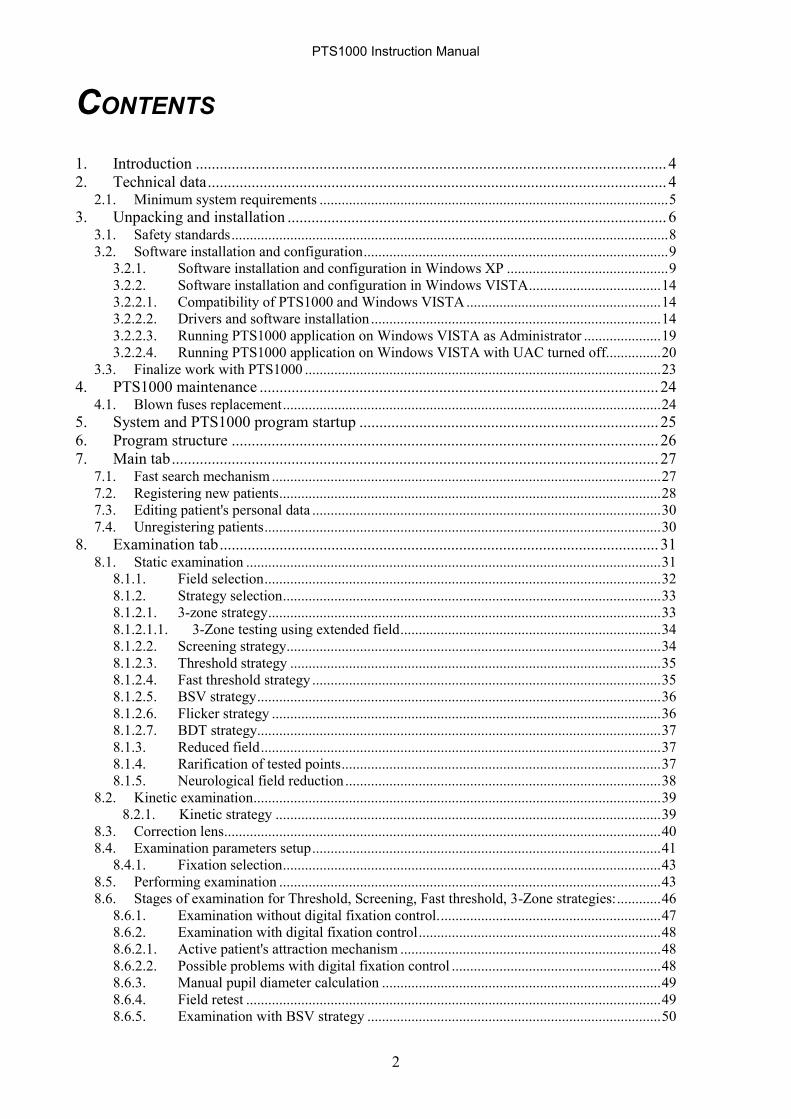
CONTENTS
1. Introduction ...................................................................................................................... 4 2. Technical data ................................................................................................................... 4
2.1. Minimum system requirements ............................................................................................... 5 3. Unpacking and installation ............................................................................................... 6
3.1. Safety standards ....................................................................................................................... 8 3.2. Software installation and configuration ................................................................................... 9
3.2.1. Software installation and configuration in Windows XP ............................................ 9 3.2.2. Software installation and configuration in Windows VISTA .................................... 14 3.2.2.1. Compatibility of PTS1000 and Windows VISTA ..................................................... 14 3.2.2.2. Drivers and software installation ............................................................................... 14 3.2.2.3. Running PTS1000 application on Windows VISTA as Administrator ..................... 19 3.2.2.4. Running PTS1000 application on Windows VISTA with UAC turned off............... 20
3.3. Finalize work with PTS1000 ................................................................................................. 23 4. PTS1000 maintenance .................................................................................................... 24
4.1. Blown fuses replacement ....................................................................................................... 24 5. System and PTS1000 program startup ........................................................................... 25 6. Program structure ........................................................................................................... 26 7. Main tab .......................................................................................................................... 27
7.1. Fast search mechanism .......................................................................................................... 27 7.2. Registering new patients ........................................................................................................ 28 7.3. Editing patient's personal data ............................................................................................... 30 7.4. Unregistering patients ............................................................................................................ 30
8. Examination tab .............................................................................................................. 31 8.1. Static examination ................................................................................................................. 31
8.1.1. Field selection ............................................................................................................ 32 8.1.2. Strategy selection ....................................................................................................... 33 8.1.2.1. 3-zone strategy ........................................................................................................... 33 8.1.2.1.1. 3-Zone testing using extended field ....................................................................... 34 8.1.2.2. Screening strategy...................................................................................................... 34 8.1.2.3. Threshold strategy ..................................................................................................... 35 8.1.2.4. Fast threshold strategy ............................................................................................... 35 8.1.2.5. BSV strategy .............................................................................................................. 36 8.1.2.6. Flicker strategy .......................................................................................................... 36 8.1.2.7. BDT strategy.............................................................................................................. 37 8.1.3. Reduced field ............................................................................................................. 37 8.1.4. Rarification of tested points ....................................................................................... 37 8.1.5. Neurological field reduction ...................................................................................... 38
8.2. Kinetic examination ............................................................................................................... 39 8.2.1. Kinetic strategy ......................................................................................................... 39
8.3. Correction lens ....................................................................................................................... 40 8.4. Examination parameters setup ............................................................................................... 41
8.4.1. Fixation selection ....................................................................................................... 43 8.5. Performing examination ........................................................................................................ 43 8.6. Stages of examination for Threshold, Screening, Fast threshold, 3-Zone strategies: ............ 46
8.6.1. Examination without digital fixation control. ............................................................ 47 8.6.2. Examination with digital fixation control .................................................................. 48 8.6.2.1. Active patient's attraction mechanism ....................................................................... 48 8.6.2.2. Possible problems with digital fixation control ......................................................... 48 8.6.3. Manual pupil diameter calculation ............................................................................ 49 8.6.4. Field retest ................................................................................................................. 49 8.6.5. Examination with BSV strategy ................................................................................ 50
PTS1000 Instruction Manual
3
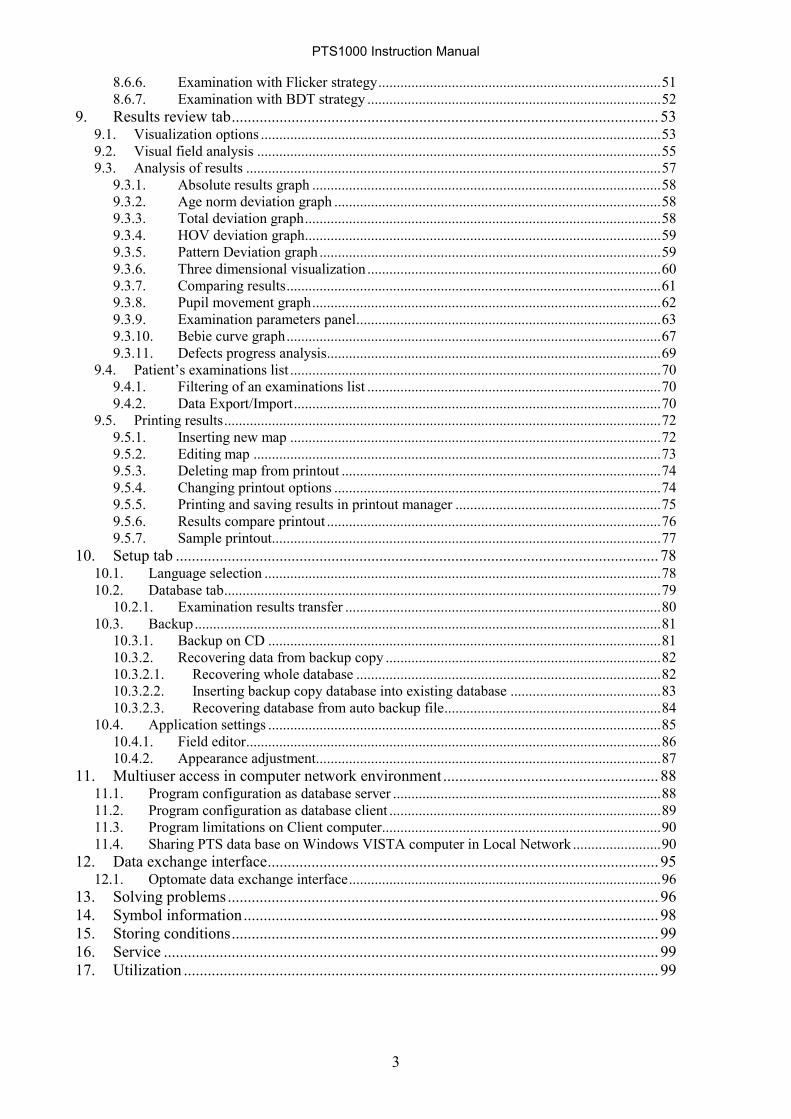
8.6.6. Examination with Flicker strategy ............................................................................. 51 8.6.7. Examination with BDT strategy ................................................................................ 52
9. Results review tab ........................................................................................................... 53 9.1. Visualization options ............................................................................................................. 53 9.2. Visual field analysis .............................................................................................................. 55 9.3. Analysis of results ................................................................................................................. 57
9.3.1. Absolute results graph ............................................................................................... 58 9.3.2. Age norm deviation graph ......................................................................................... 58 9.3.3. Total deviation graph ................................................................................................. 58 9.3.4. HOV deviation graph ................................................................................................. 59 9.3.5. Pattern Deviation graph ............................................................................................. 59 9.3.6. Three dimensional visualization ................................................................................ 60 9.3.7. Comparing results ...................................................................................................... 61 9.3.8. Pupil movement graph ............................................................................................... 62 9.3.9. Examination parameters panel ................................................................................... 63 9.3.10. Bebie curve graph ...................................................................................................... 67 9.3.11. Defects progress analysis ........................................................................................... 69
9.4. Patient‟s examinations list ..................................................................................................... 70 9.4.1. Filtering of an examinations list ................................................................................ 70 9.4.2. Data Export/Import .................................................................................................... 70
9.5. Printing results ....................................................................................................................... 72 9.5.1. Inserting new map ..................................................................................................... 72 9.5.2. Editing map ............................................................................................................... 73 9.5.3. Deleting map from printout ....................................................................................... 74 9.5.4. Changing printout options ......................................................................................... 74 9.5.5. Printing and saving results in printout manager ........................................................ 75 9.5.6. Results compare printout ........................................................................................... 76 9.5.7. Sample printout.......................................................................................................... 77
10. Setup tab ......................................................................................................................... 78 10.1. Language selection ............................................................................................................ 78 10.2. Database tab ....................................................................................................................... 79
10.2.1. Examination results transfer ...................................................................................... 80 10.3. Backup ............................................................................................................................... 81
10.3.1. Backup on CD ........................................................................................................... 81 10.3.2. Recovering data from backup copy ........................................................................... 82 10.3.2.1. Recovering whole database ................................................................................... 82 10.3.2.2. Inserting backup copy database into existing database ......................................... 83 10.3.2.3. Recovering database from auto backup file ........................................................... 84
10.4. Application settings ........................................................................................................... 85 10.4.1. Field editor ................................................................................................................. 86 10.4.2. Appearance adjustment .............................................................................................. 87
11. Multiuser access in computer network environment ...................................................... 88 11.1. Program configuration as database server ......................................................................... 88 11.2. Program configuration as database client .......................................................................... 89 11.3. Program limitations on Client computer ............................................................................ 90 11.4. Sharing PTS data base on Windows VISTA computer in Local Network ........................ 90
12. Data exchange interface .................................................................................................. 95 12.1. Optomate data exchange interface ..................................................................................... 96
13. Solving problems ............................................................................................................ 96 14. Symbol information ........................................................................................................ 98 15. Storing conditions ........................................................................................................... 99 16. Service ............................................................................................................................ 99 17. Utilization ....................................................................................................................... 99

PTS1000 Instruction Manual
4
1. Introduction
PTS1000 automated perimeter is a diagnostic devices used for examining visual field. It enables to
diagnose many eye diseases including glaucoma.
PTS 1000 series introduces some new concepts of perimetry:
Kinetic strategy allows detecting visual field losses in central and paracentral areas for patients,
who have problems with static examination.
Stimuli projection method offers all Goldmann standard stimuli sizes I-V.
Four stimuli colors: white, green, blue, red.
Digital algorithms implemented in system enable to detect any defects in patient‟s visual field.
Patient reaction time is measured automatically and examination speed is adjusted. It enables to
shorten duration of examination without rushing patient.
PTS1000 has a special DEMO function, which enables the patient to get familiar with perimeter.
Computer controls fixation quality by using Heijl-Krakau method or by digital image analysis,
which enables to continuously monitor fixation.
Live eye preview enables to position patient‟s head precisely and to observe patient‟s behavior
during testing.
Electronic adjustment of chin rest height.
Flicker (Critical Fusion Frequency) measurement strategy.
Blue on Yellow (Short Wave Automatic Perimetry) examination mode.
BDT (Binocular Drivers Test) strategy – enable Esterman score calculation.
Self diagnostic system.
2. Technical data
PTS 1000:
Dimensions 693 x 585 x 444 mm ±2mm
Outer diameter of bowl 550 mm ±2mm
Height of center of bowl 381 mm ±2mm
Height of chin rest 280 do 328 mm ±2mm
Weight 19 kg ±0.5kg
Power supply 100-250 V, 50-60 Hz
Power consumption 110 VA
Stimulus type projected
Stimulus colors white, green, blue, red
Maximum stimulus intensity 10000 asb ±20%
Minimum stimulus intensity 0.03 asb ±20%
Number of intensity levels 16
Exposition time 0.1 to 9.9 s
Number of predefined fields 10 + user defined
Number of strategies 9
Stimulus size I-V Goldman
Background illumination 10 asb (white) ±20%, 31.5asb (white),
314asb (yellow)
Dynamic range 45dB

PTS1000 Instruction Manual
5
2.1. Minimum system requirements
Processor Intel 1600 MHz
RAM 256 MB
Operating system MS Windows XP/ VISTA
Hard disk 50 MB free space
CD-ROM 4x
Graphic card 800 x 600, 24 bits of color depth (True color),
3D accelerator supporting OpenGL
Communication sockets 1 x USB 1.1
PTS1000 Instruction Manual
6
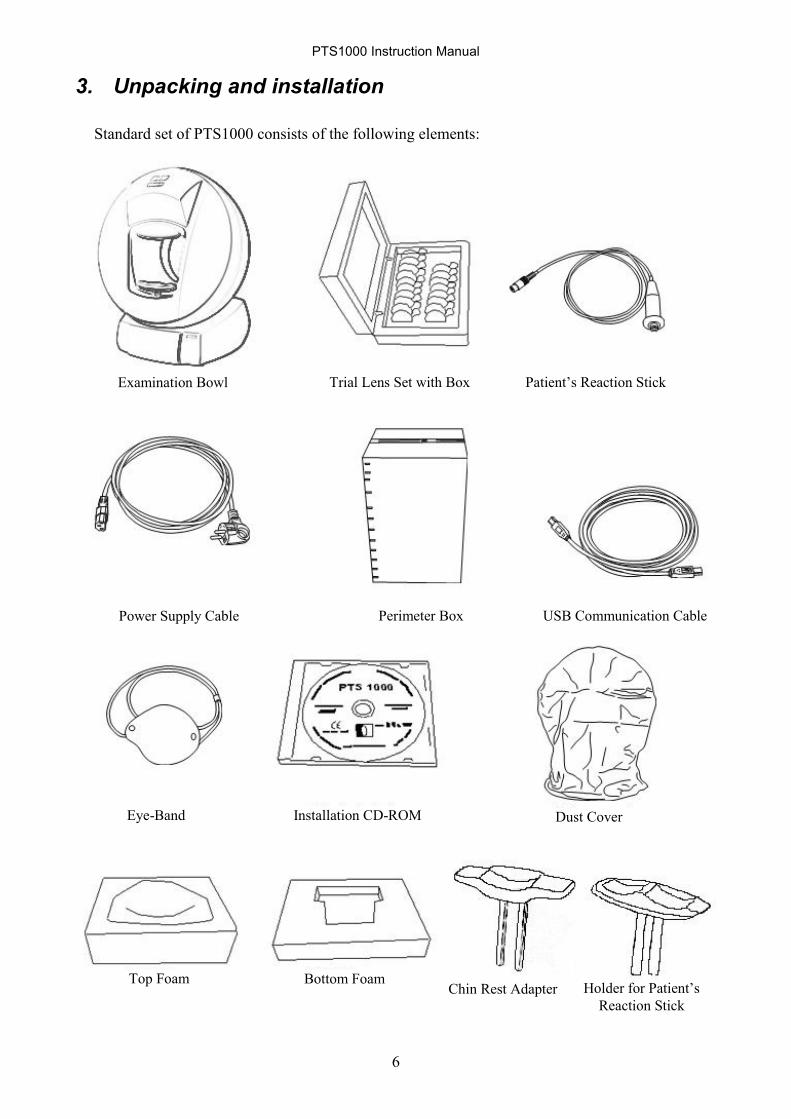
3. Unpacking and installation
Standard set of PTS1000 consists of the following elements:
Eye-Band Installation CD-ROM
Trial Lens Set with Box Patient‟s Reaction Stick Examination Bowl
Power Supply Cable USB Communication Cable Perimeter Box
Dust Cover
Bottom Foam Top Foam Chin Rest Adapter Holder for Patient‟s
Reaction Stick
PTS1000 Instruction Manual
7
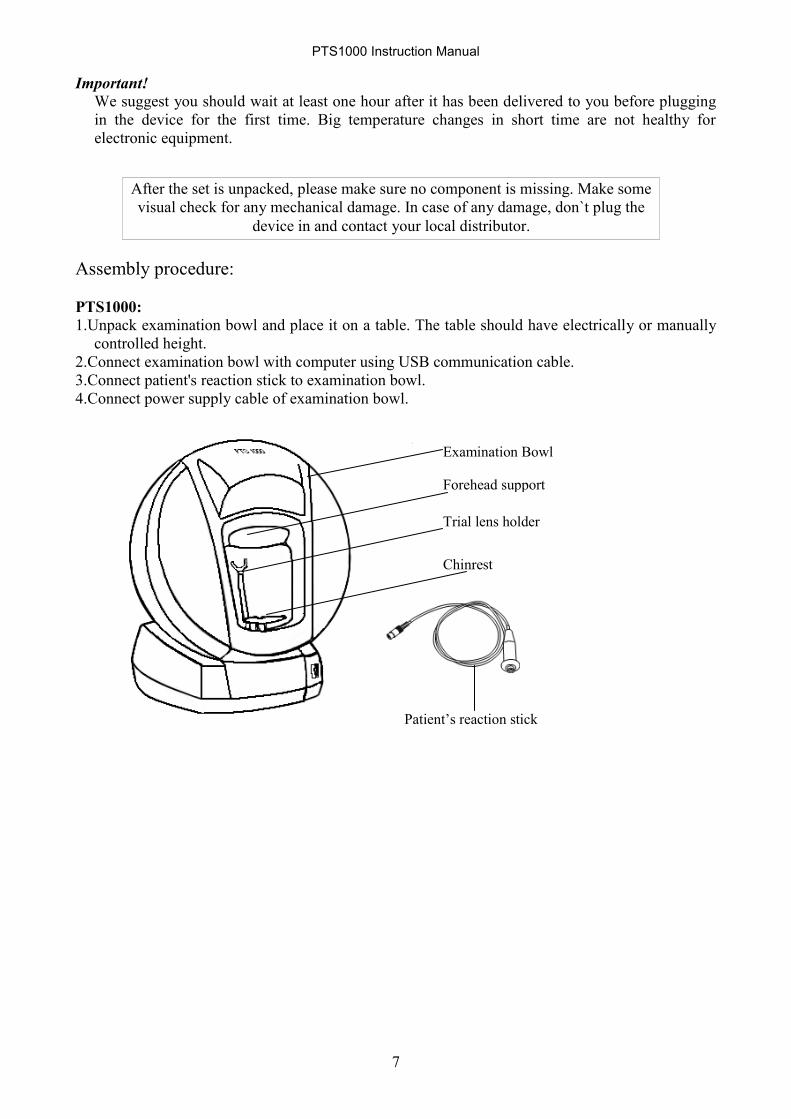
Important!
We suggest you should wait at least one hour after it has been delivered to you before plugging
in the device for the first time. Big temperature changes in short time are not healthy for
electronic equipment.
Assembly procedure:
PTS1000:
1.Unpack examination bowl and place it on a table. The table should have electrically or manually
controlled height.
2.Connect examination bowl with computer using USB communication cable.
3.Connect patient's reaction stick to examination bowl.
4.Connect power supply cable of examination bowl.
After the set is unpacked, please make sure no component is missing. Make some
visual check for any mechanical damage. In case of any damage, don`t plug the
device in and contact your local distributor.
Forehead support
Examination Bowl
Trial lens holder
Chinrest
Patient‟s reaction stick

PTS1000 Instruction Manual
8
3.1. Safety standards
PTS1000 series automated perimeter can only be connected to power supply socket equipped
with properly connected grounding pin.
PTS1000 series automated perimeter complies with requirements of directive 93/42/EEC (MDD
- Medical Devices Directive).
PTS1000 series automated perimeter is usually part of larger Medical System (containing other
medical and non medical devices). This Medical System as a whole and each device separately must
also be compliant with MDD standard. Therefore the distributor or manufacturer of all other
devices included in the Medical System must assure that those devices comply with MDD rules.
PTS1000 is connected to computer via USB cable. USB cable is electrically separated from
perimeter. This gives additional protection when the PTS1000 and the computer are connected to
different power supply sources with different ground level potential.
Electrical connections of PTS1000 medical system
Warning ! 1) If PTS1000 device and the whole Medical System have been installed by the
Manufacturer, the Manufacturer guarantees the proper installation and compliance with
MDD rules.
2) In case the PTS1000 automated perimeter and all later added instruments are
connected in a different way than in this instruction or the installation was NOT made by
Manufacturer, the Manufacturer takes no responsibility for the violence of the relevant
safety standards.
3) Any computer system or device attached to PTS1000 series perimeter must be MDD
compliant.
4) Manufacturer of PTS1000 series automated perimeters takes no responsibility for any
incorrectly diagnosed examination results and any problems caused by wrong diagnosis of
examination results.
Warning ! All activities that demand removing main body housing may be performed by qualified
personnel only.
Ignoring or disregarding the statements above may lead to danger of death or serious
injury.
CCD
cameraTRAFO
Microprocessor
PCB board
MAINS
FILTER
USB
220V/230V50Hz
PTS 910 Optical separation Computer
system
PC computer, printer, monitor, etc.
(Must comply with IEC-601:
Medical Electrical Systems
and MDD directive)
110/230 V
50 or 60 Hz
PTS1000

PTS1000 Instruction Manual
9
3.2. Software installation and configuration
3.2.1. Software installation and configuration in Windows XP
First step is installation of perimeter bowl drivers (only for PTS1000 model):
1.Turn the computer on (Windows operating system will be loaded). Insert PTS1000 series
installation CD into CD-ROM drive (usually drive D: or E:).
2.Turn the examination bowl on (according to PTS1000: make sure the bowl is connected to
computer by means of USB cable, and connected to power supply).
3.Windows will detect new hardware connected to USB socket and you will see the following
screen. Click on the “Next >” button.
4.Select “Search for the best driver for your device. (Recommended).” option and click on the “Next
>” button.
5.Mark “Specify a location:” option and select the “Browse” button to browse the directory:
“D:\Drivers” from your installation CD. Note! Replace D: with the drive letter of your CD-
ROM drive if necessary. Click on the “Next >” button.
Click `Next`
button
Select this
option
Click `Next`
button

PTS1000 Instruction Manual
10
6.Click on the “Next >” button.
7.Prepare Windows installation CD-ROM (only if Windows 9x is used).
8.Click on the “Finish” button.
Digital camera installation is performed in the same way.
After having installed the drivers, one has to install PTS1000software:
1.From PTS 1000 series installation CD-ROM run SETUP.EXE.
2.If Language window will appear select installation language. Language window will appear only
if operating systems default language is not supported by PTS software.
3.Click on the “Next” button to continue.
4.Select the folder you would like Setup to install PTS1000 program. If you want to use default
folder, click “Next >” button.
Mark this
option
Browse
'D:\Drivers'
directory
Click `Next`
button
Installation process can be little different, depending on the used version of
Windows operating system.
Click `Next`
button

PTS1000 Instruction Manual
11
5.Select the start menu group to install PTS1000 shortcut. If you want to stay with default group,
click “Next >” button.
6.Choose the option of creating shortcut on screen panel and click “Next >” button.
7.Click on the “Install” button.
8.Click ”OK” to install Borland Database Engine.
9.Click on the “Yes” button to confirm specified directory.
9. Click on the “Finish” button.
Installation process can be little different, depending on the version used of
Windows operating system.
Click `OK`
button
Click `Yes`
button
Select the folder
Click `Next`
button
Click `Next`
button
Select start
menu group

PTS1000 Instruction Manual
12
Manual selection of
communication port
in case of problems
in connecting device.
Now one has to configure the software:
1.Run PTS1000 application. (details are explained in “5. System startup” and “6. Program
structure” parts of this manual)
2.Click on the “Setup” button and go to Setup Window.
3.Choose “Microsoft WDM Image Capture Version: 5.” video source. If marked USB mode
option is visible, it is not necessary to specify communication COM port. Click on the
“Format” button.
Click `Setup`
tab
Choose `Microsoft
WDM Image
Capture Version:5.`
video source
Click `Format`
button
Mark this box to
enable video
preview

PTS1000 Instruction Manual
13
4.Choose camera resolution of “352 x 288” pixels and “RGB 24” bits of color depth (True
Color). Click on the “OK” button.
PTS1000 software requires screen resolution of 800 x 600 pixels or better and 24 bits
of color depth (True Color) or better.
1. Click right mouse button on the Windows desktop and select “Properties”.
2. Select “Settings” tab and adjust settings.
Choose
`352 x 288`
resolution
Choose
`RGB 24`
color depth
Click `OK`
button
Select 'Settings'
tab
Adjust
resolution Choose
color depth

PTS1000 Instruction Manual
14
3.2.2. Software installation and configuration in Windows VISTA
3.2.2.1. Compatibility of PTS1000 and Windows VISTA
PTS1000 software is compatible with Windows Vista with some restrictions because of UAC
(User Account Control) - new idea of user rights and user accounts implemented by Microsoft. The
differences appear if there are more than one user accounts which are used to run PTS1000
application on the computer. If the PTS1000 application is used only from administrator‟s account,
the only thing which is required for full functionality is to run application “as administrator”.
In Windows Vista only users with administrator privileges are allowed to run applications which
fully access system registry. PTS1000 uses registry indirectly via BDE component during database
integrity check. Therefore this option requires elevation of user rights and PTS application to be run
„as administrator‟.
Contrary to previous versions of Windows OS, Windows Vista with UAC turned on creates
copies of databases for each user separately. Hence, there can be a problem with maintaining
integrity of database if PTS1000 application is used from different users‟ accounts. Every user
would have own data base and different users would not be able to review the same results.
There are two ways to cope with above changes. One of them is running PTS1000 application as
administrator. This solution is described in section 3.2.2.3 of this document. Another solution is to
turn off UAC and manage users account like it was in Windows XP. This method is described in
section 3.2.2.4 of this document. In both solutions all users can see and edit the same patients‟ data
base.
3.2.2.2. Drivers and software installation
At first USB components drivers have to be installed.
1.Turn the computer on and wait for Windows to start. After Windows has started plug in USB
cable from PTS, “Found New Hardware” window will appear. This means that the Windows
found new hardware installed and will search for drivers. Select „Locate and install driver
software‟
Click ‘Locate and
install driver’
PTS1000 Instruction Manual
15
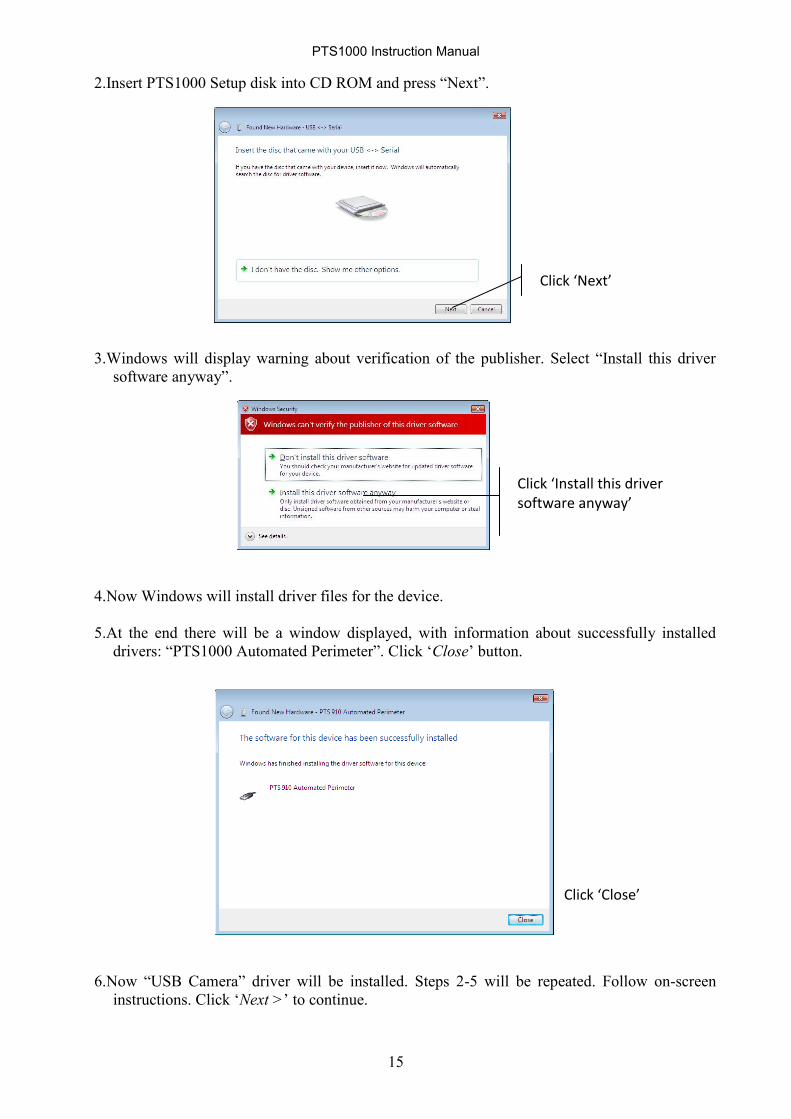
2.Insert PTS1000 Setup disk into CD ROM and press “Next”.
3.Windows will display warning about verification of the publisher. Select “Install this driver
software anyway”.
4.Now Windows will install driver files for the device.
5.At the end there will be a window displayed, with information about successfully installed
drivers: “PTS1000 Automated Perimeter”. Click „Close‟ button.
6.Now “USB Camera” driver will be installed. Steps 2-5 will be repeated. Follow on-screen
instructions. Click „Next >‟ to continue.
Click ‘Next’
Click ‘Install this driver software anyway’
Click ‘Close’

PTS1000 Instruction Manual
16
7.After that, following Windows message about successful installation will appear:
Next step is PTS1000 software installation
1. Insert PTS1000 installation CD into CD-ROM drive. Click 'My computer‟ and open CD-ROM
drive (usually D: or E:) and run SETUP.EXE file. After a message is displayed click „Next >‟
2. Select the destination folder where PTS1000 application will be installed and click „Next >‟ (the
default destination folder is: C:\Program Files\PTS1000)
Click ‘Next’
Click ‘Next’
Select destination folder

PTS1000 Instruction Manual
17
3. Select menu start group where PTS1000 icons will be placed (default: PTS1000). Click „Next >‟.
4. Mark checkbox if you wish program to create desktop icon and press „Next‟
5. Click „Install‟
Click ‘Next’
Click ‘Install’
Select Start menu group name
Click ‘Next’

PTS1000 Instruction Manual
18
6. After the software is installed, click „OK‟ to install BDE
7. If directory is not already present system will display massage. Click „Yes‟.
8. At the end of installation installer will ask for system restart. Select „Yes, restart the computer
now‟ and click „Finish‟
Click ‘OK.’
Click ‘Yes’

PTS1000 Instruction Manual
19
3.2.2.3. Running PTS1000 application on Windows VISTA as Administrator
In this method of running PTS1000 application, make sure to RUN PTS APPLICATION AS
ADMINISTRATOR. Best way is to set properties of shortcut on the desktop to always run in
administrator mode for all users. To do that:
1. Click right mouse button on the PTS1000 shortcut on the desktop.
2. Select “Run this application as administrator” in „Privilege Level‟ box.
3.Click OK.
IMPORTANT! After above changes, „Standard User‟ with standard rights, who will attend to run PTS1000
application, will have to enter password of one of system‟s administrators. Make sure that
PTS1000 software is used by responsible person who will use password only to run PTS1000
software.

PTS1000 Instruction Manual
20
3.2.2.4. Running PTS1000 application on Windows VISTA with UAC turned off
In this method of running PTS1000 application you need to reconfigure Windows VISTA.
There two actions that need to be performed.
Turn UAC off
Grant access to PTS1000 folder to all users which will be using PTS1000
TURNING UAC OFF
1. Log on to computer using account with administrator rights.
2. Go to Control Panel and open „User Accounts‟ window
3. Select “Turn User Account Control on or off”
4. Unmark “Use User Account Control (UAC) to help protect your computer” checkbox and click
“Ok”
5. System will ask you to restart computer. Select „Restart Later‟ and go to the next point.
PTS1000 Instruction Manual
21
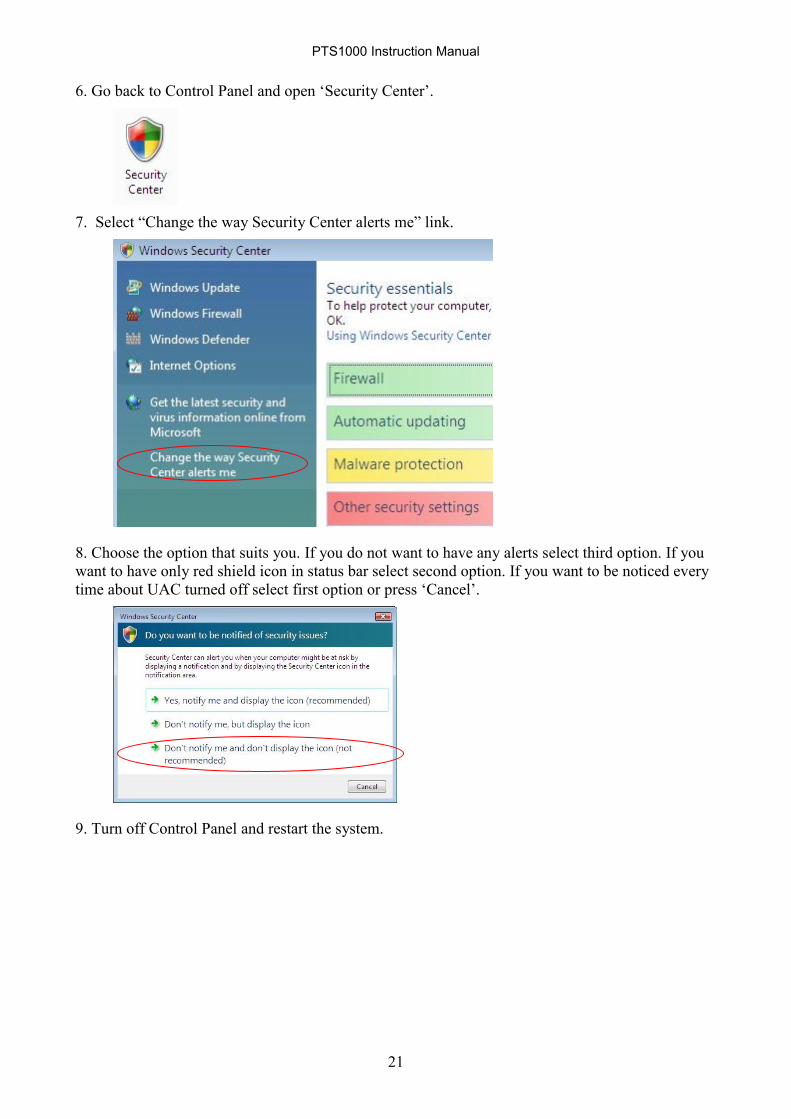
6. Go back to Control Panel and open „Security Center‟.
7. Select “Change the way Security Center alerts me” link.
8. Choose the option that suits you. If you do not want to have any alerts select third option. If you
want to have only red shield icon in status bar select second option. If you want to be noticed every
time about UAC turned off select first option or press „Cancel‟.
9. Turn off Control Panel and restart the system.

PTS1000 Instruction Manual
22
GRANTING ACCESS TO PTS1000 FOLDER TO ALL USERS WHICH WILL BE
USING PTS1000
1. Open Computer folder and navigate to place, where your PTS1000 software is installed (by
default C:\Program Files\PTS1000). Click right mouse button and select „Properties‟
2. In security properties tab press „Edit...‟.
3. In next window under groups and users table press „Add..‟.
PTS1000 Instruction Manual
23
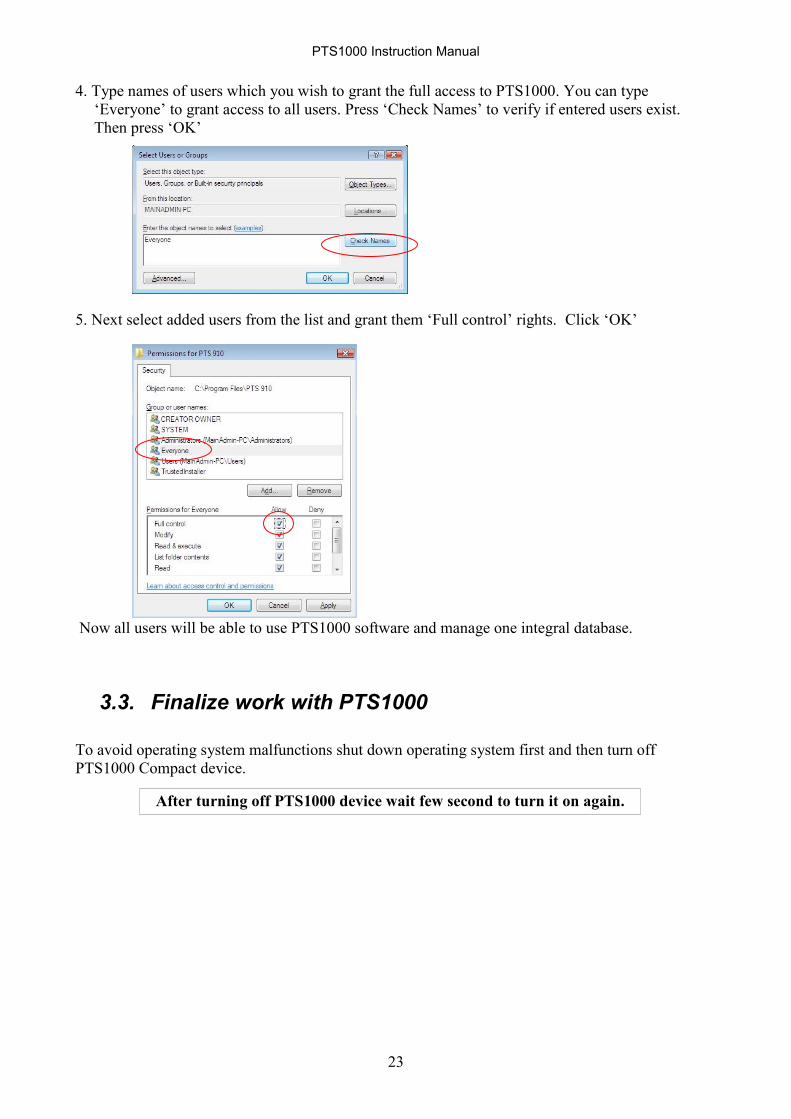
4. Type names of users which you wish to grant the full access to PTS1000. You can type
„Everyone‟ to grant access to all users. Press „Check Names‟ to verify if entered users exist.
Then press „OK‟
5. Next select added users from the list and grant them „Full control‟ rights. Click „OK‟
Now all users will be able to use PTS1000 software and manage one integral database.
3.3. Finalize work with PTS1000
To avoid operating system malfunctions shut down operating system first and then turn off
PTS1000 Compact device.
After turning off PTS1000 device wait few second to turn it on again.
PTS1000 Instruction Manual
24
4. PTS1000 maintenance
Warning!
All cleaning procedures can only be performed when PTS1000 series device is turned off and
unplugged from power socket.
During its life span PTS1000 series device doesn't require any special treatment. All surfaces of
the bowl should be kept tidy and free of dust. Use only mild solvents for cleaning. Make sure water
or any other liquid doesn't break into the interior of the bowl. Periodically check if the bowl is not
mechanically damaged. Make sure the plugs didn't get loose.
For hygienic reasons, after each examination the chinrest and forehead rest should be disinfected.
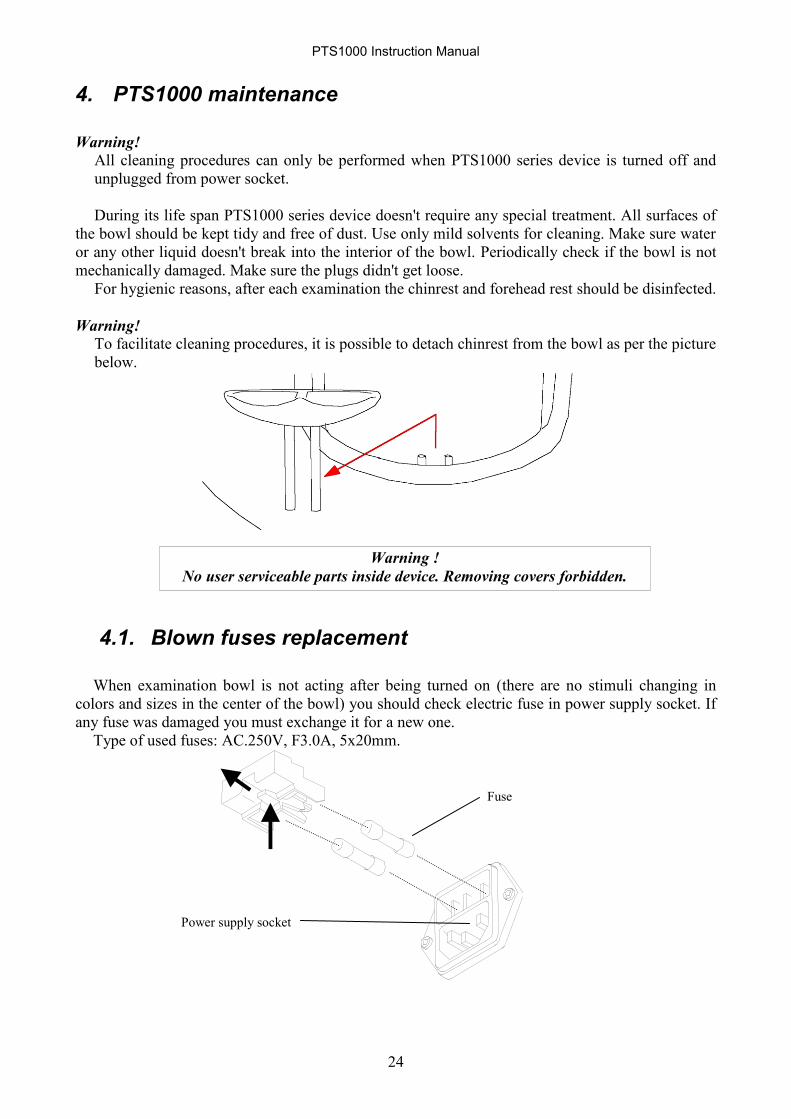
Warning!
To facilitate cleaning procedures, it is possible to detach chinrest from the bowl as per the picture
below.
4.1. Blown fuses replacement
When examination bowl is not acting after being turned on (there are no stimuli changing in
colors and sizes in the center of the bowl) you should check electric fuse in power supply socket. If
any fuse was damaged you must exchange it for a new one.
Type of used fuses: AC.250V, F3.0A, 5x20mm.
Warning !
No user serviceable parts inside device. Removing covers forbidden.
Fuse
Power supply socket

PTS1000 Instruction Manual
25
5. System and PTS1000 program startup
After Windows has started, you can run PTS1000 software. Click “Start” button and find proper
folder containing PTS1000 application. Click PTS1000 icon. The program will be started.
If you are using this computer only for PTS1000 you can make PTS1000 start
automatically. Details are explained in the next parts of this manual.
PTS1000
folder
Click PTS1000
icon
Click `Start`
button

PTS1000 Instruction Manual
26
6. Program structure
PTS1000 software is designed to make it as easy as possible for the user. All buttons are big and
ergonomically located on screen and logically grouped.
When using this application you have to remember some basic rules of data entering, cursor
movement, etc. These rules apply to all other Windows programs.
Small arrow located on the screen is mouse cursor. Mouse cursor is used to click buttons, and
also to place keyboard cursor for entering data from keyboard.
Keyboard cursor has a shape of vertical line. Each character entered from keyboard will appear
in place of this cursor.
When left mouse button is clicked, keyboard cursor is placed in the same place as mouse cursor
(If keyboard cursor is allowed to be placed there).
Switching between different controls can be done using mouse cursor or TAB key; and choosing
active control is confirmed by pressing ENTER key.
PTS1000 application is divided into four main tabs. You can jump freely between them.
Main tab – basic window visible just after program startup. It enables user to operate the database,
register new patients, edit patient's data, etc.
Examination tab – contains all controls that are used to conduct a new examination.
Result review tab– is used to review examination results.
Setup tab – is used to configure the whole application and to perform some database operations
(like backup, data recovery, etc.).
Keyboard cursor

PTS1000 Instruction Manual
27
7. Main tab
Main tab appears on the screen just after the application is started. It enables user to control patient's
database:
register new patients,
remove patients,
edit patient's personal data,
enter some remarks concerning selected patients.
All controls located on main window are shown below:
7.1. Fast search mechanism
If you find it difficult to locate your patient, just go to fast search control and patients filter.
Enter first few letters of patient's name to quickly locate patient in patients list. Program will
automatically search for the closest match.
You can also use patients filter. It can be used to display only these patients who have been
examined during last n days/months/years or who have not been tested in a given period.
Fast search mechanism –
enter first few letters to
automatically find patient
Filter modes
Fast search
mechanism
Click to register
new patient
Click to view
examination
results
Click to go to
setup window
Click to quit the
program
Click to edit
patient's
personal data
Click to
unregister patient
Current
patient`s data
You can enter
your remarks
here
Software version
and ID number
Click to
conduct new
examination
Mark to see data
Exchange
patients only
(look chapter 12)
Here enter desired
number of days, months,
years
PTS1000 Instruction Manual
28
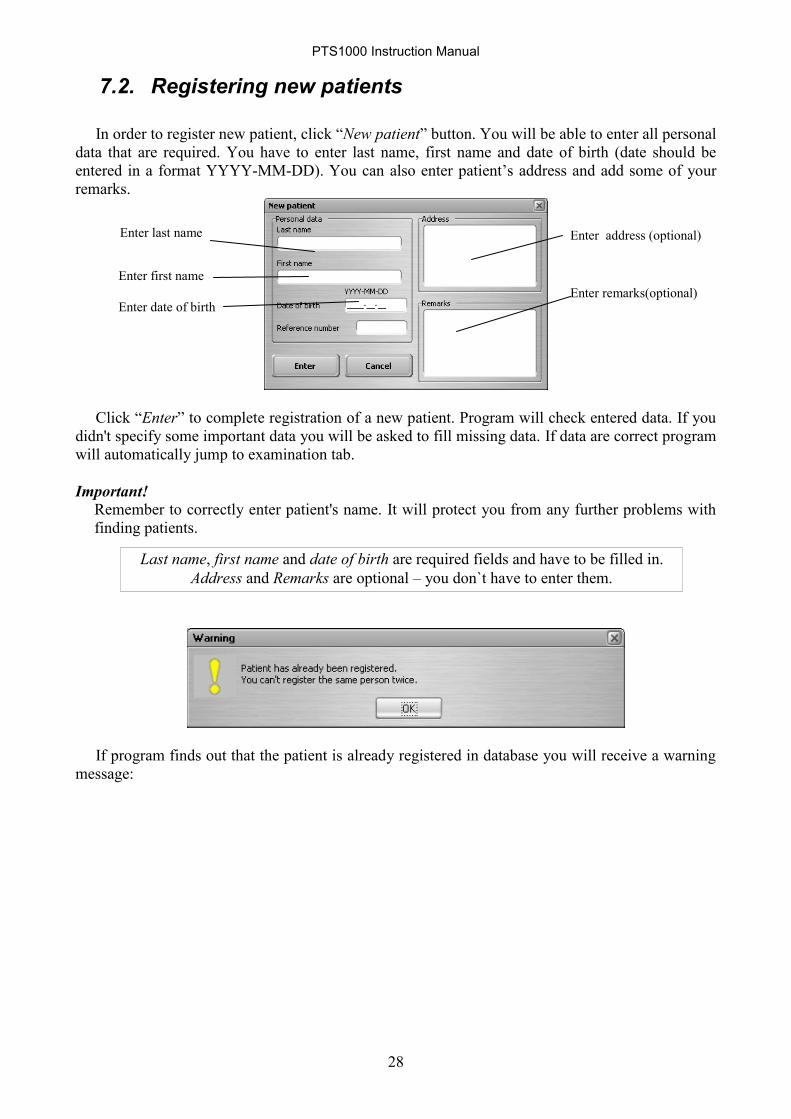
7.2. Registering new patients
In order to register new patient, click “New patient” button. You will be able to enter all personal
data that are required. You have to enter last name, first name and date of birth (date should be
entered in a format YYYY-MM-DD). You can also enter patient‟s address and add some of your
remarks.
Click “Enter” to complete registration of a new patient. Program will check entered data. If you
didn't specify some important data you will be asked to fill missing data. If data are correct program
will automatically jump to examination tab.
Important!
Remember to correctly enter patient's name. It will protect you from any further problems with
finding patients.
If program finds out that the patient is already registered in database you will receive a warning
message:
Last name, first name and date of birth are required fields and have to be filled in.
Address and Remarks are optional – you don`t have to enter them.
Enter first name
Enter date of birth
Enter address (optional)
Enter remarks(optional)
Enter last name
PTS1000 Instruction Manual
29
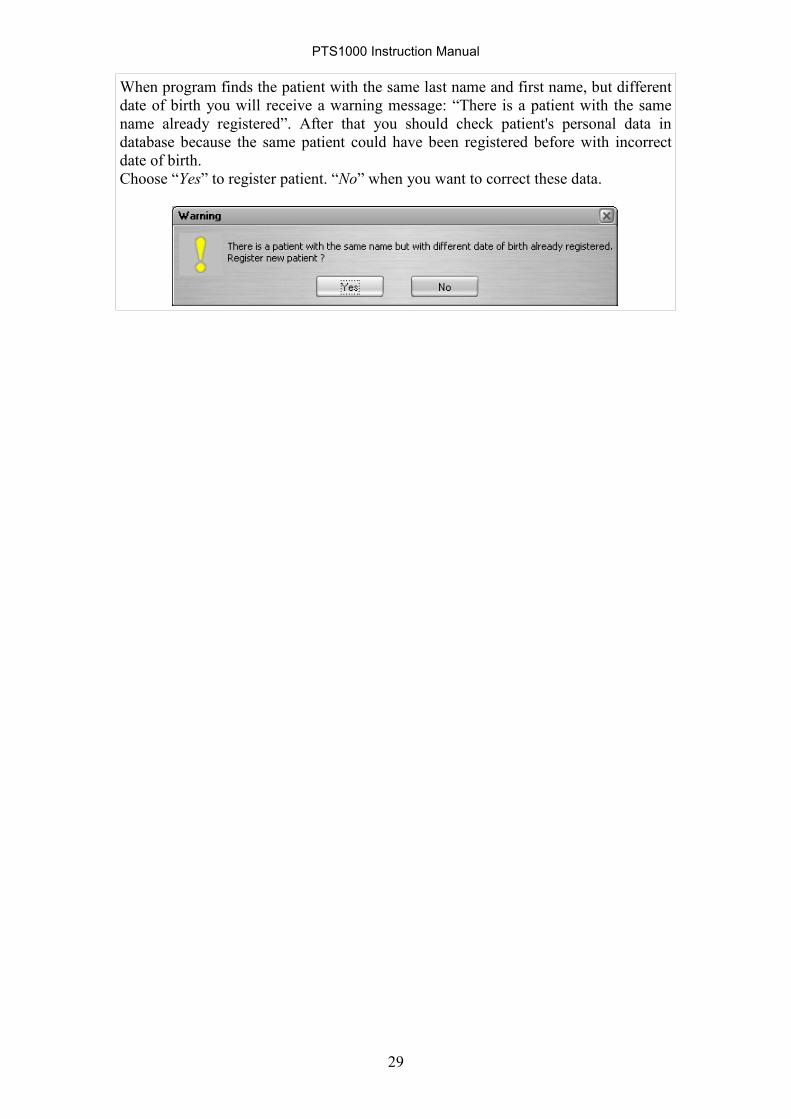
When program finds the patient with the same last name and first name, but different
date of birth you will receive a warning message: “There is a patient with the same
name already registered”. After that you should check patient's personal data in
database because the same patient could have been registered before with incorrect
date of birth.
Choose “Yes” to register patient. “No” when you want to correct these data.
PTS1000 Instruction Manual
30
7.3. Editing patient's personal data
To edit some incorrect data, select the patient from patients list and press “Edit” button. A
window will appear and you will be able to enter proper data. After the data are entered the program
will check the new data and they will be saved in database
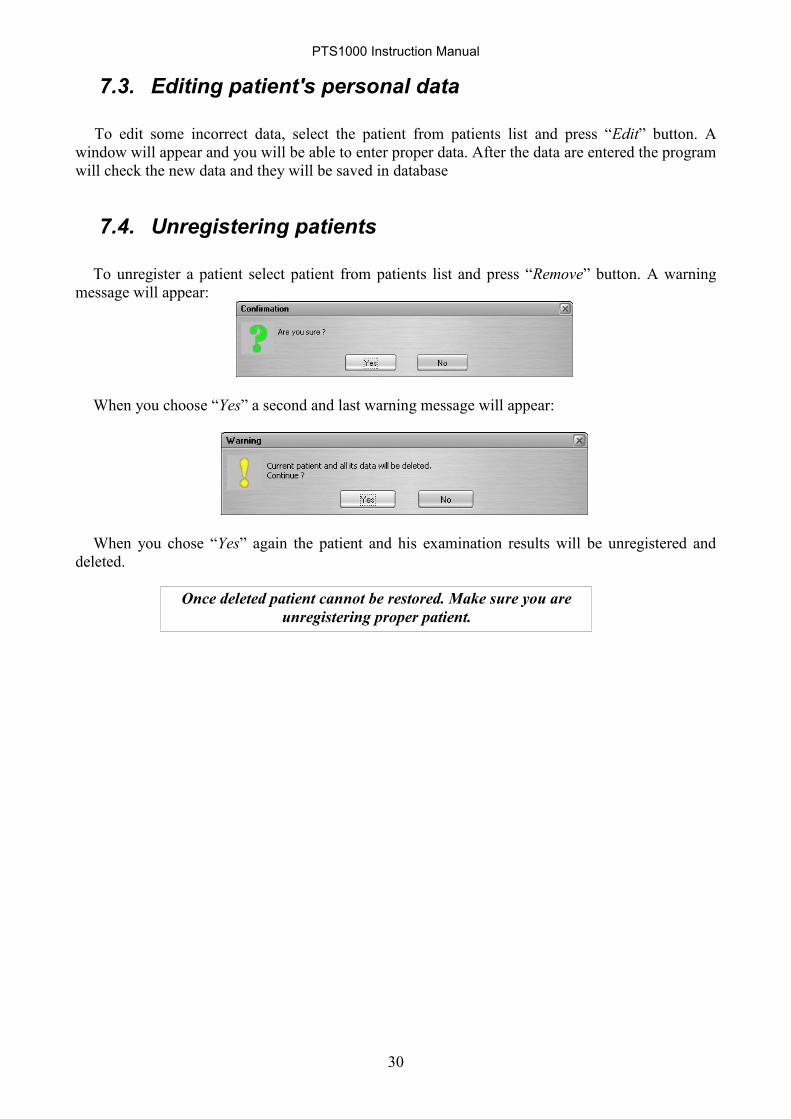
7.4. Unregistering patients
To unregister a patient select patient from patients list and press “Remove” button. A warning
message will appear:
When you choose “Yes” a second and last warning message will appear:
When you chose “Yes” again the patient and his examination results will be unregistered and
deleted.
Once deleted patient cannot be restored. Make sure you are
unregistering proper patient.

PTS1000 Instruction Manual
31
8. Examination tab
Examination tab is used to perform new examinations and to control examination parameters. It
is possible to conduct static or kinetic examination. Choice is made by clicking proper tab at the top
of the window. By default static examination window is selected.
8.1. Static examination
Picture of “Examination tab” is printed below:
During Examination additional information is shown:
Current strategy,
click to change Current field Current patient,
click to change Click to change
field
Mark this if you
want to check
neurological defects
Click to set
cylindrical lens
value
Click to change
examination
parameters
Click to select
the other eye
Status bar and
progress bar
Eye preview window
Click to begin
examination
Click to run DEMO Blind spot location
Click to set
spherical lens value
False negative
errors information
Number of exposed
stimulus points
Patient's average
reaction time
Fixation errors
information (digital
image analysis system)
Test duration
False positive
errors information
Fixation errors
information (Heijl-
Krakau method)
Current pupil
diameter
PTS1000 Instruction Manual
32
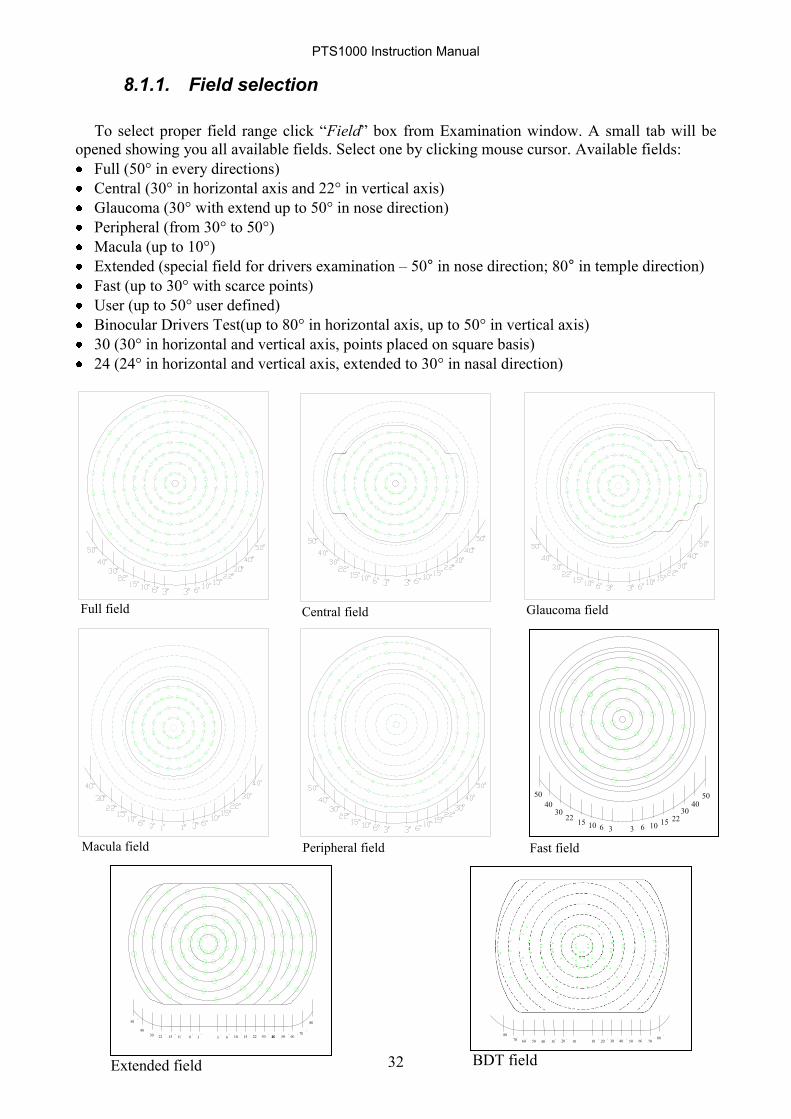
8.1.1. Field selection
To select proper field range click “Field” box from Examination window. A small tab will be
opened showing you all available fields. Select one by clicking mouse cursor. Available fields:
Full (50° in every directions)
Central (30° in horizontal axis and 22° in vertical axis)
Glaucoma (30° with extend up to 50° in nose direction)
Peripheral (from 30° to 50°)
Macula (up to 10°)
Extended (special field for drivers examination – 50° in nose direction; 80° in temple direction)
Fast (up to 30° with scarce points)
User (up to 50° user defined)
Binocular Drivers Test(up to 80° in horizontal axis, up to 50° in vertical axis)
30 (30° in horizontal and vertical axis, points placed on square basis)
24 (24° in horizontal and vertical axis, extended to 30° in nasal direction)
50 40
30 22 15 10 3 6 3 6 10 15 22 30 40 50 40 70 80
60
0 0
0 0 0 0 0 0 0 0 0 0 0 0 0 0 0 0
0 80
70 60 50 40 20 30 10 10 20 30 40 50 60 80 70
0 0
0 0 0 0 0 0 0 0 0 0 0 0 0 0
Extended field
BDT field
Full field Central field Glaucoma field
Macula field Peripheral field Fast field
3o
6o
10o
15o
22o
30o
40o
50o
3o
6o
10o
15o
22o
30o
40o
50o

PTS1000 Instruction Manual
33
8.1.2. Strategy selection
In order to select desired strategy click “Strategy” box. A small tab will be opened showing all
available strategies. Select proper strategy using mouse cursor.
There are five available strategies:
3-Zone
Screening
Threshold
Fast Threshold
Flicker
BDT (Binocular Drivers Test)
8.1.2.1. 3-zone strategy
In 3-Zone strategy each point is tested maximum 3 times. First exposition is made at 6dB below
HOV level (stimulus is brighter than expected). If patient reacts, the point is no more tested and
marked as NO DEFECT (a small dot appears on screen ),
If there is no reaction the point is exposed with maximum intensity (0dB). If there is no reaction
for maximum intensity, the point is no longer tested and marked as ABSOLUTE DEFECT (filled
square appears on screen). If there is reaction for maximum intensity, the point is tested again
6dB over expected HOV level. If there is no reaction the point is marked as RELATIVE DEFECT
(small empty square appears on screen □), otherwise the point is marked as NO DEFECT.
Below there‟s a schematic drawing of that process.
As it can be observed 3-Zone strategy can be used for locating defects of visual field without
measuring the depth of those defects.
N
N
N N
Y
N
Y
Y Y
Y NReaction No reaction
HOV level
AD RD No defect
30
10o
20o
30
0o 10o
20o
30o
0o
24 (right)
10o
20o
30
0o 10o
20o
30o
0o

PTS1000 Instruction Manual
34
8.1.2.1.1. 3-Zone testing using extended field
Unlike all other fields, extended field enables to test visual field up to 80 degrees. It can be
achieved by shifting fixation point 30 degrees left or right. Examination consists of a few stages.
In the first stage, normal 3-Zone test is performed (just as for all other fields). After a certain
number of points are tested, fixation point is shifted.
Patient should be instructed to look in the new fixation target. When the doctor makes sure that
patient‟s position is correct, examination can be resumed.
Make sure that patient looks at new fixation point and click “OK” button to continue.
8.1.2.2. Screening strategy
Screening strategy gives more accurate results. It not only locates defects but also measures the
depths of those defects.
First stimulus exposition is made 6dB over expected HOV level. If patient‟s reaction is
observed, current intensity is assumed as measured sensitivity for this point and it is no longer
tested. If there is no reaction, the intensity is increased in 6dB steps until the patients reacts for the
point or if maximum intensity is reached. If maximum intensity is reached the point is marked as
absolute defect and no longer tested (X mark is displayed on the screen).
If patient reacts, the stimulus intensity is decreased in 3dB steps until stimulus is invisible to
patient. The value of visible-not visible intensity is assumed as measured sensitivity.
Extended field can be tested only using 3-Zone strategy
After moving the fixation point, it is impossible to retest the blind
spot.

PTS1000 Instruction Manual
35
Below there‟s a schematic drawing of that process:
As can be seen from the graph above screening strategy can detect defects deeper than 6dB. It
doesn't detect areas that are more sensitive than expected – it doesn't test actual eye profile, it
detects defects only.
8.1.2.3. Threshold strategy
Threshold strategy is the most accurate strategy. It tests exactly the whole eye profile, but
duration of examination is longest.
First exposition is made at HOV level. Than the intensity is increased or decreased (depends on
reaction or no reaction from patient) in 6dB steps. Intensity is changed until sensitivity edge is
reached, then stimulus intensity is reversed in 3dB steps. This double check enables to determine
very precisely sensitivity level for each point.
This process is shown below.
Threshold strategy gives the most accurate results, but takes longest time. It not only locates
defects, measures depths of those defects but also measures exactly shape of visual field.
8.1.2.4. Fast threshold strategy
Fast threshold strategy is very similar to threshold strategy. The difference is in the duration of
examination. After calibration, initial levels of stimuli intensity are additionally modified on the
basis of measured sensitivity points in previous examinations of a given patient which are registered
in database, in order to minimize examination time. The examination consists of two stages.
In first stage points are tested using ordinary threshold strategy. After collecting half of the data,
program calculates expected sensitivity levels for the rest of points that haven‟t been tested yet. In
second stage program verifies those calculated values by means of screening strategy.
As a result Fast threshold strategy gives almost the same accuracy as threshold strategy but in a
lot shorter time (the examination takes 30%-40% less time).
Y NReaction No reaction
HOV level
N
N
NN
Y
Y
HOV level
Actual
sensitivity
level
Actual
sensitivity
level
Y NReaction No reaction
Calculated
HOV level
N
N
NN
Y
YActual
sensitivity
level
Actual
sensitivity
level
YY
N
Calculated
HOV level
PTS1000 Instruction Manual
36
8.1.2.5. BSV strategy
Examinations that use Binocular Single Vision strategy are performed in a different way than all
other examinations. BSV strategy is used to diagnose diseases related to common eyes movement
coordination and for diplopic diagnosis.
During the examination patient observes the examination bowl with both eyes opened, having his
head placed centrally using special chinrest adapter. The device will expose stimuli with maximum
intensity at different places of examination bowl. Patient should follow the stimuli with his eyes and
react on the reaction stick. If patient sees a single point, he should press the button once. If he sees
two points, then he should press the button twice.
Each of the examined points can have one of three possible values:
- it means normal single vision,
X - it means total no reaction,
- it means dual vision.
Detailed description of how to perform examinations using BSV can be found in chapter 8.6.5.
of this instruction manual.
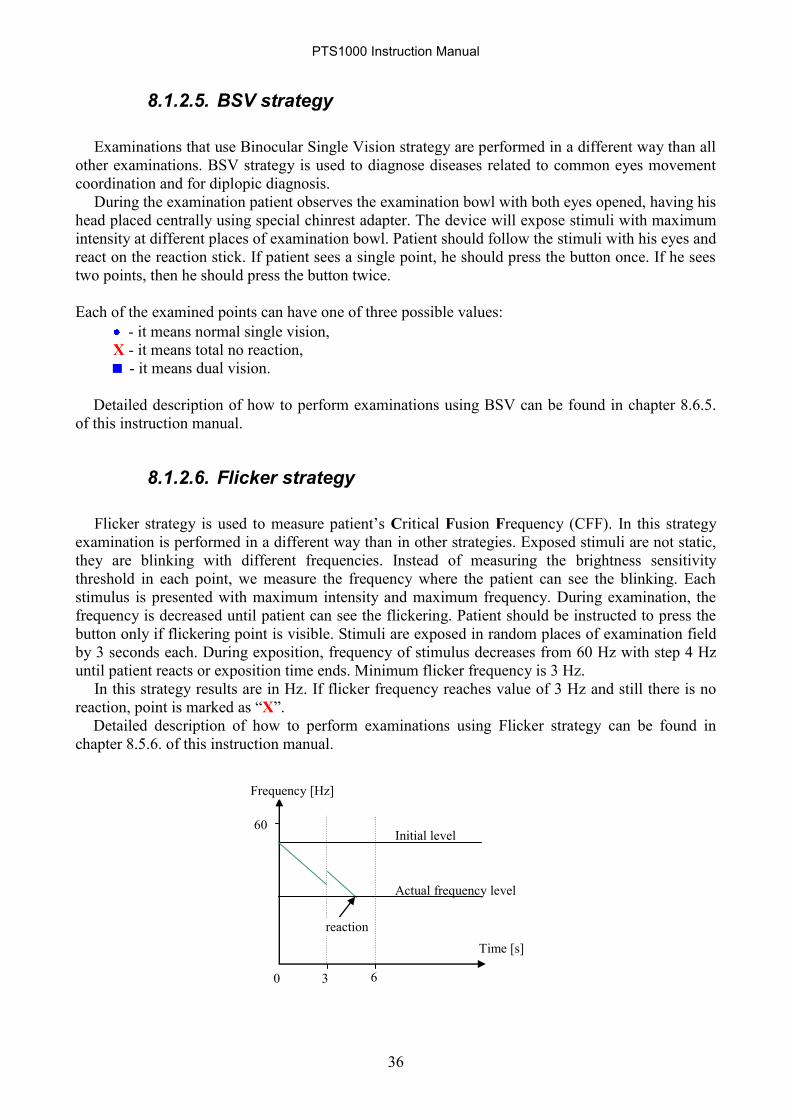
8.1.2.6. Flicker strategy
Flicker strategy is used to measure patient‟s Critical Fusion Frequency (CFF). In this strategy
examination is performed in a different way than in other strategies. Exposed stimuli are not static,
they are blinking with different frequencies. Instead of measuring the brightness sensitivity
threshold in each point, we measure the frequency where the patient can see the blinking. Each
stimulus is presented with maximum intensity and maximum frequency. During examination, the
frequency is decreased until patient can see the flickering. Patient should be instructed to press the
button only if flickering point is visible. Stimuli are exposed in random places of examination field
by 3 seconds each. During exposition, frequency of stimulus decreases from 60 Hz with step 4 Hz
until patient reacts or exposition time ends. Minimum flicker frequency is 3 Hz.
In this strategy results are in Hz. If flicker frequency reaches value of 3 Hz and still there is no
reaction, point is marked as “X”.
Detailed description of how to perform examinations using Flicker strategy can be found in
chapter 8.5.6. of this instruction manual.
Frequency [Hz]
Time [s]
60
0 3 6
Initial level
Actual frequency level
reaction

PTS1000 Instruction Manual
37
8.1.2.7. BDT strategy
Examinations that use Binocular Drivers Test strategy are performed in a different way than all
other examinations. BDT strategy is binocular test measuring full field of vision for drivers (by
default suits III4e Goldmann stimuli).
During the examination patient observes the examination bowl with both eyes opened, having his
head placed centrally using special chinrest adapter. The device will expose stimuli with the same
intensity for all points at different places of examination bowl. Intensity can be set in settings
window. Patient should look at the fixation point by both eyes and react on the reaction stick when
he sees any appears points.
Each of the examined points can have one of two possible values:
- seen point,
- missed point
Detailed description of how to perform examinations using BDT can be found in chapter 8.5.7.
of this instruction manual.
8.1.3. Reduced field
After starting new examination, program searches its database for previous examination of the
patient. If those examination results are found – program searches for absolute defects in those
examination results („X” marked). If absolute defects are found, program asks if the new
examination should be performed without testing absolute defect areas. If reduced field is not used,
the whole field is tested. Otherwise absolute defect areas are excluded from examination. Not
concern 3-Zone, BSV, Flicker and Blue on Yellow strategies.
8.1.4. Rarification of tested points
There is a possibility to reduce time of examination by decreasing number of examined
points. There are 2 options of field rarification:
- Rarified – number of examined point is halved
- Auto – in the middle of examination program checks which point lie between defective
points and require testing.
Click 'Yes' if you want
use reduced field
Click 'No' if you want
continue examination
without reduced field
Select „Whole‟ if you
want to examine all
points in a field
Select „Rarefied‟ if you want to examine
every second point in a field
Select „Auto‟ if you want
program to decide which
points to examine in the
second part of
examination
PTS1000 Instruction Manual
38
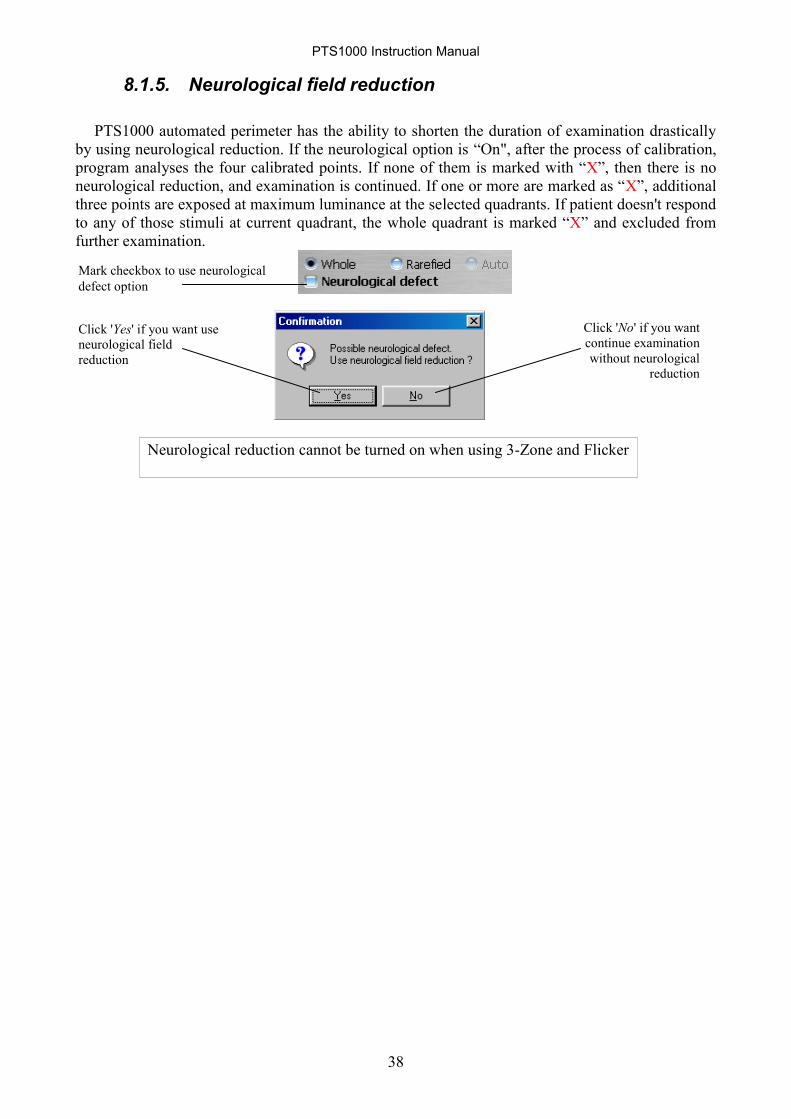
8.1.5. Neurological field reduction
PTS1000 automated perimeter has the ability to shorten the duration of examination drastically
by using neurological reduction. If the neurological option is “On", after the process of calibration,
program analyses the four calibrated points. If none of them is marked with “X”, then there is no
neurological reduction, and examination is continued. If one or more are marked as “X”, additional
three points are exposed at maximum luminance at the selected quadrants. If patient doesn't respond
to any of those stimuli at current quadrant, the whole quadrant is marked “X” and excluded from
further examination.
Neurological reduction cannot be turned on when using 3-Zone and Flicker
Click 'Yes' if you want use
neurological field
reduction
Click 'No' if you want
continue examination
without neurological
reduction
Mark checkbox to use neurological
defect option

PTS1000 Instruction Manual
39
8.2. Kinetic examination
Screen from kinetic examination is presented below:
8.2.1. Kinetic strategy
In kinetic strategy patient concentrates on a fixation point and tracks stimuli moving from
peripheral towards center of visual field.
At the beginning the blind spot is tested to check if patient fixates properly. A first stimulus is
brighter than expected normal threshold value in the central part. If patient reacts, point is marked
as point with known sensitivity. Points where patient reacted are consequently marked on a plot.
These points joined with a line create one isopteran. After completing meridians with first intensity,
intensity is decreased by 3dB and test is repeated. A stimulus is decreased 3 times so after
examination there are 4 complete isopters on the map.
User has possibility to change color, size, speed and intensity of stimuli. The value of intensity is
selected for the first run of meridians testing. In the consecutive runs stimuli is decreased by 3dB
from initially selected value.
- Isopteran map – visual field is presented in form of a
graph with approximated isopterans. In this mode
isopterans join points with the same sensitivity covering
whole visual field.
Select Color, Size, Speed
and Intensity of moving
stimuli
Eye selection
Examination settings
Stimuli vectors
Stimuli vectors
PTS1000 Instruction Manual
40
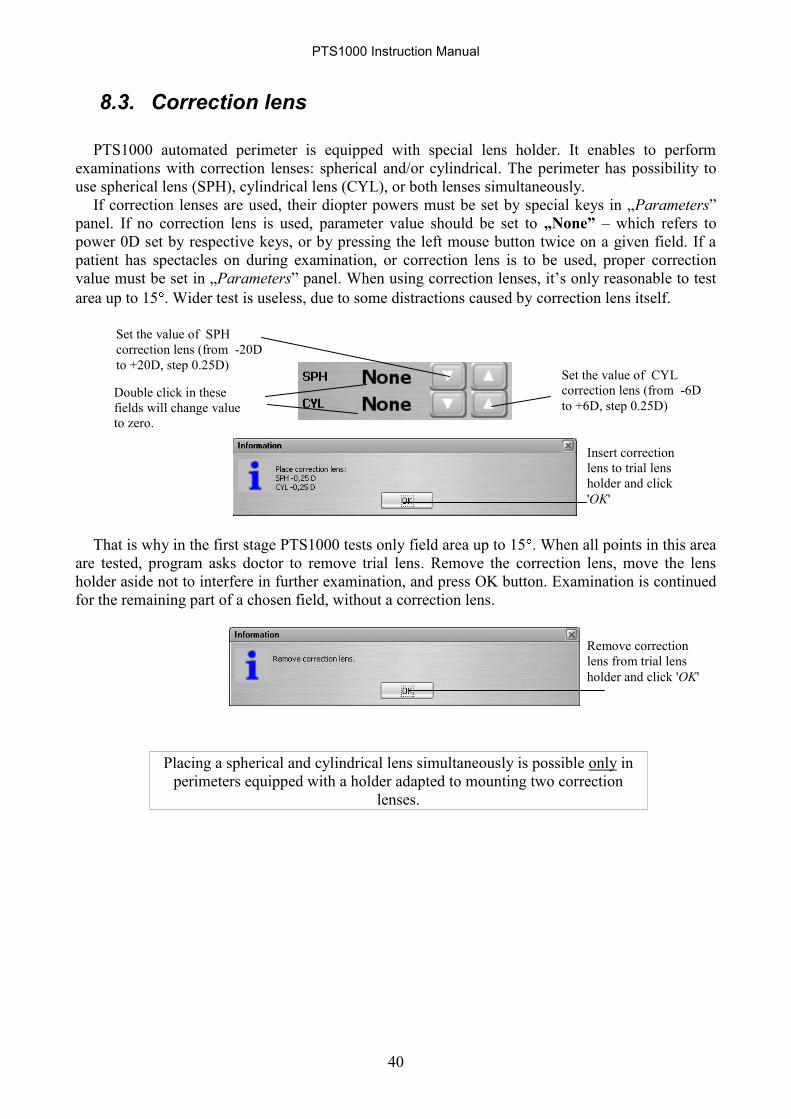
8.3. Correction lens
PTS1000 automated perimeter is equipped with special lens holder. It enables to perform
examinations with correction lenses: spherical and/or cylindrical. The perimeter has possibility to
use spherical lens (SPH), cylindrical lens (CYL), or both lenses simultaneously.
If correction lenses are used, their diopter powers must be set by special keys in „Parameters”
panel. If no correction lens is used, parameter value should be set to „None” – which refers to
power 0D set by respective keys, or by pressing the left mouse button twice on a given field. If a
patient has spectacles on during examination, or correction lens is to be used, proper correction
value must be set in „Parameters” panel. When using correction lenses, it‟s only reasonable to test
area up to 15 . Wider test is useless, due to some distractions caused by correction lens itself.
That is why in the first stage PTS1000 tests only field area up to 15 . When all points in this area
are tested, program asks doctor to remove trial lens. Remove the correction lens, move the lens
holder aside not to interfere in further examination, and press OK button. Examination is continued
for the remaining part of a chosen field, without a correction lens.
Placing a spherical and cylindrical lens simultaneously is possible only in
perimeters equipped with a holder adapted to mounting two correction
lenses.
Set the value of SPH
correction lens (from -20D
to +20D, step 0.25D)
Double click in these
fields will change value
to zero.
Set the value of CYL
correction lens (from -6D
to +6D, step 0.25D)
Insert correction
lens to trial lens
holder and click
'OK'
Remove correction
lens from trial lens
holder and click 'OK'

PTS1000 Instruction Manual
41
8.4. Examination parameters setup
In order to set Examination parameters click “Settings” button. A window will be opened as
shown below:
Fixation errors – Heijl-Krakau
Randomly during examination blind spot points are exposed. If the reaction is negative (no
reaction), program continues examination. If patient reacts for the stimulus, another stimulus is
exposed into blind spot. If there is reaction again, program displays warning message and fixation
errors index increases. The examination can be assumed as reliable if fixation errors ratio is less
than 25%
Digital fixation control
Constantly during examination special algorithm analyses images from camera and controls
fixation. Digital system of image analysis allows following movements of patient‟s eyes during
examination. If the fixation is good, examination is preceded and no expositions to blind spot are
made (which allows speeding up the process). If patient tries to stare away from fixation point,
program notices it immediately. Exposition to blind spot is made – to make sure the fixation is
incorrect. If there is no reaction from patient‟s side, examination is continued. In case of reaction
for blind spot points, program increases number of fixation errors and turns on attraction
mechanism (more details about attraction mechanism will be explained farther in this instruction
manual). Digital fixation control is much more efficient and accurate than H-K method as it
continuously monitors fixation.
False negative errors
If this option is activated, randomly during the examination, exposition is made to a point that has
already been tested. The stimulus is 6dB brighter than previously tested sensitivity level. In case of
Flicker strategy that stimulus has maximum brightness and flicker with frequency 5 Hz. The patient
should respond for this stimulus. No reaction from patient is treated as false negative error. False
negative errors can‟t be turned on for 3-zone and BSV strategy.
Stimuli exposition level
for BDT strategy
False positive
errors on/off False negative
errors on/off Fixation monitoring
on/off (Heijl-Krakau
method)
Fixation control
on/off (using image
analysis system)
Initial test speed
Fixation target
Stimuli parameters
Exposition time
Reaction time
Exposition time for
BSV strategy
Pause between
expositions
Click to restore
default values
Double reaction time
for BSV strategy
Reaction time in
slow mode

PTS1000 Instruction Manual
42
False positive errors
If this option is activated, randomly during the examination no exposition is made at all. In case of
Flicker strategy stimulus is exposed, it has maximum brightness and flicker with frequency 60 Hz.
If the patient reacts (because of so called „learning effect”), number of false positive errors is
increased. False positive errors can‟t be turned on for 3-zone and BSV strategy.
Exposure time
It's the time, when stimulus is exposed. It concerns all strategies excluding BDT strategy.
Reaction time
It's the time when device waits for patient‟s reaction after stimulus is turned off. During
examination, this time is automatically adapted to patient‟s reaction speed. It concerns all strategies
excluding BDT strategy.
Pause
It's the time when the computer delays next stimulus exposure, after the patient releases reaction
button. It concerns all strategies excluding BDT strategy.
Iterpretation of times settings
Exposure time for BSV strategy
It's the time for BSV strategy, when stimulus is exposed.
Double reaction time for BSV strategy
It's the maximum time between patient's clicks, which are treated as double click.
BDT stimuli level
It is stimuli‟s exposure level for all points. Can reach values from 3 to 30 dB with 1 dB step.
It should be considered, that fixation errors, false positive errors and false negative errors can
increase duration of examination, due to the necessity of exposing additional stimuli.
Events
Time
reaction time
pause
time exposure
time
reaction
next
exposure
When reaction occures
Events
Time
reaction time
exposure
time
next
exposure
When reaction not occures

PTS1000 Instruction Manual
43
8.4.1. Fixation selection
PTS1000 series automated perimeters support two types of fixation targets. Default target is one
central orange-colored point. For some patients (especially those suffering from strong defect of
yellow spot) this point may not be visible. For those patients fixation target can be switched to the
so called large diamond target. It consists of four paracentral fixation diodes. In order to change
fixation target the doctor has to click on target icon:
8.5. Performing examination
To perform new examination, please follow the instructions below:
1. In the main Window select proper patient. You can use “Fast search” mechanism. If the patient
is not yet registered, click New patient button and register patient.
2. Click “examination” button to go to Examination Window.
3. Make sure you have selected proper patient. The name is displayed on a panel in upper left
corner of the screen. If you selected wrong patient, click patient's name. A list will be opened
and you should find the proper person.
4. Select Field range for the examination.
Field name Usage
Full Used in monitoring neurological changes in both central and peripheral areas
of visual field. All other fields are contained in full field (except for extended
field). Usually used with screening strategy.
Glaucoma Used in glaucoma diagnosis. It is the field extended nasally to 50 degrees. Any
defects in nasal area can suggest glaucoma treatment; e.g. central or macula.
Used mostly with Fast threshold and Threshold.
Central Used to monitor changes in the centre of visual field i.e. caused by glaucoma
after previous examinations performed using glaucoma field
Macula Used in macula diseases, to detect field loss in diseases n.II and others, and
monitor changes with field limited below 10 degrees. Usually used with Fast
Threshold and Blue on Yellow strategies
Peripheral Used to detect peripheral changes, can be used as a supplementary test aimed
to follow further field loss above 22 degrees.
Extended Used for drivers. Can be tested using 3-Zone strategy only.
Fast Used mostly as first examination of a new patient and also to do large
population tests. Usually performed using Screening or 3-Zone strategy or
Blue and Yellow strategies.
User User defined field can include any points in 50 degrees range
BDT Used only with BDT strategy to examine whole drivers field range. Includes
120 points in 80 degree horizontal and 50 degree vertical ranges
30 Field covering central 30 degrees – 76 points on square basis evenly spaced
every 6 degrees
24 Field covering central 24 degrees – 54 points on square basis evenly spaced
every 6 degrees
Fixation target
button
PTS1000 Instruction Manual
44
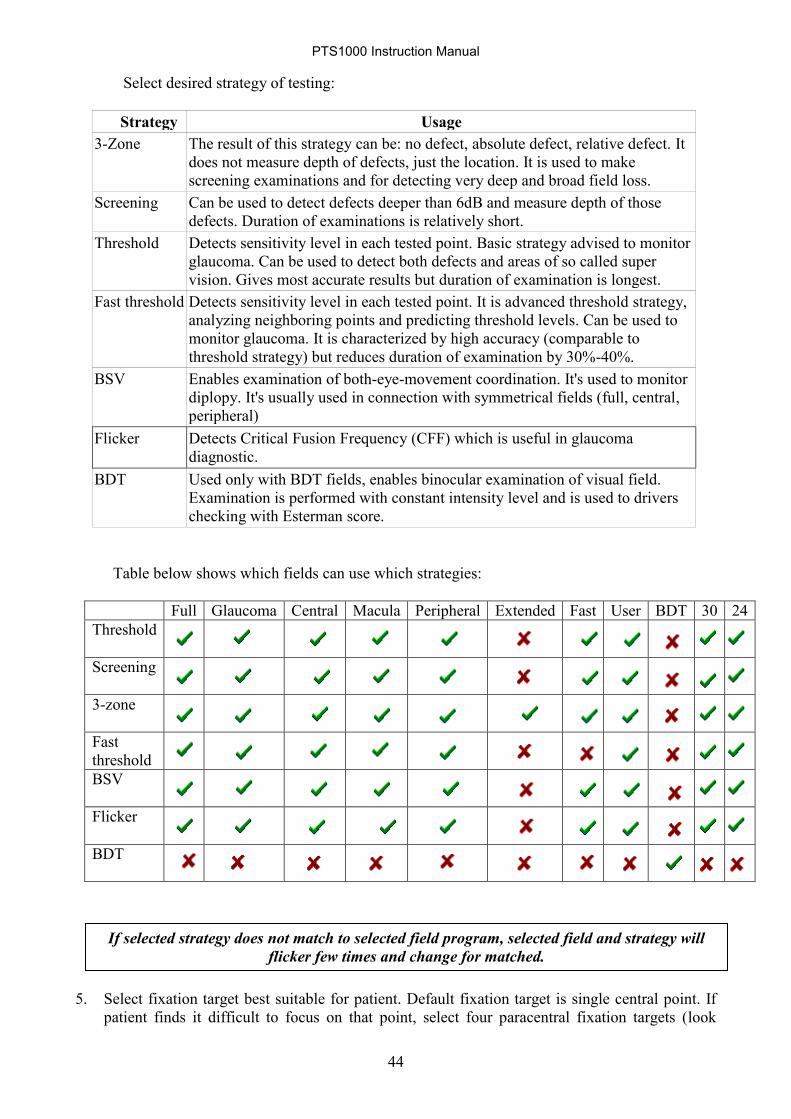
Select desired strategy of testing:
Strategy Usage
3-Zone The result of this strategy can be: no defect, absolute defect, relative defect. It
does not measure depth of defects, just the location. It is used to make
screening examinations and for detecting very deep and broad field loss.
Screening Can be used to detect defects deeper than 6dB and measure depth of those
defects. Duration of examinations is relatively short.
Threshold Detects sensitivity level in each tested point. Basic strategy advised to monitor
glaucoma. Can be used to detect both defects and areas of so called super
vision. Gives most accurate results but duration of examination is longest.
Fast threshold Detects sensitivity level in each tested point. It is advanced threshold strategy,
analyzing neighboring points and predicting threshold levels. Can be used to
monitor glaucoma. It is characterized by high accuracy (comparable to
threshold strategy) but reduces duration of examination by 30%-40%.
BSV Enables examination of both-eye-movement coordination. It's used to monitor
diplopy. It's usually used in connection with symmetrical fields (full, central,
peripheral)
Flicker Detects Critical Fusion Frequency (CFF) which is useful in glaucoma
diagnostic.
BDT Used only with BDT fields, enables binocular examination of visual field.
Examination is performed with constant intensity level and is used to drivers
checking with Esterman score.
Table below shows which fields can use which strategies:
Full Glaucoma Central Macula Peripheral Extended Fast User BDT 30 24
Threshold
Screening
3-zone
Fast
threshold
BSV
Flicker
BDT
5. Select fixation target best suitable for patient. Default fixation target is single central point. If
patient finds it difficult to focus on that point, select four paracentral fixation targets (look
If selected strategy does not match to selected field program, selected field and strategy will
flicker few times and change for matched.

PTS1000 Instruction Manual
45
chapter 8.4.1 of this manual).
6. Specify power of correction lenses (or no correction lens) and put lens/lenses in trial lens
holder. It is possible to use patient‟s own near vision spectacles. The frame can't be too loose or
too small (patent frames cannot be used), bifocal or progressive lenses cannot be used. Patient‟s
eyeglasses up to +6.0D can be used. With larger corrections you should remember about
possibility of optical artifacts. In this case using correction lens assures better parameters. With
correction 8D or higher, it is recommend to use contact lens. In case of examination using BSV
strategy, no correction lens can be mounted in lens holder.
7. Select tested eye (left or right). In case of BSV strategy you can't select tested eye (examination
is made for both eyes simultaneously).
8. If there is neurological defect suspicion (because of earlier examinations and doctor‟s
interview), you should mark this option in program (neurological option is inaccessible in 3-
zone, BSV, Flicker and BDT strategies).
9. Cover the other eye using eye-band supplied with perimeter. Patient should be informed that
during examination he must have both eyes opened, and can blink (it does not concern BSV
strategy). Keeping eyes half-open may significantly lower examination accuracy.
10. In case of BSV or BDT strategy, you should install chinrest adapter, which enables patient to
place head in central position.
11. Place patient's chin on chin-rest. Forehead should touch forehead-support. The height of table
should be set in comfortable position for patient.
12. Doctor should set patient‟s head height, using mouse cursor and clicks “up” or “down” button.
Patients pupil should be on horizontal line shown in preview window (look at below image).
13. Tell patient about the examination. Let him blink; explain what the examination is about and
what role patient plays in testing. Patient can pause the examination anytime by depressing
reaction button for about 3 seconds. Tell patient that in case fixation diode is blinking he must
look at it.
14. For inexperienced patients, having their eyes tested for the first time, it is advised to perform
DEMO program. It will allow the patient to get acquainted with the procedure, which will bring
out more credible results. When the patient is used to testing technique, DEMO program should
be cancelled.
15. There is eye preview window on the computer screen. Look at image from camera and set
patient's head height again. Patient's pupil should be on the horizontal line and inside the ellipse
(it does not concern BSV strategy – in BSV strategy height setting proceeds only according to
point no.13).
16. Ask patient if he is ready, and start examination using “Begin“ button.
The examination can be paused by the doctor using “Pause” button, but the patient himself can
pause the examination by pressing and holding reaction button for about 3 seconds. The
examination can be resumed using “Resume” button by doctor only.
Head too high – pupil above horizontal line Proper patient's head height

PTS1000 Instruction Manual
46
Below, the process of examination for the following strategies is described:
Threshold
Screening
3-Zone
Fast threshold
Examination process for BSV strategy is described in chapter 8.1.2.5
Examination process for Flicker strategy is described in chapter 8.1.2.6
Examination process for BDT strategy is described in chapter 8.1.2.7
8.6. Stages of examination for Threshold, Screening, Fast threshold, 3-Zone strategies:
Stage I – calibration
During this stage program automatically locates position and size of blind spot and measures the
sensitivity levels of four calibration points.
If the blind spot is not found, warning message is displayed.
You should then check patient‟s position and relocate blind spot.
During calibration process, it can happen that the calibrated HOV level will be much lower than
average value and below 18dB. This may be due to some defects which occur in/around calibration
point‟s area. The program detects that situation and displays warning message. Calibration level can
be then selected manually.
After sensitivity levels for all calibration points are tested, program calculates average sensitivity
by omitting two extreme values and by calculating an average value from the remaining two
figures. This average value is used to calculate a reference profile for all other field points,
according to the drawing presented below:
where X is the average sensitivity of 4 points for 10 degree ring calculated from calibration.
Sensitivity profile has a slope of 3 dB/10o for all strategies. Sensitivity profile height matches
average sensitivity of 4 calibration points for threshold and fast threshold strategies, while it is 6 dB
lower for screening and 3-Zone strategies.
If you give up with blind spot location, test will be performed without any
fixation monitoring, which will significantly affect credibility of the result.
Screening and 3-zone
strategy
10 o 10 o
0 o
Sensitivity [dB]
Angle
X
3dB/10 o
Threshold, Fast Threshold strategies

PTS1000 Instruction Manual
47
Important !!!
In case of BSV and BDT strategies the computer skips calibration and starts examination process
immediately.
Stage II – Testing
During this stage sensitivity levels are tested for each field point.
If fixation monitoring using Heijl-Krakau method is turned on, randomly there are expositions
made to blind spot location. If a patient reacts to two consecutive expositions of blind spot stimulus,
the computer increases number of H-K fixation errors.
If digital fixation is turned on, no expositions to blind spot are made when patient is fixating
well. Some expositions to blind spot are made only if program detects wrong fixation. If a patient
reacts to blind spot stimuli, the computer increases number of digital fixation errors.
Digital fixation control is a modern and a lot more reliable method than classic Heijl-Krakau
method. In digital fixation method, fixation is controlled continuously during testing. In case of
classic methods fixation tests are performed randomly, and they do not guarantee detecting all
moments of fixation loss.
Stage III – Final settings
After sensitivity levels for each point are measured, program displays final dialogue window
with a moving spiral informing patient that examination is over. The window with collection of
BASIC examination parameters is displayed on monitor screen. Doctor can enter some remarks
concerning examination. Examination can be saved to database or ignored, or printed.
8.6.1. Examination without digital fixation control.
If digital fixation control is off, program doesn't analyze images from camera. However the
image is displayed during the examination. Doctor can constantly observe patient's reactions. With
this setting, diameter of pupil is not measured automatically.
Click to save result to
database and go to result
window
Click to save result to
database only
Click to print the result
Click to ignore the result.
The result will not to be
saved to database
Click to measure
pupil diameter
Detailed information
about test
Enter your
remarks here
Click to retest field

PTS1000 Instruction Manual
48
8.6.2. Examination with digital fixation control
If examination is performed using digital fixation control, program automatically analyses
images received from the camera and locates the position of pupil. Pupil is marked with white dot
on the screen. Program measures the diameter of pupil and detects blinking.
If the patient is fixating well, the examination is conducted without expositions to blind spot. If
program notices, that the patient is trying to stare away from center, blind spot expositions are
made. It is aimed to verify, whether patient indeed has a wrong fixation. If the patient does not react
to blind spot stimuli, the examination is continued. If patient‟s reaction to blind spot stimuli is
detected, patient attraction mechanism is activated.
8.6.2.1. Active patient's attraction mechanism
Constantly during the examination program is monitoring position of pupil. If patient is not
fixating well, active attraction mechanism is turned on. The central fixation point starts to blink
rapidly. It causes patient to look at this point. When fixation is back to normal, the examination
continues.
8.6.2.2. Possible problems with digital fixation control
It can happen that in some special rare cases, program will not be able to locate position of pupil.
This happens very rarely, and can be caused by some pupil disease, mechanical pupil shape
distortions or bad lighting conditions in a room. In this case digital fixation control can be turned
off, using small button marked with x in upper right corner of camera image. Try also to arrange
examination room to avoid side lighting sources.
Wrong
fixation Marked centre
of pupil
Fixation
locator
Available eye
position range
Click to turn digital
fixation control on/off
PTS1000 Instruction Manual
49
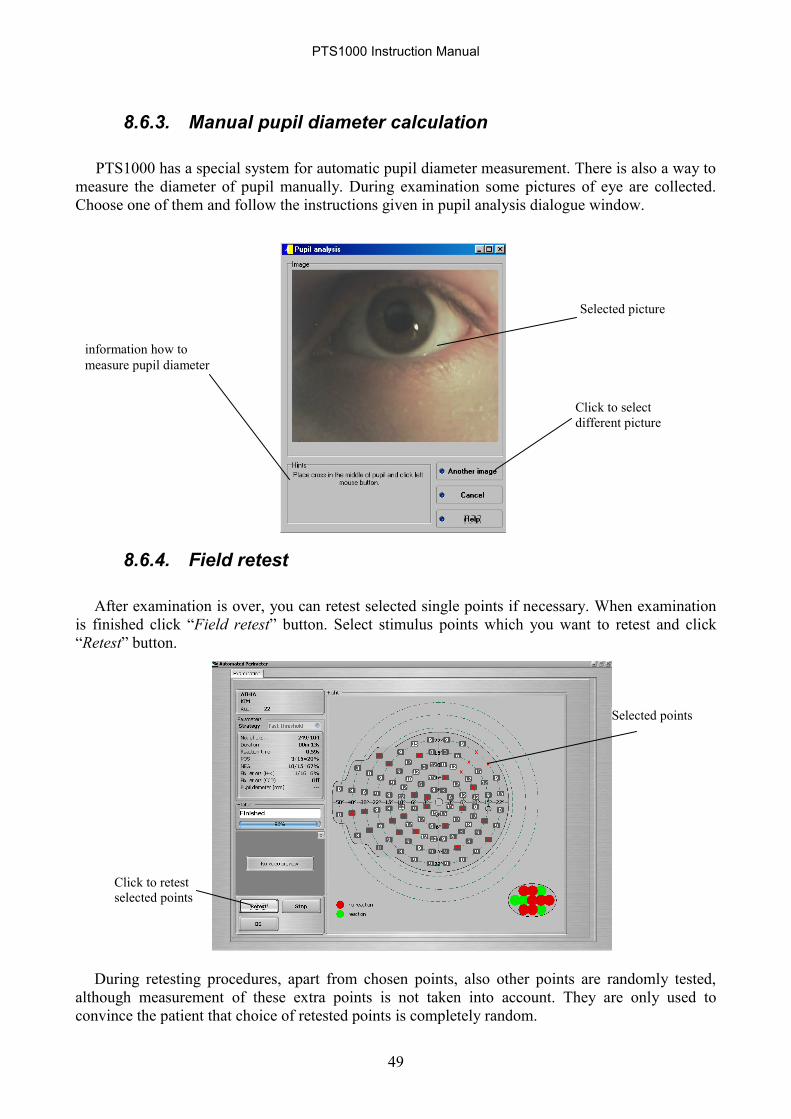
8.6.3. Manual pupil diameter calculation
PTS1000 has a special system for automatic pupil diameter measurement. There is also a way to
measure the diameter of pupil manually. During examination some pictures of eye are collected.
Choose one of them and follow the instructions given in pupil analysis dialogue window.
8.6.4. Field retest
After examination is over, you can retest selected single points if necessary. When examination
is finished click “Field retest” button. Select stimulus points which you want to retest and click
“Retest” button.
During retesting procedures, apart from chosen points, also other points are randomly tested,
although measurement of these extra points is not taken into account. They are only used to
convince the patient that choice of retested points is completely random.
information how to
measure pupil diameter
Selected picture
Click to select
different picture
Selected points
Click to retest
selected points
PTS1000 Instruction Manual
50
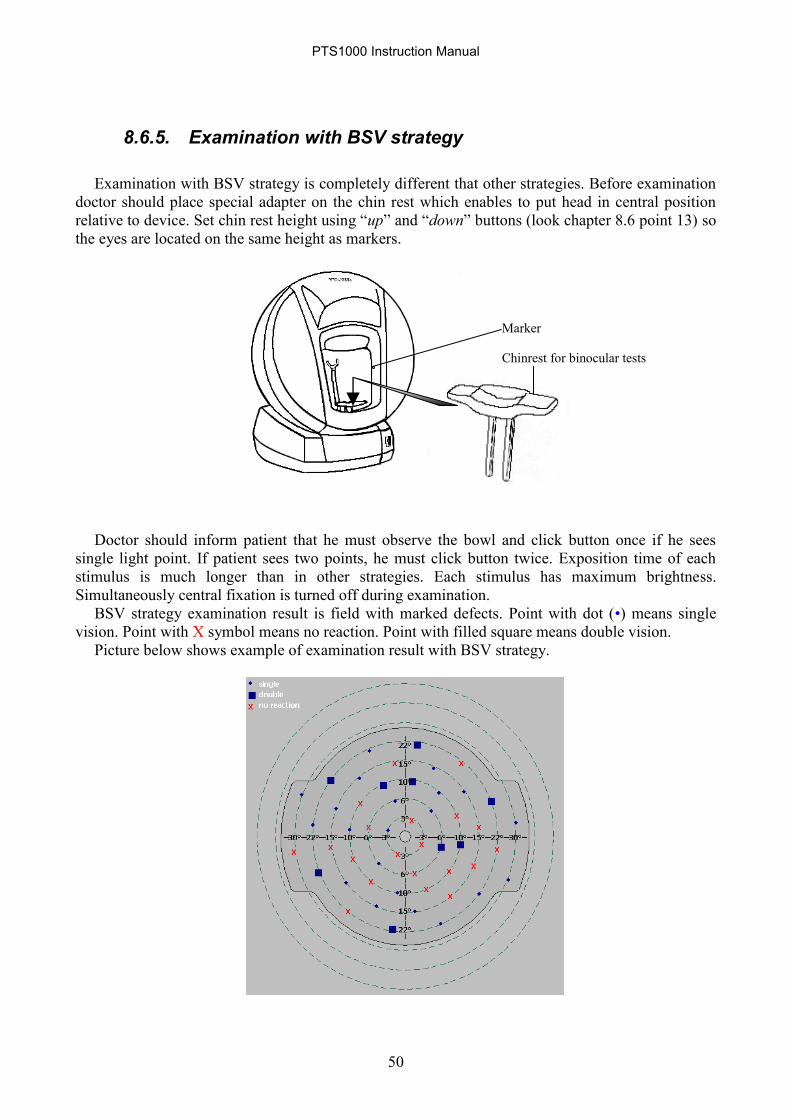
8.6.5. Examination with BSV strategy
Examination with BSV strategy is completely different that other strategies. Before examination
doctor should place special adapter on the chin rest which enables to put head in central position
relative to device. Set chin rest height using “up” and “down” buttons (look chapter 8.6 point 13) so
the eyes are located on the same height as markers.
Doctor should inform patient that he must observe the bowl and click button once if he sees
single light point. If patient sees two points, he must click button twice. Exposition time of each
stimulus is much longer than in other strategies. Each stimulus has maximum brightness.
Simultaneously central fixation is turned off during examination.
BSV strategy examination result is field with marked defects. Point with dot (•) means single
vision. Point with X symbol means no reaction. Point with filled square means double vision.
Picture below shows example of examination result with BSV strategy.
Chinrest for binocular tests
Marker

PTS1000 Instruction Manual
51
8.6.6. Examination with Flicker strategy
Examination with Flicker strategy is different than other strategies. Stimuli are exposed with
maximum luminance, but they stimulus is not static. The stimulus is blinking (flickering) with
different frequencies. Patient should react only flickering stimulus is visible. If the patient can see
static stimulus or doesn‟t see any stimulus, he should not press the button.
Calibration stage is performed by similar way than in other strategies, computer examines 4
points at 10o decentration, calculates mean value („X‟ on graph below) and increases it by 12 Hz. It
is the initial level of stimuli flicker frequency examination. During calibration computer also detects
blind spot by presenting flickering stimuli with 5 Hz frequency in each blind spot point.
During examination every stimulus starts flickering with calculated initial frequency level and
then frequency is decrease with step of 4Hz until patient reacts or 3 seconds elapse. The frequency
is decreased until patient reacts (sees flickering point) or 3Hz level is reached. If 3Hz level is
reached and patient didn‟t react, the points is marked as absolute defect (red „X‟ on the map).
False Positive and Negative tests are performed for Flicker strategy (False positive – 60 Hz,
False Negative 5 Hz frequency used).
Measured flicker level
10 o 10 o
0 o
Flicker frequency [Hz]
Angle X
Initial flicker level
Frequency [Hz]
Time [s]
60
0 3 6
Initial level
Actual frequency level
reaction
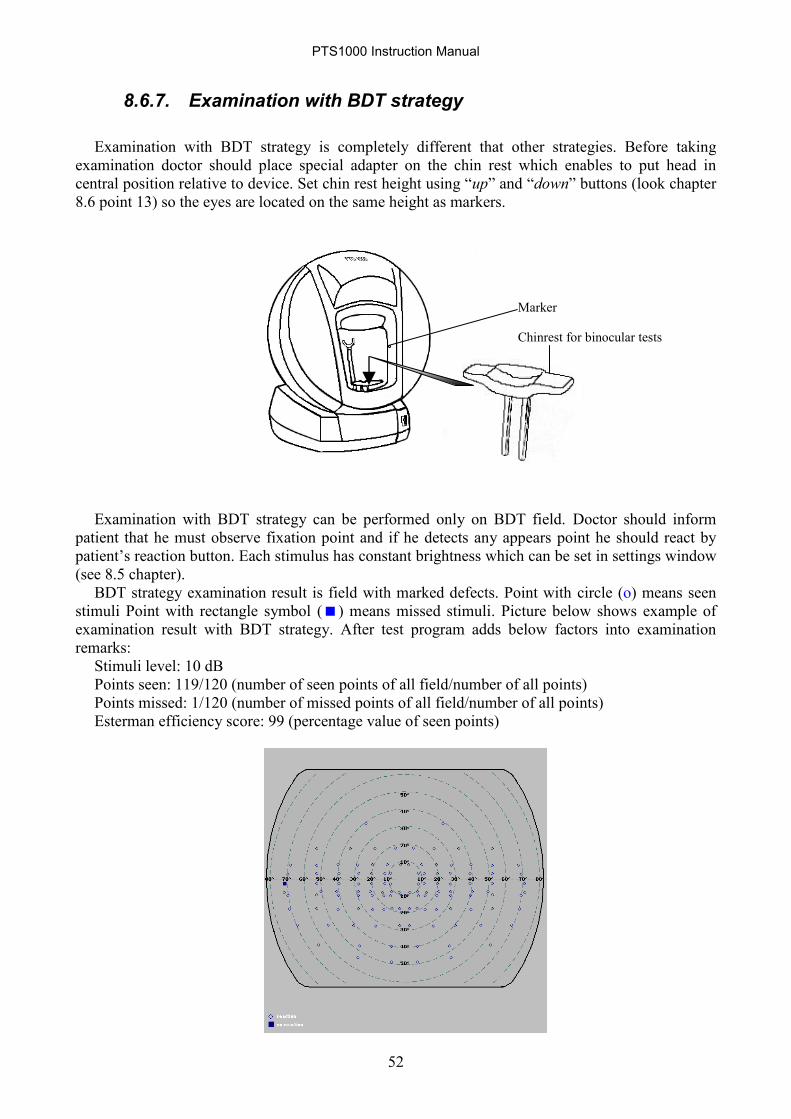
PTS1000 Instruction Manual
52
8.6.7. Examination with BDT strategy
Examination with BDT strategy is completely different that other strategies. Before taking
examination doctor should place special adapter on the chin rest which enables to put head in
central position relative to device. Set chin rest height using “up” and “down” buttons (look chapter
8.6 point 13) so the eyes are located on the same height as markers.
Examination with BDT strategy can be performed only on BDT field. Doctor should inform
patient that he must observe fixation point and if he detects any appears point he should react by
patient‟s reaction button. Each stimulus has constant brightness which can be set in settings window
(see 8.5 chapter).
BDT strategy examination result is field with marked defects. Point with circle (o) means seen
stimuli Point with rectangle symbol () means missed stimuli. Picture below shows example of
examination result with BDT strategy. After test program adds below factors into examination
remarks:
Stimuli level: 10 dB
Points seen: 119/120 (number of seen points of all field/number of all points)
Points missed: 1/120 (number of missed points of all field/number of all points)
Esterman efficiency score: 99 (percentage value of seen points)
Chinrest for binocular tests
Marker
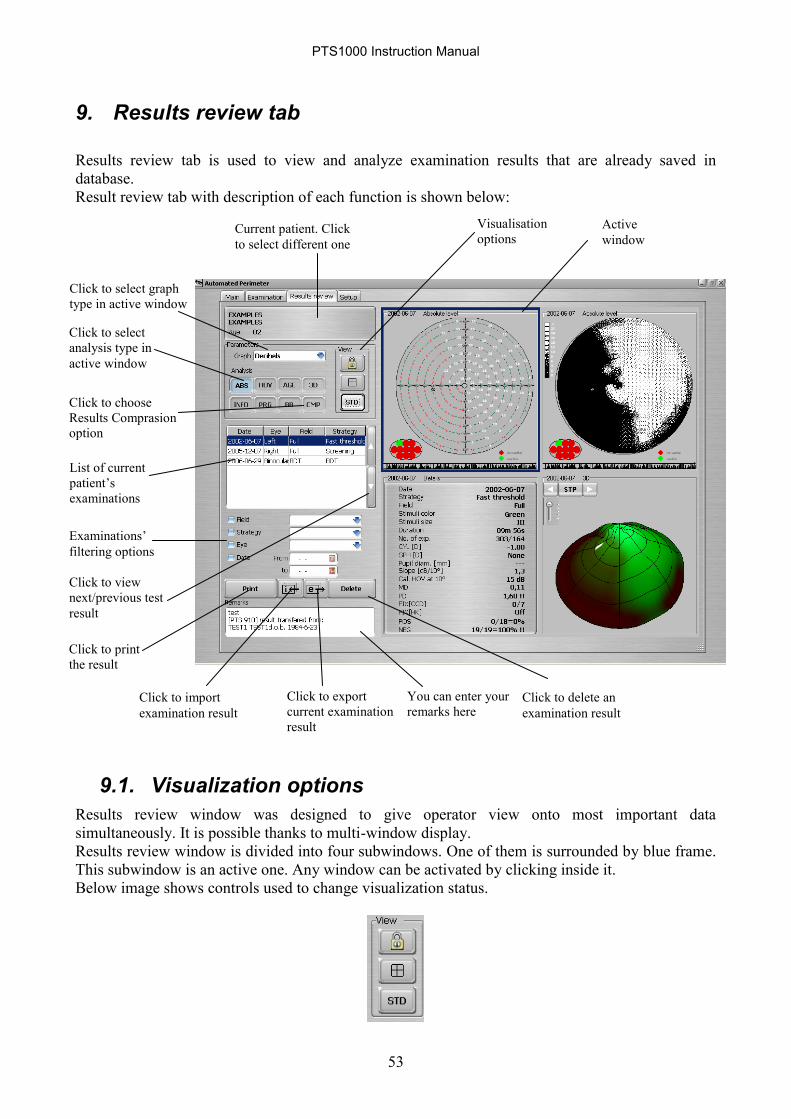
PTS1000 Instruction Manual
53
9. Results review tab
Results review tab is used to view and analyze examination results that are already saved in
database.
Result review tab with description of each function is shown below:
9.1. Visualization options
Results review window was designed to give operator view onto most important data
simultaneously. It is possible thanks to multi-window display.
Results review window is divided into four subwindows. One of them is surrounded by blue frame.
This subwindow is an active one. Any window can be activated by clicking inside it.
Below image shows controls used to change visualization status.
Click to choose
Results Comprasion
option
Visualisation
options
Click to select graph
type in active window
Click to select
analysis type in
active window
Examinations‟
filtering options
Click to view
next/previous test
result
Click to import
examination result
Click to print
the result
You can enter your
remarks here
Current patient. Click
to select different one
Active
window
Click to export
current examination
result
List of current
patient‟s
examinations
Click to delete an
examination result

PTS1000 Instruction Manual
54
Blocking all four subwindows to display results of one examination.
By default, in all four subwindows of results review screen images are related to one examination.
There is a possibility to display results of different examinations in different subwindows. In order
to do that it is necessary to turn off blocking of the windows. It is done by clicking the button with
padlock symbol.
- blocking turned on
- blocking turned off
Enlarging of the active window
It is possible to display contents of the active window enlarged onto results field. In order to
do that active subwindow should be double-clicked or enlargeing button pressed.
- 4 windows mode is active
- enlarged window mode is active
Restoring of the standard settings
To restore the standard settings, that is to display default maps in all 4 windows, “STD”
button is used. The default maps for each window can be selected in Setup/Appearance tab.
Both analysis type (ABS, HOV, AGE a.s.o.) and map style (dB, dot scale, grey scale, color
scale) can be adjusted according to preferences.
- Restore the standard maps in results review

PTS1000 Instruction Manual
55
9.2. Visual field analysis
PTS1000 automated perimeter offers four different graph types. Changing the graph types is
done by choosing one of the windows and selecting from the „Graph‟ list a required one.
Decibels field range is presented as a graph with values expressed in decibels of measured
sensitivity levels of field points.
Grey scale the result is shown as a grey scale with approximated values between tested points.
In this mode, the computer analyses and calculates sensitivity map for complete vision field,
based on point-measured sensitivity, and presents results in shades of grey. The darker the point,
the lower sensitivity.

PTS1000 Instruction Manual
56
Dot scale this graph is similar to grey scale, but sensitivity values are shown as small dots, for
easier recognition of areas with a given sensitivity level.
Color scale this graph is similar to dot scale, but pictograms are displayed in colors.
3-Zone and BSV results can be viewed only in decibel scale.

PTS1000 Instruction Manual
57
9.3. Analysis of results
PTS1000 series automated perimeters do not only collect the data during testing. It has some
special tools for analyzing results in order to easily detect all the defects. To change analysis type,
use the button named „Analysis‟
In order to change analysis tape, select one of the subwindows and then press analysis button.
- Absolute level Absolute level graph shows sensitivity levels expressed in decibels just
as they were tested. To select Absolute level analysis click “ABS” button.
- Age norm deviation / Total deviation This graph shows the deviation between actual
sensitivity of each point compared to pattern sensitivity calculated upon
patient‟s age. Negative number means, that the actual sensitivity is lower
than expected. Positive value means that the sensitivity is higher than
expected. To select Age norm deviation analysis click “AGE” button.
- HOV deviation / Pattern Deviation HOV - For each point of tested field this graph shows the deviation
between patient‟s actual sensitivity and the correct sensitivity. Correct
sensitivity is calculated on the basis of calibration and examination.
Negative number in each point means, that the actual sensitivity is lower
than expected. Positive value means, that the sensitivity is higher than
expected. To select HOV deviation analysis click “HOV” button.
Pattern Deviation – It is the Total Deviation map with removed general
depression bias. Therefore it shows deviations from the patient‟s ideal
profile and has a functionality of HOV deviation. General depression is
removed by zeroing 7th
best result from Total Deviation.
- 3D visualization This graph shows the 3-dimmensional visualization of a patient‟s Hill Of
Vision (HOV). It is based on HOV deviation.
- Examination details Shows information about selected examination. It contains: field type,
strategy, time of an examination, number of expositions, fixation errors,
MD and PD indexes.
Analysis for radial maps
Age norm is available only
for people examined with
green stimuli of size 3.
Analysis for 30 and 24
maps
Age norm is available
only for people examined
with green stimuli of size
3.
IMPORTANT!
Age norm is available only for people examined with green stimuli
of size 3 or white stimuli on maps 30 and 24.
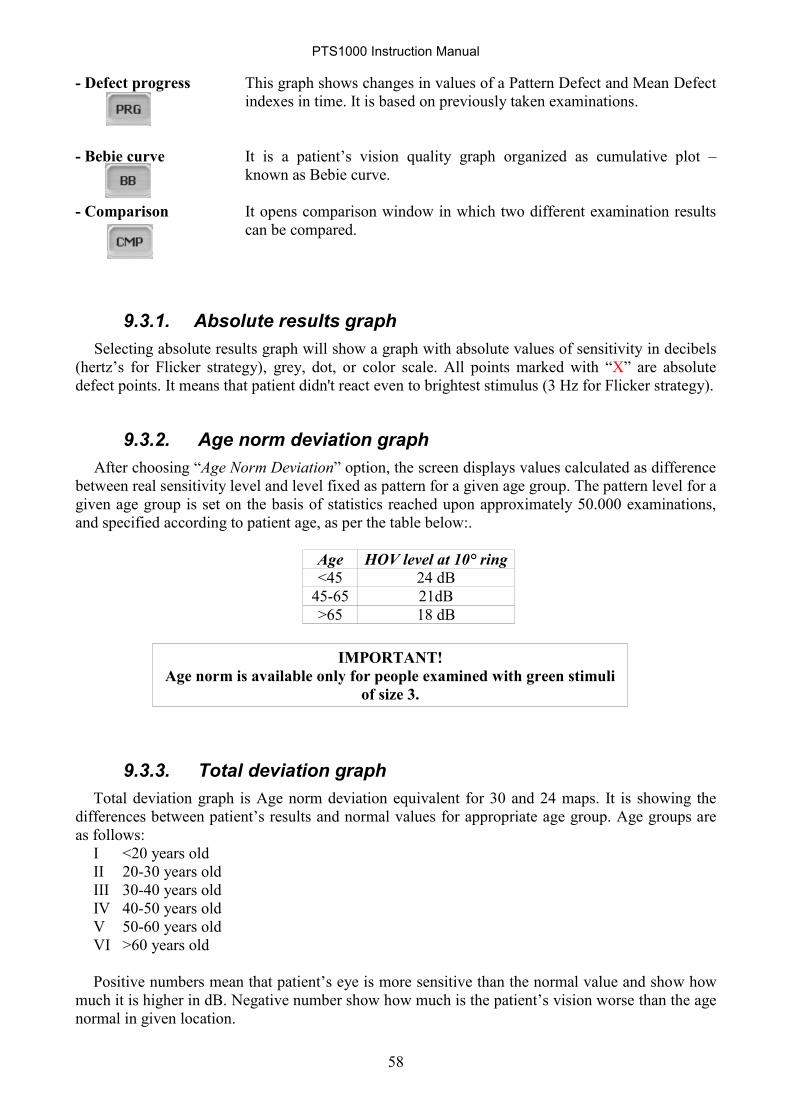
PTS1000 Instruction Manual
58
- Defect progress This graph shows changes in values of a Pattern Defect and Mean Defect
indexes in time. It is based on previously taken examinations.
- Bebie curve It is a patient‟s vision quality graph organized as cumulative plot –
known as Bebie curve.
- Comparison It opens comparison window in which two different examination results
can be compared.
9.3.1. Absolute results graph
Selecting absolute results graph will show a graph with absolute values of sensitivity in decibels
(hertz‟s for Flicker strategy), grey, dot, or color scale. All points marked with “X” are absolute
defect points. It means that patient didn't react even to brightest stimulus (3 Hz for Flicker strategy).
9.3.2. Age norm deviation graph
After choosing “Age Norm Deviation” option, the screen displays values calculated as difference
between real sensitivity level and level fixed as pattern for a given age group. The pattern level for a
given age group is set on the basis of statistics reached upon approximately 50.000 examinations,
and specified according to patient age, as per the table below:.
Age HOV level at 10° ring
<45 24 dB
45-65 21dB
>65 18 dB
9.3.3. Total deviation graph
Total deviation graph is Age norm deviation equivalent for 30 and 24 maps. It is showing the
differences between patient‟s results and normal values for appropriate age group. Age groups are
as follows:
I <20 years old
II 20-30 years old
III 30-40 years old
IV 40-50 years old
V 50-60 years old
VI >60 years old
Positive numbers mean that patient‟s eye is more sensitive than the normal value and show how
much it is higher in dB. Negative number show how much is the patient‟s vision worse than the age
normal in given location.
IMPORTANT!
Age norm is available only for people examined with green stimuli
of size 3.

PTS1000 Instruction Manual
59
9.3.4. HOV deviation graph
After selecting HOV deviation, program calculates the desired eye profile for the patient – basing
on sensitivity levels of four calibration points and examination result. Then this calculated level is
compared with actual sensitivity level for each point. Number in each point shows depth of defect,
in decibels (Hertz‟s for Flicker strategy), grey scale or dot scale. When examination was taken
using Screening and Blue on Yellow strategies, defects that are 6dB or deeper are shown. For
Threshold and Fast Threshold strategies this bound is different for each ring. For 1o - 10
o rings this
bound is 4dB, for 15 o
ring its 6dB, and for rings 22o - 50
o its 8dB. For Flicker strategy points are
marked as defects if they are deeper than 8 Hz.
Points marked with mean no defect. Points with absolute defects are marked with „X‟. Setting
pattern levels is different in Screening strategy than in other strategies.
In case of Screening strategy, pattern level for each ring is set in the same way as during patient
examination (look Chapter 8.6 – Stage I – Calibration).
For Threshold, Fast Threshold, Blue on Yellow and Spatial sensitivity strategies, pattern level for
each ring is set by using interpolation of real examination result skipping deep defects.
For Flicker strategy, pattern level suits calibration level and is flat for whole field of
examination.
Considering result reference to correct state, deviation is easy to interpret, and serves as BASIC
interpretation graph for specifying defects of visual field.
9.3.5. Pattern Deviation graph
Pattern Deviation is the HOV deviation equivalent for maps 24 and 30. It highlights local
depressions (scotomas) by zeroing influence of general depression of Hill Of Vision. The base for
Pattern Deviation graph is Total Deviation graph. By zeroing seventh best value from Total
Deviation the general depression is diminished in visualization of result.
Considering result reference to correct state, deviation is easy to interpret, and serves as BASIC
interpretation graph for specifying defects of visual field.
IMPORTANT!
Total Deviation analysis is available for Threshold and Fast
threshold strategies on 24, 30 maps and white stimuli of size 3.
Age norm is available only for people examined with green stimuli
of size 3.
IMPORTANT!
Total Deviation analysis is available for Threshold and Fast
threshold strategies on 24, 30 maps and white stimuli of size 3.
Age norm is available only for people examined with green stimuli
of size 3.

PTS1000 Instruction Manual
60
9.3.6. Three dimensional visualization
PTS1000 series has been equipped with a special system to show the results as 3D graphs. Click
“3D” button to see visualization like example below:
The doctor can change the point of view of the 3D cone by pressing the left mouse button and
dragging the mouse over the 3D image. It is possible to change the scale of the image by pressing
right mouse button and dragging amuse up/down.
Basic idea of this type of graph is to explain the idea and interpretation of test to the patient.
Result like this is very easy for the patient to understand. Proper and easy presentation of
examination results improves relationship and trust between patient and doctor. 3D view enables
doctor to better determine place and size of defects and losses.
3D visualization shows HOV deviation of the results. It is available for Threshold,
Screening, Fast Threshold results.

PTS1000 Instruction Manual
61
9.3.7. Comparing results
After choosing „Result Comparison” option, Results Compare window is displayed. To compare
examination results you must click “Select” button. The current examination will be compared to
the one chosen from the list. If sensitivity difference in a given point is not higher than 6dB, the
point is marked with a small dot (•) meaning, that the difference is within limits. If the difference is
bigger, a number is shown specifying the difference in decibels between two results.
Current result
Result to compare
Click to see field
of vision map
Click to result
details
Click to select
result to compare
Select
examination
result to compare
Click 'Select'
button
The list shows only those examination results that can be compared with
currently selected result (the proper strategy and the same field)
Results Compare does not work with 3-zone and BSV.

PTS1000 Instruction Manual
62
9.3.8. Pupil movement graph
During examination performed with digital image analysis on, program automatically stores
movements of patient‟s eyes into memory. Data like this is very useful when determining the
reliability of examination. Sample graph is shown below.
The upper horizontal line marks 10-degree deviation from center. The above graph shows poor
fixation sample. Well fixating patient's graph is shown below:
Vertical bars represent eye deviation from centre. The higher the bar, the bigger deviation from
bowl centre. Bars below horizontal bottom line mark the moments, when the active attention
attraction system is turned on.

PTS1000 Instruction Manual
63
9.3.9. Examination parameters panel
This panel contains all pieces of information about currently viewed examination result:
Duration
Shows total time that the examination has taken. This time includes only effective examining,
without pauses and breaks. When examination is paused, this timer is paused too.
Number of expositions
Shows how many stimulus points have been exposed to patient in a ratio to total number of field
points. For example: 208/104 means that test includes 104 points and its 208 expositions – each
point was tested twice on the average.
HOV level
Patient‟s HOV level is calculated on the basis of fixed sensitivity level in four calibration points
placed on 10 degree ring, after omitting two extreme values and calculating average figure from
the remaining two. This value is a HOV value calculated during calibration.
Eye profile slope
Contains information about how steep the eye profile is. For screening strategy it is set by default
to 3 [dB/10°]. In threshold strategy the slope is calculated upon test result data. Calculated
profile slope should be in bounds between 1[dB/10°] to 4.5 [dB/10°]. If it's out of bounds one of
the values listed above is chosen.
Correction lens
This field contains information about trial lens used during testing. PTS1000 perimeters offer a
possibility to perform examination using two correction lenses simultaneously (sphere and
cylinder).
Date the test was taken Strategy of examination
Duration of test
Calibrated HOV level
at 10 degree
Trial lens information
Quality indexes
Statistical indexes
Tested field
Number of expositions /
number of total field points
Eye profile slope Pupil diameter
Stimuli size Stimuli color

PTS1000 Instruction Manual
64
Quality factors
MD index for radial maps (mean defect)
This parameter specifies loss of eye sensitivity calculated as a mean difference between „ideal”
profile calculated by computer for a given patient on the basis of his examination results, and age
norm appropriate for this patient. This factor does not take into account losses in visual field
(scotoma).
This index can only be calculated for examinations taken by threshold and fast threshold
strategies. This index can change in range -1 to +1. Value -1 on average means that sensitivity is
twofold lower in the whole field than expected for age norm of a given patient (e.g. if age norm
for a patient is 24dB for 10o ring, his real sensitivity will be 12dB for 10
o ring).
Warning level is marked with one exclamation mark „!” next to a given value, and limit for
every field is presented in the table below. It refers to the location of Bebie curve on bottom line
of tolerance path.
Alarm level is marked with two exclamation marks „!!” next to a given value, and limit for every
field is presented in the table below. It refers to the location of Bebie curve below its tolerance
path.
Field/Limit Full Central Glaucoma Peripheral Macula Fast
Warning
level (!)
0,25 0,25 0,25 0,25 0,25 0,25
Alarm
level (!!)
0,35 0,35 0,35 0,35 0,35 0,35
For extended field, MD index is not given, because this field is examined only by means of
3-zone strategy.
MD index for 30 and 24 maps (mean defect)
In case of 30 and 24 maps the explanation of MD is much simpler. Basically it is the average
value of points from Total Deviation graph. Hence this index shows how far is the patient‟s
visual filed deviated from the normal values.
PD index for radial maps (pattern defect)
This parameter gives information about smoothness of patient's eye profile. Generally, it
specifies quantity and depth of local defects (scotoma) as compared to pattern sensitivity. Zero
value means, that the profile is smooth, without any local defects. The bigger the value, the
deeper local defects are.
Warning level is marked with one exclamation mark „!” next to a given value, and limit for
every field is presented in the table below. It refers to 2 deep defects (sensitivity 0dB for 10o
ring).
Alarm level is marked with two exclamation marks „!!” next to a given value, and limit for every
field is presented in the table below. It refers to 5 deep defects (sensitivity 0dB for 10o ring).
Field/Limit Full Central Glaucoma Peripheral Macula Fast
Warning
level (!)
0,26 0,42 0,40 0,58 0,83 0,72
Alarm
level (!!)
0,64 1,05 1,01 1,46 2,08 1,81
For extended field, PD index is not given, because this field is examined only by means of
3-zone strategy.

PTS1000 Instruction Manual
65
PD index for 30 and 24 maps (pattern defect)
This parameter gives information about smoothness of patient's eye profile. Generally, it
specifies quantity and depth of local defects (scotoma) as compared to pattern sensitivity. Zero
value means, that the profile is smooth, without any local defects. The bigger the value, the
deeper local defects are.
PD value is calculated as average difference between values from Total Deviation graph and
MD index value. This way in case of general depression without localized defects PD will be
around zero with high MD value. In case of lots of scotoma and no depression both PD and MD
indexes will be significant.
PTS1000 Instruction Manual
66
Statistical tests
FIX (H-K) – fixation errors
This index specifies number of fixation errors detected for Heijl-Krakau method (blind spot
location analysis). This factor is calculated only in the case, when examination was conducted
when the system of digital analysis of eyeball location was switched off.
The factor is presented as A/B=C%, where A stands for the number of fixation errors, B stands
for the number of fixation controls, and C stands for the percentage value of fixation errors in
relation to total fixation tests.
Warning level is marked with one exclamation mark „!” next to a value higher than 15%.
Alarm level is marked with two exclamation marks „!!” next to a value higher than 25%.
FIX (CCD) – fixation errors
This index has a similar meaning to FIX index, however it's much more reliable. This factor is
calculated only in the case, when examination was conducted when the system of digital analysis
of eyeball location was switched on.
Program uses digital image analysis to calculate this index. Proper fixation is controlled
continuously during the test.
It is shown as a ratio A/B, where A stands for the number of fixation errors, B stands for the
number of situations in which the system suspected patient‟s bad fixation.
Warning level is marked with one exclamation mark „!”, and its value refers to FIX (H-K) factor
of 15% value.
Alarm level is marked with two exclamation marks „!!”, and its value refers to FIX (H-K) factor
of 25% value.
POS – false positive errors
This index informs about number of false positive errors committed by patient during the test
(ratio). Details are described in Chapter 8.4.
The factor is presented as A/B=C%, where A stands for the number of false positive errors, B
stands for the number of trials, and C stands for the percentage value of errors in relation to total
number of trials.
Warning level is marked with one exclamation mark „!” next to a value higher than 15%.
Alarm level is marked with two exclamation marks „!!” next to a value higher than 25%.
NEG – false negative errors
This index informs about number of false negative errors committed by patient during the test
(ratio). Details are described in Chapter 8.4.
The factor is presented as A/B=C%, where A stands for the number of false negative errors, B
stands for the number of trials, and C stands for the percentage value of errors in relation to total
number of trials.
Warning level is marked with one exclamation mark „!” next to a value higher than 15%.
Alarm level is marked with two exclamation marks „!!” next to a value higher than 25%.

PTS1000 Instruction Manual
67
9.3.10. Bebie curve graph
A Bebie curve enables to easily and efficiently estimate patient‟s visual field quality.
Bebie curve is constructed by ordering the sensitivities of each tested point in descending order:
from highest sensitive point to lowest sensitive point. Because of the order, the curve has always
negative slope (always lowering).
radial maps, stimuli size 3, green
On the basis of statistical examinations performed by the manufacturer
of device on c.a. 50.000 examination results, there has been some margin
of tolerance applied. The area between the lines marked by B+ and B-
describes the area where 90% of healthy populations locate its Bebie
curves. The elevations, width, shape and inclination of the tolerance
margin depends on the examined field range and age of patient. Bebie
curve for a healthy visual field should be within the B+, B- lines (within
the tolerance margin). On the basis of Bebie curve shape (and additionally
PD and MD indexes) some very important information can be obtained.
Bebie curve is also helpful for estimating the reliability of examination results).
24, 30 maps, stimuli size 3, white
Normal Bebie curve shape is drawn on the basis of age norm defined for
normal patients of age groups: <20, 20-30, 30-40, 40-50, 50-60, >60.
Upper and lower margin is selected as +3dB and -3dB deviation from
norm. Scale on the left is adjusted to have zero dB value for the point in
the middle of normal Bebie curve.
Sample Bebie curve graphs and its meaning
The picture on the right shows a Bebie curve for a sample
examination result. It gives information about large and deep defects in
the visual field. Of course the Bebie curve gives no information about
the location of the defects. The larger part of Bebie curve is outside the
tolerance margin, the more extensive defects are. The part of Bebie
curve which is placed on horizontal axis reflects the points of absolute
defect (marked with X on visual field map). The part of the curve
within tolerance limits reflects the part of the field without defects. In
this sample case there will also be a high value of PD index.
The picture on the left shows a Bebie curve with characteristic
“peak” at the beginning of the curve. The rest of the curve is within the
norm. This “peak” tells the doctor, that there are no real defects in the
field, but the examination is not very reliable due to “trigger happy”
patient (patient pressed the button even if he didn't see the points).
Confirmation of the poor reliability will be
a high number of false positive errors made during examination.

PTS1000 Instruction Manual
68
Another picture on the right shows a Bebie curve of a visual field with
one or few small but quite deep defects. For this patient the MD index will
be quite normal (low) but PD index should confirm the existence of local
defects.
Another example on the left shows
a patient with very extensive shallow defect
covering almost whole visual field. This type of
defect is confirmed by the big value of MD
index, while the PD index should be normal (because of no local deep
defects).

PTS1000 Instruction Manual
69
Mean defect progress graph
Mean defect progress graph slope
Currently viewed result
Pattern defect progress graph
Pattern defect progress graph slope
Currently viewed result
9.3.11. Defects progress analysis
Defects progress analysis window shows two graphs: MD progress and PD progress. Those
graphs show MD and PD levels of all examinations for this eye ordered by examination dates from
oldest examination to newest examination.
Defects progress analysis also shows defects progress graph slope, the greater slope, the visual
field is worse.
On each graphs rectangles shows particular defects, interrupted line shows currently viewed
result.
Both graphs for a healthy visual field should have levels and slope near 0.

PTS1000 Instruction Manual
70
9.4. Patient’s examinations list
In the „Results review‟ window there is a list of all patients‟ examinations. Selecting of a different
examination can be done by clicking it on the list or by using arrows next to the list.
9.4.1. Filtering of an examinations list
In order to make searching of patient‟s examinations easier, program is equipped with filter. It can
be used to limit displayed examinations to that which satisfy filtering conditions: used field, used
strategy, examined eye and date period when the examination had been done.
To activate filter, it is necessary to select one of the filter conditions from the list. Adequate
condition switch will be automatically turned on. Clicking on the condition switch again will
deactivate it. Different conditions can be selected simultaneously to limit number of displayed
results.
9.4.2. Data Export/Import
PTS 1000 series Automated Perimeters have a mechanism for transferring single examination
results between different users/computers. Exported data can be saved in GDT format and then it
can be import to another computer. Exported data also can be saved as JPG image. Exported data
can be saved to hard disk (or other data storage) or sent by e-mail.
Cursors used to move along
examinations list.
List of conditions in filters
Filtering conditions
switches
Deleting an examination
Active
examination
Importing an
examination to list
Exporting an
examination to file
Printing an
examination result

PTS1000 Instruction Manual
71
Import
To import saved examination result click “Import” button, and next select source folder and
select GDT file in “Open” window.
Perimeter program will check validity of imported GDT file and insert it into database. If
imported result comes from older software version, message will appear.
Export To export current examination result click “Export” button, Export window will appear.
Mark type of exported file in “File mode” panel. Mark export operation in “Export mode” panel.
Click “Ok” button. If “Save file” mode is selected Save as window will appear, select destination
folder and enter file name (by default, the system will prompt „My Documents‟ folder and file name
as name_surname.gdt). Click “Ok” button to save file. If “Send by e-mail” mode is selected,
program will open New message window of default mail client installed on operating system with
exported file attached.
Sending exported file by e-mail is available only if e-mail client is installed and
mail account is configured.
Only GDT files can be imported.
Imported result derived from older software version can cause result review
errors.
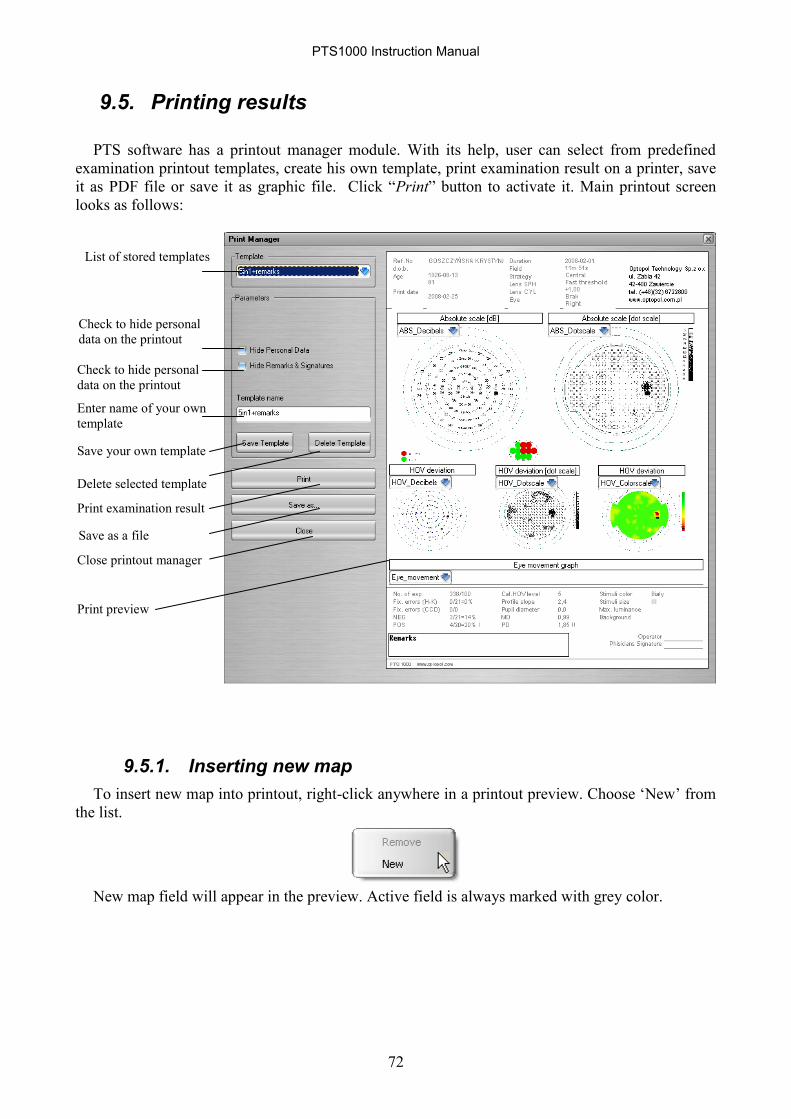
PTS1000 Instruction Manual
72
9.5. Printing results
PTS software has a printout manager module. With its help, user can select from predefined
examination printout templates, create his own template, print examination result on a printer, save
it as PDF file or save it as graphic file. Click “Print” button to activate it. Main printout screen
looks as follows:
9.5.1. Inserting new map
To insert new map into printout, right-click anywhere in a printout preview. Choose „New‟ from
the list.
New map field will appear in the preview. Active field is always marked with grey color.
List of stored templates
Check to hide personal
data on the printout
Check to hide personal
data on the printout
Enter name of your own
template
Save your own template
Delete selected template
Print examination result
Save as a file
Close printout manager
Print preview
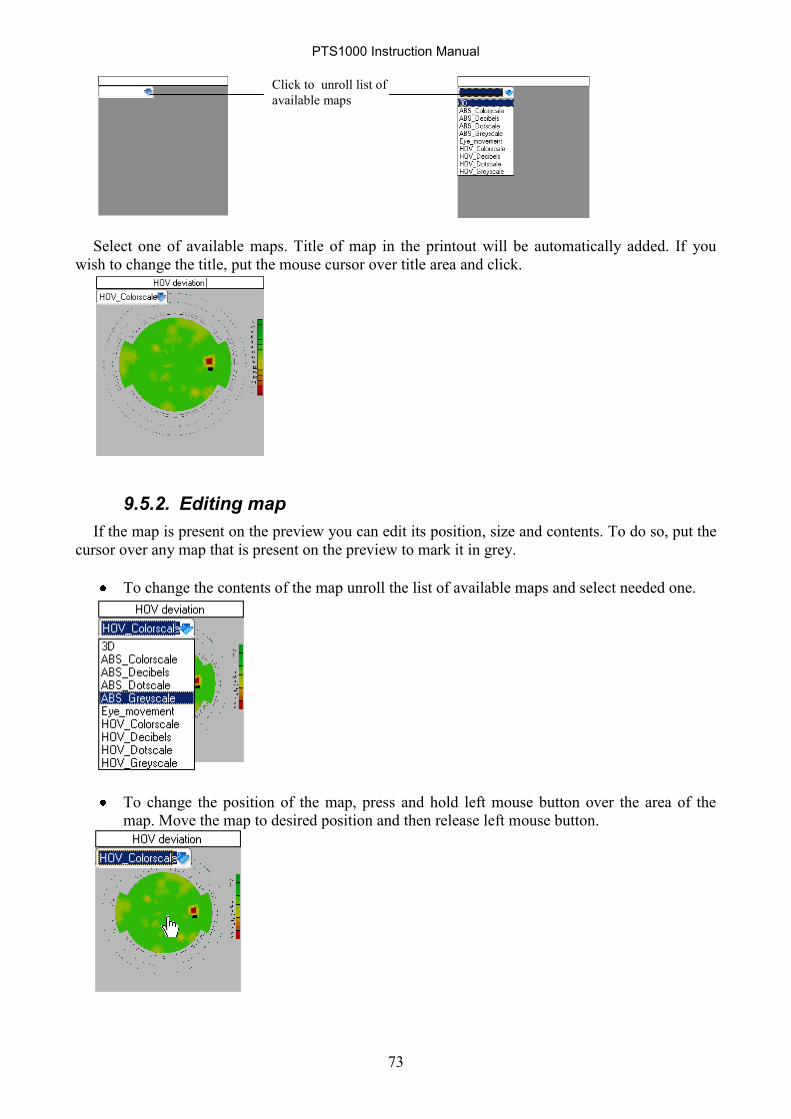
PTS1000 Instruction Manual
73
Select one of available maps. Title of map in the printout will be automatically added. If you
wish to change the title, put the mouse cursor over title area and click.
9.5.2. Editing map
If the map is present on the preview you can edit its position, size and contents. To do so, put the
cursor over any map that is present on the preview to mark it in grey.
To change the contents of the map unroll the list of available maps and select needed one.
To change the position of the map, press and hold left mouse button over the area of the
map. Move the map to desired position and then release left mouse button.
Click to unroll list of
available maps

PTS1000 Instruction Manual
74
To change dimensions of the map, place mouse cursor in the bottom-right corner of the map.
When cursor changes icon press and hold left mouse button. Moving the mouse on the
images diagonal while holding left mouse button will cause resizing of the map. Release left
mouse button if you finished resizing.
9.5.3. Deleting map from printout
To delete any mp from the printout, move mouse cursor over the area of the map which you want
to delete. Right-click to open pop-up menu. Select „remove‟ to delete map.
9.5.4. Changing printout options
In printout manager there are two additional options:
- Hide patient‟s personal data –this option removes patient‟s name and date of birth
from the printout
- Hide field for remarks and signatures – this option removes additional field for
remarks and signatures from the bottom of the printout.

PTS1000 Instruction Manual
75
Click to select
printer
Click to adjust printer
parameters
Mark this box to print
to file instead of printer
Click here to adjust
number of copies
Click here to cancel
printing
Click here to start
printing
9.5.5. Printing and saving results in printout manager
After clicking „Print‟ a window will appear, enabling to set the desired printer parameters:
After clicking „Save as‟ a window will appear, enabling to select file name and file type for
examination results:
Important !!!
It is recommended not to print earlier results while next examination is being performed. Printing
absorbs significant amount of computer resources, and together with examination may slow down
the whole system.
This window can have different shape and different controls – it depends on
type of printer you have installed.
Browse to desired
location
Enter filename
Select file format
Save printout
Cancel

PTS1000 Instruction Manual
76
9.5.6. Results compare printout
In order to print Compare result profile, click “Print” button in Results Compare window. A
Standard Print dialogue window will be opened (look point 9.4) and printout will be created.
Printout contains compared profile in decibels and dot scale, and two compared results with details.
Click to print
compare printout
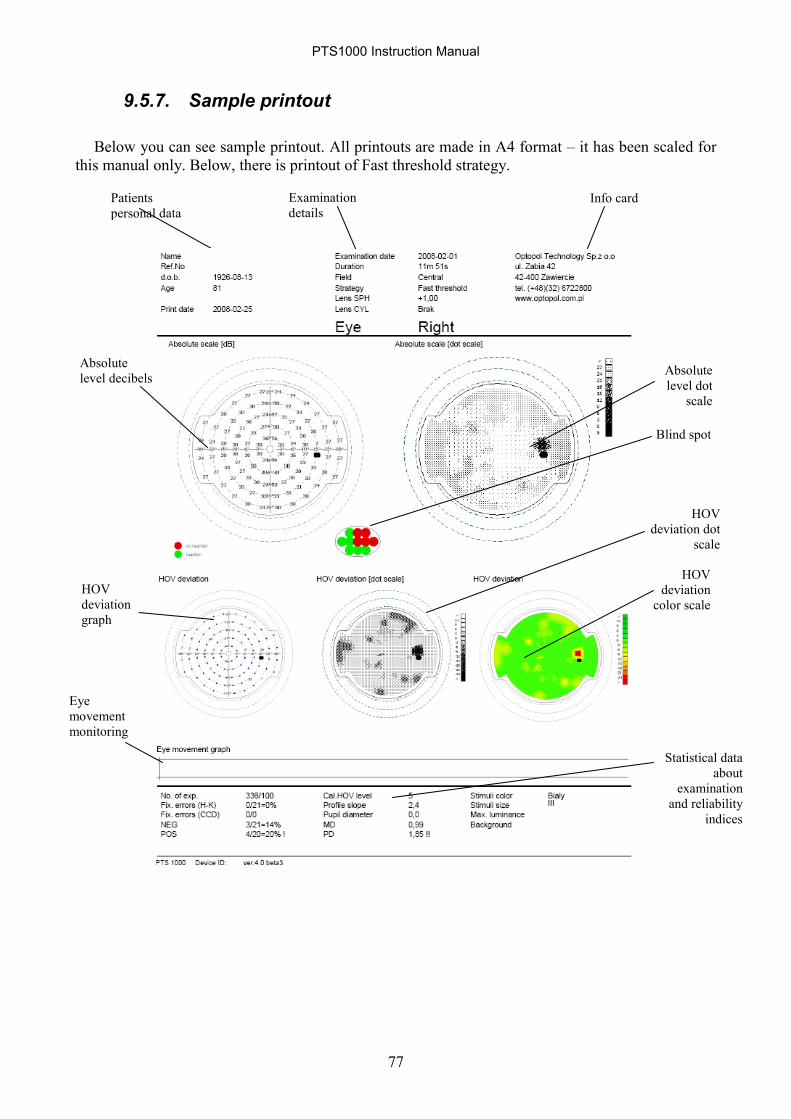
PTS1000 Instruction Manual
77
9.5.7. Sample printout
Below you can see sample printout. All printouts are made in A4 format – it has been scaled for
this manual only. Below, there is printout of Fast threshold strategy.
Patients
personal data
Examination
details Info card
Absolute
level dot
scale
Blind spot
HOV
deviation
color scale
Statistical data
about
examination
and reliability
indices
Absolute
level decibels
HOV
deviation
graph
Eye
movement
monitoring
HOV
deviation dot
scale
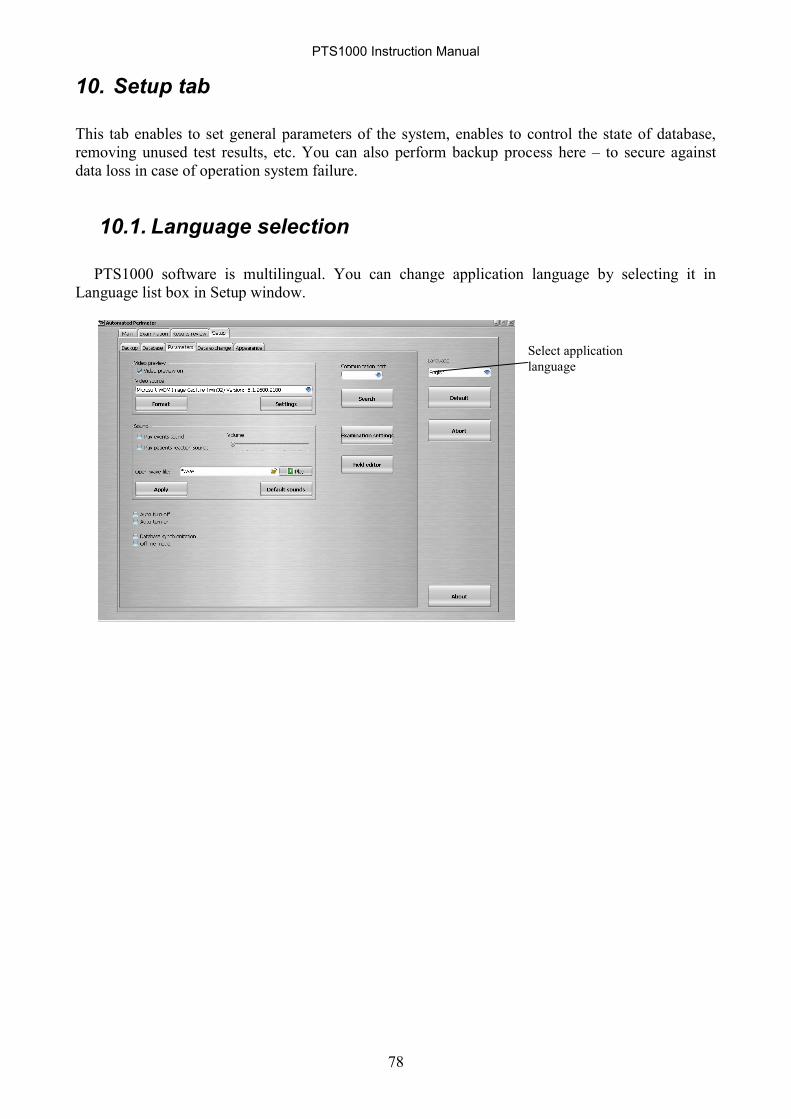
PTS1000 Instruction Manual
78
10. Setup tab
This tab enables to set general parameters of the system, enables to control the state of database,
removing unused test results, etc. You can also perform backup process here – to secure against
data loss in case of operation system failure.
10.1. Language selection
PTS1000 software is multilingual. You can change application language by selecting it in
Language list box in Setup window.
Select application
language
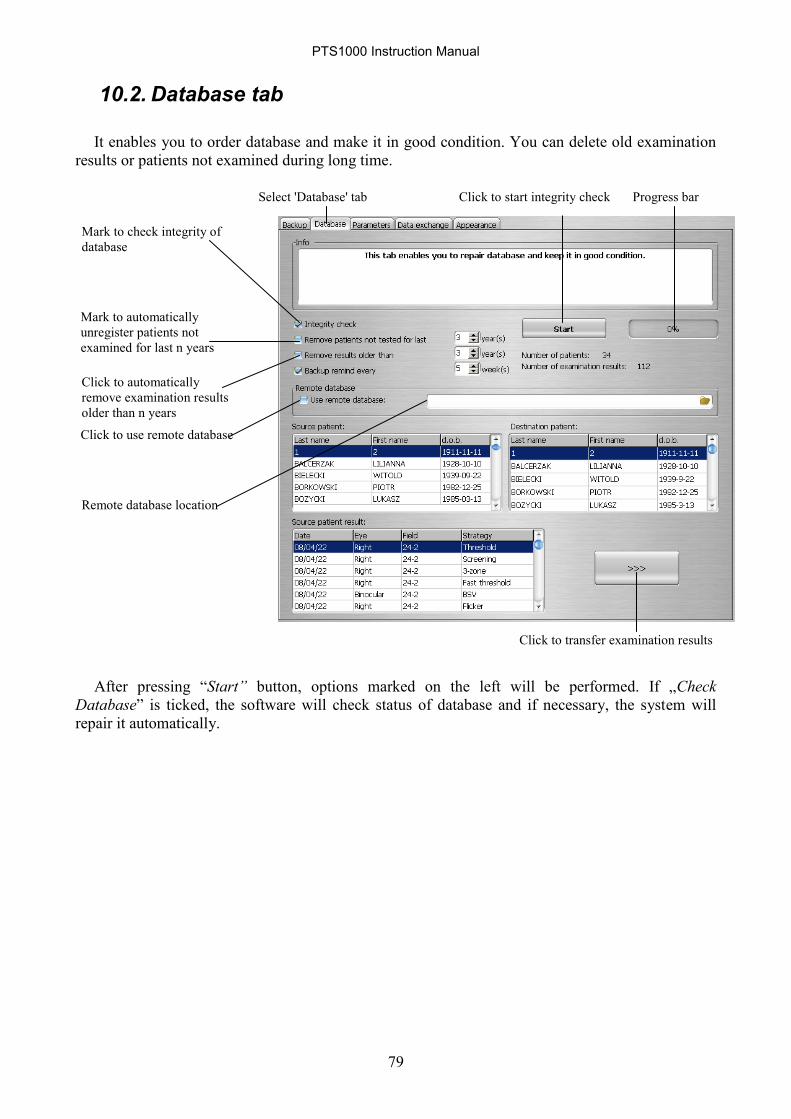
PTS1000 Instruction Manual
79
10.2. Database tab
It enables you to order database and make it in good condition. You can delete old examination
results or patients not examined during long time.
After pressing “Start” button, options marked on the left will be performed. If „Check
Database” is ticked, the software will check status of database and if necessary, the system will
repair it automatically.
Mark to check integrity of
database
Mark to automatically
unregister patients not
examined for last n years
Click to automatically
remove examination results
older than n years
Progress bar Select 'Database' tab
Click to use remote database
Remote database location
Click to transfer examination results
Click to start integrity check

PTS1000 Instruction Manual
80
10.2.1. Examination results transfer
Sometimes there is a need to transfer single examination results between different patients in
database. Such situation can happen if the doctor performed examination and then found out that he
selected improper patient in the database.
Perimeter program enables to transfer examination results between patients in current database.
To transfer result click “Results transfer” button from “Setup” window. “Results transfer” window
will appear as shown below.
The window is divided into three parts. Two panels on the left side specify the source patient and
source examination results. Panel on the right specifies the destination patient. In order to transfer
examination result, do the following:
select patient in the left panel from which the examination should be transferred (source patient)
select examination result which will be transferred in left panel (source examination)
select patient in the right panel to which the examination will be transferred (destination patient)
click “>>>” button to move examination.
Select destination patients Select source patient
Select source patients result Click to transfer result
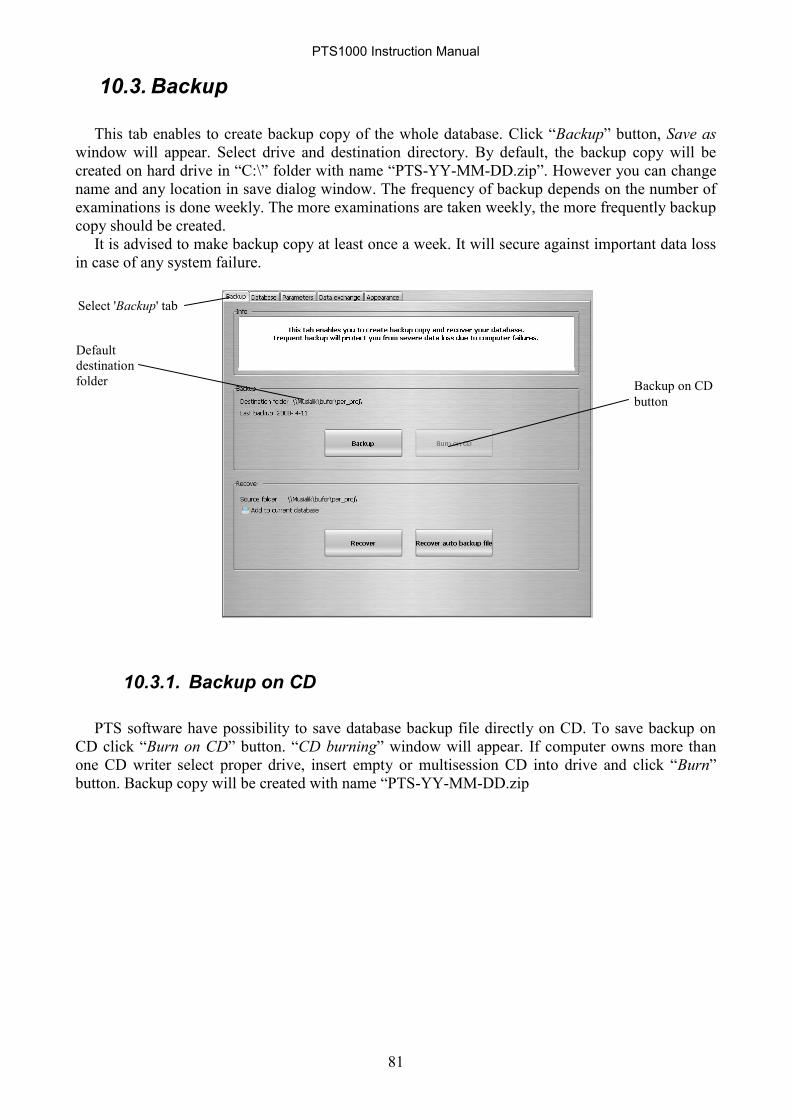
PTS1000 Instruction Manual
81
10.3. Backup
This tab enables to create backup copy of the whole database. Click “Backup” button, Save as
window will appear. Select drive and destination directory. By default, the backup copy will be
created on hard drive in “C:\” folder with name “PTS-YY-MM-DD.zip”. However you can change
name and any location in save dialog window. The frequency of backup depends on the number of
examinations is done weekly. The more examinations are taken weekly, the more frequently backup
copy should be created.
It is advised to make backup copy at least once a week. It will secure against important data loss
in case of any system failure.
10.3.1. Backup on CD
PTS software have possibility to save database backup file directly on CD. To save backup on
CD click “Burn on CD” button. “CD burning” window will appear. If computer owns more than
one CD writer select proper drive, insert empty or multisession CD into drive and click “Burn”
button. Backup copy will be created with name “PTS-YY-MM-DD.zip
Select 'Backup' tab
Default
destination
folder Backup on CD
button

PTS1000 Instruction Manual
82
10.3.2. Recovering data from backup copy
This tab enables user to recover all lost data from backup copy created on floppy disks or other
data carriers (hard disks, CD-ROMs etc.), it also enables to insert database from backup copy into
existing database.
10.3.2.1. Recovering whole database
In order to recover data from backup copy click “Recover” button. Make sure the option “Add to
current database” is not marked. Open window will appear, select source backup copy file to
recover. The program will display warning message: “Current database will be replaced with
database read from backup diskette”.
The program will replace all database files with the files from backup copy. In this way any
possible damages to database can be fixed.
Before performing recovery process one has to make sure the backup
copy was created using the same software version which is used when
recovering.
Use this option only in severe cases – when you lost all your data
from database. Contact your local distributor before performing
recover operation.
Select proper drive
Click „Burn‟ button
Saving backup file on CD is possibile only in computers applied with
CD writer
Click to recover database
from backup copy
Leave this option
unmarked

PTS1000 Instruction Manual
83
10.3.2.2. Inserting backup copy database into existing database
PTS1000 offers possibility to add backup copy of database into existing database. This option is
used to join two databases into one part.
To add Database from backup copy to current database mark “Add to current database” option
and click “Recover” button. Open window will appear, select source backup copy file to add. The
program will display confirmation message and if you click “Yes” button database will be added to
current database.
In this mode, the recovered database can have any format (it can be created by earlier versions of
software) – it will always be converted to the current format.
This mode doesn't replace database files. Any existing damages to
database will not be fixed
If recovered database derive from older software version, message will
appear, and program will rebuild database.
Click 'Yes' to
recover database
Click 'No' to
cancel
Mark this option
Click to recover database
from backup copy
Click 'Yes' to
recover database
Click 'No' to
cancel

PTS1000 Instruction Manual
84
10.3.2.3. Recovering database from auto backup file
PTS1000 software has “Auto backup” mechanism. Every day after closing PTS software,
database backup copy is created. Software archives 10 last auto backup copies which may be
recovered.
To recover auto backup file click “Recover auto backup file” button and confirm warning
message.
“Open auto backup file” dialog window will appear. Select which auto backup file you want to
recover and click “Open” button.
Click to open dialog
window
Click 'Yes' to add
database Click 'No' to cancel
operation
Click ‘Open’ to
recover selected
autobackup file
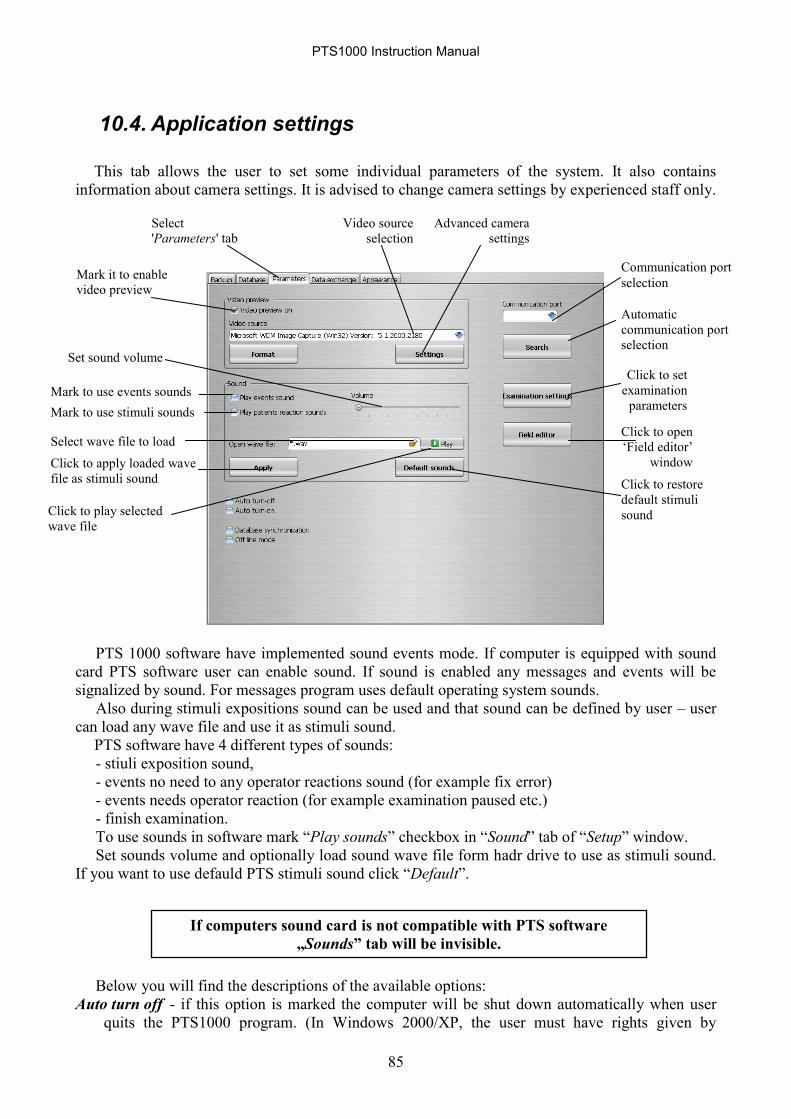
PTS1000 Instruction Manual
85
10.4. Application settings
This tab allows the user to set some individual parameters of the system. It also contains
information about camera settings. It is advised to change camera settings by experienced staff only.
PTS 1000 software have implemented sound events mode. If computer is equipped with sound
card PTS software user can enable sound. If sound is enabled any messages and events will be
signalized by sound. For messages program uses default operating system sounds.
Also during stimuli expositions sound can be used and that sound can be defined by user – user
can load any wave file and use it as stimuli sound.
PTS software have 4 different types of sounds:
- stiuli exposition sound,
- events no need to any operator reactions sound (for example fix error)
- events needs operator reaction (for example examination paused etc.)
- finish examination.
To use sounds in software mark “Play sounds” checkbox in “Sound” tab of “Setup” window.
Set sounds volume and optionally load sound wave file form hadr drive to use as stimuli sound.
If you want to use defauld PTS stimuli sound click “Default”.
Below you will find the descriptions of the available options:
Auto turn off - if this option is marked the computer will be shut down automatically when user
quits the PTS1000 program. (In Windows 2000/XP, the user must have rights given by
Communication port
selection Mark it to enable
video preview
Video source
selection
Advanced camera
settings
Click to set
examination
parameters
Select
'Parameters' tab
Automatic
communication port
selection
Click to open
„Field editor‟
window
Set sound volume
Mark to use events sounds
Select wave file to load
Mark to use stimuli sounds
Click to apply loaded wave
file as stimuli sound Click to restore
default stimuli
sound Click to play selected
wave file
If computers sound card is not compatible with PTS software
„Sounds” tab will be invisible.

PTS1000 Instruction Manual
86
Administrator to shut down the system).
Auto turn on - if this option is marked the PTS1000 software will be automatically started when
Windows is loaded.
Database synchronization - this option is valid only if there are two or more Optopol devices
installed on one computer. If this option is marked, the system will share the same patient
database.
Off line mode - if this option is marked, perimeter program is in off line mode, and it cannot do
examinations. This option is useful when program works with remote database.
10.4.1. Field editor
PTS software enables user to define own field to be examined. Thanks to implemented “Field
editor” user can define any field in range of 50 degrees in each direction, separately for each eye or
symmetric for both eyes. To define user field can use patterns matched implemented fields.
There is possibility to save defined field to a file and open defined field from file. Thanks to that
user can make collection of defined fields or send it to another user.
To define user field click “Field editor” button in “Setup” window. “Field editor” window will
appear as shown below.
Click to change defined eye
Mark to use symmetric
field
Click to select field pattern
Click to load defined field
from file
Click to save defined field
to file
Click to close field editor –
defined field will be applied
Click to close field editor
without defined field apply
Click to mark/unmark point
to be tested in user field

PTS1000 Instruction Manual
87
10.4.2. Appearance adjustment
PTS1000 enables to individually set the color style used to display graph results. The colors can
be adjusted to suit individual taste of users. If “Angular ruler” is marked, there will be a ruler
displayed in each decibels graph on screen. You can select which analysis and what style of the map
will appear in results review as standard. This setup will be recalled after pressing STD button in
results review. Also info card and logo can be selected here.
3D disable - if this option is marked, 3D view in result review window is disabled. This option is
used to avoid software malfunctions with computers equipped with non compatible graphics card
(not supported OpenGL).
Click if you want back to
default colors set
Click to select item color
Mark this to display ruler
on graph
Click to unroll list of
available skins
Click here to select Logo
which appears on a
printout
Card editor. Enables to
design own card printed
on each printout
Select analysis method in
standard setup for each of
multiwindows
Select map style in standard
setup for each of
multiwindows

PTS1000 Instruction Manual
88
11. Multiuser access in computer network environment
Starting from Automated perimeter PTS software version 3.3, databases can be accessed by many
users simultaneously by multiple users on using different computer. Thanks to network option, it is
a lot easier to perform examinations and make the diagnosis. The doctor can be in his office and
analyze examination result on his own computer; he doesn‟t have to go to another room where
examinations are done.
PTS1000 software is based on Client-Server model. It means that one of the computers in the
network is configured as Server (database files are stored on this computer), the rest of the
computers are Clients (they access the database located at Server).
To configure perimeter program for multi-user environment you have to:
a) install the same PTS software on all computers (both Clients and Server).
b) choose one of the computers as Server (in case of small local networks it is usually the computer
with direct connection to PTS, otherwise if its big network, server computer should be clearly
distinguished).
Important !!!
To let any of Client computers work with perimeter program, Server computer must be
turned on.
Following chapters describe program configuration on Server computer and on all of the Client
computers.
11.1. Program configuration as database server
a) The folder where PTS1000 application is located should be shared on the network for all Client
computers with full access rights (read+write+change). Default location: C:\Program
Files\PTS1000)
b) Run perimeter program, and go to Setup-->Database. Make sure that “Use remote database”
checkbox is unmarked. In this case content of field on the right (specifying the location of
remote database) is ignored.
c) If PTS1000 device is not connected directly to Server computer, one should mark “Off line
mode” in Setup-->Parameters. If PTS1000 device is connected to Server computer, “Off line
mode” should not be marked.

PTS1000 Instruction Manual
89
11.2. Program configuration as database client
Following procedure should be conducted on all Client computers.
a) Run perimeter program, and go to Setup-->Database. Make sure that “Use remote database”
checkbox is marked.
b) In field at right specify network location of PTS1000 database on Server computer (for example
if Server computer has name SERWER, and database folder with access named PTS1000, one
should type location: \\SERWER\PTS1000)
Warning !!!
We suggest to use UNC format when specifying location of database (e.g.
\\COMPUTER\\folder). Optionally network disk mapping can be used.
PTS1000 Instruction Manual
90
c) If PTS1000 device is not connected directly to Client computer should mark “Off line mode” in
Setup-->Parameters tab. If PTS1000 device is connected to Client computer, “Off line mode”
should not be set.
11.3. Program limitations on Client computer
Perimeter program configured as Client computer (using remote database) have some functional
limits, which do not apply to Server computer. On Client computer the following options are
blocked:
Patients removing,
Results deleting,
Database backup,
Database recovering,
Database ordering,
Results transferring.
Additionally, on all computers with turned on “Off line mode” Examination window is blocked
(it isn‟t possible to make examination).
11.4. Sharing PTS data base on Windows VISTA computer in Local Network
Sharing of the PTS data base on Windows Vista computer is similar to Windows XP but
requires some additional configuration. Following points show how to configure PTS database
sharing.
1. Go to Control Panel and „Network And Sharing Center‟
2. First of all turn the „Network discovery‟ on then apply changes.

PTS1000 Instruction Manual
91
3. Windows will show two possible choices. You can select whichever you want. If you use only
private network choose first option.
4. Next turn on „File sharing‟ and apply changes.

PTS1000 Instruction Manual
92
5. Turn off „Password protected sharing‟ and apply changes.
6. Now change type of the network to private. Press „Customize‟ next to unidentified network
7. You can name this network or leave it unidentified. Select „Private‟ and click „Next‟.
8. Now you need to share the PTS1000 folder on the network. Select Computer from Start menu
and explore to your PT1000 folder (by default C:\Program Files\PTS1000). Right click on it and
select „Share...‟
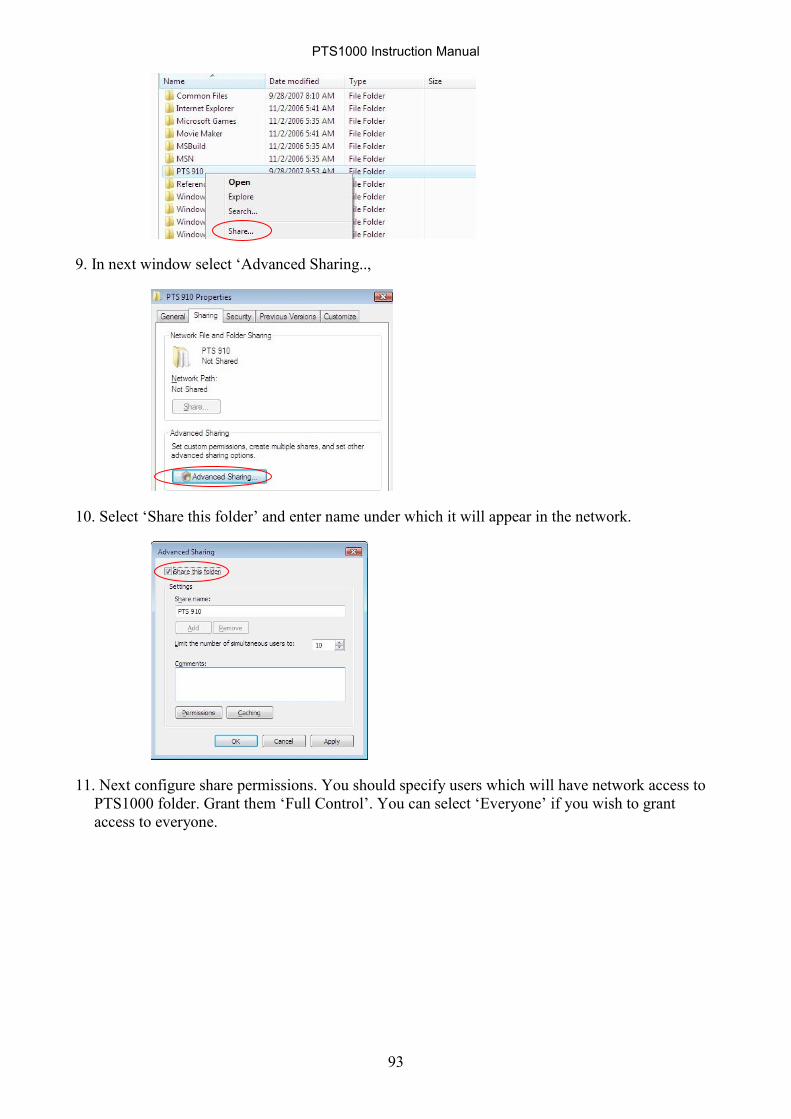
PTS1000 Instruction Manual
93
9. In next window select „Advanced Sharing..,
10. Select „Share this folder‟ and enter name under which it will appear in the network.
11. Next configure share permissions. You should specify users which will have network access to
PTS1000 folder. Grant them „Full Control‟. You can select „Everyone‟ if you wish to grant
access to everyone.

PTS1000 Instruction Manual
94
12. Click „OK‟. Now you can share PTS1000 data base from different computers in the network.
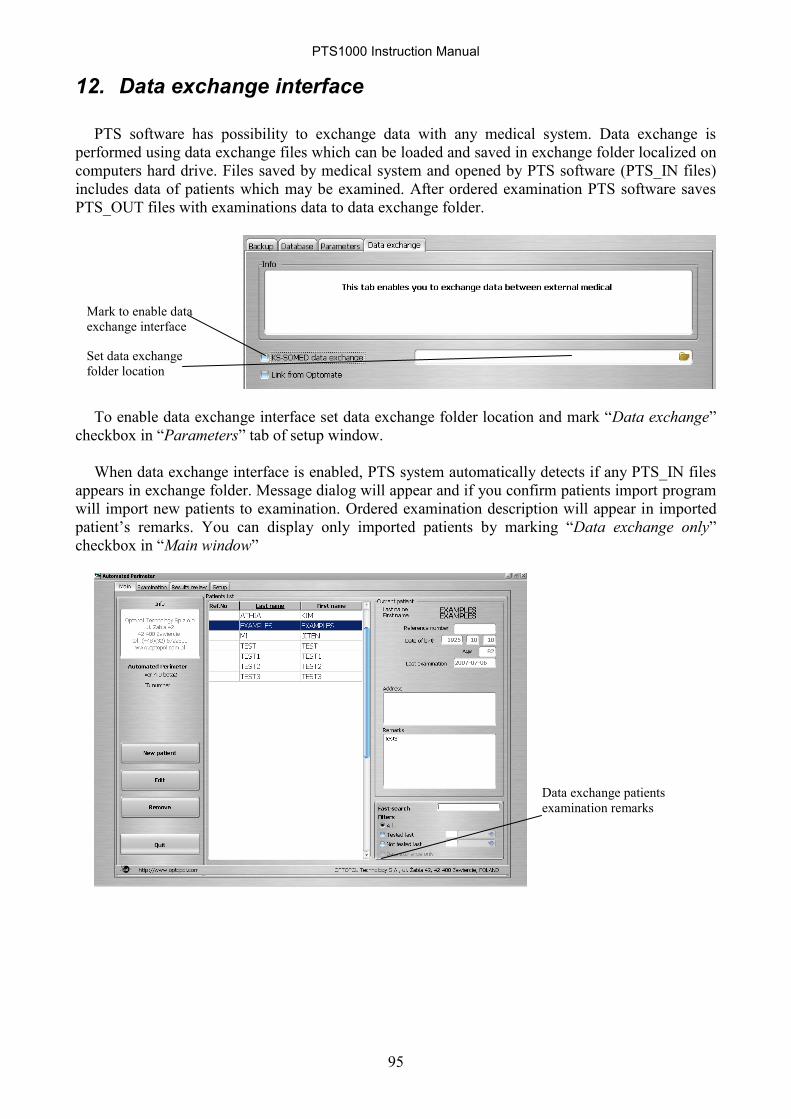
PTS1000 Instruction Manual
95
12. Data exchange interface
PTS software has possibility to exchange data with any medical system. Data exchange is
performed using data exchange files which can be loaded and saved in exchange folder localized on
computers hard drive. Files saved by medical system and opened by PTS software (PTS_IN files)
includes data of patients which may be examined. After ordered examination PTS software saves
PTS_OUT files with examinations data to data exchange folder.
To enable data exchange interface set data exchange folder location and mark “Data exchange”
checkbox in “Parameters” tab of setup window.
When data exchange interface is enabled, PTS system automatically detects if any PTS_IN files
appears in exchange folder. Message dialog will appear and if you confirm patients import program
will import new patients to examination. Ordered examination description will appear in imported
patient‟s remarks. You can display only imported patients by marking “Data exchange only”
checkbox in “Main window”
Data exchange patients
examination remarks
Mark to enable data
exchange interface
Set data exchange
folder location
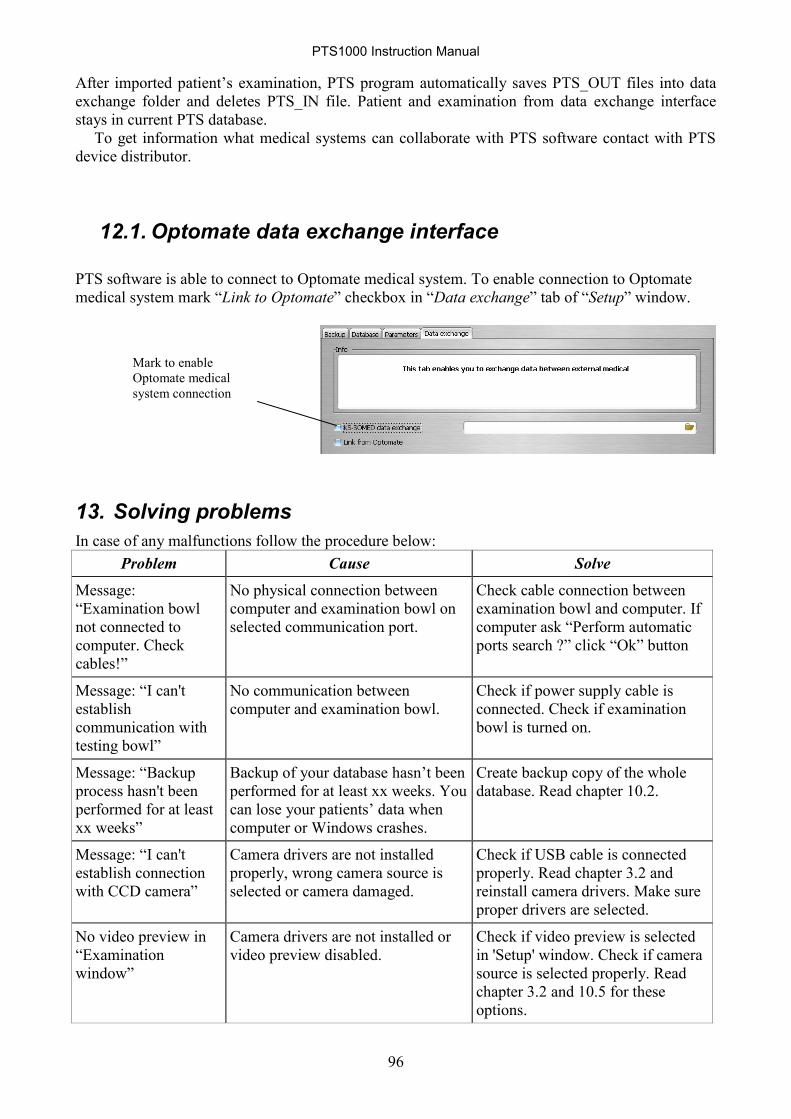
PTS1000 Instruction Manual
96
After imported patient‟s examination, PTS program automatically saves PTS_OUT files into data
exchange folder and deletes PTS_IN file. Patient and examination from data exchange interface
stays in current PTS database.
To get information what medical systems can collaborate with PTS software contact with PTS
device distributor.
12.1. Optomate data exchange interface
PTS software is able to connect to Optomate medical system. To enable connection to Optomate
medical system mark “Link to Optomate” checkbox in “Data exchange” tab of “Setup” window.
13. Solving problems
In case of any malfunctions follow the procedure below:
Problem Cause Solve
Message:
“Examination bowl
not connected to
computer. Check
cables!”
No physical connection between
computer and examination bowl on
selected communication port.
Check cable connection between
examination bowl and computer. If
computer ask “Perform automatic
ports search ?” click “Ok” button
Message: “I can't
establish
communication with
testing bowl”
No communication between
computer and examination bowl.
Check if power supply cable is
connected. Check if examination
bowl is turned on.
Message: “Backup
process hasn't been
performed for at least
xx weeks”
Backup of your database hasn‟t been
performed for at least xx weeks. You
can lose your patients‟ data when
computer or Windows crashes.
Create backup copy of the whole
database. Read chapter 10.2.
Message: “I can't
establish connection
with CCD camera”
Camera drivers are not installed
properly, wrong camera source is
selected or camera damaged.
Check if USB cable is connected
properly. Read chapter 3.2 and
reinstall camera drivers. Make sure
proper drivers are selected.
No video preview in
“Examination
window”
Camera drivers are not installed or
video preview disabled.
Check if video preview is selected
in 'Setup' window. Check if camera
source is selected properly. Read
chapter 3.2 and 10.5 for these
options.
Mark to enable
Optomate medical
system connection

PTS1000 Instruction Manual
97
Problem Cause Solve
Message: “Not
supported DIB
format”
Wrong camera configuration. Read chapter 3.1to configure
camera.
After turning on
examination bowl is
not illuminated, there
is no central fixation
point
Examination bowl has no power. Make sure the bowl is connected to
power supply socket with proper
parameters (230V, 50Hz or 60 Hz)
and turned on. If green light on the
power button is not lighting then
turn off power and check fuses.
Message: “Critical
database damage”
Database files got damaged or
backup has been done from older
version of program.
Close program and reboot system.
If problem appears again use
backup diskette to recover database
or reinstall PTS1000 software. Look
Charter 10.2 for database repair.
Message: “I can't open
communications port”
Selected COM port is used by
another application.
Select different COM port or quit
the application that uses the COM
port.
No 3D visualization in
results review on
Windows VISTA
No actual drivers for graphic card Download and install latest drivers
for you graphic card
Consumable spare parts:
fuses type: WTA-F, AC.250V, F3A, 5x20mm - 2 pcs.
(Other fuses can be used, but they must have the same electrical parameters and F,M
characteristics, or T characteristics according to IEC standard)
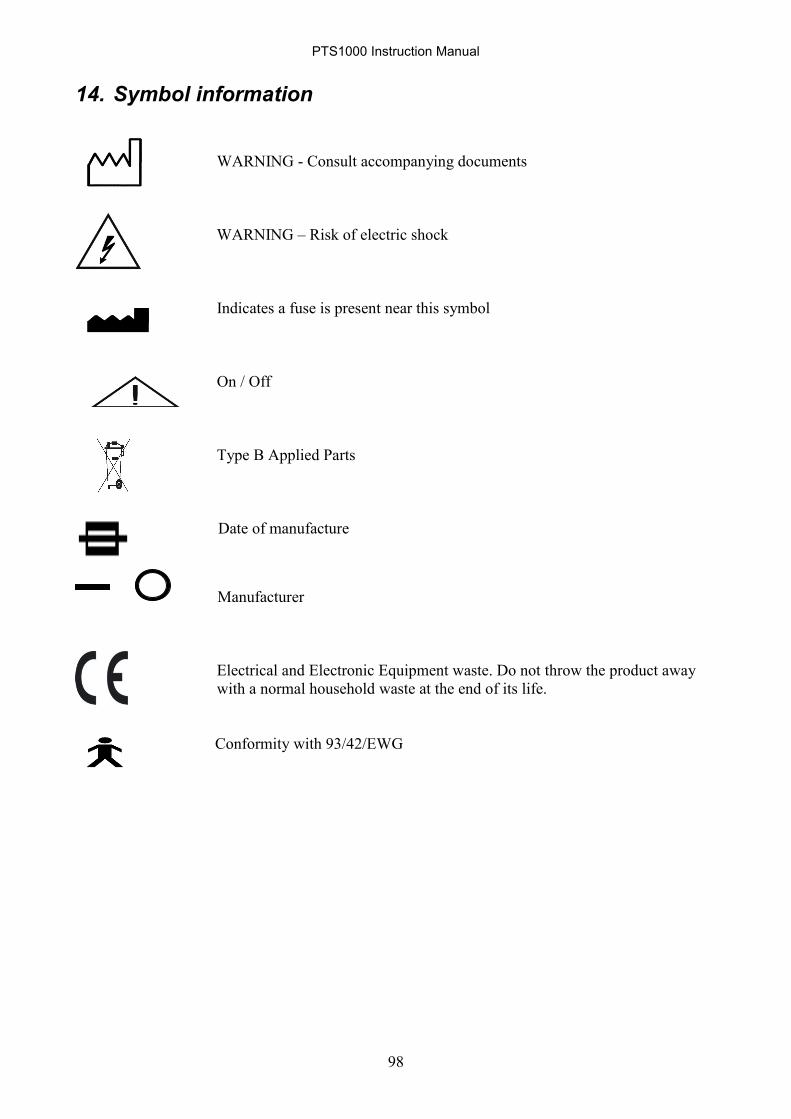
PTS1000 Instruction Manual
98
14. Symbol information
WARNING - Consult accompanying documents
WARNING – Risk of electric shock
Indicates a fuse is present near this symbol
On / Off
Type B Applied Parts
Date of manufacture
Manufacturer
Electrical and Electronic Equipment waste. Do not throw the product away
with a normal household waste at the end of its life.
Conformity with 93/42/EWG

PTS1000 Instruction Manual
99
15. Storing conditions
Temperature: 10 – 40 °C
Relative humidity: 60 – 80 %
Atmospheric pressure: 860 – 1060 hPa
16. Service
In case of problems contact your local distributor.
17. Utilization
It is recommended to contact with local distributor after device usage duration period is over – to
agree upon the way of utilization (plastic, epoxide resin, polyurethane foam, metal, etc.)
Windows is a registered trademark of Microsoft Corporation. Pentium is a registered trademark of the Intel Corporation. All other trademarks are
properties of their respective companies.
Edition date: February 2008;
Verification date: June 2008;