Embed Size (px)
Citation preview

The Black Jobs Crisisduring
the Age of Inequality
Steven Pitts,Associate Chair, UC Berkeley Labor Center
Co-Founder, National Black Worker Center ProjectApril 28, 2015

“The problem is not only unemployment, it is under or sub-employment…people who work full-time jobs for part-time wages.”
--- Martin Luther King, Jr (March 10, 1968)

Focus for today’s conversation…
• Some data on the Black job crisis• Some data on the Age of Inequality• Looking at the old approach• Some thoughts on a new approach• Some thoughts on organizing going forward

The Black Job Crisis…
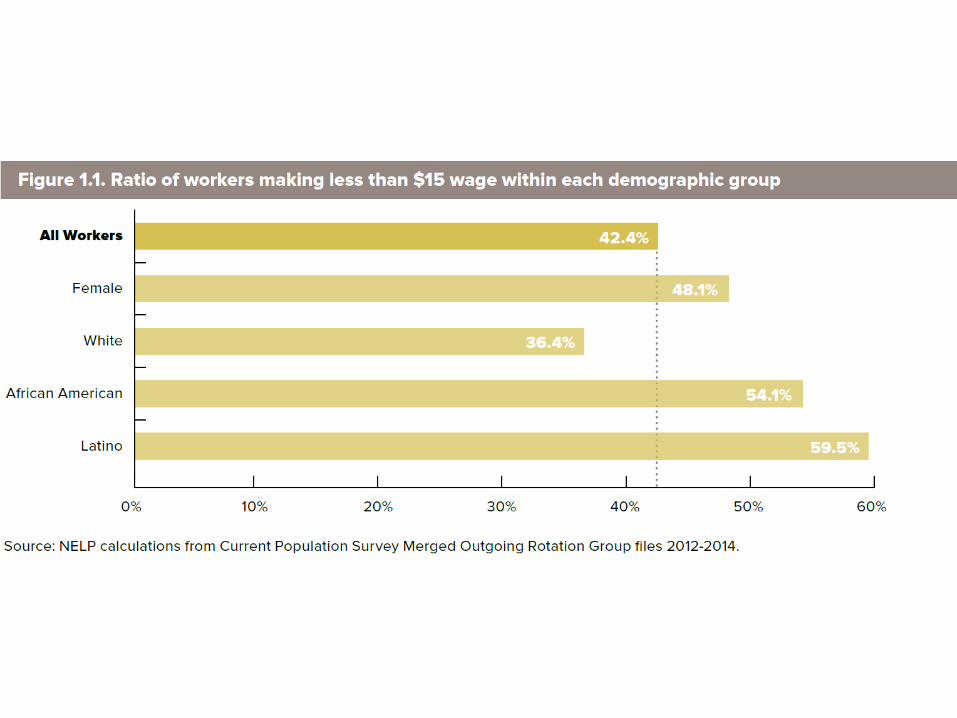
• High levels of unemployment and low-wage work
• Persistent racial disparities relative to non-Hispanic whites

19631965
19671969
19711973
19751977
19791981
19831985
19871989
19911993
19951997
19992001
20032005
20072009
20110.0%
2.0%
4.0%
6.0%
8.0%
10.0%
12.0%
14.0%
16.0%
18.0%
20.0%
Black & White Unemployment Rates: 1963 - 2012
WhiteBlack

ALL MEN WOMEN0.0%
5.0%
10.0%
15.0%
20.0%
25.0%
30.0%
35.0%
40.0%
45.0%
38.1%
35.5%
40.2%
25.9%
21.4%
30.9%
Prevalence of Black & White Low-wage Work by Gender: 2010-2012
BlackWhite

The LA Story

Industrial Distribution of Employment by Race
Black White Latino
Industry % of Total Industry % of Total Industry % of Total
Public sector 28.0% Public sector 16.1% Public sector 11.5%
Retail Trade 6.8% Professional 10.4% Retail Trade 8.9%
Finance 6.8% Finance 8.4% Durable Goods 8.8%
Transportation & warehousing 6.4% Durable Goods 8.1% Restaurants 7.8%
Hospitals 5.8% Retail Trade 8.0% Nondurable Goods 7.6%

All Men Women
-5.0%
0.0%
5.0%
10.0%
15.0%
20.0%
25.0%
30.0%28.5%
27.7%
29.3%
18.4%
16.2%
21.0%
BlackWhite
Prevalence of Black & White Low-wage Work by Gender: 2010-2012

Prevalence of Black Low-wage by Age
16 -19 20 - 24 25 - 35 35 +0.0%
10.0%
20.0%
30.0%
40.0%
50.0%
60.0%
70.0%
80.0%
74.9%72.4%
34.1%
20.4%

Industries with the highest proportion of Blacks working for low-wages (% of Blacks in that industry)
Restaurants
Grocery stores
Retail trade
Arts
Accommodation
57.5%
57.1%
50.0%
48.7%
46.5%

Industries with the highest number of Blacks working for low-wages (% of all low-wage Black workers in LA)
Public Sector
Retail Trade
Administrative Services
Transportation and Warehousing
Social Assistance
17.4%
12.3%
8.5%
6.6%
5.3%

The Age of Inequality: mid-1970s - Present
• The divergence between labor productivity and worker compensation
• The rising share of total national income received by the richest 1%

Productivity and Hourly Compensation

19131916
19191922
19251928
19311934
19371940
19431946
19491952
19551958
19611964
19671970
19731976
19791982
19851988
19911994
19972000
20032006
20092012
0
2
4
6
8
10
12
14
16
18
20 Share of Total Income Going to the Top 1% Households

What to Do?

Traditional Approaches
• Focus– Deficit model– “limited” structural barrier model
• Solution – Fix people– Remove structural barriers (fix the “on-ramps to
the highway”)• Concerns/criticisms

New Approaches - Focus
• Building power• Structural intervention at the workplace• Structural intervention at the sector level• Structural intervention at the policy level

Solutions I
• Building organizations– Unions– Worker centers– Broad durable coalitions
• Transforming sector– Growth– Labor standards– Access/equity

Solutions II• Web of Jobs– Primary functions/jobs
• Core functions/jobs• Periphery functions/jobs
– Secondary functions/jobs• Geography servicing workers
• Raise labor standards– Minimum wages– Sick days– Scheduling– Labor standard enforcement (incl racial
discrimination)
What to do?
• Blacks in unions• Blacks in worker centers

![Presentation1 · Title: Microsoft PowerPoint - Presentation1 [Compatibility Mode] Author: user Created Date: 7/29/2008 1:01:27 PM](https://img.pdfslide.net/doc/110x75/5f63cd1d7d07e339e914fe9a/presentation1-title-microsoft-powerpoint-presentation1-compatibility-mode-author.jpg)