Embed Size (px)
Citation preview
Illinois Department of RevenueConstance Beard, Director
Publication 122 January 2018
Instructions for Farmland Assessments
The information in this publication is
current as of the date of the publication.
Please visit our website at tax.illinois.gov to verify you have the most current
revision.
The contents of this publication are
informational only and do not take
the place of statutes, rules, or court
decisions. For many topics covered in
this publication, we have provided a
reference to the Illinois Property Tax
Code for further clarification or more
detail. All of the sections and parts
referenced can be found at 35 ILCS
200/1 et seq.
About this publicationPub-122, Instructions for Farmland Assessments, is issued according to Section 10-115 of the Property Tax Code which states, “The Department shall issue guidelines and recommendations for the valuation of farmland to achieve equitable assessment within and between counties.”
Get forms and other information faster and easier at tax.illinois.gov!
Definition of Land UseSection 10-125 of the Property Tax Code identifies cropland, permanent pasture, other farmland, and wasteland as the four types of farmland and prescribes the method for assessing each. State law requires cropland, permanent pasture, and other farmland to be defined according to US Bureau of Census definitions. The following definitions comply with this requirement.
Cropland includes all land from which crops were harvested or hay was cut; all land in orchards, citrus groves, vineyards, and nursery greenhouse crops; land in rotational pasture, and grazing land that could have been used for crops without additional improvements; land used for cover crops, legumes, and soil improvement grasses, but not harvested and not pastured; land on which crops failed; land in cultivated summer fallow; and, idle cropland.
Permanent pasture includes any pastureland except woodland pasture and pasture qualifying under the Bureau of Census’ cropland definition which includes rotational pasture and grazing land that could have been used for crops without additional improvements.
Other farmland includes woodland pasture; woodland, including woodlots, timber tracts, cutover, and deforested land; and farm building lots other than homesites.
Wasteland is that portion of a qualified farm tract that is not put into cropland, permanent pasture, or other farmland as the result of soil limitations and not as the result of a management decision.
ContentsDefinition of Land Use 1
How is farmland assessed? 2
What are the adjustment factors? 2
What are the guidelines for alternative uses? 3
Other guidelines 5
Assessment of Farmland 8
Individual soil weighting method 8
Table 1 Certified Values for 2018 Farmland Assessments 13
Table 2 Info and Acknowledgement 14
Table 2 Productivity of Illinois Soils 15
Table 3 Slope & Erosion Adjustment Table 35
Assessment of Farm Homesites and Rural Residential Land 36
Assessment of farm residences 36
Assessment of farm buildings 36
Farm building schedules 39
For information or forms 47
PUB-122 (R-01/18)Page 2 of 47
Instructions for Farmland Assessments
How is farmland assessed? Cropland is assessed according to the equalized
assessed value (EAV) of its adjusted soil productivity index (PI) as certified by the Department. Each year, the Department supplies a table that shows the EAV of cropland by PI.
See Page 13 for Certified Values for 2018 Farmland Assessments.
Cropland with a PI below the lowest PI certified by the Department is assessed as follows:
Step 1 Subtract the EAV of the lowest certified PI from the EAV for a PI that is five greater.
Step 2 Divide the result of Step 1 by 5.
Step 3 Find the difference between the lowest PI for which the Department certified a cropland EAV and the PI of the cropland being assessed.
Step 4 Multiply the result of Step 2 by the result of Step 3.
Step 5 Subtract the result of Step 4 from the lowest EAV for cropland certified by the Department.
Step 6 The EAV of the cropland being assessed will either be the result of Step 5 or one-third of the EAV of cropland for the lowest certified PI, whichever is greater.
Permanent pasture is assessed at one-third of its adjusted PI EAV as cropland. By statute, the EAV of permanent pasture cannot be lower than one-third of the EAV per acre of cropland of the lowest PI certified by the Department.
Other farmland is assessed at one-sixth of its adjusted PI EAV as cropland. By statute, the EAV of other farm-land cannot be lower than one-sixth of the EAV per acre of cropland of the lowest PI certified by the Department.
Wasteland is assessed according to its contributory value to the farm parcel. In many instances, wasteland contributes to the productivity of other types of farmland. Some land may be more productive because wasteland provides a path for water to run off or a place for water to collect. Wasteland that has a contributory value should be assessed at one-sixth of the EAV per acre of crop-land of the lowest PI certified by the Department. When wasteland has no contributory value, a zero assessment is recommended.
What are the adjustment factors? Adjustment for slope and erosion. Use the Slope and
Erosion Adjustment Table on Page 35 to make adjust-ments to the PI for slope and erosion.
Adjustment for flooding. Adjust the PI of the affected acreage only, which suffers actual, not potential, crop loss due to flooding as prescribed in Bulletin 810, pub-lished by the University of Illinois, College of Agriculture, Cooperative Extension Service. The following text is taken directly from Bulletin 810.
“Estimated yields and productivity indices given in Table 2 apply to bottomland soils that are protected from flooding or a prolonged high water during the cropping season be-cause of high water in stream valleys. Soils that are subject to flooding are less produc-tive than soils that are protected by levees. The frequency and severity of flooding are often governed by landscape characteristics and management of the watershed in which a soil occurs. For this reason, factors used to adjust productivity indices for flooding must be based on knowledge of the characteristics and history of the specific site. Wide variation in the flooding hazard, sometimes within short distances in a given valley, require that each situation be assessed locally.
If the history of flooding in a valley is known to have caused 2 years of total crop failures and 2 years of 50% crop losses out of ten years, for example, the estimated yields and pro-ductivity indices of the bottomland soils could be reduced to 70% of those given in Table 2. Estimated crop yields and productivity indices for upland soils subject to crop damage from long-duration ponding have already been reduced accordingly in Table 2.”
Flood adjustment procedures should
identify the actual acres affected by flooding;
determine, from yield data, the extent of crop loss (in bushels) caused in each flood situation;
adjust the PI of the affected soils by a percentage equal to the percentage of crop loss caused by each flooding situation over a multi-year (preferably ten- year) period; and
recompute the flood adjustments annually. The continuous collection and analysis of yield data is needed in order to identify and compensate for changes in a parcel’s flooding history.
Adjustment for drainage district assessments. The EAV of farmland acreage that is subject to a drain-age district assessment must be adjusted. Divide the amount equal to 33 1/3 percent of the per acre drainage district assessment by the five-year Federal Land Bank
PUB-122 (R-01/18)
Instructions for Farmland Assessments
Page 3 of 47
mortgage interest rate for that assessment year. Subtract the result from the EAV. Since drainage district assess-ments may vary greatly from year to year, it is advisable to use a five-year average of per-acre drainage district assessments when making this adjustment.
Adjustments for soil inclusions, droughty soil and ponding. Do not make an adjustment for soil inclusions, droughty soil, or ponding. Long-term yield averages taken at many locations already include these effects. Only unusual conditions of large amounts of inclusions with differing productivity potential would be likely to af-fect the productivity of a local area.
When ponding consistently produces a crop loss, make a flooding adjustment.
What are the guidelines for alternative uses?
Roads. Do not assign a value to acreage in dedicated roads unless a portion of the right-of-way is in a farm use. In this case, assess this portion.
Creeks, streams, rivers, and drainage ditches. Assess acreage in creeks, streams, rivers, and drainage ditches that contribute to the productivity of a farm as contributory wasteland. Assess acreage that does not contribute to the productivity of a farm as non-contributory wasteland.
Grass waterways and windbreaks. Assess acreage in grass waterways and windbreaks as other farmland.
Ponds and borrow pits. Assess ponds and borrow pits used for agricultural purposes as contributory wasteland. If a pond or borrow pit is used as part of the homesite, assess it with the homesite at 33 1/3 percent of market value.
Power lines. Generally, no adjustment is made.
Lanes and non-dedicated roads. Assess acreage in lanes and non-dedicated roads the same as the adjacent land use. This could be as cropland, permanent pasture, other farmland, or wasteland.
Assessment of land under an approved forestry management plan. Land that is being managed under the Illinois Forestry Development Act (FDA), as ap-proved by the Illinois Department of Natural Resources, is considered “other farmland” for assessment purposes. Land assessed under the FDA is excluded from both the two-year and primary-use requirements. Any change in assessed value resulting from a newly-approved FDA plan begins on January 1 of the assessment year immediately following the plan’s initial approval date (whether or not trees have been planted). Changes in assessed value resulting from amendments or cancella-tions of existing plans also begin as of January 1 of the assessment year following the change. If the effective
date of an FDA plan is January 1, then that plan would be eligible for an FDA assessment for that assessment year. Once the chief county assessing officer (CCAO) receives official notification that a tract has been granted approved FDA status, this status remains in effect until notified otherwise or until the property is sold. For more information, see Publication 135, Preferential Assess-ments for Wooded Acreage.
Assessment of land in vegetative filter strips. Land in all downstate counties that has been certified by the Soil and Water Conservation District (SWCD) as being in an approved vegetative filter strip (VFS) is eligible, upon application, to be assessed at one-sixth of its soil PI EAV as cropland. Land in Cook County that has been certified by the SWCD as being in an approved VFS is eligible, upon application, to be assessed according to Section 10-130 of the Property Tax Code. Land assessed as a VFS is excluded from both the two-year and primary-use requirements.
The effective date of the initial legislation that creates the assessment provision for a VFS is January 1, 1997. Assessment as a VFS begins in the first assessment year after 1996, for which the property is in an approved VFS use on the annual assessment date of January 1. For example, land that is in a VFS during a portion of 2017, and is certified by the SWCD as being in an ap-proved status on January 1, 2018, is eligible for assess-ment as a VFS for the 2018 assessment year.
Land in Christmas tree production. Land used for growing Christmas trees is eligible for a farmland assessment provided it has been in Christmas trees or another qualified farm use for the previous two years and that it is not part of a primarily residential parcel. If Christmas trees are grown on land that either was being cropped prior to tree plantings or land that ordinarily would be cropped, then the cropland assessment should apply until tree maturity prevents the land from being cropped again without first having to undergo significant improvements (e.g., clearing). At this point, the “other farmland” assessment should apply. If Christmas trees are grown on land that was neither in crop production prior to tree planting nor would ordinarily be cropped, then the “other farmland” assessment instantly applies.
Land in Conservation Reserve Program (CRP). Land in the CRP is eligible for a farmland assessment provid-ed it has been in the CRP or another qualified farm use for the previous two years and is not a part of a primarily residential parcel. CRP land is assessed according to its use. Land enrolled into the CRP can be planted in grasses or trees. If grass is planted, this land will be classified as cropland (according to the Bureau of Census’ cropland definition). If trees are planted, then the cropland assessment should apply until tree maturity prevents the land from being cropped again without first having to undergo significant improvements (e.g., clearing). At this point, the “other farmland” assess-ment should apply.

PUB-122 (R-01/18)Page 4 of 47
Instructions for Farmland Assessments
Land in Conservation Reserve Enhancement Pro-gram (CREP). Land in the CREP is eligible for a farm-land assessment provided it has been in the CREP or another qualified farm use for the previous two years and is not a part of a primarily residential parcel. Land in an active CREP program is assessed the same as CRP.
Horse boarding and training facilities. The boarding and training of horses (regardless of the use for which the horses are being raised) is generally considered to meet the “keeping, raising, and feeding” provisions of the farm definition pertaining to livestock. Therefore, such a tract would be eligible for a farmland assessment pro-vided its sole use has been in this or another qualified farm use for the previous two years; and, it is not part of a primarily residential parcel.
Assessment of tree nurseries. Tree nurseries are included in the statutory definition of a farm. Such a tract would be eligible for a farmland assessment provided its sole use has been in this or another qualified farm use for the previous two years and it is not part of a primarily residential parcel. If trees are grown on land that either was being cropped prior to tree planting or land that ordinarily would be cropped, then the cropland assess-ment should apply until tree maturity prevents the land from being cropped again without first having to undergo significant improvements (e.g., clearing). At this point, the “other farmland” assessment should apply. If trees are grown on land that was neither in crop production prior to tree planting nor would ordinarily be cropped, then the “other farmland” assessment would instantly apply.
Assessment of greenhouse property. Greenhouses are included in the statutory definition of a farm. To qualify as a greenhouse, a building must be used for cultivating plants. A tract that qualifies as greenhouse property is eligible for a farmland assessment provided its sole use has been in this or another qualified farm use for the previous two years and it is not part of a primarily residential parcel. Greenhouses are assessed according to their contributory value, and greenhouse lots are assessed as “other farmland.”
Wildlife farming. Wildlife farming is included in the statutory definition of a farm. To qualify for wildlife farm-ing, a tract must comply with the “keeping, raising, and feeding” provisions of the farm definition. The mere keeping of a wildlife habitat does not meet these provi-sions. Hunting may be a component of wildlife farming; but, hunting, in itself, does not constitute wildlife farming. Neither is just the purchase and release of adult game for hunting considered wildlife farming. Land that is actively engaged in the farming of wildlife is eligible for a farmland assessment provided its sole use has been in this or another qualified farm use for the previous two years and it is not part of a primarily residential parcel. Any such land that was either previously being
cropped or ordinarily would be cropped, would warrant a cropland assessment until additional improvements (e.g., clearing) would be required before the land could be cropped again. At this point, the other farmland as-sessment would apply. Any such land that neither was being cropped nor ordinarily would be cropped, would warrant an “other farmland” assessment.
Fish farming. Fish farming is included in the statu-tory definition of a farm. To qualify for fish farming, a tract must comply with the “keeping, raising, and feed-ing” provisions of the farm definition. Fishing may be a component of fish farming; but, fishing, in itself, does not constitute fish farming. Neither is just the purchase and release of fish for fishing, a practice often referred to as “put and take,” considered fish farming. Land that is ac-tively used for the farming of fish is eligible for a farmland assessment provided its sole use has been in this or another qualified farm use for the previous two years and it is not part of a primarily residential parcel.
Compost sites. Composting, generally, does not meet the farm definition. However, an on-farm composting site, where the finished product is for on-farm use, does qualify for the farmland assessment. If such a composting site is situated on land that either was being cropped prior to the composting activity or that ordinarily would be cropped, then the cropland assessment applies until the compost-ing activity would prevent the land from being cropped again without first having to undergo significant improve-ments. At this point, the contributory wasteland assess-ment should apply. If the composting site is situated on land that was neither in crop production prior to compost-ing activity nor would ordinarily be cropped, then the contributory wasteland assessment should instantly apply.
Sewage sludge disposal sites. Determining the proper assessment classification for farmland that is also used as a sewage sludge disposal site depends upon circumstances pertaining to the particular site, such as
the application rate of the sludge,
whether or not the application of the sludge interferes with farming operations (sludge can be applied before a crop is planted, directly to a crop, after a crop is harvested, or in a manner so intensive as to prohibit farming), or
whether or not the owner or operator of the site receives financial payment.
The overriding factor to determine whether such a dually-used tract is eligible for a farmland assessment is whether or not the sludge is being applied at agronomic rates (i.e., rates which are suitable for the growth and development of crops). If nonfarm sludge is applied to an otherwise eligible farm tract at an agronomic rate, then the farm classification applies. If, however, cessation of farming occurs as a result of sludge being applied at a nonagronomic rate, then the farm classification may not apply. Even if application of nonfarm sludge at a non-

PUB-122 (R-01/18)
Instructions for Farmland Assessments
Page 5 of 47
agronomic rate does not interfere with farming operations, income generated from this nonfarm activity may conflict with the law’s sole-use requirement.
The Illinois Environmental Protection Agency, Water Pollution Control Division, should be contacted at 217 782-0610 for information pertaining to whether or not nonfarm sludge is being applied at an agronomic rate.
Other guidelines “Idle land” is land that is not put into a qualified farm
use as the result of a management decision, including neglect. Idle land differs from wasteland, which is defined as “... that portion of a qualified farm tract which is not put into cropland, permanent pasture, or other farmland as the result of soil limitations and not as a result of a management decision.”
How to assess idle land depends upon whether or not the idle land
is part of a farm,
could be cropped without additional improvements, and
is larger or smaller than the farmed portion of the parcel or tract.
Guidelines for the assessment of idle land are as follows:
If idle land is not part of a farm or not qualified for a special assessment (i.e., open space), treat it as nonfarm and assess it at market value according to its highest and best use.
If idle land is part of a farm, and could be cropped without additional improvements, it may be assessed as cropland if the idle portion of the parcel is smaller than the farmed portion of the parcel.
If idle land is part of a farm but could not be cropped without additional improvements, it may be assessed as wasteland if the idle portion of the parcel is smaller than the farmed portion of the parcel.
Generally, when the idle portion of the parcel is larger than the farmed portion of the parcel, the idle portion is assessed at market value according to its highest and best use. However, when a farm tract consists of multiple tax parcels, the cropland or wasteland assessment may apply to the idle portion of a predominantly (or exclusively) idle parcel if the idle portion of the overall farm tract is smaller than the farmed portion of the tract.
Distinguishing between idle land (that is not farmland) and land that may qualify under the farm definition as “forestry” may be difficult. However, to qualify as forestry, a wooded tract must be systematically managed for the production of timber.
Primary use provision of the farm definition. The statutory farm definition (35 ILCS 200/1-60) states: “For purposes of this Code, ‘farm’ does not include property which is primarily used for residential purposes even though some farm products may be grown or farm animals bred or fed on the property incidental to its pri-mary use.” Because the farm definition prohibits farmed portions of primarily residential parcels from receiving a farmland assessment, assessors must make primary-use determinations on parcels that contain both farm and residential uses.
The determination of primary-use must have a rational basis and be uniformly applied in the assessment jurisdiction. This recommended guideline is intended to supplement the assessor’s judgment and experience and to provide advice and direction to assessors to determine whether or not a parcel with both farm and residential uses is used primarily for residential pur-poses. This guideline does not apply to tracts assessed under the forestry management or vegetative filter strip provisions of the Property Tax Code, nor does it apply to parcels that do not contain any residential usage.
According to this guideline, the primary use of a parcel containing only intensive farm and residential uses is residential unless the intensively-farmed portion of the parcel is larger than the residential portion of the parcel. For purposes of this guideline, “intensive farm use” refers to farm practices for which the per-acre income and expenditures are significantly higher than in con-ventional farm use. Intensive farm use is typically more labor-intensive than conventional farm use. According to this guideline, the primary use of a parcel containing only conventional farm and residential uses is residential unless the conventionally-farmed portion of the parcel is larger than the residential portion of the parcel. These presumptions may be rebutted by evidence received that the primary use of the parcel is not residential. For purposes of this guideline, “conventional farm use” refers to the tending of all major and minor Illinois field crops, pasturing, foresting, livestock, and other activities associated with basic agriculture.
If a parcel has a use combination of residential, conventional farm, and intensive farm, the determination of whether or not the primary use is residential must be made by applying the criteria for each type of farm use described in the preceding paragraphs and then weigh-ing the result of all farm uses against residential use of the parcel.
If a parcel has a use combination of residential, nonresidential-nonfarm (e.g., commercial, industrial), and any type of farm use, then the relative proportion of all uses should be considered in determining whether the primary use of the parcel is residential. For example, if the primary use of the parcel is commercial, the primary use of the parcel cannot be residential and any farmed portion of the parcel meeting the two-year requirement is
PUB-122 (R-01/18)Page 6 of 47
Instructions for Farmland Assessments
entitled to a farmland assessment even though it may be smaller than the portion of the parcel used for residential purposes.
Alternative soil mapping guideline. The Department has consistently advocated the use of Illinois Coopera-tive Soil Survey (ICSS) soil mapping (mapping prepared for county detailed soil surveys) for computing farmland assessments. The ICSS soil maps contain the level of accuracy needed to assure that soil productivity indices and assessed values are accurate.
The Natural Resources Conservation Service (NRCS), the agency responsible for directing the ICSS program, is a producer of Order 2 soil surveys. Order 2 soil mapping (mapping prepared at a scale of 1:12,000 to 1:20,000) is regarded by the Department as the largest, feasibly-manageable scale for which to conduct a reli-able state mapping project. The ICSS does not produce Order 1 (mapping produced at a scale usually larger than 1:12,000) soil mapping for a county. Although Order 1 soil mapping could provide a more detailed account of the soils for a specific site than Order 2 mapping, its lack of national and state standards will often cause it to be less accurate.
Landowners may, however, challenge ICSS soil data (mapping) in a tax assessment complaint and submit alternative soil mapping. Such soil mapping should be prepared at the same scale or under the specifications and standards as ICSS soil mapping. When a complaint is filed, boards of review must decide whether evidence supports replacing ICSS soil mapping with alternative mapping. Evidence that supports substituting alternative soil mapping for ICSS soil mapping is the acceptance of such alternative mapping by the NRCS and a result-ing change in the official record copy of the soil map. An official record copy soil map showing all approved soil surveys is maintained by the NRCS. Board of review decisions regarding the standing of alternative mapping should not be made without considering the expert opin-ion of the NRCS.
Through combined efforts of the Department, NRCS, and the Office of Research in the College of Agricultural, Consumer and Environmental Sciences at the University of Illinois at Champaign-Urbana, the following mecha-nism has been developed which will give boards of review access to such expert opinion.
The CCAO should forward any alternative Order 2 soil mapping received in a complaint to the local NRCS field office. The NRCS field office will conduct an initial evalu-ation of the alternative soil mapping, and, as warranted, will forward the material to the NRCS area and/or state level. The NRCS will determine if the alternative mapping warrants a change in the official record copy. Boards of review should give substantial weight to NRCS decisions when settling complaints.
Since NRCS evaluations will only be performed on
alternative Order 2 soil mapping, according to this guide line, board of review rules should be amended to require that corresponding Order 2 soil mapping must accom-pany any Order 1 soil mapping submitted in a complaint. Boards of review can benefit greatly from an NRCS evaluation of Order 2 soil mapping.
Since ICSS soil maps identify soils as they occur on the landscape, boards of review should not replace ICSS soil mapping with any alternative mapping for areas smaller in size than a tax parcel. The entire tax parcel should be evaluated and mapped if alternative soil mapping is done.
Use of a tract during the assessment year. Since real property is valued according to its condition on January 1 of the assessment year, a time when most farmland is idle, an assessor will often not know if a tract will no longer be used for farming. Therefore, circumstances occurring after January 1 may be taken into consider-ation to determine a parcel’s tax status as farm or non-farm. For example, if a typically cropped tract previously assessed as farmland has not been planted or used in any other qualified farm use during the assessment year and building construction has begun on the tract, the tract should not be assessed as farmland.
Significance of primary use on a non-residential parcel. The primary use of a non-residential parcel does not have to be agricultural in order for a tract within the parcel to be assessed as a farm. The farmed portion of primarily commercial or industrial parcels is eligible for a farm assessment provided it qualifies under the statutory definition of farm and has qualified for the previous two years. For example, if a small farmed tract on an 80-acre industrial parcel meets the farm definition and has met the definition for the previous two years, the small tract should be assessed as farmland.
Two-year eligibility requirement. The statutory requirement that land be in a farm use for the preceding two years applies to nonfarm converted-to-farm tracts for which there was no previous farming and not to tracts converted for the purpose of adding to existing farmland. For example, the two-year requirement would not apply when the dwelling on a farmed parcel is demolished and the land is farmed. The two-year requirement also does not apply to tracts assessed under the Forestry Development Act or land assessed as a vegetative filter strip.
Non-published modern detailed soil mapping. Mod-ern detailed soil maps prepared by the USDA Natural Resources Conservation Service, are now complete in every county. Although the actual survey books are not yet published for every county, the mapping is finalized and available. Boards of review are advised to consider such detailed soil mapping when presented for appeal.

PUB-122 (R-01/18)
Instructions for Farmland Assessments
Page 7 of 47
Effect of commercial retailing of farm products on preferential assessment status. Eligibility for receiving the preferential farmland assessment depends solely upon a tract’s conformity with the farm definition without regard to the retailing methods of agricultural products produced on the tract. For example, a pay-to-pick strawberry patch is eligible for a preferential farmland assessment provided its sole use has been in this or another qualified farm use for the previous two years and it is not part of a primarily residential parcel. Tracts devoted to nonfarm uses (e.g., clubhouse, cabin), tracts where the use is not solely agricultural (e.g., pasture also used for commercial horseback riding or camping), or tracts used for the sale of nonfarm products are not eligible for preferential treatment.
Effects of gubernatorial proclamation — declaring county as a State of Illinois disaster area. Unless stipulated, there is no farmland assessment relief associated with a disaster area proclamation. Any crop damage caused by flooding from such a disaster, should be compensated for through the county’s flood adjustment procedure.
Use of ortho-photo base maps. Use of an ortho-photo base map is neither mandated by statute nor required by the Department. The Department recognizes certain advantages associated with ortho-photography, but is also aware of hardships the additional expense of ortho- photography may impose on some local governments. The benefits of ortho-photography increase when the photo base map is used in a computer-assisted mapping system or geographic information system and increases further as the steepness and diversity of the terrain increases. Before deciding on a base map, a county should be sure that it is accurate enough to allow for proper matching of parcel boundaries and soil types. The law requires that cropland, permanent pasture, and other farmland be assessed according to its adjusted PI. This can only be accomplished when soil types are adequately identified and measured by land use.
Effect of a designated Ag area on farmland assessments. The Agricultural Areas Conservation and Protection Act, 505 ILCS 5/1 et seq., provides for the establishment of agricultural conservation and protection areas (commonly called “Ag Areas”). The establishment of an Ag area provides the following benefits:
Landowners are protected from local laws or ordinances that would restrict normal farming practices, including nuisance ordinances.
Protection from special benefit assessments for sewer, water, lights or nonfarm drainage (unless landowners are benefited) is provided.
Land is protected from locally-initiated projects that would lead to the conversion of that land to other uses.
State agencies may consider the existence of Ag Areas when selecting a site for a project; however, the Act does not prohibit these agencies from acquiring land in Ag Areas for development purposes.
When determining farmland eligibility, no special consideration is given to a tract due to its being located within a designated Ag Area.
Comparing actual yields to formula yields when determining flood adjustments. Sometimes the yields of flood-affected farms and upland farms of similar PIs are similar; but, once adjusted for flood, the flood-affect-ed farms carry a lower assessment. In order to keep the PIs and assessments of flood-affected soils and similar-producing upland soils consistent, a proposal was presented for comparing actual yields to formula yields and not assigning a flood adjustment when the yield of a particular soil meets or exceeds the average yield for the soil’s PI. The Department advises against comparing actual yields to formula yields as a way of determining if a flood adjustment is warranted. The Farmland Assess-ment Law presupposes average yield potential under an average level of management. It would be inappropriate to penalize farmers who achieve higher-than-average yields through the employment of higher and costlier management practices. Refer to the instructions for flood adjustment.
PUB-122 (R-01/18)Page 8 of 47
Instructions for Farmland Assessments
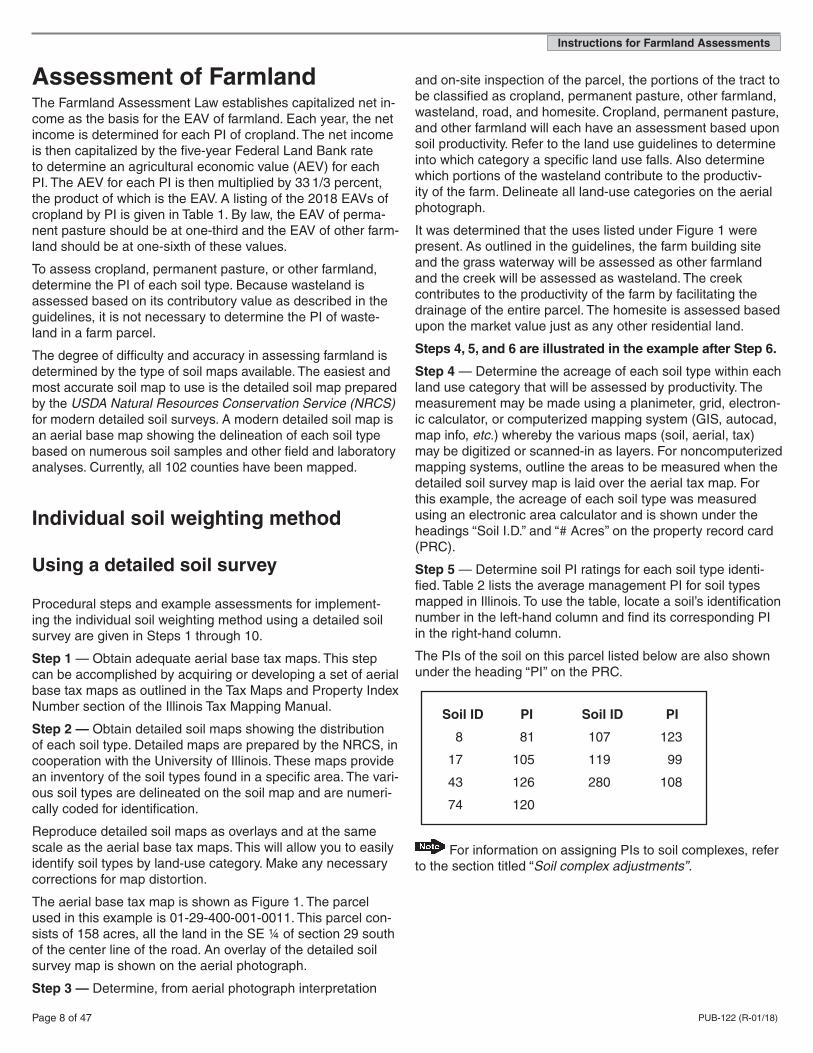
Assessment of FarmlandThe Farmland Assessment Law establishes capitalized net in-come as the basis for the EAV of farmland. Each year, the net income is determined for each PI of cropland. The net income is then capitalized by the five-year Federal Land Bank rate to determine an agricultural economic value (AEV) for each PI. The AEV for each PI is then multiplied by 33 1/3 percent, the product of which is the EAV. A listing of the 2018 EAVs of cropland by PI is given in Table 1. By law, the EAV of perma-nent pasture should be at one-third and the EAV of other farm-land should be at one-sixth of these values.
To assess cropland, permanent pasture, or other farmland, determine the PI of each soil type. Because wasteland is assessed based on its contributory value as described in the guidelines, it is not necessary to determine the PI of waste-land in a farm parcel.
The degree of difficulty and accuracy in assessing farmland is determined by the type of soil maps available. The easiest and most accurate soil map to use is the detailed soil map prepared by the USDA Natural Resources Conservation Service (NRCS) for modern detailed soil surveys. A modern detailed soil map is an aerial base map showing the delineation of each soil type based on numerous soil samples and other field and laboratory analyses. Currently, all 102 counties have been mapped.
Individual soil weighting method
Using a detailed soil survey
Procedural steps and example assessments for implement-ing the individual soil weighting method using a detailed soil survey are given in Steps 1 through 10.
Step 1 — Obtain adequate aerial base tax maps. This step can be accomplished by acquiring or developing a set of aerial base tax maps as outlined in the Tax Maps and Property Index Number section of the Illinois Tax Mapping Manual.
Step 2 — Obtain detailed soil maps showing the distribution of each soil type. Detailed maps are prepared by the NRCS, in cooperation with the University of Illinois. These maps provide an inventory of the soil types found in a specific area. The vari-ous soil types are delineated on the soil map and are numeri-cally coded for identification.
Reproduce detailed soil maps as overlays and at the same scale as the aerial base tax maps. This will allow you to easily identify soil types by land-use category. Make any necessary corrections for map distortion.
The aerial base tax map is shown as Figure 1. The parcel used in this example is 01-29-400-001-0011. This parcel con-sists of 158 acres, all the land in the SE ¼ of section 29 south of the center line of the road. An overlay of the detailed soil survey map is shown on the aerial photograph.
Step 3 — Determine, from aerial photograph interpretation
and on-site inspection of the parcel, the portions of the tract to be classified as cropland, permanent pasture, other farmland, wasteland, road, and homesite. Cropland, permanent pasture, and other farmland will each have an assessment based upon soil productivity. Refer to the land use guidelines to determine into which category a specific land use falls. Also determine which portions of the wasteland contribute to the productiv-ity of the farm. Delineate all land-use categories on the aerial photograph.
It was determined that the uses listed under Figure 1 were present. As outlined in the guidelines, the farm building site and the grass waterway will be assessed as other farmland and the creek will be assessed as wasteland. The creek contributes to the productivity of the farm by facilitating the drainage of the entire parcel. The homesite is assessed based upon the market value just as any other residential land.
Steps 4, 5, and 6 are illustrated in the example after Step 6.
Step 4 — Determine the acreage of each soil type within each land use category that will be assessed by productivity. The measurement may be made using a planimeter, grid, electron-ic calculator, or computerized mapping system (GIS, autocad, map info, etc.) whereby the various maps (soil, aerial, tax) may be digitized or scanned-in as layers. For noncomputerized mapping systems, outline the areas to be measured when the detailed soil survey map is laid over the aerial tax map. For this example, the acreage of each soil type was measured using an electronic area calculator and is shown under the headings ‘‘Soil I.D.’’ and ‘‘# Acres’’ on the property record card (PRC).
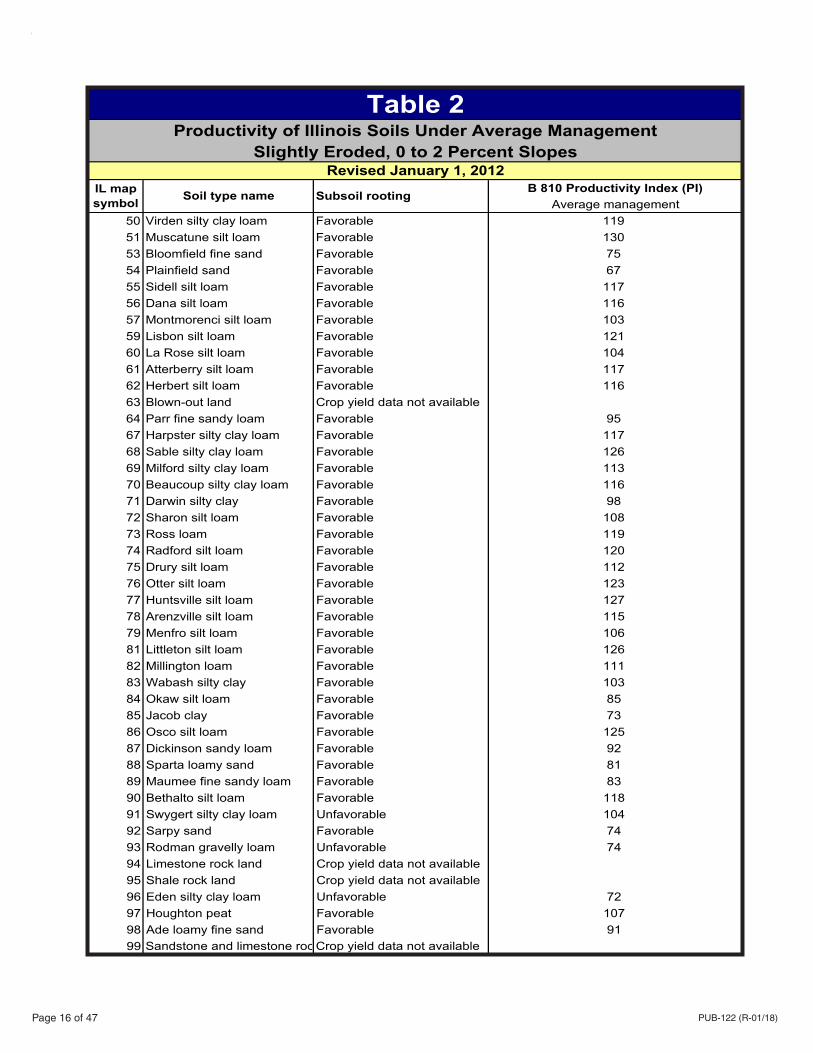
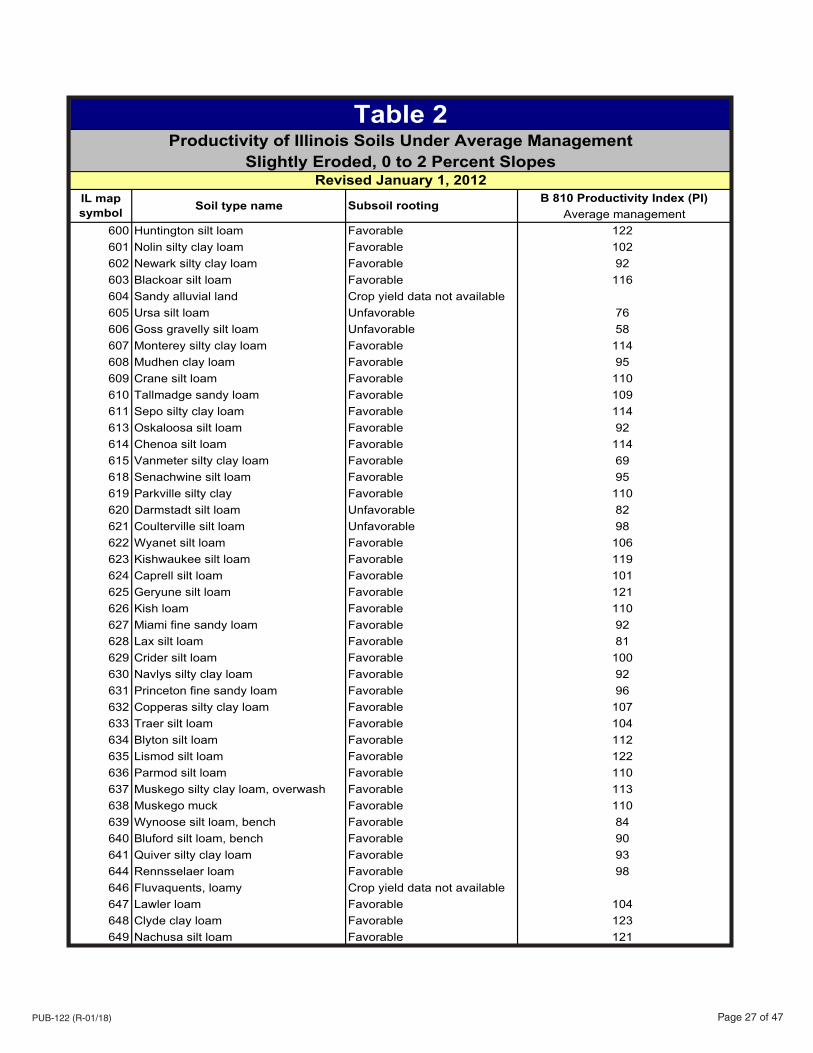
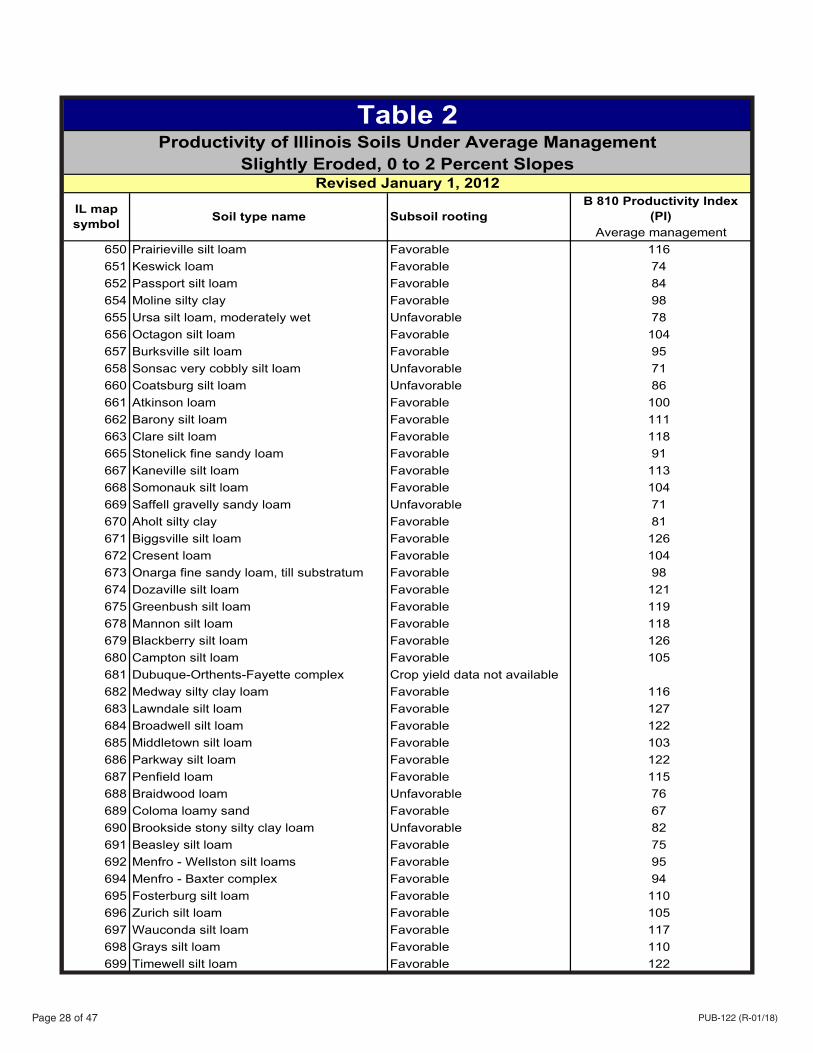
Step 5 — Determine soil PI ratings for each soil type identi-fied. Table 2 lists the average management PI for soil types mapped in Illinois. To use the table, locate a soil’s identification number in the left-hand column and find its corresponding PI in the right-hand column.
The PIs of the soil on this parcel listed below are also shown under the heading ‘‘PI’’ on the PRC.
Soil ID PI Soil ID PI
8 81 107 123
17 105 119 99
43 126 280 108
74 120
For information on assigning PIs to soil complexes, refer to the section titled “Soil complex adjustments”.

PUB-122 (R-01/18)
Instructions for Farmland Assessments
Page 9 of 47
Step 6 — Adjust the PIs for slope and erosion. The indexes given in Table 2 are for 0 to 2 percent slopes and uneroded conditions. Therefore, adjust these PIs for the negative influ-ence of actual slope and erosion conditions.
Table 3 shows percentage adjustments for common slope and erosion conditions for favorable and unfavorable subsoil. Soil types with unfavorable subsoils are indicated in Table 2 under subsoil rooting. To use Table 3, select the proper subsoil type and correlate the percentage slope on the left-hand side of the table with the degree of erosion at the top of the table. The number taken from this table is a percentage that is multiplied by the PI taken from Table 2. The result is the PI under aver-age level management adjusted for slope and erosion.
Slope is indicated on a detailed soil survey map by the letter following the soil number. In this particular soil survey, the slopes are identified as follows:
Letter code % slope used % slope used in
Table 3
no letter or A 0-2% slope 1%
B 2-4% slope 3%
C 4-7% slope 6%
D 7-12% slope 10%
E 12-18% slope 15%
F 18-35% slope 27%
Letter codes and percentage of slope vary between detailed soil surveys and between soil types within surveys. Consult your soil survey for the correct percentage of slope for each soil type.
Because Table 3 cannot be used with slope ranges, use a central point of the slope ranges unless a better determinant of slope is available. For the slope ranges used in the exam-ple, the central points are given above.
Erosion is indicated on a detailed soil survey map by a num-ber following the letter indicating slope. Erosion is indicated below.
No number or 1 uneroded
2 moderate erosion
3 severe erosion
Given the information above, the designation of a soil as 280C2 indicates soil #280 with 4-7 percent slope and moder-ate erosion.
Using Table 3 to find the percentage adjustment to the PI of a soil designated as ‘‘C’’ slope ‘‘2’’ erosion, read down the ‘‘slope’’ column to 6 percent and across to the ‘‘moderate erosion’’ col-umn to find the number 93, or 93 percent adjustment. Applying
this 93 percent adjustment to the PI of soil #280 given in Table 2 results in a PI adjustment for slope and erosion of 100 for the 280C2 soil (108 x 93% = 100).
The designation of a soil as 8F indicates soil #8 with 18-35 percent slope and uneroded.
Using Table 3 to find the percentage adjustment to the PI of a soil designated as ‘‘F’’ slope and uneroded, read down the ‘‘slope’’ column to 27 percent and across to the ‘‘uneroded’’ column to find the number 71 or 71 percent adjustment. Apply-ing this adjustment to the PI of soil #8 given in Table 2 results in an adjusted PI of 58 for the 8F soil (81 x 71% = 58).

PUB-122 (R-01/18)Page 10 of 47
Instructions for Farmland Assessments
17 105 105 2843 126 126 35119D 99 0.94 (S) 93 1280B 108 0.99(S) 107 14280C2 108 0.93(S & E) 100 5
83
8F 81 0.71(S) 58 443 126 126 174 120 120 12107 123 123 4119D 99 0.94 (S) 93 17119E3 99 0.75 (S & E) 74 4280B 108 0.99 (S) 107 6280C2 108 0.93 (S & E) 100 8
56
43 126 126 4280C2 108 0.93 (S & E) 100 3
7 6 2 2 156
Steps 7 through 10 are illustrated on the PRC example fol-lowing Step 10.
Step 7 — Determine the EAV per acre of each soil type for each land use category. To do this, locate the adjusted PI of each soil type in Table 1. The EAV per acre for a soil type in the cropland category is found directly from the table. For soil types in the permanent pasture and other farmland catego-ries, determine the EAV per acre for each soil in the same manner as for cropland; then, multiply this value times one-third for permanent pasture and one-sixth for other farmland.
For example, soil #17 in the cropland category has an adjust-ed PI of 105. By locating the PI of 105 in Table 1, the EAV per acre is found to be $242.64. To determine the EAV per acre for a soil included in the permanent pasture and other farmland categories, multiply the value as cropland by one-third and one-sixth respectively. Soil 119D in the permanent pasture category has an adjusted PI of 93 which has a cropland value from Table 1 of $144.45. After multiplying this value by one-third, the EAV for this soil in the permanent pasture category is equal to $48.15. The EAV per acre of a soil included in the other farmland category is determined by multiplying its value as cropland from Table 1 by one-sixth.
The six acres of creek are considered to contribute to the productivity of the farm and are assessed as contributory wasteland at one-sixth of the value of the lowest PI of crop-land certified by the Department. For 2017, the lowest PI of cropland certified by the Department was 82. The EAV per acre for cropland of PI 82 is $102.96. The EAV per acre of the wasteland that is a creek is $102.96 x 1/6 = $17.16 per acre. An EAV per acre of zero is assigned to both the two acres of non-contributory wasteland and the two acres of public road. All EAVs by soil type are shown under the heading ‘‘Cert. Val.’’ on the PRC.
Step 8 — Calculate the assessed value for each soil type in each land-use category by multiplying the EAV per acre (from Step 7) by the number of acres for each corresponding soil type. For example, the assessed value for soil #43 in the cropland category is 35 (acres) x $622.10/acre = $21,773.50. These calculations are shown under the heading ‘‘Asmt.’’ on the PRC.
Step 9 — Subtotal the number of acres and assessed values of the soil types within each land-use category to obtain the total number of acres and total EAVs for the cropland, perma-nent pasture, and other farmland categories. In the example, the total EAV for the 83 acres of cropland is $33,309. These calculations are shown on the ‘‘Subtotal’’ line under their re-spective headings on PRC.
Step 10 — Determine the total EAV for farmland by adding the previously determined subtotals for cropland, permanent pasture, and other farmland to the assessed value of waste-land.
2018
The PI adjustments and the adjusted PIs of all soils in the parcel are shown under the headings ‘‘Adj. Factor(s)’’ and ‘‘Adj. P.I.’’ on the PRC.
Example — Steps 4, 5, and 6

PUB-122 (R-01/18)
Instructions for Farmland Assessments
Page 11 of 47
Use Acres Use Acres
Cropland 83 Grass Waterway 3
Permanent Pasture 56 Wasteland 2
Farm Building Site 4 Creek 6
Homesite 2 Road 2
Figure 1
17 105 105 2843 126 126 35119D 99 0.94 (S) 93 1280B 108 0.99(S) 107 14280C2 108 0.93(S & E) 100 5
83
8F 81 0.71(S) 58 443 126 126 174 120 120 12107 123 123 4119D 99 0.94 (S) 93 17119E3 99 0.75 (S & E) 74 4280B 108 0.99 (S) 107 6280C2 108 0.93 (S & E) 100 8 56
43 126 126 4280C2 108 0.93 (S & E) 100 3
7 6 2 2 156
2018
242.64 6794622.10 21,774 144.45 144259.35 3631193.25 966
33,309
34.32 137207.35 207132.64 1592168.03 672 48.15 819 34.32 206 86.44 519 64.41 515 4,667 103.70 415 32.21 97
512 103
17.16
38,591
PUB-122 (R-01/18)Page 12 of 47
Instructions for Farmland Assessments
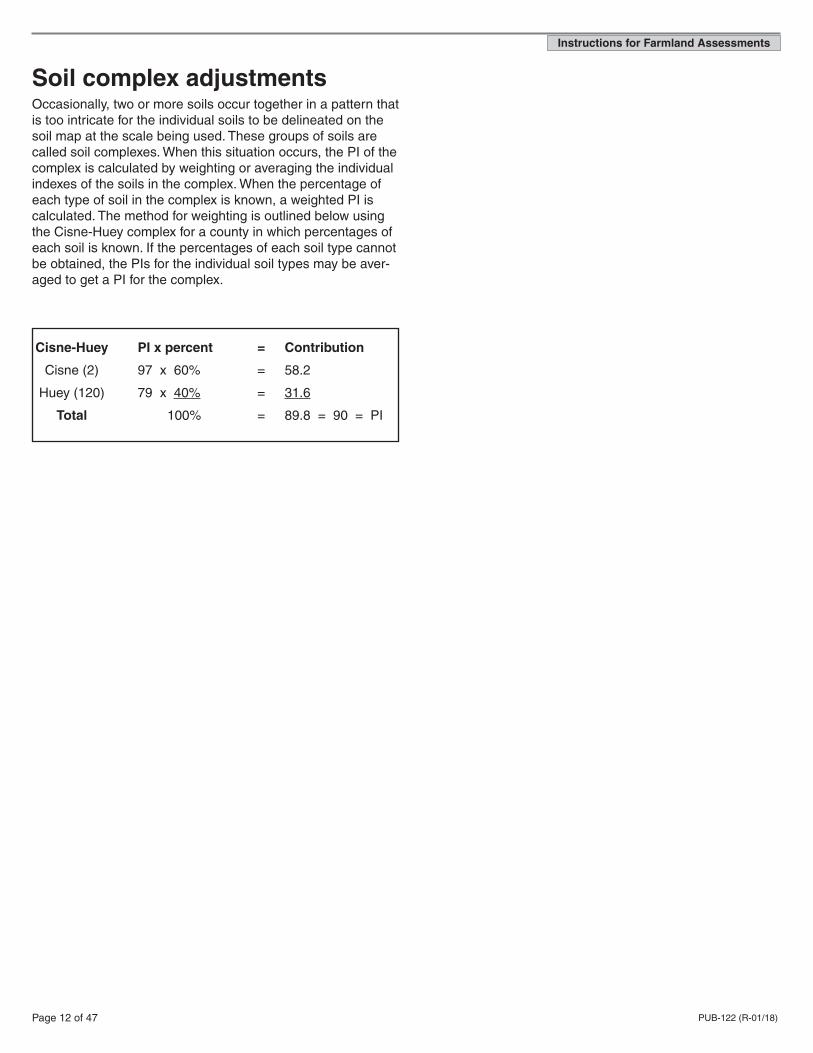
Soil complex adjustmentsOccasionally, two or more soils occur together in a pattern that is too intricate for the individual soils to be delineated on the soil map at the scale being used. These groups of soils are called soil complexes. When this situation occurs, the PI of the complex is calculated by weighting or averaging the individual indexes of the soils in the complex. When the percentage of each type of soil in the complex is known, a weighted PI is calculated. The method for weighting is outlined below using the Cisne-Huey complex for a county in which percentages of each soil is known. If the percentages of each soil type cannot be obtained, the PIs for the individual soil types may be aver-aged to get a PI for the complex.
Cisne-Huey PI x percent = Contribution
Cisne (2) 97 x 60% = 58.2
Huey (120) 79 x 40% = 31.6
Total 100% = 89.8 = 90 = PI

PUB-122 (R-01/18)
Instructions for Farmland Assessments
Page 13 of 47
PUB-122 (R-01/18)Page 14 of 47
Instructions for Farmland Assessments
Table 2 Information and Acknowledgement This table replaces Table 2 in Bulletin 810. Duplicate IL Map Symbols are in bold typeface. Use the appropriate soil type name to determine the proper productivity index.
Acknowledgement: Soil productivity indices and other required data for each Illinois soil were transferred to this web site. From 1996 to present, the Illinois crop yields estimates and productivity indices by soil type were created by a University of Illinois Urbana-Champaign, College of Agricultural, Consumer and Environmental Sciences task force of soil scientists, agronomists, crop scientists and agricultural economists under the direction of Dr. Kenneth R. Olson, Professor of Soil Science in the Department of NRES. If you have an Illinois soil type symbol that is not in this Table or have other soil productivity questions please contact Dr. Kenneth R. Olson at the following e-mail address: [email protected].

PUB-122 (R-01/18)
Instructions for Farmland Assessments
Page 15 of 47
Instructions for Farmland Assessments
Table 2Productivity of Illinois Soils Under Average Management
Slightly Eroded, 0 to 2 Percent Slopes
B 810 Productivity Index (PI)Average management
50 Virden silty clay loam Favorable 11951 Muscatune silt loam Favorable 13053 Bloomfield fine sand Favorable 7554 Plainfield sand Favorable 6755 Sidell silt loam Favorable 11756 Dana silt loam Favorable 11657 Montmorenci silt loam Favorable 10359 Lisbon silt loam Favorable 12160 La Rose silt loam Favorable 10461 Atterberry silt loam Favorable 11762 Herbert silt loam Favorable 11663 Blown-out land Crop yield data not available64 Parr fine sandy loam Favorable 9567 Harpster silty clay loam Favorable 11768 Sable silty clay loam Favorable 12669 Milford silty clay loam Favorable 11370 Beaucoup silty clay loam Favorable 11671 Darwin silty clay Favorable 9872 Sharon silt loam Favorable 10873 Ross loam Favorable 11974 Radford silt loam Favorable 12075 Drury silt loam Favorable 11276 Otter silt loam Favorable 12377 Huntsville silt loam Favorable 12778 Arenzville silt loam Favorable 11579 Menfro silt loam Favorable 10681 Littleton silt loam Favorable 12682 Millington loam Favorable 11183 Wabash silty clay Favorable 10384 Okaw silt loam Favorable 8585 Jacob clay Favorable 7386 Osco silt loam Favorable 12587 Dickinson sandy loam Favorable 9288 Sparta loamy sand Favorable 8189 Maumee fine sandy loam Favorable 8390 Bethalto silt loam Favorable 11891 Swygert silty clay loam Unfavorable 10492 Sarpy sand Favorable 7493 Rodman gravelly loam Unfavorable 7494 Limestone rock land Crop yield data not available95 Shale rock land Crop yield data not available96 Eden silty clay loam Unfavorable 7297 Houghton peat Favorable 10798 Ade loamy fine sand Favorable 9199 Sandstone and limestone rock landCrop yield data not available
Revised January 1, 2012IL map symbol Soil type name Subsoil rooting
PUB-122 (R-01/18)Page 16 of 47
Instructions for Farmland Assessments
Table 2Productivity of Illinois Soils Under Average Management
Slightly Eroded, 0 to 2 Percent Slopes
B 810 Productivity Index (PI)Average management
50 Virden silty clay loam Favorable 11951 Muscatune silt loam Favorable 13053 Bloomfield fine sand Favorable 7554 Plainfield sand Favorable 6755 Sidell silt loam Favorable 11756 Dana silt loam Favorable 11657 Montmorenci silt loam Favorable 10359 Lisbon silt loam Favorable 12160 La Rose silt loam Favorable 10461 Atterberry silt loam Favorable 11762 Herbert silt loam Favorable 11663 Blown-out land Crop yield data not available64 Parr fine sandy loam Favorable 9567 Harpster silty clay loam Favorable 11768 Sable silty clay loam Favorable 12669 Milford silty clay loam Favorable 11370 Beaucoup silty clay loam Favorable 11671 Darwin silty clay Favorable 9872 Sharon silt loam Favorable 10873 Ross loam Favorable 11974 Radford silt loam Favorable 12075 Drury silt loam Favorable 11276 Otter silt loam Favorable 12377 Huntsville silt loam Favorable 12778 Arenzville silt loam Favorable 11579 Menfro silt loam Favorable 10681 Littleton silt loam Favorable 12682 Millington loam Favorable 11183 Wabash silty clay Favorable 10384 Okaw silt loam Favorable 8585 Jacob clay Favorable 7386 Osco silt loam Favorable 12587 Dickinson sandy loam Favorable 9288 Sparta loamy sand Favorable 8189 Maumee fine sandy loam Favorable 8390 Bethalto silt loam Favorable 11891 Swygert silty clay loam Unfavorable 10492 Sarpy sand Favorable 7493 Rodman gravelly loam Unfavorable 7494 Limestone rock land Crop yield data not available95 Shale rock land Crop yield data not available96 Eden silty clay loam Unfavorable 7297 Houghton peat Favorable 10798 Ade loamy fine sand Favorable 9199 Sandstone and limestone rock landCrop yield data not available
Revised January 1, 2012IL map symbol Soil type name Subsoil rooting
PUB-122 (R-01/18)
Instructions for Farmland Assessments
Page 17 of 47
Table 2Productivity of Illinois Soils Under Average Management
Slightly Eroded, 0 to 2 Percent Slopes
B 810 Productivity Index (PI)Average management
100 Palms muck Favorable 104101 Brenton silt loam, bedrock substratum Favorable 111102 La Hogue loam Favorable 107103 Houghton muck Favorable 115104 Virgil silt loam Favorable 117105 Batavia silt loam Favorable 114106 Hitt sandy loam Favorable 100107 Sawmill silty clay loam Favorable 123108 Bonnie silt loam Favorable 98109 Racoon silt loam Favorable 94111 Rubio silt loam Favorable 101112 Cowden silt loam Favorable 103113 Oconee silt loam Favorable 105114 O'Fallon silt loam Unfavorable 89115 Dockery silt loam Favorable 114116 Whitson silt loam Favorable 103119 Elco silt loam Favorable 99120 Huey silt loam Unfavorable 79122 Colp silt loam Unfavorable 87123 Riverwash Crop yield data not available124 Beaucoup gravelly clay loam Favorable 116125 Selma loam Favorable 114126 Bonpas silt loam, overwash Favorable 117127 Harrison silt loam Favorable 115128 Douglas silt loam Favorable 112131 Alvin fine sandy loam Favorable 98132 Starks silt loam Favorable 106134 Camden silt loam Favorable 106136 Brooklyn silt loam Favorable 99137 Clare silt loam, bedrock substratum Favorable 113138 Shiloh silty clay loam Favorable 115
138+ Shiloh silt loam, overwash Favorable 111141 Wesley fine sandy loam Favorable 100142 Patton silty clay loam Favorable 117145 Saybrook silt loam Favorable 117146 Elliott silt loam Favorable 111147 Clarence silty clay loam Unfavorable 95148 Proctor silt loam Favorable 120149 Brenton silt loam Favorable 125
Revised January 1, 2012IL map symbol Soil type name Subsoil rooting

PUB-122 (R-01/18)Page 18 of 47
Instructions for Farmland Assessments
Table 2Productivity of Illinois Soils Under Average Management
Slightly Eroded, 0 to 2 Percent Slopes
B 810 Productivity Index (PI)Average management
150 Onarga sandy loam Favorable 97151 Ridgeville fine sandy loam Favorable 101152 Drummer silty clay loam Favorable 127153 Pella silty clay loam Favorable 120154 Flanagan silt loam Favorable 127155 Stockland loam Unfavorable 82157 Symerton loam Favorable 114159 Pillot silt loam Favorable 106162 Gorham silty clay loam Favorable 115164 Stoy silt loam Favorable 96165 Weir silt loam Favorable 94166 Cohoctah loam Favorable 118167 Lukin silt loam Favorable 96171 Catlin silt loam Favorable 122172 Hoopeston sandy loam Favorable 97173 McGary silt loam Unfavorable 89174 Chaseburg silt loam Favorable 107175 Lamont fine sandy loam Favorable 86176 Marissa silt loam Favorable 109178 Ruark fine sandy loam Favorable 88179 Minneiska loam Favorable 92180 Dupo silt loam Favorable 116182 Peotone mucky silty clay loam, marl substratum Favorable 106183 Shaffton loam Favorable 102184 Roby fine sandy loam Favorable 98188 Beardstown loam Favorable 100189 Martinton silt loam Favorable 115191 Knight silt loam Favorable 107192 Del Rey silt loam Favorable 100193 Mayville silt loam Favorable 98194 Morley silt loam Favorable 92197 Troxel silt loam Favorable 124198 Elburn silt loam Favorable 127199 Plano silt loam Favorable 126
Revised January 1, 2012IL map symbol Soil type name Subsoil rooting
PUB-122 (R-01/18)
Instructions for Farmland Assessments
Page 19 of 47
Table 2Productivity of Illinois Soils Under Average Management
Slightly Eroded, 0 to 2 Percent Slopes
B 810 Productivity Index (PI)Average management
200 Orio sandy loam Favorable 97201 Gilford fine sandy loam Favorable 98204 Ayr sandy loam Favorable 96205 Metea silt loam Favorable 86206 Thorp silt loam Favorable 112208 Sexton silt loam Favorable 102210 Lena muck Favorable 111212 Thebes silt loam Favorable 98213 Normal silt loam Favorable 118214 Hosmer silt loam Unfavorable 93216 Stookey silt loam Favorable 102217 Twomile silt loam Favorable 93218 Newberry silt loam Favorable 101219 Millbrook silt loam Favorable 114221 Parr silt loam Favorable 105223 Varna silt loam Favorable 103224 Strawn silt loam Favorable 93225 Holton silt loam Favorable 89226 Wirt silt loam Favorable 94227 Argyle silt loam Favorable 108228 Nappanee silt loam Unfavorable 78229 Monee silt loam Favorable 88230 Rowe silty clay Favorable 98231 Evansville silt loam Favorable 114232 Ashkum silty clay loam Favorable 112233 Birkbeck silt loam Favorable 108234 Sunbury silt loam Favorable 116235 Bryce silty clay Favorable 107236 Sabina silt loam Favorable 108238 Rantoul silty clay Favorable 96239 Dorchester silt loam Favorable 113240 Plattville silt loam Favorable 106241 Chatsworth silt loam Unfavorable 69242 Kendall silt loam Favorable 110243 St. Charles silt loam Favorable 108244 Hartsburg silty clay loam Favorable 119248 McFain silty clay Favorable 105249 Edinburg silty clay loam Favorable 112
Revised January 1, 2012IL map symbol Soil type name Subsoil
rooting
PUB-122 (R-01/18)Page 20 of 47
Instructions for Farmland Assessments
Table 2Productivity of Illinois Soils Under Average Management
Slightly Eroded, 0 to 2 Percent Slopes
B 810 Productivity Index (PI)Average management
250 Velma loam Favorable 100252 Harvel silty clay loam Favorable 111256 Pana silt loam Favorable 102257 Clarksdale silt loam Favorable 114258 Sicily silt loam Favorable 110259 Assumption silt loam Favorable 106261 Niota silt loam Favorable 87262 Denrock silt loam Favorable 102264 El Dara silt loam Favorable 89265 Lomax loam Favorable 102266 Disco sandy loam Favorable 96267 Caseyville silt loam Favorable 112268 Mt. Carroll silt loam Favorable 119270 Stronghurst silt loam, sandy substratum Favorable 111271 Timula silt loam Favorable 100272 Edgington silt loam Favorable 109274 Seaton silt loam Favorable 106275 Joy silt loam Favorable 127277 Port Byron silt loam Favorable 127278 Stronghurst silt loam Favorable 111279 Rozetta silt loam Favorable 106280 Fayette silt loam Favorable 108282 Chute fine sand Favorable 66283 Downsouth silt loam Favorable 120284 Tice silty clay loam Favorable 118285 Carmi loam Favorable 95286 Carmi sandy loam Favorable 94287 Chauncey silt loam Favorable 105288 Petrolia silty clay loam Favorable 103290 Warsaw silt loam Favorable 105291 Xenia silt loam Favorable 104292 Wallkill silt loam Favorable 109293 Andres silt loam Favorable 120294 Symerton silt loam Favorable 116295 Mokena silt loam Favorable 111296 Washtenaw silt loam Favorable 116297 Ringwood silt loam Favorable 115298 Beecher silt loam Favorable 101
Revised January 1, 2012IL map symbol Soil type name Subsoil
rooting

PUB-122 (R-01/18)
Instructions for Farmland Assessments
Page 21 of 47
Table 2Productivity of Illinois Soils Under Average Management
Slightly Eroded, 0 to 2 Percent Slopes
B 810 Productivity Index (PI)Average management
300 Westland clay loam Favorable 107301 Grantsburg silt loam Unfavorable 90302 Ambraw clay loam Favorable 101304 Landes fine sandy loam Favorable 89306 Allison silty clay loam Favorable 120307 Iona silt loam Favorable 105308 Alford silt loam Favorable 107310 McHenry silt loam Favorable 101311 Ritchey silt loam Unfavorable 74312 Edwards muck Favorable 97313 Rodman loam Unfavorable 74314 Joliet silty clay loam Favorable 87315 Channahon silt loam Unfavorable 71316 Romeo silt loam Unfavorable 43317 Millsdale silty clay loam Favorable 97318 Lorenzo loam Unfavorable 93319 Aurelius muck Favorable 85320 Frankfort silt loam Unfavorable 90321 Du Page silt loam Favorable 111322 Russell silt loam Favorable 103323 Casco silt loam Unfavorable 91324 Ripon silt loam Favorable 98325 Dresden silt loam Favorable 102326 Homer silt loam Favorable 101327 Fox silt loam Favorable 96328 Holly silt loam Favorable 96329 Will silty clay loam Favorable 115330 Peotone silty clay loam Favorable 108331 Haymond silt loam Favorable 117332 Billett sandy loam Favorable 88333 Wakeland silt loam Favorable 114334 Birds silt loam Favorable 103335 Robbs silt loam Favorable 92336 Wilbur silt loam Favorable 113337 Creal silt loam Favorable 98338 Hurst silt loam Unfavorable 88339 Wellston silt loam Unfavorable 80340 Zanesville silt loam Unfavorable 84341 Ambraw silty clay loam, sandy substratumFavorable 101342 Matherton silt loam Favorable 101343 Kane silt loam Favorable 110344 Harvard silt loam Favorable 111345 Elvers silt loam Favorable 104346 Dowagiac silt loam Favorable 99347 Canisteo silt loam Favorable 111348 Wingate silt loam Favorable 107349 Zumbro sandy loam Favorable 87
Revised January 1, 2012IL map symbol Soil type name Subsoil rooting
PUB-122 (R-01/18)Page 22 of 47
Instructions for Farmland Assessments
Table 2Productivity of Illinois Soils Under Average Management
Slightly Eroded, 0 to 2 Percent Slopes
B 810 Productivity Index (PI)
Average management350 Drummer silty clay loam, gravelly substratum Favorable 122351 Elburn silt loam, gravelly substratum Favorable 120352 Palms silty clay loam, overwash Favorable 112353 Toronto silt loam Favorable 114354 Hononegah loamy coarse sand Favorable 74355 Binghampton sandy loam Favorable 93356 Elpaso silty clay loam Favorable 127357 Vanpetten loam Favorable 94359 Fayette silt loam, till substratum Favorable 105360 Slacwater silt loam Favorable 100361 Kidder silt loam Favorable 91362 Whitaker variant loam Favorable 105363 Griswold loam Favorable 103365 Aptakisic silt loam Favorable 102366 Algansee fine sandy loam Favorable 83367 Beach sand Crop yield data not available368 Raveenwash silty clay loam Favorable 95369 Waupecan silt loam Favorable 123370 Saylesville silt loam Favorable 94371 St. Charles silt loam, sandy substratum Favorable 100372 Kendall silt loam, sandy substratum Favorable 104373 Camden silt loam, sandy substratum Favorable 96374 Proctor silt loam, sandy substratum Favorable 108375 Rutland silt loam Favorable 118376 Cisne silt loam, bench Favorable 97377 Hoyleton silt loam, bench Favorable 96378 Lanier fine sandy loam Favorable 72379 Dakota silt loam Favorable 99380 Fieldon silt loam Favorable 101381 Craigmile sandy loam Favorable 102382 Belknap silt loam Favorable 104383 Newvienna silt loam Favorable 119384 Edwardsville silt loam Favorable 124385 Mascoutah silty clay loam Favorable 125386 Downs silt loam Favorable 119387 Ockley silt loam Favorable 102388 Wenona silt loam Favorable 114389 Hesch loamy sand, shallow variant Unfavorable 50390 Hesch fine sandy loam Unfavorable 89391 Blake silty clay loam Favorable 103392 Urban land, loamy Orthents complex Crop yield data not available393 Marseilles silt loam, gravelly substratum Unfavorable 96394 Haynie silt loam Favorable 105395 Ceresco loam Favorable 104396 Vesser silt loam Favorable 109397 Boone loamy fine sand Unfavorable 61398 Wea silt loam Favorable 115
Revised January 1, 2012
IL map symbol Soil type name Subsoil rooting

PUB-122 (R-01/18)
Instructions for Farmland Assessments
Page 23 of 47
Table 2Productivity of Illinois Soils Under Average Management
Slightly Eroded, 0 to 2 Percent Slopes
B 810 Productivity Index (PI)
Average management400 Calco silty clay loam Favorable 121401 Okaw silty clay loam Favorable 78402 Colo silty clay loam Favorable 122403 Elizabeth silt loam Unfavorable 54404 Titus silty clay loam Favorable 104405 Zook silty clay Favorable 103406 Paxico silt loam Favorable 106407 Udifluvents, loamy Crop yield data not available408 Aquents, loamy Crop yield data not available409 Aquents, clayey Crop yield data not available410 Woodbine silt loam Favorable 87411 Ashdale silt loam Favorable 110412 Ogle silt loam Favorable 116413 Gale silt loam Favorable 89414 Myrtle silt loam Favorable 110415 Orion silt loam Favorable 116416 Durand silt loam Favorable 112417 Derinda silt loam Unfavorable 84418 Schapville silt loam Unfavorable 94419 Flagg silt loam Favorable 106420 Piopolis silty clay loam Favorable 95421 Kell silt loam Favorable 83422 Cape silty clay loam Favorable 91423 Millstadt silt loam Favorable 97424 Shoals silt loam Favorable 113425 Muskingum stony silt loam Unfavorable 61426 Karnak silty clay Favorable 89427 Burnside silt loam Favorable 85428 Coffeen silt loam Favorable 117429 Palsgrove silt loam Favorable 92430 Raddle silt loam Favorable 122431 Genesee silt loam Favorable 111432 Geff silt loam Favorable 97433 Floraville silt loam Favorable 90434 Ridgway silt loam Favorable 104435 Streator silty clay loam Favorable 116436 Meadowbank silt loam Favorable 121437 Redbud silt loam Favorable 101438 Aviston silt loam Favorable 121439 Jasper silt loam, sandy substratum Favorable 104440 Jasper silt loam Favorable 115441 Wakenda silt loam Favorable 123442 Mundelein silt loam Favorable 123443 Barrington silt loam Favorable 115445 Newhaven loam Favorable 111446 Springerton loam Favorable 117447 Canisteo silt loam, sandy substratum Favorable 105448 Mona silt loam Favorable 104449 Amiesburg - Sarpy complex Favorable 100
Revised January 1, 2012
IL map symbol Soil type name Subsoil rooting

PUB-122 (R-01/18)Page 24 of 47
Instructions for Farmland Assessments
Table 2Productivity of Illinois Soils Under Average Management
Slightly Eroded, 0 to 2 Percent Slopes
B 810 Productivity Index (PI)
Average management450 Brouillett silt loam Favorable 118451 Lawson silt loam Favorable 124452 Riley silty clay loam Favorable 112453 Muren silt loam Favorable 105454 Iva silt loam Favorable 110455 Mixed alluvial land Crop yield data not available456 Ware silt loam Favorable 104457 Booker silty clay Favorable 79458 Fayette silt loam, sandy substratum Favorable 104459 Tama silt loam, sandy substratum Favorable 120460 Ginat silt loam Favorable 95461 Weinbach silt loam Favorable 93462 Sciotoville silt loam Favorable 93463 Wheeling silt loam Favorable 96464 Wallkill silty clay loam Favorable 97465 Montgomery silty clay loam Favorable 98466 Bartelso silt loam Favorable 112467 Markland silt loam Unfavorable 93468 Lakaskia silt loam Favorable 107469 Emma silty clay loam Favorable 98470 Keller silt loam Unfavorable 101471 Clarksville cherty silt loam Unfavorable 54472 Baylis silt loam Favorable 96473 Rossburg loam Favorable 117474 Piasa silt loam Unfavorable 92475 Elsah cherty silt loam Favorable 97476 Biddle silt loam Unfavorable 103477 Winfield silt loam Favorable 105479 Aurelius muck, sandy substratum Favorable 92480 Moundprairie silty clay loam Favorable 103481 Raub silt loam Favorable 119482 Uniontown silt loam Favorable 104483 Henshaw silt loam Favorable 104484 Harco silt loam Favorable 124485 Richwood silt loam Favorable 120486 Bertrand silt loam Favorable 101487 Joyce silt loam Favorable 117488 Hooppole loam Favorable 107489 Hurst silt loam, sandy substratum Unfavorable 83490 Odell silt loam Favorable 114491 Ruma silt loam Favorable 103492 Normandy silt loam Favorable 109493 Bonfield silt loam Favorable 108494 Kankakee fine sandy loam Favorable 102495 Corwin silt loam Favorable 108496 Fincastle silt loam Favorable 107499 Fella silty clay loam Favorable 119
Revised January 1, 2012
IL map symbol Soil type name Subsoil rooting

PUB-122 (R-01/18)
Instructions for Farmland Assessments
Page 25 of 47
Table 2Productivity of Illinois Soils Under Average Management
Slightly Eroded, 0 to 2 Percent Slopes
B 810 Productivity Index (PI)
Average management501 Morocco fine sand Favorable 77503 Rockton loam Favorable 90504 Sogn silt loam Unfavorable 54505 Dunbarton silt loam Unfavorable 66506 Hitt silt loam Favorable 105508 Selma loam, bedrock substratum Favorable 112509 Whalan loam Favorable 79511 Dunbarton silt loam, cherty variant Unfavorable 53512 Danabrook silt loam Favorable 122513 Granby loamy sand Favorable 96515 Bunkum silty clay loam Favorable 98516 Faxon clay loam Favorable 102517 Marine silt loam Favorable 92518 Rend silt loam Unfavorable 93523 Dunham silty clay loam Favorable 117524 Zipp silty clay loam Favorable 91525 Joslin loam, bedrock substratum Unfavorable 84526 Grundelein silt loam Favorable 122527 Kidami silt loam Favorable 102528 Lahoguess loam Favorable 111529 Selmass loam Favorable 107530 Ozaukee silt loam Favorable 96531 Markham silt loam Favorable 101533 Urban land Crop yield data not available534 Urban land, clayey Orthents complex Crop yield data not available535 Orthents, stony Crop yield data not available536 Dumps, mine Crop yield data not available537 Hesch fine sandy loam, gray subsoil variant Unfavorable 99538 Emery silt loam Favorable 112539 Wenona silt loam, loamy substratum Favorable 116540 Frankville silt loam Favorable 86541 Graymont silt loam Favorable 119542 Rooks silt loam Favorable 122543 Piscasaw silt loam Favorable 108544 Torox silt loam Favorable 109545 Windere silt loam Favorable 112546 Keltner silt loam Favorable 104547 Eleroy silt loam Favorable 93548 Marseilles silt loam, moderately wet Unfavorable 94549 Marseilles silt loam Unfavorable 94
Revised January 1, 2012
IL map symbol Soil type name Subsoil rooting

PUB-122 (R-01/18)Page 26 of 47
Instructions for Farmland Assessments
Table 2Productivity of Illinois Soils Under Average Management
Slightly Eroded, 0 to 2 Percent Slopes
B 810 Productivity Index (PI)Average management
551 Gosport silt loam Unfavorable 75552 Drummer silty clay loam, till substratum Favorable 120553 Bryce-Calamine variant complex Favorable 103554 Kernan silt loam Favorable 100555 Shadeland silt loam Favorable 85556 High Gap loam Unfavorable 84557 Millstream silt loam Favorable 115558 Breeds silty clay loam Favorable 105559 Lindley loam Favorable 83560 St. Clair silt loam Unfavorable 83561 Whalan and NewGlarus silt loams Favorable 85562 Port Byron silt loam, sandy substratum Favorable 115563 Seaton silt loam, sandy substratum Favorable 101564 Waukegan silt loam Favorable 106565 Tell silt loam Favorable 99566 Rockton and Dodgeville soils Favorable 91567 Elkhart silt loam Favorable 111568 Niota silty clay loam, clayey subsurface variant Favorable 78569 Medary silty clay loam Favorable 76570 Martinsville silt loam Favorable 101571 Whitaker silt loam Favorable 106572 Loran silt loam Favorable 107573 Tuscola loam Favorable 90574 Ogle silt loam, silt loam subsoil variant Favorable 102575 Joy silt loam, sandy substratum Favorable 119576 Zwingle silt loam Favorable 94577 Terrace escarpment Crop yield data not available578 Dorchester silt loam, cobbly substratum Favorable 93579 Beavercreek loam Unfavorable 75580 Fayette silty clay loam, karst Favorable 96581 Tamalco silt loam Unfavorable 82582 Homen silt loam Favorable 96583 Pike silt loam Favorable 103584 Grantfork silty clay loam Unfavorable 77585 Negley loam Favorable 90586 Nokomis silt loam Favorable 100587 Terril loam Favorable 116588 Sparta loamy sand, loamy substratum Favorable 83589 Bowdre silty clay Favorable 98590 Cairo silty clay Favorable 105591 Fults silty clay Favorable 102592 Nameoki silty clay Favorable 106593 Chautauqua silty clay loam Favorable 106594 Reddick silty clay loam Favorable 115595 Coot loam Favorable 97596 Marbletown silt loam Favorable 115597 Armiesburg silty clay loam Favorable 117598 Bedford silt loam Favorable 83599 Baxter cherty silt loam Favorable 73
Revised January 1, 2012IL map symbol Soil type name Subsoil rooting
PUB-122 (R-01/18)
Instructions for Farmland Assessments
Page 27 of 47
Table 2Productivity of Illinois Soils Under Average Management
Slightly Eroded, 0 to 2 Percent Slopes
B 810 Productivity Index (PI)Average management
600 Huntington silt loam Favorable 122601 Nolin silty clay loam Favorable 102602 Newark silty clay loam Favorable 92603 Blackoar silt loam Favorable 116604 Sandy alluvial land Crop yield data not available605 Ursa silt loam Unfavorable 76606 Goss gravelly silt loam Unfavorable 58607 Monterey silty clay loam Favorable 114608 Mudhen clay loam Favorable 95609 Crane silt loam Favorable 110610 Tallmadge sandy loam Favorable 109611 Sepo silty clay loam Favorable 114613 Oskaloosa silt loam Favorable 92614 Chenoa silt loam Favorable 114615 Vanmeter silty clay loam Favorable 69618 Senachwine silt loam Favorable 95619 Parkville silty clay Favorable 110620 Darmstadt silt loam Unfavorable 82621 Coulterville silt loam Unfavorable 98622 Wyanet silt loam Favorable 106623 Kishwaukee silt loam Favorable 119624 Caprell silt loam Favorable 101625 Geryune silt loam Favorable 121626 Kish loam Favorable 110627 Miami fine sandy loam Favorable 92628 Lax silt loam Favorable 81629 Crider silt loam Favorable 100630 Navlys silty clay loam Favorable 92631 Princeton fine sandy loam Favorable 96632 Copperas silty clay loam Favorable 107633 Traer silt loam Favorable 104634 Blyton silt loam Favorable 112635 Lismod silt loam Favorable 122636 Parmod silt loam Favorable 110637 Muskego silty clay loam, overwash Favorable 113638 Muskego muck Favorable 110639 Wynoose silt loam, bench Favorable 84640 Bluford silt loam, bench Favorable 90641 Quiver silty clay loam Favorable 93644 Rennsselaer loam Favorable 98646 Fluvaquents, loamy Crop yield data not available 647 Lawler loam Favorable 104648 Clyde clay loam Favorable 123649 Nachusa silt loam Favorable 121
Revised January 1, 2012IL map symbol Soil type name Subsoil rooting
PUB-122 (R-01/18)Page 28 of 47
Instructions for Farmland Assessments
Table 2Productivity of Illinois Soils Under Average Management
Slightly Eroded, 0 to 2 Percent Slopes
B 810 Productivity Index (PI)
Average management650 Prairieville silt loam Favorable 116651 Keswick loam Favorable 74652 Passport silt loam Favorable 84654 Moline silty clay Favorable 98655 Ursa silt loam, moderately wet Unfavorable 78656 Octagon silt loam Favorable 104657 Burksville silt loam Favorable 95658 Sonsac very cobbly silt loam Unfavorable 71660 Coatsburg silt loam Unfavorable 86661 Atkinson loam Favorable 100662 Barony silt loam Favorable 111663 Clare silt loam Favorable 118665 Stonelick fine sandy loam Favorable 91667 Kaneville silt loam Favorable 113668 Somonauk silt loam Favorable 104669 Saffell gravelly sandy loam Unfavorable 71670 Aholt silty clay Favorable 81671 Biggsville silt loam Favorable 126672 Cresent loam Favorable 104673 Onarga fine sandy loam, till substratum Favorable 98674 Dozaville silt loam Favorable 121675 Greenbush silt loam Favorable 119678 Mannon silt loam Favorable 118679 Blackberry silt loam Favorable 126680 Campton silt loam Favorable 105681 Dubuque-Orthents-Fayette complex Crop yield data not available682 Medway silty clay loam Favorable 116683 Lawndale silt loam Favorable 127684 Broadwell silt loam Favorable 122685 Middletown silt loam Favorable 103686 Parkway silt loam Favorable 122687 Penfield loam Favorable 115688 Braidwood loam Unfavorable 76689 Coloma loamy sand Favorable 67690 Brookside stony silty clay loam Unfavorable 82691 Beasley silt loam Favorable 75692 Menfro - Wellston silt loams Favorable 95694 Menfro - Baxter complex Favorable 94695 Fosterburg silt loam Favorable 110696 Zurich silt loam Favorable 105697 Wauconda silt loam Favorable 117698 Grays silt loam Favorable 110699 Timewell silt loam Favorable 122
Revised January 1, 2012
IL map symbol Soil type name Subsoil rooting

PUB-122 (R-01/18)
Instructions for Farmland Assessments
Page 29 of 47
Table 2Productivity of Illinois Soils Under Average Management
Slightly Eroded, 0 to 2 Percent Slopes
B 810 Productivity Index (PI)
Average management700 Westmore silt loam Favorable 87701 Menfro - Hickory silt loams Favorable 97702 Ruma - Hickory silt loams Favorable 95703 Pierron - Burksville silt loams Favorable 93705 Buckhart silt loam Favorable 126706 Boyer sandy loam Favorable 88709 Osceola silt loam Favorable 101711 Hatfield silt loam Favorable 100712 Spaulding silty clay loam Favorable 118713 Judyville fine sandy loam Unfavorable 57715 Arrowsmith silt loam Favorable 124717 Stockey - Clarksville complex Favorable 84718 Marsh Crop yield data not available720 Aetna silt loam Favorable 118721 Drummer and Elpaso silty clay loams Favorable 127722 Drummer - Milford silty clay loams Favorable 121723 Reesville silt loam Favorable 110724 Rozetta-Elco silt loams Favorable 103725 Otter-Lawson silt loams Favorable 123726 Elburn silt loam, sandy substratum Favorable 120727 Waukee loam Favorable 97728 Winnebago silt loam Favorable 108730 Bethesda channery silty clay loam Crop yield data not available731 Nasset silt loam Favorable 100732 Appleriver silt loam Favorable 93737 Tama silt loam, sandy substratum Favorable 123738 Milton silt loam Unfavorable 57739 Milton silt loam Unfavorable 57740 Darroch silt loam Favorable 114741 Oakville fine sand Favorable 73742 Dickinson sandy loam, loamy substratum Favorable 95743 Ridott silt loam Favorable 99745 Shullsburg silt loam Unfavorable 100746 Calamine silt loam Favorable 97747 Milford silty clay loams Favorable 113748 Plano silt loam, sandy substratum Favorable 119749 Buckhart silt loam, till substratum Favorable 126
Revised January 1, 2012
IL map symbol Soil type name Subsoil rooting

PUB-122 (R-01/18)Page 30 of 47
Instructions for Farmland Assessments
Table 2Productivity of Illinois Soils Under Average Management
Slightly Eroded, 0 to 2 Percent Slopes
B 810 Productivity Index (PI)
Average management750 Skelton fine sandy loam Favorable 93751 Crawleyville loam Favorable 94752 Oneco silt loam Favorable 97753 Massbach silt loam Favorable 98754 Fairpoint gravelly clay loam Crop yield data not available755 Lamoille silt loam Favorable 75756 Wyanet fine sandy loam Favorable 101757 Senachwine fine sandy loam Favorable 90759 Udolpho loam, sandy substratum Favorable 90760 Marshan loam, sandy substratum Favorable 109761 Eleva sandy loam Unfavorable 76763 Joslin silt loam Favorable 115764 Coyne fine sandy loam Favorable 93765 Trempealeau silt loam Favorable 100766 Lamartine silt loam Favorable 118767 Prophetstown silt loam Favorable 122768 Backbone loamy sand Favorable 77769 Edmund silt loam Unfavorable 79770 Udolpho loam Favorable 91771 Hayfield loam Favorable 100772 Marshan loam Favorable 110774 Saude loam Favorable 96776 Comfrey clay loam Favorable 122777 Adrian muck Favorable 97779 Chelsea loamy fine sand Favorable 68780 Grellton sandy loam Favorable 93781 Friesland sandy loam Favorable 105782 Juneau silt loam Favorable 116783 Flagler sandy loam Favorable 85784 Berks loam Unfavorable 56785 Lacrescent cobbly silty clay loam Favorable 73786 Frondorf loam Unfavorable 77787 Banlic silt loam Favorable 94
789# Ambraw-Ceresco-Sarpy complex Favorable 97 789# Volney silt loam, bedrock substratum Unfavorable 76
791 Rush silt loam Favorable 96792 Bowes silt loam Favorable 115793 Berks, Muskingum and Wiekert soils Unfavorable 55796 Huey-Burksville silt loam Unfavorable 85797 Hickory-Homen silty clay loam Favorable 87799 Arents, loamy Crop yield data not available
Revised January 1, 2012
IL map symbol Soil type name Subsoil rooting

PUB-122 (R-01/18)
Instructions for Farmland Assessments
Page 31 of 47
Table 2Productivity of Illinois Soils Under Average Management
Slightly Eroded, 0 to 2 Percent Slopes
B 810 Productivity Index (PI)
Average management800 Psamments Crop yield data not available801 Orthents, silty Crop yield data not available802 Orthents, loamy Crop yield data not available803 Orthents Crop yield data not available804 Orthents, acid Crop yield data not available805 Orthents, clayey Crop yield data not available806 Orthents, clayey-skeletal Crop yield data not available807 Aquents-Orthents complex Crop yield data not available808 Orthents, sandy-skeletal Crop yield data not available809 Orthents, loamy - skeletal, acid, steep Crop yield data not available810 Oil-brine damaged land Crop yield data not available811 Aquolls Crop yield data not available812 Typic Hapludalfs Crop yield data not available813 Orthents, bedrock subs.,silty, pits, complex Crop yield data not available814 Muscatune-Buckhart complex Favorable 128815 Udorthents, silty Favorable 95816 Stookey-Timula-Orthents complex Crop yield data not available817 Channahon-Hesch fine sandy loam Unfavorable 78818 Flanagan-Catlin silt loams Favorable 125819 Hennepin-Vanmeter complex Unfavorable 76820 Hennepin-Casco complex Unfavorable 84821 Morristown silt loam Favorable 71823 Schuline silt loam Favorable 86824 Swanwick silt loam Favorable 82825 Lenzburg silt loam, acid substratum Favorable 59826 Orthents, silty, acid substratum Crop yield data not available827 Broadwell-Onarga complex Favorable 112828 Broadwell-Sparta complex Favorable 106829 Biggsville-Mannon silt loams Favorable 123830 Landfill Crop yield data not available832 Menfro - Clarksville complex Favorable 86833 Menfro - Goss complex Favorable 87834 Wellston - Westmore silt loams Unfavorable 83835 Earthen dam Crop yield data not available836 Hamburg - Lacrescent complex Favorable 86837 Limestone rockland - Lacrescent complex Crop yield data not available838 Fayette - Goss complex Favorable 88840 Zurick and Ozaukee silt loams Favorable 101841 Carmi - Westland complex Favorable 99843 Bonnie and Petrolia soils Favorable 101844 Ava-Blair complex Unfavorable 90845 Darwin and Jacob silty clays Favorable 89846 Kamak and Cape silty clays Favorable 91847 Fluvaquents - Orthents complex Crop yield data not available848 Drummer - Barrington - Mundelein complex Favorable 123849 Milford - Martinton complex Favorable 114
Revised January 1, 2012
IL map symbol Soil type name Subsoil rooting
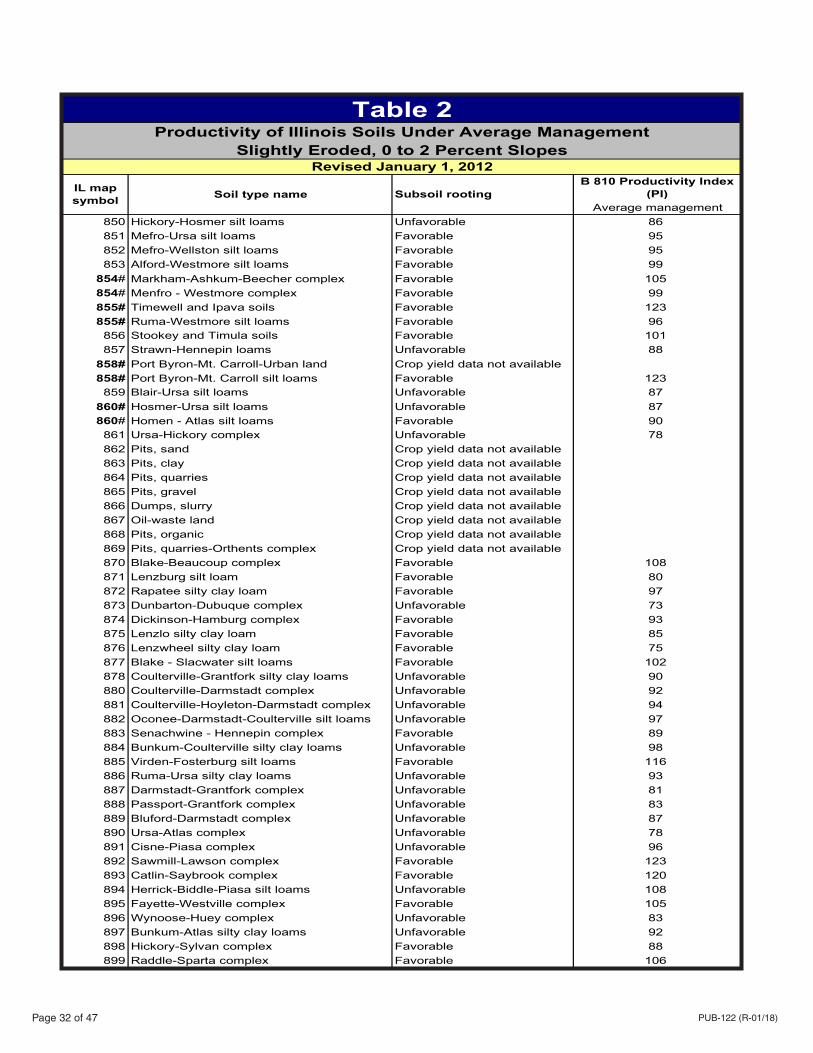
PUB-122 (R-01/18)Page 32 of 47
Instructions for Farmland Assessments
Table 2Productivity of Illinois Soils Under Average Management
Slightly Eroded, 0 to 2 Percent Slopes
B 810 Productivity Index (PI)
Average management850 Hickory-Hosmer silt loams Unfavorable 86851 Mefro-Ursa silt loams Favorable 95852 Mefro-Wellston silt loams Favorable 95853 Alford-Westmore silt loams Favorable 99
854# Markham-Ashkum-Beecher complex Favorable 105 854# Menfro - Westmore complex Favorable 99 855# Timewell and Ipava soils Favorable 123 855# Ruma-Westmore silt loams Favorable 96
856 Stookey and Timula soils Favorable 101857 Strawn-Hennepin loams Unfavorable 88
858# Port Byron-Mt. Carroll-Urban land Crop yield data not available 858# Port Byron-Mt. Carroll silt loams Favorable 123
859 Blair-Ursa silt loams Unfavorable 87 860# Hosmer-Ursa silt loams Unfavorable 87 860# Homen - Atlas silt loams Favorable 90
861 Ursa-Hickory complex Unfavorable 78862 Pits, sand Crop yield data not available863 Pits, clay Crop yield data not available864 Pits, quarries Crop yield data not available865 Pits, gravel Crop yield data not available866 Dumps, slurry Crop yield data not available867 Oil-waste land Crop yield data not available868 Pits, organic Crop yield data not available869 Pits, quarries-Orthents complex Crop yield data not available870 Blake-Beaucoup complex Favorable 108871 Lenzburg silt loam Favorable 80872 Rapatee silty clay loam Favorable 97873 Dunbarton-Dubuque complex Unfavorable 73874 Dickinson-Hamburg complex Favorable 93875 Lenzlo silty clay loam Favorable 85876 Lenzwheel silty clay loam Favorable 75877 Blake - Slacwater silt loams Favorable 102878 Coulterville-Grantfork silty clay loams Unfavorable 90880 Coulterville-Darmstadt complex Unfavorable 92881 Coulterville-Hoyleton-Darmstadt complex Unfavorable 94882 Oconee-Darmstadt-Coulterville silt loams Unfavorable 97883 Senachwine - Hennepin complex Favorable 89884 Bunkum-Coulterville silty clay loams Unfavorable 98885 Virden-Fosterburg silt loams Favorable 116886 Ruma-Ursa silty clay loams Unfavorable 93887 Darmstadt-Grantfork complex Unfavorable 81888 Passport-Grantfork complex Unfavorable 83889 Bluford-Darmstadt complex Unfavorable 87890 Ursa-Atlas complex Unfavorable 78891 Cisne-Piasa complex Unfavorable 96892 Sawmill-Lawson complex Favorable 123893 Catlin-Saybrook complex Favorable 120894 Herrick-Biddle-Piasa silt loams Unfavorable 108895 Fayette-Westville complex Favorable 105896 Wynoose-Huey complex Unfavorable 83897 Bunkum-Atlas silty clay loams Unfavorable 92898 Hickory-Sylvan complex Favorable 88899 Raddle-Sparta complex Favorable 106
Revised January 1, 2012
IL map symbol Soil type name Subsoil rooting
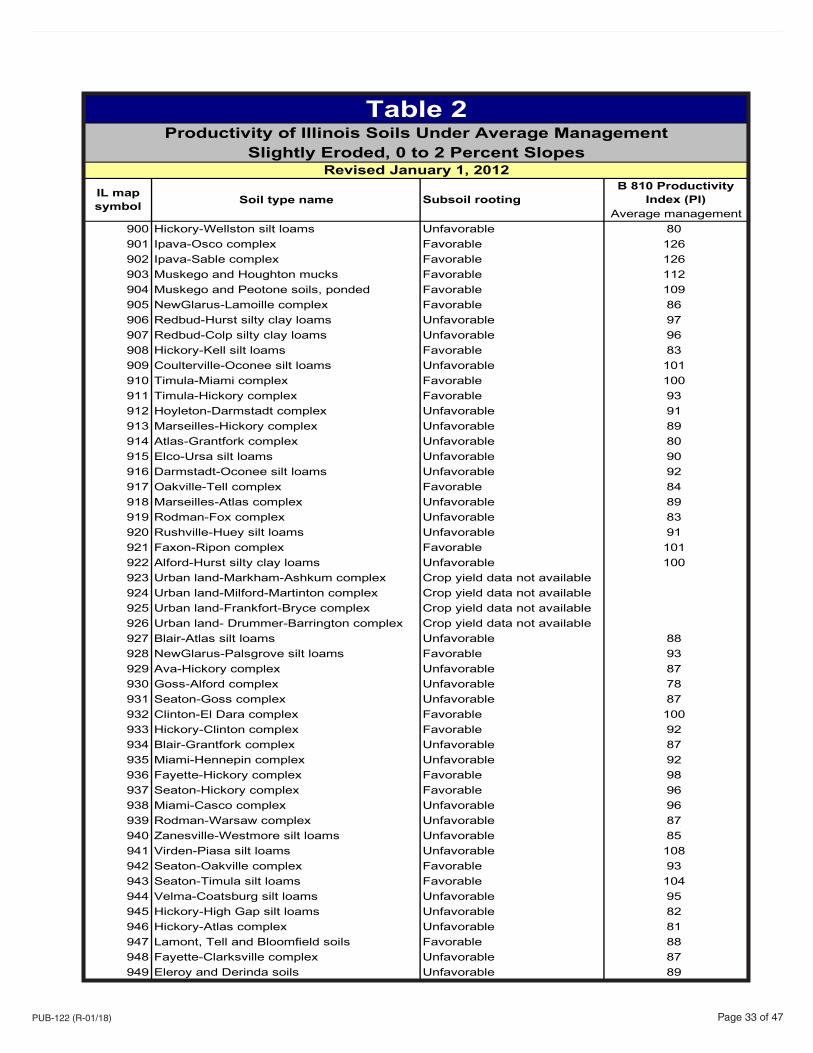
PUB-122 (R-01/18)
Instructions for Farmland Assessments
Page 33 of 47
Table 2Productivity of Illinois Soils Under Average Management
Slightly Eroded, 0 to 2 Percent Slopes
B 810 Productivity Index (PI)
Average management900 Hickory-Wellston silt loams Unfavorable 80901 Ipava-Osco complex Favorable 126902 Ipava-Sable complex Favorable 126903 Muskego and Houghton mucks Favorable 112904 Muskego and Peotone soils, ponded Favorable 109905 NewGlarus-Lamoille complex Favorable 86906 Redbud-Hurst silty clay loams Unfavorable 97907 Redbud-Colp silty clay loams Unfavorable 96908 Hickory-Kell silt loams Favorable 83909 Coulterville-Oconee silt loams Unfavorable 101910 Timula-Miami complex Favorable 100911 Timula-Hickory complex Favorable 93912 Hoyleton-Darmstadt complex Unfavorable 91913 Marseilles-Hickory complex Unfavorable 89914 Atlas-Grantfork complex Unfavorable 80915 Elco-Ursa silt loams Unfavorable 90916 Darmstadt-Oconee silt loams Unfavorable 92917 Oakville-Tell complex Favorable 84918 Marseilles-Atlas complex Unfavorable 89919 Rodman-Fox complex Unfavorable 83920 Rushville-Huey silt loams Unfavorable 91921 Faxon-Ripon complex Favorable 101922 Alford-Hurst silty clay loams Unfavorable 100923 Urban land-Markham-Ashkum complex Crop yield data not available924 Urban land-Milford-Martinton complex Crop yield data not available925 Urban land-Frankfort-Bryce complex Crop yield data not available926 Urban land- Drummer-Barrington complex Crop yield data not available927 Blair-Atlas silt loams Unfavorable 88928 NewGlarus-Palsgrove silt loams Favorable 93929 Ava-Hickory complex Unfavorable 87930 Goss-Alford complex Unfavorable 78931 Seaton-Goss complex Unfavorable 87932 Clinton-El Dara complex Favorable 100933 Hickory-Clinton complex Favorable 92934 Blair-Grantfork complex Unfavorable 87935 Miami-Hennepin complex Unfavorable 92936 Fayette-Hickory complex Favorable 98937 Seaton-Hickory complex Favorable 96938 Miami-Casco complex Unfavorable 96939 Rodman-Warsaw complex Unfavorable 87940 Zanesville-Westmore silt loams Unfavorable 85941 Virden-Piasa silt loams Unfavorable 108942 Seaton-Oakville complex Favorable 93943 Seaton-Timula silt loams Favorable 104944 Velma-Coatsburg silt loams Unfavorable 95945 Hickory-High Gap silt loams Unfavorable 82946 Hickory-Atlas complex Unfavorable 81947 Lamont, Tell and Bloomfield soils Favorable 88948 Fayette-Clarksville complex Unfavorable 87949 Eleroy and Derinda soils Unfavorable 89
Revised January 1, 2012
IL map symbol Soil type name Subsoil rooting

PUB-122 (R-01/18)Page 34 of 47
Instructions for Farmland Assessments
Table 2Productivity of Illinois Soils Under Average Management
Slightly Eroded, 0 to 2 Percent Slopes
B 810 Productivity Index (PI)
Average management950 Dubuque and Palsgrove soils Unfavorable 88951 Palsgrove and Woodbine soils Favorable 90952 Tell-Lamont complex Favorable 95953 Hosmer-Lax silt loams Unfavorable 88954 Alford-Baxter complex Favorable 94955 Muskingum and Berks soils Unfavorable 59956 Brandon and Saffell soils Unfavorable 83957 Elco-Atlas silt loams Unfavorable 91958 Hickory and Hennepin soils Unfavorable 81959 Strawn-Chute complex Favorable 82960 Hickory-Sylvan-Fayette silt loams Favorable 92961 Burkhardt-Saude complex Favorable 82962 Sylvan-Bold complex Favorable 98963 Hickory and Sylvan soils Favorable 88
964# Hennepin and Miami soils Unfavorable 88 964# Miami and Hennepin soils Favorable 92
965 Tallula-Bold silt loams Favorable 109966 Miami-Russell silt loams Favorable 101967 Hickory-Gosport complex Unfavorable 79968 Birkbeck-Miami silt loams Favorable 105969 Rodman-Casco complex Unfavorable 81970 Keller-Coatsburg complex Unfavorable 95971 Fishhook-Atlas complex Unfavorable 84972 Casco-Fox complex Unfavorable 93973 Dubuque and Dunbarton soils Unfavorable 78974 Dickinson-Onarga complex Favorable 94975 Alvin-Lamont complex Favorable 93976 Neotoma-Rock outcrop complex Crop yield data not available977 Neotoma-Wellston complex Unfavorable 74978 Wauconda and Beecher silt loams Favorable 111979 Grays and Markham silt loams Favorable 106980 Zurich and Morley silt loams Favorable 100981 Wauconda and Frankfort silt loams Unfavorable 106982 Aptakisic and Nappanee silt loams Unfavorable 92983 Zurich and Nappanee silt loams Unfavorable 94984 Barrington and Varna silt loams Favorable 110985 Alford-Bold complex Favorable 103986 Wellston-Berks complex Unfavorable 70987 Atlas-Grantfork variant complex Unfavorable 77988 Westmore-Neotoma complex Unfavorable 80989 Mundelein and Elliott soils Favorable 118990 Stookey-Bodine complex Unfavorable 90991 Cisne-Huey complex Unfavorable 90992 Hoyleton-Tamalco complex Unfavorable 90993 Cowden-Piasa complex Unfavorable 99994 Oconee-Tamalco complex Unfavorable 96995 Herrick-Piasa complex Unfavorable 107996 Velma-Walshville complex Unfavorable 93997 Hickory-Hennepin complex Unfavorable 81998 Hickory-Negley complex Favorable 86999 Alford-Hickory complex Favorable 97
# Duplicate IL Map Symbols are in Bold Print (use the appropriate soil type name)+ Overwash phase
Revised January 1, 2012
IL map symbol Soil type name Subsoil rooting

PUB-122 (R-01/18)
Instructions for Farmland Assessments
Page 35 of 47
Table 3
PUB-122 (R-01/18)Page 36 of 47
Instructions for Farmland Assessments
Assessment of Farm Homesites and Rural Residential LandA farm homesite is the part of the farm parcel used for resi-dential purposes and includes the lawn and land on which the residence and garage are situated. Areas in gardens, non-commercial orchards, and similar uses of land are also included.
Rural residential land may include farmland that is inciden-tal to the primary residential use. It is generally comparable in value to the farm homesite. Both are subject to the state equalization factor and both should be assessed at the same percentage of market value as urban property. Whenever possible, use the sales comparison approach to value farm homesites and rural residential land.
Assessment of farm residencesAssess farm residences according to market value in the same manner as urban residences are assessed. Refer to the Residential section of the Publication 123, Instructions for Residential and Condominium Schedules for valuation of farm residences.
Assessment of farm buildingsThe valuation of farm buildings is the final component in the assessment of farm real estate. The law requires farm build-ings, which contribute in whole or in part to the operation of the farm, to be assessed as part of the farm. They are valued upon the current use of those buildings and their respective contribution to the productivity of the farm. Farm buildings are assessed at 331/3 percent of their contributory value. The state equalization factor is not applied to farm buildings.
Valuation of farm buildings based upon contribution relies on theory as well as reality. Farm buildings are usually an integral part of the farm. When farms are sold, the land and improvements are valued together. The portion of this value attributable to farm buildings depends upon the degree to which they contribute to farming operations. Some farm build-ings, even though they are in good physical condition, may play a minor role in the operation of the farm and have little value. These same buildings on another farm may be vitally important to the farming operation. The value of the farm buildings in these two instances is different.
The sales comparison, or market approach, and income ap-proach to value are difficult to apply. The sales comparison, or market approach, is inadequate because farm buildings are rarely sold in isolation. The land and buildings are consid-ered together in valuing the farm. The same problem arises in using the income approach. It is difficult to attribute a por-tion of the farm income solely to the buildings.
Value must be based on cost. This entails a third problem — depreciation. Since most farm buildings are constructed in the hopes of increasing efficiency or productivity, the unde-preciated cost of the building will approximate market value
when the building is new. The undepreciated cost of the build-ing may be quite different than the value as the building ages. This difference between actual cost of replacement and the value of the building is depreciation.
Replacement cost is the cost of replacing an existing struc-ture with an equally desirable structure having similar, if not the same, utility. The difference between replacement cost and reproduction cost is essentially that reproduction cost is the cost of constructing a replica of the building with the same design, materials, and quality of workmanship, while replace-ment cost is the cost of a contemporary building of equal utility. The concept of replacement cost evolves from the Prin-ciple of Substitution that value of property is no more than the cost of acquiring an equally desirable substitute. Replace-ment cost is the upper limit of building value.
Depreciation is the difference between the replacement cost new (RCN) and current value. Depreciation can be in the form of physical deterioration, functional obsolescence, or eco-nomic obsolescence.
Physical deterioration is a loss in the physical ability of a building to withstand normal use. Deterioration results from use, wear and tear, structural defects, and decay. Physical depreciation is observable and identifiable.
Functional obsolescence is a loss in value due to charac-teristics of the building which cause a failure of the building to serve the purpose for which it was intended. Inadequacy may result from poor design, surplus capacity, and changes in farming techniques. Functional inadequacy causes a loss in desirability and usefulness.
Economic obsolescence is a loss in value due to changes in the economic environment of the farm. Economic obso-lescence results from external influences such as land-use changes, government regulations, and farm market condi-tions. Economic obsolescence causes loss in desirability and utility.
Depreciation reflects loss in value due to all possible factors. Value of contribution to productivity can be determined by deducting all depreciation from replacement costs. This value will reflect such factors as improper design (functional obso-lescence), neglect of repairs (physical deterioration), and more stringent government regulations (economic obsolescence).
Estimation of farm buildings’ contribution to the operation of the farm first requires a thorough inspection of the buildings. The inspection should include the structural components of the buildings and their functional capacity. Record the follow-ing structural details:
• measurements,
• excavation,
• foundation,
• framing exterior walls,
• floors,
• roof,
• interior partitions,

PUB-122 (R-01/18)
Instructions for Farmland Assessments
Page 37 of 47
• electric wiring,
• plumbing,
• heating,
• ventilation,
• built-in equipment, and
• any other permanent features.
Functional features to note include:
• relative location,
• current use,
• capacity (e.g. too large, too small),
• design, and
• other possible uses.
Physical deterioration is observed during the inspection of the property. Economic obsolescence will require investigation into such factors as government regulation changes, current market fluctuations, and any land use changes of the sur-rounding property.
The cost tables in this section are provided as an aid in the development of replacement costs of typical farm buildings. The application of the cost tables is much the same as the cost tables in other sections of the manual. Select the costs for a comparable building and adjust this cost for variations from the model buildings.
To estimate the farm building’s contribution to productivity of the farm, follow the procedure below.
Step 1
Estimate RCN of the building, in its current use.
• Measure the square feet of area being used.
• Decide the type of structure that provides the same util-ity for the current use.
• Multiply the square foot area by the replacement cost per square foot for a building of the same utility.
This step in the procedure allows for both function and economic depreciation. Remember that the existing type of structure may well provide the highest utility.
Step 2
Estimate the remaining physical life of the existing structure. This step allows for physical depreciation.
Step 3
Compute remaining economic life (REL) factor.
• Select a typical life expectancy figure from the typical life expectancies table on Page 40 for the existing structure.
• Divide the remaining physical life by typical life expec-tancy, giving REL.
Step 4
Multiply the RCN by the REL factor to find the value of the farm building according to its contribution to the productivity of the farm. Remember, this procedure does not apply to farm residences.

PUB-122 (R-01/18)Page 38 of 47
Instructions for Farmland Assessments
SummarySince the passage of the Farmland Assessment Law (P.A. 82-121) in 1981, the assessment of farmland has been based upon net income to the farmland as determined by land productivity and use. Land use is determined through the use of aerial photographs and visual inspection. Land productiv-ity is determined through the use of soil maps, productivity indexes, and all other available data.
Farmland is separated into the four categories — cropland, permanent pasture, other farmland, and wasteland. Cropland, permanent pasture, and other farmland are assessed based upon PI which involves the identification of soil types; selec-tion of PIs for average level management; adjustment of PIs for slope, erosion, and subsoil conditions; measurement of areas of soil types; selection of per acre assessed values for individual soil types or for weighted PIs from the table of val-ues certified each year by the Illinois Department of Revenue; adjustment of assessed values for land use; and summation of assessed values for all farmland. Wasteland is assessed based on its contributory value.
Rural residential land and farm homesites are appraised according to market value. Customary appraisal procedures, such as the sales comparison, or market, approach and the income approach, are used in the valuation of these types of rural land. Farm residences are valued as part of the farm, using the same methodology as urban residences.
Farm buildings are valued according to current use and contribution to the productivity of the farm. All buildings are inspected, measured, and sketched on a property record card (PRC). In most cases, they are shown in the sketch space in their proper relative location to each other. Buildings are num-bered consecutively with the number designation carried over to a summary of buildings, types, sizes, general descriptions, and tabulation of values.
Building replacement costs are computed from cost sched-ules developed for each type of structure and used uniformly throughout the jurisdiction. Depreciation allowances are carefully determined based upon the condition, desirability, and degree of usefulness of each structure. The total of all building valuations should represent the value which their presence contributes to the productivity of the farm.

PUB-122 (R-01/18)
Instructions for Farmland Assessments
Page 39 of 47
General Purpose Barns
Base specifications; Foundation — concrete or masonry piers; Roof — double pitch gable style; Floor — dirt; Electric and wiring — minimal service; Plumbing — two or less cold water outlets; Interior construction — two or less stalls and portioned feed room.
Base price+ OR - for each eave height variance
Base costs reflect the following basic exterior walls: wood frame, steel frame, and pole frame are board and batten, wood siding or standard gauge corrugated metal. Masonry barns include con-crete block and average quality brick.
Continuous concrete foundations and footings 1.64Concrete floor 3.21No electricity -0.56+ or - for no water service or extensive water service 0.49
One-story barns (per SFFA)Based on 10’ height at eaves
Construction type Wood Steel Pole frame Masonry frame frame
$26.50 $25.97 $23.75 $23.40 .51 .50 .46 .45
Gambrel style roof 3.81Gothic style roof 4.50Wood floor loft (per SF loft area) 7.50
Adjustments
Size adjustments Floor Factor Floor Factor Floor Factor Less than 1,000 1.000 4,000 .870 7,000 .800 2,000 .965 4,400 .850 8,000 .780 2,400 .930 5,000 .840 9,000 .765 3,000 .905 5,600 .830 over 10,000 .750 3,600 .890 6,000 .810
Two-story barns (per total SFFA)Based on 10’ average floor height
Construction type Wood Steel Pole frame Masonry frame frame
$20.37 $19.72 $18.33 $17.36 .46 .44 .36 .38
Gambrel style roof 1.91Gothic style roof 2.25Wood floor loft (per SF loft area) 7.50
Adjustments
Base specifications; Foundation — concrete or masonry piers; Roof — double pitch gable style; Floor — dirt; Second floor — wood planks over wood frame; Electric and wiring — minimal ser-vice; Plumbing — two or less cold water outlets; Interior construc-tion — two or less stalls and portioned feed room.
Base price+ OR - for each eave height variance
Base costs reflect the following basic exterior walls: wood frame, steel frame, and pole frame are board and batten, wood siding or standard gauge corrugated metal. Masonry barns include con-crete block and average quality brick.
Continuous concrete foundations and footings .82Concrete floor 1.62No electricity -0.56+ or - for no water service or extensive water service 0.49
Size adjustments Floor Factor Floor Factor Floor Factor Less than 2,000 1.000 5,600 .830 10,000 .750 3,000 .905 6,000 .810 12,000 .746 4,000 .870 7,000 .800 14,000 .726 4,400 .850 8.000 .780 over 15,000 .719 5,000 .840 9,000 .765

PUB-122 (R-01/18)Page 40 of 47
Instructions for Farmland Assessments
Typical life expectancies
Grain bins .......................................................30 Silos ................................................................30 Barns ..............................................................30 Stables ...........................................................30 Poultry houses ................................................20 Confinement barns .........................................20 Equipment storage sheds ...............................20 Miscellaneous sheds ......................................15 Pole buildings .................................................20 Dairy barns .....................................................30 Corn cribs .......................................................15
Sample Appraisal - Barn
Subject – Two-story barnGrade – CRemaining physical life – 15 yearsSpecifications – 34’ x 60’ x 20’ height to eavesFoundation – concrete wall and footingsWalls – Vertical wood siding on wood framing, wood sash windows, and wood batten doorsFloor – Concrete
Step 1 — Base square foot price from schedule $ 20.37
Step 2 — Base price adjustments Foundation, continuous concrete wall 0.82 Floors main floor concrete 1.62 Electricity and wiring, no service -0.56 Total $ 22.25Step 3 — Wall height adjustment Base price includes a 10’ avg. story height, subject 20’ two-story, no adjustment Step 4 — Size adjustment percentage Calculate SFFA. 34’ X 60’ X 2 = 4,080 SF Use the size adjustments table to find the adjustment percentage for 4,080 SF x .870 Total base price $ 19.36Step 5 — Replacement cost new Multiply total base price by the SFFA to obtain replacement cost new x 4,080
$ 78,988.80
Step 6 — REL factor
Divide the remaining physical life by the typical life from the Typical life expectancy table.
15 years ÷ 30 years = 0.50 REL factor
Step 7 — Full value of the building
Multiply the REL factor by the RCN from Step 5 to find the full value x 0.50
$ 39,494.40

PUB-122 (R-01/18)
Instructions for Farmland Assessments
Page 41 of 47
Pole frame buildings Base price is for pole buildings with wood poles 15’ to 20’ o.c., wood truss roof, wood or metal siding, earth floor, one large sliding door, one service door, and minimum electric. Eave Price per SF of ground area Type height 600 850 1,000 1,200 1,500 2,000 2,500 3,000 4,000 5,000 6,000 7,000 8,000 9,000 10,000 Four 8’ 14.15 13.05 12.05 11.55 11.75 11.10 10.25 10.10 9.40 9.20 8.65 8.50 8.45 8.40 8.20 sides 10’ 14.75 13.60 12.60 12.05 11.80 11.35 10.70 10.55 9.80 9.60 9.10 8.80 8.75 8.75 8.50 closed 12’ 15.30 14.10 13.05 12.50 12.25 11.85 11.10 10.90 10.10 10.00 9.45 9.25 9.10 9.10 8.80 14’ 15.85 14.60 13.50 12.95 12.65 12.20 11.50 11.30 10.45 10.30 9.75 9.50 9.45 9.40 9.10 16’ 16.50 15.15 14.05 13.40 13.20 12.70 12.05 11.75 10.90 10.70 10.05 9.80 9.70 9.65 9.45 18’ 17.65 15.60 15.30 14.70 14.25 13.50 12.70 12.25 12.00 11.60 11.00 10.60 10.15 10.10 9.75
One 8’ 11.75 10.95 10.25 10.15 9.95 9.90 8.95 8.85 8.55 8.10 7.60 7.55 7.50 7.45 7.40 side 10’ 12.25 11.40 10.70 10.35 10.30 10.20 9.30 9.25 8.90 8.45 8.00 7.90 7.85 7.85 7.65 open 12’ 12.70 11.85 11.10 10.75 10.70 10.65 9.45 9.40 9.20 8.90 8.30 8.10 8.00 8.00 7.90 14’ 13.15 12.25 11.50 11.15 11.10 11.00 10.30 9.95 9.50 9.10 8.60 8.45 8.35 8.30 8.20 16’ 13.70 12.70 11.95 11.50 11.45 11.30 10.55 10.35 9.90 9.40 8.85 8.80 8.75 8.70 8.50 18’ 14.65 13.10 13.00 12.60 12.55 12.15 10.80 10.75 10.60 10.20 9.70 9.55 9.55 9.00 8.80
Four 8’ 6.40 6.40 6.40 6.20 6.20 6.20 6.05 6.05 6.05 5.85 5.85 5.85 5.70 5.70 5.70 sides 10’ 6.65 6.65 6.65 6.45 6.45 6.45 6.20 6.20 6.20 6.15 6.15 6.15 5.95 5.95 5.95 open 12’ 6.90 6.90 6.90 6.60 6.60 6.60 6.40 6.40 6.40 6.30 6.30 6.30 6.10 6.10 6.10 14’ 7.15 7.15 7.15 6.85 6.85 6.85 6.70 6.70 6.70 6.55 6.55 6.55 6.30 6.30 6.30 16’ 7.10 7.10 7.10 7.50 7.50 7.50 7.40 7.40 7.40 7.35 7.35 7.35 6.55 6.55 6.55 18’ 7.95 7.95 7.95 7.75 7.75 7.75 7.55 7.55 7.55 7.10 7.10 7.10 6.85 6.85 6.85
Floor adjustments based on per SF Misc. adjustments based on Door adjustments based on SF floor area building SF of door area Concrete floor $3.80 Insulation $0.95 Extra sliding door $15.50 Crushed rock $0.67 No electric $0.62 Service door $45.00 Asphalt floor $2.38 Water service $0.55 Space heaters $1.20
Lean-tos Base costs include: Pier foundation, vertical wall sid-ing or corrugated metal walls; shed type roof of single pitch; earth floor, minimum electric. Walls from 8’ to 12’ rise average 10’ at center.
SF area Wood frame Pole frame 240 $12.85 $9.30 300 11.20 8.20 400 11.10 8.10 500 10.95 8.00 600 10.65 7.75 800 10.35 7.55 1,000 10.00 7.30 1,200 9.40 6.85 1,400 9.00 6.60
Adjustments to base costsConcrete floor and foundation $2.10No electric - 0.47Height adjustment for each foot avg. 0.20
Wood frame corn cribs Foundation — Concrete walls and footings; Walls — Spaced boards on wood frame; Roof — Gable style roof with composition or wood shingles; Drive through; No mechanicals.
Wood spaced SF boards on Wire mesh ground area wood frame on wood frame
80 $36.35 100 35.55 150 28.25 175 26.80 200 24.15 250 23.35 300 $49.05 22.80 400 43.50 22.15 500 37.85 20.95 700 33.05 1,000 32.15 1,500 30.80 2,000 27.35 2,500 23.15
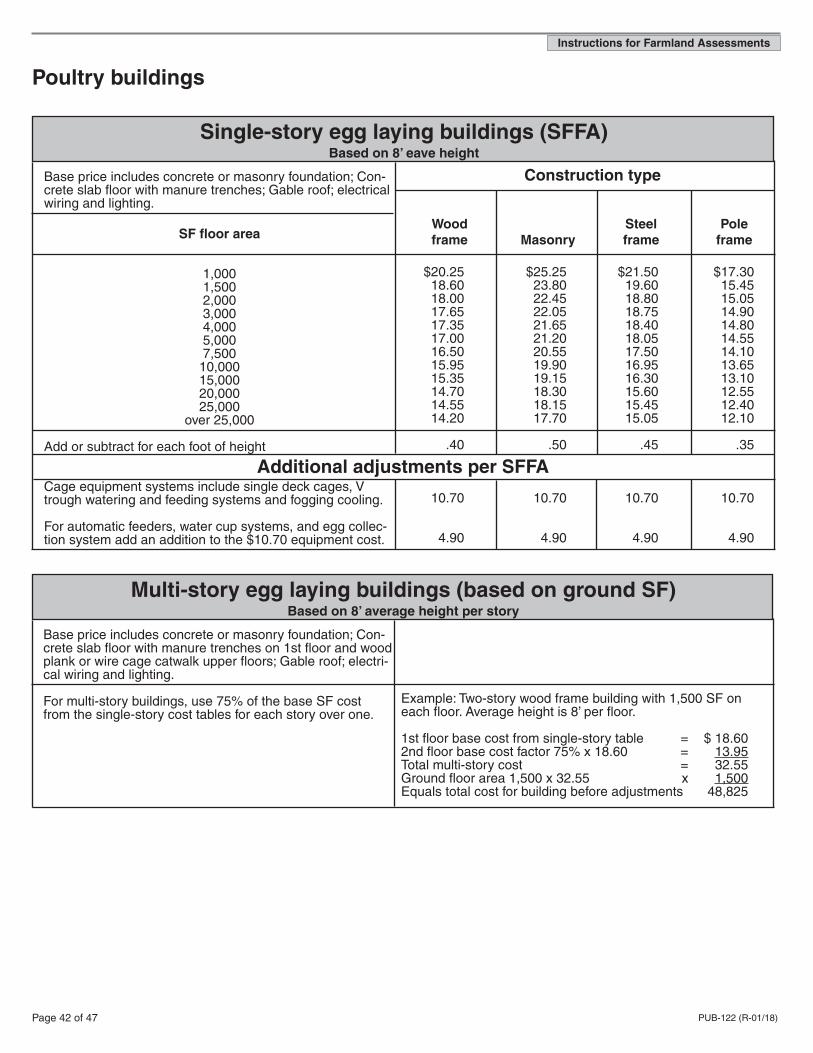
PUB-122 (R-01/18)Page 42 of 47
Instructions for Farmland Assessments
Poultry buildings
Base price includes concrete or masonry foundation; Con-crete slab floor with manure trenches; Gable roof; electrical wiring and lighting.
SF floor area
1,0001,5002,0003,0004,0005,0007,50010,00015,00020,00025,000
over 25,000
Add or subtract for each foot of height
Cage equipment systems include single deck cages, V trough watering and feeding systems and fogging cooling.
For automatic feeders, water cup systems, and egg collec-tion system add an addition to the $10.70 equipment cost.
Single-story egg laying buildings (SFFA)Based on 8’ eave height
Construction type Wood Steel Pole frame Masonry frame frame
$20.25 $25.25 $21.50 $17.30 18.60 23.80 19.60 15.45 18.00 22.45 18.80 15.05 17.65 22.05 18.75 14.90 17.35 21.65 18.40 14.80 17.00 21.20 18.05 14.55 16.50 20.55 17.50 14.10 15.95 19.90 16.95 13.65 15.35 19.15 16.30 13.10 14.70 18.30 15.60 12.55 14.55 18.15 15.45 12.40 14.20 17.70 15.05 12.10
.40 .50 .45 .35
10.70 10.70 10.70 10.70
4.90 4.90 4.90 4.90
Additional adjustments per SFFA
Base price includes concrete or masonry foundation; Con-crete slab floor with manure trenches on 1st floor and wood plank or wire cage catwalk upper floors; Gable roof; electri-cal wiring and lighting.
For multi-story buildings, use 75% of the base SF cost from the single-story cost tables for each story over one.
Multi-story egg laying buildings (based on ground SF)Based on 8’ average height per story
Example: Two-story wood frame building with 1,500 SF on each floor. Average height is 8’ per floor.
1st floor base cost from single-story table = $ 18.602nd floor base cost factor 75% x 18.60 = 13.95Total multi-story cost = 32.55Ground floor area 1,500 x 32.55 x 1,500Equals total cost for building before adjustments 48,825

PUB-122 (R-01/18)
Instructions for Farmland Assessments
Page 43 of 47
Single-story broiler building (SFFA)Based on 8’ eave height
Additional adjustments per SFFA
Base price includes dirt floor, galvanized metal or wood sid-ing on frame, partial curtain wall, insulated walls and ceil-ing, gable roof, electrical wiring and lighting, water service,and some subdivision.
SF floor area
1,0001,5002,0003,0004,0005,0007,50010,00015,00020,00025,00030,00040,000
over 40,000
Add or subtract for each foot of height
Equipment systems include feeders, waterers, suspended infrared heaters, curtains, automatic ventilation control.
Construction type
Steel frame Pole frame
$13.60 $12.65 12.20 11.00 12.10 10.90 11.85 10.70 11.65 10.50 11.40 10.30 11.10 10.15 10.70 10.00 10.30 9.65 9.90 9.30 9.80 8.90 9.75 8.80 9.65 8.65 9.55 8.60 .23 .21
3.75 3.75
Concrete liquid manure tanks Size Gallon Cost cubic feet capacity each 4,000 30,000 $16,160 8,000 60,000 26,560 12,000 90,000 43,440 16,000 120,000 56,400
Steel frame round wire mesh corn crib
Height Bushel Cost Diameter to eave capacity each 10’ 12’ 315 $1,010 16’ 419 1,310 20’ 524 1,610
12’ 12’ 452 1,405 16’ 603 1,835 20’ 754 2,265 24’ 905 2,690 14’ 16’ 821 2,450 20’ 1,026 3,030 24’ 1,232 3,605
16’ 16’ 1,072 3,150 20’ 1,340 3,900 24’ 1,609 4,660 28’ 1,876 5,415Cylindrical wire mesh with metal cone roof, steel frame, concrete slab.

PUB-122 (R-01/18)Page 44 of 47
Instructions for Farmland AssessmentsConfinement buildings
Base price includes concrete or masonry foundation; Con-crete slab floor; Gable roof; Electrical wiring and lighting; Water service; Insulation, vents, and feed storage room.
SF floor area
8001,0001,5002,0002,4003,0004,0005,0006,0008,000
10,00012,00015,00020,00025,000
30,000 and higher
Add or subtract for each foot of height
Construction type Wood Steel Pole frame Masonry frame frame
$35.40 33.85 31.05 30.15 29.60 29.00 28.40 27.80 27.50 27.25 27.05 26.85 26.75 26.65 26.55 26.45
.62 .70 .60 .55 Adjustments
Swine farrowing barnsBased on 10’ eave height
$40.80 39.00 35.80 34.80 34.10 33.45 32.75 32.10 31.75 31.40 31.15 30.95 30.85 30.70 30.60 30.50
$34.95 33.30 30.55 29.70 29.10 28.50 27.95 27.35 27.10 26.75 26.60 26.40 26.30 26.20 26.10 26.00
$34.95 33.30 30.55 29.70 29.10 28.50 27.95 27.35 27.10 26.75 26.60 26.40 26.30 26.20 26.10 26.00
Concrete slotted floor 5.55 5.55 5.55 5.55Equipment of crates, waterers, and feeder per SFFA 6.60 6.60 6.60 6.60Pit, 6’ deep per SF 13.20 13.20 13.20 13.20
Base price includes concrete or masonry foundation; Con-crete slab floor; Gable roof; Electrical wiring and lighting; Water service; Insulation, vents, and feed storage room.
SF floor area
8001,0001,5002,0002,4003,0004,0005,0006,0008,000
10,00012,00015,00020,00025,000
30,000 and higher
Add or subtract for each foot of height
Construction type Wood Steel Pole frame Masonry frame frame
$26.35 25.20 23.10 22.45 22.00 21.60 21.15 20.70 20.50 20.25 20.10 20.00 19.90 19.85 19.75 19.70
.46 .55 .45 .43 Adjustments
Swine finishing barnsBased on 10’ eave height
$25.80 24.65 22.65 22.00 21.55 21.15 20.70 20.30 20.05 19.85 19.70 19.55 19.50 19.40 19.35 19.25
Concrete slotted floor 6.90 6.90 6.90 6.90Equipment of crates, waterers, and feeder per SFFA 5.55 5.55 5.55 5.55Pit, 6’ deep per SF 13.20 13.20 13.20 13.20
$31.70 30.30 27.80 27.00 26.50 25.95 25.45 24.90 24.65 24.40 24.20 24.05 23.95 23.85 23.75 23.65
$ 24.30 23.25 21.35 20.75 20.30 19.95 19.50 19.10 18.95 18.70 18.55 18.45 18.35 18.30 18.25 18.15
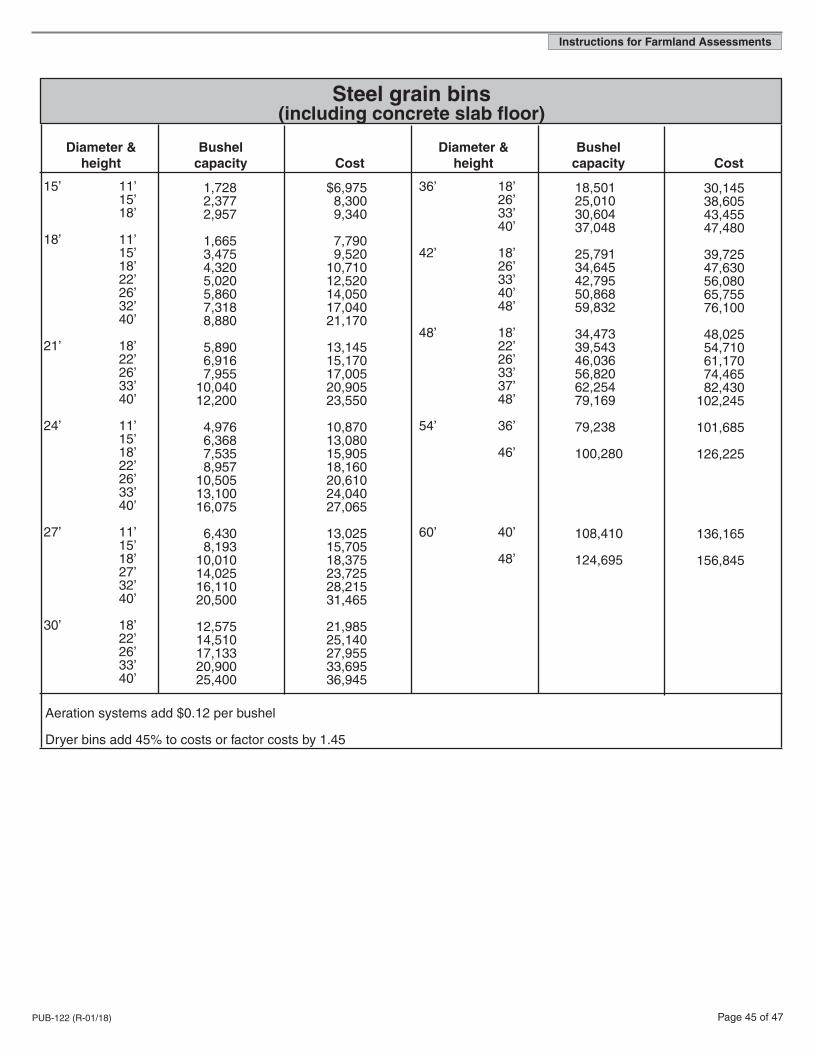
PUB-122 (R-01/18)
Instructions for Farmland Assessments
Page 45 of 47
15’ 11’ 15’ 18’
18’ 11’ 15’ 18’ 22’ 26’ 32’ 40’
21’ 18’ 22’ 26’ 33’ 40’
24’ 11’ 15’ 18’ 22’ 26’ 33’ 40’
27’ 11’ 15’ 18’ 27’ 32’ 40’
30’ 18’ 22’ 26’ 33’ 40’
Steel grain bins(including concrete slab floor)
Diameter & Bushel Diameter & Bushel height capacity Cost height capacity Cost
1,728 2,377 2,957
1,665 3,475 4,320 5,020 5,860 7,318 8,880 5,890 6,916 7,955 10,040 12,200
4,976 6,368 7,535 8,957 10,505 13,100 16,075
6,430 8,193 10,010 14,025 16,110 20,500
12,575 14,510 17,133 20,900 25,400
$6,975 8,300 9,340
7,790 9,520 10,710 12,520 14,050 17,040 21,170 13,145 15,170 17,005 20,905 23,550 10,870 13,080 15,905 18,160 20,610 24,040 27,065
13,025 15,705 18,375 23,725 28,215 31,465 21,985 25,140 27,955 33,695 36,945
36’ 18’ 26’ 33’ 40’
42’ 18’ 26’ 33’ 40’ 48’
48’ 18’ 22’ 26’ 33’ 37’ 48’
54’ 36’ 46’
60’ 40’
48’
18,501 25,010 30,604 37,048
25,791 34,645 42,795 50,868 59,832
34,473 39,543 46,036 56,820 62,254 79,169
79,238
100,280
108,410
124,695
30,145 38,605 43,455 47,480
39,725 47,630 56,080 65,755 76,100
48,025 54,710 61,170 74,465 82,430 102,245
101,685
126,225
136,165
156,845
Aeration systems add $0.12 per bushel
Dryer bins add 45% to costs or factor costs by 1.45

PUB-122 (R-01/18)Page 46 of 47
Instructions for Farmland Assessments
Steel Silos(glass lined)
Includes concrete foundation, steel roof, breather bag, ladder, and platform.
Diameter Height Cost 14’ 30’ $36,600 40’ 43,370 50’ 45,600Add for sweep arm auger 6,610 17’ 30’ 50,755 40’ 56,875 50’ 62,525Add for sweep arm auger 7,500 20’ 30’ 65,800 40’ 73,245 50’ 80,360 60’ 88,370 70’ 102,910 80’ 107,610 90’ 120,585
Add for sweep arm auger 7,500
Add for chain unloader 40,150 25’ 40’ 112,570 50’ 126,290 60’ 131,120 70’ 145,840 80’ 157,430 90’ 177,050Add for chain unloader 44,500
Steel Silos(non-glass lined)
Includes concrete foundation, steel roof, ladder, and platform.
Diameter Height Cost 14’ 30’ $22,920 40’ 26,440 50’ 29,970Add for sweep arm auger 6,610 17’ 30’ 29,820 40’ 34,230 50’ 39,078Add for sweep arm auger 7,500 20’ 30’ 40,840 40’ 47,160 50’ 53,620 60’ 59,940 70’ 66,255 80’ 70,810 90’ 77,775
Add for sweep arm auger 8,960Add for chain unloader 40,150 25’ 40’ 78,750 50’ 88,410 60’ 91,380 70’ 98,725 80’ 104,895 90’ 114,500Add for chain unloader 44,500
Concrete Silos Per foot of height. Includes concrete foundation
Add for Diameter Stave Poured unloader
12’ 405 510 10,750 14’ 450 565 10,750 16’ 490 730 11,635 18’ 530 740 11,635 20’ 610 830 13,355 24’ 740 1030 13,355 30’ 1065 1340 13,355
PUB-122 (R-01/18)
Instructions for Farmland Assessments
Page 47 of 47
Visit our website at tax.illinois.gov.For assistance, click on “Got Questions? - get answers here!” on our website.
For information or forms
Printed by authority of the State of Illinois - web only