Embed Size (px)
Citation preview

Public Contributions to the European RailSector: An in depth analysis for eight countries
Jan Thomas Schafer∗ Georg Gotz†
December 12, 2016
This paper is work in progress. Please do not quote or circulate.
Abstract
This paper provides an analysis of the funding structure of therailways in 8 European countries. It updates and expands the well-known database on public contributions to rail which has been ini-tially published by NERA (2004). The analysis shows that there arelarge differences concerning the focus of granted funds which can beexplained by different policy objectives, differences in the level anddegree of network access charges and different cost coverage ratios ofpublic transport services. We identify a tendency towards two mainfinancing models. In our data-set countries either focus their supportpayments on the operation of the infrastructure, which implies lowernetwork charges and thus a lower amount of necessary Public ServiceCompensations, or they focus on the support of transport services witha higher degree of cost coverage of network charges and thus a loweramount of operating contributions paid to the infrastructure manager.The structure of funds, different approaches of infrastructure financingand differences in the treatment of historical debt are likely to havean influence on the performance of the investigated railway systems.
Keywords: Public Contributions, Subsidies, Rail, RailwaysJEL Classification: R42, R48, L92
∗Research Assistant, Chair for Industrial Organization, Regulation and Antitrust,Department of Economics, Justus-Liebig-University Giessen. Licher Strasse 62, 35394Giessen, Germany, E-mail: [email protected].†Professor, Chair for Industrial Organization, Regulation and Antitrust, Department of
Economics, Justus-Liebig-University Giessen. Licher Strasse 62, 35394 Giessen, Germany,E-mail: [email protected].
1

1 Introduction
Public contributions are one of the main funding sources of the European rail-way sector. Environmental and social reasons as well as the potential to fostereconomic development are common justifications for these payments. Eventhough government expenditures for the railway sector make up a significantshare of state budgets in most of European countries, detailed informationon the level and use of funds are typically not available in easily accessible,systematic and well-structured form. This is why researchers argue, thatthere is plenty of room for a deeper investigation of public support to theEuropean railway sector (see for example Arrigo and Di Foggia 2014, p. 33).Especially in times of tightening budgets and higher financial needs of railwayundertakings the debate on the future design of the European railway sectormight benefit from an in depth review of different funding schemes. Apartfrom budgetary and efficiency considerations detailed data on the level ofpublic contributions to the different organizational units of the sector mightalso have regulatory relevance, since large parts of regulated access chargesare paid from public service compensations.
NERA (2004) is one of the few databases that allow for cross-countrycomparisons of public support in certain categories and therefore goes be-yond the rather aggregate figures that are stated in most analyzes. Theprevalence of those aggregate approaches (see for example Nash et al. 2011and van de Velde et al. 2012) are due to the fact that payments are typi-cally not collected on a comparable basis. Furthermore, European legislationdoesn’t provide a clear classification of government support since permittedpayments are regulated by several directives and guidelines. Because of this,no standardized methods for the assessment of government support to therailway sector do exist. However, given the rather complex financing struc-tures railways exhibit, and the fact that government support occurs on dif-ferent stages by the means of different methods and might be complementingor substituting other sources of funds, it is obvious that in depth analysisrequires a sufficiently detailed database.
In this paper we provide an analysis of the financing structure of therailways in 8 European countries. We update and expand the well-knowndatabase on public contributions to rail which has been initially publishedby NERA (2004). For this we took a deeper look at the financing struc-ture of each railway sector, collected relevant payments and evaluated theconsistency of already existing studies. Data have been mainly collectedfrom public budget plans, annual reports of infrastructure managers andtransport undertakings, publications of regulatory authorities and statistical
2

offices. We furthermore conducted a survey to obtain additional informationon the level and breakdown of government support. In our data we differbetween seven categories of government support that reflect the organiza-tional structure of the European railway sector as well as the main areas ofpublic contributions. The database covers a period from 2001 to 2015 andincludes financial figures as well as other key characteristics for the railwaysectors of France, Germany, Great-Britain, Italy, Norway, Spain, Sweden andSwitzerland. To be able to compare the level of government support and thedevelopment of transfers over the observation period we adjusted our figuresusing passenger-ton-kilometer (ptkm) and the number of inhabitants (taxpayer cost) as the main indicators.
2 Literature Review
2.1 The NERA (2004) Database
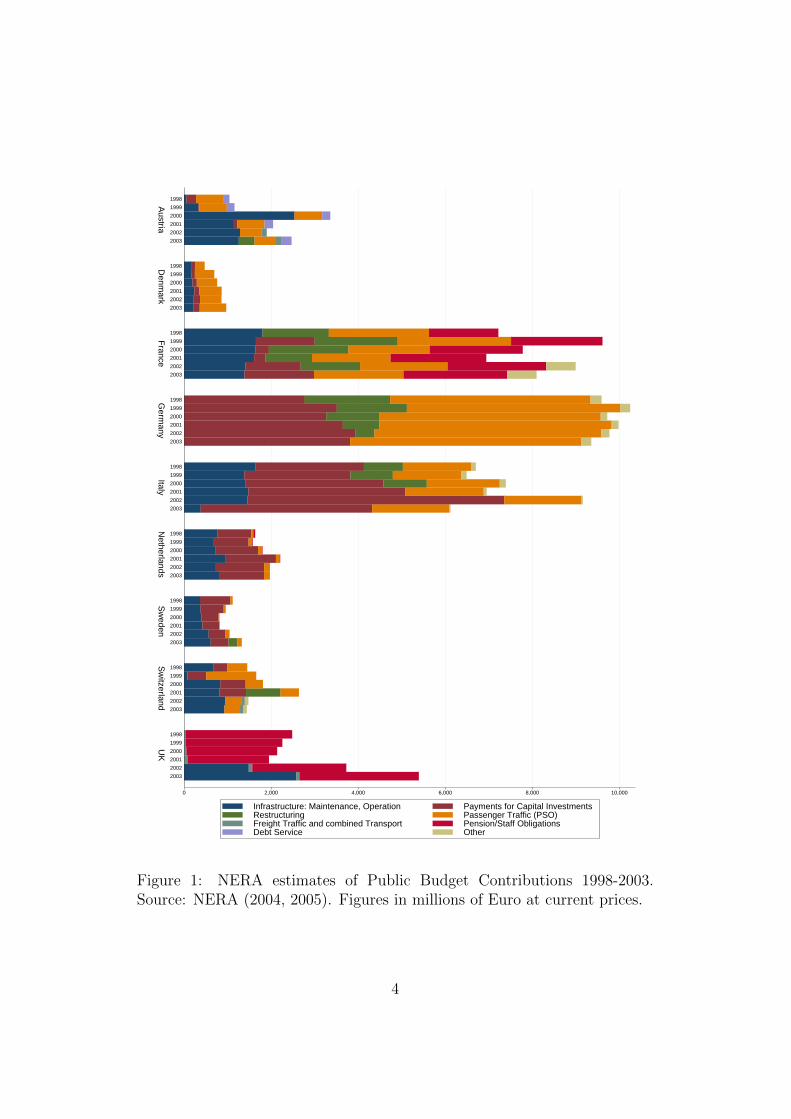
The publication of NERA (2004) is one of the most detailed, publicly avail-able, studies of public contributions to the European railway sector. Itcompares direct public budget contributions of seventeen European coun-tries with state aid data from the European Commission. The paymentsare summarized into several groups, reflecting different types of public bud-get contributions permitted by EU legislation. This includes compensationfor Public Service Obligations, freight transport grants, support for opera-tion and maintenance of the infrastructure, grants to support investment,staff and pension obligations, debt service as well as support granted forthe restructuring of the sector. Initial 2001 data have been updated andextended for an period from 1995-2003 (see NERA 2005), covering publicbudget contributions to railways in 9 European countries (see Figure 1).Data sources comprise annual reports, budget reports and the InternationalRailway Statistics published by the International Union of Railways (UIC).
Even though the data has been used in several studies and publications(see for example Perkins 2005 or Dehornoy 2011), we find that the database ofNERA (2004) has several shortcomings when trying to compare governmentsupport between countries. For example, it covers only support to operatorsand infrastructure managers while other entities or institutions involved ininfrastructure or transport provision are often not included. Staff and pensionobligations, are often paid to institutions outside the administrative area ofcompanies and are therefore not included in the dataset - whereas in somecountries like Switzerland those expenses have to be borne by the companiesitself without additional government contributions.
3
0 2,000 4,000 6,000 8,000 10,000
UK
Sw
itzerlandS
weden
Netherlands
ItalyG
ermany
France
Denm
arkA
ustria
2003
2002
2001
2000
1999
1998
2003
2002
2001
2000
1999
1998
2003
2002
2001
2000
1999
1998
2003
2002
2001
2000
1999
1998
2003
2002
2001
2000
1999
1998
2003
2002
2001
2000
1999
1998
2003
2002
2001
2000
1999
1998
2003
2002
2001
2000
1999
1998
2003
2002
2001
2000
1999
1998
Infrastructure: Maintenance, Operation Payments for Capital InvestmentsRestructuring Passenger Traffic (PSO)Freight Traffic and combined Transport Pension/Staff ObligationsDebt Service Other
Figure 1: NERA estimates of Public Budget Contributions 1998-2003.Source: NERA (2004, 2005). Figures in millions of Euro at current prices.
4

The exclusion of payments might be more problematic when looking atinfrastructure investments. For example, in Switzerland large infrastruc-ture projects are financed from special budget funds outside public accounts.When examining the effectiveness of government support or the performanceof a railway system those payments should be included into the analysis,since they might be able to explain differences between countries. Further-more, the database of NERA (2004) contains only support paid to the mainrailway companies, mostly incumbents, while payments to other companiesare not included. However, since we are most interested in a country compar-ison it is crucial to consider industry data rather than data for incumbentsand main institutions. This is in particular important since the number ofprivate companies taking over public transport contracts tend to be increas-ing in some countries. These points should therefore be kept in mind whenupdating data on public contributions.
2.2 Recent Studies and Databases
Apart from the comprehensive database of NERA (2004) and the State aidestimates of the European Commission1, data on government support hasbeen collected for a number of analyses who compare data between variouscountries and for various periods. Typically data is gathered from financialreports of receiving as well as granting institutions in each country. Moreover,sector reports and publications of ministries in charge, regulatory authoritiesor organizations like the International Union of Railways are usually con-sulted to obtain a more detailed overview of the financing structure in eachcountry. However, coverage and level of aggregation of data differ betweenstudies as well as between analyzed countries. Data most commonly containonly contributions paid directly to transport operators and infrastructuremanagers, whereas government loans and support granted via special pur-pose entities are not always included. Furthermore, it is not always clearto which extent government payments for the restructuring of the sector orother expenditures are accounted for or whether payments to competitors offormer state-owned enterprises have been included. We find that a detaileddescription of contained data, data gaps or the applied collection process is
1See State aid Scoreboard of the European Commission 2014, Non-crisis aid, Table’Subsidies to the railway sector’, available online: http://ec.europa.eu/competition/
state_aid/scoreboard/railways.xlsx. Since 2012 data is broken down in PublicService Compensation and pensions as well as infrastructure and other aid. Previ-ous data has been stated in aggregated figures only (see Table ’Subsidies to the rail-way sector’, available online: http://ec.europa.eu/competition/state_aid/studies_reports/ws4_41.xls).
5

often missing. This hampers the comparison of data and outcomes betweenstudies. The following paragraphs contain a review of selected studies thatanalyzed government support to the rail sector in European countries.
Nash et al. (2011) compared the overall level of government spending forGreat Britain, Sweden and Germany for a period from 1997-2007. How-ever, they only state government support for infrastructure investments forSweden separately. Dehornoy (2011) compared the development of publicfunding between Germany, UK, France, Sweden and Switzerland for a pe-riod ranging from 1980-2010 (depending on country). The author tried tobreak down payments in accordance to the classification of NERA (2004),however, in their final analysis they had to use aggregated figures since de-tailed comparable data was not available for all countries. Dehornoy (2011)furthermore mention the importance of a consistent comparison of support,in particular of payments for the restructuring and debt relief programs thatreduce the cost of some undertakings while other undertakings haven’t beenexempted from these additional burden.
Deville and Verduyn (2012) conducted a detailed analysis of the financialsituation of the railways in Belgium, Germany, France and the Netherlands,though, data is not being used to compare the development of governmentfunding between countries. Steer Davis Gleave (2005) compared the level ofstate funding of 18 EU countries, Norway and Switzerland for a period from2000-2004. However, a detailed breakdown of support (categories infrastruc-ture development and PSC) is only available for the year 2003 and not forall countries. RGL Forensics, Frontier Economics and Aecom (2009) pre-pared a detailed report of the financial situation of transport undertakingsand infrastructure managers to the European Commission covering a periodfrom 2004-2007. They provide detailed data on public funding that nationalrailways received from the government, however, companies have been an-alyzed independently without attempts being made to assess differences inthe financing structure between countries. The European Commission (2007,p. 111) published a comparison of the development of financial contributionsfor infrastructure operation, maintenance, renewals and construction for anperiod from 1996-2006. Unfortunately they don’t provide an exact break-down of support figures.
Less comprehensive analyses contain data for single years or provide onlyfigures on the relative development of support without an exact breakdown ofpayments. Arrigo and Di Foggia (2013), for example, analyzed schemes andlevels of government support to the railway sectors in Germany, UK, Sweden,Italy and France for different years. However, only for Italy payments werebroken down into operating support and capital grants (covering a period
6

from 1997-2011). Arrigo and Di Foggia (2014) extends and deepens theanalysis to cover public spending to railways in France, Germany, Great-Britain and Sweden for a period ranging from 1992 to 2012. However, datais only comparable to a small extent. In their country comparison the authorstherefore considered only aggregated support figures.
In their report to the European Commission ECORYS Nederland BV(2006) compared the financial situation of 23 EU countries, Norway andSwitzerland. Information on government support is not available for all coun-tries and the level of aggregation of funding data varies between countries.Nash (2010) analyzed state spending on rail infrastructure between 25 Eu-ropean countries using 2006 data provided by the Community of EuropeanRailway and Infrastructure Companies (CER). For their EVES-Rail studyvan de Velde et al. (2012) compared the development of government supportper transport unit for Germany, UK, Switzerland, Netherlands and Franceover a period from 2000-2010. Figures include operating and investmentgrants, pension obligations and health insurance costs. Dividends that somegroups pay back to the government have been subtracted. Nevertheless, noattempts are made to analyze the breakdown of support and contributionsare only stated in an aggregated form.
Finger et al. (2015) compared the financial structure of 10 Europeancountries in 2012. Data is taken from the Rail Market Monitoring Scheme(RMMS) of the European Commission (2014), Eurostat, the UIC and otherpublications. The authors discuss the interaction of public contributions toinfrastructure and transport undertakings as well as the influence of differentapproaches of access charge and fare pricing on the focus of governmentcontributions. Using the data collected in our paper, the analysis of Fingeret al. (2015) could be extended for a longer period. This would allow toexamine changes in the financing structure of each railway system and theirimpact on the performance and output of the industry over time.
3 Construction of the Data Set
3.1 Identification of relevant payments
The collection of financial data, in particular in regard to public contribu-tions, is an elaborate process. This is due to several reasons. Railways consistof rather complex financing structures. Government support is paid on dif-ferent stages by the means of different methods and might be complementingor substituting other sources of funds. European legislation doesn’t provide aclear classification of government support/funding instruments and detailed
7
data is not available for the period after the liberalization of the Europeanrailway sector.
Furthermore, it is often not easy to identify the ’true’ extent of govern-ment support. For example, if the government is the biggest shareholder ofrailway companies, it is challenging to determine the effect of governmentinfluence on investment decision of the entity and the financing of these (seefor example Steer Davis Gleave 2005, p. 72-73). Especially PPPs are said tobe used to transfer debt out of public accounts and should be stated as gov-ernment investments (see Engel et al. 2010, p. 62), however these financinginstruments are often not accounted for in existing studies. In practice theimpact of so called indirect support is difficult to measure (see for exampleValsecchi et al. 2009, p. 17), since no standardized demarcation of indirectsupport exists. Some researchers suppose that indirect support accounts onlyfor a comparably small portion of total support (see Best et al. 2006, p. 613)while others estimate the level of indirect funding to up to 30 percent of de-clared State aid (see NERA 2004, p. 118). However, literature focuses mainlyon contributions that can be observed directly. We’ll follow this approachto be in line with existing studies and to avoid estimation errors. Thus, inthis study the terms ’government support’ or ’public contribution’ refer toany direct government expenditure which is targeted to the field of transportservice and infrastructure provision as well as the restructuring of the sectoror other fields mentioned in the next chapter.
Following suggestions of the OECD (2010, p. 83-86), who published aguide on measuring public support to the agricultural sector, we will cap-ture relevant government payments using a three-step identification process.We apply this procedure to overcome shortcomings of previous studies whomainly concentrated on the biggest railway companies and excluded supportpaid to special purpose entities or investment undertaken directly by the gov-ernment. It allows to reveal the overall level of government funding ratherthan the support to single companies. First, all institutions that are involvedin public funding of the railway system will be identified. Second, all admin-istrative levels will be covered, since funding might pass several stages beforebeing granted to the final beneficiary. Third, all public finance instrumentswill be considered, even those that are organized outside the national bud-gets, for example funding for investment that is provided through specialpurpose entities.
8

3.2 Classification of contributions
To achieve comparability of the collected data between countries we classifythe identified payments to one of the categories mentioned below. The cat-egories reflect the main areas of government funding and are derived fromexisting studies (in particular NERA 2004, 2005), the organizational struc-ture of the sector as well as the legislative background and financing practiceas discussed in the previous chapter. We’ve slightly modified the classificationof NERA (2004, p. 61-68) to account for additional types of support. Ouranalysis will focus on the following categories of government contributions:(1) Infrastructure revenue contribution (support for management, operationand maintenance of the network) that are paid to complement/substituterevenue from access charges, (2) Infrastructure investment contributions for(a) replacement investments as well as (b) for the expansion of the existingnetwork and new construction projects, (3) Public Service Compensation(PSC), (4) investment contributions for the purchase of rolling stock, (5)pension and staff obligations, (6) payments to reduce the indebtedness ofundertakings, debt service payments, compensation for interest expenses aswell as the takeover of historical debt and (7) obligations related to restruc-turing. In the following we discuss these definitions in detail.
Infrastructure revenue contributions (1) refer to public funding that cov-ers operating costs of the railway infrastructure. These payments are oftenclassified as operating income in the profit and loss account of the infras-tructure managers and are subject to management contracts or compensatethe IM for specific operating expenses. Government support for the task ofestablishing, managing and maintaining the railway infrastructure are sub-ject to Article 8 of Parliament and Council Directive (EU) No 2012/34 (OJL 343/32) establishing a single European railway area. However, it is notexplicitly stated in which forms financing can be granted. According toa statement of the European Commission (2008) the relationship betweeneach Member State and its infrastructure manager for the funding of main-tenance and modernization of the railway infrastructure should be subjectto a multi-annual-contract. Government support thereby shall complementrevenue from user charges, i.e. should be treated as additional income fromoperation. However, Council Directive (EU) No 2012/34 also gives MemberStates the right to demand the infrastructure manager to balance its profitand loss account without government support, i.e. to cover operational ex-penditures only from user charges.
Council Directive (EU) No 2012/34 furthermore points out that MemberStates may provide the infrastructure manager with financing, in particular
9

to cover new investments. In our analysis we split contributions for infras-tructure investments (2) into two sub-categories, support for replacementinvestments (a) and support for expansion and new construction (b). Thisinvolves grants for the renewal of the existing railway infrastructure (a) aswell as grants for investments in new railway infrastructure and expansion ofthe existing network. In contrast to NERA (2004), support for infrastructureinvestment has been split into two subcategories. This will allow examiningto which degree the government supports the development of the infrastruc-ture in terms of focusing either on the preservation or/and on the extensionof existing infrastructure. Moreover, the influence of governmental supporton different stages of the provision of railway services can be studied to agreater extent. For instance, especially support for infrastructure operationand maintenance as well as support for replacement investments lowers theaccess charge and therefore the cost of transport undertakings, i.e. necessaryPublic Service Compensation (see NERA 2004, p. 64-66), while other coun-tries might support the infrastructure indirectly by higher PSO payments.
The Category Public Service Compensation (3) refers to contractual pay-ments and revenue contributions that are subject to the public provision oftransport services. Public services are most commonly referring to regionaltransport services, nevertheless, some long-distance or freight connections arealso seen as economically desirable and receive government support. How-ever, it should be noted that public service activities are not necessarilynon-profitable. Due to their importance and the use of cross-subsidization toreduce the amount of necessary government funds, the decision-making powerusually remains with the responsible authority. Public service activities aretypically contracted to a commercial operator. Parliament and Council Reg-ulation (EC) 1370/2007 (OJ L 315/1) on public passenger transport servicesby rail and by road sets the conditions under which authorities can compen-sate transport operators for costs incurred or can grant exclusive rights inreturn for the discharge of public service obligations. The Regulation de-fines that a public service compensation refers to any benefit, particularlyfinancial, that can be granted directly or indirectly to operators (see article2 g). Since the measurement of non-financial, e.g. indirect, compensationscan be only approximate, we focus only on direct compensations as stated incompany accounts and budget plans.
According to European legislation support to transport operators out-side the scope of a Public Service Obligation may also be granted if it iscompatible with the Treaty. Community Guidelines on State aid for railwayundertakings (2008, OJ C 184/07) point out, that financing of rolling stockcan contribute to the objective of common interest. Thus, governments may
10

support transport undertakings with funds for the purchase and renewal ofrolling stock. Only the costs of the purchase of rolling stock for exclusive usein freight transport are not admissible (see paragraph 34). For all other typesof transport strict conditions need to be met to avoid distortions of competi-tion (see paragraphs 31-40). If transport operators receive additional grantsfor investment in rolling stock, payments are stated in the category rollingstock investment contributions (4). The treatment of rolling stock invest-ment contributions differs to the approach of NERA (2004), who haven’tstated them separately but included them into PSC figures.
Payments for retirement as well as redundancies, i.e. government sup-port for staff payments that are not directly related with the operation ofinfrastructure or transport services, are contained in the category pensionobligations (5). Debt service, debt reduction and capital rejections (6) refersto the takeover of historical debt and debt service payments in the form ofcapital transfers or the compensation of interest expenses. The category obli-gations related to the restructuring (7) contains government support like thecompensation for specific operating cost and compensation for legacy costthat are due to the management of a former state owned enterprise. In thepast, support for restructuring was most commonly granted in the form ofdebt reliefs that were aimed at freeing the sector from ’historically’ growndebt. Government support thereby focuses on relieving operators from ad-ditional burden that private operators don’t need to bear. Thus, supportrelated not directly to operation and investment is most often justified bypromoting equality between former state owned enterprises and other com-mercial companies (see Council Regulation (EEC) No 1192/69 on commonrules for the normalization of the accounts of railway undertakings, 1969, OJL 156/8). The degree to which former state owned enterprises have beenexempted from historic debt has an influence on the financing cost the un-dertakings have to bear, and thus influences the amount of necessary fundsthat have to be recovered either from revenue or from public funds, this iswhy it is crucial to include these payments into the analysis.
3.3 Data Sources and Quality
The quality and the coverage of available data on government contributionshas increased in recent years. To maintain comparability of data over thewhole observation period minor adjustments had to be made. Nevertheless,there are still large gaps in data for some countries. Furthermore, differencesin data availability, scope and consistency persist between countries that havebeen considered in our study. There are also large differences concerning
11

the accounting treatment of government support. It is clear that due to thecomplexity of the sector a full coverage of data cannot be achieved. However,this problem is exacerbated by the fact that no major attempts have beenmade at the political level to standardize the reporting of government fundsbeing spent on the sector, even though they account for a significant portionof Government budgets in each country. Especially in times of tighteningbudgets the debate on the future design of the railway sector in Europe mightbenefit from an in depth analysis of differences in the funding structure andreturn on government funds.
For France we compiled data mainly from the annual transport statisticpublished by the French Ministry of Transport. Although data of the Min-istry of Transport differ slightly from the payments stated in annual reports ofSNCF and RFF they are still advantageous, since data is available for a longerperiod and allows for a detailed breakdown of support figures. The amountof compensation for infrastructure operation in our dataset is comparable tothe figures in NERA (2004, 2005). Nevertheless, we obtained different esti-mates for the height of the granted infrastructure investment contribution,Public Service Compensation and pension obligations. Dehornoy (2011) andDeville and Verduyn (2012), who analyzed the development of public con-tributions to the French railway sector in detail, also used data publishedby the French Ministry of Transport. Since both publications don’t providedetailed information on the exact height of payments included into each oftheir categories, figures are difficult to compare with our findings. However,the relative development of total support estimates is similar.
Data for the German railway sector has been mainly taken from the bud-get plans of the Ministry of Transport. However, some adjustments had tobe made. We supplemented data by comparing data with figures publishedby NERA (2004, 2005), the financial reports of Deutsche Bahn, the outcomesof the studies of RGL Forensics, Frontier Economics and Aecom (2009), De-hornoy (2011), Nash et al. (2011) and Deville and Verduyn (2012) as well aswith information and data obtained from correspondence with the FederalNetwork Agency (Bundesnetzagentur) and Deutsche Bahn. In addition, twopublicly available statements of the Federal Government concerning the useof transfers to the Federal States have been consulted to trace data gaps andto estimate the approximate amount of support for public services.
Data for Great Britain has been taken from a data-base on Governmentsupport to the British rail industry2 that is updated annually by the Depart-ment for Transport, Transport Scotland and the Welsh Government. We
2See Table ’Government support to the rail industry: annual from 1985/86’, avail-able online: https://www.gov.uk/government/uploads/system/uploads/attachment_
12

complemented data with information from the National Rail Trend Year-books which are published by the Office of Rail Regulation, data on pay-ments to TOCs collected by the Department for Transport and the Officeof Rail Regulation, the annual reports and accounts of the Department forTransport, the business plans of the Department for Transport, a report ofthe National Audit Office on the Department for Transport, the Central Gov-ernment Supply Estimates, GB rail industry financial information publishedby the Office of rail Regulation as well as the annual reports and regula-tory financial statements of Network Rail. It should be noted that data forGreat-Britain refer to financial years only. Data of all other countries re-fer to calendar years. Furthermore, figures are net of received performancepayments, whereas figures for other countries contain gross data.
Data for Italy has been mainly from the financial statements of FS Ital-iane and its subsidiaries. Trenitalia SpA provided us with data on PublicService Compensation for regional and freight transport services as well ascontributions for the purchase of rolling stock for a longer period. Supportto other companies and regional operators is missing in our data set. Weare not sure about the approximate level of support granted to other entitiessince no detailed information was available to us. We used publications ofArrigo and Di Foggia (2013, 2014), NERA (2004, 2005) and RGL Forensics,Frontier Economics and Aecom (2009) to compare our estimates for eachcategory. Data for some categories of our framework were not available to usfor all years, therefore we had to exclude government support for 2001-2003from our final figures.
The Norwegian Department of Public and Rail Transport of the Ministryof Transport and Communications provided us with detailed data on supportto NSB as well as to Jernbaneverket. We complemented the data with figuresfrom the annual reports of the NSB Group and NSB AS as well as withdata from the annual reports of Jernbaneverket. Comparable support figureswere only available in the publication of NERA (2004) for the year 2001. Theheight of support in each category as well as our total support estimates are inline with the findings of NERA (2004). Slight differences could be explainedby currency conversion from NOK into Euro using different exchange rates.
Data for the Spanish railway sector has been taken from budget plans ofthe State as well as from annual reports of RENFE, Renfe-Operadora andAdif. We obtained additional information from the publication of NERA(2004) as well as from the report of RGL Forensics, Frontier Economics andAecom (2009). In Spain public support for investments is transferred in
data/file/482748/rai0302.xls.
13

the form of equity contributions to both, Renfe-Operadora and ADIF/GIF.However, these payments are officially not stated as investment grants inthe government expenditure report or the annual reports of the companies,but are used to finance a large part of investments. Eurostat (2008) hascriticized the methodological treatment of these payments (see also InstitutoNacional de Estadistica 2007), we’ve therefore included the payments in ourinvestment contribution figures. Due to the restructuring of the sector in theend of 2004, data availability and consistency problems persist. Coverage ofour data differs between the period before and after the restructuring.
Our data set for Sweden is based on support figures submitted by Trafikver-ket, the annual reports of Banverket, Trafikverket, Green Cargo as well asSJ. We furthermore gathered information from publications of Trafikanalys,a Swedish government agency who is responsible for the production of officialstatistic in the transport sector, the budget plans of the Swedish governmentas well as the Sector Report of Banverket (2008). However, we haven’t beenable to complete data for the whole observation period. Furthermore, de-tailed data on Public Service Obligations for regional rail transport was notavailable. Trafikanalys publishes an annual statistic on local and regionalpublic transport (Stockholm region missing); however, payments for the pro-vision of services are not broken down by mode of transport. PSC for localand regional rail services have therefore been calculated by subtracting totalrevenues from total costs of rail operators. There seems to be a lack of dataavailability since other authors had similar problems to estimate PSC (seefor example Dehornoy 2011).
Support figures for the Swiss railway sector have been found in the annualreports/financial statements of the SBB Group, data published and submit-ted by the Swiss Ministry of Transport, data from the Swiss Statistical Officeas well as publications of the Swiss government. Even though a large numberof statistical databases exist for the Swiss railway sector, the completion ofour data set was not possible without accepting some data gaps. One prob-lem was to determine the amount of Public Service Compensation since theresponsibility for public services is shared between the State and the regionalauthorities. Furthermore, there is a break in time series data between 2006and 2007 due to changes in the support scheme. It should be noted that theSwiss Statistical Office publishes a detailed account for the railway sector (seeBundesamt fur Statistik BFS 2013). Unfortunately, data is too aggregatedto use it for our data base. Concerning the coverage of our data we believethat the figures that we have collected for the Swiss rail sector undervalue theactual amount of government compensation to a certain extent. Therefore,all estimates should be treated with care.
14

4 Public Budget Contributions
4.1 Overview
In order to be able to compare the absolute level of public budget contributionbetween countries we have used GDP Purchasing Power Parities (PPP) tonormalize data. This approach is consistent with the studies of NERA (2005),Dehornoy (2011) and van de Velde et al. (2012) who also used PPP adjustedestimates of public budget contributions.
We find that there are large differences between the level of governmentsupport as well as concerning the structure of government contributions (Fig-ure 2). The development of payments also differs to a great extend betweencountries. Taking into account all categories of support, the German railwaysector receives the highest contributions, followed by the French sector. TheItalian and British as well as the Norwegian and the Swedish railway sectorreceive contributions on a comparable level, Spain as well as Switzerland arein between the four.
While support figures evolve relatively stable in France, Germany, Nor-way, Sweden and Switzerland, there a lot of volatility in the data for Great-Britain, Italy and Spain. In Great-Britain we observe a strong increase in(infrastructure revenue) contributions since the foundation of Network Railin 2002. Figures reach their peak in 2007, since 2012 contributions continueto climb. The development is being dampened by repayments of franchises.For 2013 and 2015, there are even surpluses from the franchise contracts.
In Italy contributions reached their peak in 2009, in Spain in 2006. Therehave been large transfers for the takeover of debt in 2006 (Italy) and 2004(Spain). In 2008 the Swedish sector received additional funds for the repay-ment of loans. Till 2008 the French railway sector has also been receivingequity contributions on a regular basis. Onetime payments also occurred inGermany, where there have been transfers for the restructuring of the sectorin 2001 and 2002, as well as in Switzerland in 2001 and 2010 in the form oftransfers to the pension fund. The French and the German railway sectorreceive payments to offset the additional burden which is caused by formerhaving been run as state enterprises. This applies in particular to pensionpayments.
All main infrastructure managers except the German national infrastruc-ture operator, receive contributions for operation which are usually treatedas revenue in the income statement. In France payments have been decreas-ing since 2001, at the same time the compensation for public services has
15

0 5,000 10,000 15,000 20,000
Sw
itzerlandS
weden
Spain
Norw
ayItaly
Germ
anyG
BF
rance
201520142013201220112010200920082007200620052004200320022001
2015201420132012201120102009200820072006200520042003
201520142013201220112010200920082007200620052004200320022001
201520142013201220112010200920082007200620052004200320022001
201520142013201220112010200920082007200620052004
201520142013201220112010200920082007200620052004200320022001
201520142013201220112010200920082007200620052004200320022001
201520142013201220112010200920082007200620052004200320022001
Infrastructure revenue contribution Infrastructure investment contributionPublic service compensation (PSC) Rolling stock investment contributionPension obligations Debt Service, debt reduction and capital injectionsObligations related to the restructuring Other
Figure 2: Development and Breakdown of Public Budget Contributions 2001-2015. Figures in millions of PPP adjusted Euros.
been increasing. In all Countries the railway sector has been receiving in-vestment contributions for enhancement of the infrastructure. Contributions
16

for rolling stock investments have been only granted in France, Spain in Italy.However, in some countries additional funds are provided from the budgetfor public services.
4.2 Relative development
To adjust for the country and sector size we will use passenger-ton-kilometer(sum of passenger and ton-kilometer) as well as the number of inhabitants ineach country as indicator. Passenger-ton-kilometers are one of the most com-monly used output indicator that shows the amount of traffic units producedin each country. The number of inhabitants will allow to adjust data for dif-ferences in the size of the country and is an important measure of taxpayerscost of running the national railways. To further increase the comparabilityof support figures we exclude all payments that are not directly related tothe operation of transport services and the infrastructure or that are notused to finance investments. In the following chapters public budget contri-butions therefore refer only to infrastructure revenue contributions (supportfor management, operation and maintenance of the network), Infrastructureinvestment contributions for replacement investments as well as for the ex-pansion of the existing network and new construction projects, Public ServiceCompensations (PSC) as well as investment contributions for the purchaseof rolling stock.
Support per passenger-ton-kilometer (ptkm) is in a range between 0.02and 0.22 Euro over the observation period. Thus, in average each outputunit is funded with 0.08 Euro. Sweden grants the lowest contribution perptkm while Norway has become the country paying the highest contributionper passenger-ton-kilometer. The average annual contribution per passenger-ton-kilometer varies between 0.03 Euro/ptkm (Sweden) and 0.14 Euro/ptkm(Norway). Some countries have undergone significant changes in the level ofcontribution per passenger-ton-kilometer during the years. Support to theSpanish railway sector has decreased from more than 0.18 Euro/ptkm in 2006to 0.08 Euro/ptkm in 2015 while support to the Norwegian railway sectorincreased from 0.10 Euro/ptkm in 2001 to 0.22 Euro/ptkm in 2015. Supportper passenger-ton-kilometer to the German and Swiss railway sector emergedrelatively constant. Payments to the British railway sector have reached theirpeak in 2007 and tend to decrease since that point. Payments to the Italianrailway sector are also characterized by a high volatility, tending to decreaseduring the last periods. Support to the French and Swedish railway sectorhas been increasing over the observation period.
Contributions per inhabitant are in a range between 26 and 360 Euro over
17

0.02
0.04
0.06
0.08
0.10
0.12
0.14
0.16
0.18
0.20
0.22
2001
2002
2003
2004
2005
2006
2007
2008
2009
2010
2011
2012
2013
2014
2015
0
50
100
150
200
250
300
350
2001
2002
2003
2004
2005
2006
2007
2008
2009
2010
2011
2012
2013
2014
2015
France GB Germany Italy
Norway Spain Sweden Switzerland
(a) ePPP/ptkm (b) ePPP/inhab.
Figure 3: Government support for infrastructure investments, operation,PSC and investments in rolling stock 2001-2015.
the whole observation period. Great-Britain has granted the smallest annualaverage contribution to its national railway sector (80 Euro/inhabitant) whilethe Swiss railway sector has received the highest average contribution overthe whole observation period (308 Euro/inhabitant). Like the level of supportper passenger-ton-kilometer in some countries taxpayer cost vary to a greatextend over the observation period, while in some countries support figuresevolve relatively constant over time. Support payments to the Swiss railwaysector increased by almost 100 Euro/inhabitant. Support to the Norwegiansector has doubled. Payments in France, Germany and Sweden have beenincreasing while support to the British, Italian and Swedish sector tend todecrease in most recent years.
18

5 Applied Financing Models
5.1 Operation
5.1.1 Ratio Analysis
Similar to Finger et al. (2015) we identified a tendency to mainly two fi-nancing models. In our data-set there are countries that either focus theirsupport payments on the operation of the infrastructure, which implies lowernetwork charges and thus a lower amount of necessary PSC; or they focussupport payments on transport services with a higher degree of cost coverageof access charges and thus lower operating contributions that need to be paidto the infrastructure manager. However, we also find that in some countriesno clear tendency can be observed. These countries apply a ’hybrid’-likefinancing approach where the infrastructure manager as well as transportoperators receive an almost equal share of operating contributions. We’lldiscuss differences in the focus of Government support as well as changesduring the observation period as well its implications on cost coverage andfinancial sustainability in more detail in the following chapters.
France
GB
Germany
Italy
Norway
Spain
Sweden
Switzerland
0.00
0.02
0.04
0.06
0.08
Pub
lic S
ervi
ce C
ompe
nsat
ion
0.00 0.02 0.04 0.06 0.08Infrastructure revenue contribution
Figure 4: Ratio of PSC and infrastructure revenue contribution in 2014.Investment contributions and other support categories have been excluded.We furthermore excluded Norway from the calculation of the average ratio,since data is out of range of the other countries.
19

By comparing public budget contributions for the operation of the in-frastructure as well as Public Service Compensations relative to the trafficvolume we were able to identify three different support schemes. Figure 4shows the amount of granted Public Service Compensation per passenger-kmin relation to the amount of infrastructure revenue contribution granted perpassenger-ton-kilometer in 2014. One can observe a negative relationshipbetween Public Service Compensation and infrastructure revenue contribu-tion. Countries that pay a comparably small Public Service Compensationsupport the operation of the network to a greater extent while countries thatare granting a high compensation for passenger transport services supportthe operation of the network to a smaller extent. In 2014 Germany, Franceand Great-Britain are the countries that focus either completely on supportfor transport services or on support to the infrastructure manager. All othercountries use a combination of support for public services and infrastruc-ture operation. Only support to the Norwegian railway sector lies outsidethe range of all other countries and has therefore been excluded from theanalysis. However, the outlier might be explained by the comparably smallamount of passenger-ton-kilometer demanded in in relation to the networksize and thus higher cost per passenger and ton-kilometer of the Norwegiansector. The Swiss railway sector, that has a similar network size, providesan almost four times higher amount of traffic units compared to Norway.However, one should also keep in mind differences in the population size anddensity that could explain differences in transport demand.
5.1.2 Development of PSC and revenue contributions
There are large differences between the levels and development of publicbudget contributions within the different support categories. Figure 5 showsthe granted infrastructure revenue contribution for a period from 2001-2015in PPP adjusted Euro relative to passenger-ton-kilometer and the numberof inhabitants. Figure 6 shows the respective development of Public ServiceCompensation and Figure 8 the development of support for infrastructureinvestments.
The infrastructure revenue contribution which refers to public contri-butions granted for the operation of the network, varies to a great extentbetween countries. The British railway sector receives by far the largest con-tribution in absolute terms, reaching 5,600 million PPP adjusted Euro in2007. In relative terms only the Norwegian railway sector is receiving highercontributions, reaching 0.08 Euro per passenger-ton-kilometer or 110 Europer inhabitant in 2015. Contributions to the railway sector in Great-Britainhave experienced a strong increase in both, absolute and relative terms since
20

0.00
0.01
0.02
0.03
0.04
0.05
0.06
0.07
0.08
2001
2002
2003
2004
2005
2006
2007
2008
2009
2010
2011
2012
2013
2014
2015
0
20
40
60
80
100
120
2001
2002
2003
2004
2005
2006
2007
2008
2009
2010
2011
2012
2013
2014
2015
France GB Germany Italy
Norway Spain Sweden Switzerland
(a) ePPP/ptkm (b) ePPP/inhab.
Figure 5: Infrastructure revenue contribution 2001-2015
the foundation of Network Rail in 2001. After reaching its peak in 2007 con-tributions tend to decrease in the following years. The average revenue con-tribution over the whole observation period and over all countries amountedto 0.02 Euro/ptkm. Thus, the infrastructure managers receive an averagecompensation of approximately 2 cent for each passenger-ton-kilometer thatis demanded on their network. Tax payer cost of operating the nationalnetwork amount to an average of 32.5 Euro per inhabitant. Only the Ger-man railway sector finances the operation of the infrastructure entirely fromnetwork access charges and therefore receives no revenue contribution.
The average Public Service Compensation amounts to 0.04 PPP ad-justed Euro per passenger-kilometer. However, values and development ofsupport differ to a great extend between countries. While the compensa-tion is decreasing over the observation period in Germany and GB it tendsto increase in all other countries. Germany is paying the highest aver-age compensation amounting to 7 cents per demanded passenger-kilometerwhile the Swedish operators receive the smallest amount of compensationper passenger-kilometer amounting to an average of 1 cent over the obser-vation period. The development of Public Service Compensation in Franceand Great-Britain are outstanding from the development in other countries.
21

−0.01
0.00
0.01
0.02
0.03
0.04
0.05
0.06
0.07
0.08
0.09
2001
2002
2003
2004
2005
2006
2007
2008
2009
2010
2011
2012
2013
2014
2015
−20
0
20
40
60
80
100
120
2001
2002
2003
2004
2005
2006
2007
2008
2009
2010
2011
2012
2013
2014
2015
France GB Germany Italy
Norway Spain Sweden Switzerland
(a) ePPP/pkm (b) ePPP/inhab.
Figure 6: Public Service Compensation 2001-2015
While the compensation per passenger-kilometer to the French transport sec-tor has more than doubled, the compensation to the British operators hasreached values close to and below zero. However, it should be noted thatsupport estimates for Great-Britain are net figures (support net of revenuefrom franchise allowances), i.e. they might be undervalued compared tothe development in other countries. This is particularly true for most recentyears because of an increasing amount of performance receipts from franchiseholders that offset the paid gross compensation.
5.1.3 Cost Coverage of Access Charges
Operating cost of infrastructure managers (net of interest expenses) are cov-ered to different degrees from access charges, other revenue and governmentsupport. The same holds for cost of operating Public Services where costare covered from fare revenue and Public Service Compensations. From ourratio analysis in the previous chapter one would expect, that countries with afocus on infrastructure financing would reach lower cost coverage ratios fromaccess charges since revenue is substituted by government contributions andvice versa. Laurino et al. (2015, p. 209) also assume that the pricing princi-ples vary according to the applied financing model and other country specific
22

characteristics. However, we find that there are also differences between thecost coverage ratios of countries that apply an almost equal financing scheme.
0
10
20
30
40
50
60
70
80
90
100
2001
2002
2003
2004
2005
2006
2007
2008
2009
2010
2011
2012
2013
2014
France GB Germany Italy
Norway Spain Sweden Switzerland
Figure 7: Share of infrastructure operating cost covered by access charges2001-2014.
Figure 7 shows the degree to which access charges for the use of thenational railway network are covering operating expenses. Underlying datainclude staff expenses, material purchases, depreciation as well as other ex-penditures. Countries using a financing scheme with focus on the support ofpublic transport services like Germany and France reach cost coverage ratiosof more than 80 percent, while countries which are applying a hybrid-likefinancing model reach cost coverage ratios of only 20 to 40 percent. Eventhough government contributions in Great-Britain are mainly paid to Net-work Rail, the cost coverage ratio of access charges is still higher than incountries with a hybrid-like financing model, amounting to more than 40percent. This is due to the fact, that a large part of revenue contributions isused to finance the debt of Network Rail rather than to finance the operationof the network. When looking at differences in the height of contributionsfor the operation of the network, one should therefore adjust payments bythe part that is used to finance debt or investments.
Revenue from rail access charges in Norway are covering only 2 to 3 per-cent of operating cost, with revenue contributions being the main source of
23

income. In Italy, Switzerland, Sweden and Spain the degree of cost cover-age has been slightly increasing over the observation period, while the costcoverage ratio in France has seen a sharp increase. The French network op-erator RFF has more than doubled the cost coverage of infrastructure accesscharges from around 40 percent in 2001 to more than 90 percent in 2015.As mentioned earlier this development is due to a change in the supportscheme. However, since the revenue contribution to RFF has been substi-tuted by higher payments to operators of public transport services, totalsupport figures have only slightly changed.
5.2 Infrastructure financing
5.2.1 Investment contributions
Concerning the financing of infrastructure investments two approaches exist.Either investments are financed from government contributions or from fundsof the infrastructure manager. The latter typically involves issuing debt.Some infrastructure managers are compensated for the additional burden offinancing debt while other IM need to cover these expenses from networkcharges and revenue contributions.
The governments in the countries that are subject to our study grantfunds of different size for infrastructure investments to their national railwaysectors. In absolute terms Germany has received the highest average annualcontribution over the observation period amounting to 3,800 million PPPadjusted Euro. While contributions develop relatively constant in most ofcountries, there is a lot of volatility in contributions to the Italian and Span-ish railway sector. Tax payers cost for investment in infrastructure amounton average to 62 Euro per inhabitant over the whole observation period.The Swiss railway sector receives the highest annual average contributionamounting to almost 185 Euro per inhabitant, while the British governmentsupports investment in the infrastructure only with an average annual contri-bution of 10 PPP adjusted Euro per inhabitant. Except Switzerland all othercountries grant an annual average contribution that is less than 60 Euro perinhabitant. However, high contributions in Switzerland might be the resultof expensive construction cost since a large number of bridges and tunnelsare necessary for the operation of alpine crossing railway lines.
The main funding source for investments in the German infrastructureis the government budget. The Norwegian sector also finances nearly all in-vestments from direct government contributions, while the degree in othercountries is between 20 and 60 percent. The share of infrastructure invest-ment that has been financed from direct government contributions has been
24
0.00
0.02
0.04
0.06
0.08
0.10
0.12
0.14
2001
2002
2003
2004
2005
2006
2007
2008
2009
2010
2011
2012
2013
2014
2015
0
50
100
150
200
250
2001
2002
2003
2004
2005
2006
2007
2008
2009
2010
2011
2012
2013
2014
2015
France GB Germany Italy
Norway Spain Sweden Switzerland
(a) ePPP/ptkm (b) ePPP/inhab.
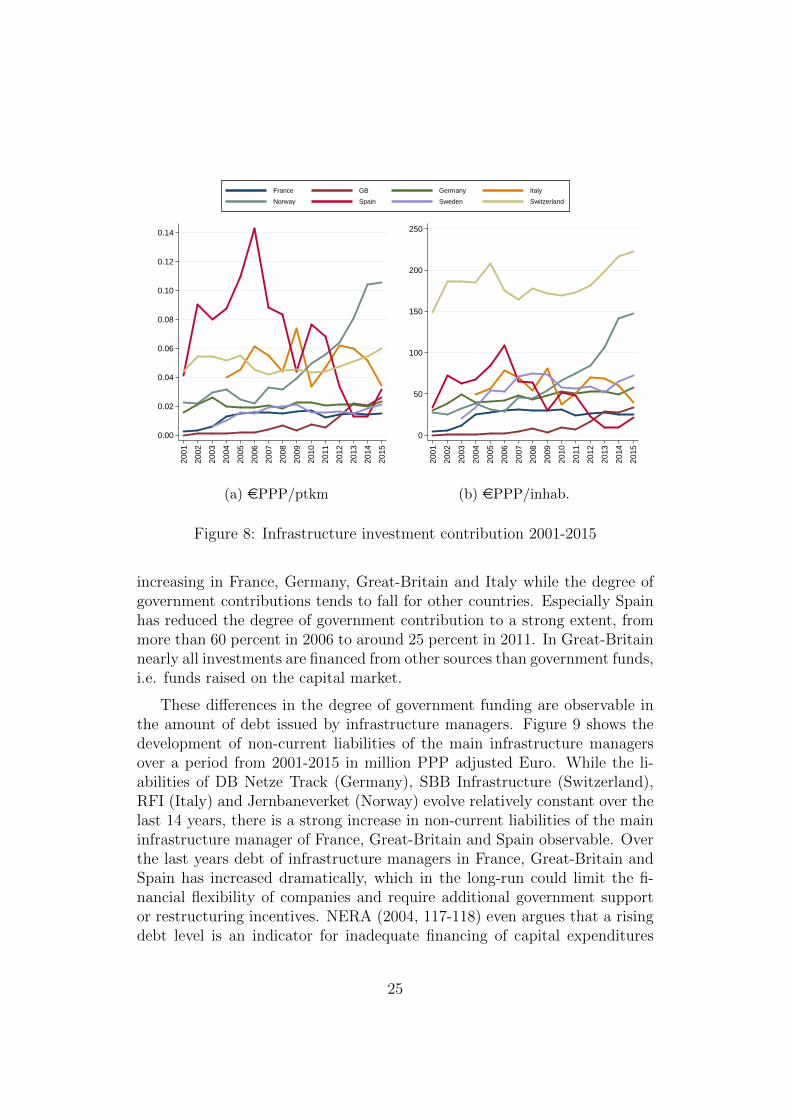
Figure 8: Infrastructure investment contribution 2001-2015
increasing in France, Germany, Great-Britain and Italy while the degree ofgovernment contributions tends to fall for other countries. Especially Spainhas reduced the degree of government contribution to a strong extent, frommore than 60 percent in 2006 to around 25 percent in 2011. In Great-Britainnearly all investments are financed from other sources than government funds,i.e. funds raised on the capital market.
These differences in the degree of government funding are observable inthe amount of debt issued by infrastructure managers. Figure 9 shows thedevelopment of non-current liabilities of the main infrastructure managersover a period from 2001-2015 in million PPP adjusted Euro. While the li-abilities of DB Netze Track (Germany), SBB Infrastructure (Switzerland),RFI (Italy) and Jernbaneverket (Norway) evolve relatively constant over thelast 14 years, there is a strong increase in non-current liabilities of the maininfrastructure manager of France, Great-Britain and Spain observable. Overthe last years debt of infrastructure managers in France, Great-Britain andSpain has increased dramatically, which in the long-run could limit the fi-nancial flexibility of companies and require additional government supportor restructuring incentives. NERA (2004, 117-118) even argues that a risingdebt level is an indicator for inadequate financing of capital expenditures
25

0
20,000
40,000
60,000
80,00020
01
2002
2003
2004
2005
2006
2007
2008
2009
2010
2011
2012
2013
2014
2015
France GB Germany Italy
Norway Spain Sweden Switzerland
Figure 9: Non-Current liabilities of main infrastructure managers 2001-2015in million PPP adjusted Euro. Note: We excluded data for some countriesin order to avoid breaks in time series data. Figures for DB Netze Trackinvolve total liabilities (current and non-current). No data was available forSweden.
and that the main goal of government policy should be to ensure sustainabledebt levels which they have specified as the degree of indebtedness of othercommercial sectors.
5.2.2 Debt Service and Capital Injections
In particular the French and the Spanish rail infrastructure managers haverepeatedly received additional government funds to finance their indebted-ness. The Spanish railway group Renfe has been freed from a large partof its debt before the infrastructure was separated and taken over by ADIFin 2004. RFF, the national infrastructure manager in France, has receivedgrants to reduce its indebtedness between 2004 and 2008 as well as capitalinjections in 2001 and 2002. However, in recent years no additional fundshave been transferred to RFF.
For the Italian High-Capacity project (a railway link between Turin,Milan, Rome and Naples) a joint-stock company called Infrastrutture SpA(ISPA) was founded in 2002. ISPA raised funds on the capital market and
26

0
2,000
4,000
6,000
8,000
10,000
12,00020
01
2002
2003
2004
2005
2006
2007
2008
2009
2010
2011
2012
2013
2014
2015
France GB Germany Italy
Norway Spain Sweden Switzerland
Figure 10: Debt service, debt reduction and capital injections 2001-2015 inmillion PPP adjusted Euro
provided them to TAV, a RFI subsidiary that was responsible for the de-velopment of the Italian high-speed network. After the completion of theproject the State should have provided RFI-TAV with the amount necessaryto cover the difference between the revenues arising from the operation ofthe new railway link and the debt service owed to ISPA. Since the State wasbearing all the risk, it has been decided that the debt issued by ISPA hasto be treated as government debt because RFI-TAV will not be able to re-pay most of the provided loans without additional government support (seeEurostat 2005). The inclusion into public accounts was completed by a debtassumption, i.e. a capital transfers from the Italian government to RFI-TAVin 2006.
Further examples can be taken from Perkins (2005, p. 8-9), who providesan overview of actions that have been taken to reduce the indebtedness ofrailway infrastructure and transport undertakings. He shows that in mostcountries railway sector debt has been taken over by the governments whilethe debt of the French railway sector remained with RFF. Regarding thefinancial situation of infrastructure managers there are therefore large differ-ences between the investigated countries. While Sweden and Norway operateand develop their national rail infrastructure by government authorities otherinfrastructure managers are run as private companies with the governments
27

being the main shareholders.
Infrastructure managers that carry a large amount of debt must bearhigher interest burdens which influences total operating cost and thus theamount of necessary funds which must be covered by access charges or gov-ernment contributions. Dehornoy (2011, p. 15) tried to incorporate the addi-tional financial burden that is caused by the debt into his support estimatesby estimating financing cost. He finds that the debt British and French rail-way sector generate financing costs of around 1.5 billion Euro each whilefinancing costs of the German infrastructure operator DB Track amount to0.6 billion Euro. On the other hand, an institution like the Federal RailwayFund (BEV) in Germany relieves some undertakings from additional costthat other undertakings need to bear by themselves. In the German case theannual benefit is estimated to an equivalent of 0.2 billion Euro. However, hisresults are preliminary and need to be treated with care.
5.3 Summary
There are large differences between the financing of infrastructure operation,public services and investment. Table 1 summarizes our findings about thefinancing structure of the railways in France, Germany, Italy, Norway, Spain,Sweden, Switzerland and Great-Britain for 2013. The main characteristicsof each country will be described below.
France finances the operation of the infrastructure from a combinationof government funds as well as access charges. Infrastructure investment arefinanced from government contributions and through debt issued by RFF.The additional financial burden is covered from revenue and governmentcontributions. However, between 2001 and 2007 RFF has made large losseswhich had an influence on the financial sustainability of the company.
With the exception of Germany all countries in our data-set grant revenuecontributions to their national infrastructure manager. In Germany accesscharges are the main source of funding for infrastructure operation (costcoverage 90 percent in 2013), while investments are mainly financed fromdirect government contributions as well as funds of DB Netze Track. Thecost coverage of public services amounted to 50 percent in 2013.
Italy, Spain, Sweden and Switzerland use a hybrid model where both,transport service operators and infrastructure managers, receive an almostequal share of total financial contributions. Investments in the Spanishrailway infrastructure are financed using a combination of debt issued byAdif and government contributions. Investment expenditures of the Swedish
28

Fra
nce
Ger
man
y
Gre
at-B
rita
in
Ital
y
Nor
way
Spai
n
Sw
eden
Sw
itze
rlan
d
InfrastructureRevenue contribution X X X X X X XInvestment contribution X X (X) X X X X XFinancing of investmentsfrom debt issued by theIM
X X X X
TransportPSC X X (X) X X X X XInvestment contributionrolling stock
X (X) (X) (X)
OtherPension obligation X XDebt service, debt reduc-tion and capital injec-tions
(X) X
Table 1: Financing structure of investigated railway systems in 2013
Trafikverket are financed from government contributions as well as (state)loans. Financial expenses as well as the repayment of loans are partly fi-nanced from additional contributions. In Switzerland large infrastructureinvestments are financed from funds of a special purpose entity. Other in-vestments are financed from direct contributions, (State) loans as well asfunds of SBB Infrastructure.
The British sector is the only one which uses a model where the majorityof government funding is granted to the infrastructure. Nevertheless, accord-ing to our data cost coverage of access charges reached around 40 percent in2013. The cost coverage of transport services amounted to nearly 75 percent,which is the highest degree in our data-set. Infrastructure investments arealmost entirely financed though debt issued by Network Rail. Debt servicepayments are financed from revenue and operating contributions. There-fore Great-Britain is the country receiving the highest infrastructure revenuecontribution in our data-set. In Norway infrastructure operation is almostentirely financed from government contributions. Even though investments
29

in infrastructure are mainly financed from direct government contributions,the indebtedness of Jernbaneverket has been slightly increasing in recentyears. Nevertheless, compensation for public services are comparably high.
6 Conclusion
The aim of this paper was to assess the funding structure of European coun-tries by collecting data that allow to assess differences in the way governmentsupport is granted to the railway sector. We used a database of NERA (2004)as starting point of our analysis and developed a taxonomy for the classifica-tion of government support to the railway sector. In a second step we took adeeper look on the funding structure of eight European countries, collectedrelevant payments and evaluated the consistency of already existing studies.To compare government support between countries we classified paymentsaccording to seven categories that reflect the main areas of support as wellas the organizational structure of the European railway sector. This involvespayments that are reflected as income in the profit and loss statement ofinfrastructure managers (category 1), payments to support infrastructure in-vestment (2), Public Service Compensations (3), payments for investmentsin rolling stock (4), pension and staff obligations (5), payments to reducethe indebtedness of undertakings, debt service payments and the takeover ofhistorical debt (6) as well as obligations related to the restructuring of therailway sector (7).
The quality and the coverage of available data on government contribu-tions has increased in recent years. Nevertheless, there are still large gapsin data for some countries. It is clear that due to the complexity of the sec-tor a full coverage of data cannot be achieved. However, no major politicalattempts have been made to standardize the reporting of government fundsbeing spent on the sector, even though they account for a significant portionof Government budgets. All of the investigated countries support their na-tional railway sector by means of direct contributions that are either grantedfor the provision of transport services, the operation of the infrastructure aswell as to support investments in the infrastructure or rolling stock. Thetotal height of government contributions as well as the breakdown of pay-ments differ to a large extent between countries. Furthermore there are largedifferences between the degrees to which government contributions cover op-erating and capital expenditure of infrastructure and transport provision. Wecompared the development of government support using two main indicators:passenger-ton-kilometer (ptkm) and the number of inhabitants. The averagecontribution per ptkm amounted to 0.08 PPP adjusted Euro over the obser-
30

vation period (other support than for infrastructure and transport provisionexcluded). Norway receives the highest contribution per ptkm (0.14 Euro)while Sweden funds every demanded ptkm with an average of only 0.03 Euro.Taxpayer cost (support per inhabitant) amount on average to 139 Euro perinhabitant, with Switzerland receiving the highest average contribution perinhabitant (308 Euro) and Great-Britain the lowest (80 Euro).
Concerning the focus of government support there are also large differ-ences between countries. We identified a tendency to mainly two financingmodels. In our data-set there are countries that either focus their supportpayments on the operation of the infrastructure, which implies lower net-work charges and thus a lower amount of necessary PSC, or they focus onthe support of transport services with a higher degree of cost coverage ofnetwork charges and thus a lower amount of operating contributions thatneed to be paid to the infrastructure manager. However, we also find that insome countries no clear tendency can be observed. These countries apply a’hybrid’like financing approach where the infrastructure manager as well astransport operators receive an almost equal share of operating contributions.Concerning the financing of infrastructure investments two approaches exist.Either investments are financed from government contributions or from fundsof the infrastructure manager, which usually involves issuing debt. Some in-frastructure managers are compensated for the additional burden of financingdebt while other IM need to cover these expenses from network charges andrevenue contributions.
In 2012 Italy as well as Switzerland have granted the majority of sup-port for infrastructure investment (around 60 percent of total funds) whilefunds for investments made up only 20 percent in France and 10 percent inGreat-Britain. In Spain, Germany, Sweden and Norway infrastructure in-vestment contributions amount to around 40 percent of total support whichwas granted for infrastructure and transport provision. Germany is the onlycountry in our data set that doesn’t provide revenue contributions to thenational infrastructure manager. Respective payments are rather small inFrance, Italy as well as Switzerland, while they account for 90 percent oftotal support in Great-Britain. In Norway and Switzerland support for in-frastructure operation amounted to around 40 percent in 2012. The major-ity of funds is granted for the provision of transport services in France andGermany, while the shares of Public Service Compensations are comparablysmall in other countries. There is a negative relationship between fundingprovided as revenue contributions to the infrastructure and the compensationfor the operation of public services, i.e. countries that are supporting publicservices to a higher degree, grant less funds per ptkm to the infrastructure
31

manager. However, some countries provide funding above the average ratio,which could be an indicator for an inefficient funding structure. This findingneeds to be further investigated, especially under consideration of revenuefrom other sources.
Apart from government funding revenue from passenger and freight trans-port as well as access charges that are paid for the use of the infrastructure arethe main sources of funding. The degree of cost coverage of infrastructure ac-cess charges varies between 3 percent (Norway) and 95 percent (Germany).The degree of investments financed from government contributions differsalso to a great extent between countries. While in some countries infras-tructure investments are financed mainly from government funds (Germany,Norway) other countries finance investments through debt issued by the na-tional infrastructure manager (France, Spain, Great-Britain). This resultsin increasing debt and additional financial burden. Thus, a company thatis indebted to a high degree could be limited in its capacity to act and thussuffer under inefficiencies. This is why researchers argue that a sustainable fi-nancing structure can have a large influence on the performance of the sector(see Beck et al. 2013).
References
Arrigo, U., Di Foggia, G., 2013. Schemes and Levels of State Aid to Rail In-dustry in Europe: Evidences from a Cross-Country Comparison. EuropeanJournal of Business and Economics 8 (3).
Arrigo, U., Di Foggia, G., 2014. Policy-Oriented Insights to Enhance Effec-tiveness and Efficiency of Public Spending: Comparing the Determinantsof Subsidies to Railways in key European Countries. International Journalof Managerial Studies and Research (IJMSR) Volume 2, Issue 11, Decem-ber 2014, 23–35.
Banverket, 2008. Swedish Rail Sector Development: Banverket’s sector re-port.
Beck, A., Bente, H., Schilling, M., 2013. Railway Efficiency - An Overviewand a Look at Opportunities for Improvement. International TransportForum, Discussion Paper (2013-12).
Best, A., Gorlach, B., van Essen, H., Schroten, A., Becker, U., Gerike, R.,2006. Size, Structure and Distribution of Transport Subsidies in Europe: A
32

report to the European Environment Agency. Final Report, 11 December2006.
Bundesamt fur Statistik BFS, 2013. Schweizerische Eisenbahnrechnung 2011.
Dehornoy, J., 2011. The evolution of public funding to the rail sector in5 European countries - a comparison. Fourth Annual Competition andRegulation in Network Industries (CRNI) Conference, Brussels.
Deville, X., Verduyn, F., 2012. Implementation of EU legislation on railliberalisation in Belgium, France, Germany and The Netherlands: NBBWorking Paper No 221. National Bank of Belgium. Brussels.
ECORYS Nederland BV, 2006. Analysis of the financial situation of railwayundertakings in the European Union: Report to the European CommissionDG-TREN. ECORYS Nederland BV. Rotterdam.
Engel, E., Fischer, R., Galetovic, A., 2010. The economics of infrastructurefinance: Public-Private Partnerships versus public provision. EIB PapersVolume 15, No. 1, 40–69.
European Commission, 2007. Annexes to the Communication on monitoringdevelopment of the rail market: Commission Staff Working Document,COM(2007) 609. Brussels.
European Commission, 2008. Multi-annual contracts for rail infrastructurequality: Communication from the Commission to the Council and theEuropean Parliament, COM(2008) 54 final. Brussels.
European Commission, 2014. Fourth report on monitoring development ofthe rail market: Report from the Commission to the Council and theEuropean Parliament, COM(2014) 353 final, Brussels, 13.06.2014.
Eurostat, 2005. Three decisions on Italy: SCIP, ISPA and Concessionarid’imposta: Euro-Indicators News Release 65/2005. Eurostat Press Office.Luxembourg.
Eurostat, 2008. Methodological treatment of the capital injections intoRENFE-Operadora in 2006: Letter to Instituto Nacional de EstadisticaMadrid. European Commission, Eurostat Directorate C: National and Eu-ropean Accounts. Luxembourg.
Finger, M., Putallaz, Y., van de Velde, D., 2015. Solid infrastructure financ-ing for efficient rail systems: Results of an workshop organized by SNCFGroup’s strategy team.
33

Instituto Nacional de Estadistica, 2007. Methodological treatment of the cap-ital injections into ADIF: Letter from the National Statistics Office toEurostat. Madrid, Spain.
Laurino, A., Ramella, F., Beria, P., 2015. The economic regulation of railwaynetworks: A worldwide survey. Transportation Research Part A: Policyand Practice 77, 202–212.
Nash, C., 2010. European rail reform and passenger services – the next steps.Research in Transportation Economics 29 (1), 204–211.
Nash, C., Nilsson, J.-E., Link, H., 2011. Comparing three models for intro-duction of competition into railways – is a Big Wolf so Bad after all? CTSWorking Paper 2011:19, Centre for Transport Studies Stockholm.
NERA, 2004. Study of the Financing of and Public Budget Contributions toRailways: A Final Report for European Commission, DG TREN. NERANational Economic Research Associates, London.
NERA, 2005. Public Budget Contributions to the Railways: A Report toDeutsche Bahn AG. NERA National Economic Research Associates, Lon-don.
OECD, 2010. The PSE Manual - OECD’s Producer Support Estimate andrelated Indicators of Agricultural Support. OECD Trade and AgricultureDirectorat, Paris.
Perkins, S., 2005. The Role of Government in European Railway Investmentand Funding. China Railway Investment & Finance Reform Forum, Bei-jing, China.
RGL Forensics, Frontier Economics and Aecom, 2009. Study on Separationof accounts of railway undertakings and rail infrastructure managers: FinalReport for the European Commission.
Steer Davis Gleave, 2005. RAILIMPLEMENT - Implementation of EU Direc-tives 2001/12/EC, 2001/13/EC and 2001/14/EC: Final Report for the Eu-ropean Commission, Directorate General for Energy and Transport. SteerDavies Gleave, Bologna, Italy.
Valsecchi, C., ten Brink, P., Bassi, S., Withana, S., Lewis, M., Best, A.,Oosterhuis, F., Dias Soares, C., Rogers-Ganter, H., Kapenhengst, T., 2009.Environmentally Harmful Subsidies: Identification and Assesment: Finalreport for the European Commission’s DG Environment. Institute for Eu-ropean Environmental Policy (IEEP), London and Brussels.
34

van de Velde, D., Nash, C., Smith, A., Mizutani, F., Uranishi, S., Lijesen, M.,Zschoche, F., 2012. EVES-Rail, Economic effects of Vertical Separation inthe railway sector: Full technical report for CER, Community of EuropeanRailways and Infrastructure Companies, by inno-V (Amsterdam) in coop-eration with University of Leeds - ITS, Kobe University, VU AmsterdamUniversity and civity management consultants.
35