Embed Size (px)
Citation preview

Washington DC, June 2011
state and trends of the
₂₀₁₁
Pub
lic D
iscl
osur
e A
utho
rized
Pub
lic D
iscl
osur
e A
utho
rized
Pub
lic D
iscl
osur
e A
utho
rized
Pub
lic D
iscl
osur
e A
utho
rized
Pub
lic D
iscl
osur
e A
utho
rized
Pub
lic D
iscl
osur
e A
utho
rized
Pub
lic D
iscl
osur
e A
utho
rized
Pub
lic D
iscl
osur
e A
utho
rized


state and trends of the
₂₀₁₁
Environment Department
This report was prepared by a World Bank team comprising ofNicholas Linacre, Alexandre Kossoy and Philippe Ambrosi,with important contributions from Manelle Aït Sahlia, Veronique Bishop,Benoît Bosquet, Christophe de Gouvello, Taisei Matsuki and Monali Ranade.

2 | State and Trends of the Carbon Market 2010
New Approach for the 2011 Report
With the goal of providing a comprehensive discus-sion of the issues that most affected the carbon mar-ket in 2010, the authors of last year’s report have re-structured State and Trends of the Carbon Market for 2011. The report still provides an overview of the size and reach of the carbon markets, as well as the evolu-tion of the Kyoto flexibility mechanisms, and offers potential supply/demand scenarios for coming years. However, it no longer includes a detailed breakdown of carbon transactions, as in previous years. Instead, the report provides a more in-depth analytical dis-cussion of the regulation and policy issues that will guide future carbon market development.
The findings and opinions expressed in this report are the sole responsibility of the authors and should not be cited without permission. They do not necessarily reflect the views of the World Bank Group, its Executive Directors, the countries they represent or of any of the participants in the carbon funds or facilities man-aged by the World Bank. The World Bank does not guarantee the accuracy of the data included in this work. This report is not intended to form the basis of an investment decision. The bound-aries, colors, denominations, and other information shown in this work do not imply any judgment on the part of The World Bank concerning the legal status of any territory or the endorsement or acceptance of such boundaries.
Section 1 photo credit: Jan Golinski / UNFCCCSection 2 photo credit: Veer IncorporatedSection 3 photo credit: Veer IncorporatedSection 4 photo credit: Dreamstime LLCSection 2 photo credit: Veer IncorporatedDesign: Studio GrafikPrinting: Westland Printers

State and Trends of the Carbon Market 2010 | 3
Acknowledgements
The report benefitted greatly from colleagues in the carbon market who provided their written contribu-tions and perspectives: Olga Christyakova, Martin Lawless, and Damien Meadows.
We wish to extend our gratitude to those who offered their cooperation and insights during the elaboration of this report: Edwin Aalders, Schwan Badirou Gafari, Ellysar Baroudy, Jean-Jacques Barberis, François Beaurain, Luca Bertali, Agnès Biscaglia, Martina Bosi, Ana Bucher, Marcos Castro, Lance Coogan, Isabelle Curien, Keith Davis, Karen Degouve de Nuncques, Eduardo Dopazo, Jason Dunn, Saša Eichberger, Emmanuel Fages, Laura Fidao, Greger Flodin, James Foster, Javier Freire Coloma, Martin French, Pranab Ghosh, Matthew Gray, Pierre Guigon, Isabel Hagbrink, Katherine Hamilton, Henrik Hasselknippe, Carina Heimdal, Andrew Howard, Robert M. Hunt, Daigo Koga, Werner Kornexl, Ganna Korniyenko, Benoît Leguet, Gautier Le Maux, Mark Lewis, Zijun Li, Peter Lloyd, Thomas Marcello, Allison McManus, Rachel Mountain,
Akiko Nishimae, John O’Brien, Klaus Oppermann, Molly Peters-Stanley, Vicky Pollard, Leila Pourarkin, Neeraj Prasad, Brice J. M. Quesnel, David Rapin, Heike Reichelt, Renaud Scardina, Kai-Uwe Barani Schmidt, Guido Schmidt-Traub, Chandra Shekhar Sinha, Trevor Sikorski, Milo Sjardin, Yvon Slingenberg, Sara Stahl, Andy Stone, Aurelien Tignol, Sarah Underwood, Laurent Valiergue, John Virgoe, Alessandro Vitelli, George Waldburg, Xueman Wang, Vikram Widge, Yevgen Yesyrkenov, Peter Zapfel, Ivan Zelenko, Elizabeth Zelljadt.
We would also like to thank all of those who took time to respond to the market survey. Without your responses the report would be less than it is. Finally, we want to thank the many market participants strug-gling to make a difference on a critical global issue.
The State and Trends of the Carbon Market 2011 re-ceived financial support from the CF-Assist Program, managed by the World Bank Institute (WBI).

4 | State and Trends of the Carbon Market 2010
List of Abbreviations and Acronyms
AAU Assigned Amount UnitAAUPA AAU Purchase AgreementAB 32 Global Warming Solutions Act of 2006 Assembly Bill 32ACR American Carbon RegistryADB Asian Development BankAfDB African Development BankAMF Autorité des Marchés FinanciersAWG-KP Ad Hoc Working Group on Further Commitments for Annex I Parties under the Kyoto ProtocolAWG-LCA Ad Hoc Working Group on Long-term Collaborative ActionCAPEX Capital ExpendituresCARB California Air Resources Board CAR Climate Action ReserveCCP central counterpartiesCCS Carbon Capture and StorageCCX Chicago Climate ExchangeCDM Clean Development MechanismCER Certified Emission ReductionCFL Compact Fluorescent LampCFTC Commodities Future Trading CommissionCH4 MethaneCMM Coal Mine MethaneCMP Conference of the Parties serving as the Meeting of the Parties to the Kyoto ProtocolCPF Carbon Partnership FacilityCO2 Carbon Dioxide CO2e Carbon Dioxide EquivalentCOP Conference of the PartiesCPA CDM Programme ActivityCPRS Carbon Pollution Reduction SchemeCP-1 First Commitment Period under the Kyoto ProtocolCRE Commission de régulation de l’énergie CRT Climate Reserve TonneDNA Designated National AuthorityDOE Designated Operational EntityEB Executive Board of the CDMEBRD European Bank for Reconstruction and DevelopmentEC European CommissionECX European Climate ExchangeEE Energy EfficiencyEIT Economy in TransitionEITE Emission-intensive, Trade-exposed ER Emission Reduction ERPA Emission Reduction Purchase AgreementERU Emission Reduction UnitESC Energy Savings CertificateESS Energy Savings SchemeETS Emissions Trading Scheme EU European Union
EUA European Union AllowanceEU ETS European Union Emissions Trading SchemeEURIBOR Euro Interbank Offered RateFSB Financial Stability BoardGDP Gross Domestic ProductGGAS New South Wales Greenhouse Gas Reduction SchemeGHG Greenhouse GasGIS Green Investment SchemeHFC HydrochlorofluorocarbonIFC International Finance CorporationIEA International Energy AgencyIFI International Financial InstitutionIFRS International Financial Reporting StandardIMF International Monetary FundIRR Internal Rate of ReturnJ-VETS Japan-Voluntary Emissions Trading SchemeJI Joint ImplementationJISC Joint Implementation Supervisory CommitteeKM Kyoto MechanismLBFR Law on Banking and Financial RegulationLDC Least Developed CountryLEDS Low Emission Development StrategieslCER Long-term Certified Emission ReductionLFG Landfill GasLoA Letter of ApprovalLRET Large-scale Renewable Energy TargetLULUCF Land Use, Land Use Change and ForestryMAD Market Abuse DirectiveMCCF Multilateral Carbon Credit FundMDB Multilateral Development BankMiFiD Markets in Financial Instruments DirectiveMOP Meeting of the Parties MRET Mandatory Renewable Energy TargetMRV Measurement, Reporting and VerificationNAMA Nationally Appropriate Mitigation ActionNCCP National Climate Change PolicyNDRC National Development and Reform Commission N2O Nitrous OxideNAP National Allocation PlanNPV Net Present ValueNZ ETS New Zealand Emissions Trading SchemeNZU New Zealand UnitOECD Organization for Economic Co-operation and DevelopmentOTC Over-the-CounterpCER Primary Certified Emission ReductionPDD Project Design DocumentPFC PerfluorocarbonPIN Project Idea NotePMR Partnership for Market ReadinessPoA CDM Programme of Activities

State and Trends of the Carbon Market 2010 | 5
POI Proof of IdentityPP Project ParticipantR&D Research and DevelopmentRE Renewable EnergyREC Renewable Energy CertificateREDD Reducing Emissions from Deforestation and Forest DegradationREDD+ Extends REDD by including sustainable forest management, conservation of forests, and enhancement of carbon sinks.REMIT Regulation on Energy Markets Integrity and TransparencyRET Renewable Energy TargetRGGI Regional Greenhouse Gas InitiativeRMU Removal UnitsCER Secondary Certified Emission ReductionSCF Strategic Climate FundSEI Sustainable Energy Initiative
SF6 Sulfur HexafluorideSME Small and Medium-size EnterpriseSRES Small-scale Renewable Energy SchemetCO2 Ton of Carbon DioxidetCO2e Ton of Carbon Dioxide EquivalenttCER Temporary Certified Emission ReductionUN United NationsUNEP United Nations Environment ProgrammeUNFCCC United Nations Framework Convention on Climate Change VAT Value-added TaxVCS Voluntary Carbon StandardVCU Verified Carbon UnitsVER Verified Emission ReductionWB World BankWCI Western Climate InitiativeWTI West Texas IntermediateWTO World Trade Organization

6 | State and Trends of the Carbon Market 20106 | State and Trends of the Carbon Market 2010

State and Trends of the Carbon Market 2010 | 7
Contents
Acknowledgements 3Overview 9Introduction 11
1. International Developments—Cancun Conference and the Post-2012 Environment 13 1.1 Improvements to the Clean Development Mechanism and Continuing Support for Market Mechanisms 14 1.2 Climate Finance and the Establishment of the Green Climate Fund 16 1.3 Recognition of Developing Country Contributions to Mitigation and a Better Representation of Forestry-related Activities 16 1.4 Beyond Cancun—Market Perceptions 17 1.5 Conclusions 18
2. Domestic Policy Developments—A Story of Fragmentation 21 2.1 Annex I Countries 22 2.2 Non-Annex I Countries 33 2.3 Linking Emissions Trading Schemes 36 2.4 Conclusions 37
3. How Market Participants Transact—Risk and Regulation 39 3.1 The Changing Regulatory Landscape—The Impact of Financial Market Reforms 39 3.2 Over-the-counter Market—Regulation is Coming Down the Pike 42 3.3 Primary Issuance Market—Emission Allowance Auctions 42 3.4 Secondary Markets—Controlling Risk and Ensuring Transparency and Accountability 43 3.5 Conclusions 45
4. Carbon and Climate Finance 47 4.1 Kyoto Market—A post-2012 Facing Low Demand and Low Supply 47 4.1.1 CERs—What Did or Did Not Happen in 2010? 48 4.1.2 ERUs—What Lies Ahead? 51 4.1.3 AAUs—Responding to the Lack of Demand 52 4.2 Voluntary Markets 53 4.3 Mobilizing Low-carbon Investment—Beyond Carbon Revenue Streams 55 4.4 New Asset Classes Coming to the Market 57 4.4.1 REDD and REDD+ 57 4.4.2 Sustainable Land Management—Agricultural Soil Carbon 59 4.5 Conclusions 59
5. Outlook - Demand and Supply Balance 61 5.1 Demand and Supply Balance Through to 2012 61 5.1.1 Sovereign Demand 61 5.1.2 Private Sector Demand 63 5.1.3 Supply Through to 2012 64 5.1.4 Residual Demand—136 MtCO2e 64 5.2 Will there be Enough Emission Reductions Generated in Developing Countries After 2012? 65 5.3 Conclusions 68
Methodology 70Appendix 1. Assumptions for Estimates of Potential Demand for Offsets from non-Annex I Countries 71Glossary 73

8 | State and Trends of the Carbon Market 2010
BoxesBox 1. The European Union’s Approach to International Credits 15Box 2. North American Offset Prices 31Box 3. Brief History of Carbon Market Fraud in the EU ETS 40Box 4. A Point of View on the EU ETS 41Box 5. Voluntary Markets 54
FiguresFigure 1. Carbon Market at a Glance, Market Values, 2004–10 9Figure 2. Respondents Views on a Future Multilateral Framework 18Figure 3. RGGI Forecast Emissions 33
TablesTable 1. Carbon Market at a Glance, Market Values, 2004–10 9Table 2. Current State Climate Change Policies in Australia 23Table 3. Current Province Climate Change Policies in Canada 23Table 4. EU ETS Phase II Auctions 25Table 5. Aviation Directive Summary 27Table 6. Some Examples of U.K. Complementary Measures 28Table 7. Current Climate Change Policies in Japan 29Table 8. Offset Supply and Demand Forecast for California’s Cap-and-trade 31Table 9. Current U.S. State and Regional Climate Change Policy in North America 32Table 10. Current Trading Platforms in China 35Table 11. Voluntary Market Prices and Volumes 54Table 12. Supply and Demand in Perspective–Kyoto Market Balance, 2008–12 62Table 13. Potential Demand, Contracted Supply, and Residual Demand, 2008–12 65Table 14. Scenarios of Potential Demand for Offsets Generated in non-Annex I Countries 2013–20 (MtCO2e). 66Table 15. Estimates of Potential Supply Under the CDM and JI up to 2020 (MtCO2e) 67

State and Trends of the Carbon Market 2010 | 9
Overview
HOW LONG CAN A MARKET BE IN TRANSITION?
After five consecutive years of robust growth, the total value of the global carbon market stalled at $142 billion (see Figure 1).1,2 Suffering from the lack of post-2012 regulatory clarity, the value of the primary Clean Development Mechanism (CDM) market fell by double-digits for the third year in a row, ending lower than it was in 2005, the first year of the Kyoto Protocol. The Assigned Amount Unit (AAU) market, which grew in 2009 with strong sov-ereign support, shrank as well in 2010. Finally, the market that had grown most in 2009—allowances under the U.S. Regional Greenhouse Gas Initiative (RGGI)—saw that year’s gains erased in 2010.
As these segments declined, the dominance of the European Union Allowances (EUAs) market became more pronounced than ever. EUAs accounted for 84 percent of global carbon market value in 2010. With the value of the secondary CDM transactions taken into account, the share of the carbon market primar-ily driven by the EU Emissions Trading Scheme (EU ETS) rose to 97 percent, dwarfing the remaining segments of the market (see Table 1).
Secondary CDM
Other Offsets
Primary CDM
Other Allowances
EU ETS Allowances
Car
bon
Mar
ket E
volu
tion
($ b
illio
n)
Figure 1. Carbon Market at a Glance, Market Values, 2004–10
Carbon Market Evolution, values ($ billion), 2004–10
EU ETS Allowances
Other Allowances
Primary CDM Secondary CDM
Other Offsets Total
2005 7.9 0.1 2.6 0.2 0.3 11.0
2006 24.4 0.3 5.8 0.4 0.3 31.2
2007 49.1 0.3 7.4 5.5 0.8 63.0
2008 100.5 1.0 6.5 26.3 0.8 135.1
2009 118.5 4.3 2.7 17.5 0.7 143.7
2010 119.8 1.1 1.5 18.3 1.2 141.9
Sources: World Bank, Thomson Reuters Point Carbon, Bloomberg New Energy Finance and Ecosystem MarketplaceNote: Numbers may not add up due to rounding.
Table 1. Carbon Market at a Glance, Market Values, 2004–10
Sources: World Bank, Thomson Reuters Point Carbon, Bloomberg New Energy Finance, and Ecosystem Marketplace
1. For details on the methodology refer to the Methodology Section at the end of the report. 2. Still, carbon volumes traded contracted by over 10 percent during the same period as prices declined in some markets.

10 | State and Trends of the Carbon Market 2010
The global carbon market stagnated even as the global economy stabilized and began a tentative recovery in 2010. The carbon market growth halted at a particu-larly inopportune time: 2010 proved to be the hottest on record,3 while emission levels continued their seem-ingly inexorable rise.4 In the end, however, the year may be remembered most for the political opportunities that arose, yet were ultimately failed to materialize.
In the United States, there was not enough sup-port to pass federal cap-and-trade legislation. The Japanese Basic Act on Global Warming, which passed in the Diet’s lower house, was halted when the government lost control of the upper house a few months later. Australia’s Senate failed to pass the Carbon Pollution Reduction Scheme and Australia’s government subsequently chose to freeze its plans for a domestic cap-and-trade scheme. Even the year’s rare good news, namely the Republic of Korea’s adoption of the Framework Act on Low Carbon Green Growth, turned sour when the government, facing internal opposition, decided in early 2011 to delay the implementation of its cap-and-trade scheme until 2015.
At the global regulatory level, in mid-2010 the CDM Executive Board temporarily halted issuance of Certified Emission Reductions (CERs) from hydro-fluorocarbon (HFC-23) projects over baseline con-cerns. As concerns revealed not to be substantiated, issuance resumed at the end of the year. Nonetheless, the European Commission soon thereafter proposed qualitative restriction in the EU ETS of carbon off-sets related to CDM industrial gas projects. The pro-posal was adopted by the European Member States, which in January 2011 confirmed the ban of CERs from HFC and nitrous oxide (N2O) adipic acid projects starting, in 2013.
Some of the most notable events in 2010 and early 2011 were unfortunately related to framework loop-holes and criminal activities directed against the EU ETS. In addition to the “carousel” value-added tax (VAT) fraud that surfaced in 2009,5 the last 18 months witnessed the sale of recycled CERs, phish-ing attempts on Germany’s national registries and a series of subsequent cyber-thefts that undermined the European market,6 highlighting security short-comings and increasing the urgency of stakeholders’ pleas to strengthen infrastructure.
Nevertheless, there were a few reasons for guarded optimism in 2010. Europe started to craft its road-map for moving toward a competitive low-carbon economy in 2050. Also, while the Copenhagen cli-mate summit in 2009 failed to meet expectations, progress was achieved during the Conference of the Parties in Cancun last December. Such progress was welcomed by the market and helped to restore some confidence in UN negotiations on climate change. Still, as Parties continue their deliberations,7 much remains to be done. Differences among major emit-ters regarding domestic priorities, approaches and ambition will need to be resolved before a robust and sustainable international agreement can emerge.
While the international regulatory environment re-mains uncertain, national and local initiatives have noticeably picked up and may offer the potential to collectively overcome the international regulatory gap. The most prominent of these initiatives is California’s cap-and-trade scheme, which is expected to begin op-erating in 2012. Other low-carbon initiatives, includ-ing domestic emission reduction targets, clean energy certificate programs, voluntary and pre-compliance do-mestic offset trading programs, and carbon exchanges, have gained increasing traction in developing econo-mies such as Brazil, China, India, and Mexico. These initiatives signal that, one way or another, solutions that address the climate challenge will emerge.
3. 2010 ranked as the warmest year on record, together with 2005 and 1998, World Meteorological Organization (WMO) (http://www.wmo.int/pages/mediacentre/press_releases/pr_906_en.html). 2010 tied with 2005 as the warmest year of the global surface temperature record, beginning in 1880, The U.S. National Oceanic and Atmospheric Administration (NOAA) (http://www.noaanews.noaa.gov/sto-ries2011/20110112_globalstats.html).4. 2010 ended with CO2 emission concentrations of 389.68 ppm, NOAA, January 7, 2011.5. Some of the issues evidenced in 2009 were explained in detail in the State and Trends 2010 report: http://siteresources.worldbank.org/INTCARBONFINANCE/Resources/State_and_Trends_of_the_Carbon_Market_2010_low_res.pdf Access date 15 April 2011.6. Over 3 million European Union [emission] allowances (EUAs) were reported stolen from at least 5 European national registries from No-vember 2010 until January 2011. As a consequence, the transfer of allowances has been temporarily suspended in the European registries and the spot-trade of carbon assets was frozen for several days early 2011 (http://ec.europa.eu/clima/news/index_en.htm).7. Under the Ad Hoc Working Group on Further Commitments for Annex I Parties under the Kyoto Protocol and the Ad Hoc Working Group on Long-term Cooperative Action under the Convention.

State and Trends of the Carbon Market 2010 | 11
Introduction
This report covers many of the issues facing the carbon market today. The Overview provides high-lights from the report and information on the size of the carbon market. The body of the report covers international developments (Section 1), domestic policies (Section 2), risk and regulation of markets (Section 3), carbon and climate finance (Section 4), and market outlook (Section 5).
The international developments section briefly dis-cusses the positive outcomes for carbon markets and climate finance resulting from the Cancun Conference. International developments have im-portant implications for market confidence and hence vital private capital investment. The report includes the results from a market sentiment sur-vey conducted by the World Bank’s Carbon Finance Unit. The results show that, despite well-document-ed short-term uncertainty surrounding the carbon market, respondents to are optimistic about the pos-sibility of a binding agreement in the longer term. This section of the report also establishes the broad parameters used in the projection scenarios devel-oped in the market outlook.
The report provides a summary of some national and regional mitigation measures being implement-ed, including important Nationally Appropriate Mitigation Actions (NAMAs) from some major emitters. The information in this section supports the increasingly common perspective among market
participants of the emergence of a fragmented but workable carbon market that could further evolve through linking and acceptance of similar levels of ambition.
An issue related to domestic and regional mitiga-tion policies is the considerable activity currently surrounding carbon market risk and regulatory de-velopment. This section provides details on many is-sues faced by policy makers, regulators, and market participants. Considerable change occurred during 2010 and is expected to continue over 2011. There is convergence on regulatory approaches as more European countries move toward robust and trans-parent regulation of the carbon market to ensure market and public confidence. This includes a re-evaluation of such long-held principles as universal participation.
While Sections 1–3 summarize the geopolitical and regulatory environment affecting the carbon market, Section 4 on carbon and climate finance provides a more detailed analysis of the impacts of these factors on current Kyoto primary market prices, volumes, and market behavior. This part of the report also briefly discusses climate finance and new emerging asset classes such as REDD plus. Finally, in Section 5, the report brings all this information together in the market outlook, which discusses the supply and demand balance going forward.
12 | State and Trends of the Carbon Market 2010
SECTION1

State and Trends of the Carbon Market 2010 | 13
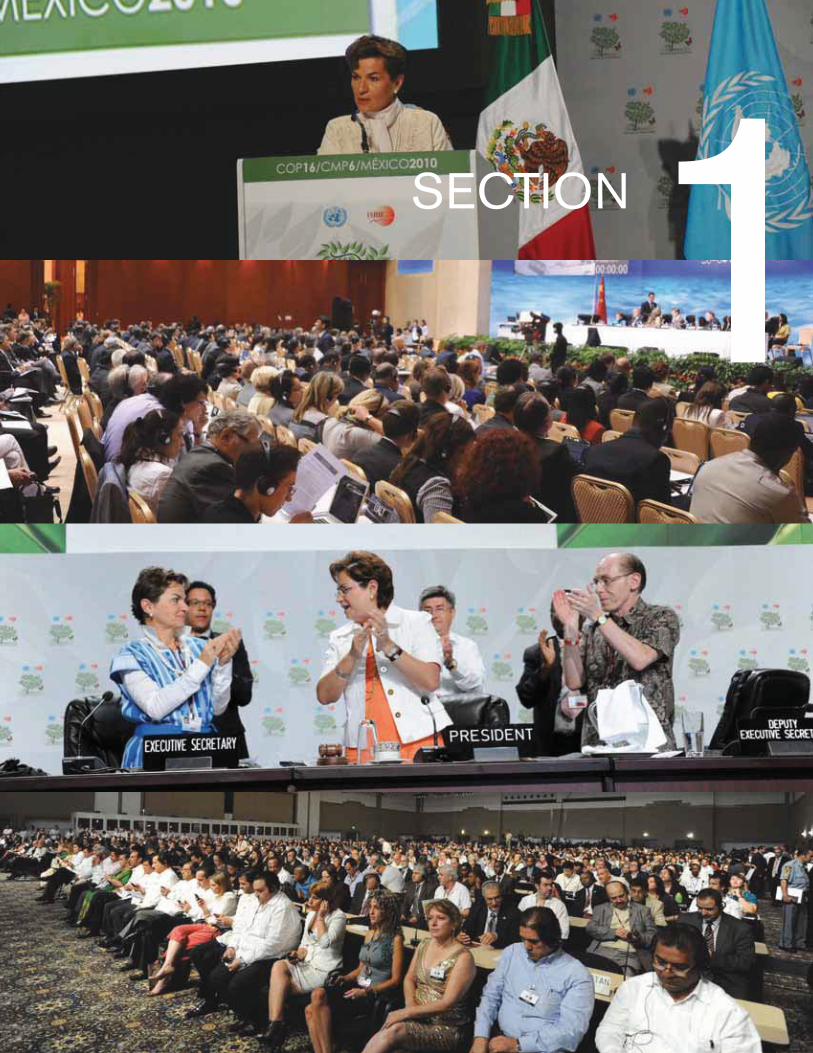
International Developments—Cancun Conference and the Post-2012 Environment
THE DISAPPOINTMENT resulting from the United Nations Climate Change
Conference in Copenhagen in 2009 was replaced by the renewed optimism of the
Cancun Conference in 2010, which restored some market confidence in the United
Nations Framework Convention on Climate Change (UNFCCC) process. At the Cancun
Conference, countries agreed to keep average global temperature warming below 2˚C in
comparison to preindustrial levels. They also agreed to review the adequacy of this com-
mitment with the possibility of moving to a 1.5˚C target as new scientific evidence on
impacts becomes available.8
The Cancun Conference resulted in a number of oth-er positive outcomes for carbon markets and climate finance:9 the decision to establish the Green Climate Fund; the continuation of the Kyoto mechanisms, including important improvements and reforms to the Clean Development Mechanism (CDM); the inclusion of reduced deforestation through REDD and REDD plus (REDD+); and the formal recogni-tion of developing countries’ pledges of Nationally Appropriate Mitigation Actions, which are aimed at achieving a deviation in their GHG emissions com-pared to business-as-usual trends by 2020.
The best case analysis from the 2010 United Nations Environment Programme (UNEP) Emissions Gap Report estimates that developed and devel-oping country pledges are 60 percent of what is needed by 2020 to place the world onto a trajec-tory that will keep global temperature rises to less
than 2˚C in comparison to preindustrial levels.10 The International Energy Agency (IEA 2010) also estimates that the 2˚C goal will only be achievable with a dramatic scaling-up effort,11 particularly from major emitters.
This section focuses on key elements of the Cancun Agreements and current market sentiment.
“Developed and developing country pledges are 60 percent of what is needed by 2020 to place the world onto a trajectory that will keep global temperature rises to less than 2˚C”
8. http://unfccc.int/files/meetings/cop_16/application/pdf/cop16_kp.pdf Access date 28 Feb 2011.9. The United Nations Climate Change Conference took place in Cancun, Mexico, from 29 November to 10 December 2010. It encom-passed the sixteenth Conference of the Parties (COP) and the sixth Conference of the Parties serving as the Meeting of the Parties to the Kyoto Protocol (CMP).10. UNEP 2010. Emissions Gap Report. “Are the Copenhagen Accord Pledges Sufficient to Limit Global Warming to 2˚C or 1.5˚C? A Preliminary Assessment.” http://www.unep.org/publications/ebooks/emissionsgapreport/ Access date 9 March 2011.11. IEA 2010. World Energy Outlook. http://www.worldenergyoutlook.org/ Access date 29 March 2011.

14 | State and Trends of the Carbon Market 2010
1.1 IMPROVEMENTS TO THE CLEAN DEVELOPMENT MECHANISM AND CONTINUING SUPPORT FOR MARKET MECHANISMS
The major area of improvement and reform of the CDM is arguably the introduction of standardized baselines and monitoring methodologies. These deci-sions are aimed at maintaining environmental integ-rity, but reducing transaction costs, enhancing trans-parency and predictability, and facilitating access to underrepresented project types and regions.12
Such decisions that seek to improve the access of under-represented regions in the CDM are particu-larly important in the face of the EU’s decision to restrict CERs from CDM projects registered after December 31, 2012 to those generated by projects located in least developed countries (LDCs). A sig-nificant change is needed in order to be able to scale up the virtual absence of LDC projects from the CDM pipeline (for further details see Section 4.1).
Emissions trading and the project-based mechanisms under the Kyoto Protocol will continue to be avail-able to Annex I Parties as means to meet their quan-tified emission limitation and reduction objectives,13 but the future of the Kyoto Protocol itself remains unresolved. Additionally the Cancun Conference under the Ad Hoc Working Group on Long-term Cooperative Action under the Convention (AWG-LCA) negotiation track agreed to consider the estab-lishment of one or more market-based mechanisms to enhance the cost-effectiveness of mitigation ac-tions by Parties.14
These changes are not yet providing the regulatory predictability the market is seeking. Clarity is still urgently needed on the post-2012 international cli-mate change regime and on countries’ plans to use market-based mechanisms to meet domestic GHG objectives. As highlighted in Box 1, the European Union is seeking to provide such clarity.
“Emissions trading and the project-based mechanisms under the Kyoto Protocol will continue to be available to Annex I Parties as means to meet their quantified emission limitation and reduction objectives, but the future of the Kyoto Protocol itself remains unresolved.”
12. COP 16. Decision -/CMP.6. “ Further guidance relating to the clean development mechanism.” http://unfccc.int/files/meetings/cop_16/conference_documents/application/pdf/20101204_cop16_cmp_guidance_cdm.pdf Access date 4 Feb 2011.13. Outcome of the work of the Ad Hoc Working Group on Further Commitments for Annex I Parties under the Kyoto Protocol at its fifteenth session http://unfccc.int/files/meetings/cop_16/application/pdf/cop16_kp.pdf Access date 28 Feb 2011.14. http://unfccc.int/resource/docs/2010/cop16/eng/07a01.pdf#page=2 Access date 29 April 2011.

State and Trends of the Carbon Market 2010 | 15
BOX 1. The European Union’s Approach to International Credits
The strategic importance of a broad and deep international carbon market
The EU is by far the biggest buyer of emission re-duction credits15 from third countries, providing for continued financial flows and technology transfer to developing countries, also after 2012 even in the ab-sence of the certainty that should come from a new international agreement to effectively tackle climate change. If designed properly and underpinned by ro-bust targets, the international carbon market can play a major role in global abatement efforts, and create increasing financial flows to support mitigation activi-ties in developing countries.
Design limitations of the CDM
To make this happen, we need to improve our existing tools and create new, advanced and scaled-up mar-ket mechanisms. Despite its successes, as a project-based system—and one that in practice covers so far a limited number of project types—the CDM is simply not designed to drive the structural transformation of industry in developing countries that the transition to a low-carbon economy requires. By definition, offset mechanisms such as the CDM cannot reduce global emissions in net terms—yet this is what is needed if we are to keep global warming below 2°C.
Need for a move to sectoral crediting mechanisms
That is why the EU and other Parties are advocat-ing the creation of new and more ambitious sec-toral mechanisms that make it possible to tap into far greater emissions-saving potentials and provide more revenue for financing reductions in developing countries. Because only actions that go beyond a previously defined threshold or target are credited, this would ensure net benefits to the atmosphere.
Sectoral mechanisms and the CDM could co-exist but the CDM should increasingly focus on less developed countries, where it should continue to target low cost options for saving emissions. For the major emerging economies in the developing world, the CDM should gradually be replaced by new sectoral mechanisms.
Provisions in the climate and energy package
Several provisions of the EU’s domestic climate leg-islation provide the tools to incentivise a move away from the CDM and towards sectoral mechanisms. The EU ETS and Effort Sharing Decision foresee that after 2012, even without an international agreement, these instruments can provide a market for CERs from new projects in Least Developed Countries. In addition, CERs from existing projects in other coun-tries can continue to be used. The EU’s standards on HFC-23 and adipic N2O credits, which have been discussed extensively and will apply from 2013, cre-ate more space for other CDM credits and can pro-mote a shift to credits from bilateral or multilateral agreements. The EU is interested in engaging with our partners to set up such pilots so that the experi-ence gained can inform the international negotiations. Participation in the initiatives such as the Partnership for Market Readiness can facilitate the designing of robust pilots and finding interested partners.
EU’s vision for the international carbon market
Europe’s vision for the international carbon market remains to link up the EU ETS with other compat-ible emission trading systems around the world and to develop robust sectoral mechanisms. We see an eventual network of links between cap and trade sys-tems as forming the backbone of an expanded and strengthened international carbon market. In this per-spective, sectoral crediting is a necessary step be-yond the CDM’s project-based approach.
Kindly provided by Damien Meadows, Head of Unit, International Carbon Market, Aviation and Maritime, DG Climate Action European Commission.
15. Project-based emission reductions are commonly referred to as credits, offset credits or offsets.

16 | State and Trends of the Carbon Market 2010
1.2 CLIMATE FINANCE AND THE ESTABLISHMENT OF THE GREEN CLIMATE FUND
The Cancun Agreements formalized the commit-ment made by developed countries in Copenhagen to mobilize $100 billion a year by 2020 to address the mitigation and adaptation needs of developing countries. Importantly, the Cancun Conference de-cided to establish a “Green Climate Fund.” It is envi-sioned that the Fund will manage a portion of these additional resources.
The sources of funding are not yet clear. It is ex-pected, however, that a portion of the $100 billion will come from private sources, which may be mo-bilized through carbon markets.16 Carbon finance and other financial instruments will be important for leveraging these funds to scale up the financing of mitigation and adaptation activities. Policy mak-ers will need to ensure that market-based capacity is maintained in both the public and private sectors to ensure mobilization of the pledged climate finance.
The Fund will be governed by the Green Climate Board, comprising 24 members as well as alternate members, with an equal number of members from developing and developed country Parties. The World Bank will serve as the interim trustee of the Green Climate Fund, subject to a review three years after operationalization of the Fund. An independent sec-retariat will support the operations of the Fund.17
The Green Climate Fund will be designed by a Transitional Committee in accordance with the terms of reference. The Transitional Committee comprises 40 members, with 15 members from
developed country Parties and 25 members from de-veloping country Parties, with members having the necessary experience and skills, notably in the area of finance and climate change.18
1.3 RECOGNITION OF DEVELOPING COUNTRY CONTRIBUTIONS TO MITIGATION AND A BETTER REPRESENTATION OF FORESTRY-RELATED ACTIVITIES
The Cancun Conference formally recognized devel-oping countries’ Nationally Appropriate Mitigation Actions (NAMAs), which were pledged after the Copenhagen Conference. In the context of sustain-able development, developing countries agreed to undertake NAMAs aimed at reducing emissions rela-tive to business-as-usual emissions in 2020—contin-gent upon the provision of finance, technology, and capacity building provided by developed countries.19 A registry is to be established under the UNFCCC to record NAMAs seeking international support and to facilitate matching of finance, technology, and capacity-building support to these actions.20
At the time of writing, 45 countries have regis-tered a wide range of mitigation actions with the UNFCCC. These actions range from broad enunci-ated targets with varying form—absolute reductions on business-as-usual (BAU) or intensity limits—with varying base years21,22 to detailed programs of activities with and without quantified GHG emis-sion reductions.23,24
The particularity of NAMAs, especially those seek-ing support from international sources, is a need for
16. Final Report of the UN High-Level Advisory Group on Climate Change Financing. 2010. http://www.un.org/wcm/content/site/climat-echange/pages/financeadvisorygroup/pid/13300 Access date 29 March 2009.17. http://unfccc.int/cancun_agreements/green_climate_fund/items/5869.php Access date 29 April 2011.18. http://unfccc.int/files/na/application/pdf/07a01-1.pdf Access date 29 April 2011.19. List of Nationally Appropriate Mitigation Actions of Developing Country Parties. http://unfccc.int/meetings/cop_15/copenhagen_ac-cord/items/5265.php Access date 8 April 2011. 20. COP 16. 2010. Outcome of the work of the Ad Hoc Working Group on Long-term Cooperative Action under the Convention. http://unfccc.int/files/meetings/cop_16/application/pdf/cop16_lca.pdf Access date 28 Feb 2011.21. Mexico aims at reducing its GHG emissions up to 30 percent with respect to the business as usual scenario by 2020. http://unfccc.int/files/meetings/cop_15/copenhagen_accord/application/pdf/mexicocphaccord_app2.pdf Access date 8 April 2011.22. India will endeavor to reduce the emissions intensity of its GDP by 20-25 percent by 2020 in comparison to the 2005 level. http://unfccc.int/files/meetings/cop_15/copenhagen_accord/application/pdf/indiacphaccord_app2.pdf Access date 8 April 2011.23. Brazil has a range of quantified emissions reductions from different activities. http://unfccc.int/files/meetings/cop_15/copenhagen_ac-cord/application/pdf/brazilcphaccord_app2.pdf Access date 07 April 2011. 24. Ethiopia quantifies many reduction actions in terms of power generation potential http://unfccc.int/files/meetings/cop_15/copenha-gen_accord/application/pdf/ethiopiacphaccord_app2.pdf Access date 08 April.

State and Trends of the Carbon Market 2010 | 17
monitoring, reporting, and verification (MRV) ca-pacity. Clear boundaries and tracking will be neces-sary to avoid overlapping and double counting sup-port for NAMAs.
The Cancun Conference recognized the much broader contribution of forest-related activities in efforts to limit climate change. Specific recogni-tion was given to the reduction of deforestation and degradation through such initiatives as REDD and REDD+. This means that forests will be included in any future agreement with the possibility of generat-ing international credits from these activities.25
Measurement of forest carbon will occur at the na-tional level, thus enabling programmatic approach-es. This measure is expected to encourage greater geographic diversification (for further details see Section 4.4).
1.4 BEYOND CANCUN —MARKET PERCEPTIONS
Developing countries are united in their support for a second commitment period of the Kyoto Protocol, as a critical element of the international community’s fight against climate change. Among the developed countries, the European Union continues to support the multilateral framework through the UNFCCC26 and the Kyoto Protocol, but some countries have expressed opposition to the extension of the Kyoto Protocol in which only some countries are obligated to reduce emissions.27 The uncertain future of the international negotiations affects market percep-tions. Participants partly deal with this uncertainty through scenario analysis.
The New Zealand government, as part of the cur-rent review of the New Zealand Emissions Trading Scheme (NZ ETS), has identified three broad sce-narios for the evolving near-term international
framework. The scenarios include the following: (1) a continuation of the current multilateral framework with legally binding limits on emissions; (2) a non-binding multilateral accord; and (3) no multilateral framework in the short-term.28
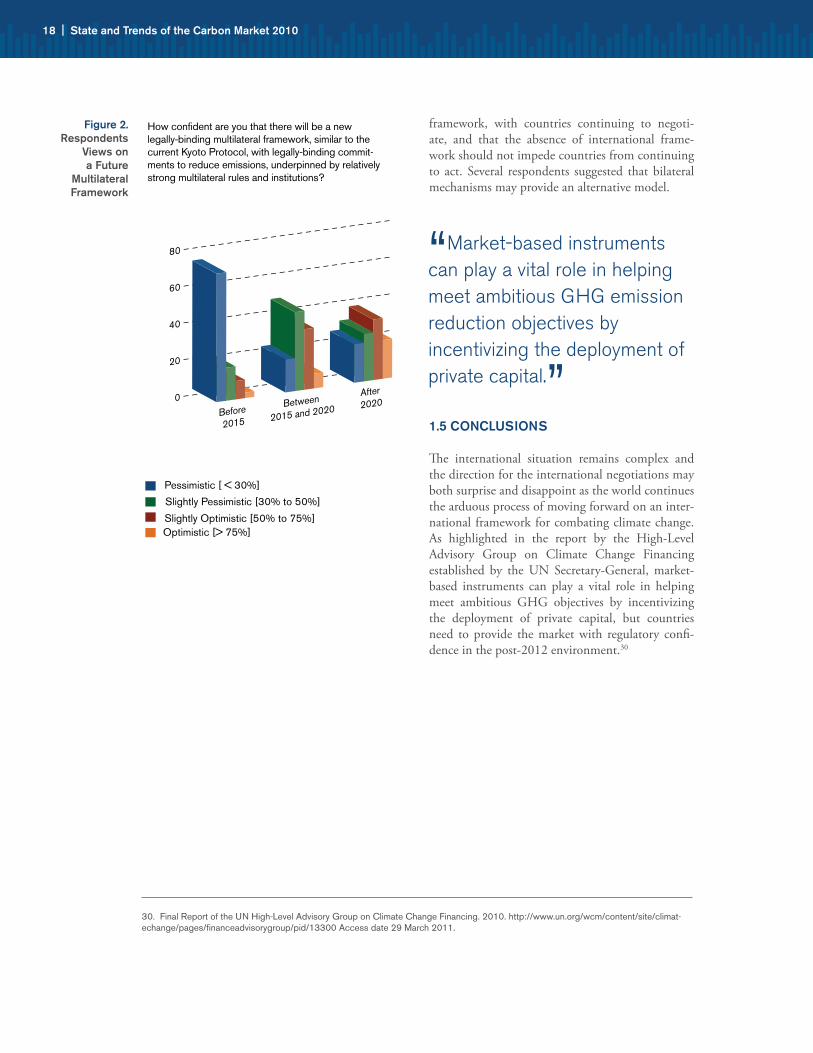
As scenario development is important for market participants, the World Bank’s Carbon Finance Unit surveyed them on five questions regarding the suc-cess of an international agreement post-2012:
1. How confident are you that there will be a new le-gally binding multilateral framework, similar to the current Kyoto Protocol, with legally binding com-mitments to reduce emissions, underpinned by relatively strong multilateral rules and institutions?
2. How confident are you that there will be a new political multilateral accord, building on the Copenhagen Accord and Cancun Agreements, un-der which countries make voluntary political com-mitments, supported by at least some multilateral rules and institutions, but without legal force?
3. How likely do you think it is that there will be no multilateral framework or accord in the near term? Countries continue to negotiate, but in the interim, action is mainly driven at a national level or through other international links.
4. Do you think a comprehensive agreement under the auspices of the UNFCCC is fundamental for countries to address the climate change agenda?
5. Are there other scenarios, apart from those listed above, which should be considered?
Survey respondents were not optimistic that a bind-ing international agreement could be achieved in the short term. However, they were optimistic about the possibility of a binding agreement in the longer term (see Figure 2). Respondents believed that a nonbinding multilateral accord is more likely in the short term.29
The majority of respondents also believed that there will be a short-term hiatus in the international
25. COP 16. 2010. Outcome of the work of the Ad Hoc Working Group on Long-term Cooperative Action under the Convention. http://unfccc.int/files/meetings/cop_16/application/pdf/cop16_lca.pdf Access date 4 Feb 2011.26. EC Communication. 2010. “International climate policy post-Copenhagen: Acting now to reinvigorate global action on climate change.” http://ec.europa.eu/clima/documentation/finance/docs/com_2010_86.pdf Access date 19 March 2011.27. For example, Japan. See Ministry of Foreign Affairs of Japan. “Japan’s Basic Position at COP16 as well as on the Kyoto Protocol.” http://www.mofa.go.jp/announce/media/2010/12/1203.html Access date 19 March 2011.28. New Zealand Emissions Trading Scheme Review 2011. http://www.climatechange.govt.nz/emissions-trading-scheme/ets-review-2011/issues-statement.pdf Access date 19 March 2011.29. The survey did not test respondents’ views on the relative likelihood of a binding agreement compared to the multilateral accord.
18 | State and Trends of the Carbon Market 2010
framework, with countries continuing to negoti-ate, and that the absence of international frame-work should not impede countries from continuing to act. Several respondents suggested that bilateral mechanisms may provide an alternative model.
1.5 CONCLUSIONS
The international situation remains complex and the direction for the international negotiations may both surprise and disappoint as the world continues the arduous process of moving forward on an inter-national framework for combating climate change. As highlighted in the report by the High-Level Advisory Group on Climate Change Financing established by the UN Secretary-General, market-based instruments can play a vital role in helping meet ambitious GHG objectives by incentivizing the deployment of private capital, but countries need to provide the market with regulatory confi-dence in the post-2012 environment.30
Figure 2. Respondents
Views on a Future
Multilateral Framework
How confident are you that there will be a new legally-binding multilateral framework, similar to the current Kyoto Protocol, with legally-binding commit-ments to reduce emissions, underpinned by relatively strong multilateral rules and institutions?
Optimistic [> 75%]Slightly Optimistic [50% to 75%]
Slightly Pessimistic [30% to 50%]
Pessimistic [ < 30%]
“Market-based instruments can play a vital role in helping meet ambitious GHG emission reduction objectives by incentivizing the deployment of private capital.”
30. Final Report of the UN High-Level Advisory Group on Climate Change Financing. 2010. http://www.un.org/wcm/content/site/climat-echange/pages/financeadvisorygroup/pid/13300 Access date 29 March 2011.

State and Trends of the Carbon Market 2010 | 19

20 | State and Trends of the Carbon Market 2010
SECTION2

State and Trends of the Carbon Market 2010 | 21
2Domestic Policy Developments—A Story of Fragmentation
THIS SECTION SUMMARIZES SOME OF THE POLICY INITIATIVES around the
world, with an in-depth examination of the EU ETS, which is the international driving
force of carbon markets. The information in this section supports the increasingly common
perspective among market participants of the emergence of a fragmented but workable
international carbon market that could further evolve through linking and acceptance of
similar levels of ambition. The list of countries is not exhaustive. It illustrates the diversity
of approaches and measures being either considered or implemented in several countries.
To drive emission reductions, countries are adopt-ing a range of domestic policies that fall under one of the following categories: cap-and-trade schemes, baseline and credit mechanism, renewable energy and energy efficiency certificates, carbon taxes, sub-sidies, and emission standards. In many cases, mul-tiple policy approaches are being used that may be complementary and sometimes contradictory, and which often have different costs and benefits accru-ing at different times and geographical scales. It is important in the overall design of mitigation policies that policy makers consider the interaction between similar and different—market and non-market—policy measures at different jurisdictional levels.
For example, the current discussion in the EU on the set-aside of EUAs results from the interaction of energy efficiency measures and the EU ETS. The introduction in the United Kingdom of a Carbon Price Floor31 provides another example were some market analysts argue that the price floor may of-fer limited benefits due to interactions with the EU ETS.32 The interaction between individual voluntary actions and Australia’s now shelved Carbon Pollution Reduction Scheme (CPRS) also shows the need for careful design.33 Finally, some academic work argues that multiple policies such as cap-and-trade and re-newable energy policies will not necessarily create additional environmental benefits.34
31. As announced in the U.K. 2011 Budget from April 1, 2013, the United Kingdom will introduce a carbon price floor for the power sector. The floor, which in reality constitutes a tax floor rather than a price floor, will start at around £16 per ton of carbon dioxide (tCO2) and follow a linear path to target £30/tCO2 in 2020 (both in 2009 prices). The carbon price support rates in 2013–14 will be equivalent to £4.94/tCO2. Indicative rates for 2014–15 and 2015–16 are £7.28/tCO2 and £9.86/tCO2 respectively. http://www.hm-treasury.gov.uk/consult_carbon_price_support.htm Access date 4 April 2011. 32. Point Carbon. Carbon Market Daily March 25. “UK carbon floor could distort EUA price.”33. The shelved Australian CPRS provides an example of voluntary action interacting with a cap-and-trade scheme. http://www.climat-echange.gov.au/government/initiatives/cprs/cprs-progress/voluntary-action.aspx Access date 27 April 2011. The situation is more compli-cated when AAUs are considered, as the countries initial assigned amount must also be reduced to preserve the effects of the voluntary action on global reductions.34. See Fischer C., and L. Preonas. 2010. “Combining Policies for Renewable Energy,” Resources for the Future. Fischer and Preonas ar-gue that in the presence of a binding emissions cap, additional renewable policies do not affect emissions. Their effects on the ETS should be recognized. Policies that expand renewables make it easier to meet the cap, driving down allowance prices to the benefit of the relatively dirty sources and to the detriment of the relatively clean nonrenewable sources. http://www.rff.org/documents/RFF-DP-10-19.pdf Access date 2 April 2011.

22 | State and Trends of the Carbon Market 2010
2.1 ANNEX I COUNTRIES
Australia—Preparing to Price Carbon
During 2010, the Australian government an-nounced plans for a carbon price mechanism with a three-to-five-year annually increasing fixed-price period that will transition into an emissions trading scheme. The government will start pricing carbon on July 1, 2012, subject to negotiating an agreement with a majority in both houses of Parliament and passing legislation this year.35
With support from the Greens and Independents, the government should be able to pass the legisla-tion in both houses of Parliament as a result of the incoming senate in July 2011. The legislation would need to pass during the spring Parliamentary sittings (August–November 2011) to avoid being delayed until the autumn Parliamentary sittings (February–March 2012).
Australia is also developing a domestic offsets scheme known as the Carbon Farming Initiative (CFI),36 which aims to provide new economic opportunities to farmers, forest growers, and landholders and to help the environment by reducing carbon pollution. Some offsets may be allowed during the fixed-price period.37
At the national level, the Renewable Energy Target (RET) scheme remains the main market-based mechanism in use to achieve emission reductions.
During 2010, the Australian Parliament passed legislation to separate the RET into two parts, with the new scheme commencing on January 1, 2011. The RET was separated into the Large-scale Renewable Energy Target (LRET) and the Small-scale Renewable Energy Scheme (SRES).38
Splitting the RET scheme was in response to indus-try pressure to reform the scheme after a collapse in prices of certificates resulting from a flood of Renewable Energy Certificates (RECs) from small-scale projects. It is reported that the generation of RECs was partly due to the interaction of state and federal renewable energy incentives and the RET scheme.39,40
The Australian government also closed several emis-sion reduction programs in 2010, including the Home Insulation Program, which was terminated because of safety concerns,41 and the Green Loans program.42
At the state level, various initiatives are in place, including the New South Wales Greenhouse Gas Reduction Scheme (GGAS), which commenced on January 1, 2003. It is one of the first manda-tory greenhouse gas emissions trading schemes in the world. GGAS aims to reduce greenhouse gas emissions associated with the production and use of electricity. It achieves this by using project-based activities to offset the production of greenhouse gas emissions (see Table 2 for further details on state cli-mate change policies in Australia).
Canada—Provinces Forging Ahead
At the federal level, Canada is taking a sectoral ap-proach to GHG emissions, largely focusing on ob-taining reductions from the transport sector. Canada has aligned its international commitment with that made by the United States and plans to reduce to-tal greenhouse gas emissions by 17 percent from 2005 levels by 2020. The target is inscribed in the Copenhagen Accord.
35. http://www.pm.gov.au/press-office/climate-change-framework-announced Access date 24 Feb 2011.36. http://www.climatechange.gov.au/government/initiatives/carbon-farming-initative.aspx Access date 21 February 2011.37. http://www.garnautreview.org.au/update-2011/update-papers/up6-carbon-pricing-and-reducing-australias-emissions.pdf Access date 22 March 2011.38. http://www.climatechange.gov.au/government/initiatives/renewable-target.aspx Access date 07 April 2011.39. “Price Hit Put Wind Power Projects in Limbo.” Herald Sun. http://www.heraldsun.com.au/ipad/price-hit-puts-wind-projects-in-limbo/story-fn6bfmgc-1225976910971 Access date 29 April 2011.40. “Renewable Energy Target Needs a Rethink.” The Australian. http://www.theaustralian.com.au/business/industry-sectors/renewable-energy-target-needs-a-rethink/story-e6frg976-1225785558866 Access date 29 April 2011.41. http://www.climatechange.gov.au/government/programs-and-rebates/hisp.aspx Access date 03 February 2011.42. http://www.climatechange.gov.au/government/programs-and-rebates/green-loans.aspx Access date 03 February 2011.

State and Trends of the Carbon Market 2010 | 23
On September 1, 2010, Canada released final Renewable Fuel Regulations that requires an aver-age renewable fuel content of 5 percent in gasoline, which will come into effect starting December 15, 2010. On June 23, 2010, the government of Canada announced that it is committed to introducing
tough new regulations on coal-fired electricity gen-eration that will have a significant impact on reduc-ing emissions from the electricity sector.51
Various initiatives are in place at the Canadian prov-ince level. For further details see Table 3.
Table 2. Current State Climate Change Policies in Australia
Policy Jurisdiction Comment
Solar Feed-in Tariffs Victoria, South Australia, Queensland, Australian Capital Territory, New South Wales, Northern Territory, Western Australia
State-based incentives for small-scale solar.
Greenhouse Gas Reduction Scheme GGAS43
New South Wales One of the first mandatory greenhouse gas emis-sions trading schemes in the world.
Greenhouse Gas Reduction Scheme GGAS44
Australian Capital Territory The ACT Government introduced a Greenhouse Gas Reduction Scheme that commenced on January 1, 2005. It mirrors the NSW Greenhouse Gas Reduction Scheme (GGAS).
State Energy Efficiency Schemes.
Victoria, South Australia, New South Wales Multiple schemes with similar objectives.
Policy Jurisdiction Details
Greenhouse Gas Reduction (Cap and Trade) Act 200845
British Columbia
British Columbia is the first province in Canada to introduce an act allowing a cap-and-trade scheme. The proposed scheme enables British Columbia to link to the emissions trad-ing schemes being developed with other jurisdictions.
Greenhouse Gas Reduction (Cap and Trade) Act 200846
Ontario The amendment enables Ontario to have a cap-and-trade emissions trading scheme, and to link to the emissions trading schemes being developed with other jurisdictions.
Cap-and-Trade Consultation (March 2011)47
Manitoba Manitoba plans to move forward with legislation enabling the creation of a cap-and-trade scheme to reduce greenhouse gas emissions, subject to public consultations.
Act to amend the Environment Quality Act and other legislative provi-sions in relation to climate change48
Quebec The amendment enables Quebec to have a cap-and-trade emissions trading scheme, and to link to the emissions trading schemes being developed with other jurisdictions.
Climate Change and Emissions Management Act49
Alberta Covers facilities with GHG emissions greater than 100,000 tons. Requires emissions intensity reductions of 12 percent.
Management and Reduction of Greenhouse Gases Act50
Saskatchewan Covers facilities with GHG emissions greater than 50,000 tons. Requires emission reductions from a baseline by 2 percent per year from 2010 to 2019.
Table 3. Current Province Climate Change Policies in Canada
43. http://www.greenhousegas.nsw.gov.au/ Access date 03 February 2011.44. http://www.greenhousegas.nsw.gov.au/act_scheme.asp Access date 07 April 2011.45. http://www.leg.bc.ca/38th4th/3rd_read/gov18-3.htm Access date 16 March 2011.46. http://www.e-laws.gov.on.ca/html/regs/english/elaws_regs_090452_e.htm Access date 17 March 2011.47. http://www.gov.mb.ca/conservation/climate/capandtradeconsultation.html Access date 17 March 2011.48. http://www2.publicationsduquebec.gouv.qc.ca/dynamicSearch/telecharge.php?type=5&file=2009C33A.PDF Access date 17 March 2011.49. http://www.qp.alberta.ca/570.cfm?frm_isbn=9780779740956&search_by=link Access date 17 March 2011.50. http://www.environment.gov.sk.ca/Default.aspx?DN=9192fbe8-23fe-4077-ac7d-30b7b269bdbf Access date 17 March 2011.51. http://www.climatechange.gc.ca/default.asp?lang=En&n=4FE85A4C-1 Access date 17 March 2011.

24 | State and Trends of the Carbon Market 2010
Europe—A Year of Consolidation and a Roadmap for 2050
During 2010, the EU ETS continued to be the world’s most important market mechanism for reducing GHG emissions. The EU ETS operates in 30 countries (the 27 EU Member States plus Iceland, Liechtenstein, and Norway) and is expected to reduce total emissions by 21 percent in 2020 compared to 2005 levels. The year-on-year declines in GHG emissions experienced by installations in 2008 and 2009 now appear to be over, with GHG emissions rising by 3.3 percent—a rebound due to the end of the economic downturn in 2010. When accounting for new entrants, the overall year-on-year increase is 3.5 percent.52,53
Europe continues the task of transitioning to a low-carbon society by 2050. The European Commission (EC) is looking beyond the 2020 objectives and is establishing a plan to meet the long-term target of reducing domestic emissions by 80 to 95 percent by mid-century—Europe’s Roadmap for 2050. During the year, there was speculation that Europe would move to reduce GHG emissions by 30 percent by 2020 compared to 1990 levels. The EC has since reaffirmed that the EU ambition is to achieve a 20 percent reduction by 2020 on 1990 levels.54
From 2013, the revised EU ETS Directive provides for:55
-ances, which will reduce each year by 1.74 percent of the average annual level of the Phase II cap. The cap will deliver an overall reduction of 21 percent below 2005 verified emissions by 2020.
at 2,039,152,882 allowances, that is just under 2.04 billion allowances.56 This is not the final 2013 cap.57
least 50 percent of allowances will be auctioned from 2013, compared to about 3 percent in Phase II. This will improve the economic ef-ficiency of the EU ETS. In most EU Member States, there will be 100 percent auctioning for the power sector.
from outside the EU will be limited to no more than 50 percent of the reductions required in the EU ETS. This is a reduction from Phase II. It means a much larger share of emission reduc-tions will happen within the EU borders.
will be redistributed to Member States with low-er gross domestic product (GDP) in the interests of solidarity. These are mostly the newer eastern Member States.
of the revenues from auctioning to tackle cli-mate change both in the EU and in developing countries.
-age concerns, industrial sectors will be allocat-ed allowances for free on the basis of product benchmarks. The benchmarks will be set on the basis of the average of the top 10 percent most greenhouse gas–efficient installations in the EU. Sectors deemed at significant risk of relocating production outside of the EU because of the carbon price—carbon leakage—will receive 100 percent of the benchmarked allocation for free. Sectors not deemed at significant risk of carbon
52. On April 5, 2011, the EC published updated data for a perimeter corresponding to 94.4 percent of 2009 volumes: the 10,500 plants reporting in both years (out of 12,802 listed in CITL, 82 percent) emitted 1,833 Mt in 2010 compared to 1,775 Mt in 2009, resulting in a 3.3 percent increase in emissions. Source: SG orbeo Carbon Specials, April 7, 2011, Société Générale.53. http://ec.europa.eu/clima/documentation/ets/registries_en.htm Access date 4 April 2011.54. http://ec.europa.eu/clima/documentation/roadmap/docs/com_2011_112_en.pdf Access date 24 March 2011.55. EU ETS Phase III (2013-20) http://www.decc.gov.uk/eu_ets/phase_iii/phase_iii.aspx Access date 07 April 2011.56. The EU ETS cap is the total amount of emission allowances to be issued for a given year under the EU Emissions Trading System (EU ETS). The total number of allowances, that is, the “cap,” determines the maximum amount of emissions possible under the EU ETS. The cap will decrease each year by 1.74 percent of the average annual total quantity of allowances issued by the Member States in 2008–12. This annual reduction will continue beyond 2020, but it may be subject to revision not later than 2025. http://ec.europa.eu/clima/policies/ets/cap_en.htm Access date 07 April 2011.57. The 2013 cap that has been released so far is not the final 2013 cap. It is the Phase II scope provisional cap and does not account for the cap for aviation and new sectors and gases entering the ETS from 2013. Deutsche Bank estimates that the 2013 cap for the Phase II scope should be worth 1,966 Mt. Counting the 1.3 Mt cap for opt-ins and the 106.9 Mt 2013 cap for new sectors and gases, Deutsche Bank estimates the 2013 cap should be worth 2,074 Mt, not accounting for aviation. From Curien I., and M. C. Lewis. 2011. “May You Live in Interesting Times ...” Market Update from Deutsche Bank.

State and Trends of the Carbon Market 2010 | 25
leakage will receive 80 percent of their bench-marked allocation for free in 2013, declining to 30 percent in 2020 and 0 percent in 2027.
entrants’ reserve of the EU ETS will be used to support the demonstration of carbon capture and storage (CCS) and innovative renewable technologies.
hospitals so as to reduce regulatory burden.
During 2010 and early 2011, the allowance auction (primary issuance) market (see Section 3.3) con-tinued to develop, with Germany and the United
Kingdom auctioning allowances. Access to Kyoto Protocol project offsets (namely CDM and JI) were further limited with constraints on project types (see Section 4.1).65 The EU ETS continued to be plagued by market irregularities—the EU has addressed these issues through a series of directives and pro-posed measures (see Section 3.4).66 Further activity occurred on coverage with airlines expected to join the EU ETS in 2012.67 Member States continued to develop complementary measures to comply with the “Effort Sharing Decision” that places an annual binding GHG emission targets on sectors not cov-ered by the EU ETS for the period 2013–20.68
Table 4. EU ETS Phase II Auctions58
Member State
Average Annual Quantity to Be Auctioned
Comments
Germany 40 million (about 9 percent) Auctions from January 2010 are held weekly—spot auctions on Tuesday and futures auctions on Wednesday—at the European Energy Exchange (EEX).59 During 2008 and 2009 a banking group, on behalf of the German government, sold allowances at the market price at the relevant exchanges.
United Kingdom
17 million (7 percent) An auction schedule with dates and volumes for future auctions, up to November 2011, is available on the U.K. Debt Management Office.60 As of January 2010, a noncompetitive bidding facility has also been put in place.61
Netherlands 3.2 million (3.7 percent) The first auction of 4 million allowances was carried out by the Dutch State Treasury Agency and took place on April 15, 2010.62 On October 27 and November 18, 2010, two further auctions of 2 million allow-ances each were held by Climex.63 The Dutch authorities have not yet decided the details of the auctioning of the remaining allowances (some 8 million).
Austria 400,000 (1.3 percent) For 2009–12, two auctions per year are foreseen.64
Ireland 557,065 (0.5 percent) Ireland sold 185,000 allowances in January 2009, and the same number again in February 2010. The remainder for the 2008–12 period is also likely to be sold instead of auctioned.
Hungary 2.7 million (2 percent) Frequency and scope are not yet decided.
58. Auction details for EU ETS Phase II. http://ec.europa.eu/clima/policies/ets/auctioning_second_en.htm Access date 07 April 2011.59. European Energy Exchange (EEX). http://www.eex.com/en/EEX/Products%20%26%20Fees/Emission_Rights/EUA%20Primary%20Market%20Auction Access date 07 April 2011.60. U.K. Debt Management Office EU Emissions Trading Scheme Web site. http://www.dmo.gov.uk/index.aspx?page=ETS/AuctionInfo Access date 07 April 2011.61. http://www.decc.gov.uk/en/content/cms/what_we_do/change_energy/tackling_clima/emissions/eu_ets/euets_phase_ii/auctioning/noncompbidding/noncompbidding.aspx Access date 07 April 2011.62. http://www.dsta.nl/english/Subjects/Carbon_auctions Access date 07 April 2011.63. http://www.climex.com/government-auctions.aspx Access date 07 April 2011.64. Austrian National Registry. http://www.emissionshandelsregister.at/emission_trading/auction/index.html Access date 07 April 2011.65. In taking this action, the EC identified the high proportion of CDM credits generated by the small number of industrial gas projects that, the EC argues, favor a limited number of advanced developing countries and do not encourage geographic diversification. http://europa.eu/rapid/pressReleasesAction.do?reference=IP/11/56 Access date 4 Feb 2011.66. The details are discussed in the section on “How Market Participants Transact—Risk and Regulation.”67. http://eur-lex.europa.eu/LexUriServ/LexUriServ.do?uri=OJ:L:2009:008:0003:0021:EN:PDF Access date 22 March 2011.68. http://ec.europa.eu/clima/policies/effort/framework_en.htm Access date 22 March 2011.

26 | State and Trends of the Carbon Market 2010
Auctioning
Table 4 illustrates the auctioning of some EU allow-ances. During Phase II (2008–12) the majority of al-lowances continued to be allocated for free. However, when Phase III starts in 2013, about half of the allow-ances are expected to be auctioned. On November 11, 2010, the EU Commission formally adopted the EU Auctioning Regulation. This is an EU-wide regulation that determines how some 1 billion allowances will be auctioned each year during Phase III.
The regulation provides for a common platform that all Member States can use, but Member States may also opt out from the common platform. To host their own platforms, Member States had to submit a notification to the Commission by February 18, 2011, which would then be proposed to and voted on by the Climate Change Committee.69
The European Commission proposes to auction 120 million allowances in 2012, ahead of the start of Phase III. The volume of early auctions is to be de-termined by means of an amendment to the EU ETS Auctioning Regulation. It is expected that almost 60 percent of the total allowances auctioned in Phase III will enter the market via the common platform.
The procurement of both the common auction plat-form and the single auction monitor that will over-see auctions on all auction platforms is ongoing.70
Germany, Poland, and the United Kingdom have in-formed the Commission that they intend to opt out of the planned common platform for auctioning emission allowances for Phase III of the EU ETS. Each will in-stead appoint its own auction platform.
Aviation
Direct emissions from aviation account for about 3 percent of the EU’s total GHG emissions, with the majority of these emissions from international flights, for example, flights between two Member States or between a Member State and a non-EU country.71 Aviation emissions are growing rapidly, however, so the EU plans to cover emissions from all domestic and international flights that arrive at or depart from an EU airport.
The expansion of coverage will translate into approx-imately 200 million of additional allowances annu-ally. Of this number, 82 percent of the allowances will be freely allocated to aircraft operators and 15 percent will be auctioned. The remaining 3 percent will be allocated to a special new entrant’s reserve (see Table 5 for a summary).72
The move to include aviation in the EU ETS is not without controversy with airlines in both China and the United States opposing the inclusion of their emissions in the EU ETS. The Air Transport Association of America (ATA)—acting on behalf of American Airlines, Continental, and United Airlines—is challenging the EU directive in the courts.73 News reports also suggest that the China Air Transport Association (Cata) has threatened re-taliatory measures if Chinese airlines are required to participate in the EU ETS, with Cata—acting on behalf of three Chinese airlines—joining the ATA’s existing legal challenge to the EU directive.74
The EC Directive on Aviation has provisions for ex-empting non-EU based airlines from the EU ETS where similar measures are in place.75
69. U.K. Department of Energy and Climate Change. The EU Emissions Trading System: Preparing for Phase III (and implementation of Phase II). http://www.decc.gov.uk/assets/decc/what%20we%20do/global%20climate%20change%20and%20energy/tackling%20cli-mate%20change/emissions%20trading/eu_ets/phase%20iii/1016-euets-preparing-phase-III.pdf Access date 07 April 2011.70. The first auctions of EUAs will take place at the latest in 2013. No firm date is fixed yet, as the volume of any “early auctions” before 2013 remains to be decided. The first auctions of European Union Aviation Allowances (EUAAs) will take place in 2012, which is the year when aircraft operators come under the EU ETS. http://ec.europa.eu/clima/faq/ets/auctioning_third_en.htm Access date 07 April 2011.71. http://europa.eu/rapid/pressReleasesAction.do?reference=MEMO/11/139 Access date 24 March 2011.72. http://www.decc.gov.uk/en/content/cms/what_we_do/change_energy/tackling_clima/emissions/eu_ets/aviation/aviation.aspx Access date 23 March 2011.73. http://www.airlines.org/News/Releases/Pages/news_5-27-10.aspx Access date 22 March 2011.74. http://www.pointcarbon.com/news/1.1522877 Access date 31 March 2011. 75. DIRECTIVE 2008/101/EC OF THE EUROPEAN PARLIAMENT AND OF THE COUNCIL of 19 November 2008 amending Directive 2003/87/EC so as to include aviation activities in the scheme for greenhouse gas emission allowance trading within the Community. Where a third country adopts measures for reducing the climate change impact of flights departing from that country which land in the Community, the Commission, after consulting with that third country, and with Member States shall consider options available in order to provide for optimal interaction between the Community scheme and that country’s measures. Where necessary, the Commission may adopt amend-ments to provide for flights arriving from the third country concerned to be excluded from the aviation activities in the EU ETS. http://eur-lex.europa.eu/LexUriServ/LexUriServ.do?uri=OJ:L:2009:008:0003:0021:EN:PDF Access date 07 April 2011.

State and Trends of the Carbon Market 2010 | 27
Effort Sharing
The “Effort Sharing Decision” establishes annual binding GHG emission targets for Member States for emissions not included in the EU ETS for the 2013–20 period. It is the responsibility of Member States to define and implement policies and mea-sures to limit emissions of non-EU ETS covered sectors under the Effort Sharing Decision. As a result EU Member States are likely to implement comple-mentary measures in such areas as transport, build-ings, agriculture, and waste (see Table 6).77
The level of effort varies between EU Member States depending on their relative wealth (GDP/capita). At the EU level, this will deliver an approximate 10 percent reduction of emissions from the uncovered sectors in 2020 compared with 2005 levels. The ef-fort-sharing targets vary by EU Member State, with the greatest decreases being required for Denmark, Ireland, and Luxembourg, and with the greatest in-creases allowed in Bulgaria, Latvia, and Romania.78 Cost-control measures include allowing Member States to transfer part of their annual emission alloca-tion to other EU Member States as well as the use of credits from Joint Implementation (JI) and CDM.
Table 5. Aviation Directive Summary
Issue Comment
Timing 2012: Inclusion of all flights arriving at and departing from EU airports
Level of emissions cap 2012: 97 percent of average 2004–06 emissions2013: 95 percent of 2004–06 emissions
Auctioning 2012: 15 percent auctioning2013: The volume to be auctioned over 2013–20 is already set to 15 percent per year, but may be revised.
Free allocation criteria Great circle distance plus 95 km (fixed). Operators may choose to apply (i) actual weight, (ii) standard weight, or (iii) default passenger weight of 100 kg.
Special reserve Creation of a reserve for new entrants and fast-growing airlines from within the cap. Three percent of the total capped allowances for that phase. Allocated to new operators and those whose activity data shows an increase of more than 18 percent per annum.
A new type of allowances not backed anymore with AAUs will be created in 2012 to be al-located/auctioned to airline opera-tors. Access to Certified Emission Reductions (CERs) and Emission Reduction Units (ERUs)
Open trading scheme, but with the removal of the clause that allows convertibility between Assigned Amounts Units (AAUs) and EU Allowance Units (EUAs)76 2012: 15 percent access to CERs and ERUs2012+: to be confirmed as part of ETS review negotiations
Notable exemptions.A full list is available on the European Commission Web site
Weight – certified 5.7t maximum take-off mass thresholdHeads of State exemption restricted to non-EUExemption for Public Service Obligations where they are either on specific routes between outermost regions or where capacity offered does not exceed 30,000 seats per yearActivity threshold exemption for commercial air operators who operate at a frequency lower than 243 flights per period into, out of, or within the EU for three consecutive four-month periods, or with an emissions threshold of less than 10,000 tCO2 a year
76. Pers Comm. cdc climat. EUAs can be used for compliance by airline operators, whereas allowances from the Aviation Trading Scheme (ATS) cannot be used for compliance in the EU ETS.77. DECISION No 406/2009/EC OF THE EUROPEAN PARLIAMENT AND OF THE COUNCIL of 23 April 2009 on the effort of Mem-ber States to reduce their greenhouse gas emissions to meet the Community’s greenhouse gas emission reduction commitments up to 2020. http://eur-lex.europa.eu/LexUriServ/LexUriServ.do?uri=OJ:L:2009:140:0136:0148:EN:PDF Access date 23 March 2011.78. http://ec.europa.eu/clima/documentation/effort/docs/targets2020.pdf Access date 4 April 2011.

28 | State and Trends of the Carbon Market 2010
Member States that have to reduce their non-ETS emissions, or are allowed to increase them by up to 5 percent of 2005 emissions, may use an additional 1 percent of CDM and JI credits. These credits can come only from CDM projects in least developed countries and small-island developing states; they are nonbankable and nontransferable, and they are available only to Member States meeting at least one of the following four conditions:83
concerned is higher than or equal to 0.7 percent of GDP according to the EC’s impact assessment.
-cording to the EC’s impact assessment, as a result of setting targets on the basis of the GDP per capita instead of the basis of cost-efficiency.
emissions covered by the Effort Sharing Decision are transport-related.
excess of 30 percent.
Further details on the EU ETS can be found in Sections 3, 4, and 5.
Japan—Reviewing the Target
In March 2010, the government of Japan introduced the “Basic Act on Global Warming Countermeasures.” The ETS component of the Basic Act has met with strong opposition, which has strengthened with rising concerns about costs to the economy and a lack of extensive consultations with industry groups.
The government of Japan considers the ETS com-ponent an important policy measure for Japan to achieve its announced target of reducing GHG emissions by 25 percent by 2020 compared to 1990 levels. This reduction is premised on the establish-ment of a fair and effective international agreement covering all major economies.
In the absence of such an agreement, it appears unlikely that Japan will make a unilateral 25 percent cut. As a consequence of these factors, the Diet has deferred dis-cussion of the ETS component of the Basic Act. The current state of policy is summarized in Table 7.
Despite the deferral of the ETS, other components of the Basic Act (introducing a carbon tax and estab-lishing a feed-in tariff for all renewable energy sourc-es) may pass in 2011. These measures are expected to be needed for Japan to meet its yet undecided unilat-eral emission reduction goal.
The passage of these measures through the Diet is also supported by Japan’s energy plan. The measures introduce an anti-global warming tax on oil, coal, and natural gas, as well as a feed-in tariff that sup-ports the goal of increasing domestic energy genera-tion from renewable sources of up to 10 percent of total primary energy supply by 2020.
The Japanese government also views access to in-ternational offsets as an important contribution to Japanese emission reduction efforts. As an agreement on the post-2012 regime has yet to be achieved, it is currently unclear how Japan will access offset markets;
79. http://www.vcacarfueldata.org.uk/ Access date 03 February 2011.80. An introduction to the U.K.’s Climate Change Levy (CCL). http://customs.hmrc.gov.uk/ Access date 4 February 2011.81. http://www.decc.gov.uk/en/content/cms/what_we_do/uk_supply/energy_mix/renewable/feedin_tariff/feedin_tariff.aspx Access date 4 February 2011.82. A summary of the U.K.’s Renewable Heat Incentive (RHI) Scheme. http://www.decc.gov.uk/renewable_heat/incentive.aspx Access 4 Feb 2011.83. From Questions and Answers on the Effort Sharing Decision. http://ec.europa.eu/clima/faq/effort/index_en.htm Access date 4 April 2011.
Table 6. Some Examples of U.K. Complementary
Measures
Measure Comment
Vehicle Emissions Tax79 Vehicle tax based on emissions measured in grams per kilometer (g/km) driven.
Climate Change Levy80 The levy is chargeable on the industrial and commercial supply of taxable commodi-ties for lighting, heating and power by consumers in the following sectors of busi-ness: industry, commerce, agriculture, public administration, and other services.
Renewable Energy Feed-in Tariffs81 Incentivizes small-scale (less than 5 MW), low-carbon electricity generation.
Renewable Heat Incentive82 Incentivizes generation of heat from renewable sources at all scales (expected launch June 2011).

State and Trends of the Carbon Market 2010 | 29
it may develop a bilateral offset scheme.84 The recent earthquake and tsunami and associated nuclear safety concerns may cause the Japanese government to re-consider its energy plans and climate change policies (for more details see Section 5.1.1).
New Zealand—Under Review
In November 2002, the New Zealand Parliament passed the Climate Change Reponses Act 2002.85 The act was subsequently amended in September 2008, introducing the greenhouse gas Emissions Trading Scheme (NZ ETS), which retrospectively covers forest-ry from January 2008. In November 2008, the newly elected government suspended, except for forestry op-erations, the NZ ETS, and launched a review of the country’s climate change policy. A further amended scheme came into existence in November 2009.86
During 2010, the NZ ETS was expanded to cover fuels and industry. In early 2011, a review of the NZ ETS commenced, as required by Climate Change Response Act 2002. The review seeks to highlight
whether the ETS is functioning efficiently and effec-tively. Recommendations from the review process will be forwarded to the Minister for Climate Change by September 2011.The scope of the review includes the following: coverage of agriculture, allocation mecha-nisms for New Zealand Units (NZUs), whether or not to keep the fixed-price cap of NZ$25 and the one-for-two obligation for emitters, and whether synthetic greenhouse gases should be included in the ETS. The review also examines the impact of the ETS on investment and operational decisions.87
Over the past year, the New Zealand market for NZUs has remained relatively flat. The market has traded between NZ$17 (€9.34) and NZ$22 (€12.1) and tends to follow the CER price at around a 10 to 15 percent discount, which reflects the fact that NZUs are subject to a price cap of NZ$25 and cannot be sold to companies participating in the EU ETS.
Demand in the NZ ETS mainly stems from local utilities, local industry, and fuel companies, with a few transactions from government buyers. In terms
Table 7. Current Climate Change Policies in Japan
Policy Jurisdiction Details
Emissions Trading Scheme (deferred)
Japan On March 12, 2010, the government of Japan proposed the “Basic Act on Global Warming Countermeasures,” an overall climate change policy frame-work that includes introducing an ETS.
Feed-in Tariffs Japan Feed-in tariff for all renewable energy sources with the goal of increasing domestic energy generation from renewable sources to 10 percent of total primary energy supply by 2020.
Anti-global Warming Measure Tax
Japan Anti-global warming tax is proposed as add-on to existing taxes covering wide range of fuels, of which rates are proportional to CO2 emission.
Voluntary Experimental Integrated ETS
715 organizations
715 organizations had applied to participate, of which 521 supplied targets (as of July 2009).The trial scheme aims to bring together several existing initiatives, such as the Keidanren Voluntary Action Plan, plans for a domes-tic offsets scheme, and the Japan-Voluntary Emissions Trading Scheme (J-VETS), which targets smaller emitters.
Tokyo Emissions Trading Scheme (Cap-and-Trade)
Tokyo The Tokyo metropolitan area launched its own mandatory cap-and-trade scheme on April 1, 2010, which targets office and commercial buildings (in-cluding universities) and factories. The scheme covers approximately 1,400 installations and 1 percent of the country’s emissions.
Saitama Prefecture Trading Scheme (Cap-and-Trade)
Saitama Prefecture
Starting April 1, 2011, Saitama, the fifth largest prefecture in Japan, will be-come the second Japanese prefecture to implement a mandatory emissions trading scheme. Saitama and Tokyo signed a pact to link their cap-and-trade schemes in the future.
84. “Japan confirms bilateral offsets support.” Point Carbon http://www.pointcarbon.com/news/1.1466069 Access date 15 April 2011. 85. http://www.legislation.govt.nz/act/public/2002/0040/latest/DLM158584.html Access date 17 March 2011.86. http://www.legislation.govt.nz/act/public/2009/0057/latest/DLM2381636.html Access date 15 April 2011.87. http://www.climatechange.govt.nz/emissions-trading-scheme/ets-review-2011/issues-statement.pdf Access date 19 March 2011.

30 | State and Trends of the Carbon Market 2010
of supply, however, it appears that a large percentage of the allocations of NZUs are not coming to mar-ket as fast as envisioned, thus increasing the market price. An expected surplus of supply for NZUs has so far failed to materialize.88
Russian Federation—The Bear Awakes
Russia, as part of the Copenhagen accord, has com-mitted to reductions of between 15 and 25 percent on 1990 levels by 2020. These reductions are predicated on the inclusion of forestry in Russia’s efforts to meet its anthropogenic emission reductions and its success in imposing binding obligations on major emitters.89
Russia also continues to be active in the JI market through the generation of Emission Reduction Units (ERUs). For further details see Section 4.1.2.
United States and North America—It is all about California
Uncertainty in U.S. climate policy continues as new legislators and administrators at the U.S. state and fed-eral levels reevaluate previous climate policy positions, affecting market sentiment and investment decisions. There appears to be bipartisan congressional support for a two-year suspension of the EPA’s authority to regulate GHG emissions under the Clean Air Act (CAA).90
In the President’s address on the State of the Union 2011, a Federal Clean Energy Standard was made an aspiration for the new Congress. Early reports suggest possible Senate support for a Clean Energy Standard that includes coal carbon capture and stor-age (CCS), natural gas, nuclear energy, and renew-able energy sources such as wind, geothermal, and solar.91 At this time, House support is unclear.92
This means that approaches centered on California will drive the carbon market landscape in the United States and North America for the foreseeable future
(see Table 9 for a summary of state and regional cli-mate change policies).
California
California continues to champion market-based mea-sures in the United States through the Global Warming Solutions Act of 2006 Assembly Bill 32 (AB 32). AB 32 requires California to cut greenhouse gas emissions to 1990 levels by 2020. It also identifies a cap-and-trade program as one of the strategies the state will em-ploy to reduce GHG emissions. As part of the public consultation process on the proposed cap-and-trade plan, the California Air Resources Board (CARB) held a rule-making meeting in December 2010 and approved resolution 10–24 outlining elements of the program. The regulation is not expected to be finalized until fall 2011 (September–November). As a cost-control measure, AB 32 allows entities cov-ered by the scheme to purchase and use offsets for com-pliance purposes, but volumes are limited to 8 percent of annual emissions. Offsets will come from a domestic offsets program with the possibility of importing inter-national forest offsets (see Section 4.4.1.1).93 California also has a strong renewable energy mandate and a re-quirement that the carbon content of the state’s vehicle fuels be cut by 10 percent by 2020.94
During 2010, opponents of AB 32 supported Proposition 23 with the aim of suspending AB 32. The Proposition 23 was defeated, but a related California ballot, Proposition 26, was passed. Proposition 26 re-quires certain state and local fees be approved by a two-thirds vote. Fees include those that address ad-verse impacts on society or the environment caused by the fee-payer’s business. Proposition 26 expands the definition of a tax under California law and some legal opinion speculates that it may affect the imple-mentation of AB 32.95 Nonetheless, advice from the State Attorney General’s office argues that Proposition
88. This section benefited from a Pers. Comm., with John O’Brien, Carbon Market Solution.89. http://unfccc.int/files/meetings/cop_15/copenhagen_accord/application/pdf/russiacphaccord_app1engl.pdf Access date 10 April 2011.90. There is a House bill to amend the Clean Air Act to prohibit the Administrator of the Environmental Protection Agency from promulgating any regulation concerning, taking action relating to, or taking into consideration the emission of a greenhouse gas to address climate change, and for other purposes. http://www.gpo.gov/fdsys/pkg/BILLS-112hr910rfs/pdf/BILLS-112hr910rfs.pdf Access date 15 April 2011.91. http://www.reuters.com/article/2011/01/31/us-usa-bingaman-nuclear-idUSTRE70U64Z20110131 Access date 17 March 2011.92. http://upton.house.gov/News/DocumentSingle.aspx?DocumentID=229488 Access date 17 March 2011.93. http://www.arb.ca.gov/newsrel/newsrelease.php?id=170 Access date 11 March 2011.94. http://www.arb.ca.gov/cc/ab32/ab32.htm Access date 4 Feb 2011.95. http://cdn.law.ucla.edu/SiteCollectionDocuments/EnvironmentalLaw/PayingforPollution.pdf Access date 11 Feb 2011.

State and Trends of the Carbon Market 2010 | 31
Years Supply (Mt) Demand (Mt) Shortage (Mt)
2012–14 38 42 (4)
2015–17 52 100 (48)
2018–20 75 91 (16)
Source: Thomson Reuter’s Point Carbon’s Carbon Market Analyst, A price forecast for California: Gauging Uncertainty, February 2011.
Kindly provided by Olga N. Chistyakova, Senior Analyst, Point Carbon
Table 8. Offset Supply and Demand Forecast for California’s Cap-and-trade
BOX 2. North American Offset Prices
North American Offset Prices: 2010–11
In 2010, the expectations of the North American carbon market refocused from federal legislation to California’s cap-and-trade. Between January and July, prices for offset credits in the United States were driven by the signals from federal legislation of whether the credit was likely to be eligible for an anticipated federal cap-and-trade program. Between August and October, the market was mostly illiquid, but in November it was reawakened by the release of California’s cap-and-trade regulation.
The Climate Reserve Tonnes (CRTs) issued by the Climate Action Reserve (CAR) were the first choice for sourcing early action credits in the federal bills that came through the 111th Congress, including the Waxman-Markey climate bill that passed the House of Representatives in the summer of 2010. Average prices lingered from January 2010 to July 2010 at $5.90/t for national forestry vintage 2009 CRTs, at $3.50/t for landfill gas vintage 2009 CRTs, and at $4.20/t for V11-12 CRT forwards from ozone deplet-ing substance (ODS) projects.
However, CRTs from forestry projects located in California went for an average of $6.90/t and held steady throughout the year to be knocked down to an average of $5.50/t for a brief time in October on the back of fears that Proposition 23 could have pre-vented the California cap-and-trade program from moving forward. The California forestry CRTs carried a premium over other project types as those were thought to be most likely to be eligible in a then loom-ing California cap-and-trade scheme.
Various iterations of federal legislation did not give the Verified Carbon Units (VCUs) from the Verified Carbon Standard (VCS) as much hope for early action accep-tance as for CRTs. As a result, the average VCU price was at $2.40/t from January through July, dropping to an average of $1.50/t for the remainder of the year as the market lost confidence in federal legislation.
As Proposition 23 was voted down in November and the market gained confidence in the California cap-and-trade scheme, the price for CRTs from U.S. forest-ry, livestock methane, and ODS projects converged into one “CARB eligible CRT” price at an average of $7.00/t, jumping approximately 40% by January to an average of $9.75/t. In February and March 2011, on the back of the court case of “Association of Irritated Residents v CARB” and market’s concern with the invalidation of CRT prices were once again down by approximately 17% to average of $8.10/t. CARB eli-gible CRT prices are expected to stay at this level until further developments in the court case. Will there be enough supply for California’s cap-and-trade?
In December 2010, CARB approved four U.S. based project types—urban forestry, forestry, livestock meth-ane, and ODS—to generate offsets for California’s cap-and-trade system. In order to ensure supply of offsets at the start of the program in 2012, the legislation al-lows early supply of CRTs from the above listed project types with vintages 2005–14, as long as the project started prior to 2012. Offsets from jurisdictions under the Western Climate Initiative may also be accepted, but Certified Emission Reductions (CERs) from the Clean Development Mechanism (CDM) are not eligible.
CARB’s regulations suggest a cumulative demand of 233 million tonnes of offsets from 2012 to 2020, or 8.7% of the total cap. To forecast supply, Thomson Reuters Point Carbon included projections from four project types CARB has approved. The projections also included REDD supply from Acre, Brazil and Chiapas, Mexico, and from U.S. based agricultural sequestra-tion (cropland management and nutrient management), protocols for which CARB is likely to consider next for inclusion. The supply estimates show that there will not be enough offsets to meet the maximum theoretical de-mand in any of the scheme’s 3 phases, resulting in a cu-mulative offset shortage of 68Mt, as shown in Table 8.

32 | State and Trends of the Carbon Market 2010
26 is not applicable to AB 32.102 Some market ana-lysts consulted by the authors share the same view.
At the time of writing, a long-standing legal action brought by the Association of Irritated Residents against the CARB has been successful. The Superior Court of California ruled that CARB failed to prop-erly consider alternatives to the cap-and-trade pro-gram contained in AB 32.103 Media reports suggest that this ruling has the potential to delay the start date of the cap-and-trade program.104
Western Climate Initiative
California is the leading member of the Western Climate Initiative (WCI), which aims to reduce re-gional GHG emissions to 15 percent below 2005 levels by 2020.105 However, the future of WCI
appears to be restricted to the West Coast of the United States and several Canadian provinces.
On June 30, 2010, Arizona withdrew from the WCI’s planned January 2012 implementation of a regional cap-and-trade emissions trading scheme, citing the economic downturn.106 Continued par-ticipation by Utah is also uncertain; its legislature passed a resolution to withdraw from the WCI.107
Some news reports suggest that Montana is also hav-ing trouble with cap-and-trade and may be unlikely to have legislation in place before WCI’s proposed start in January 2012.108 Cap-and-trade also appears in doubt in New Mexico, with the state executive terminating the employment of all members of the Environmental Improvement Board that passed cap-and-trade regulations.109
Table 9. Current U.S. State
and Regional Climate Change
Policy in North America
Policy Jurisdiction Details
AB 32 Cap-and-Trade96 California Cap-and-trade scheme to start in 2012.
AB 32 Renewable Electricity Standard97
California Regulation requiring a 33 percent renewable energy target by 2020.
Renewable Portfolio Standards98
Various U.S. states A renewable portfolio standard is a state policy that requires elec-tricity providers to obtain a minimum percentage of their power from renewable energy resources by a certain date.
Midwestern Greenhouse Gas Reduction Accord99 (MGGRA)
Six midwestern states and one Canadian province
MGGRA appears no longer functional with cap-and-trade off the agenda. The Midwestern Governors Association is now primary fo-cused on energy efficiency, renewable electricity, and advanced coal with carbon capture, as well as on bioeconomy and transportation.
Regional Greenhouse Gas Initiative (RGGI)100
10 northeastern and mid-Atlantic states
Cap-and-trade program reducing CO2 (only) emissions from the power sector 10 percent by 2018.
Western Climate Initiative (WCI)101
Western and midwestern U.S. states, and some Canadian provinces
Currently it appears that California, British Columbia, Quebec, and Ontario may be ready for trading in the WCI from 2012.
96. http://www.arb.ca.gov/cc/capandtrade/capandtrade.htm Access date 07 February 2011.97. http://www.arb.ca.gov/energy/res/res.htm Access date 07 February 2011.98. http://apps1.eere.energy.gov/states/maps/renewable_portfolio_states.cfm Access date 07 February 2011.99. http://www.midwesterngovernors.org/Energy.htm Access date 08 February 2011.100. http://www.rggi.org/home Access date 07 February 2011.101. http://www.westernclimateinitiative.org/ Access date 07 February 2011.102. Response from California Air Resources Board Chairman to a floor question at the IETA Carbon Forum, 14-15 March 2011, Washington, DC. http://www.ietacarbonforum.com/2011/.103. http://webaccess.sftc.org/Scripts/Magic94/mgrqispi94.dll?APPNAME=IJS&PRGNAME=ROA22&ARGUMENTS=-ACPF09509562 Access date 24 March.104. http://www.pointcarbon.com/research/marketsoverview/1.1520265 Access date 29 March 2011.105. http://www.westernclimateinitiative.org/ Access date 12 March 2011.106. http://www.azsos.gov/aar/2010/31/governor.pdf Access date 11 March 2011.107. http://le.utah.gov/~2010/bills/hbillenr/HJR021.pdf Access date 12 Feb 2011.108. http://billingsgazette.com/news/state-and-regional/montana/articled2433252-9c10-11df-958a-001cc4c002e0.html Access date 12 March 2011.109. http://www.governor.state.nm.us/uploads/FileLinks/20e5f2e740f34a2297a940e2bacdfcce/010411_02.pdf Access date 18 March 2011.

State and Trends of the Carbon Market 2010 | 33
Washington and Oregon are expected to join California in emissions trading through the WCI, but they will not be ready for trading in 2012.110
At the level of Canadian provinces, British Columbia, Ontario, and Quebec have passed cap-and-trade legislation; they are positioned to join California in early regional emissions trad-ing through the WCI. Manitoba does not yet have the legislative authority it needs to join in emissions trading through the WCI. Alberta and Saskatchewan are both taking individual actions—outside the WCI—to limit GHG emissions.
Regional Greenhouse Gas Initiative
The other major regional initiative operating in the United States is the Regional Greenhouse Gas Initiative (RGGI). It is a mandatory cap-and-trade CO2-only-reduction program covering ten northeastern and mid-Atlantic states that aims to reduce CO2 emis-sions from the power sector by 10 percent by 2018.111 RGGI continues to have overallocation problems. The cap exceeded emissions by about 50 percent in 2009. Although at lower levels (about 15 percent), overal-location is expected until 2018 (see Figure 3).112 In addition, the lack of momentum at federal level fully offset in 2010 the growth of this market segment in the previous year, which had strongly benefited from the expectation of an imminent federal legislation.
The future of RGGI is unclear. The New Hampshire legislature recently passed House Bill 519, which repeals the state’s participation in RGGI.113 Media analysis suggests that the New Hampshire legislature has enough votes to enact the bill into law should the governor veto it.114 There is speculation that the
success of Bill 519 will cause other states to consider withdrawing from RGGI and possibly delay any re-view of the cap.115
2.2 NON-ANNEX I COUNTRIES
Brazil—Making Commitments
On December 29, 2009, the Brazilian Parliament ad-opted Law 12.187. The law establishes the National Climate Change Policy (NCCP) of Brazil and sets a voluntary national greenhouse gas reduction target of between 36.1 and 38.9 percent of projected emissions by 2020. On October 26, 2010, the government pub-lished an executive summary of the sectoral mitigation plans to implement its voluntary commitment.116
CapEmissions forecast
RG
GI a
nnua
l em
issi
ons
vs. c
ap (M
tCO
2e) Figure 3.
RGGI Forecast Emissions
Source: Thomson Reuters Point Carbon
110. http://www.pointcarbon.com/polopoly_fs/1.1512601!Carbon%202011_web.pdf Access date 17 March 2011.111. http://www.rggi.org/home Access date 12 March 2011.112. http://www.pointcarbon.com/research/northamerica/rggi/ Access date 17 March 2011.113. http://www.gencourt.state.nh.us/bill_Status/results.aspx?lsr=475&sortoption=&txtsessionyear=2011&txtbillnumber=hb519 Access date 17 March 2011.114. http://www.boston.com/news/local/new_hampshire/articles/2010/11/03/nh_gop_tally_5_sen_almost_300_house_seats/ Access date 17 March 2011.115. RGGI market view - http://www.pointcarbon.com/research/northamerica/rggi/ Access date 17 March 2011.116. Beyond official and voluntary commitments, a number of studies have investigated the potential of emissions reductions in Brazil in coming decades:
levels and would require an average incremental investment of $18.5 billion per year and an average volume of incentive of $21billion per year to turn the low-carbon options attractive. de Gouvello et al., World Bank, 2010 http://go.worldbank. org/53EVFQYOG0 Access date 6 April 2011.
than 18,000 potential low-carbon investment to implement systematically 61 different kinds of technologies, corresponding to cumulative emissions reduction potential of 455 MtCO2e per year.

34 | State and Trends of the Carbon Market 2010
Among other instruments, the NCCP law considers in article 9 the creation of a Brazilian Emission Reductions Market (BERM) to achieve the voluntary emission re-duction target. It will be operationalized by Brazilian stock exchanges and the Securities Commission.
As a signatory of the Copenhagen Accord, Brazil detailed this voluntary commitment in an offi-cial communication on NAMAs to the UNFCCC Secretariat as follows:
Region and the Cerrado (minus 668 MtCO2e/year in 2020); degraded pastures recovery (minus 83 to 104 MtCO2e/year in 2020); reduction of livestock emissions (minus 22 MtCO2e/year in 2020); zero tillage (minus 20 MtCO2e/year in 2020); biological fixing of N2 (minus 16 to 22 MtCO2e/year in 2020).
15 MtCO2e/year in 2020); use of bio-fuels (mi-nus 28 to 60 MtCO2e/year in 2020); increase of hydropower generation (minus 79 to 99 MtCO2e/year in 2020).
-coal by planted forest–based charcoal in the steel industry (minus 12 to 15 MtCO2e/year in 2020).
China—Going Green
In recognition of its changing economic and geopo-litical role, China released in March 2011 its 12th Five-Year Plan of National Economic and Social Development. It sets a carbon-intensity reduction tar-get (CO2 emissions per unit GDP) of 17 percent and aims to cut energy intensity117 by 16 percent by 2015. These targets are consistent with the 40 to 45 percent reduction in carbon intensity from 2005 levels that was first announced at the Copenhagen Conference and reaffirmed at the Cancun Conference.118,119
These policy choices are driven by China’s need to reduce emissions to avoid the negative impacts of cli-mate change on its population, to promote energy se-curity, and to reduce emissions of health-threatening pollutants such as sulfur dioxide (SO2), nitrous oxides (NOX), and particulates. As part of the 12th Five-Year Plan China will increase forest cover by 12.5 million hectares by 2015, improve GHG emissions and ener-gy monitoring systems, promote energy efficiency in industrial plants and buildings, support the expansion of public rail transport infrastructure, and continue the development of nonfossil fuel energy sources.120
China continues to support emissions trading and Kyoto Protocol flexibility mechanisms, and has es-tablished a number of environment and energy exchanges to provide infrastructure for trading in CERs and Voluntary Emission Reductions (VERs). As of December 2010 the National Development and Reform Commission (NDRC) had approved ap-proximately 2,850 Clean Development Mechanism (CDM) projects.
Of these projects more than 1,000 have been success-fully registered at the CDM Executive Board. China has contributed 42 percent of the overall number of globally registered CDM projects, with expected annual certified emission reductions of about 240 MtCO2e, or 62 percent of total global emission re-ductions from the CDM. Table 10 outlines the cur-rent trading market and products covered.
China may introduce an emissions trading scheme in six regions in 2013 and this may be expanded to a national scheme by 2015.121
India—Setting Itself a Target
India’s per capita CO2 emissions are expected to grow from 1.1 ton in 2001 to 3–5 tons in 2030.122 In 2008, India launched the National Action Plan on Climate Change, which involves the establishment
117. CO2 emissions per unit of GDP.118. http://www.theclimategroup.org/_assets/files/China-Five-Year-Plan-EXECUTIVE-SUMMARY.pdf Access date 17 March 2011.119. http://www.wri.org/stories/2011/03/how-does-chinas-12th-five-year-plan-address-energy-and-environment Access date 18 March 2011.120. http://pdf.wri.org/testimony/seligsohn_testimony_energy_and_commerce_2011-04-04.pdf Access date 10 April 2011.121. The Panda Standard is a quality standard for Chinese voluntary emission reduction projects within agriculture and forestry. The standard is being developed by the China Beijing Environmental Exchange (CBEEX) and Paris-based carbon exchange Bluenext. The first deal of Panda Standard credit—China’s pilot domestic carbon standard—was announced on March 29, 2011. A major market participant purchased 16,800 t at $9.14 per ton. The project is the Bamboo reforestation developed under the AFD-FFEM Yunnan Rural Project. 122. India’s GHG Emissions Profile: Results of Five Climate Modeling Studies, Ministry of Environment & Forest.

State and Trends of the Carbon Market 2010 | 35
of eight programs—known as missions—on solar technology, energy efficiency, sustainable habitat, water, Himalayan ecosystem, green India, agricul-ture, and strategic knowledge.
The solar mission, approved in 2009, is expected to enable setting up of 200 MW of off-grid solar power and cover 7 million square meters with solar collec-tors in its first phase from 2010–13. It has set a vol-untary target of 20,000 MW by 2022.
The energy efficiency mission, approved in 2010, is expected to achieve total avoided capacity addi-tion of 19,598 MW, representing fuel savings of around 23 million tons per year and greenhouse gas emission reductions of 98.55 million tons per year, over the next four years. This mission in-cludes a market-based mechanism—the Perform Achieve and Trade—to enhance cost effectiveness of meeting energy efficiency improvement targets in
energy-intensive large industries and facilities. The energy saving certificates generated can be traded.
Approved in 2010, the mission on sustainable habi-tats aims to make cities sustainable by improving en-ergy efficiency in buildings and solid waste manage-ment, and encouraging a shift to public transport.
In 2011, India submitted its voluntary emission re-duction objective under the Copenhagen Accord, a voluntary target of reducing emissions intensity of its GDP by 20–25 percent by 2020 in comparison to the 2005 level.
Mexico—Looking for Options
Mexico has submitted three National Communications to the UNFCCC. The First National Communication (1997) established the national greenhouse gas inventory and reported
Table 10. Current Trading Platforms in China123
China Beijing Environment Exchange
Tianjin Climate Exchange Shanghai Environment Energy Exchange
(CBEEX) (TCX) (SEEE)
Web site http://www.cbeex.com.cn http://www.chinatcx.com.cn http://www.cneeex.com
Location Beijing Tianjin Shanghai
Date of Establishment
08/05/2008 09/25/2008 08/05/2008
Shareholders -China Beijing Equity Exchange (CBEX, 40 percent)-CNOOC New Energy Investment Co., Ltd. (20 percent)-China Guodian Corp. (20 percent)-China Everbright Investment Management Corp. (20 percent)
-National Petroleum Corporation Assets Management Co. (CNPCAM, 53 percent),-Tianjin Property Rights Exchange (TPRE, 22 percent),-Chicago Climate Exchange (CCX, 25 percent).
Sole owner: Shanghai United Assets and Equity Exchange (SUAEE)
Common Functions
Information and service center for CDM projectsEnvironmental property rights trading, mainly SO2 and CODEnergy Management/Performance contract and green technologies transfersDomestic VERs transactions
Key Focus Activities
Panda Standard: China’s pilot domestic carbon standard—first project announced in Cancun124
Chinese companies joint action of voluntary emission reduction
Voluntary emission reduc-tion platform for the World Expo
China voluntary reduction standard (still nothing as of March 2011)
China Carbon Neutral Alliance Pilot intensity-cap trading scheme on heat suppliers of residential buildings (no further announce-ment as of March 2011)
123. Personal communication from Bluenext. http://www.bluenext.eu/.124. Point Carbon, based on comment from the NRDC, reports that China wants to launch markets in Beijing, Chongqing, Guangdong, Hubei, Shanghai, and Tianjin in 2013, National Development and Reform Commission (NDRC). Carbon Market Daily. 11 April 2011.

36 | State and Trends of the Carbon Market 2010
the first studies on Mexico’s vulnerability to climate change. Mexico is currently preparing its Fourth National Communication. Recognizing the mul-tisectoral challenges posed by climate change, in April 2005 Mexico established the Comisión Intersecretarial de Cambio Climático (CICC) (Intersecretarial Commission on Climate Change). The CICC’s key mandates include formulating and coordinating national climate change strategies and incorporating them into sectoral programs. The CICC contains several working groups, including groups on mitigation and adaptation. Associated with the CICC is an advisory board on climate change, which creates a link between the CICC, the scientific community, and civil society.125
A voluntary program for GHG accounting and re-porting (Program GEI) covered 98 companies in 2009 accounting for 21 percent of national emis-sions. In the next two years the coverage will be ex-panded to 80 percent of national emissions. Sectoral crediting is expected to complement CDM.
Republic of Korea—Two Steps Forward One Step Back
During 2010, the Republic of Korea enacted its Framework Act on Low Carbon, Green Growth.126 This act establishes a legal framework for setting GHG and energy reduction targets and provides for GHG emissions reporting. It also establishes the right to implement a cap-and-trade scheme for the purposes of reducing GHG emissions and sets up fuel use and GHG emission standards for automobiles. The act has met resistance from industry groups concerned about the cost implications of cap-and-trade policies.127
Consequently, the implementation of the cap-and-trade scheme originally planned for commence-ment in 2013 has been postponed until 2015.128 Regardless, the Republic of Korea is continuing with its GHG Target Management System, which will require companies to meet energy-saving and green-house gas reduction targets. The system is believed to
cap GHG emissions for 1,564 sites that collectively emit more than 442 MtCO2e a year.129
South Africa—Committed to Reducing Emissions
South Africa, as part of the Copenhagen accord, has made a non-binding commitment to reduce GHG emission by 34 percent below its business-as-usual emissions trajectory by 2020. South Africa further plans to reduce emissions by 42 percent below its business-as-usual emissions trajectory by 2025. This commitment is contingent on financing, technol-ogy, and capacity-building support.130
It has been reported that South Africa is contem-plating the introduction of a carbon tax as a policy measure to support its emission reduction target, rather than a cap-and-trade scheme. South Africa’s actions toward low-carbon growth will become more visible in 2011, as the country will host the next Conference of the Parties of the Kyoto Protocol, to be held in Durban in December 2011.
2.3 LINKING EMISSIONS TRADING SCHEMES
Linking emissions trading schemes is a complex is-sue that has attracted attention because of the po-tential for reducing costs and enhancing market li-quidity.131 Different forms of linking are available, including the following:
-tion of allowances in each emissions trading scheme being linked and would involve trading allowances between the schemes (import and export).
mutually recognized standard unit. Most trading schemes indirectly link though CERs.
Linking issues typically cover compatibility in the level of effort or ambition; use of offsets; monitoring,
125. World Bank, Low-Carbon Development for Mexico. 2010.126. http://www.moleg.go.kr/english/korLawEng;jsessionid=2XVAoj0GR5al5jBzbf231tBLR5sfblXWqUKrdjsnkPDpRoPPZWg4k7g10127dywk?pstSeq=52136 Access date 22 March 2011.127. http://af.reuters.com/article/metalsNews/idAFL3E7CO0CK20110124 Access date 22 March 2011.128. http://www.pointcarbon.com/news/1.1519474 Access date 22 March 2011.129. http://af.reuters.com/article/metalsNews/idAFL3E7CO0CK20110124 Access date 22 March 2011.130. http://unfccc.int/files/meetings/cop_15/copenhagen_accord/application/pdf/southafricacphaccord_app2.pdf Access date 26 April 2011.131. http://www.oecd-ilibrary.org/environment/towards-global-carbon-pricing_5km975t0cfr8-en Access date 22 March 2011.

State and Trends of the Carbon Market 2010 | 37
reporting and verification (MRV) standards;132 and price caps. For example, the proposed U.S. Waxman-Markey bill (H.R. 2454: Sec 728)133 outlines provi-sions for linking between the U.S. and foreign climate change schemes run by national or supra-national governments. The criteria include the following:
-lute tonnage limit on greenhouse gas emissions (that is, cap-and-trade)
in the United States (that is, equivalent effort)
compliance, and enforcement (that is, similar MRV standards)
and restrictions on the use of offsets
The now shelved Australian Carbon Pollution Reduction Scheme (CPRS) contained price cap provi-sions and allowance export limitations, which were im-posed partially because of the price cap. The rationale was if the international price moved above Australia’s price cap, Australian allowances would be exported and entities with compliance obligations would access the price cap.134 This has two impacts: (1) abatement will be less than otherwise would have occurred without the price cap, and (2) auction revenues will be lower than otherwise would have occurred without the price cap.
Indirect linking through an offset scheme, such as the CDM, can provide an important cost contain-ment mechanism for developed countries with high cost abatement and offset import potential. The cre-ation of low-cost offsets through a scheme, such as REDD+, offers import countries considerable op-portunities for cost-effective abatement. The cost-containment opportunities justify the considerable work needed to develop offset schemes.135
2.4 CONCLUSIONS
The national and regional mitigation measures discussed in the preceding section support the in-creasingly common perspective among market par-ticipants of the emergence of a fragmented carbon market.136 Some participants expressed the belief that having several regulatory systems could be a positive feature of fragmented markets, citing the benefits of fast (and flexible) local approval pro-cesses, high-degree of adaptability to specific needs, and potentially, large local acceptability and in-creased level of engagement. The sentiment survey presented in Section 1.4 supports the perspective that market participants view this as a workable sit-uation while the carbon market further evolves and matures through linking and acceptance of similar levels of ambition.
The rate at which this will occur will depend on many factors. In particular, it will depend on each country’s willingness to work on and accept the fun-gibility of allowances from other national or supra-national schemes, which will be a consequence of compatibility in effort or ambition; use of offsets; monitoring, reporting and verification (MRV) stan-dards; and absence of price caps. Without fungible assets and open schemes, the fragmentation of the carbon market will persist and the hoped for long-term carbon pricing signal—desired by some market participants—will not be achieved.
Countries continue to adopt a range of policy measures to drive emission reductions. It is important in the overall design of mitigation policies for policy makers to consider the interaction between different—market and non-market—policy measures. A great deal can be learned from countries that have direct experience of these potentially complex interactions.
132. Linking separate schemes requires robust and transparent monitoring, reporting and verification (MRV) to ensure the environmental integrity of the different schemes and to build the trust needed among participants. Ideally uniform or at least compatible standards for MRV should be collectively adopted.133. http://thomas.loc.gov/cgi-bin/query/z?c111:H.R.2454: Access date 23 March 2011.134. http://www.climatechange.gov.au/publications/cprs/white-paper/~/media/publications/white-paper/V1011Chapter-pdf.ashx Access date 23 March 2011.135. The cost-saving potential for developed countries of well-functioning crediting mechanisms appears to be very large. Even limited use of offsets would nearly halve mitigation costs; cost savings would be largest for carbon-intensive economies. However, one open issue is whether these gains can be fully reaped in reality, given that direct linking and the use of crediting mechanisms both raise complex system design and implementation issues. The analysis shows, however, that the potential gains to be reaped are so large that substantial efforts in this domain are warranted. http://www.oecd-ilibrary.org/environment/towards-global-carbon-pricing_5km975t0cfr8-en Access date 12 April 2011.136. “Costs and financing of climate change policies: Negotiating a post-Kyoto regime requires the redefinition of the financial engagement of the different actors.” http://www.cdcclimat.com/IMG/pdf/16_Climat_Sphere_EN_Copenhagen_last_stop.pdf Access date 29 April 2011.

38 | State and Trends of the Carbon Market 2010
SECTION3

State and Trends of the Carbon Market 2010 | 39
How Market Participants Transact—Risk and Regulation
THE ECONOMIC MALAISE resulting from the global financial crisis and the per-
ceived excess risk taking in global financial centers have led many to question the effec-
tiveness of market mechanisms. Yet, carbon markets can be one of the most important
policy tools for cost-effectively reducing GHG emissions. However, obtaining politi-
cal support from a skeptical public for market-based solutions in a period of economic
slowdown is becoming ever more difficult. Robust and transparent regulations of these
markets are vital for ensuring market and public confidence, which in turn supports the
market’s ability to deliver cost-effective emission reductions. This section discusses the
changing regulatory landscape, important regulatory approaches being used to control
risk, and future regulatory developments.
3.1 THE CHANGING REGULATORY LANDSCAPE—THE IMPACT OF FINANCIAL MARKET REFORMS
The recent and extensive turmoil in global finan-cial markets has resulted in financial market regu-latory reforms. At the international level, the G20 have promoted financial market regulatory reform through the Financial Stability Board (FSB)137 and the Basel Committee.138
At the domestic level, countries have initiated ma-jor financial market regulatory reforms; some ex-amples include the United States’ Dodd–Frank Wall Street Reform and Consumer Protection Act,139 the British government’s reforms to financial regula-tion,140 and the French government’s Law on Banking and Financial Regulation (LBFR).141 Against this
background, the U.S. Commodities Future Trading Commission (CFTC) released a report on carbon market oversight.142 And after recent carbon market irregularities in the European Union (see Box 3), the European Commission has taken steps to improve the functioning of the EU Emissions Trading Scheme.
3“Robust and transparent regulations of these markets are vital for ensuring market and public confidence, which in turn supports the market’s ability to deliver cost-effective emission reductions.”
137. http://www.financialstabilityboard.org/index.htm Access date 25 Feb 2011.138. http://www.bis.org/bcbs/ Access date 25 Feb 2011.139. http://frwebgate.access.gpo.gov/cgi-bin/getdoc.cgi?dbname=111_cong_bills&docid=f:h4173enr.txt.pdf Access date 22 Feb 2011.140. http://www.hm-treasury.gov.uk/consult_financial_regulation.htm Access date 22 Feb 2011.141. http://www.legifrance.gouv.fr/rechTexte.do?reprise=true&page=1 Access date 22 Feb 2011.142. http://www.cftc.gov/ucm/groups/public/@swaps/documents/file/dfstudy_carbon_011811.pdf Access date 15 March 2011.

40 | State and Trends of the Carbon Market 2010
The EU Commission reform initiatives include a communication on carbon market oversight, which aims to ensure that the EU Emissions Trading Scheme (ETS) is sufficiently protected from insider dealing and market manipulation.143 The ETS operations will be centralized into a single European Union registry, which will be operated by the Commission. It will replace all EU ETS registries currently hosted in Member States. The Commission proposed using a consistent reverse charge mechanism for VAT as a response to carousel fraud in certain sectors.144 In
addition, some EU Member States, most notably France, have implemented or are considering do-mestic carbon market regulatory reforms.
The new French LBFR is important because it of-fers a carbon market regulatory reform model for both other EU Member States and countries out-side the EU who may be considering establishing emissions trading schemes. The LBFR, based on recommendations in the Prada review,145 provides for oversight of the carbon market and its opera-tors through two regulators, Autorité des Marchés Financiers (AMF) and Commission de régulation de l’énergie (CRE).146 AMF and CRE have signed a memorandum of understanding on the exchange of information, control, and supervision of markets in greenhouse gas emission allowances, electricity, nat-ural gas, and their derivatives.147 The memorandum of understanding is one of the LBRF’s applications and it defines cooperation between AMF and CRE.
Under the memorandum of understanding, AMF is responsible for overseeing the operation of the mar-ket in allowances and their derivatives and CRE is responsible for supervision of transactions carried out in allowances by energy market participants. CRE is also responsible for analyzing the behavior of allowances in relation to the economic and technical factors underpinning energy markets. The memo-randum of understanding anticipates provisions in the draft European Regulation on Energy Markets Integrity and Transparency (REMIT).148
An additional factor behind France’s carbon market regulatory reforms appears to be the EU Auctioning Regulation, which requires that any auction platform must be a regulated market.149 At the time of writing, Bluenext150—the major spot market—was in the pro-cess of becoming a regulated market for the purposes of participating in auctions. To date, most allowance auc-tion markets have appointed independent observers, as the markets have not been regulated. The EC continues this practice in the EU Auctioning Regulation.
BOX 3. Brief History of Carbon Market Fraud in the EU ETS
million worth of EU allowances leads to the closure of national carbon registries, the suspension of spot trade, and the implementation of an EU-wide upgrade of registry security.
ETS registry accounts in Romania results in the theft of 1.6 million EUAs.
virus Nimkey.
been surrendered to it under the EU’s emissions trading scheme. In response, the EU amends the registry regula-tions to prevent CER recycling.
-sures for a consistent response to deal with VAT or carou-sel fraud detected in the market in 2009–10.
of EU ETS registries prompts the EU to revise Internet security guidelines.
143. http://ec.europa.eu/clima/news/docs/communication_en.pdf Access date 22 Feb 2011.144. http://ec.europa.eu/taxation_customs/resources/documents/common/legislation/proposals/taxation/com(2009)511_en.pdf Access date 22 Feb 2011.145. http://www.minefe.gouv.fr/services/rap10/100419rap-prada.pdf Access date 22 Feb 2011. 146. http://www.amf-france.org/documents/general/9794_1.pdf Access date 22 Feb 2011.147. http://www.amf-france.org/documents/general/9767_1.pdf Access date 22 Feb 2011.148. http://ec.europa.eu/energy/gas_electricity/markets/doc/com_2010_0726_en.pdf Access date 22 Feb 2011.149. http://ec.europa.eu/clima/documentation/ets/auctioning_third_en.htm Access date 22 Feb 2011.150. Jointly controlled by CDC Climat–a subsidiary of French long-term investor Caisse des Dépôts–and NYSE Blue

State and Trends of the Carbon Market 2010 | 41
BOX 4. A Point of View on the EU ETS
The Carbon Market in Crisis?—Recognition, Resolve and Optimism.
For many, 2010 has been a year of considerable dis-ruption and controversy in the carbon markets.
The CDM continues to suffer from registration and issuance delays due to complex procedures and ca-pacity constraints. JI continues to be challenged by inefficient domestic bureaucracy and varying politi-cal support. There have been sovereign suspensions under the Kyoto Protocol and alleged misappropria-tion of AAU sale revenues. The EU-ETS has suf-fered from alleged VAT fraud, money laundering and theft leading to registry suspensions and a dramatic loss of confidence and liquidity in the spot markets. International negotiations are stalled on the critical issue of binding commitments.
However, the carbon markets are far from unique in their troubles. In the 1990’s several emerging econ-omies suffered serious setbacks with stock market losses and currency devaluations. Many have since recovered. The recent “credit crunch” led to the near paralysis of EU and US money markets requiring significant injections of government liquidity. Major fi-nancial institutions failed and stock markets suffered significant losses, though some recovery has since occurred. The credit markets remain challenged by economic difficulties in Greece, Ireland and Portugal.
The credit crunch exposed the $50bil+ Madoff fraud. Theft, fraud and money laundering are serious concerns in all markets. Regulators and market participants are perpetually challenged to develop safeguards ahead of criminal activity. Advancing technology creates its own issues. In 2010 the Dow Jones temporarily lost $1trillion in a “flash crash” driven by high speed auto-mated trading. “Fat fingers” have led to disruptions in numerous electronically traded markets.
Yet there is no clamour to abandon free market mech-anisms in finance and commerce. Rather, a gritty resolve from regulators and market participants to continue improving these markets. Indeed, free mar-ket principles are increasingly widely embraced. So it should be with the carbon markets, whose pres-ent challenges are small by comparison. Whilst not the only tool in the fight against climate change - and every available tool should be deployed - the carbon markets continue to be the most efficient available mechanism for wholesale delivery of penalties for emissions and rewards for reductions.
Despite the flaws in the carbon markets, many of which are being resolved, there have been real achieve-ments. The CDM & JI have reduced over 600MtCO2e of emissions and may achieve 3.3 billion tCO2e by end 2020. The EU-ETS is demonstrably encouraging coal-to-gas switching, renewable energy investment and industrial energy efficiency. Phase 3 auction revenues will help finance CCS. Regional schemes are being implemented in New Zealand and California with fur-ther schemes under discussion in Australia, South Korea, Japan and China. The importance of REDD is gaining widespread international support.
Most importantly, there is now an established interna-tional market that penalises emissions and rewards reductions via prices that respond in real time to a changing world.
Thus recognition of flaws in the carbon markets should be balanced by resolve to improve and ex-pand these markets - and outweighed by optimism in the potential of the carbon markets to deliver signifi-cant emissions reductions and to drive the transition to a global low carbon economy.
Kindly provided by Martin Lawless, Managing Director and Global Head of Deutsche Bank’s carbon markets business.

42 | State and Trends of the Carbon Market 2010
The suite of regulatory reforms at the EU and Member State levels will over time lead to a more robust, transparent, and fair market. Many of the challenges encountered in the continuing develop-ment of the EU ETS offer invaluable lessons for other countries considering emissions trading.
3.2 OVER-THE-COUNTER MARKET—REGULATION IS COMING DOWN THE PIKE
The theft of EUAs and lack of clarity over legal owner-ship across the Member States of the EU is leading to renewed interest in over-the-counter (OTC) spot mar-kets. Depending on the jurisdiction, stolen allowances purchased in good faith from a trusted source may not confer ownership and, hence, usability.151 Some mar-ket participants view OTC transactions with known counterparties as an effective way to manage counter-party credit risk. VAT fraud has also encouraged mar-ket participants into the OTC spot market as a way to avoid being inadvertently implicated in carousel fraud.
Some market participants argued for a harmonization of rules for dealing with ownership of stolen allowanc-es, favoring the approaches taken in certain Member States. Given the urgency of the situation harmoniza-tion may not be practical, but a solution is needed to restore confidence in the exchange-traded market. In the absence of a practical solution, more participants are likely to look toward OTC spot markets as a way to control this type of counterparty risk.
As interest has increased in the OTC spot market, there is pressure to move away from the use of the noncleared OTC derivatives market. Transactions in the OTC derivatives market represent approxi-mately 15 percent of derivatives transactions. The European Commission has proposed that standard OTC derivative contracts be cleared through cen-tral counterparties (CCPs).152 The aim is to reduce counterparty credit risk153 and improve transpar-ency. Some market participants expressed concerns
over the ability to embed optionality in standardized contracts and the impact standardization will have on developing the tailored OTC derivatives market.
3.3 PRIMARY ISSUANCE MARKET—EMISSION ALLOWANCE AUCTIONS
The move away from administrative allocations to competitive auctions for emissions allowances is a significant policy change affecting carbon markets. Auctioning provides a mechanism that both efficient-ly allocates allowances and raises revenue. Starting in 2013, the EU ETS will enter Phase III of its imple-mentation (currently it is in Phase II), stimulating further development of the primary issuance market. The market is expected to grow from around 3 percent of allowances auctioned during Phase II to at least 50 percent of allowances auctioned during Phase III.
Many EU Member States will auction 100 percent of allowances for the power sector in Phase III of the EU ETS. As Germany, Poland, and the United Kingdom intend to opt out of the planned common auction platform,154 there will be four separate pri-mary markets for emissions allowances that may of-fer arbitrage opportunities.
Although the move to auctioning is theoretically sound, there are practical considerations. Measures need be in place to prevent carbon leakage for sec-tors that are assessed at significant risk.155 Permit auc-tions also raise the possibility of including transport in the EU ETS without any loss of revenue. This was the approach taken in the shelved Australian Carbon Pollution Reduction Scheme (CPRS) where the fuel excise tax was to reduce under the scheme.
In the current financial environment, concern focuses on the ability of liable entities to obtain financing for allowances or to purchase allowances out of working capital. Governments have attempted to address these issues with a range of policy initiatives, including the
151. http://www.ieta.org/assets/PositionPapers/ietaletter_registrysuspension20012011final.pdf Access date 23 Feb 2011.152. http://ec.europa.eu/internal_market/financial-markets/derivatives/index_en.htm Access date 23 Feb 2011.153. The risk that one party to the contract defaults.154. http://www.decc.gov.uk/en/content/cms/what_we_do/change_energy/tackling_clima/emissions/eu_ets/phase_iii/phase_iii.aspx Ac-cess date 13 March 2011.155. It may be argued even in the absence of auctioning that compensation should be made to sectors at risk of carbon leakage. The EU sectors at significant risk will receive 100 percent of the benchmarked allocation for free and, depending on where the facility is located, may receive further assistance for increased electricity costs.

State and Trends of the Carbon Market 2010 | 43
auctioning of futures contracts and deferred payment arrangements.156 These approaches are not ideal, as they reduce liquidity in allowance futures markets. The move to auctioning has also encouraged work on emissions auction design and many approaches are be-ing proposed or are in operation across the globe. The predominant current approach is the single-round, sealed-bid, uniform price auction.157 Other significant issues include limits on who can participate and the collateral needed to participate in auctions.
3.4 SECONDARY MARKETS—CONTROLLING RISK AND ENSURING TRANSPARENCY AND ACCOUNTABILITY
From a policy perspective, the desire to encourage broad market participation and facilitate easy access to the carbon market must be balanced by the need to control such risks as the potential for tax eva-sion and money laundering. The issue of managing the risks associated with components of the carbon market infrastructure is broad. It encompasses the operations of the registry, liability reporting system, auction platform, settlement system, and secondary market integration. Management of risk is critical for maintaining market integrity.158
3.4.1 Proof of Identity
Given the potential for market abuses in the carbon market, various law enforcement agencies have tak-en an active interest in the development of the mar-ket. Governments and corporate entities use proof of identity (POI) to control risk. Proof of identity aims to ensure that you know with whom you are dealing.
Adequate proof of identity is a prerequisite for partici-pation in primary and secondary markets and for es-tablishing registry accounts. Variations have occurred in POI requirements across the EU ETS, with coun-tries implementing a variety of regimes. It is thought that weak POI regimes in some countries may have
contributed to the VAT fraud that occurred in the EU ETS. For example, Denmark moved to restrict regis-try access to permanent residents in October 2010 to combat VAT fraud and other crimes.159
Tightening of POI regimes may have implications for individuals or corporations from developing coun-tries wishing to participate in existing carbon mar-kets. The problem is complex, but not new. How does an agency in a particular country verify the bona fide credentials of another country’s citizens or corpora-tions? The authors believe that the goal of ensuring access can be achieved without compromising market integrity. Multilateral development banks and other international institutions could potentially play a role in developing the market infrastructure that can both support access and control risk.
3.4.2 Operational Risk Management—Registries
The January 2011 theft of approximately 3.1 million EUAs from national registries in Europe has reignited controversy around the carbon market’s effectiveness as a policy tool for emission reductions and led to the temporary suspension of spot markets. As with other Web-based financial systems, EU ETS registries are vulnerable to phishing attacks and other malicious ac-tivities, such as hacking and denial of service attacks. In response to the theft, the EU took decisive action and closed EU ETS registries pending the implemen-tation of minimum-security arrangements. However, the resulting market disruption underscores the need for a comprehensive approach to the issue.
The proposed European Commission solution—centralizing the ETS operations into a single European Union registry—has much merit. The European Commission will operate the single European Union registry, which will replace all EU ETS registries currently hosted in EU Member States.160 The European Commission will take on the registry operational risks from Member States,
156. http://www.climatechange.gov.au/publications/cprs/white-paper/~/media/publications/white-paper/V1009Chapter-pdf.ashx Access date 02/11/2011.157. In this type of auction, the auctioneer announces the number of allowances to be sold and bidders submit sealed bids that indicated the number of allowances desired at each price. Allowances are allocated to bidders based on the price paid by the lowest successful bid-der and only the auctioneer has information about the demand curves from auction participants. 158. 159. http://www.pointcarbon.com/news/1.1493597160. http://eur-lex.europa.eu/LexUriServ/LexUriServ.do?uri=OJ:L:2009:140:0063:0087:en:PDF Access date 22 Feb 2011.

44 | State and Trends of the Carbon Market 2010
but the Member States will remain in control of the administration of the POI regime.
This situation creates an opportunity for developing a consistent POI regime across EU Member States as a way to minimize the risk of continued jurisdictional shopping by criminals. This does not imply that the same POI regime will occur in each EU Member State, but that an equivalently robust POI regime will exist in each Member State. It may make sense for registry participation rules to be consistent with auc-tion participation rules, and there is some speculation from market participants that this will be the case.161
An associated issue is access controls over govern-ment holdings of Assigned Amount Units (AAUs) and Certified Emission Reductions (CERs). It seems likely that these access rights will remain under the control of the respective Member States. In this situ-ation, the move to the single European Union reg-istry is an opportunity to bring access controls in line with current banking practices by strengthening account access, audit, and notification processes.
3.4.3 Market Oversight Issues
This section covers market oversight issues such as money laundering, insider dealings, and fraud pre-vention. Much work has been undertaken in the EC to ensure the integrity of the carbon market.
Money laundering refers to transactions that are undertaken to hide the true sources of the money. Usually the money involved is earned from illegal sources and is laundered to give the appearance of coming from a legitimate source.162 The detection of laundering and enforcement of the law normally in-volves several agencies, including tax authorities, po-lice, and surveillance apparatus. A speculation and concern of carbon market participants is that money laundering exists in the market.163
This speculation is based on the ease of transfer of allowances between registry accounts held in differ-ent countries, while avoiding mandatory reporting requirements, because no threshold reporting limits are triggered. However, at the time of writing the au-thors are unaware of any substantiated cases of money laundering. The EC plans to address money launder-ing and other issues as part of a wide-ranging review of the market oversight framework of the EU ETS.164
The EU’s existing Market Abuse Directive165 (MAD) applies to emission allowance derivatives and cov-ers insider dealing and market manipulation. MAD does not currently apply to the spot allowance mar-ket in the majority of EU Member States because allowances are not defined as financial instruments.
According to the Prada review, many EU Member States have not resolved the legal status of allowanc-es. However, the Markets in Financial Instruments Directive (MiFID) has harmonized the part of the allowance derivatives market regarded as financial in-struments.166 The EC review of the market oversight framework will examine the need to better protect the scheme from insider dealing and market manipulation.
The EU has proposed a reverse charge mechanism to deal with VAT fraud167 and, at the time of writ-ing, several EU Member States have adopted the mechanism or an equivalent to address the problem. However, market participants continue to express concern that VAT fraud exists in the market as not all EU Member States have adopted the proposed reverse charge mechanism or an equivalent.
Continued VAT fraud is problematic for many mar-ket participants wishing to protect their organiza-tion’s brands and reputation. It is likely that VAT fraud will be removed from the EU emissions trad-ing scheme when all EU Member States adopt the proposed reverse charge or equivalent mechanism.
161. The EC auction regulations will ensure the integrity of the auctions by establishing minimum requirements for adequate customers through diligence checks. Eligibility to apply for admission to the auctions will be given to easily identifiable, well-defined categories of par-ticipants, notably operators of stationary installations and aircraft operators covered by the emissions trading scheme, as well as regulated financial entities, such as investment firms and credit institutions. 162. http://www.irs.gov/compliance/enforcement/article/0,,id=112999,00.html163. 164. http://europa.eu/rapid/pressReleasesAction.do?reference=MEMO/10/697&format=HTML Access date 25 Feb 2011.165. http://eur-lex.europa.eu/LexUriServ/LexUriServ.do?uri=OJ:L:2003:096:0016:0025:EN:PDF Access date 25 Feb 2011.166. http://eur-lex.europa.eu/LexUriServ/LexUriServ.do?uri=CONSLEG:2004L0039:20060428:EN:PDF Access date 25 Feb 2011.167. http://ec.europa.eu/taxation_customs/resources/documents/common/legislation/proposals/taxation/com(2009)511_en.pdf Access date 22 Feb 2011.

State and Trends of the Carbon Market 2010 | 45
It will be important to ensure harmonization of approaches and practices to prevent a recurrence of VAT fraud as other countries outside the EU Emissions Trading Scheme start to participate in emissions trading. Currently nine operational regis-tries are outside the EU ETS,168 with more planned.
3.4.4 Taxation and Accounting Treatments
The taxation treatment of allowances varies by ju-risdiction. Allowances purchased for investment purposes will generally be treated differently from allowances purchased for EU ETS compliance pur-poses. For compliance purposes nine EU Member States treat allowances as commodities for taxation purposes and allow an immediate deduction of the purchase price.
The remaining 18 countries treat allowances as in-tangible assets with five countries allowing firms to depreciate the assets over their expected lifetime.169 These approaches are equivalent when allowance are purchased and used for compliance purposes within the same tax year. When banking is involved, how-ever, there may be some advantages in immediate deductibility.
Currently no International Financial Reporting Standard (IFRS) exists for accounting of allowance and permits.170 The accounting treatment is frag-mented across jurisdictions and between entities, and some entities treat free allowances as zero value and do not include them on their balance sheets.
Some entities may continue to apply the withdrawn International Financial Reporting Interpretations Committee (IFRIC) 3 standard as an accounting policy. The most common approach recognizes freely allocated allowances at zero value, with obliga-tions/liabilities recognized at the carrying value of allowances already allocated (which may be zero) or purchased, with the balance, if applicable, valued at the prevailing market price.171
3.5 CONCLUSIONS
Universal participation—the idea that the market should be directly open to all who want to par-ticipate—has promoted open access to the carbon market. Yet, while universal participation encour-ages constituencies supportive of action on climate change, few schemes come close to its ideal. The principle does not readily fit with the practical reali-ty of building a robust, well-functioning market. An informal consensus appears to be developing among regulators to limit participation to identifiable cat-egories of participants, such as scheme participants and financial intermediaries.
168. http://unfccc.int/kyoto_protocol/registry_systems/registry_websites/items/4067.php Access Date 24 Feb 2011.169. This section made use of a study by Copenhagen Economics for the European Union. The report is available at http://ec.europa.eu/taxation_customs/common/publications/studies/index_en.htm Access Date 24 Feb 2011.170. http://www.ifrs.org/Current+Projects/IASB+Projects/Emission+Trading+Schemes/Emissions+Trading+Schemes.htm Access Date 15 March 2011.171. http://www.pwc.co.uk/eng/publications/trouble_entry_accounting_revisited.html Access Date 15 March 2011.

46 | State and Trends of the Carbon Market 2010
SECTION4

State and Trends of the Carbon Market 2010 | 47
Carbon and Climate Finance
MITIGATING THE WORST IMPACTS OF CLIMATE CHANGE requires substantial
investment.172 Much of the growth in both emissions and energy use will come from devel-
oping countries. Mitigation costs in developing countries consistent with keeping average
global temperature warming below 2˚C in comparison to preindustrial levels could reach
$139–175 billion per year by 2030. Delaying action increases costs, as the world locks itself
into high-carbon trajectories while stabilization options progressively disappear.
The World Energy Outlook 2010 estimates that within one year the global cost of keeping average global temperature warming below 2˚C in compari-son to preindustrial levels has increased by $1 trillion over 2010–30 (or $50 billion p.a.).173 The scale and the amounts of financing needed means that private capital flows will be vital to the transition to a low-carbon future.174 Therefore, the global community must continue to support mechanisms that mobilize private capital in support of emission reductions in developing countries.
This section provides information on project-based offsets mechanisms (Kyoto Markets), climate fi-nance, and new asset classes.
4.1 KYOTO MARKET—A POST-2012 FACING LOW DEMAND AND LOW SUPPLY
The Cancun Conference delivered positive deci-sions to improve the CDM (see Section 1.1). In addition, the Ad Hoc Working Group on Further Commitments for Annex I Parties under the Kyoto Protocol (AWG-KP) has tried to clarify some of the
considerations related to a possible gap between the first and subsequent commitment periods.175 Nevertheless, the current uncertainties surround-ing a post-2012 international agreement have left Europe alone to absorb the supply of project-based CERs in the post-2012 environment.
Even within Europe, demand for CERs post-2012 will be restricted. The recovery of the European economy after 2009 has been slow. There is a broad consensus among market participants that Phase II of the EU ETS will be considerably long (for ex-ample, EU installations’ cap will be higher than their overall emissions), leading many installations
4“The current uncertainties surrounding a post-2012 international agreement have left Europe alone to absorb the supply of project-based CERs in the post-2012 environment.”
172. Stern Review on the Economics of Climate Change. Ch 9:232. The global cost of reducing total GHG emissions to three-quarters of current levels (consistent with 550ppm CO2e stabilization trajectory) is estimated at around $1 trillion in 2050 or 1 percent of GDP in that year, with a range of –1.0 percent to 3.5 percent depending on the assumptions made. http://webarchive.nationalarchives.gov.uk/+/http://www.hm-treasury.gov.uk/independent_reviews/stern_review_economics_climate_change/stern_review_report.cfm Access date 6 April 2011.173. IEA 2011. World Energy Outlook. http://www.worldenergyoutlook.org/ Access date 29 March 2011.174. http://www.un.org/wcm/content/site/climatechange/pages/financeadvisorygroup/pid/13300 Access date 29 March 2011.175. UNFCCC. Legal Considerations relating to a possible gap between the first and subsequent commitment periods, July 2010.

48 | State and Trends of the Carbon Market 2010
to “bank” surplus allowances and offsets to be used in Phase III. The surplus to be brought over from Phase II together with the new Phase III allowances will reduce the needs for additional CERs in the first years of Phase III (2013–20).
As covered in the previous year’s report, new usage rules and qualitative restrictions will apply in the EU ETS. CERs will no longer be de facto compliance assets for Phase III of the EU ETS. Installations will have to swap them into EUAs to comply with their obligations, adding another layer of complexity to the process. In addition, only compliance entities will be allowed to swap CERs into EUAs, leaving the financial institutions out of the process and conse-quently reducing overall liquidity for those assets in the market.
The supply will also be limited. Offsets issued from projects registered after 2012 will only be eligible to be swapped if sourced from a least developed coun-try (LDC). However, limited emissions and major investment barriers will constrain the supply of eligi-ble CERs from LDCs. To illustrate the level of mag-nitude of those constraints, the number of CERs issued from LDCs is about 16,000,176 or 0.003 per-cent of the total 605 million CERs issued to date.177
In addition, the ban of offsets from hydrofluo-rocarbons (HFCs) and adipic acid N2O projects from Phase III will limit even further the number of CERs eligible for compliance in the EU ETS. A large portion of the CERs currently being issued are from these project types—407 million out of
the 605 million CERs issued to date (67 percent). The problem is further compounded because it takes on average about 670 days for project developers to get their projects registered178 yet there are only 631 days left until December 31, 2012.179 This strongly diminishes the hope that projects in the early stages of development will be able to get registered in time and generate EU ETS-eligible credits.
Unless additional non-EU demand emerges soon and the supply is boosted by meaningful CDM re-forms, project developers will have very little, if any, real incentive to continue investing in new CDM projects. This will eventually lead to the already an-ticipated movement of resources—capital, capabili-ties, and personnel—to other markets.
4.1.1 CERs—What Did or Did Not Happen in 2010?
In 2010, the market volume and value of project-based transactions fell by almost 50 percent from the previous year, to reach a total value of approximately $1.5 billion. The two-digit annual decline in the size of the market in the last three consecutive years (12 percent in 2008, 59 percent in 2009, and 46 percent in 2010) led the primary CER (pCER) market to its record low value since the entry into force of the Kyoto Protocol in 2005.
Primary CER transactions, which used to represent a significant portion of the global carbon market in previous years (up to 23 percent of the market in 2005 and 19 percent in 2006), account for barely 1 percent of the global market today.
4.1.1.1 CER Supply and Demand Dynamics —A Smaller Market and a Buyer’s Market
Since 2009, sovereign buyers who still had some residual emission reduction obligations, and have historically engaged in origination activities and promoted the project-based primary market, largely shifted their efforts toward the Assigned Amount Units (AAUs) market. This market offers predict-able volumes, making it a suitable instrument for
“Unless additional non-EU demand emerges soon and the supply is boosted by meaningful CDM reforms, project developers will have very little, if any, real incentive to continue investing in new CDM projects.”
176. Projects in Tanzania, Lao PDR and Bhutan.177. UNEP Risoe, CDM/JI Pipeline Analysis and Database, May 1, 2011.178. World Bank, UNEP Risoe, CDM/JI Pipeline Analysis and Database.179. As of May 1, 2011.

State and Trends of the Carbon Market 2010 | 49
compliance buyers to match and fine-tune demand to “land on the dime,” which represents their final Kyoto obligations.
In addition, during 2010 the primary market was further negatively affected as some sovereign buyers increased purchases in the secondary CER (sCER) market, taking advantage of fast transactions, relatively inexpensive and simple contractual processes, and pre-dictable volumes ensured through delivery guarantee.
Demand from the private sector has also consider-ably reduced, as lower overall GHG emissions led to a surplus of allowances and offsets in the EU ETS. A large number of financial institutions (that is, nonfi-nancially regulated traders and private banks), inter-mediaries, and aggregators preferred investing in ex-isting—undervalued—portfolios rather than in new projects, and froze their origination activities. Other buyers either exited the market or were acquired by other firms in the past two to three years, which sub-stantially reduced the primary market’s liquidity.
Despite the overall decline in the pCER market and the exits of many participants, the market continues to limp along with mainly private sector buyers look-ing for cheap opportunities to purchase both pre- and post-2012 CERs. The still active private sector buy-ers include mainly utilities and financials. Potential aviation compliance buyers have shown an increased interest in precompliance, but this is yet to translate into significant demand.180 In addition, some demand has come from a few multilaterals and governmental agencies winding up funds close to full subscription.
Utilities continue buying CERs since they are cheap-er than EUAs for compliance purposes. Utilities and nonfinancially regulated traders have a cost advan-tage over private banks because they do not have to comply with the stringent and potentially expensive rules imposed by the Basel Accords.181 On the other hand, the large commercial banks have continued to develop their portfolios of captive clients because of their strong reputations, attractive and flexible fi-nancial packages, and creditworthiness.
The pCER market is a buyer’s market with minimal residual demand until 2012. Uncertain eligibility rules and the lack of traction for post-2012 have in-creased the bargaining power of active buyers. This imbalance has been reflected in Emission Reduction Purchase Agreement (ERPA) terms and conditions.
4.1.1.2 Emission Reduction Purchase Agreements —Tailored to Buyers
As reported last year, project registration prior to December 31, 2012, and EU ETS eligibility became standard clauses in the great majority of ERPAs. In addition, last year buyers involved in both origina-tion and secondary trade reportedly secured even more stringent conditionality and guarantee clauses in their ERPAs. In the case assets prove not eligible at delivery, ERPA prices are reduced to the prevail-ing prices for these assets in the voluntary market.182 Option clauses also have become common in ERPAs. If the offsets transacted are not eligible at time of delivery or at the buyer’s sole discretion, contractual purchase obligations may be converted into call op-tions; in this case, the market liquidity is squeezed and no secondary trade occurs (that is, buyers can terminate the contracts without penalties, thus pass-ing the entire delivery risk to the sellers). The results of the World Bank survey confirmed the trends. More than 80 percent of respondents confirmed re-strictive clauses in their ERPAs, in addition to regis-tration pre-2012 and eligibility under the EU ETS.
Some increase in the level of activity in the primary market was reported in early 2011. Some buyers, who had their origination activities dramatically reduced in 2009 and frozen in 2010, resumed some investment and sought new projects, motivated by the internal pressure to justify the maintenance of the personnel infrastructure created. It is also interesting to note that, at the same time that the overall uncertainty favors buy-ers, the few sellers who hold the most desirable pCER assets (that is, clean energy projects in advanced stage of development and projects in LDCs) have obtained favorable ERPA conditions and premium prices.
180. The aviation sector is to be included in the EU ETS in 2012. Please refer to Section 2.1 for further details.181. The Basel Accords set up global regulatory standards on bank capital adequacy and liquidity designed to ensure that banks holds capital reserves appropriate to face the risk exposure in their lending and investment practices, safeguarding their solvency and overall economic stability. http://www.bis.org/press/p101201a.htm Access date 07 April 2011.182. Some buyers have reported favoring CDM projects with CERs that are also compliant with voluntary standards, such as Gold Standard.

50 | State and Trends of the Carbon Market 2010
Finally, the lack of demand has also led to further market segmentation and the rise of niche markets that accentuate technology and regional preferences, reflect specific objectives of sellers and buyers, and favor commercial relationships built in previous years. Under this scenario, ERPAs are being tailored to address specific preferences and objectives, sub-stantially increasing the lack of transparency of the primary market—a market that now resembles the earlier days of the Kyoto Protocol, when the level of information was sparse and inconsistent.
4.1.1.3 New Operational Dynamics —Prices and Behavior
Pre-2013
Despite the recovery of sCER prices vis-à-vis the previous year (that is, consistent with other energy related commodities), pCER prices did not follow the same pattern. With lower compliance needs, buyers were more selective and acquired safer assets. For these assets prices remained at the same level as the previous year (2009).
Fixed prices for pre-2013 pCERs averaged €8–10 across most regions and sectors. In cases where vari-able prices were negotiated, floor or fixed components were in the €7–8 range, while variable components—defined in terms of shared upside between buyers and sellers—commonly reached 90 percent of the spot CER prices, to be determined based on the prevailing price on the largest exchanges at the time of delivery.
Respondents to the World Bank survey who indi-cated interest in buying CP-1 HFC-23 offsets to be delivered after April 2013 reported prices lower than €6. The information clearly indicates that, since those offsets will no longer be valid for EU instal-lations, governments with obligations under Kyoto become the sole buyers of those assets183 and value them in the same price range of AAUs, which are equally acceptable Kyoto compliance assets.
Sovereign buyers have also been accessing sCERs from industrial gas projects to be delivered after April 2013 (and before the end of the “true up” peri-od) at the same price range of AAUs, and thus, even cheaper than the prevailing price for EU ETS eligi-ble pCERs for the same delivery dates. The negative spread—sCERs being cheaper than pCERs—be-tween the secondary and the primary market prices in those specific offsets should further encourage sovereign buyers to seek those sources.
Post-2012
Post-2012 prices were reported to be in the €6–8 range, with €7–7.50 being the median prices—al-most identical to those reported in 2009. Variable price formulas followed pre-2013 transactions, but discounts on upside sharing were reported to be slightly higher—up to 20 percent of the spot CERs at delivery. The discount on the variable price com-ponent increases relative to how high the fixed floor price is agreed upon (i.e., sellers’ access to upside prices at delivery is reduced).
These prices are consistent with other publicly avail-able information184 and with the results of the World Bank survey. About 70 percent of the respondents confirmed either not buying post-2012 offsets or if they were, prices were in the €6–8 range. If a fully variable price were chosen, over 70 percent of re-spondents indicated prices would be between 60 to 80 percent of spot CERs prices.
In addition to the new contractual developments mentioned in Section 4.1.1.2, several players re-ported further safety provisions and changes in their modus operandi. The origination arms of private sector financials reported very low incentives to in-vest in post-2012 offsets because of concerns over the possibility of financial losses. This risk reportedly led shareholders to zero-value offsets to be delivered after 2012. In addition, capital reserve provisions under the Basel rules substantially reduce the return on equity (RoE) in those deals.
183. Although those assets may eventually be eligible to other ETS outside Europe, it is very unlikely that a relevant demand will be created given the precedent provided by the EU.184. IDEAcarbon’s pCER Index confirms our findings and shows that average post-2012 pCER prices varied within the narrow range
2010 and early 2011.

State and Trends of the Carbon Market 2010 | 51
Other financials, concerned about reputational risks and future liabilities, have reportedly removed carbon assets and projects from their spectrum of investment alternatives. Moreover, many froze carbon advisory services to both traditional and new clients seeking in-vestment diversification and environmentally friendly investment alternatives. Similarly, some sovereign buyers have reported receiving clear instructions to refrain from any exposure to post-2012 offsets.
Finally, although specific limits in contractual obli-gations (e.g., maximum prices, volume contracted, length of contracts, and ERPA value) have been commonly used by buyers as a means to matching their budget allocations, corporate buyers reported much more stringent limits for post-2012 transac-tions. The stringency of those limits increased in ERPAs signed at fixed prices or in projects located in the most industrialized developing countries.
Although a few contracts up to 2020 were reported, buyers strongly preferred to sign ERPAs limited to the end of the project’s first crediting period (that is, reducing the risks related to the obligatory renewal of the project’s additionality) and early 2015 (that is, the expiration of the “true up” period for govern-ments with obligations under the first commitment period of the Kyoto Protocol), whichever comes first.
Buyers—especially financials—strongly favored vari-able prices in the ERPAs, capped at the sCER price to limit their financial exposure. Some buyers have reported being allowed to sign fixed-price ERPAs in least developed countries only. In contrast, sellers indi-cated a preference for fixed-price contracts, at least for the initial years of their contracts. This practice allows them to seek finance or, at least, to forecast the extent of possible future revenue streams. This message was also conveyed by sellers dealing with Programmes of Activities (PoAs), especially when the implementing agency, commonly a financial institution or govern-mental agency, plays the role of the financier or guar-antor of the projects undertaken by the program.
The current buyers’ preference for variable prices and the sellers’ preference for fixed prices is the opposite of what the market witnessed in 2006–08. In those days,
sellers favored variable prices, as they desired poten-tial upside gains and did not perceive any downside risk. During 2006–08, buyers preferred fixed prices to reduce their exposures to price spikes. The cur-rent reversal of the 2006–08 trend indicates that the downside risk is perceived as higher now, given the uncertainties in the post-2012 market.
However, the ERPA risk allocation between the parties may be more relevant than pricing. The eligibility and option clauses mentioned previously drain most of the predictability and security of fixed-price contracts (i.e., future flows of resources cannot be ensured until deliv-ery). As a result, in ERPAs incorporating those clauses, front-loading mechanisms such as unsecured advance payments from buyers or commercial loans backed-up by future carbon revenues could not be found. On the other hand, those clauses have also allowed ERPAs to address both buyers’ and sellers’ concerns and objec-tives in either pricing approach chosen. Thus, both fixed- and variable-price contracts were observed.
4.1.2 ERUs—What Lies Ahead?
Many of the issues surrounding the development of the JI market are similar to the CDM and relate to the post-2012 uncertainties, but with additional complexi-ties. Unless Parties adopt a COP decision not to do so, JI country governments or legal entities authorized by them might still be able to continue determining proj-ects and verifying Emission Reduction Units (ERUs) unilaterally beyond 2012 under Track 1.
In fact, interested JI Parties may have no incentive to stop ERU issuance for post-2012 vintages. However, it is less clear whether the Joint Implementation Supervisory Committee (JISC) has a mandate to continue its activities under the Track 2 procedure after 2012. In that scenario, it is envisioned that buyers will require strong monitoring and auditing processes in place to ensure environmental integrity.
It is also unclear whether ERUs can be issued for emission reductions that occur after the end of the first commitment period and prior to another. The JISC raised these and other questions in its last an-nual report,185 providing recommendations and
185. Annual report of the Joint Implementation Supervisory Committee of the Parties serving as the meeting of the Parties to the Kyoto Protocol, November 16, 2010, UNFCCC.

52 | State and Trends of the Carbon Market 2010
indicating areas of improvements for the JI process and a possible reorientation of the JISC’s program. These recommendations include further improve-ment of the verification procedure, increasing the number of accredited independent entities, and en-hancing the financial stability of the JISC.
In terms of the JI market, JISC recommendations include consolidating the two tracks into one single unified track for JI and allowing the issuance of the emission reductions for existing and new JI projects between January 1, 2013 and either the end of the “true-up” period or the entry into force of new com-mitments, whichever is sooner, by converting AAUs from the first commitment period.186
No significant changes were reported in the JI prices in 2010. As ERUs became tradable on exchange platforms in late 2010,187 liquidity for those assets increased and consequently, the traditional pricing discount over sCERs reported in previous year di-minished in 2010. Still, the much lower volumes of ERUs available in the market (vis-à-vis CER) kept the JI market in the hands of few players. Whereas some participants found JI a very attractive market for offsets in 2010—specifically the possibility to obtain retroactive offsets—other participants report-ed an unwillingness to accept the counterparty risk involved in ERU deals.
Sberbank, the State Savings Bank of Russia—the entity designated as the authorized entity to man-age the selection of potential JI projects in Russia—confirmed the officially recommended price of €10 for the Russian tenders handled in 2010.188 That price is at the high end of primary market prices,
which is justifiable based on the credit-enhancement and (counterpart) risk-mitigation roles played by Sberbank in the process.
Deals have reportedly been signed at prices lower than the government’s recommended €10 and more consistent with the prevailing primary market price range. This has resulted in at least one legal dispute between a buyer and seller,189 and has raised con-cerns among certain buyers regarding the effective-ness of their ERPAs.190
To date, 199 of the 392 visible projects in the JI pipeline are referenced as Track 2 projects (that is, 51 percent of the total) and 28 (14 percent) out of them have been determined. Under Track 1, all 193 vis-ible projects in the pipeline (49 percent of the total) have already been approved by their respective host countries. Russia is currently responsible for 113 vis-ible projects, leaving the former leader, Ukraine, in second place with 70 projects.191
Although striking, the latest moves from Russia could not yet be reflected in the number of deter-mined projects or in the volume of issued ERUs. Ukraine remains in the lead with 47 determined projects (versus 4 in Russia) and about 50 percent of the almost 30 million issued ERUs to date, followed by Russia with about a 15 percent share.
4.1.3 AAUs—Responding to the Lack of Demand
AAU prices in 2010 were reported to have substan-tially dropped from the €8–10 seen in 2009 to the €5–7 level as carbon buyers became less active. It was
186. “The JISC is of the view that the two-track approach to JI, as it is currently applied, is not sustainable and is hindering the success of the overall JI mechanism in a number of ways.” Paragraph 125, page 41 of the JISC Annual report cited above.187. On November 8, 2010, the Intercontinental Exchange (ICE) ECX announced the first cleared trade of EURs. The ERUs were traded
introduced ERUs in the list of assets tradable in their platform. 188. In July 2010, the Ministry of Economic Development (MED) of Russia approved the results of the first Russian JI tender, managed by Sberbank. In the tender, 15 JI projects, which could earn up to 30 million ERUs, have been approved. A second tender was announced few months later with a deadline for applications in October 2010. In the second tender, 18 projects generating up to 29 million tons were granted with LoA. Ten of 18 projects have applied for LoA for the second time. A third JI project tender was announced by the Russian gov-ernment and it is expected by mid-March 2011. Like the previous two, the third tender would likely be assigned a cap of 30 million ERUs. Source: Point Carbon communication to the authors. 189. The Arbitration Court of Perm turned down a claim from Halopolymer, which was seeking to breach a contract to sell ERUs to
Carbon Market Daily, April 20, 2011.190. In a government newsletter, the Danish Energy Agency said it was withdrawing from investing in Russian emission reduction projects
give guarantees that the offset credits it was seeking would be issued. Source: Point Carbon, CDM&JI Monitor, April 13, 2011.191. http://www.cdmpipeline.org/publications/JiPipeline.xlsx Access date 1 March 2011.
State and Trends of the Carbon Market 2010 | 53
noticed that private Japanese carbon buyers, such as utility companies, have kept their focus on AAUs due to the predictability of those assets. However, instead of pursuing those though direct purchases as in previ-ous years, they started bidding for AAUs via brokers, such as Japanese trading houses.
The UNFCCC negotiation proposals spearheaded by the European Commission to ban or limit banking first commitment period AAUs under any new inter-national agreement (or possibly as an arrangement in-ternal to the EU) provided an incentive for countries to try and sell more AAUs during the first commit-ment period. This essentially turned the market into a buyer’s market and suppressed AAU prices further.
More AAU sellers have entered the market but their be-haviors have varied. For example, Latvia, which was one of the front-runners of the Green Investment Schemes (GIS), has opted to stop offering AAU sales because of the currently low AAU prices, while other countries, such as Estonia, the Czech Republic, and Poland, have actively sought to sell their AAUs, mainly to Japanese private firms. Countries such as Lithuania, Bulgaria, and those that had difficulties in the implementation of the GIS before, such as Ukraine and Slovakia, started preparations for new GIS transactions.
Although the number of AAU purchase agreements signed in 2010 grew compared to 2009, the vol-ume of AAUs sold dropped, having spiked in 2009 because of the large GIS transaction in the Czech Republic and Ukraine. Seller countries have been re-quested to demonstrate the accountability and trans-parency of the AAU transaction via their GISs to at-tract AAU buyers. It should be noted that Russia, potentially the largest seller of AAUs, has not been able to enter the market, as the regulatory frame-work could not be prepared.
Japan kept its absolute dominant position among AAU buyers, although with smaller amounts. As Annex 1 countries get close to fully complying with their Kyoto obligations, governments reduce the pace of their purchases, and trading opportunities for private sector players decline in tandem. Still, the rapid decline in AAU prices resulted in a large spread between those assets and more expensive CERs, opening profitable swap opportunities for private sector Japanese firms. The reported issues regarding the misuse of AAU proceeds from Ukraine may have
led the country to lose its position as leading seller in 2010. Estonia, with about 50 percent of market share, became the preferred source for AAU buyers in 2010, followed by Czech Republic and Poland.
The last ten years have shown that the Kyoto flex-ibility mechanisms are often cumbersome. As a re-sult, GIS operations typically bundle many subproj-ects coordinated by a single management entity and monitor and verify results on a sample basis.
These elements are similar to those that PoAs have to address. Although it is too early to draw conclusions, GIS operations could, therefore, serve as additional testing ground for management, implementation, monitoring, and verification procedures for mitiga-tion programs, similar to the ones foreseen under the PoA rules and procedures.
In many cases, GIS operations also focus on prop-er and transparent financial management of the program, which is also important to consider in PoAs. Similarly, some elements of the GIS could be useful in planning and implementing Nationally Appropriate Mitigation Actions (NAMAs) in devel-oping countries or provide insight into the develop-ment of new market-based instruments.
4.2 VOLUNTARY MARKETS
The voluntary markets remain a small, but important component of the overall carbon market. Voluntary action by environmentally conscious individuals and organizations continues to send an important mes-sage on the need for action. This message has been expressed through the rapid growth of the Voluntary markets (see Box 5).
“GIS operations could, therefore, serve as additional testing ground for management, implementation, monitoring, and verification procedures for mitigation programs, similar to the ones foreseen under the PoA rules and procedures.”

54 | State and Trends of the Carbon Market 2010
BOX 5. Voluntary Markets
2010 was a record year for activity in the voluntary carbon markets (VCM). While the volumes in the VCM remain miniscule, less than 0.3 percent of the global carbon markets, overall transaction volumes increased 28 percent between 2009 and 2010 (see Table 11). The global economic crisis that dampened demand for voluntary climate action in 2009 gave way to market growth as buyers sought credits from projects that reduce emissions from deforestation and forest degradation (REDD).
The meteoric rise of REDD’s market share (+500% from 2009)* can be attributed to formal internation-al recognition for REDD and conservation-based REDD+ as critical for climate change mitigation as well as likely pre-compliance interest in the project type under California’s emerging cap-and-trade program.
At the same time, REDD gained market standing on the platform of the first REDD project methodologies approved for use by the Verified Carbon Standard (VCS) and through forest-focused third-party stan-dards like Brasil Mata Viva (BMV).
Not all project types witnessed such growth. Transactions of methane-based credits—which was the most popular project category in 2009—fell dramatically in 2010 as hope for national pre-compliance credits’ value waned with failed US federal climate legislation.
However, the US maintained a slight lead (<1 MtCO2e) over Latin America as the top project loca-tion due to landfill methane and the growing popu-larity of improved forest management (IFM) projects
and the destruction of ozone depleting substances (ODS) under the Climate Action Reserve (CAR).
A huge shift in the marketplace was the demise of the CCX cap-and-trade program. Shortly af-ter acquiring CCX operator Climate Exchange, IntercontinentalExchange (ICE) announced that CCX’s severely over-allocated voluntary cap-and-trade program would conclude at the end of the program’s Phase II in December 2010. In lieu of exchange trad-ing, ICE will continue to operate the CCX program’s project protocols and registry system in 2011–12.
Parallel to the collapse of exchange-traded volumes and prices, however, sellers began trading CCX credits off-exchange (bilaterally) to obtain higher pric-es. One such bilateral trade rocked the voluntary mar-ket in 2010, transacting 59 MtCO2e at $0.02/tCO2e. Even excluding this trade, CCX ranked among the top third-party standards in 2010—with some retail-ers packaging the low-priced credits (average $0.2/tCO2e) along with non-CO2 environmental assets to obtain higher retail prices.
The voluntary markets have always seen a mix of “pure voluntary” offsetting and pre-compliance motivations. Last year, suppliers reported that the bulk of transac-tions, around 70 percent, were driven by purely vol-untary intentions. A resurgence in value among purely voluntary standards like the Gold Standard (up 56% to $55 million) and continued interest in “act local” project types like bike shares and composting illus-trate ways the market continues to adapt (and grow) around its traditional customer base.
Average price ($/tCO2e) Volume (MtCO2e) Value (million $)
2009 2010 2009 2010 2009 2010
Chicago Climate Exchange (CFIs) 1.2 0.1 41.4 1.6 49.8 0.2
Voluntary over-the-counter market 6.5 5.8 55.4 125 357.8 393.5
Of which VCS 4.7 5.2 16.4 26.1 76.8 134.8
Of which CAR 7 5.8 14.6 13.4 101.9 78.2
Of which Gold Standard 11.1 11.4 3.2 4.8 35.2 54.7
Of which CCX bilateral 0.8 0.2 5.5 61.4 4.3 1.4
Source: Ecosystem Marketplace and Bloomberg New Energy Finance NOTE: preliminary findings, dated April 2010
Table 11. Voluntary Market
Prices and Volumes
*Survey respondents transacted 16.7 MtCO2e REDD offset credits in 2010, up from 2.8 MtCO2e in 2009.
Kindly provided by Hamilton et al from Ecosystem Market Place and Bloomberg New Energy Finance.

State and Trends of the Carbon Market 2010 | 55
4.3 MOBILIZING LOW-CARBON INVESTMENT—BEYOND CARBON REVENUE STREAMS
The CDM has been an important catalyst of low-carbon investment in developing countries. By en-hancing the overall financial viability of low-carbon projects in low-income countries, it leveraged other resources and catalyzed the shift of much larger amounts of (essentially private) financial and invest-ment flows toward climate-smart development.
However, as we approach 2012, the prospect of rev-enues from the CDM shrinks, and CDM currently makes little difference in accessing financing. Because of the deep uncertainty surrounding the regulatory frameworks for mitigating GHG emissions post-2012, and the continued evolution of methodologies and other crediting rules, banks are unwilling to con-sider future flows from CERs in debt sizing.192
It is well known that developing countries face large investment barriers—the lower income countries in particular. Mobilizing low-carbon investment in emerging markets can be challenging. Investors in these countries typically face small-market size, weak business environments, high levels of perceived risk, relatively low competitiveness, and incomplete capital markets, so that sponsors are unable to secure debt with sufficient maturities to cover the higher up-front cost of low-carbon investment. These constraints are especially relevant in LDCs where European carbon markets are now looking to source post-2012 CERs.
This situation is further complicated by the fact that carbon offsets are normally paid upon delivery, only after the underlying project has been built and has be-come operational. This reduces the capacity of carbon offsets to meet capital investment needs. In addition, the very low incremental revenue streams provided by carbon offsets in many clean energy technologies—particularly in renewable energy projects—have limited
the transformational impact of CDM. In many sectors, revenues from carbon credits have simply not been able to overcome the sectoral and regional investment barri-ers faced by many underlying projects.193
Lenders that had in earlier years been willing to ac-count for prospective CDM cash flows in debt siz-ing are no longer willing to do so, given the fact that buyers typically do not take CER eligibility risk any-more. Moreover, on the supply side, as the post-2012 market refocuses towards LDCs, the potential proj-ects and sponsors are considered less strong and less creditworthy. As a result, some market participants report that their CDM origination efforts are winding down. On the bright side, some market participants report increasing interest in the forestry sector, with fi-nancing potentially driven by voluntary carbon deals.
The relative decline in the importance of CDM has refocused attention on the value of additional revenues from carbon finance that enhances the overall financial viability of low-carbon projects. As performance-based payments, these revenues create a positive incentive for good management and operational practices that will sustain emission reductions over time.194
As the global credit crisis eased during 2010, low-car-bon finance and investment recovered, growing by 30 percent to $243 billion.195 Clean energy investment in the Asian region increased 33 percent to $82.8 billon. This is partly because of the rapid growth of private in-vestment in China’s clean energy sector, which increased by 39 percent to $54.4 billion. Many other developing countries fared less well: Brazil only achieved $7.6 bil-lion and India $4.0 billion. Argentina ($743 million) and Mexico ($2.3 billion) were the fastest-growing markets, at 568 percent and 273 percent, respectively.
Climate financing is a priority area for the six ma-jor multilateral development banks (MDBs),196 which are increasingly integrating climate into their support to client countries. The MDBs’ country
192. UNEP 2009. Catalysing low-carbon growth in developing economies. http://www.unep.org/PDF/PressReleases/Public_financ-ing_mechanisms_report.pdf Access date 08 April 2011.193. Kossoy, A. 2010. “Managing Expectations,” Trading Carbon, February 2010, Thomson Reuters Point Carbon.194. Bosi, M. et al. 2010. “10 Years of Experience in Carbon Finance.” Carbon Finance Unit, World Bank. http://siteresources.worldbank.org/INTCARBONFINANCE/Resources/10YearsofExperienceinCF_Exec_Summary.pdf Access date 29 April 2011.195. The Pew Charitable Trusts. 2011. “Who’s Winning the Global Clean Energy Race.” http://www.pewenvironment.org/news-room/press-releases/global-clean-energy-investment-reached-record-243-billion-in-2010-329326 Access date 02 April 2011.196. This discussion focuses on the five major MDBs collaborating on the CIFs: African Development Bank (AfDB), Asian Development Bank (ADB), European Bank for Reconstruction and Development (EBRD), European Investment Bank (EIB), Inter-American Development Bank (IADB), and the World Bank Group (WBG).

56 | State and Trends of the Carbon Market 2010
assistance strategies—jointly developed with cli-ent governments and other key stakeholders—in-creasingly address climate issues.MDB support has historically taken the form of investment funding, risk mitigation, and technical assistance (providing capacity-building and other policy, regulatory and institutional advice). In the past decade the MDBs have increasingly tailored specific instruments aimed at reducing barriers to low-carbon investment, in-cluding climate-specific funding instruments, risk mitigation instruments, and carbon funds and facili-ties.MDB funding for mitigation activities has risen from $5.4 billion in 2006 to $17 billion in 2009. This growth trend is expected to continue, with in-dicative financing of $20 billion in 2012.197
An important driver of the growth in MDB climate financing has been the Climate Investment Funds (CIF), which provide new and additional financing through the MDBs to support mitigation and ad-aptation at a significant scale. To date, donors have pledged $6.4 billion to the CIF, which is piloting efforts in 45 client countries. The CIF comprises two funds: the Clean Technology Fund (CTF) and the Strategic Climate Fund (SCF).198 Further, sev-eral of the MDBs have developed specific initiatives targeting sustainable energy, which enables them to combine carbon finance—notably, purchasing post-2012 CERs—with underlying project finance:
Program199
Development (EBRD) Sustainable Energy Initiative (SEI),200 EBRD Post-2012 Fund, and EBRD Multilateral Carbon Credit Fund (MCCF)201
Carbon Credit Fund202
Sustainable Energy and Climate Change Initiative (SECCI)203
2012 Carbon Facility204 205
Grant support has historically been channeled through donor-financed facilities, notably the Global Environment Facility (GEF), a range of bi-lateral funds, and the MDBs’ own budgets.
Responding to growing interest from fixed-income investors looking to support climate activities with their investments, MDBs have issued “green bonds,” which raise funding earmarked to low-carbon ac-tivities in client countries.206 This builds on earlier experience with climate-themed bonds, such as the CER-linked “COOL” bonds207 (a total of $31.5 million was raised through two bonds with coupons
197. United Nations High-Level Advisory Group on Climate Change Financing. Work Stream 4: Contributions from International Financial Institutions. http://www.un.org/wcm/content/site/climatechange/pages/financeadvisorygroup/pid/13300 Access date 08 April 2011.198. Under the SCF, there are three targeted programs with total pledges of $1.8 billion in funding. The Forest Investment Program (FIP) is supporting REDD+ activities in eight pilot countries). The Scaling Up Renewable Energy Program in Low Income Countries (SREP) is supporting grid- and off-grid electricity, including renewable generation and the transmission and distribution grids needed to connect them, as well as household energy. A third SCF program, the Pilot Program for Climate Resilience (PPCR), is developing strategic investment programs supporting climate resilience. http://www.climateinvestmentfunds.org/cif/ Access date 08 April 2011.199. The Asian Development Bank (ADB) carbon market program supports CDM projects through two carbon funds (the Asia Pacific Car-bon Fund and Future Carbon Fund), a technical support facility, and a credit marketing facility. http://www.adb.org/Clean-Energy/CEFPF.asp Access date 5 April 2011.200. http://www.ebrd.com/pages/homepage.shtml Access date 08 April 2011.201. The Multilateral Carbon Credit Fund (MCCF) is a post-2012 fund jointly developed by the EBRD and EIB. http://www.ebrd.com/pages/sector/energyefficiency/sei/carbon/markets.shtml Access date 5 April 2011.202. The Post 2012 Carbon Credit Fund focuses exclusively on purchasing CERs and ERUs generated after 2012, potentially up to 2020, with funding from the European Investment Bank, Caisse des Dépôts, Instituto de Crédito Oficial, KfW Bankengruppe, and Nordic Investment Bank. http://www.eib.org/projects/publications/post-2012-carbon-credit-fund.htm Access date 5 April 2011.203. http://www.iadb.org/en/topics/climate-change/secci,1449.html Access date 27 April 2011.204. IFC launched a Post-2012 Carbon Facility in February 2011 to forward purchase CERs from projects either directly financed by IFC or by local banks financed by IFC. 205. http://web.worldbank.org/WBSITE/EXTERNAL/TOPICS/ENVIRONMENT/EXTCARBONFINANCE/0,,contentMDK:21871259~menuPK:5216275~pagePK:64168445~piPK:64168309~theSitePK:4125853,00.html. 206. Since the inaugural issue issued in 2008, the World Bank has raised about $2.3 billion via 39 World Bank Green Bonds issued in 15 currencies. http://treasury.worldbank.org/cmd/htm/WorldBankGreenBonds.html. Other MDBs, such as IFC, have also issued similar green bonds in 2010. For example IFC’s four-year, fixed-rate bond raised $200 million. http://www.ifc.org/ifcext/media.nsf/Content/IFCGreen-Bond Access date 08 April 2011. 207. Cool Bonds are five-year AAA notes issued by the International Bank for Reconstruction and Development (IBRD) and linked to Certified Emission Reductions (CERs) set up under the Kyoto Protocol. http://siteresources.worldbank.org/CFPEXT/Resources/IF-for-Development-Solutions.pdf Access date 5 April 2011.

State and Trends of the Carbon Market 2010 | 57
tied to CERs generated by specified GHG-reducing projects in China and Malaysia) and “Eco Notes”208 linked to special equity indices that support clean energy or other eco-friendly sectors (approximately $390 million was raised through three euro-de-noinated transactions). However, funds raised with the “COOL” bonds and “Eco Notes” were not ear-marked for specific purposes.
The Green Climate Fund (see Section 1.2) and the expansion of green lending through international financial institutions are important developments that will provide additional financial support for de-veloping countries.
Looking forward, long-term carbon price signals are fundamental to deploy the currently not vi-able low-carbon technologies, as well as to develop new low-carbon technologies necessary to support the technological transformation to a low-carbon society. The low-carbon transition will be achieved through an appropriate mix of policy measures (such as domestic/national budget allocations), conces-sional finance, and overseas development assistance (ODA). Nonetheless, private sector resources and investments will be needed at a much larger scale than is available today in order to tackle the enor-mous infrastructure transformation that is required.
4.4 NEW ASSET CLASSES COMING TO THE MARKET
Many of the emission reduction opportunities are beyond CDM, notably in the REDD+ space. They do not have clear methodologies and are in sectors that may not be amenable to conventional financing. Organizing, financing, and implementing carbon projects in such sectors as low-tillage agriculture and sustainable land management will require developing new organizational and financing models. The follow-ing is a brief discussion of new developments in forest (REDD and REDD+), agriculture, and soils.
4.4.1 REDD and REDD+
A significant development was achieved at the Cancun Conference (COP 16). For the first time, the impor-tance of stemming the loss of tropical forests for miti-gating global climate change with financial support from the industrialized world was enshrined in an international agreement. The Kyoto Protocol’s Clean Development Mechanism has only allowed incentive payments to be made for afforestation and reforesta-tion in developing countries, and only at the level of projects. With COP 16 decision, entire jurisdictions (including countries themselves) could receive incen-tives, subject to verification that emissions have been reduced against a reference level.209
All developing country activities referred to as “REDD+” are now eligible for financial support. They are as follows:
to diverge from the reference level by reducing the conversion of forest to nonforest);
-verging from the reference level by reducing the gradual loss of biomass because of activities un-der the canopy);
forests);
emissions through harvesting activities with low-er impact); and
-hanced sequestration, for example, through reforestation).
REDD+ activities will have to support and promote safeguards. In particular, the knowledge and rights of indigenous peoples and local communities must be respected. Indigenous peoples and local com-munities must be able to participate fully and ef-fectively. In addition, the national forest governance structures must be transparent and effective, taking into account national legislation and sovereignty. REDD+ must not encourage the conversion of nat-ural forests to plantations.
208. http://treasury.worldbank.org/ Access date 08 April 2011.209. Cancun Decision (Ad Hoc Working Group on Long-term Cooperative Action): http://unfccc.int/files/meetings/cop_16/application/pdf/cop16_lca.pdf, Sections III.C, and Annexes I and II. Access date 09 April 2011.

58 | State and Trends of the Carbon Market 2010
Emissions from forests will now have to be ac-counted at the national level, possibly starting at the subnational level as an interim measure. However, the principles or objectives of the Cancun decision will still need to be operationalized. The Subsidiary Body on Scientific and Technological Advice (SBSTA) is expected to develop modalities on the setting of Reference Emission Levels and the design of measurement, reporting, and verification systems (MRV) and to propose guidance on the establish-ment of information systems by developing coun-tries to report on safeguards.
Even though the magnitude of finances required for REDD+ calls for the involvement of the private sector, the role of markets in mobilizing funding for REDD+ still needs to be discussed under the UNFCCC. It is clearly agreed that Phase l (national strategies and ca-pacity building) and Phase ll (implementation of strat-egies and investment in demonstration activities) will be financed through additional public bilateral or ex-isting multilateral assistance, such as under Norway’s International Climate and Forest Initiative, the Forest Carbon Partnership Facility (FCPF), the REDD+ Partnership, or the UN-REDD Programme. What is left open is the type of support that should be provid-ed for Phase lll (development of result-based activities that are fully measured, reported, and verified). The Ad Hoc Working Group on Long-term Cooperative Action (AWG-LCA) was mandated to explore options and will report to the Durban Conference (COP 17). It is likely that multiple channels will be proposed, recognizing the role of the private sector, including through carbon markets, in addition to government assistance.
4.4.1.1 California—REDD+ Offset Potential
The UNFCCC is not the only potential source of market creation for REDD+. The most advanced regulatory framework that could create demand for REDD+ is California’s cap-and-trade system, which is expected to become operational on January 1, 2012. The system, which will be linked to other re-gional schemes within the United States and Canada, will allow offsets equal to 8 percent of total volume.
The most favored source of international offsets is REDD+. The eligibility criteria for REDD+ offsets to enter the California system (such as baseline, so-cial, and environmental safeguards) are still to be
defined, but it is likely that preference will be given to offsets produced by states that have signed memo-randa of understanding with California (so far, Acre from Brazil and Chiapas from Mexico).
4.4.1.2 Voluntary Forestry Offsets
In the voluntary markets, a number of smaller REDD+ projects are being developed by private and public entities. Several standards are being applied, with the Verified Carbon Standard (VCS) becoming the main one. In Indonesia alone, more than 100 projects of different scales are under preparation.
In February 2011, the Kasigau Corridor REDD project in Kenya, developed by Wildlife Works, is-sued the first REDD carbon offsets under the VCS. The project issued 1.16 million offsets for the ini-tial six-year monitoring period of its 30-year project life, representing 80 percent of the total 1.45 million tons of GHG emissions avoided during the period. The project deposited 290,066 “buffer credits”—or 20 percent of the net GHG benefit—to the VCS pooled buffer account, where they will be held to insure against the potential loss of offsets across all projects in the VCS AFOLU portfolio.
Prior to this issuance, Wildlife Works had success-fully developed its own REDD+ methodology and had it approved by the VCS Program. Pursuant to a financing agreement between BNP Paribas and Wildlife Works, BNP Paribas has the option to pur-chase 1.25 million tons of these emission reductions over five years.
Going forward, a key challenge for the REDD+ proj-ects and subnational programs will be to integrate them into the emerging national systems (in particu-lar MRV), reference emission levels, and strategies. The integration of this increasing number of projects will demand two things: (1) high management ca-pacity on the part of national governments and (2) an open and transparent approach in the way data and payments are handled to ensure that the system is credible and guarantee that local actors, including indigenous peoples and local communities, are ap-propriately involved. It is expected that the Carbon Fund of the Forest Carbon Partnership Facility (FCPF) will produce useful experience in this area.

State and Trends of the Carbon Market 2010 | 59
4.4.2 Sustainable Land Management—Agricultural Soil Carbon
With nearly two times as much carbon in soil than in the atmosphere, small changes in the level of car-bon in soils can drive large changes in atmospheric carbon concentrations. Sustainable land manage-ment projects that increase the carbon content of soils represent a “triple win” for society: develop-ment, climate change resilience, and climate change mitigation.
Healthy and fertile croplands increase the productiv-ity of farms and the incomes of farming communi-ties. In addition, cropland management techniques promote resilience to variations in climate, encour-aging stability and food security. Finally, the seques-tration of carbon in soils is a viable and quantifiable way to reduce atmospheric carbon. The sequestra-tion of carbon in soils is currently a neglected part of the climate solution, yet it is important for mitiga-tion, adaptation, and rural communities.
In 2010, a groundbreaking project in Kenya brought the potential for carbon sequestration in soils to the forefront of carbon finance. The Kenya Agricultural Carbon Project is the first project in Africa that sells carbon offsets from a sustainable land management project, improving the livelihoods of rural commu-nities while tackling climate change.
Implemented by the Swedish NGO Vi Agroforestry, the project is located on over 40,000 hectares in the Nyanza Province and Western Province of Kenya.
Smallholders and small-scale business entrepre-neurs are trained in diverse cropland management techniques, including cover crops, crop rotation, compost management, and agroforestry. The farm-ing practices both increase the yield of the land and sequester carbon in the soil.
The project is developing the Sustainable Agriculture Land Management Methodology under the VCS. The first validation was finalized in November 2010 by Scientific Certification Systems. The project is currently undergoing the second validation. The BioCarbon Fund is leading the methodological work, together with Vi Agroforestry. It will purchase 150,000 emission reductions up to 2016.
4.5 CONCLUSIONS
Long-term carbon price signals are fundamental for the deployment of the currently not viable low-car-bon technologies, as well as for the development of new low-carbon technologies necessary to support transformation at scale. Well-developed policies and regulations, concessional finance, and ODA fund-ing are all necessary in the overall climate finance package. However, harnessing private sector capital is vital for the transformation to a low-carbon soci-ety. Despite all uncertainties in the future market, the development of assets, including new categories, continues, thus confirming the belief that market in-struments are still considered as an efficient way to mobilize private capital for financing climate action.

60 | State and Trends of the Carbon Market 2010
SECTION5

State and Trends of the Carbon Market 2010 | 61
Outlook - Demand and Supply Balance
DESPITE SIGNS OF ECONOMIC RECOVERY and rising emissions the demand
outlook remains slim in the period to 2012. It is anticipated that buyers will mostly
meet their needs through purchases of Assigned Amount Units (AAUs) and secondary
Certified Emission Reductions (sCERs) (further details in Section 5.1). Beyond 2012
the outlook for the carbon market is complex and depends on the likely commitment
of major emitters and the mechanisms adopted at the domestic and international levels
to achieve these commitments. Therefore, the scenarios used in Section 5.2 have been
developed from the market sentiment (Section 1.4) and specific country and regional
initiatives (Section 2). There is a great deal of uncertainty associated with forecasting
demand, as much depends on uncertain future frameworks for emission reductions.
5.1 DEMAND AND SUPPLY BALANCE THROUGH TO 2012
The following sections investigate demand for Kyoto assets, including demand from governments and private sector entities,210 as well as supply under the three Kyoto Mechanisms. Residual demand for Kyoto assets continues to shrink, currently estimated at 136 MtCO2e, virtually all from European govern-ments. This is a 41 percent decrease from last year’s estimate.
5.1.1 Sovereign Demand
Demand estimates for Kyoto assets from Annex B governments remain virtually unchanged over 2010. Sovereign gross demand for Kyoto assets is currently estimated at around 437 MtCO2e through 2012, with EU-15 accounting for 72 percent of the total, Japan 23 percent of the total, and all other Annex B governments 5 percent (Table 12).
5
210. Those are entities covered by existing or anticipated domestic climate regulation, like the EU ETS or the NZ ETS, or participants to sectoral agreements, like the Keidanren Voluntary Action Plan in Japan. For the vast majority, they belong to the private sector; however, some public installations (like hospitals under the EU ETS) are also regulated.
“Beyond 2012 the outlook for the carbon market is complex and depends on the likely commitment of major emitters and the mechanisms adopted at the domestic and international levels to achieve these commitments.”
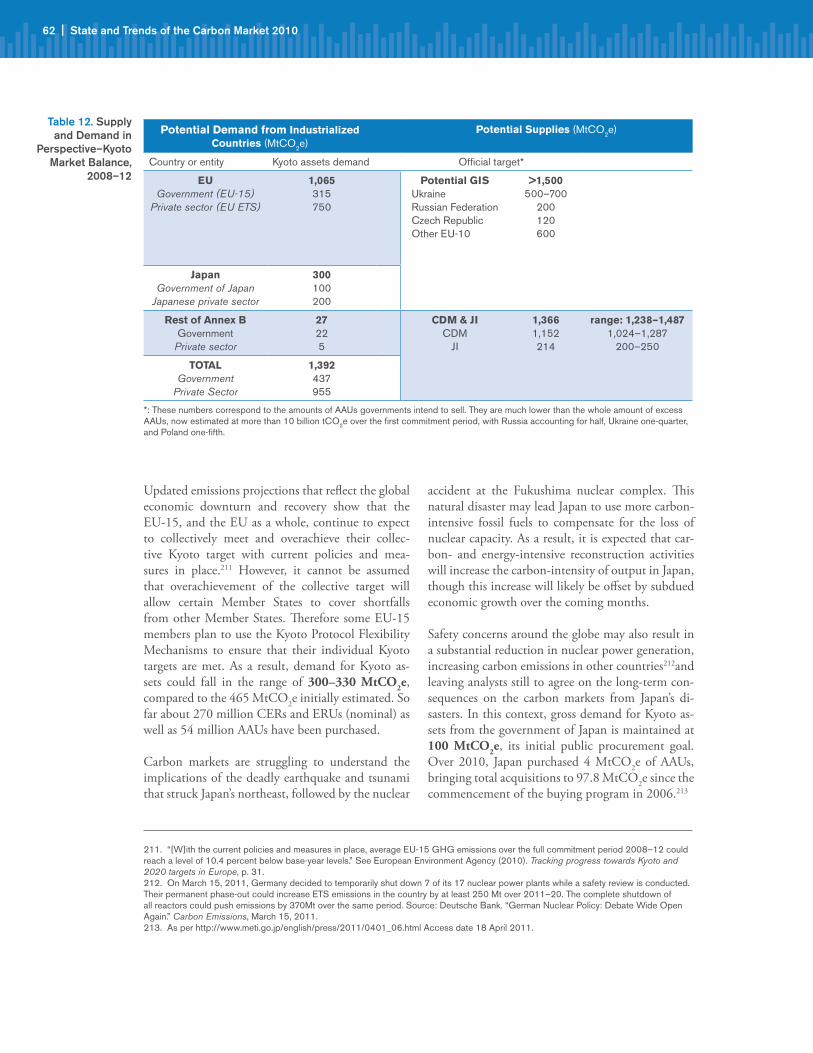
62 | State and Trends of the Carbon Market 2010
Updated emissions projections that reflect the global economic downturn and recovery show that the EU-15, and the EU as a whole, continue to expect to collectively meet and overachieve their collec-tive Kyoto target with current policies and mea-sures in place.211 However, it cannot be assumed that overachievement of the collective target will allow certain Member States to cover shortfalls from other Member States. Therefore some EU-15 members plan to use the Kyoto Protocol Flexibility Mechanisms to ensure that their individual Kyoto targets are met. As a result, demand for Kyoto as-sets could fall in the range of 300–330 MtCO2e, compared to the 465 MtCO2e initially estimated. So far about 270 million CERs and ERUs (nominal) as well as 54 million AAUs have been purchased.
Carbon markets are struggling to understand the implications of the deadly earthquake and tsunami that struck Japan’s northeast, followed by the nuclear
accident at the Fukushima nuclear complex. This natural disaster may lead Japan to use more carbon-intensive fossil fuels to compensate for the loss of nuclear capacity. As a result, it is expected that car-bon- and energy-intensive reconstruction activities will increase the carbon-intensity of output in Japan, though this increase will likely be offset by subdued economic growth over the coming months.
Safety concerns around the globe may also result in a substantial reduction in nuclear power generation, increasing carbon emissions in other countries212and leaving analysts still to agree on the long-term con-sequences on the carbon markets from Japan’s di-sasters. In this context, gross demand for Kyoto as-sets from the government of Japan is maintained at 100 MtCO2e, its initial public procurement goal. Over 2010, Japan purchased 4 MtCO2e of AAUs, bringing total acquisitions to 97.8 MtCO2e since the commencement of the buying program in 2006.213
Potential Demand from Industrialized Countries (MtCO2e)
Potential Supplies (MtCO2e)
Country or entity Kyoto assets demand Official target*
EUGovernment (EU-15)
Private sector (EU ETS)
1,065315750
Potential GISUkraine Russian FederationCzech RepublicOther EU-10
>1,500500–700
200120600
JapanGovernment of Japan
Japanese private sector
300100200
Rest of Annex BGovernment
Private sector
27225
CDM & JICDM
JI
1,3661,152214
range: 1,238–1,4871,024–1,287
200–250
TOTALGovernment
Private Sector
1,392437955
*: These numbers correspond to the amounts of AAUs governments intend to sell. They are much lower than the whole amount of excess AAUs, now estimated at more than 10 billion tCO2e over the first commitment period, with Russia accounting for half, Ukraine one-quarter, and Poland one-fifth.
Table 12. Supply and Demand in
Perspective–Kyoto Market Balance,
2008–12
211. “[W]ith the current policies and measures in place, average EU-15 GHG emissions over the full commitment period 2008–12 could reach a level of 10.4 percent below base-year levels.” See European Environment Agency (2010). Tracking progress towards Kyoto and 2020 targets in Europe, p. 31.212. On March 15, 2011, Germany decided to temporarily shut down 7 of its 17 nuclear power plants while a safety review is conducted. Their permanent phase-out could increase ETS emissions in the country by at least 250 Mt over 2011–20. The complete shutdown of all reactors could push emissions by 370Mt over the same period. Source: Deutsche Bank. “German Nuclear Policy: Debate Wide Open Again.” Carbon Emissions, March 15, 2011.213. As per http://www.meti.go.jp/english/press/2011/0401_06.html Access date 18 April 2011.

State and Trends of the Carbon Market 2010 | 63
Gross demand from other Annex B governments could amount to 22 MtCO2e, mainly through Norway and Switzerland acquisition programs, of which a sub-stantial part has been completed to date, possibly 25 MtCO2e for Norway (Nominal)214 and nearing the 12 MtCO2e purchasing target for Switzerland (Nominal).215 Australia and New Zealand continue to expect to meet their Kyoto obligations through do-mestic policy measures and carbon sinks.216
5.1.2 Private Sector Demand
Gross demand from private entities has been revised up 28 percent from last year, to 955 MtCO2e, with de-mand in the EU ETS accounting for 79 percent of the total. The main reason for this increase is the preferen-tial surrender of CERs and ERUs (instead of EUAs) by EU ETS operators in response to the EC’s qualitative restrictions on the eligibility of offsets in Phase III.
Analysts expect the EU ETS to be long over Phase II, with an overall surplus of about 1,280 MtCO2e to be banked, in the form of allowances, including remain-ing reserves and set-asides, and unused offsets.217 It is also expected that some installations—primarily utili-ties and airlines, which enter the scheme in 2012—will be short. The power sector shows the largest compliance shortfall of all ETS-covered sectors, being short against free allowances by approximately 500 MtCO2e cumulative since 2008.218
Additional demand could come from generators that start to hedge their future exposure in Phase III as a result of tighter caps and increased auctioning. Depending on the schedule of anticipated sales or auc-tions of Phase III allowances, this hedging behavior is expected to induce some volatility in the EU ETS
market during the transition from Phase II to Phase III. Changes in the generation mix, brought by shifts in Germany’s nuclear energy policy or overheating in global energy prices for instance, could further push compliance demand from power sector installations. Airlines will face auctioning in their first year un-der the EU ETS, leading to an expected shortfall of about 50 MtCO2e against free allowances in 2012, to be filled by CERs and ERUs (up to 32 MtCO2e), or Aviation EU Allowances (See Section 2.1).
So far EU ETS participants have contracted approxi-mately 1.6 billion CERs and ERUs (nominal) with CERs from HFC and adipic acid projects amount-ing to about 25 percent of volumes. Due to the ban of CERs from HFC and adipic acid projects in Phase III, installations are likely to surrender offsets over and above their compliance shortfall and bank surplus al-lowances instead. In this context, estimates of CDM and JI use over Phase II average 750 MtCO2e, of which compliance needs may represent only a fraction.
Private sector companies in Japan have report-edly contracted more than 400 MtCO2e in CERs, ERUs, and AAUs that can be surrendered under the Keidanren Voluntary Action Plan, which should amply cover their estimated needs of 200 MtCO2e. There are estimates that the prolonged outage of nuclear capacity in Japan could create an additional demand of 60–70 MtCO2e.219 It remains to be seen, given the circumstances, to what extent private com-panies would be required to cover the gap or wheth-er force majeure would be invoked.
Exploratory demand from installations covered un-der the NZ ETS,220 the Swiss ETS and other ini-tiatives under development such as California or
214. Norway is likely to meet its Kyoto target (+1 percent) solely through domestic policy and measures. The demand for KMs stems from its long-term commitment to carbon neutrality, including an overachievement of its Kyoto target by 10 percent.215. This includes an extra 2 MtCO2e to account for delivery risk. All in all, around 7 million CERs and ERUs only (from 10 initially planned) could be required to bridge the Kyoto gap in Switzerland, factoring in policies and measures as well as carbon sinks.216. See Department of Climate Change and Energy Efficiency (2010). Australia’s emissions projections, and New Zealand’s net position under the Kyoto Protocol (updated March 17, 2011) at http://www.mfe.govt.nz/issues/climate/greenhouse-gas-emissions/net-position/index.html Access date 18 April 2011.217. Barclays Capital. Monthly Carbon Standard, April 11, 2011: long position over Phase II: 470 MtCO2e, use of CERs and ERUs over Phase II: 700–900 MtCO2e; Société Générale. Carbon Specials, April 7, 2011: long position over Phase II: 520 MtCO2e, use of CERs and ERUs over Phase II: 780 MtCO2e.218. Based on verified emissions data for 2008 and 2009 and preliminary emissions data for 2010.219. Barclays Capital. Monthly Carbon Standard, April 11, 2011: 60 MtCO2e; Deutsche Bank. “Japan’s Quake & The Implications for Commodities.” Commodities Special Report, March 14, 2011: 70 MtCO2e.220. Though a significant number of participants expect to be short under the NZ-ETS (41 percent following Point Carbon (2011). Carbon 2011), being in compliance should not be that much of an issue given the transitionary measures and the expected abundant supply of New Zealand Units, likely to be nearly double the domestic demand for units between 2008 and 2012. See New Zealand Emissions Trading Scheme Review 2011, op. cit., p. 17.

64 | State and Trends of the Carbon Market 2010
Australia, might be in excess of 5 MtCO2e depend-ing on price levels and rules beyond 2012.
5.1.3 Supply Through to 2012
About 1,150 million CERs are expected be issued pre-2013,221 of which slightly more than half should be issued to HFC and adipic acid projects. Supply projections are up 12 percent on average since last year, reflecting both improved timelines for regis-tration (most notably through Cancun’s decision on start of the crediting period) as well as uninter-rupted growth in the pipeline of CDM projects. At the same time, lead time to issuance continues to be a significant risk to pre-2013 supply. Potential bottlenecks and delays are possible as project devel-opers rush to have verification processed on time for delivery of CERs valid for compliance with EU ETS Phase II obligations.
First, the COP/MOP decision in Cancun to move forward the starting date of the crediting period222 has the potential to add three to six months worth of CERs (or the average time from request of reg-istration to effective registration) to a project ex-pected deliveries. Second, over the past 15 months (Jan. 10–Mar. 11), the inflow of projects entering the CDM pipeline averaged 112 new projects per month, the highest rate ever—perhaps reflecting the fact that project developers are rushing to get proj-ects registered before 2013 in light of EU eligibility restrictions for Phase III.
Market analysts’ project around 215 million ERUs should to be issued through 2012. This is an in-crease over last year’s estimate and is largely a result of Russian efforts to increase supply. Russia is projected to account for approximately 50 percent of ERUs is-sued through 2012 (see Section 4.1 for more details).
Sustained activity in the AAU market continues to encourage countries to market their GIS. For exam-ple, Slovakia is proactively trying to sell 27 million AAUs during 2011. Countries have announced in-tentions to sell over 1.5 billion AAUs (see Table 12). Some of these AAUs may come from existing Green Investment Schemes. This supply is far larger than the anticipated demand. Uncertainties regarding the bankability of AAUs, which could play a decisive role in determining the commitment ambition of Parties under a future international climate change agreement, are likely to further reinforce the imbal-ance and affect market dynamics negatively.
5.1.4 Residual Demand—136 MtCO2e
Expected gross use of Kyoto assets now stands at 1.39 billion tCO2e over 2008–12 (up 14 percent from last year), with approximately 70 percent of demand coming from the private sector. The three Kyoto Flexibility Mechanisms will be required to meet the demand for Kyoto assets, which could in-crease if deliveries from CDM and JI are lower than anticipated, if the performance of domestic policies and measures disappoints, if carbon sinks have been overestimated, or if economic recovery is stronger than expected. Adjusting the approximate 2.4 bil-lion CERs and ERUs contracted (nominal) for risk of underdelivery and accounting for AAU transac-tions as well as some secondary transactions by gov-ernments lead to an estimated residual demand of 136 MtCO2e of Kyoto assets over the next two years, virtually all from European governments (Table 13).
“Estimated residual demand of 136 MtCO2e of Kyoto assets over the next two years, virtually all from European governments.”
221. Barclays Capital. Monthly Carbon Standard, April 11, 2011: 1.14 billion CERs and 250 million ERUs over 2008–12; CDC Climat Research (2011). Assessment of supply-demand balance for Kyoto offsets (CERs and ERUs) up to 2020. Climate Brief #5: 1.12 billion CERs and 205 million ERUs over 2008–12 (Conservative estimate that does not account for new projects possibly entering the CDM pipeline after March 2011); Deutsche Bank: Personal communication: 1.29 billion CERs and 200 million ERUs over 2008–12 (Secured supply from the first crediting period of projects registered as of January 2011); Point Carbon, Carbon Program Manager (accessed April 14, 2011): 1.19 billion CERs and 202 million ERUs over 2008–12; Société Générale. Carbon Drivers, April 11, 2011: 1.02 billion CERs and 214 million ERUs over 2008–12.222. The CDM Executive Board was requested to revise the procedures for registration to allow the effective registration date/start of crediting period “to be the date on which a complete request of registration has been submitted by the designated operational entity where the project activity has been registered automatically.”

State and Trends of the Carbon Market 2010 | 65
CDM projects contracted in the next few months will be unlikely to deliver large volumes before 2013, and thus governments may have to purchase AAUs to cover their residual Kyoto shortfalls and underde-livery of CDM and JI. Governments may also wish to secure some volumes through secondary transac-tions, with the advantage of being able to choose the types of projects generating the CERs, as is already the case under a number of procurement programs. Approximately 300 million CERs are in the hands of intermediaries and could be available. The price and quality of assets will likely determine sovereign compliance strategy.
5.2 WILL THERE BE ENOUGH EMISSION REDUCTIONS GENERATED IN DEVELOPING COUNTRIES AFTER 2012?
Estimating the future demand for emission reduc-tions generated in developing countries remains a delicate and heroic exercise as many initiatives look-ing beyond 2012 are still at the proposal stage and will likely be influenced by the outcome of the ongoing negotiations. Key features of many of these proposals
are not yet fully specified, with uncertainties as to the amount of credits that could be used to meet compli-ance obligations, eligible mechanisms or standards, and further qualitative restrictions (for example, on country of origin or technology). To deal with these uncertainties about the supply-demand balance in the carbon market over 2013–20, projections of supply are compared with estimates of demand for emission reductions derived from three scenarios, reflecting more or less ambitious collective action.
The three scenarios (detailed in Table 14) encom-pass: (1) enacted and proposed initiatives aligned with unconditional pledges under the Copenhagen Accord, (2) the full implementation of enacted and proposed initiatives aligned with higher pledges un-der the Copenhagen Accord, and (3) the introduc-tion of domestic cap-and-trade schemes in most of Annex I countries to deliver on pledges at the higher end of commitments under the Copenhagen Accord.
These scenarios only look at the EU and other current OECD Annex B countries223 and omit some Annex I countries, such as Belarus, Croatia, Kazakhstan, Monaco, Russia, Turkey, and Ukraine.
Potential demand Contracted CERs and ERUs AAUs Residual demand
(MtCO2e)nominal
(MtCO2e)adjusted for performance
(MtCO2e) (MtCO2e) (MtCO2e)
EUGovernment (EU-15)Private sector (EU ETS)
1,065315750
1,868270
1,598
883132751
54540
129129
0 (-1)
JapanGovernment of JapanJapanese private sector
300100200
37234
338
18021
159
19176
115
33
0 (-74)
Rest of Annex BGovernmentPrivate sector
27225
40373
22211
110
514
TotalGovernmentPrivate sector
1,392437955
2,280341
1,939
1,085174911
245130115
136133
4
Note: Numbers may not add up due to rounding. A portion of the purchases attributed to the European private sector relates to portfolios of intermediaries that are available for secondary transactions. In addition to the volumes reported above, about 173 million tons (nominal) are contracted but not attributed, and are very likely in the hands of intermediaries. They could represent about 83 million tons also available for secondary transactions, with public or private entities.
Table 13. Potential Demand, Contracted Supply, and Residual Demand, 2008–12
223. To the exception of Cyprus and Malta, as well as Liechtenstein, as they join the EU effort.

66 | State and Trends of the Carbon Market 2010
Some of the omitted countries have pledges under the Copenhagen Accord.224 There are also some non-An-nex I countries—such as Brazil, Chile, China, and the Republic of Korea—that are contemplating new mar-ket mechanisms, including emissions trading, which may, at some point, generate possible demand for (do-mestic) offsets. This demand is not considered here.
Depending on ambition of collective action, demand for emission reductions generated in developing countries could easily surpass 2 billion tCO2e over 2013–20 (or twice as much as demand for KMs over 2008–12), possibly ramping up to 3 billion tCO2e or more (see Table 14). Accounting for around 60
percent of total demand for scenarios 1 and 2, the EU Climate and Energy Package represents thus far the only substantial source of demand for offsets from non-Annex I countries beyond 2012. Other potential sources remain speculative at this stage.
Importantly, these estimates of demand correspond to the maximum theoretical demand, given expected shortfall and rules governing the use of offsets (quali-tative and quantitative restrictions). In other words, they are not estimates of the actual use of offsets, which depends on availability and price (relative to other options, for example, AAUs or their successor, allowances from other schemes, price caps, and so on).
Country (group of)
Scenario 1: Enacted and proposed initiatives, uncon-
ditional pledges
Scenario 2: Enacted and proposed initiatives, higher
pledges
Scenario 3: ETS in major Annex I countries, higher end of Copenhagen Accord pledges*
Description Potential demand (MtCO2e)
Description Potential demand (MtCO2e)
Potential demand in 2020 (MtCO2e)
EU, as well as Iceland, Liechtenstein and Norway
20 percent below 1990, with differen-tiation EU ETS and effort sharing
1,750† 30 percent below 1990, with differen-tiation EU ETS and effort sharing
2,550†
New Zealand NZ ETS: 10 percent below 1990
77 NZ ETS: 20 percent below 1990
106
Australia CPRS (2015): 5 percent below 2000
516 CPRS (2015): 15 percent below 2000
637 All countries deliver on Copenhagen Pledges resulting in aggregate reductions in Annex I GHG emissions of 17 percent below 1990 levels)
Japan Between 25 and zero percent below 1990
539 25 percent below 1990
539
Switzerland 20 percent below 1990, with ETS and other measures
28 30 percent below 1990, with ETS and other measures
55
United States & Canada
No U.S. federal ETS, California and limited WCI, RGGI‡
12 No U.S. federal ETS, with full WCI (incl. California), RGGI‡
24
TOTAL 2,922 3,911 1,500–2,000
*: Demand under Scenario 3 is only for year 2020, thus not comparable with the first two scenarios.†: Already accounts for an inflow in the EU ETS of 750 million CERs and ERUs during Phase II.‡: No significant demand is expected to come from RGGI.
Table 14. Scenarios
of Potential Demand
for Offsets Generated in non-Annex I
Countries 2013–20 (MtCO2e)225
224. No demand for carbon assets is expected from Russia and Ukraine (the two largest emitters from the countries listed above), as their pledges are above their baseline projection. See den Elzen, M. G. J. et al. 2010. Evaluation of the Copenhagen Accord: Chances and risks for the 2°C climate goal. Netherlands Environmental Assessment Agency (PBL), The Netherlands, and Ecofys, Germany.225. For detailed assumptions see Appendix 1.

State and Trends of the Carbon Market 2010 | 67
Also, this theoretical demand is not to be met systemat-ically through CDM and JI, as there is political support in all major developed countries for the Cancun de-cision to establish new market mechanisms under the UNFCCC to “enhance the cost effectiveness of, and to promote, mitigation actions.” For instance, Japan is preparing a bilateral offsetting mechanism with 15 pi-lot projects in nine countries that could co-exist along current Kyoto Mechanisms; EU is supporting sectoral approaches that could represent an increasing share of its demand for emission reductions; California may be open to international offsets from sectors and regions, including from REDD activities, which so far are out-side the scope of the CDM. Estimates of supply (Table 15) are forecasts for CDM and JI only. None of these projections assumes con-tinuation of JI beyond CP-1. They do not include sup-ply under new approaches or mechanisms, still under negotiation. While there appears to be keen interest by several developing countries to participate in such new mechanisms, it will take some time to discuss, elaborate,
and agree upon a common set of rules and modalities, including baseline setting and MRV requirements.
In this context, a streamlined, cost-effective, and effi-cient CDM will still likely play a lasting role on the sup-ply side (hence our focus). It could serve as a platform for those countries willing to transition toward new mechanisms, drawing on experience, achievements, and capacity built under the CDM. Alternatively, it could remain a central project-based mechanism, serv-ing the low-carbon development priorities of those countries preferring not to transition to new mecha-nisms in the near future. After all, programmatic ap-proaches such as the CDM Programme of Activities (PoA) are already helping scale up mitigation efforts.
About 2.5 billion offsets could be generated over 2013–20, or twice as much as expected supply from CDM and JI pre-2013. For the most part (50–70 percent), this supply is expected from projects registered before 2013, highlighting the strain of the lack of a predictable and scaled-up demand on new origination. HFC and
Table 15. Estimates of Potential Supply Under the CDM and JI up to 2020 (MtCO2e)
pre-2013 post-2012 Cumulative (up to 2020)
Point CarbonCDM-EU ETS eligibleCDM-otherERUTOTAL
1,1866
2021,394
1,875409
2,285
3,061415202
3,679
BarclaysCDM-EU ETS eligibleCDM-otherERUTOTAL
1,140
2501,390
1,7411,043
2,784
2,8811,043
2504,174
CDC Climat Research †CDM-EU ETS eligibleCDM-otherERUTOTAL
1,115
2051,320
2,534373
2,907
3,649373205
4,227
Deutsche Bank*CDM-EU ETS eligibleCDM-otherERUTOTAL
1,2872
2001,489
939437
1,376
2,226439200
2,865
† Conservative estimate that does not account for new projects possibly entering the CDM pipeline after March 2011, nor for possible renewal of crediting period for already registered projects.*Secured supply from the first crediting period of projects registered as of January 2011.

68 | State and Trends of the Carbon Market 2010
N2O credits to be banned from the EU ETS represent about one-third of 2013–20 supply. Given investment barriers, the share of supply from projects registered in LDCs post-2012 is likely to remain extremely limited, between 10 and 75 MtCO2e (depending on sources) or systematically less than 5 percent. Also important to note, two downward risks to these supply estimates are the possible rejection of application for crediting period renewal and the revision of baselines.
Available supply of EU ETS eligible offsets over 2013–20 may reach about 2 billion tCO2e, compris-ing approximately 200 million tCO2e remaining from pre-2013 and 1.8 billion tCO2e generated post-2012 (almost entirely from projects registered before 2013). In addition, at least 500 MtCO2e of non-EU ETS eli-gible offsets (potentially up to 1 billion tCO2e) could come online over 2013–20.226 This could be sufficient to cover specific demand from EU ETS operators as well as demand from governments under the EU Climate and Energy Package (even under a tighter cap, in line with an EU 30 percent target).
The availability of a substantial and credible offset supply could increase the likelihood of cost-effectively achieving more ambitious emission reduction targets. Under full implementation of Scenario 1 (let alone Scenario 2 or 3), potential demand for international offsets over 2013–20 exceeds potential supplies, which have been so far heavily constrained. This could imply that price of offsets beyond 2012 could be sustained, with hopes that higher prices will stimulate supply and encourage financial innovation to turn future carbon revenues into upfront financing.
These preliminary estimates also underscore the need to scale up supply to avoid future imbalances in the carbon market. Supply can be scaled up by (i) strengthening capacity and making mechanisms more predictable and efficient; (ii) broadening the scope of the carbon market, looking at underserved sectors and project-types; and (iii) facilitating LDCs
participation. For the latter to materialize, it is nec-essary to simplify the procedures for project approval and credit issuance (including for programmatic ap-proaches to enable reaching micro-scale activities) and increase the eligibility of land-based agriculture (including remedy the current temporary crediting approach which penalizes forestry projects).
5.3 CONCLUSIONS
Beyond 2012, the main constraint to the carbon mar-ket is perhaps a lack of demand beyond current initia-tives, with no further encouragement to build up a sub-stantial and credible supply. For both developed and developing countries, this could be a missed opportu-nity to benefit from market instruments to mobilize re-sources and engage private sector in climate action. The use of market mechanisms can contribute to lower the cost of achieving sustainable goals, result in additional resources, and send a price signal to encourage less car-bon-intensive lifestyles and investment decisions.
Financing needs for green growth and implementing low-emission development strategies are huge, in the hundreds of billions annually for developing countries alone. Mobilizing sufficient resources in a predictable and sustainable manner requires a combination of sources-both existing and innovative ones, both pub-lic and private. The Secretary-General’s High-Level Advisory Group on Climate Change Financing (AGF) concluded that carbon markets can play a valuable role in the mobilization of $100 billion per year from 2020, in conformity with the pledges under the Copenhagen Accord. With predictable, long-term, and ambitious targets, financial flows through improved market mechanisms to developing countries could reach $30–50 billion a year by 2020, further committing an equiv-alent amount of foreign private investment to climate action. Predictability and ambition, ingenuity and reforms, capacity—all are needed to scale up carbon markets and maximize their transformational impact.
226. Some of these credits could become eligible, should the EU enter into bilateral agreements with non-LDC countries. So far no such bilateral agreement has been signed.

State and Trends of the Carbon Market 2010 | 69

70 | State and Trends of the Carbon Market 2010
Methodology
The data used in this report was collected from a combination of sources, including a survey of mar-ket participants conducted by the World Bank’s Carbon Finance Unit between March 21 to April 1, 2011; semi-structured interviews of selected market participants, policy makers, and regulators; and a desk study of major carbon-industry publications,227 legislation, regulations, and media reports. The re-port has written contributions kindly provided by Ecosystem Marketplace and Bloomberg New Energy Finance (voluntary and pre-compliance activi-ties), Thomson Reuters Point Carbon (California), European Commission (international markets), and Deutsche Bank (international markets).
The survey addressed selected market participants involved in several activities and representing the various sectors of the carbon market. The survey contained 26 questions and covered market senti-ment and Kyoto Protocol flexibility mechanisms. The results of the survey were used to augment and corroborate information collected from the desk study and semi-structured interviews. Some of the results of the survey are provided in this report, in the appropriate sections.
Unless said otherwise, the symbol $ implies U.S. dollars.
The size of the global carbon market in 2010 has been derived from the growth rate between 2009 and 2010 of each market segment (for example, primary CER, other project-based markets, AAUs, EUAs, and other allowance markets) drawing on information obtained primarily from Thomson Reuters Point Carbon and Bloomberg New Energy Finance. The value of the voluntary transactions was obtained from data provided by Ecosystem Marketplace. Since the original information from Thomson Reuters Point Carbon and Bloomberg New Energy Finance was provided in euros, the impact of the $/euro exchange rate in the same pe-riod was eliminated and the US$-based results were applied to the values of each market segment, as calculated by the World Bank in 2009. When ap-plicable, the unweighted average from the sources was used, although some adjustments were made as deemed appropriate.
Prices and values are primarily expressed in nomi-nal $ per tCO2e, unless indicated otherwise. An av-erage annual exchange of €1 = $1.328 for 2010 was applied. The cutoff date for information is April 15, 2011. A ton (abbreviated as “t”) refers to a met-ric ton (1,000 kg).
227. Including online sources such as Carbon Finance (www.carbon-financeonline.com), Joint Implementation Quarterly (www.jiqweb.org), PointCarbon (www.pointcarbon.com), as well as Carbon Positive (www.carbonpositive.net), CDC Climat Research (www.cdcclimat.com), the Climate_L list (www.iisd.ca), IDEAcarbon (www.ideacarbon.com), Ecosystem Marketplace (www.ecosystemmarketplace.com), the CDM and JI pipeline databases and analyses maintained by UNEP Risoe and IGES, and Web sites of market players (DNAs, DOEs, proj-ect developers and aggregators, exchanges and trading platforms, financial institutions and brokers, regulators, carbon purchasing funds and facilities, public procurement programs, and companies facing compliance obligations). One should also mention other resources, such as reports prepared by financial institutions, such as analyses by Barclays Capital, Deutsche Bank, and Société Générale, that have been made kindly available to the authors.

State and Trends of the Carbon Market 2010 | 71
Appendix 1. Assumptions for Estimates of Potential Demand for Offsets from non-Annex I Countries
EU: Under the EU Climate and Energy Package, the EU commits to cut its GHG emissions by 20 percent below 1990 levels, possibly tightening to 30 percent depending on developments in climate negotiations. For the EU ETS, this translates into further tighten-ing of the cap from an average 6 percent below 2005 levels over 2008–20 to 21 percent by 2020 (or more in the 30 percent scenario), with a corresponding shortfall of about 2,500 MtCO2e over 2013–20 in the 20 percent scenario (resp. 3,500 MtCO2e in the 30 percent scenario).228
The total amount of offsets that can be used over 2008–20 is estimated at 1,700 MtCO2e in the 20 percent scenario (2,200 MtCO2e in the 30 percent scenario). On aggregate, the amount of offsets that can be surrendered during Phase III corresponds to the difference between the overall amount allowed over Phases II and III jointly minus what has been already surrendered during Phase II. The following qualitative restrictions apply with regard to the use of CERs/ERUs against Phase III obligations:
-struction of HFC-23 and N2O from adipic acid production are banned from the EU ETS. CP-1 offsets will still be allowed until the end of April 2013 against Phase II obligations.
project types can be banked and surrendered.
from a project registered before end of 2012 or from a project based in an LDC if registered after 2013.
For non-ETS covered sectors, the Climate and Energy Package translates into cuts of 10 percent (or more) be-low 2005 levels by 2020. Offsets can be used to cover about one-third of the effort in the 20 percent sce-nario, estimated to represent about 800 MtCO2e over 2013–20. In the 30 percent scenario, offsets can in principle be used to cover half of the additional effort, leading to a total demand of about 1,100 MtCO2e. No restriction applies so far to the use of offsets.
New Zealand: The NZ ETS continues to expand its coverage, with synthetic gases and waste joining in 2013 and agriculture in 2015. The cap of the scheme is set in line with the country international commit-ment—to reduce emissions by 10 percent below 1990 levels by 2020 or, if a comprehensive global agreement is reached, by 20 percent. This could translate into a shortfall of 75 to 105 million tons over 2013–20, ac-counting for a limited uptake of forestry.229
Australia: Following announcements earlier in 2011, Australia implements economy-wide carbon pricing for a period of three years, starting 2013, with a view to transitioning to an emissions trading scheme, sim-ilar in its design to the Carbon Pollution Reduction Scheme (CPRS). The cap is set in line with Australia’s pledges under the Copenhagen Accord: 5 percent to 15 percent below 2000 levels by 2020, depending on climate negotiations. One assumes that 75–80 percent of the country’s emissions are capped (that is, forestry and agriculture are excluded) and that unlimited use of offsets is allowed. Following recent projections by Australia, this could represent a cu-mulative shortfall over 2015–20 ranging from 520 to 640 MtCO2e, depending on ambition.230
228. This includes also aviation. Source: Barclays Capital. Monthly Carbon Standard, April 11, 2011229. Source: own calculation based on New Zealand Fifth National Communication.230. Own calculation based on Department of Climate Change and Energy Efficiency (2010). Australia’s emissions projections.

72 | State and Trends of the Carbon Market 2010
Japan: As plans for a mandatory ETS in Japan are delayed, one simply assumes here that offsets could be used up to 50 percent to fill the gap to the -25 percent conditional pledge. Accounting for sinks, this could correspond to a cumulative demand for offsets of 540 MtCO2e over 2013–20.231
Switzerland: As its main additional climate policies and measures, Switzerland implements an ETS simi-lar in design to the EU ETS. This could result in a cumulative demand for offsets from covered entities over 2013–20 of 2.3 MtCO2e in the 20 percent sce-nario, reaching 4 MtCO2e in the 30 percent scenar-io. Another large source of demand for offsets stems from the obligation for producers and importers of fossil fuels to offset 25–30 percent of CO2 emissions in the 20 percent scenario (gearing up to 40-45 per-cent in the 30 percent scenario). It is estimated that this measure could generate a demand of 25 to 50 MtCO2e of international offsets.232
Northern America: Demand of offsets under California’s cap-and-trade scheme could total 233 MtCO2e over 2012–20 (see Section 2.1). Estimates of use for offsets from the full WCI are hardly slightly higher, at 235 MtCO2e.233 Importantly, however un-certain such estimates are, it is unclear which share of demand could be sourced internationally. For this ex-ercise, it is set at 10 percent. Given abundant overallo-cation in RGGI, no demand for international offsets is expected over the decade from the scheme.
Higher end of Copenhagen Accord pledges: Estimates here are obtained from the Report of the Secretary-General’s High-Level Advisory Group on Climate Change Financing (AGF). They correspond to the medium price scenario, based on the higher end of Accord pledges, which assumes that most Annex 1 countries introduce domestic cap-and-trade schemes and that government-to-government AAU trade occurs. Based on these assumptions, the potential demand for offsets in this scenario ranges between 1,500 and 2,000 MtCO2e in 2020.234
231. Assuming Japan’s emissions grow in line with projections by the U.S. DoE Energy Information Administration’s International Energy Outlook 2010 (High oil price case). Carbon sinks are maintained at 20 MtCO2e (that is, their planned use under the Kyoto Protocol), though they could decrease as indicated by http://unfccc.int/files/kyoto_protocol/application/pdf/awgkplulucfdatajapan051109.pdf.232. Own calculation based on Switzerland Fifth National Communication.233. Western Climate Initiative (2010). Updated Economic Analysis of the WCI Regional Cap-and-Trade Program234. As per http://www.un.org/wcm/webdav/site/climatechange/shared/Documents/AGF_reports/Work_Stream_8_%20Carbon%20markets.pdf.
State and Trends of the Carbon Market 2010 | 73
Glossary
Accredited Independent Entity (AIE): Accredited independent entities (AIEs) are independent audi-tors that assess whether a potential project meets all the eligibility requirements of the JI (determination) and whether the project has achieved greenhouse gas emission reductions (verification).
Additionality: A project activity is additional if an-thropogenic GHG emissions are lower than those that would have occurred in the absence of the proj-ect activity.
Afforestation: The process of establishing and grow-ing forests on bare or cultivated land, which has not been forested in recent history.
Annex I (Parties): The industrialized countries listed in Annex I to the UNFCCC were committed to re-turn their greenhouse gas emissions to 1990 levels by 2000. They currently include Australia, Austria, Belarus, Belgium, Bulgaria, Canada, Croatia, Czech Republic, Denmark, Estonia, Finland, France, Germany, Greece, Hungary, Iceland, Ireland, Italy, Japan, Latvia, Liechtenstein, Lithuania, Luxembourg, Monaco, the Netherlands, New Zealand, Norway, Poland, Portugal, Romania, Russian Federation, Slovakia, Slovenia, Spain, Sweden, Switzerland, Turkey, Ukraine, the United Kingdom, and the United States, as well as the European Economic Community. All but Turkey are listed in Annex B.
Annex B (Parties): The 39 industrialized countries (including the European Economic Community) listed in Annex B to the Kyoto Protocol have com-mitted to country-specific targets that collectively reduce their GHG emissions by at least 5.2 percent below 1990 levels on average over 2008–12.
Assigned Amount Unit (AAU): Annex I Parties are issued AAUs up to the level of their assigned amount, corresponding to the quantity of green-house gases they can release in accordance with the Kyoto Protocol (Art. 3), during the first commit-ment period of that protocol (2008–12). One AAU
represents the right to emit one metric ton of carbon dioxide equivalent.
Banking or carry over: Compliance units under the various schemes to manage GHG emissions in ex-istence may or may not be carried over from one commitment period to the next. Banking may en-courage early action by mandated entities depend-ing on their current situation and their anticipations of future carbon constraints. In addition banking brings market continuity. Banking between Phase I and Phase II of the EU ETS is not allowed but is al-lowed between Phase II and further Phases. Some re-strictions on the amount of units that can be carried over may apply: for instance, EUAs may be banked with no restriction while the amount of CERs that can be carried over by a Kyoto Party is limited to 2.5 percent of the assigned amount of each Party.
Baseline: The emission of greenhouse gases that would occur without the policy intervention or proj-ect activity under consideration.
Biomass Fuel: Combustible fuel composed of a biological material, for example, wood or wood by-products, rice husks, or cow dung.
California Global Warming Solution Act AB32 (AB32): The passage of Assembly Bill 32 (California Global Warming Solution Act AB32) in August 2006 sets economy-wide GHG emissions targets as follows: Bring down emissions to 1990 levels by 2020 (considered to be at least a 25 percent reduc-tion below business-as-usual) and to 80 percent of 1990 levels by 2050. Covering about 85 percent of GHG emissions, a cap and trade scheme (still under design) would be a major instrument, along with renewable energy standards, energy efficiency stan-dards for buildings and appliances as well as vehicle emissions standards.
Cap and trade: Cap-and-trade schemes set a desired maximum ceiling for emissions (or cap) and let the market determine the price for keeping emissions

74 | State and Trends of the Carbon Market 2010
within that cap. To comply with their emission tar-gets at least cost, regulated entities can either opt for internal abatement measures or acquire allowances or emission reductions in the carbon market, de-pending on the relative costs of these options.
Carbon Asset: The potential of greenhouse gas emission reductions that a project is able to generate and sell.
Carbon Finance: Resources provided to activities generating (or expected to generate) greenhouse gas (or carbon) emission reductions through the trans-action of such emission reductions.
Carbon Dioxide Equivalent (CO2e): The univer-sal unit of measurement used to indicate the global warming potential of each of the six greenhouse gases regulated under the Kyoto Protocol. Carbon dioxide—a naturally occurring gas that is a by-prod-uct of burning fossil fuels and biomass, land-use changes, and other industrial processes—is the refer-ence gas against which the other greenhouse gases are measured, using their global warming potential.
Certified Emission Reductions (CERs): A unit of greenhouse gas emission reductions issued pursuant to the Clean Development Mechanism of the Kyoto Protocol, and measured in metric tons of carbon di-oxide equivalent. One CER represents a reduction in greenhouse gas emissions of one metric ton of carbon dioxide equivalent.
Chicago Climate Exchange (CCX): Members to the Chicago Climate Exchange make a voluntary but legally binding commitment to reduce GHG emissions. By the end of Phase I (December 2006), all Members will have reduced direct emissions 4 percent below a baseline period of 1998-2001. Phase II, which extends the CCX reduction pro-gram through 2010, will require all Members to ultimately reduce GHG emissions 6 percent below baseline. Among the members are companies from North America as well as municipalities or U.S. states or universities. As new regional initiatives began to take shape in the U.S., membership of the CCX grew from 127 members in January 2006 to 237 members by the end of the year while new participants expressed their interest in familiarizing themselves with emissions trading.
Clean Development Mechanism (CDM): The mechanism provided by Article 12 of the Kyoto Protocol, designed to assist developing countries in achieving sustainable development by allowing entities from Annex I Parties to participate in low-carbon projects and obtain CERs in return.
Climate Action Reserve (CAR): The Climate Action Reserve is a U.S.-based offsets program that estab-lishes regulatory-quality standards for the develop-ment, quantification and verification of greenhouse gas (GHG) emission reduction projects in North America; issues carbon offset credits known as Climate Reserve Tonnes (CRT) generated from such projects; and tracks the transaction of credits over time in a transparent, publicly accessible system.
Community Independent Transaction Log (CITL): The Community Independent Transaction Log (CITL) conducts “supplementary checks” to those by the ITL for transactions involving registries of at least one EU Member State, such as the issuance, transfer, cancellation, retirement and banking of EUAs.
Conference of Parties (COP): The supreme body of the Convention. It currently meets once a year to review the Convention’s progress. The word “con-ference” is not used here in the sense of “meeting” but rather of “association,” which explains the seem-ingly redundant expression “fourth session of the Conference of the Parties.”
Conference of the Parties serving as the Meeting of the Parties (CMP): The Convention’s supreme body is the COP, which serves as the meeting of the Parties to the Kyoto Protocol. The sessions of the COP and the CMP are held during the same period to reduce costs and improve coordination between the Convention and the Protocol.
Crediting period: The crediting period is the dura-tion of time during which a registered, determined or approved project can generate emission reduc-tions. For CDM projects, the crediting period can be of either seven years (renewable twice) or ten years (non-renewable).
Designated Focal Point (DFP): Parties participating in the Joint Implementation (JI) mechanism are re-quired to nominate a Designated Focal Point (DFP) for approving projects.

State and Trends of the Carbon Market 2010 | 75
Designated National Authority (DNA): An of-fice, ministry, or other official entity appointed by a Party to the Kyoto Protocol to review and give na-tional approval to projects proposed under the Clean Development Mechanism.
Designated Operational Entities (DOEs): Designated operational entities are independent au-ditors that assess whether a potential project meets all the eligibility requirements of the CDM (validation) and whether the project has achieved greenhouse gas emission reductions (verification and certification).
Determination: Determination is the process of evaluation by an independent entity accredited by the host country (JI Track 1) or by the Joint Implementation Supervisory Committee (JI Track 2) of whether a project and the ensuing reductions of anthropogenic emissions by sources or enhance-ments of anthropogenic removals by sinks meet all applicable requirements of Article 6 of the Kyoto Protocol and the JI guidelines.
Eligibility Requirements: There are six Eligibility Requirements for Participating in Emissions Trading (Art. 17) for Annex I Parties. Those are: (i) being a Party to the Kyoto Protocol, (ii) having calculated and recorded one’s Assigned Amount, (iii) having in place a national system for inventory, (iv) having in place a national registry, (v) having submitted an an-nual inventory and (vi) submit supplementary infor-mation on assigned amount. An Annex I party will automatically become eligible after 16 months have elapsed since the submission of its report on calcula-tion of its assigned amount. Then, this Party and any entity having opened an account in the registry can participate in Emissions Trading. However, a Party could lose its eligibility if the Enforcement Branch of the Compliance Committee has determined the Party is non-compliant with the eligibility requirements.
Emission Reductions (ERs): The measurable re-duction of release of greenhouse gases into the at-mosphere from a specified activity, and a specified period of time.
Emission Reductions Purchase Agreement (ERPA): Agreement which governs the transaction of emis-sion reductions.
Emission Reduction Units (ERUs): A unit of emission reductions issued pursuant to Joint Implementation. One ERU represents the right to emit one metric ton of carbon dioxide equivalent. Emissions Trading Scheme (ETS): See cap and trade.
EU-10: Bulgaria, Czech Republic, Estonia, Hungary, Latvia, Lithuania, Poland, Romania, Slovakia, and Slovenia.
EU-15: Austria, Belgium, Denmark, Finland, France, Germany, Greece, Ireland, Italy, Luxembourg, Netherlands, Portugal, Spain, Sweden, United Kingdom.
European Union Allowances (EUAs): The allowanc-es in use under the EU ETS. An EUA unit is equal to one metric ton of carbon dioxide equivalent.
European Union Emission Trading Scheme (EU ETS): The EU ETS was launched on January 1, 2005, as a cornerstone of EU climate policy toward its Kyoto commitment and beyond. Through the EU ETS, Member States allocate part of the efforts toward their Kyoto targets to domestic emission sources (mostly utilities). Over 2008–12, emissions from mandated installations (about 40 percent of EU emissions) are capped on average at 6 percent below 2005 levels. Participants can internally reduce emissions, purchase EUAs or acquire CERs and ERUs (within a 13.4 percent average limit of their allocation over 2008–12). The EU ETS will con-tinue beyond 2012, with further cuts in emissions (by 21 percent below 2005 levels in 2020 or more, depending on progress in reaching an ambitious in-ternational agreement on climate change).First Commitment Period: The five-year period, from 2008 to 2012, during which industrialized country have committed to collectively reduce their greenhouse gas (or “carbon”) emissions by an average of 5.2 percent compared with 1990 emissions under the Kyoto Protocol.
Green Investment Scheme (GIS): A GIS is a volun-tary mechanism through which proceeds from AAU transactions will contribute to contractually agreed environment- and climate-friendly projects and pro-grams both by 2012 and beyond.

76 | State and Trends of the Carbon Market 2010
Greenhouse Gases (GHGs): Both natural and an-thropogenic, greenhouse gases trap heat in the Earth’s atmosphere, causing the greenhouse effect. Water vapor (H2O), carbon dioxide (CO2), nitrous oxide (N2O), methane (CH4), and ozone (O3) are the pri-mary greenhouse gases. The emission of greenhouse gases through human activities (such as fossil fuel combustion or deforestation) and their accumula-tion in the atmosphere is responsible for an addi-tional forcing, contributing to climate change. The Kyoto Protocol regulates six GHGs: carbon dioxide (CO2), methane (CH4), and nitrous oxide (N20), as well as hydrofluorocarbons (HFCs), perfluorocar-bons (PFCs), and sulfur hexafluoride (SF6).
Global Warming Potential (GWP): An index rep-resenting the combined effect of the differing times greenhouse gases remain in the atmosphere and their relative effectiveness in absorbing outgoing infrared radiation.
Internal rate of return: The annual return that would make the present value of future cash flows from an investment (including its residual market value) equal the current market price of the invest-ment. In other words, the discount rate at which an investment has zero net present value.
International Transaction Log (ITL): The ITL links together the national registries and the CDM regis-try and is in charge of verifying the validity of trans-actions (issuance, transfer and acquisition between registries, cancellation, expiration and replacement, retirement and carry-over). It is the central piece of the emissions trading under the Kyoto Protocol.
Japan-Voluntary Emissions Trading Scheme (J-VETS): Under the J-VETS, companies receive subsidies to implement mitigation activities in line with voluntary commitments and can resort to emissions trading (incl. offsets) to meet their commitments with more flexibility. Though growing, impact remains limited: over the first three years of the scheme, participants (288 companies) have reduced their emissions by about one million tCO2e. The J-VETS has contrib-uted to the development of MRV system, third-party verification system, and the registry system. The J-VETS has been incorporated to the Experimental Integrated ETS as one of participating options.
Joint Implementation (JI): Mechanism provided by Article 6 of the Kyoto Protocol, whereby entities from Annex I Parties may participate in low-carbon projects in hosted in Annex I countries and obtain Emission Reduction Units in return.
Kyoto Mechanisms (KMs): the three flexibility mechanisms that may be used by Annex I Parties to the Kyoto Protocol to fulfill their commitments. Those are the Joint Implementation (JI, Art. 6), Clean Development Mechanism (CDM, Art. 12), and International Emissions Trading (Art. 17).
Kyoto Protocol: Adopted at the Third Conference of the Parties to the United Nations Convention on Climate Change held in Kyoto, Japan in December 1997, the Kyoto Protocol commits industrial-ized country signatories to collectively reduce their greenhouse gas emissions by at least 5.2 percent below 1990 levels on average over 2008–12 while developing countries can take no regret actions and participate voluntarily in emission reductions and removal activities through the CDM. The Kyoto Protocol entered into force in February 2005.
Monitoring Plan: A set of requirements for monitor-ing and verification of emission reductions achieved by a project.
Nationally Appropriate Mitigation Actions (NAMAs): Refers to a set of mitigation policies and/or actions a developing country undertakes aiming at reducing its GHG emissions and reports to UNFCCC on a volun-tary basis. The concept of NAMAs emerged in 2007 under the UNFCCC Bali Action Plan, which called for “[the implementation of] Nationally Appropriate Mitigation Actions by developing country Parties in the context of sustainable development, supported and enabled by technology, financing and capacity build-ing, in a measurable, reportable and verifiable man-ner.” Through international negotiations within the UNFCCC, NAMAs have been steadily refined. The Cancun Agreement of last December achieved signifi-cant progress in the concept of NAMAs and, inter alia, set milestones for the development of a central registry of NAMAs (including NAMAs seeking international funding support) and guidelines for measuring, report-ing and verification (MRV). Definitions on these ele-ments are expected by the end of this year.
State and Trends of the Carbon Market 2010 | 77
National Allocation Plans (NAPs): The documents, established by each Member State and reviewed by the European Commission, that specify the list of installations under the EU ETS and their absolute emissions caps, the amount of CERs and ERUs that may be used by these installations as well as other features such as the size of the new entrants reserve and the treatment of exiting installations or the pro-cess of allocation (free allocation or auctioning).
New South Wales Greenhouse Gas Reduction Scheme (NSW GGAS): Operational since January 1, 2003 (to last at least until 2012), the NSW Greenhouse Gas Abatement Scheme aims at reduc-ing GHG emissions from the power sector. NSW and ACT (since January 1, 2005) retailers and large elec-tricity customers have thus to comply with manda-tory (intensity) targets for reducing or offsetting the emissions of GHG arise from the production of elec-tricity they supply or use. They can meet their targets meet their targets by purchasing certificates (NSW Greenhouse Abatement Certificates or NGACs) that are generated through project activities.
New Zealand Emissions Trading Scheme (NZ ETS): The NZ ETS will progressively regulate emis-sions of the six Kyoto gases in all sectors of the econ-omy by 2015. Forestry is covered since 2008 and by July 1, 2010, stationary energy, industrial process and liquid fossil fuel will be phased-in. The govern-ment recently announced, however, that full imple-mentation could be delayed if adequate progress is not made in establishing similar regulations in other developed countries.
Offsets: Offsets designate the emission reductions from project-based activities that can be used to meet compliance—or corporate citizenship—objec-tives vis-à-vis greenhouse gas mitigation.
Primary transaction: A transaction between the origi-nal owner (or issuer) of the carbon asset and a buyer.
Project Design Document (PDD): A central docu-ment of project-based mechanisms, the PDD nota-bly describes the project activity (including environ-mental impacts and stakeholders consultations), the baseline methodology and how the project is addi-tional as well as the monitoring plan.
Project Idea Note (PIN): A note prepared by a proj-ect proponent presenting briefly the project activity (for example, sector, location, financials, estimated amount of ERs, and so on).
REDD plus (REDD+): All activities that reduce emis-sions from deforestation and forest degradation, and contribute to conservation, sustainable management of forests, and enhancement of forest carbon stocks.
Regional Greenhouse Gas Initiative (RGGI): Under RGGI, 10 Northeast and Mid-Atlantic states aim to reduce power sector CO2 emissions by 10 percent be-low 2009 levels in 2019. Within this ten-year phase, there are three shorter compliance periods. During the first and second compliance periods (2009–11 and 2012–14) the cap on about 225 installations is set at 171 MtCO2e (or 188 M short ton CO2e). This is followed by a 2.5 percent per year decrease in cap during the third compliance period (2015–18).
Reforestation: This process increases the capacity of the land to sequester carbon by replanting forest biomass in areas where forests have been previously harvested.
Registration: The formal acceptance by the CDM Executive Board of a validated project as a CDM project activity.
Removal Unit (RMU): RMUs are issued by Parties to the Kyoto Protocol in respect of net removals by sinks from activities covered by Article 3(3) and Article 3(4) of the Kyoto Protocol.
Secondary transaction: A transaction where the seller is not the original owner (or issuer) of the carbon asset.
Supplementarity: Following the Marrakesh Accords, the use of the Kyoto mechanisms shall be supplemen-tal to domestic action, which shall thus constitute a significant element of the effort made by each Party to meet its commitment under the Kyoto Protocol. However there is no quantitative limit to the utiliza-tion of such mechanisms. While assessing the NAPs, the European Commission considered that the use of CDM and JI offsets could not exceeded 50 percent of the effort by each Member State to achieve its com-mitment. Supplementarity limits may thus affect de-mand for some categories of offsets.

78 | State and Trends of the Carbon Market 2010
United Nations Framework Convention on Climate Change (UNFCCC): The international legal framework adopted in June 1992 at the Rio Earth Summit to address climate change. It commits the Parties to the UNFCCC to stabilize human in-duced greenhouse gas emissions at levels that would prevent dangerous manmade interference with the climate system, following “common but differentiat-ed responsibilities” based on “respective capabilities.”
Validation: Validation is the process of indepen-dent evaluation of a project activity by a Designated Operational Entity (DOE) against the requirements of the CDM. The CDM requirements include the CDM modalities and procedures and subsequent decisions by the CMP and documents released by the CDM Executive Board.
Verified Emission Reductions (VERs): A unit of greenhouse gas emission reductions that has been verified by an independent auditor. Most often, this designates emission reductions units that are traded on the voluntary market.
Verification: Verification is the review and ex post determination by an independent third party of the monitored reductions in emissions generated by a registered CDM project, a determined JI project (or a project approved under another standard) during the verification period.
Voluntary market: The voluntary market caters for the needs of those entities that voluntarily decide to reduce their carbon footprint using offsets. The regulatory vacuum in some countries and the antici-pation of imminent legislation on GHG emissions also motivates some pre-compliance activity.
Western Climate Initiative (WCI): The WCI cov-ers a group of seven U.S. states (Arizona, California, Montana, New Mexico, Oregon, Utah, and Washington) and four Canadian provinces (British Columbia, Manitoba, Ontario, and Quebec), with an aggregate emissions target of 15 percent below 2005 levels by 2020. Other U.S. and Mexican states and Canadian provinces have joined as observers.

NOTES

NOTES


1818 H STREET, NW
WASHINGTON, DC 20433 USAFSC Logo