Embed Size (px)
Citation preview
9979ProductivitygTechnologysand IndustrialDevelopment
A Case Study in Textiles
Howard Pacl
___ ~~~~A World Bank Research Publication
Pub
lic D
iscl
osur
e A
utho
rized
Pub
lic D
iscl
osur
e A
utho
rized
Pub
lic D
iscl
osur
e A
utho
rized
Pub
lic D
iscl
osur
e A
utho
rized
Pub
lic D
iscl
osur
e A
utho
rized
Pub
lic D
iscl
osur
e A
utho
rized
Pub
lic D
iscl
osur
e A
utho
rized
Pub
lic D
iscl
osur
e A
utho
rized

Productivity, Technology,and Industrial Development
A World Bank Research Publication

.. q . ~~~~~~~I .
Productivity, Technologyand Industrial Development
A Case Study in Textiles
Howard Pack
Published for the World Bank
OXFORD UNIVERSITY PRESS
Oxford University Press
NEW YORK OXFORD LONDON GLASGOW
TORONTO MELBOURNE WELLINGTON HONG KONG
TOKYO KUALA LUMPUR SINGAPORE JAKARTA
DELHI BOMBAY CALCUTTA MADRAS KARACHI
NAIROBI DAR ES SALAAM CAPE TOWN
© 1987 The International Bank forReconstruction and Development / THE WORLD BANK
1818 H Street, N.W., Washington, D.C. 20433, U.S.A.
All rights reserved. No part of this publicationmay be reproduced, stored in a retrieval system,
or transmitted in any form or by any means,electronic, mechanical, photocopying, recording,
or otherwise, without the prior permissionof Oxford University Press.
Manufactured in the United States of AmericaFirst printing June 1987
The findings, interpretations, and conclusions expressed in this study are theresults of country economic analysis or research supported by the World Bank,
but they are entirely those of the author and should not be attributed inany manner to the Wortd Bank, to its affiliated organizations, or to members of
its Board of Executive Directors or the countries they represent.
Library of Congress Cataloging-in-Publication Data
Pack, Howard.Productivity, technology, and industrial development.
(A World Bank research publication)"Published for the World Bank"
Bibliography: p.Includes index.
1. Cotton textile industry-Labor productivity-Case studies. I. Title. II. Series.
HD9870.5.P 2 5 1987 331.11'8 86-33271ISBN 0-19-520543-x
Contents
Preface ix
1. Introduction
Productivity Comparisons in the Literature 2Analyses of Technology Choice 3Productivity Differences and the Transfer of Technology 3Issues in Industrial Strategy 5The Cotton Textile Industry 6The Analytic Model 7A Preview 9Notes 10
2. Technological and Economic Issuesin Cotton Textile Production 12
Spinning 12Weaving 22Product Specialization and Productivity 27Product Specification and Factor Proportions 29Notes 32
3. Best Practice and the Source of Deviations from It 35
The Technical Frontier and Best Practice 36The Evolution of Best-Practice Standards 39A Decomposition of Cross-Country Productivity
Differentials 41Formalization of the Decomposition 47Intracountry Cost Comparisons 53Details of the Calculation of Productivity-Depressing
Factors 55Appendix 60Notes 64
v
Vi CONTENTS
4. The Kenyan Textile Sector 67
Spinning 68Weaving 70Performance Relative to Best Practice 71Potential Competitiveness 80Notes 81
5. The Philippine Textile Sector 84
Spinning 85Weaving 91The Choice of Current Textile Technologies 95Performance Relative to Best Practice 96Potential Competitiveness 101Notes 102
6. Behind the Productivity Differentials 103
Selected Issues in Production Engineering 104Operating Characteristics of Philippine and Kenyan
Plants 110Performance Gaps 116Spare Parts 123Notes 124
7. Comparative Analysis 126
The Availability and Cost of Technology 126An Augmented Neoclassical Model 128Intracountry-Intraindustry Variations in Productivity 132International Comparisons 139The Importance of Proprietary Information 146Summary 146Notes 148
8. Project Design 151
Formulation of Alternative Industrial Projects 151Cost-Effectiveness of Two Alternative Projects 155Benefit-Cost Analysis of Productivity-Enhancing
Projects 157An Application to the Philippine Textile Sector 161Notes 167

CONTENTS Vii
9. Conclusions 170
The Choice of Technology 170Productivity 171Guidelines for Policy 172Some Issues in the Transfer of Technology 176Notes 178
References 179
Index 187

Preface
To EVALUATE project proposals that would establish new factories, theWorld Bank follows well-defined steps to determine the proposed plant'seconomic viability and rate of return. These evaluations typically assumethat there is little scope for altering the productivity of existing plants inthe same sector or for modifying the choice of technology to accommo-date the circumstances of the host country. This book arose from effortsto examine those assumptions and to encourage a dialogue on the designof industrial projects. The particular issues of contention arose in regardto loans for the construction of cotton textile plants, hence the focus ofthis book on that specific industry.
As I worked on these issues, I realized that economists and industrialengineers had devoted relatively little effort to either measuring or under-standing the sources of low productivity in manufacturing in developingcountries. I have attempted in this book to fill that gap and to shed lighton other issues in industrial development, as well as to suggest ways inwhich national governments and international lenders can improve thedesign of projects. The suggestions involve orthodox macroeconomicpolicies such as import liberalization, as well as microeconomic policiesthat are less conventional.
The research was funded by the Research Committee of the WorldBank and jointly sponsored by the Industry and Development Researchdepartments. The manuscript was completed while I was a Eugene M.Lang Faculty Fellow at Swarthmore College.
My greatest debt is to Janet Rothenberg Pack, who took time from herown research schedule to accompany me on all the field visits to factoriesand who helped extensively in the interview process. R. H. Grills, a textileengineer and analyst at the Shirley Institute in Manchester, England, alsovisited the factories and ensured that the answers received during inter-views were consistent on technical issues. He was also an invaluable guideto the uncodified knowledge on textile manufacturing. In Kenya I hadconsiderable help in arranging interviews from Hayley Goris, the head ofthe World Bank resident mission. In the Philippines the way was
ix
X PREFACE
smoothed by the Ministry of Industry and the Board of Investment.Bobby Bernardo and Gloria Santos of these organizations were instructiveand pleasant guides.
I am especially grateful to the large number of people from each of thetextile mills who cooperated with this study. Not only did they willinglyprovide information, but they also offered insightful observations ontechnical issues and government policies.
I received useful comments on an early draft from Janet Pack, GustavRanis, Yung Rhee, Bernard Saffran, Gene Tidrick, and five anonymousreferees. Peter Bocock was a careful and congenial editor. Larry Westphal,who helped to initiate the project, provided helpful conversations andincisive comments on the final draft.
CHAPTER ONE
Introduction
THIS BOOK has its origins in the need to make informed choices aboutthe desirability of proposed industrial projects in developing countries.The past fifteen years have seen an enormous growth in the literaturesuggesting precise analytic methods for evaluating an individual projectwhose operating characteristics are known. Nevertheless, one of the mostimportant elements of the decision process-the establishment of aplausible range for these characteristics-has been largely ignored in mostformal discussions. It is generally believed that manufacturing plants indeveloping countries operate at lower levels of productivity than those indeveloped countries, but relatively little is known of the current magni-tude of the difference, its evolution over time, or its sources. Although afew authors, notably Leibenstein, have called attention to this phe-nomenon, it is still most often treated as a curiosity, outside the main-stream of development thought. Yet the large difference betweenproductivity in industrial and developing countries is inextricably relatedto such major concerns as the choice of technology and the validity ofspecial support for infant industries. Productivity differences betweentechnically similar plants in different countries are of interest in them-selves for the insight they provide into the industrialization process; theyalso suggest that there may be high social rates of return from industrialprojects that improve performance.
A comprehensive approach to the design of industrial projects requiresconsideration of the optimal choice of technology or capital-labor ratio ina new plant if the correct benefit-cost ratio from additional capacity is tobe obtained. Because optimal capital intensity depends partly on theproductivity with which specific equipment is employed under actualoperating conditions, the choice of technology and the level of productiv-ity are closely related.
Most analyses of technology choice rely on labor and capital prod-uctivities that apply only in advanced countries or solely in developingcountries. The productivity assumptions embedded in feasibility studies,for example, particularly when equipment of advanced design is one of
I
2 INTRODUCTION
the alternative technologies, often reflect idealized working conditions inindustrialized countries that have had long experience in the manufactureof a particular product. Although the standard input coefficients pre-sented by consulting engineers or machinery producers may offer a usefulguide to prospective equipment purchasers in Lyons, Antwerp, or Raleigh,the typical producer in a developing country will fall short of the en-visaged productivity. Sophisticated equipment that exhibits a lower unitcost of production (at developing country factor prices) than more con-ventional machinery in feasibility studies that assume high productivityfor both may result in greater cost when the production parameters usedare more realistic for developing countries. The unit input requirements ina developed country do not necessarily translate into similar ones whenthe technology is transferred to a different setting. The calculation of theleast-cost technology is sensitive to the specific set of productivities used;the choice of technology and differences in productivity between operat-ing developing country plants and best-practice ones are inextricablylinked.' Input coefficients specific to the developing country must beused if realistic rather than fanciful project evaluations are to be obtained.
Productivity Comparisons in the Literature
There have been two types of comparative international productivitystudies of specific manufacturing branches, and they have drawn mainlyon evidence from developed countries.2 The first uses sectorwide mea-sures of output and input to derive comparisons of labor productivity,whereas the second compares one or two plants in an industry in each oftwo or three countries. Both sets of analyses typically investigate sectorsor firms in developed countries and consider labor productivity dif-ferences; they provide little guidance on the probable range of results indeveloping countries or on differences in total-factor productivity (TFP).
3
There have also been a few comparisons of developed and developingcountries with respect to differences in TFP at a point in time.4 In contrast,the present study analyzes data from a large group of individual plants inKenya and the Philippines and compares their total-factor productivitywith that of best-practice plants in a developed country using identicalequipment. Knowledge about the performance of a large number of facto-ries in each developing country permits the measurement and analysis ofintracountry as well as international productivity variations. In this andother respects the present study is closer to the emerging literature onfrontier production functions than to the studies cited in the precedingfootnote or those surveyed by Kravis.5
PRODUCTIVITY AND TECHNOLOGY 3
Analyses of Technology Choice
The main empirical question considered in past analyses of the choiceof technology has been whether a choice in fact exists or whether thenewest technology dominates older ones in the sense of requiring less ofboth capital and labor per unit of output.' A substantial body of work hasshown that in many industrial processes the technology permits consid-erable substitution of labor for machinery and that, in general, newertechnologies do not dominate older ones.7 The analysis of the cottontextile sector presented in the following chapters confirms these earlierfindings. Comparison of the most modern technologies and currentlyavailable conventional technologies for both spinning and weaving showsthat the former have higher production costs at market prices for thefactors of production; the discrepancy would be greater at shadow prices.The magnitude of the cost difference between the technologies variesconsiderably with the productivity with which each technology is used inparticular developing country settings.
Productivity Differences and the Transfer of Technology
Evidence about productivity differences and their evolution is criticalfor evaluating industrialization strategies and methods for effecting thesuccessful transfer of industrial technologies to developing countries.
Productivity in Developing Country Plants
It has often been asserted that the establishment of manufacturingcapacity behind tariff or quota barriers enables individual firms to im-prove their productive abilities gradually and to move toward best prac-tice.8 Although firms do not need to attain best practice to competeinternationally-lower prices for some factors can offset some productiv-ity disadvantage-it is nevertheless of considerable interest to determinehow close to best practice textile firms are in the highly protected econo-mies of Kenya and the Philippines. Although it was not possible to obtainadequate time-series data of technical coefficients from the firms, thedata collected do permit an analysis of the nature of the gap still to beclosed fifteen to thirty years after production started in each country.
The approach followed in this book, particularly the disaggregation ofthe sources of productivity differences between operating developingcountry plants and best-practice plants in developed countries, permitsthe analysis of issues that standard criteria of competitiveness do not
4 INTRODUCTION
consider. In particular, estimates of effective protection rates or domesticresource cost cannot discriminate between a number of microeconomicfactors that generate the summary measures. A firm may have successfullymastered its own technologies according to its expectations and maycome close to best engineering practice, for example, but may still not beable to match the total-factor productivity of better developed countryfirms because of excessive product variety-which in turn stems from theparticular market structure that has evolved, perhaps in response to pro-tection. A high rate of measured effective protection cannot discriminatebetween this possibility and substantial technical inefficiency within thefirm, yet the two phenomena may have different implications for thesuccess of infant industries.
Disaggregated analysis of the sources of productivity differentials alsopermits detailed analysis of policy questions with respect to improvingindustrial sector performance. Much effort has been expended on mea-suring the level of effective protection but little on finding out why firms(and industries) need such protection. Although there is clearly somevalidity in the view that protection itself is a source of inefficiency,9 it ispossible that the removal of protection alone will not provide a magiccorrective to existing deficiencies; some specific technological interven-tion or effort at rationalizing the organization of an industry may also berequired. These questions are discussed in chapters 8 and 9, using theresults of the preceding chapters.
Transfer of Technology
Within the strictly neoclassical framework of a freely available interna-tional technology, observed differences in total-factor productivitybetween actual- and best-practice firms-particularly those attributableto variations in activities controlled by firms-are anomalous. To accountfor international differences in productivity, it is necessary to postulatedifferential costs of acquiring technical information, variations in themarginal productivity of utilizing such information, or some combinationof the two. Moreover, to the extent that total-factor productivity of firmswith identical equipment differs within a country, similar questions ariseabout the intracountry diffusion of technology.
Although some of the literature on the transfer of technology hasdocumented the substantial expenses that may be incurred in implantingan existing technology in another environment (see Teece 1976), the intra-country dispersion of productivity has received little attention. The datacollected in Kenya and the Philippines for this book, plus an unusual bodyof technical engineering information collected from a sample of major
INDUSTRIAL STRATEGY 5
textile-producing nations, permit a number of issues that arise under thecatchall phrase "transfer of technology" to be addressed more fully than isusually the case.
One related question-whether local or foreign managers are likely toachieve greater productivity when new firms are established-will also beconsidered. A priori arguments can be made in favor of both: domesticmanagers are more familiar with local customs and probable reactions ofworkers to specific requests, whereas expatriates bring superior technicalknowledge. The data available and the analysis performed with themsuggest at least preliminary answers to questions about relative productiv-ity performance-answers that also have policy implications in the debateabout the desirability of permitting direct foreign investment.
Issues in Industrial Strategy
The typical industrial project, financed by international lending institu-tions and by industrial development banks in developing countries, allowsthe borrower to establish or expand a factory. In a country that alreadypossesses a significant amount of manufacturing capacity, existing plantsmay be inefficient, and much greater output could be obtained if firmscould eliminate part of the gap between their current productivity andthat realized by the better plants in other countries. The additional outputobtained from such an improvement project may eliminate the need foradditional physical investment in a particular industry. Any proposal toexpand capacity in a sector with existing plants should be viewed asimplying an alternative project against which it should be compared,namely an improvement project for the sector in question and, moregenerally, for other sectors as well. The choice of the optimal project mustthen be based on a comparison of the social benefit-cost ratio of capacityexpansion with that of productivity enhancement.
To design an improvement project requires a substantial amount ofdetail about the economic and technical engineering characteristics ofexisting plants. Such information is also a useful check on the plausibilityof performance projections for new factories. If insights are to be ob-tained about the probable magnitudes involved, the relevant analysis mustproceed within a specific national and industrial context. The presentanalysis considers the cotton textile sector in Kenya and the Philippines;the reason for focusing on textiles is discussed in the next section. De-tailed data at each processing stage have been collected from textile plantsin the two countries. Comparable data from plants in developed countriesmake it possible to calculate the total-factor productivity of mills in the
6 INTRODUCTION
developing countries and of their counterparts in developed countriesusing ostensibly identical equipment. The rich data base also makes itpossible to identify and measure sources of productivity differences be-tween the two sets of plants. This decomposition in turn makes it possibleto address such questions as whether the lower productivity in developingcountry manufacturing is attributable to the poor labor force skills thatmay characterize the early stage of industrialization or whether otherfeatures of developing economies-such as insufficient product spe-cialization by firms or managers' inadequate technical knowledge-areresponsible.
Any effort to improve productivity within a framework of general tradeliberalization raises a number of difficult issues, such as the sequencing oftariff reductions, the timing and nature of technical assistance, and theutility of improving or adding to the equipment of existing firms. Theinformation obtained from detailed analysis of the level of productivityand its determinants provides useful insights into these more generalpolicy questions.
The Cotton Textile Industry
The cotton textile industry was chosen for investigation for a numberof reasons. The industry is currently among the larger industrial subsec-tors in many developing countries in terms of employment and share ofindustrial value added; it is thus high on the list of sectors in which higherproductivity could sharply raise output. It is also a sector in which manynew plants are being planned. A considerable body of literature indicatesboth that a substantial range of technology exists and that careful evalua-tion of alternative technologies is imperative, as the capital required perworker may exceed US$30,000 if machinery is chosen from the higher endof the technology spectrum (see Amsalem 1983; Pack 1975; Pickett andRobson 1981).
The relevant technical characteristics of the industry include the fol-lowing: it has a largely mechanical-as opposed to biological, chemical, orelectronic-technological base; production is machine paced, but theabilities of operatives and technical managers affect the quantity andquality of output per unit of time; and the size of the production run is animportant determinant of unit cost. More generally, the textile manufac-turing process bears many similarities to such industries as food process-ing and the manufacture of paints, pharmaceuticals, and ball bearings;some of the methods of analysis followed here should therefore, withsuitable modification, be useful in studying these sectors as well.
THE MODEL 7
The choice of countries was largely dictated by the need for the cooper-ation of individual firms. The selection does not seem to have led to anyparticular bias; major variables have been roughly checked against lesscomprehensive plant-level data obtained by consulting engineering firmsin other countries. At the time of data collection for the study, bothKenya and the Philippines had long been engaged in encouraging indus-trialization through comprehensive protection of local firms from importcompetition. Exports are not, in the aggregate, important for either coun-try's textile sector, though some firms do export part of their output. Thetwo countries differ significantly in that multinational firms dominate theKenyan textile sector, whereas the Philippine industry is owned domes-tically. As I shall show, this difference manifests itself in a number of ways.
The Analytic Model
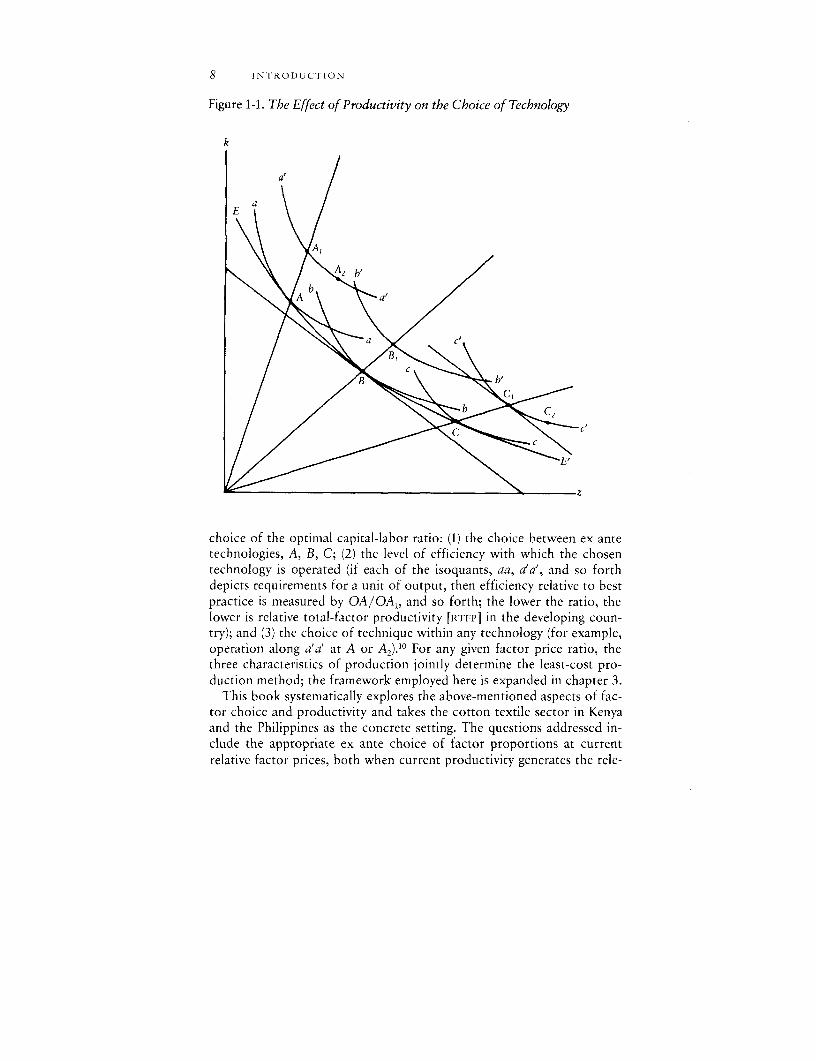
A simple model can be used to analyze the implication of many of theissues that I have raised so far. In the following discussion, "technology" isused to describe a relatively homogeneous set of production methods thatdiffer distinctly from each other; for example, a variety of looms used forweaving differ mainly in the principle by which the weft is inserted intothe warp. Semiautomatic, automatic, and water jet looms are three of themany technologies available, though there are several relatively minorvariations of the basic loom within each category, depending on the par-ticular loom manufacturer. For any technology, a specific technique indi-cates the labor-to-capital ratio-each type of loom can be used withvarying amounts of labor, depending upon the wage-rental ratio facing thefirm. The ex ante unit isoquant facing a firm about to purchase newequipment consists of the envelope of best-practice coefficients of eachof the technologies, or EABCE' in figure 1-1, in which the axes measure unitinput requirements, k the capital-output ratio, and z the labor-outputratio. Once a particular technology has been chosen by a firm, for exam-ple, technology A, ex post variation in technique is possible. If the firmcan achieve best practice, this variation occurs along aa. In developingcountries, where plants typically exhibit total-factor productivity belowthat of best practice, ex post substitution occurs along a'a'. As drawn infigure 1-1, the ex post elasticity of substitution is less than that holding exante, the latter including as it does the possibility of choosing amongdifferent technologies designed to be optimal for any given factor priceratio.
Given the preceding definitions and assumptions, we may identify threeseparate features that are compressed into one in most analyses of the
8 INTRODUCTION
Figure 1-1. The Effect of Productivity on the Choice of Technology
k
a,
aE
A b
choice of the optimal capital-labor ratio: (1) the choice between ex antetechnologies, A, B, C; (2) the level of efficiency with which the chosentechnology is operated (if each of the isoquants, aa, a'a', and so forthdepicts requirements for a unit of output, then efficiency relative to bestpractice is measured by OA/OA1 , and so forth; the lower the ratio, thelower is relative total-factor productivity [RTFPJ in the developing coun-try); and (3) the choice of technique within any technology (for example,operation along a'a' at A or A2 ).10 For any given factor price ratio, thethree characteristics of production jointly determine the least-cost pro-duction method; the framework employed here is expanded in chapter 3.
This book systematically explores the above-mentioned aspects of fac-tor choice and productivity and takes the cotton textile sector in Kenyaand the Philippines as the concrete setting. The questions addressed in-clude the appropriate ex ante choice of factor proportions at currentrelative factor prices, both when current productivity generates the rele-
A PREVIEW 9
vant set of choices and when developing country firms are postulated torealize productivity close to that on the best-practice frontier. The ex antechoice of technologies includes: (1) the most technologically advancedequipment currently available; (2) machinery currently being manufac-tured that is of modern but conventional design; (3) used modern machin-ery that differs from new versions mainly in price and expected useful life;(4) new or used machinery whose design dates back forty years or more.In analyzing the optimal ex ante technology choice, it is necessary toobtain both current operating productivity and estimates of feasible pro-ductivity. If developing country productivity that has been realized withalternative technologies is the only basis for calculation, technology Cshown in figure 1-1 is superior to B, as Cl yields a lower unit cost than B1;if best-practice coefficients could be realized in the developing country,however, B would yield a lower unit cost. Existing studies utilize eitherinformation about best-practice alternatives (aa, bb, cc) or observationsfrom current developing country operations a'a', b'b', c'c').11
The above-described analytical framework is also useful for assessingproductivity improvement projects. The potential cost reductions to beobtained from improved performance in existing plants are twofold: thosearising from a movement from low current productivity levels (for exam-ple, c'c') to best practice (cc) as well as from an improved choice of theamount of labor to be employed with machines already installed (themove from C2 to C,). (This analysis is developed more fully in chapter 3.)The cost reductions realized do not represent net gains to the firms or theeconomy, because some costs will typically have to be incurred to realizebetter practice. Thus the economic optimality of a program to enhanceproductivity must be established through a careful appraisal of benefitsand costs. Such an effort is undertaken in chapter 8.
A Preview
Chapters 2 and 3 present the technical background information neededfor the subsequent analysis. Chapter 2 contains the relevant engineeringinformation as well as a discussion of economic issues such as the deter-minants of ex post factor substitution possibilities. Chapter 3 examinesthe concept of best practice, derives measures of developing-countryplant productivity relative to best practice, and uses the technical infor-mation developed in chapter 2 to provide a formal framework for analyz-ing the sources of the deviation of productivity in developing-countryplants from best practice. Chapters 4 and 5 contain two types of analysesof firms in Kenya and the Philippines: first, the current cost structure of
10 INTRODUCTION
plants in each country employing different types of equipment is com-pared; second, the total-factor productivity of each textile mill is calcu-lated relative to a best-practice counterpart in a developed country, thecounterpart being determined by the engineering characteristics of themachinery employed. The sources of the intercountry productivity dif-ferentials are then decomposed into the categories set forth in chapter 3.
The presentation in chapters 4 and 5 is largely quantitative and does notinclude the richness of detail that is one of the benefits of intensive plantinterviews. Chapter 6 therefore presents some of the qualitative and anec-dotal evidence needed to give the reader a sense of what lies behindmeasured productivity differentials-the details of how best-practice pro-duction relations undergo a deformation in operating plants. Thus chap-ters 4 and 5 document the hypothesis that technically similar firms withinKenya and the Philippines are not operating on the same productionfunction as their counterparts in the United Kingdom, whereas chapter 6presents a more concrete sense of the implications. A more formal, quan-titative analysis of observed intracountry and international performancedifferentials is presented in chapter 7, which also places Kenyan andPhilippine performance in an international perspective. Chapter 8 uses theinsights gained in the preceding chapters to address some questions aboutthe design of industrial projects. In particular, the benefits and costs ofestablishing additional productive capacity through new investments inplant and equipment are compared with those stemming from efforts tocorrect existing sources of low productivity.
Chapter 9 summarizes some of the major empirical results and placesthe question of a program of productivity augmentation within thebroader context of trade liberalization. It uses the insights obtained in thepreceding analyses of the sources of low productivity to propose somepolicy options and their desirable temporal phasing.
The individual chapters have been designed to be read in two possiblesequences: (1) the reader interested in both the underlying technologicalissues and methods of analysis may wish to proceed through the volumefrom start to finish; (2) the reader interested in the study's more generalimplications for the analysis of economic development and project designmay prefer to skip to the introductory sections of chapters 4 and 5, whichsummarize the significant empirical results in Kenya and the Philippines,respectively, and then proceed to chapters 6-9.
Notes
1. This point was first emphasized by Hirschman (1958), who hypothesized that industrialproduction methods in which both worker and management effort is determined by the speed
NOTES ||
and sequential demands of "machine-paced" operations will exhibit greater productivity thanthose in which the process can be segmented into individually paced activities. Continuous-process activities, such as most chemical production, would thus exhibit higher relative pro-ductivity than metal working, in which individual tasks are subject to considerable latitude intiming. In spinning and weaving, the production process is largely machine paced regardless oftechnology, so this characteristic of the production process cannot explain observed dif-ferences between firms.
2. A comprehensive survey is provided by Kravis (1976).3. A useful survey and an analysis of what is known about labor productivity in developing
countries are provided by Horton and King (1981).4. Arrow, Chenery, Minhas, and Solow (1961), Daniels (1969), Pack (1984). These and
studies of the growth of productivity in developing countries are surveyed in Pack (forthcom-ing).
5. A review of the use of frontier production functions in analyzing developing countryperformance is given in Pack (forthcoming).
6. The proper choice should also take into account differences in the reinvestable fundsgenerated by each project if current investment rates in the economy are suboptimal. Littleeffort has been devoted to empirical work on this aspect of the choice problem. For acomplete statement of the theoretical issues, see Sen (1968).
7. There have been two generations of studies of empirical substitution possibilities, begin-ning with the estimation of the constant elasticity of substitution production functions in the1960s and continuing with a number of studies based on engineering and microeconomicinformation. Four extensive survey articles of the second group of studies are Acharya (1974),Stewart (1974), Morawetz (1974), and White (1978). Surveys of the first set include Gaude(1975), Morawetz (1976a), and Nerlove (1967). For a recent and comprehensive set of CES
estimates, see Behrman (1982). An estimate of the aggregate quantitative importance of thecorrect choice of factor proportions is provided in Pack (1982a).
8. Such a prospective move does not provide the basis for infant industry protection; in thepresence of perfect capital markets, a firm could finance its own learning, later reaping therewards. For a full discussion of infant industry arguments, see Corden (1974).
9. As has been noted by Corden (1974), however, this outcome is not necessary. For acomplete analysis, see Martin (1978).
10. There is no reason to expect RTFP to be the same for every technology. As noted above,the Hirschman hypothesis that machine-paced operations are more likely to exhibit greaterrelative productivity is not apposite here, as most of the processes in spinning and weaving aremachine paced.
11. For an example of the former, see Pack (1975); for the latter approach, see Rhee andWestphal (1977) and Stewart (1975). A complementary investigation of textile production isalso to be found in Ranis and Saxonhouse (1978).
CHAPTER TWO
Technical and Economic Issuesin Cotton Textile Production
COTTON TEXTILE PRODUCTION comprises an array of processes thatcan be characterized broadly as spinning and weaving. A third stage,finishing, which includes the printing or dyeing of woven cloth, is notconsidered in this book.
Spinning
The production of yarn involves several preparatory processes beforethe final spinning stage. These processes are opening and cleaning, theformation of laps of clean cotton, carding, drawing, and roving. Each willbe described briefly.'
Production Processes
The raw cotton used to manufacture yarn arrives at mills in large,tightly packed bales, which contain substantial amounts of dirt and de-bris. The opening process separates the fiber into smaller particles, ortufts, suitable for cleaning, extracts dirt from the tufts, and combinesthem into a sheet (or lap) suitable for carding. The initial opening andcleaning is achieved by one or more of the following mechanisms: revolv-ing beaters, revolving saws, or jets of air. The lap of cotton that goes tocarding still contains partially unopened fibers as well as some dirt.
Laps from the opening process are fed to cards, which remove theremaining dirt and excessively short or immature fibers. Any unusuallyhard tufts that failed to open in the previous stage are now broken up.The fibers are then arranged in a roughly parallel disentangled form(called a sliver) that becomes the input for drawing. The drawing processfurther straightens the fibers and reduces the size of the sliver by passing itbetween successive sets of rollers, each of which moves more rapidly than
12
SPINNING 13
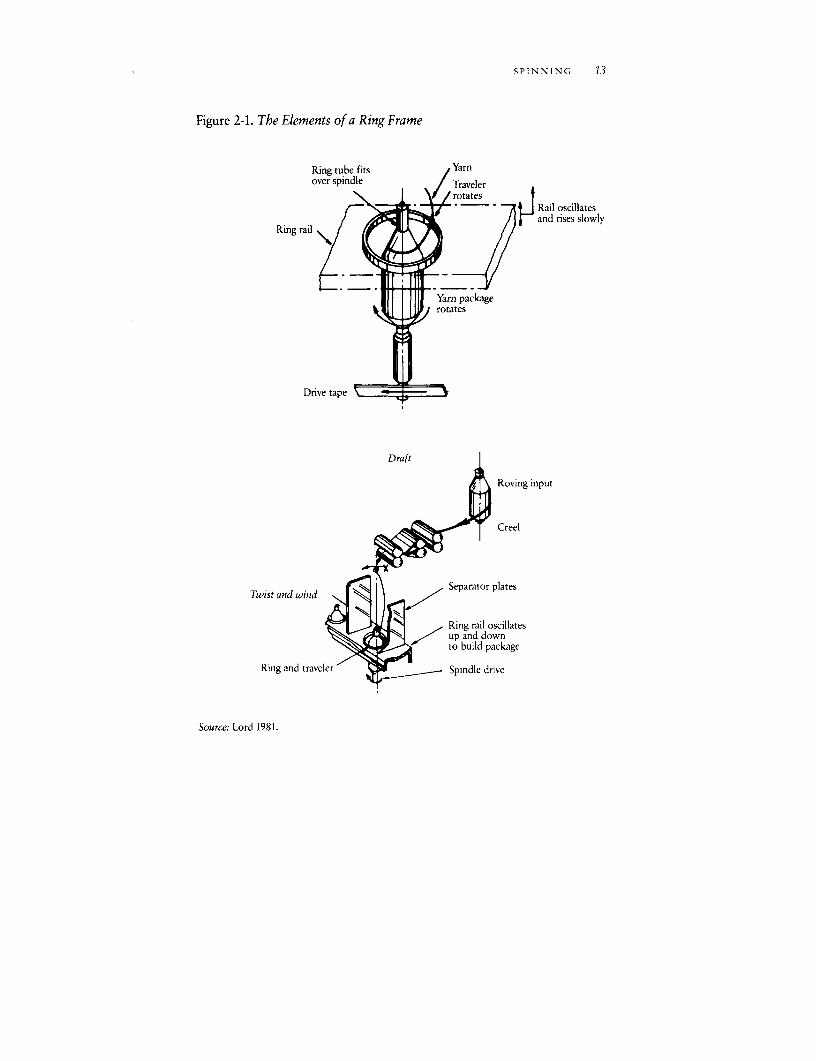
Figure 2-1. The Elements of a Ring Frame
Ring tube fits Yarnover spindle / Traveler
rotates-; -b * - z7 L Rail oscillates
and rises slowlyRing rail
Yarn package% _ _ffi yrotates
Drive tape
Draft
Roving input
Creel
Twist and wind Separator plates
Ring rail oscillatesup and downto build package
Ring and traveler Spindle drive
Source: Lord 1981.
14 COTTON TEXTILE PRODUCTION
the preceding one. The amount of reduction in the weight of the sliver iscalled the draft; the term is used in a similar way in roving and spinning.The greater the draft, the larger the reduction in weight per yard of theinitial sliver.
The roving process takes the sliver from the drawing process and againmakes it thinner by the same means of employing increasingly fast rollers.The sliver is simultaneously twisted slightly to strengthen it. Until the1950s, there were several roving stages, each producing consecutively finersliver. With the invention of processes that can achieve higher drafts inone stage, roving now generally requires only one passage. The product ofthe roving process is itself known as roving and provides the material usedin spinning, the last step of production.
The purpose of spinning is to obtain a still finer yarn from the rovingand to twist previously parallel strands into a spiral so that they adheretogether and make yarn strong enough to bear the great stress place on itin succeeding operations. The yarn being spun is twisted as the spindletravels more quickly than the front roller (see figure 2-1), the number oftwists per inch being given by the ratio of the number of rotations of thespindle per turn of the front roller. (More precisely, the yarn is taken upby the traveler, a small loop, and is then wound on the bobbin.) Mostplants use a standard "twist multiple" to determine the appropriatenumber of twists per inch, T, the formula being T = t c, where t is thetwist multiple and c the yarn count. Two types of yarn are used in weaving,warp and weft; the former are the lengthwise yarns of a woven fabric, thelatter the crossing, or filling, yarns. A higher value of t is usually used inwarp yarns than in weft yarns because of the greater stress endured by theformer.
Spinning is carried out on spinning frames, each of which may have 300to 500 spindles. Though the spindles are driven by a common motor, eachis independent of the others. Labor falls into two major categories inspinning: there are spinners, who set up the supply of roving into creelsand mend any breaks that appear in yarn, and doffers, who remove thefilled bobbins of spun yarn from the spinning frame.
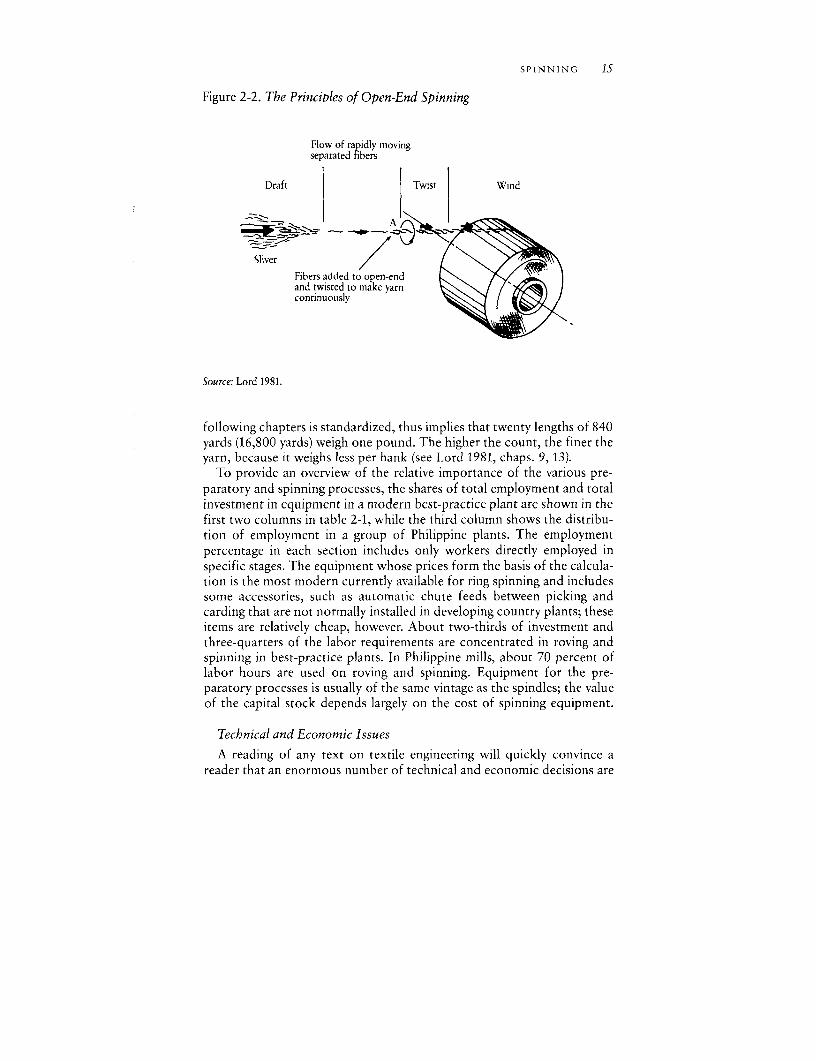
Over the last two decades an entirely new process-open end, or break,spinning-has been perfected. Rather than rotating an entire bobbin orpackage of yarn to obtain twist, an open end of the yarn is rotated aroundthe axis of the yarn (see figure 2-2). The major benefits of the process arethat yarn formation proceeds at much greater speed than in ring spinningand that the roving process can be entirely skipped.
The thickness of yarn is called its count. Several measures of count arecurrently used; I will use the nonmetric Anglo-American one, in which acount of ls indicates that one hank, or length of yarn amounting to 840yards, weighs one pound. A count of 20s, around which the analysis of the
SPINNING 15
Figure 2-2. The Principles of Open-End Spinning
Flow of rapidly movingseparated fibers
Draft Twist Wind
SliverFibers added to open-endand twisted to make yarncontinuously
Source: Lord 1981.
following chapters is standardized, thus implies that twenty lengths of 840yards (16,800 yards) weigh one pound. The higher the count, the finer theyarn, because it weighs less per hank (see Lord 1981, chaps. 9, 13).
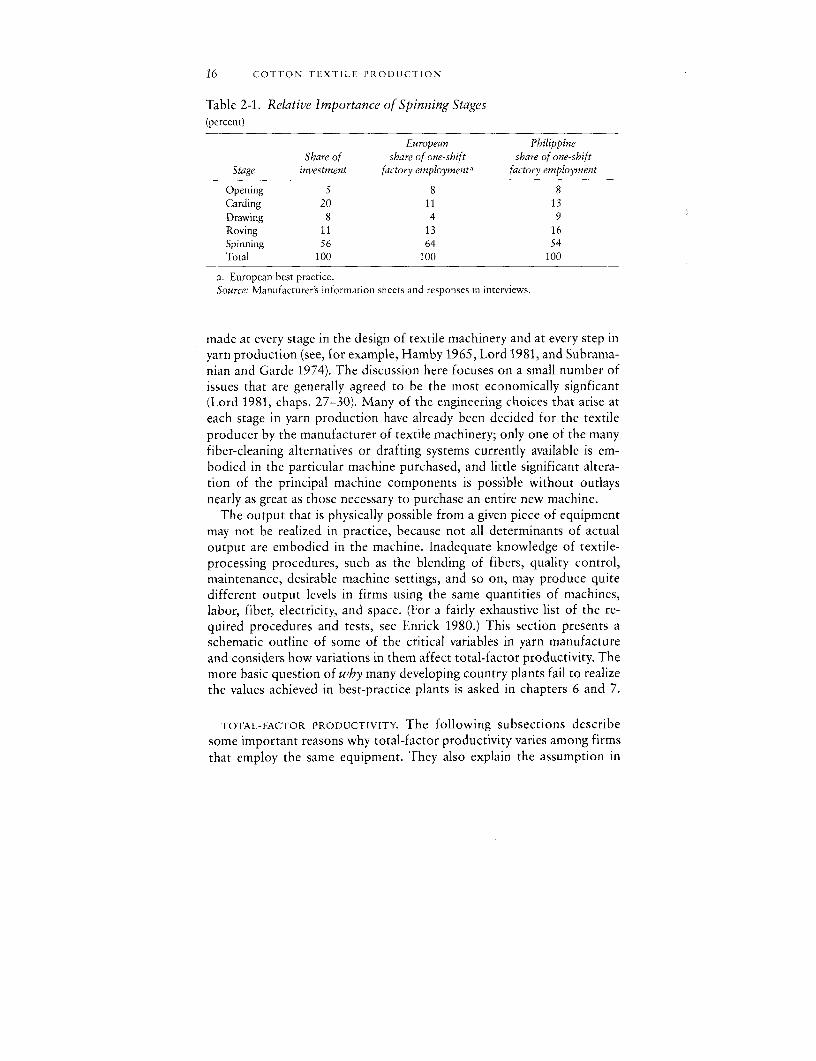
To provide an overview of the relative importance of the various pre-paratory and spinning processes, the shares of total employment and totalinvestment in equipment in a modern best-practice plant are shown in thefirst two columns in table 2-1, while the third column shows the distribu-tion of employment in a group of Philippine plants. The employmentpercentage in each section includes only workers directly employed inspecific stages. The equipment whose prices form the basis of the calcula-tion is the most modern currently available for ring spinning and includessome accessories, such as automatic chute feeds between picking andcarding that are not normally installed in developing country plants; theseitems are relatively cheap, however. About two-thirds of investment andthree-quarters of the labor requirements are concentrated in roving andspinning in best-practice plants. In Philippine mills, about 70 percent oflabor hours are used on roving and spinning. Equipment for the pre-paratory processes is usually of the same vintage as the spindles; the valueof the capital stock depends largely on the cost of spinning equipment.
Technical and Economic Issues
A reading of any text on textile engineering will quickly convince areader that an enormous number of technical and economic decisions are
16 COTTON TEXTILE PRODUCTION
Table 2-1. Relative Importance of Spinning Stages(percent)
European PhilippineShare of share of one-shift share of one-shift
Stage investment factory employmenv' factory employment
Opening 5 8 8Carding 20 11 13Drawing 8 4 9Roving 11 13 16Spinning 56 64 54Total 100 100 100
a. European best practice.Source: Manufacturer's information sheets and responses in interviews.
made at every stage in the design of textile machinery and at every step inyarn production (see, for example, Hamby 1965, Lord 1981, and Subrama-nian and Garde 1974). The discussion here focuses on a small number ofissues that are generally agreed to be the most economically signficant(Lord 1981, chaps. 27-30). Many of the engineering choices that arise ateach stage in yarn production have already been decided for the textileproducer by the manufacturer of textile machinery; only one of the manyfiber-cleaning alternatives or drafting systems currently available is em-hodied in the particular machine purchased, and little significant altera-tion of the principal machine components is possible without outlaysnearly as great as those necessary to purchase an entire new machine.
The output that is physically possible from a given piece of equipmentmay not be realized in practice, because not all determinants of actualoutput are embodied in the machine. Inadequate knowledge of textile-processing procedures, such as the blending of fibers, quality control,maintenance, desirable machine settings, and so on, may produce quitedifferent output levels in firms using the same quantities of machines,labor, fiber, electricity, and space. (For a fairly exhaustive list of the re-quired procedures and tests, see Enrick 1980.) This section presents aschematic outline of some of the critical variables in yarn manufactureand considers how variations in them affect total-factor productivity. Themore basic question of why many developing country plants fail to realizethe values achieved in best-practice plants is asked in chapters 6 and 7.
TOTAL-FACTOR PRODUCTIVITY. The following subsections describesome important reasons why total-factor productivity varies among firmsthat employ the same equipment. They also explain the assumption in
SPINNING 17
succeeding chapters that a shortfall relative to best practice decreasesaverage labor and capital productivity by the same percentage, an assump-tion that permits differences in productivity among firms to be calculatedrelatively simply (see chapter 3). In addition, the technical description ofselected aspects of the manufacturing processes provides the engineeringbasis necessary to understand the sources of potential variations in factorproportions in equipment that has already been installed. The proceduresused to establish numerical measures of the sources of productivity varia-tion are set forth in chapter 3.
A simplified description of the spinning process shows output per spin-dle hour for a given count of yarn, Q, depending on the speed, R, at whichspindles rotate per minute, the numbers of twists, T, inserted per inch,and the hourly rate of spindle utilization, e, known among textile tech-nologists as machine, or spindle, efficiency. The functional relation is
(2-1) Q= Te
Three operating characteristics may result in downward shifts of the pro-duction function, namely, failure to operate spindles at rated speed, inser-tion of a greater number of twists per inch than is standard (T- tV') for agiven count, and inability to operate spindles for the same percentage ofeach hour that best-practice plants do. Each characteristic is discussed inturn.
It is important to distinguish between those alterations in the variablesthat produce shifts in the production function through pure efficiencychanges and those that reflect a movement along it; although these dif-ferences are simple to articulate in principle, they are fairly difficult todistinguish in practice. The speed at which spindles rotate, for example,may be lower than the maximum physically achievable. The first level ofanalysis of this fact may reveal that it results from inadequate maintenanceor a decision to economize on electricity. In the former case the lowerspeed is attributed to technical inefficiency, in the latter to cost minimiza-tion. We could, however, step further back to inquire about the source ofinadequate maintenance, if this is indeed the problem. At this second levelit might be established that the firm allocated most of its limited quantityof technical personnel to improving the mixing process rather than toestablishing maintenance routines. At this more disaggregated level, theobserved insufficient maintenance would more appropriately be classifiedas the outcome of a cost-minimizing strategy rather than as x-inefficiency.
Thus whether a particular observed deficiency should be assigned tothe category of technical inefficiency or to cost minimizing often dependson the number of stages through which one traces back the decision
18 COTTON TEXTILE PRODUCTION
process of the firm. Indeed, all measured x-inefficiency may have as itssource allocative inefficiency at some higher level. The categories used inthe following chapters stop at the first level and do not inquire into morebasic allocation decisions within firms, such as the division of managerialeffort between the improvement of mixing and the establishment of moreadequate maintenance procedures. This decision was made for pragmaticreasons; it is possible, and tempting, to pursue ever more disaggregatedinquiries, but such a process can become an infinite regression that pre-cludes even partial understanding of the issues involved.
A major development in conventional ring spinning has been the real-ization of greater potential spindle speeds. For ring frames of a givenvintage, however, the actual speed employed can differ from the maximumachievable physical speed. The conditions leading to such a divergenceinclude inadequate maintenance, an insufficient supply of spare parts, andefforts to economize on power or labor (because the requirements ofboth these inputs per unit of output rise with the speed used for a givencount). The growth in labor usage results from higher breakage rates asspindle speed is raised. The potential for carefully discriminating amongthese alternative sources of divergence is one of the benefits of the inter-view process undertaken as part of this study, although it remains neces-sary to check answers for consistency and to avoid accepting theoccasional glib response at face value.
If the quality of roving used in spinning is not sufficiently high-forexample, as a result of insufficient blending of fibers in the openingprocess or because of deficiencies in the preceding processing stages-astronger yarn can nevertheless be manufactured by imparting a higherthan normal twist to the sliver as it is spun. (For a discussion of these andrelated issues, see Hance 1965 and Lord 1981, chap. 8). A larger number oftwists per inch is obtained by slowing the speed of the front roller of thedrafting system that supplies yarn to the spindle, which itself continues tooperate at a fixed speed. The slowing of the roller reduces output inproportion to the increase in the number of twists per inch (see equation2-1) and is here considered an x-inefficient practice if it is attributable todeficient blending. There is an optimal level of twist, however, beyondwhich yarn strength actually declines and thus sets limits on the correc-tion possible at this stage.
Higher-than-usual levels of T may reflect factor substitution rather thanx-inefficiency. A decrease in the average length of the cotton fiber used,for example, from one and one-quarter inches to one inch, normallyreduces the strength of the yarn produced. It is possible, however, tooffset this effect partly by increasing the twist multiple.2 Because anincrease in the number of twists per inch reduces output proportionally,
SPINNING 19
the purchase of less expensive short fibers represents a substitution oflabor and capital for (quality-adjusted) fiber. When this practice increasesthe average cost of production, it is allocatively inefficient. In the fewcases in the empirical work described in the following chapters in whichexcessive twist multiples are found, only a small part of the excess is dueto poor fiber; it is generally attributable to deficient practices in otherrespects-for example, to inadequate blending.3
Spindle, or machine, efficiency indicates the percentage of each hourduring which the spindles are actually spinning and not stopped for repairof a broken end or for some other reason.4 An increase in the rate atwhich yarns break will, at a given labor-spindle ratio, result in an equalpercentage decrease in the average product of labor and equipment; mostoften the output per spindle is partly restored by increasing the labor-spindle ratio. Other reasons why efficiency may fall below 100 percentinclude the stopping of the spindle when the filled bobbin needs to beremoved (doffed), replacement of the doffed bobbin, unscheduled main-tenance, and alteration of ring-frame settings. Although the time takenfor doffing and replacing bobbins is usually quite small and is an inherentpart of the production process, unscheduled maintenance and frequentalteration of machine settings (for example, to change the tension towhich yarn is subjected) can significantly affect spindle efficiency andconstitute one source of interfirm and intercountry variation in total-factor productivity.
The productivity losses from lower spindle efficiency just discussed areunrelated to those stemming from more twists per inch and from speedslower than the standard. Equation 2-1 shows that the three factors actmultiplicatively to reduce total-factor productivity.
FACTOR SUBSTITUTION. As breakage rates rise above a desired level,firms may attempt to maintain spindle efficiency by adding spinners toexisting frames, a practice that reduces the time it takes to notice andrepair a broken yarn.5 When an end breaks, the affected spindle is auto-matically stopped by a sensing device and (unlike others on the sameframe) remains idle until the spinner, who is patrolling perhaps a thousandspindles along thirty or forty yards of ring frame, notices it, repairs thebreak with a simple knot, and restarts it. The time during which a spindleis stopped pending attention from the spinner is called machine inter-ference.
Achievable levels of efficiency (the percentage of time during which aspindle is spinning) can be calculated from standard machine interferencetables; they depend on the number of end breaks, b, the machine-workerratio, k, patrol speed, p (the time it takes the spinner to walk around the
20 COTTON TEXTILE PRODUCTION
set of frames he or she is tending), and rest time. Given the spindle-laborratio initially adopted, and b and p, the potential level of spindle effi-ciency can be calculated. In this book, observed efficiency rates belowthis potential are attributed to x-inefficient practices. The relationshipbetween k, b, p, and e permits choices to be made about factor propor-tions even after a specific type of equipment has been installed. Efficiencyis partly a function of the machine-worker ratio and is an endogenouseconomic variable, ultimately depending on factor prices and engineeringsubstitution possibilities. Speed is also partly endogenous; firms facinglow wage rates may operate at high speeds and may employ additionalworkers to repair the excessive breaks occasioned by high speeds.
The expression for the optimal spindle assignment per worker(K/L) = k that a cost-minimizing firm would choose can be shown to be
(2-2) k = 2w/bp
where w is the hourly wage and r the hourly user cost of a spindle.6
This rule is derived by expressing unit cost in terms of the cost ofcapital, labor, and material waste as well as technical parameters such asthe breakage rate and patrol time and then determining the value of k thatminimizes unit cost. An increase in the breakage rate thus provides anincentive for raising the labor-capital ratio. The optimal level of efficiencyimplied in equation 2-2 can then be found from
(2-3) e= h-bkp
where h is a constant depending on a number of technical parameters.The cost-minimizing level of efficiency falls with an increase in k as
e/dak = - bp(b,p > 0) and with an increase in b as ae/db = - kp(k,p > 0).7 In interfirm comparisons in Kenya and the Philippines, firmsnot achieving their lowest cost factor proportion according to equation2-2 are considered to be allocatively inefficient.
OTHER CONSIDERATIONS. The discussion so far has implied that, giventhe speed of spindles, the rate of end breaks (and yarn quality moregenerally) is a given for the firm. This is too simple a view. Yarn charac-teristics, such as the number of thick and thin spots, affect the breakagerate and can be altered: greater expenditures on the quality of raw fiber,maintenance, humidity control, the determination of proper machine set-tings, and quality control can all improve the attributes of yarn produced.8
If lower end breakage rates can be achieved, productivity will rise, par-ticularly in spinning proper. Indeed, almost all deficiencies in activitiesaffecting yarn quality manifest themselves in shortfalls in spinning pro-
SPINNING 21
ductivity rather than in the preparatory processes from opening throughroving.
Thus the decision on the optimal level of spindles per spinner is moreadequately understood as one part of what should be a simultaneousdecision problem, namely, the joint determination of optimal yarn qualityand the cost-minimizing capital-labor ratio. The analysis in the followingchapters takes the quality level as a given and attributes to it part of thedeviation from best-practice TFP. Whether firms have made correct deci-sions that minimize firmwide costs is left open-I do not inquire intowhether additional outlays on maintenance or quality control would raiseor lower average production costs. The discussions that follow do indi-cate some opportunities of this kind, but as I indicated earlier, analyzingthem would require a degree of disaggregation that is beyond the scope ofthis study. The issue is of considerable importance, however, and I willreturn to it in chapter 7.
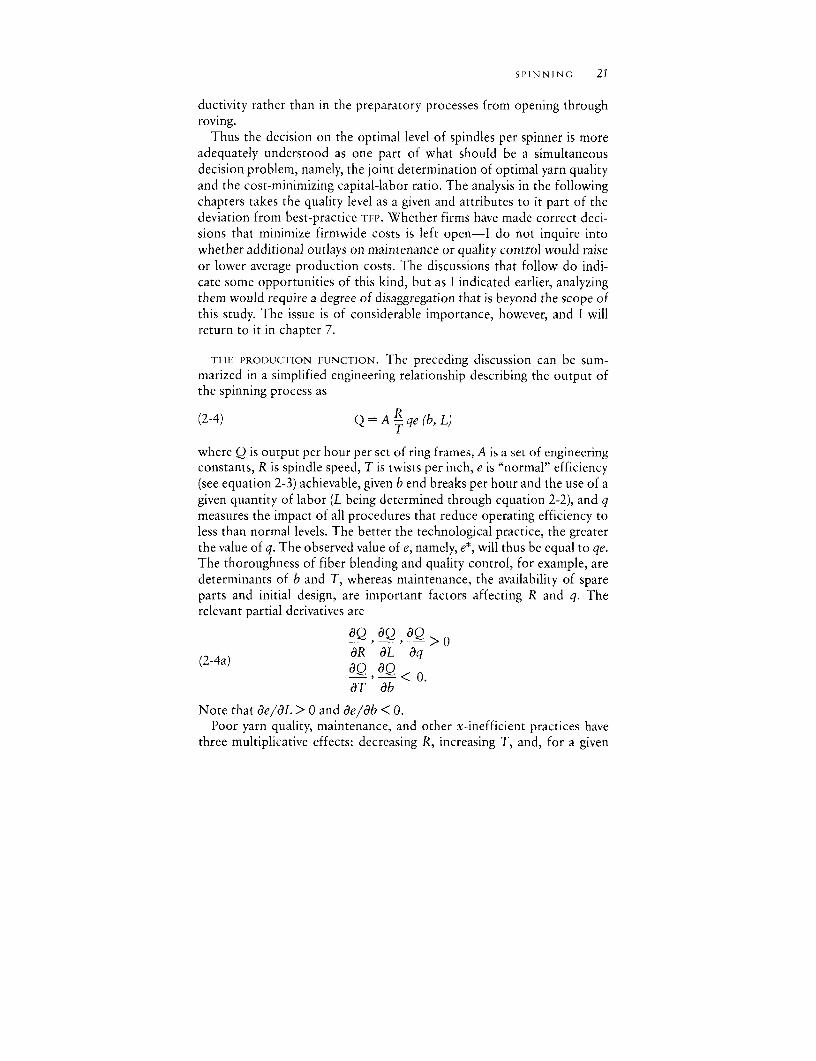
THE PRODUCTION FUNCTION. The preceding discussion can be sum-marized in a simplified engineering relationship describing the output ofthe spinning process as
(2-4) Q = A R qe (b, L)
where Q is output per hour per set of ring frames, A is a set of engineeringconstants, R is spindle speed, T is twists per inch, e is "normal" efficiency(see equation 2-3) achievable, given b end breaks per hour and the use of agiven quantity of labor (L being determined through equation 2-2), and qmeasures the impact of all procedures that reduce operating efficiency toless than normal levels. The better the technological practice, the greaterthe value of q. The observed value of e, namely, e*, will thus be equal to qe.The thoroughness of fiber blending and quality control, for example, aredeterminants of b and T, whereas maintenance, the availability of spareparts and initial design, are important factors affecting R and q. Therelevant partial derivatives are
OQ,OQ,OQ >0
(2-4a) aR dL aq
aT ab
Note that ae/lL > 0 and de/OEb < 0.Poor yarn quality, maintenance, and other x-inefficient practices have
three multiplicative effects: decreasing R, increasing T, and, for a given
22 COTTON TEXTILE PRODUCTION
level of labor, decreasing efficiency as ae/cb < 0. Technical problemsaffecting R, T, or b (before any movement along the production functionaccording to equation 2-2) reduce the average product of labor and capitalin equal proportions-that is, they are factor neutral.
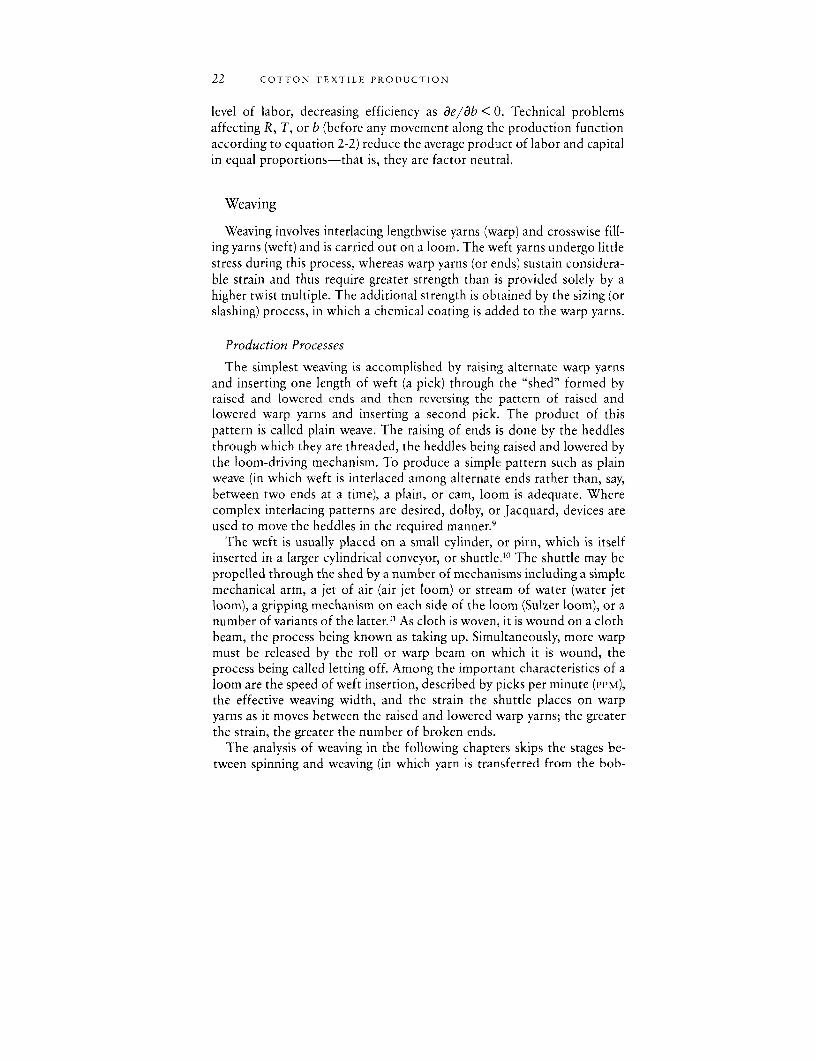
Weaving
Weaving involves interlacing lengthwise yarns (warp) and crosswise fill-ing yarns (weft) and is carried out on a loom. The weft yarns undergo littlestress during this process, whereas warp yarns (or ends) sustain considera-ble strain and thus require greater strength than is provided solely by ahigher twist multiple. The additional strength is obtained by the sizing (orslashing) process, in which a chemical coating is added to the warp yarns.
Production Processes
The simplest weaving is accomplished by raising alternate warp yarnsand inserting one length of weft (a pick) through the "shed" formed byraised and lowered ends and then reversing the pattern of raised andlowered warp yarns and inserting a second pick. The product of thispattern is called plain weave. The raising of ends is done by the heddlesthrough which they are threaded, the heddles being raised and lowered bythe loom-driving mechanism. To produce a simple pattern such as plainweave (in which weft is interlaced among alternate ends rather than, say,between two ends at a time), a plain, or cam, loom is adequate. Wherecomplex interlacing patterns are desired, dolby, or Jacquard, devices areused to move the heddles in the required manner.9
The weft is usually placed on a small cylinder, or pirn, which is itselfinserted in a larger cylindrical conveyor, or shuttle."' The shuttle may bepropelled through the shed by a number of mechanisms including a simplemechanical arm, a jet of air (air jet loom) or stream of water (water jetloom), a gripping mechanism on each side of the loom (Sulzer loom), or anumber of variants of the latter.1" As cloth is woven, it is wound on a clothbeam, the process being known as taking up. Simultaneously, more warpmust be released by the roll or warp beam on which it is wound, theprocess being called letting off. Among the important characteristics of aloom are the speed of weft insertion, described by picks per minute (PPM),
the effective weaving width, and the strain the shuttle places on warpyarns as it moves between the raised and lowered warp yarns; the greaterthe strain, the greater the number of broken ends.
The analysis of weaving in the following chapters skips the stages be-tween spinning and weaving (in which yarn is transferred from the bob-
WEAVING 23
bins on which it is spun to smaller ones used in weft supply or to largerones used to form warp supplies). Also omitted are sizing and beaming(the placing of warp yarns on a large roller). The reason for omitting thesestages is the large number of separate operations, the very large number ofalternative processes, the importance of chemical skills in some activities(for example, in sizing), and, most important, the relatively small percent-age of total production costs accounted for by the steps of weavingpreparation. For a typical fabric the combined costs of the preparatoryprocesses, such as sizing and beaming, amount to less than 20 percent ofthe cost of weaving itself.
Finally, this book leaves open the question of the proper degree ofintegration of spinning and weaving operations. With the exception of afew plants, notably those employing open-end spinning to produce largebobbins of low-count yarn for denim production, most textile mills inKenya and the Philippines are vertically integrated, including not onlyspinning and weaving but finishing as well. A substantial body of opinionasserts that integrated plants in developed countries are less efficient thanspecialized spinners or weavers; some of the arguments are presented inTextile Council (1969). Whether specialist spinning and weaving mills leadto a lower unit cost in weaving will obviously depend, among other things,on the organization and transportation costs of shipping spun yarn be-tween physically separate factories. Although the issue raises some inter-esting questions that have recently been the basis for imaginative work ineconomic history (Lazonick 1981), the present book omits it because ofspace limitations.
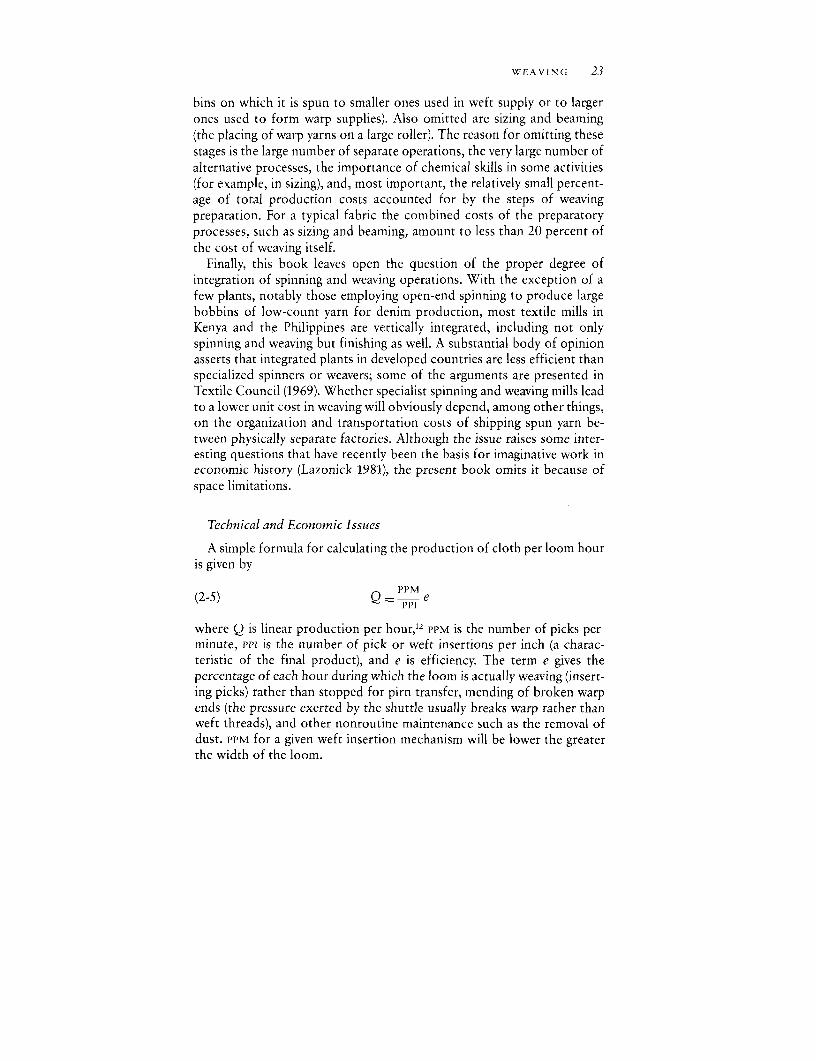
Technical and Economic Issues
A simple formula for calculating the production of cloth per loom houris given by
(2-5) Q = PPM e
where Q is linear production per hour,12 PPM is the number of picks perminute, PPi is the number of pick or weft insertions per inch (a charac-teristic of the final product), and e is efficiency. The term e gives thepercentage of each hour during which the loom is actually weaving (insert-ing picks) rather than stopped for pirn transfer, mending of broken warpends (the pressure exerted by the shuttle usually breaks warp rather thanweft threads), and other nonroutine maintenance such as the removal ofdust. PPM for a given weft insertion mechanism will be lower the greaterthe width of the loom.
24 COTTON TEXTILE PRODUCTION
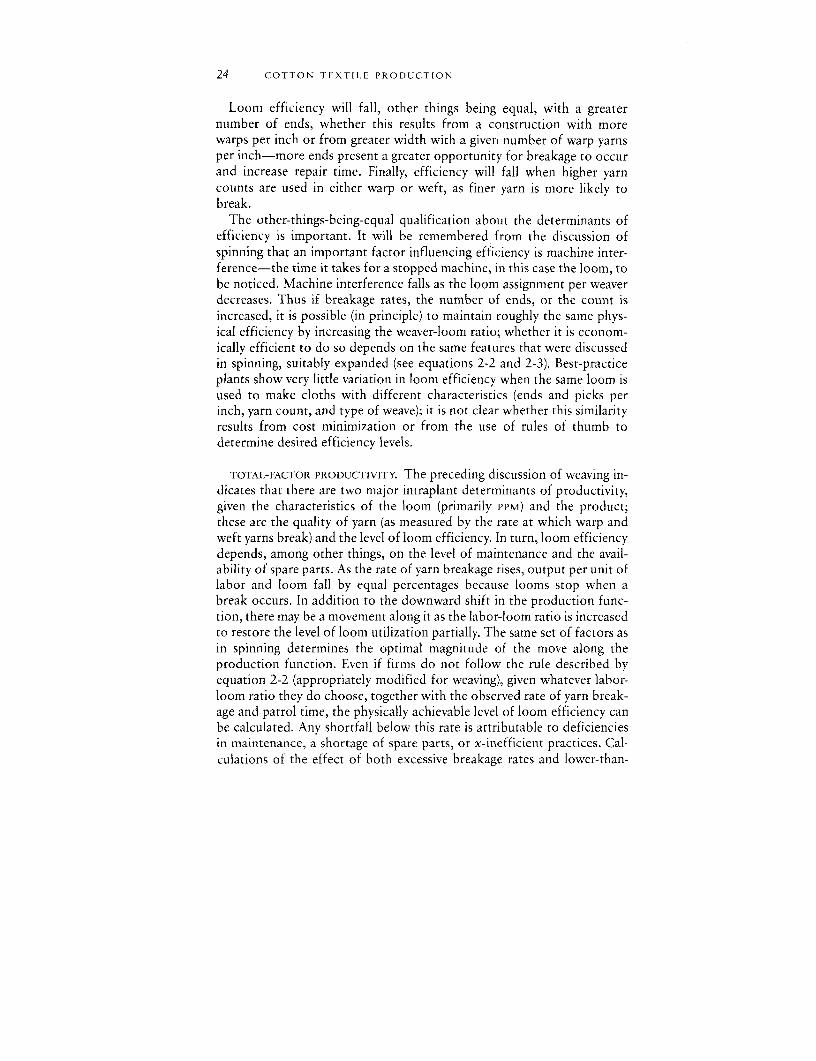
Loom efficiency will fall, other things being equal, with a greaternumber of ends, whether this results from a construction with morewarps per inch or from greater width with a givern number of warp yarnsper inch-more ends present a greater opportunity for breakage to occurand increase repair time. Finally, efficiency will fall when higher yarncounts are used in either warp or weft, as finer yarn is more likely tobreak.
The other-things-being-equal qualification about the determinants ofefficiency is important. It will be remembered from the discussion ofspinning that an important factor influencing efficiency is machine inter-ference-the time it takes for a stopped machine, in this case the loom, tobe noticed. Machine interference falls as the loom, assignment per weaverdecreases. Thus if breakage rates, the number of ends, or the count isincreased, it is possible (in principle) to maintain roughly the same phvs-ical efficiency by increasing the weaver-loom ratio; whether it is econom-ically efficient to do so depends on the same features that were discussedin spinning, suitably expanded (see equations 2-2 and 2-3). Best-practiceplants show very little variation in loom efficiency when the same loom isused to make cloths with different characteristics (ends and picks perinch, yarn count, and type of weave); it is not clear whether this similarityresults from cost minimization or from the use of rules of thumb todetermine desired efficiency levels.
TOTAL-FACTOR PRODUCTIVITY. The preceding discussion of weaving in-dicates that there are two major intraplant determinants of productivity,given the characteristics of the loom (primarily PPM) and the product;these are the quality of yarn (as measured by the rate at which warp andweft yarns break) and the level of loom efficiency. In turn, loom efficiencydepends, among other things, on the level of maintenance and the avail-ability of spare parts. As the rate of yarn breakage rises, output per unit oflabor and loom fall by equal percentages because looms stop when abreak occurs. In addition to the downward shift in the production func-tion, there may be a movement along it as the labor-loom ratio is increasedto restore the level of loom utilization partially. The same set of factors asin spinning determines the optimal magnitude of the move along theproduction function. Even if firms do not follow the rule described byequation 2-2 (appropriately modified for weaving), given whatever labor-loom ratio they do choose, together with the observed rate of yarn break-age and patrol time, the physically achievable level of loom efficiency canbe calculated. Any shortfall below this rate is attributable to deficienciesin maintenance, a shortage of spare parts, or x-inefficient practices. Cal-culations of the effect of both excessive breakage rates and lower-than-
WEAVING 25
achievable levels of loom efficiency are used in later chapters to explainthe discrepancy between actual productivity and best-practice productiv-ity in operating plants. The effects of observed changes in the capital-labor ratio engendered by both differential breakage rates and wage-rentalratios are incorporated as movements along the production function. Iffirms do not follow this rule, the calculations attribute part of their excesscost to allocative inefficiency.
OUTPUT QUALITY AND FACTOR SUBSTITUTION. Several of the technicalfeatures of the weaving process need to be examined if we are to under-stand issues other than those directly affecting TFP. Of the myriad tech-nical questions that arise, those selected for consideration here aregenerally acknowledged to be critical in determining economic efficiency,including the question of appropriate factor proportions.
When a pirn containing weft yarn is exhausted, the loom stops, and theweft is replenished manually on a semiautomatic loom; in an automaticloom, a sensing device called a feeler determines the need to move a new,full pirn into weaving position. Automatic pirn changing can significantlyreduce unit labor requirements and can raise quality. Automatic loomshave been available since the early part of the twentieth century and havelargely displaced semiautomatic looms in developed countries except inthe production of some special cloths. In some developing countries, suchas the Republic of Korea and India, semiautomatics remain in use and areeven made locally."3 The two types of looms present well-defined tech-nologies with different capital-labor ratios.
A critical issue in evaluating the economic merit of different types oflooms is the effect of starting marks that may occur when an empty pirn ischanged. In automatic looms, it is possible to avoid any starting markswhen a depleted pirn is replaced by a full one, as the feeler senses theimminent exhaustion of the weft and orders the shuttle transfer mecha-nism to move a replacement pirn into place. If an automatic loom's feeleris incorrectly connected, it may leave a starting mark when a replacementis needed. Even where a correctly functioning changing mechanism exists,there will still be a flaw (a mispick) when a break in yarn occurs; thusautomatic looms do not guarantee cloth of better quality unless mispicksare kept low, which in turn requires high-quality yarn.
In contrast, each time a pirn runs out of yarn in a semiautomatic loomthere is the potential for a flaw as the shuttle crosses the shed oncewithout inserting any weft while the woven fabric on the cloth beam ismoved up one pick and the let-off roll also moves one pick. Experiencedweaving managers claim that defects are not inevitable when semi-automatic looms are being used; a skilled weaver will generally anticipate
26 COTTON TEXTILE PRODUCTION
actual pirn depletion, stop the loom, and replace the almost empty pirn.Even if the pirn does run out, it is possible for an able weaver to adjust thelet-off and take-up rolls so that the pick with an empty pirn will not causea starting flaw. Nevertheless, it is acknowledged that these operations(sensing a nearby empty pirn and adjusting the warp or cloth beams)require substantial experience, diligence, and dexterity. Thus an auto-matic loom may substitute capital (in the form of a. somewhat higher pricefor the feelers and automatic changing mechanism) for skilled labor, andthe competitiveness of the semiautomatic loom, at least in producinghigh-quality cloth, will be contingent on the availability of inexpensive,highly skilled labor.
More generally, the relevance of concern about starting places is ques-tionable: starting places may be noticeable where a single color finishing isused but are not readily discernible in a printed pattern. In many develop-ing countries, printed goods constitute the overwhelming majority ofproducts destined for the domestic market, and printed fabrics with weav-ing starting marks are not normally lower in priice.14 If semiautomaticlooms yielded lower-cost fabric production, there would be a prima facie,static efficiency case for using them, though questions about the develop-ment of the quality consciousness necessary for successful exportingmight still arise in a dynamic framework. Even here, however, if the onlydefects associated with semiautomatic looms were starting places, a mar-keting program for printed cloth might yield substantial sales and mightpermit expanded use of labor-intensive technology.
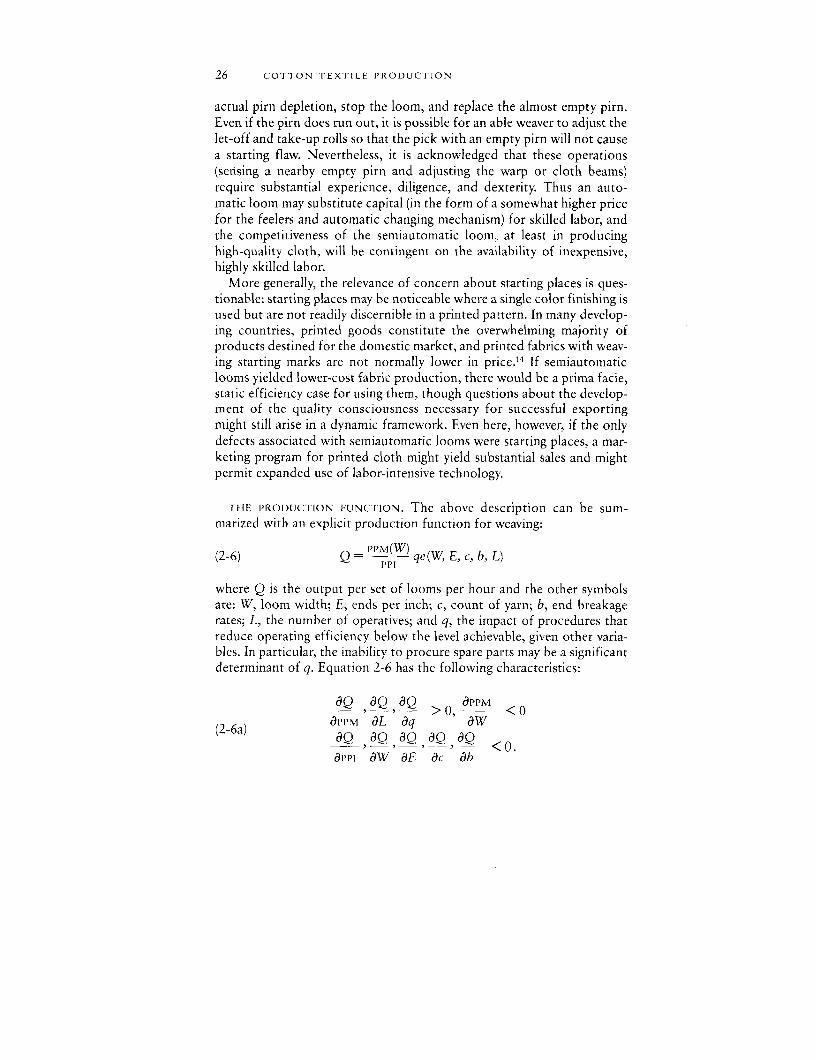
THE PRODUCTION FUNCTION. The above description can be sum-marized with an explicit production function for vveaving:
(2-6) Q = M(W) qe(W, E, c, b, L)
where Q is the output per set of looms per hour and the other symbolsare: W, loom width; E, ends per inch; c, count of yarn; b, end breakagerates; L, the number of operatives; and q, the impact of procedures thatreduce operating efficiency below the level achievable, given other varia-bles. In particular, the inability to procure spare parts may be a significantdeterminant of q. Equation 2-6 has the following characteristics:
OQ dQ dQ > O dPPM <O(2-6a) apPM dL aq aw
,Q Q_QOQ_,Q <0.apPI aW OE ac db
SPECIALIZATION 27
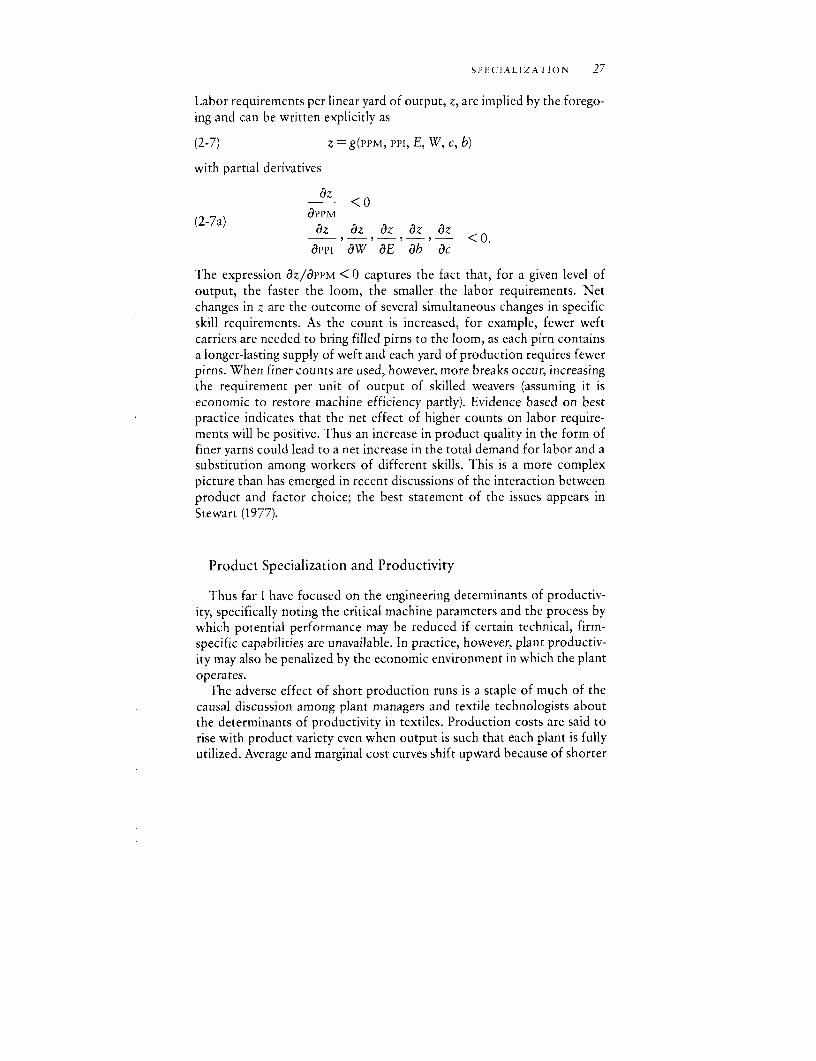
Labor requirements per linear yard of output, z, are implied by the forego-ing and can be written explicitly as
(2-7) z = g(PPM, PPI, E, W, c, b)
with partial derivatives
dz < 0
(2-7a) Oppm(az dz dz dz dz,___ -,--,_,_ <0.
appi aW aE ab ac
The expression oz/aPPM < 0 captures the fact that, for a given level ofoutput, the faster the loom, the smaller the labor requirements. Netchanges in z are the outcome of several simultaneous changes in specificskill requirements. As the count is increased, for example, fewer weftcarriers are needed to bring filled pirns to the loom, as each pirn containsa longer-lasting supply of weft and each yard of production requires fewerpirns. When finer counts are used, however, more breaks occur, increasingthe requirement per unit of output of skilled weavers (assuming it iseconomic to restore machine efficiency partly). Evidence based on bestpractice indicates that the net effect of higher counts on labor require-ments will be positive. Thus an increase in product quality in the form offiner yarns could lead to a net increase in the total demand for labor and asubstitution among workers of different skills. This is a more complexpicture than has emerged in recent discussions of the interaction betweenproduct and factor choice; the best statement of the issues appears inStewart (1977).
Product Specialization and Productivity
Thus far I have focused on the engineering determinants of productiv-ity, specifically noting the critical machine parameters and the process bywhich potential performance may be reduced if certain technical, firm-specific capabilities are unavailable. In practice, however, plant productiv-ity may also be penalized by the economic environment in which the plantoperates.
The adverse effect of short production runs is a staple of much of thecausal discussion among plant managers and textile technologists aboutthe determinants of productivity in textiles. Production costs are said torise with product variety even when output is such that each plant is fullyutilized. Average and marginal cost curves shift upward because of shorter
28 COTTON TEXTILE PRODUCTION
average production runs as variety increases even though, for a givenproduct mix and for a given plant and labor force, average cost maydecline as fuller utilization occurs. Conversely, longer average productionruns shift the cost curves downward. The precise engineering bases forpostulating these upward shifts are rarely specified, but they appear to bea combination of optimal batch size and the cost of attaining routinizedproduction.
Part of the upward shift in cost curves is attriburable to increased setuptimes. If a count is to be changed in spinning, roller speeds, which deter-mine the amount of draft (sliver attenuation), must be adjusted fromdrawframes through ring spindles. Even with good mechanics, the processcan be time consuming; meanwhile operatives and equipment are idle.Setup time assumes even greater importance in weaving, where an entirewarp beam may be changed when a new pattern is to be woven and theends of the new beam must be tied through the heddles. If frequentproduct changes occur, setup time significantly reduces productivity rela-tive to best practice. There is an irreducible level of setup costs, however,even without frequent pattern changes, for example when an exhaustedwarp beam must be changed. Short production runs are viewed as a majorsource of the lower productivity of U.K. plants relative to their counter-parts in the United States (Textile Council 1969) and are clearly an impor-tant cause of lower productivity in plants in Kenya and the Philippinesrelative to plants in the United Kingdom.
Despite the importance of setup costs, it seems likely that the highercosts associated with short production runs arise mainly from the need tobe almost continually learning about, and reacting to, processing prob-lems that would become routine in longer production runs. Considerspinning. It will be shown in chapter 6 that many mills are careless withrespect to the blending of fibers and have limited proficiency in qualitycontrol. Under these conditions, switching to a new count will reduceproductivity even more than it would in the presence of greater skills inthese areas. Problems with strength and uniformity, which would benoted immediately in a plant with good quality control, will be noticedonly with a lag, and correcting them will therefore take longer. Before thecorrection occurs, the productivity-depressing effects will have been feltin the form of a greater number of end breaks. When longer productionruns prevail, however, a larger percentage of outpuit is produced after thenecessary corrections have been made, and this output is manufacturedunder routine conditions that permit higher productivity. Similar argu-ments hold for weaving.
These problems undoubtedly explain the attempt by many U.S. textilemills to produce no more than two or three yarn counts and a similar
SPECIFICATION 29
number of fabric types over the course of a year. In contrast, it was notuncommon for the firms that I visited to have ten or twelve yarn counts (aproblem worsened by constantly changing mixtures of cotton and syn-thetic fibers) and forty to sixty cloth types.
The following statement explains why U.K. firms are less productivethan those in the United States and aptly summarizes the discussion so far:
Such changes (in count or cloth) present technical and organizationalproblems which strain the ability of the staff and work people to copewith them. When staff at all levels can concentrate on the productionof a very limited number of products, the smallest details can receiveattention and be brought to near perfection. Production planning be-comes relatively easy. Time and effort which would be widely un-economic in normal circumstances can be justified if the volume ofproduction is sufficiently great. (Textile Council 1969, vol. 1, p. 72.)
This remark suggests that an improvement in technical managementthat provides better quality control (faster identification and correctionof problems) could offset some of the adverse effects of product diver-sity.15 Hence plants in two economies might have differing levels of total-factor productivity-even though they had the same domestic market sizeand similar levels of protection-if one of them had expended moreeffort than the other on augmenting firm-level technological capabilities.
Saxonhouse and Wright (1984) have shown that Japanese textile firmsput considerable effort into mixing, operative training, and supervision inthe early stages of their development and thus obtained higher productiv-ity with low-quality domestic cotton fiber than would otherwise havebeen possible. Such care throughout the production cycle can reduce theproblems arising from constant changes in product specification but willnot eliminate them.
Product Specification and Factor Proportions
Much attention has recently focused on how the choice of productcharacteristics affects optimal factor proportions (Stewart 1977). Thistopic is not addressed systematically in subsequent chapters, but some ofthe relevant issues are considered here. In both spinning and weaving,different product specifications lead to variations in the best-practicecapital-labor ratio for a given technology, such as a conventional auto-matic loom. Factor proportions may also vary when different tech-nologies are used to make an identical product, the conventional issue inthe choice of technology debate. The magnitude of the range in factor
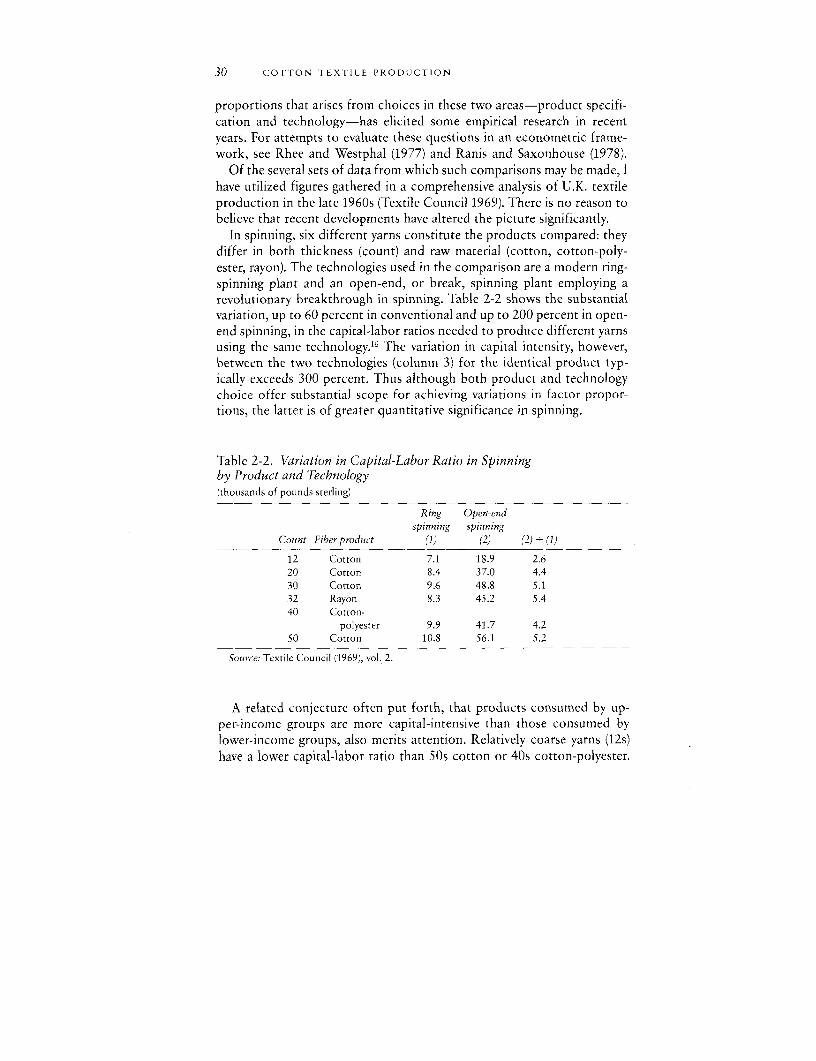
30 COTTON TEXTILE PRODUCTION
proportions that arises from choices in these two areas-product specifi-cation and technology-has elicited some empirical research in recentyears. For attempts to evaluate these questions in an econometric frame-work, see Rhee and Westphal (1977) and Ranis and Saxonhouse (1978).
Of the several sets of data from which such comparisons may be made, Ihave utilized figures gathered in a comprehensive analysis of U.K. textileproduction in the late 1960s (Textile Council 1969). There is no reason tobelieve that recent developments have altered the picture significantly.
In spinning, six different yarns constitute the products compared: theydiffer in both thickness (count) and raw material (cotton, cotton-poly-ester, rayon). The technologies used in the comparison are a modern ring-spinning plant and an open-end, or break, spinning plant employing arevolutionary breakthrough in spinning. Table 2-2 shows the substantialvariation, up to 60 percent in conventional and up to 200 percent in open-end spinning, in the capital-labor ratios needed to produce different yarnsusing the same technology.16 The variation in capital intensity, however,between the two technologies (column 3) for the identical product typ-ically exceeds 300 percent. Thus although both product and technologychoice offer substantial scope for achieving variations in factor propor-tions, the latter is of greater quantitative significance in spinning.
Table 2-2. Variation in Capital-Labor Ratio in Spinningby Product and Technology(thousands of pounds sterling)
Ring Open-endspinning spinning
Count Fiber product (1) (2) (2) - (1)
12 Cotton 7.1 18.9 2.620 Cotton 8.4 37.0 4.430 Cotton 9.6 48.8 5.132 Rayon 8.3 45.2 5.440 Cotton-
polyester 9.9 41.7 4.250 Cotton 10.8 56.1 5.2
Source: Textile Council (1969), vol. 2.
A related conjecture often put forth, that products consumed by up-per-income groups are more capital-intensive than those consumed bylower-income groups, also merits attention. Relatively coarse yarns (12s)have a lower capital-labor ratio than 50s cotton or 40s cotton-polyester.
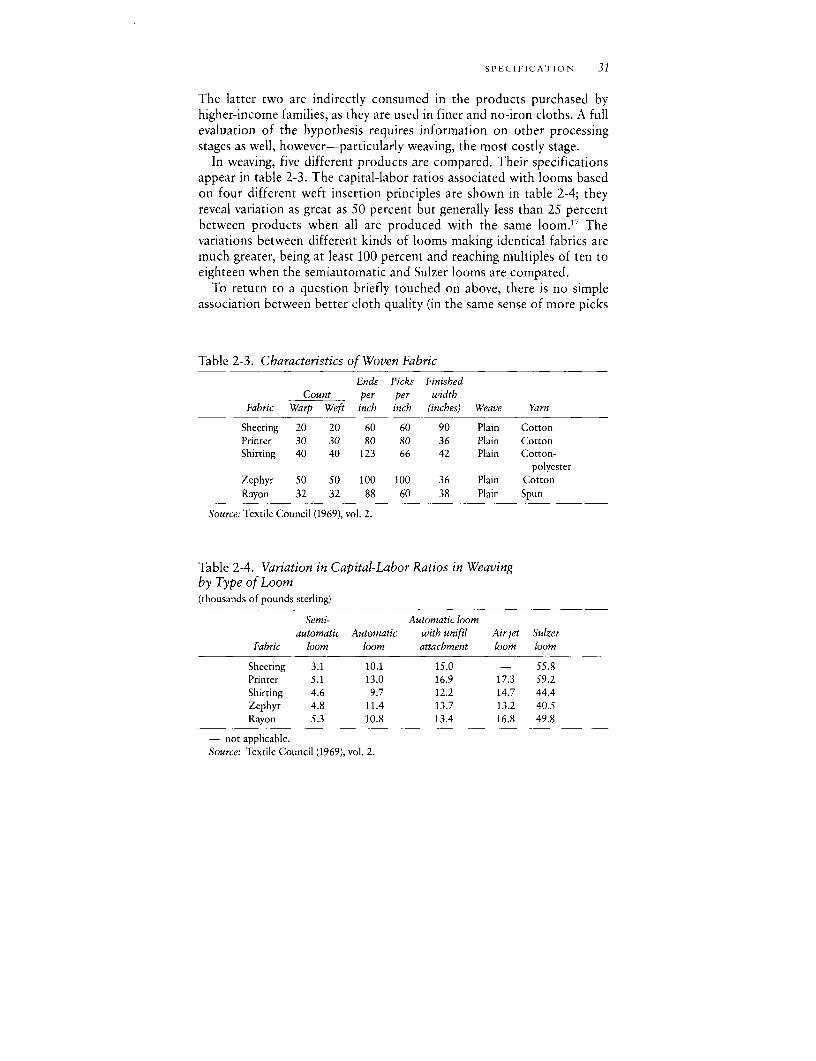
SPECIFICATION 31
The latter two are indirectly consumed in the products purchased byhigher-income families, as they are used in finer and no-iron cloths. A fullevaluation of the hypothesis requires information on other processingstages as well, however-particularly weaving, the most costly stage.
In weaving, five different products are compared. Their specificationsappear in table 2-3. The capital-labor ratios associated with looms basedon four different weft insertion principles are shown in table 2-4; theyreveal variation as great as 50 percent but generally less than 25 percentbetween products when all are produced with the same loom.17 Thevariations between different kinds of looms making identical fabrics aremuch greater, being at least 100 percent and reaching multiples of ten toeighteen when the semiautomatic and Sulzer looms are compared.
To return to a question briefly touched on above, there is no simpleassociation between better cloth quality (in the same sense of more picks
Table 2-3. Characteristics of Woven Fabric
Ends Picks FinishedCount per per width
Fabric Warp Weft inch inch (inches) Weave Yarn
Sheeting 20 20 60 60 90 Plain CottonPrinter 30 30 80 80 36 Plain CottonShirting 40 40 123 66 42 Plain Cotton-
polyesterZephyr 50 50 100 100 36 Plain CottonRayon 32 32 88 60 38 Plain Spun
Source: Textile Council (1969), vol. 2.
Table 2-4. Variation in Capital-Labor Ratios in Weavingby Type of Loom(thousands of pounds sterling)
Semi- Automatic loomautomatic Automatic with unifil Air jet Sulzer
Fabric loom loom attachment loom loom
Sheeting 3.1 10.1 15.0 - 55.8Printer 5.1 13.0 16.9 17.3 59.2Shirting 4.6 9.7 12.2 14.7 44.4Zephyr 4.8 11.4 13.7 13.2 40.5Rayon 5.3 10.8 13.4 16.8 49.8
- not applicable.Source: Textile Council (1969), vol. 2.
32 COTTON TEXTILE PRODUCTION
and ends per inch and finer yarn count) and greater capital intensity. If, forexample, zephyr and printer cloths are compared, zephyr (the higher-quality cloth) is typically produced with a capital-labor ratio ranging from68 percent to 95 percent of that associated with printer."8 In addition tothe direct capital intensity of the weaving process, the indirect require-ments of the spinning stage must also be considered: the capital-laborratio for the yarn used in zephyr is 13 percent greater than it is for thatused in printer. Taking direct and indirect input requirements together,the total capital intensity for spinning and weaving combined is consider-ably greater for printer. The total capital intensity by cloth type dependson both the type of loom used (because the capital-labor ratio variesamong looms) and the required weight of yarn per square meter of cloth.The ultimate labor and capital requirements for the finished product alsodepend on the finishing process employed; however, because spinning andweaving constitute the two major cost components in textile manufactur-ing, the finishing process will not much alter the results obtaining afterthe first two. In sum, it is difficult to discern any simple relation betweentotal-factor intensity and the importance of particular goods in the con-sumption baskets of different income groups. At the same time, however,the choice of technology, at least in spinning and weaving, significantlyaffects the direct employment generated by a given investment.
Two additional observations may be made. First, the capital and laborcoefficients that form the basis for the figures in table 2-4 are those ofbest-practice plants in a developed country. Operational differences be-tween plants could alter the relationship between factor intensity andsuch product characteristics as count and picks per inch if operations thatwere important in producing one or another characteristic were poorlycarried out. Second, the introduction of still other product charac-teristics, such as more complex weaves that require Jacquard, or dolby,looms, could alter the weaving results, though it is not clear that thepattern described above would be reversed.
Notes
1. For elaboration of the technical activities in spinning, the interested reader may consultHamby (1966), vol. 1, chaps. 6-10, and Lord (1981), chaps. 11 and 12.
2. Lord (1981). In India it is apparently common practice to increase the number of twistsper inch to compensate for poor fiber.
3. The length of fiber and other fiber attributes were among the data collected in the plantinterviews. The attribution of excessive twist multiples to causes other than poor fiber reflectspartly the results of standard quality-control tests at each stage where these are performedand, where they were not available, the judgment of R. Grills, a textile engineer from the
NOTES 33
Shirley Institute who accompanied me on all plant visits. Thus the basis for the attributionbetween x-inefficiency and cost-minimizing responses is partly subjective. It is worth empha-sizing that no matter how "micro" the research strategy employed, some minimum subjectivejudgment will always be required. The leap of faith in this respect is, I would claim, consider-ably smaller than that required in econometric modeling of secondary data collected on anindustrywide basis.
4. The variations in the rate of machine utilization per hour should not be confused withvariations in the number of hours per week or per year during which a factory utilizes its plantand equipment; the latter may reflect a set of factors different from those discussed here(Betancourt and Clague 1981; Winston 1973). The productivity measures presentedthroughout this book are based on hourly production data, and fluctuations in capacityutilization over the year do not affect the comparison with best practice discussed in chapter 3.
5. High breakage rates may be encountered as spindle speed is increased for a given count orfor a variety of other reasons. The most complete account of the phenomenon in developingcountry mills is that of Subramanian and Garde (1974).
6. Whether firms in fact follow the dictates of this cost-minimizing rule is a questionaddressed in chapter 7. The normative rule is introduced here to indicate the behavioral andtechnical basis of postinstallation variability in factor proportions.
7. For a derivation and discussion of these formulas, see Lord (1981), pp. 532-34, forspinning, and Lord and Mohamed (1976), pp. 319-23, for weaving. Also see Ormerod (1979),chap. 2, and Enrick (1978).
8. Among the best discussions of the relevant issues is that of Subramanian and Garde(1974).
9. For a very clear and detailed account of the weaving process, see Marks and Robinson(1976); also Aitken (1964) and Lord and Mohamed (1976). The best discussion of some of theeconomic issues appears in Ormerod (1979).
10. Exceptions occur in some of the newer looms, in which the weft is not wound ontopirns.
11. Forgood technical discussions of the various looms, see Aitken (1964) and Duxbury andWray (1962).
12. The greater the width of the loom, the larger the area of fabric woven. This is animportant economic consideration, price being a function of total area. Moreover, for someitems, such as sheeting, only wide widths can provide an acceptable product. Loom prices risewith width, though not proportionally. Shuttle speed and picks per minute fall with width, butnot proportionally. In calculations reported in later chapters, differences in the widths oflooms and products have been taken into account so that all inputs are stated on a commonbasis.
13. The semiautomatic loom should not be confused with a hand loom: the former iselectrically powered, and its shuttle speed is quite high. In hand looms, all operations, such aspropelling the shuttle, are done manually. A useful technical discussion of the weft replenish-ment process can be found in Marks and Robinson (1976), chap. 9.
14. There are no durability problems associated with starting places as there are with otherdefects.
15. The effect of increasing product specialization continues to be realized even when quitesubstantial specialization has already occurred, as indicated by the following: "Recently theRendall Company of the USA, for example, announced that it had split one large shed into twosheds of 690 and 550 looms, reduced warp counts from four to two and weft counts from tento three. As a result of these changes, overall productivity increased by 40 percent. Thisexample is no exception. A recent survey of seven of the most modern mills in the UnitedStates, five modernized and two newly built, showed that the trend to fewer yarn counts and
34 COTTON TEXTILE PRODUCTION
fewer fabrics continues. Of the seven plants, only two had more than two warp and weftcounts and they are concentrating on a basic fabric with few changes. In the seven plants,groupings of 500-600 looms have become the norm" (Textile Council 1969, vol. 1, p. 73).
16. The greater capital-labor ratio as the count increases reflects the need for a largernumber of spindles to produce a pound of yarn of higher count. Although the increase in thenumber of spindles per pound is partly offset by the increase in labor requirements occasionedby the higher breakage rate as count increases, the net effect is the measured increase in thecapital-labor ratio.
17. Some of the variation between products is not relevant; for example, sheeting material isnot very suitable for clothing.
18. The lower capital-labor ratio of the finer cloth arises from the fact that the use of higheryarn counts generates more broken ends, so that additional labor is used as firms attempt inpart to restore loom efficiency. The implication is that the requirement for additional weaversoutweighs the negative employment effect of the reduced frequency of weft replenishment.Rhee and Westphal (1977) also find that labor requirements increase with the specificationsusually associated with high-income consumption.
CHAPTER THREE
Best Practiceand the Source of Deviations
from It
THIS CHAPTER discusses the concept of best practice as opposed to"pure" engineering standards and then presents best-practice coefficientsfor spinning and weaving in a developed country environment. The data Ihave collected on input requirements in developing country textile plantsshow that, for plants that are technically similar in terms of the type ofequipment used, developing country operators typically use more of mostinputs per unit of output, that is, they are less physically productive thantheir developed country counterparts. The sources of this difference inproductivity, as we shall see, include factors arising from shortcomings inthe national economy, aspects of industrywide phenomena, features spe-cific to individual firms, and, finally, poor task-level performance of indi-vidual operatives. Unfortunately, there are no independent measures ofthe last item; it is calculated as a residual that may include other possiblesources of low productivity, such as poor measurements of the otherfactors or sources of low productivity that have been totally omitted.
I subsequently present the algebra involved in the actual calculation oftotal-factor productivity of developing country firms relative to theirdeveloped country counterparts as well as the decomposition of the dif-ference into its various sources. Both Cobb-Douglas and constant elas-ticity of substitution (CES) production functions are used as weightingfunctions to make possible some quantification of the relative total-factorproductivity of firms in developed and developing countries.
In addition to international differences in productivity and its sources,I analyze the varying production costs of firms using different tech-nologies within Kenya and the Philippines, present the conceptual frame-work that forms the basis of the interfirm comparisons presented inchapters 4 and 5, and set forth the actual empirical procedures used to
35
36 BEST PRACTICE AND DEVIATIONS
calculate each of the productivity-depressing factors. An appendix ad-dresses the measurement of inputs and the determination of parametervalues used in the calculations. Both the last section and the appendix maybe omitted by the reader not interested in detail.
The Technical Frontier and Best Practice
An isoquant represents an efficient set of technologies. A range ofmachinery is currently available from equipment manufacturers for eachstage of the production process in cotton textiles; each machine or set ofmachines is operated by a group of workers using specific amounts of rawmaterials. The amount of machines, materials, and labor per unit of out-put for a specific technology as envisaged by the equipment producersmay be described as an engineering standard or norm and represents thecurrent technical frontier. Some of the anticipated input-output ratiosprimarily reflect physical laws governing the process; others are also af-fected by economic and social variables such as relative factor prices andthe state of management-labor relations. As will be seen in the followingchapters, the best-practice ratio of machines to output is more nearlyrealized than the analogous labor-output standard. The quanity of outputper card per minute specified in operating manuals by a card manufac-turer, for example, is usually fairly close to its actual productivity on thefactory floor: the wastage rate, required floor space, and kilowatt hours ofelectricity are also generally close to the manufacturer's specifications.
The manning levels suggested by machinery manufacturers are derivedfrom a variety of sources, including their own experimental workshopsand extrapolations of the experience of current users of earlier versions oftheir equipment. Labor-output ratios generated by these observations are,however, not purely technical data reflecting underlying physical imper-atives. Labor productivity in manufacturers' own experimental plants orthe high-productivity plants of their purchasers may reflect the rigor ofthe hiring process, incentive pay systems, supervisory quality, the ability ofmanagement to provide high-quality raw materials, and workers' and man-agers' awareness that they are being observed. Unlike the case of the well-known Chenery engineering production functions for gas flow (Chenery1953), derivable from the laws of chemistry, observed input-output coeffi-cients in textiles will reflect these nonmachine behavioral relations as wellas the physically feasible engineering coefficients. Thus the concept ofbest practice rather than that of engineering norms seems appropriate asthe standard against which to compare operating firms. Best practice
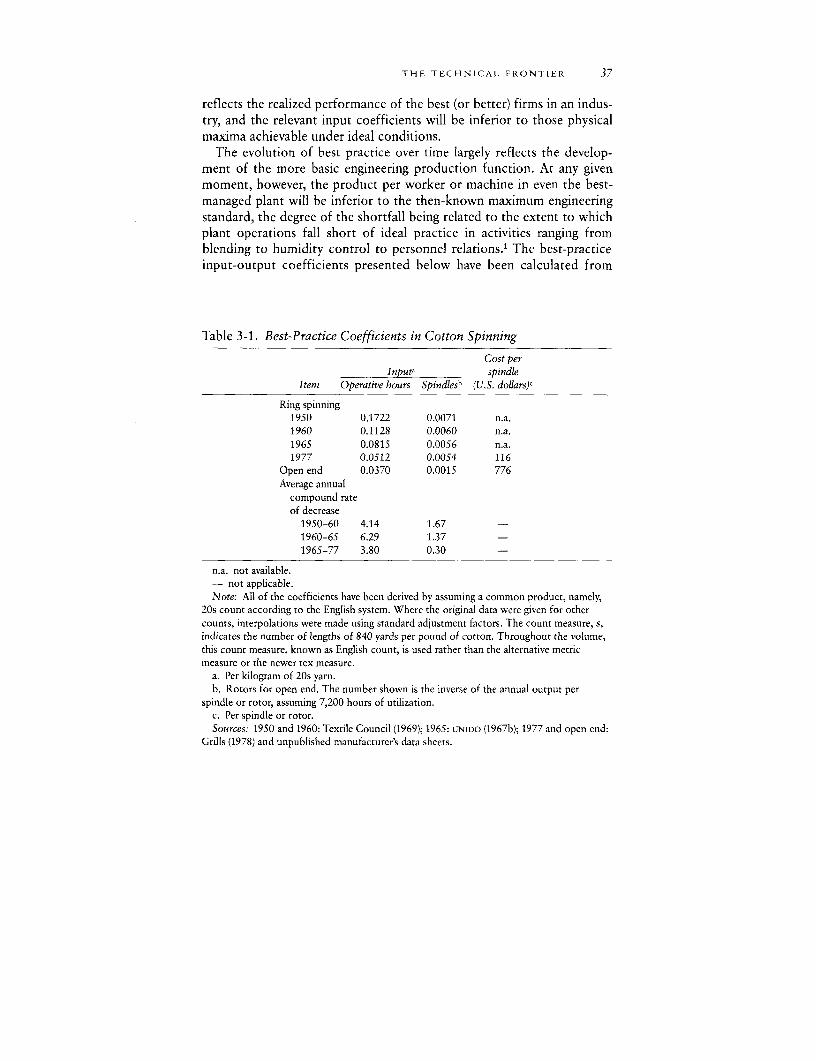
THE TECHNICAL FRONTIER 37
reflects the realized performance of the best (or better) firms in an indus-try, and the relevant input coefficients will be inferior to those physicalmaxima achievable under ideal conditions.
The evolution of best practice over time largely reflects the develop-ment of the more basic engineering production function. At any givenmoment, however, the product per worker or machine in even the best-managed plant will be inferior to the then-known maximum engineeringstandard, the degree of the shortfall being related to the extent to whichplant operations fall short of ideal practice in activities ranging fromblending to humidity control to personnel relations.' The best-practiceinput-output coefficients presented below have been calculated from
Table 3-1. Best-Practice Coefficients in Cotton Spinning
Cost perJnput spindle
Item Operative bours Spindlesb (U.S. dollars),
Ring spinning1950 0.1722 0.0071 n.a.1960 0.1128 0.0060 n.a.1965 0.0815 0.0056 n.a.1977 0.0512 0.0054 116
Open end 0.0370 0.0015 776Average annual
compound rateof decrease
1950-60 4.14 1.67 -
1960-65 6.29 1.37 -
1965-77 3.80 0.30 -
n.a. not available.- not applicable.Note: All of the coefficients have been derived by assuming a common product, namely,
20s count according to the English system. Where the original data were given for othercounts, interpolations were made using standard adjustment factors. The count measure, s,indicates the number of lengths of 840 yards per pound of cotton. Throughout the volume,this count measure, known as English count, is used rather than the alternative metricmeasure or the newer tex measure.
a. Per kilogram of 20s yarn.b. Rotors for open end. The number shown is the inverse of the annual output per
spindle or rotor, assuming 7,200 hours of utilization.c. Per spindle or rotor.Sources: 1950 and 1960: Textile Council (1969); 1965: UNIDO (1967b); 1977 and open end:
Grills (1978) and unpublished manufacturer's data sheets.
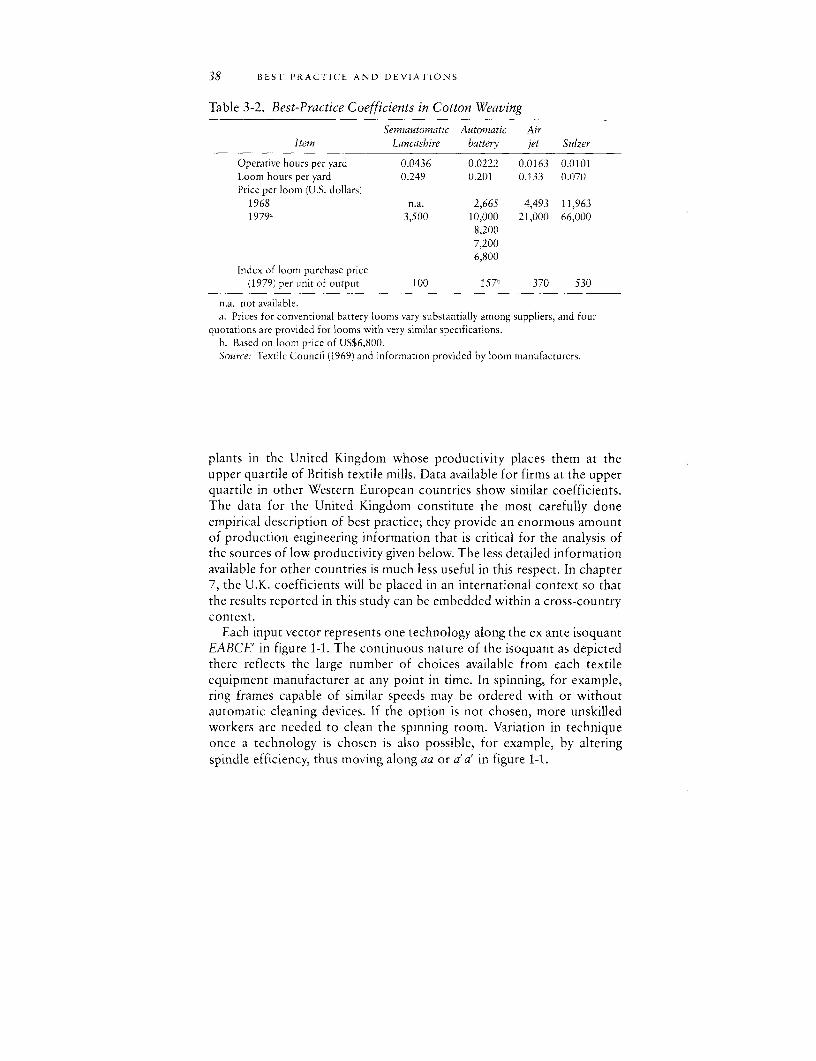
38 BEST PRACTICE AND DEVIATIONS
Table 3-2. Best-Practice Coefficients in Cotton Weaving
Semiautomatic Automatic AirItem Lancashire battery jet Sulzer
Operative hours per yard 0.0436 0.0222 0.0163 0.0101Loom hours per yard 0.249 0.201 0.133 0.070Price per loom (U.S. dollars)
1968 n.a. 2,665 4,493 11,9631979a 3,500 10,000 21,000 66,000
8,2007,2006,800
Index of loom purchase price(1979) per unit of output 100 l57h 370 530
n.a. not available.a. Prices for conventional battery looms vary substantially among suppliers, and four
quotations are provided for looms with very similar specifications.b. Based on loom price of USS6,800.Source: Textile Council (1969) and information provided by loom manufacturers.
plants in the United Kingdom whose productivity places them at theupper quartile of British textile mills. Data available for firms at the upperquartile in other Western European countries show similar coefficients.The data for the United Kingdom constitute the most carefully doneempirical description of best practice; they provide an enormous amountof production engineering information that is critical for the analysis ofthe sources of low productivity given below. The less detailed informationavailable for other countries is much less useful in this respect. In chapter7, the U.K. coefficients will be placed in an internat-ional context so thatthe results reported in this study can be embedded within a cross-countrycontext.
Each input vector represents one technology along the ex ante isoquantEABCE' in figure 1-1. The continuous nature of the isoquant as depictedthere reflects the large number of choices available from each textileequipment manufacturer at any point in time. In spinning, for example,ring frames capable of similar speeds may be ordered with or withoutautomatic cleaning devices. If the option is not chosen, more unskilledworkers are needed to clean the spinning room. Variation in techniqueonce a technology is chosen is also possible, for example, by alteringspindle efficiency, thus moving along aa or a'a' in figure 1-1.
BEST-PRACTICE STANDARDS 39
The Evolution of Best-Practice Standards
Spinning
Table 3-1 presents measures of best-practice unit input requirements inthe United Kingdom for cotton spinning with equipment manufactured infour different years, 1950, 1960, 1965, and 1977. There are a number ofother sources of data for the first three years, and all provide similarestimates of output per spindle and output per man-hour (for example,see UNIDO 1967a and b; ECLA 1951 and 1965). The 1977 norms are thosepresented to prospective purchasers by the engineering department of onemajor producer of textile equipment and are not corroborated by otherevidence. These estimates are consistent with earlier trends, however, andthe norms are considered accurate by textile engineers. The 1965 data arebased on the same company's estimate and thus provide consistency inintertemporal comparisons.
The unit labor requirements (operative hours per kilogram of 20s cot-ton) measure the labor input for the entire spinning process from theopening of bales of cotton fiber to the removal from ring frames ofbobbins of spun yarn; they do not reflect labor used in processes subse-quent to spinning, such as preparation of yarn for weaving. The (physical)capital-output measure, spindles per kilogram, describes only the spinningprocess proper, omitting opening, cleaning, carding, drawing, and roving.Productivity per machine in these activities has roughly increased at thesame rate as in spinning, though some variation exists. The emphasis onspinning proper focuses attention on the essential features of technicalchange while avoiding excessive detail.2
The coefficients shown in table 3-1 are the best-practice norms againstwhich the actual coefficients in developing country spinning plants can becompared. They also provide a capsule summary of the nature of tech-nological change in spinning.
Over the 1950-77 period, operative hours per kilogram in best-practiceplants fell by 70 percent and spindles per kilogram by 23 percent. Thisgrowth in productivity was achieved by continuing progress within abasically unchanged technology and resulted from increased speed,changes in the physical dimensions of some machine components (ringsize) and accessories (cans collecting slivers), and a number of devices thatturned the production sequence into one approaching continuous pro-cessing, thus eliminating workers whose job had been the transfer ofmaterial from one stage to the next. Table 3-1 shows the compound ratesof decrease in the coefficients for various subperiods. It is noteworthythat the labor coefficient continued to fall rapidly throughout the twenty-
40 BEST PIRACTICE AND DEVIATIONS
seven years, though with some variation. Despite the halving of the laborcoefficient between 1950 and 1965, opportunities for further declineswere hardly exhausted even with the conventional technology. In con-trast, the rate of decline in the physical capital coefficient for ring spin-ning has decelerated over the period.
The process of rapid technical innovation characterizing the cottonspinning process did not come to an end, or even slow down, after theremarkable productivity increases in ring spinning in the third quarter ofthe century. A completely new process, developed in the 1960s andknown as open-end (or break) spinning, is now being diffused to operat-ing plants. This process requires a quarter less labor than the 1977 ring-spinning norms and reduces the number of spindles (more precisely, ro-tors) per unit of output by three-quarters, though at a 570 percent in-crease in cost per rotor (table 3-1). Whereas the improved performancelevels between 1950 and 1977 reflect the results of steady advances in aprocess whose basic features would be recognizable to a nineteenth-cen-tury mill owner, open-end spinning initiates an essentially new process.The unit capital requirement should not be compared with those for ringspinning; the change in technology is so radical that the comparison ofspindles and rotors per unit of output is not meaningful in analyzingtechnical evolution. Nevertheless, the almost sixfold difference betweencost per rotor and cost per ring spindle implies that, despite the dramaticchange in technology, the least-cost decision facing textile producerschoosing between the two remains a meaningful one. As with earliertechnical evolution, this innovation does not necessarily yield lower pro-duction costs in developing countries, given their low wages and the highopportunity cost of capital.
Weaving
The major technical developments in weaving, it will be recalled, havebeen in how the weft is replenished as the supply on the pirn currently inuse is exhausted (chapter 2) and the technique of weft insertion. The best-practice input coefficients for shirting are shown in table 3-2 for loomsranging from the Lancashire semiautomatic (electric-powered weft inser-tion but manual replacement of weft supply), to the gripper, or Sulzer,loom. These coefficients capture much of the technical development ofthe last forty years, though this evolution has not been temporally sequen-tial, and new innovations have occurred simultaneously in some cases. Asin spinning, the major quantitative change has been the decrease in laborrequirements, though loom hours per unit of output have also fallensignificantly, mainly because of a faster rate of weft insertion, measured
CROSS-COUNTRY DIFFERENTIALS 41
by picks per minute. Nevertheless, the greater price of the physically moreproductive looms implies that the least-cost technology choice dependson relative factor prices. The input coefficients in table 3-2 and compara-ble ones for woven products with other characteristics are employed asthe best-practice norms. Although input requirements differ for alter-native versions of the various looms, the differences are typically small.
More recent (1976) data on input coefficients in weaving presented in acareful study by Pickett and Robinson indicate that little change hasoccurred in best-practice coefficients except in a few cases, notably air jetlooms, which are slightly faster than 1968 models.3 Moreover, more re-cent information collected for the present volume by the Shirley Instituteof Manchester also suggests relatively little change in best practice sincethe date of the earlier study (the Textile Council 1969), upon which manyof the detailed calculations are based. These issues are also discussedbelow in the present chapter.
A Decomposition of Cross-Country Productivity Differentials
A recurrent feature in the data collected in Kenya and the Philippinesfor this study, as well as in earlier published data on Latin America, is thelower productivity in developing country plants compared with the best-practice ones in developed countries. The difference between productiv-ity (labor productivity is usually emphasized) in developed and developingcountries has often been noted, and several explanations have been of-fered for it.4 These often rely on descriptions of the cultural backgroundor educational characteristics of industrial workers but almost never con-sider the nature of the manufacturing process or economic factors such asthe rationality of using greater labor-capital ratios when lower wage-rentalratios prevail. They emphasize one major obstacle (absence of "modern-ity") in an occasionally tautological way, and the implicit hypotheses arelargely incapable of being tested or quantified. A more fruitful approachinvolves the identification of the most likely major sources of deviationfrom best-practice productivity and the quantification of each of themwhere possible.
A descriptive schema that I have found useful in other industrial anal-yses can also be utilized here (Pack 1981). A firm's productivity may beaffected by (1) conditions determined at the national and industry levels,(2) the managerial capacities of the firm, and (3) the task-level productiv-ity of individual workers. The empirical implementation of the decom-position is discussed below. Productivity is calculated on an hourly basis,and fluctuations in capacity utilization because of seasonal, cyclical, or
42 BEST PRACTICE AND DEVIATIONS
random phenomena such as interruption in electricity supply do notaffect measured productivity.
The National Economy
If productivity is evaluated for a given period such as a month, somefeatures of the national economy will affect the plant: breakdowns in thetransportation system, failures in electricity supply, and other intermittentsources of production delays will lead to fluctuations in capacity utiliza-tion. Even if transient disturbances are omitted and productivity per hourof actual production is calculated, the national economy will impinge onindividual plants. Inadequacies in the educational system, for example,will increase the training costs of firms; this in turn may lead firms toprovide less instruction than they would otherwise and may lower theproductivity of operatives or managers.5
The success of the economy in providing jobs may affect the willingnessof workers to accept rationalization of the production process in terms ofboth general plant reorganization and individual work loads. Nationallabor legislation that limits the ability of firms to fire excess workers, forexample, may adversely affect productivity, whereas management's com-mitment to raising it may be influenced by the structure of existing incen-tives, ranging from those affecting international and domesticcompetition to those determining the terms of loans from the financialsystem.
Despite their number and potential importance, I do not try to quantifythe impact of features of the national economy that affect measuredproductivity for individual firms. Some of them ought not to enter intothe calculations as formulated for this study: for example, the impact ofintermittent interruptions is not relevant, because all comparisons involveoutput per hour and inputs per hour when equipment is in fact operating;annual productivity may be affected significantly by such stoppages but isnot at issue here. Other characteristics of the national economic environ-ment, such as the impact of the protection afforded by trade barriers onthe intensity of worker and managerial effort, are difficult to model, andno attempt has been made to model them. Such omissions may lead to anunexplained difference in productivity between developing country anddeveloped country best-practice plants, which is included in the measuredresidual task-level productivity.
The Industry
Among the industrywide features that can affect plant productivity arethe number of firms in the industry and the resulting intensity of competi-
CROSS-COUNTRY DIFFERENTIALS 43
tion. Competitive imports are largely excluded and do not affect the levelof internal competition in either Kenya or the Philippines. If an industryhas been encouraged by high rates of effective protection to expand itsproductive capacity beyond the requirements of the domestic market butremains unable to produce cheaply enough to export its output, it willoperate at higher than necessary average cost. In Kenya and the Philip-pines, most firms are producing a sufficiently large volume of output thatexcess costs are not attributable to economies of scale in the conventionalsense that average costs decline with increasingly intensive use of fixedfacilities. An important source of high cost, however, is the small scale ofindividual production runs in weaving and the range of yarn counts inspinning. For any given percentage of capacity utilization, unit costs couldbe reduced if the variety of yarns or fabrics produced were decreased.6
ECONOMIES OF SPECIALIZATION. The prevalence of short productionruns, with each firm producing a broad spectrum of products that dupli-cates those of others, presents a puzzle. Any firm that moved towardspecializing in a small range of products would enjoy a cost advantage thatwould provide it with a competitive edge.7 If we assume that it lowered itsprice, it would attract sales away from nonspecializing mills, which wouldthen have an incentive to reduce the diversity of their own output.8 Inboth Kenya and the Philippines, the domestic market is large enoughrelative to the minimum efficient scale of an individual firm's operationsto permit greater intraindustry specialization, yet this has not occurred.Moreover, even the failure to specialize does not necessarily imply theshort production runs that currently prevail. There are two key questions.(1) Why do firms typically produce a large range of products, given thedecrease in unit production costs obtainable by greater specialization? (2)Given a decision to manufacture a wide spectrum of products, why dofirms not attempt to realize longer production runs by producing forinventory? Each question is addressed in turn.9
Several answers to the first question can be posited, including the roleof risk aversion and the effect of vertical integration and historical links toparticular distribution channels. If specialization existed, shifts in demandamong products could lead to excess capacity for any individual product.An attempt by the producer to diversify into other areas would probablynot succeed, given the lower costs of firms already specializing in thesegoods. To avoid this unattractive scenario, individual firms may maintain abroad product line as a strategy of risk reduction, if it is assumed thatfluctuations in their individual markets are not positively correlated. Thisinterpretation requires an explanation of the willingness of firms in moredeveloped countries to specialize more narrowly. The possible reasons
44 BEST PRACTICE AND DEVIATIONS
include a lower degree of risk aversion, given higher profit levels, a lowerprobability of dramatic shifts in large markets with stable past histories,an ability to export and thus to offset domestic demand fluctuations (if itis assumed that identical shifts do not occur throughout the world), and agreater ability to alter product specifications efficiently and quickly be-cause of the generally higher quality and breadth of experience of man-agement and technical personnel.
Most textile mills in the Philippines, and to a lesser extent in Kenya, areclosely linked to specific wholesalers or retailers and have often beenestablished by the latter during the period of growing import substitution.There is substantial evidence that the wholesalers and retailers prefer tohave their own mills manufacture the entire range of products, fearingmonopolistic behavior on the part of unaffiliated rnills should the retailerrequire a good not produced by its own subsidiary. Shifts in demand andthe attendant risks will intensify any preference for internal production ofthe complete spectrum of products. If historical ties and the avoidance ofpotential high prices are a major motivation for product diversification,the ability to purchase inputs such as yarn at world prices would con-stitute an incentive to abandon the current structure.
Insofar as the establishment of new plants is possible, new entrantscould lower their costs by increasing their specialization. But the newfirms would have difficulty in domestic markets, given the vertical integra-tion of the textile sector. If the new mills were oriented to export marketsand specialized in a narrow range of products, they could realize lowerunit costs, which might also induce greater specialization among existingfirms. These issues are discussed further in chapters 8 and 9.
Given the fact that each firm has decided, for the above-mentionedreasons, to produce a large range of products, it is nevertheless possiblethat production for inventory would permit a significant proportion ofthe benefit from large individual lot sizes to be realized. The determina-tion of the optimal size of an individual production run has been a stapleof the operations research literature.10 The optimal lot size is determinedby minimizing the joint cost of production and the cost of holding inven-tories and yields the following decision rule:
(3-1) Q* = V2FD/hV
where F is the fixed cost incurred in setting up an individual productionrun, D is the firm's demand per unit of time, h is the cost of carryinginventory (including interest, charges for storage space, and obsolescenceor spoilage costs) as a percentage of variable costs, V, which is assumed tobe constant. For the individual firm, D is determined by the size of the
CROSS-COUNTRY DIFFERENTIALS 45
market and the factors affecting the degree of specialization among prod-ucts.
The formulation contained in equation 3-1 does not explicitly recog-nize the possibility that variable cost declines with the length of produc-tion run, for reasons discussed in the preceding chapter. Assume thatvariable cost takes the simple form V =A + B/Q, where A is theasymptote approached as Q becomes large. In this case, the optimum-lotformula changes slightly and becomes
(3-2) Q = /2(F+ B)D/hV.
The reluctance of firms to produce for inventory rather than for currentorders might result from very high values of h, caused by rapid shifts intastes that lead to a reduced value of inventory at the time of sale. Thisdoes not appear to be a plausible description of the overall textile market.Nor are high interest or storage costs plausible explanations of observedbehavior. An absence of a cost calculus similar to that applicable in otherinstances (which will be discussed in chapter 6) needs to be invoked toexplain the failure to produce systematically for inventory.
OTHER INDUSTRY CHARACTERISTICS. Other industry activities that mayaffect productivity include the financing of research institutes, the diffu-sion of their findings, and the establishment of central education facilitiesfor operatives and technicians." In Kenya and the Philippines, however,the potential benefits of these activities are dwarfed by those of productspecialization.
The Firm
Managerial and technical skills in production engineering can have amajor influence on productivity at the firm level.'2 Important factorsinclude adequate blending of raw fiber at the beginning of the productionprocess in spinning (inadequate blending produces imperfect yarn thatcauses high breakage rates in both spinning and weaving); good humiditycontrol in spinning and weaving; appropriate quality of sizing, the liquidused to add strength to yarn before it is woven; and the use of quality-control tests throughout the process to obtain quick identification andcorrection of production errors accounting for defects. Inadequateknowledge of or ability to implement these and other aspects of produc-tion engineering may lower capital, labor, or material productivity. Fre-quent breaks in spinning caused by poor blending and weak roving, forexample, will lower average output per spindle and per worker.
46 BEST PRACTICE AND DEVIATIONS
Knowledge of these and other technical requirements of production isunevenly distributed among firms).3 The most efficient firms are usuallvin command of almost all of the relevant skills. The less capable are awareof the general issues and make some attempt to achieve technical masteryof the production process but often do not understand the precise meth-ods for achieving it. Others may be aware of the required changes inmanagerial practice but have decided that they are too expensive relativeto expected benefits.
Although an explicit effort is needed by individual firms to obtain mostelements of technical knowledge, it might plausibly be argued that operat-ing practices depend partly on the industry; with a well-developed sector(a large number of competent firms) possessing substantial technicalknowledge, informal contacts and interfirm mobilitv of workers andmanagers will diffuse technical information. 14 It could also be arguedthat, although the immediate locus of inadequate training is the firm, thelatter's own cost would be decreased and its instruction improved if alarge number of other firms also provided such education; when em-ployees trained at one's own expense moved to other firms, the loss wouldbe at least partly compensated by a reverse flow. These and other possibleinteractions suggest that the focus of the decomposition procedure onsingle stages of a process can yield only proximate results that do notcapture potentially important interdependencies.
Task-Level Productivity
Task-level productivity (TLP) will depend on worker skills and motiva-tion. These in turn may be affected by the care with which workers arerecruited, the quality and extent of firm-level instruction, the incentivestructure, and the quality and intensity of supervision. Most efforts toexplain low industrial productivity in developing countries emphasizetask-level productivity.15
Unfortunately, TLP cannot be measured directly, for example, by usingtime and motion studies that firms have already carried out; the plantsvisited have not undertaken such analyses. Thus TLP is calculated as aresidual, and any errors or omissions in assessments of productivity de-pressants in the preceding stages will be reflected in TLP. Given the omis-sion of national economy productivity depressants and the inclusion ofonly a subset of possible industry- and firm-level factors, measured TLP ofdeveloping country plants relative to best-practice plants is probably un-derstated for the Kenyan and Philippine firms. Surprisingly, in light of thisprobable understatement, measured TLP relative to best practice is not a
THE DECOMPOSITION 47
major source of low relative total-factor productivity in the numericalresults presented in chapters 4 and 5.
The four levels in the explanation of productivity differences are con-ceptual categories and are not mutually exclusive. A decomposition of thesources of productive inefficiency using these categories can identify onlyproximate causes and not the fundamental sources of industrial ineffi-ciency. Thus the adverse incentive effects of a protectionist trade systemmay be the underlying problem, manifesting itself at the industry and firmlevels in the form of excessive product differentiation, inadequate tech-nical knowledge, and a low intensity of managerial and labor work effort.An economy characterized by slow growth in total job opportunities mayprompt workers to withhold achievable productivity gains-a behaviorpattern that may show up, as a residual, in low task-level productivity.Nevertheless, the kind of decomposition discussed here can be useful inpolicy discussions, by indicating, for example, possible fruitful loci ofgovernment intervention even where national policies such as a protec-tionist regime continue to prevail.
Just as social cost-benefit analysis attempts to develop social prices thatpermit the correct evaluation of individual projects within an interven-tionist milieu, some of the results developed here indicate economicallydesirable technological policies to employ in a second-best world; more-over, it is arguable that many industry- and firm-level deficiencies wouldnot simply disappear within a liberalized trade environment and wouldhave to be addressed by more direct means.
A finding of low productivity does not imply that "excess" labor orcapital can or should be removed. The normative question for the privatefirm is whether such a reduction would raise or lower its total profits,given that the effort to achieve increased productivity will require at leastsome expenditures. From a social viewpoint, the guiding principle mustalso be a benefit-cost calculus. Thus public provision of better vocationaleducation may increase labor productivity in textiles, but the social rateof return on such expenditures may fall short of that obtainable fromother investments. Some of these issues are discussed in chapters 8 and 9.
Formalization of the Decomposition
To implement the decomposition, a production-theoretic framework isemployed that has been extensively used at the aggregate level. Assumethat plant A is being compared with a best-practice developed countryplant, B. Both possess the same types and quantities of machines.
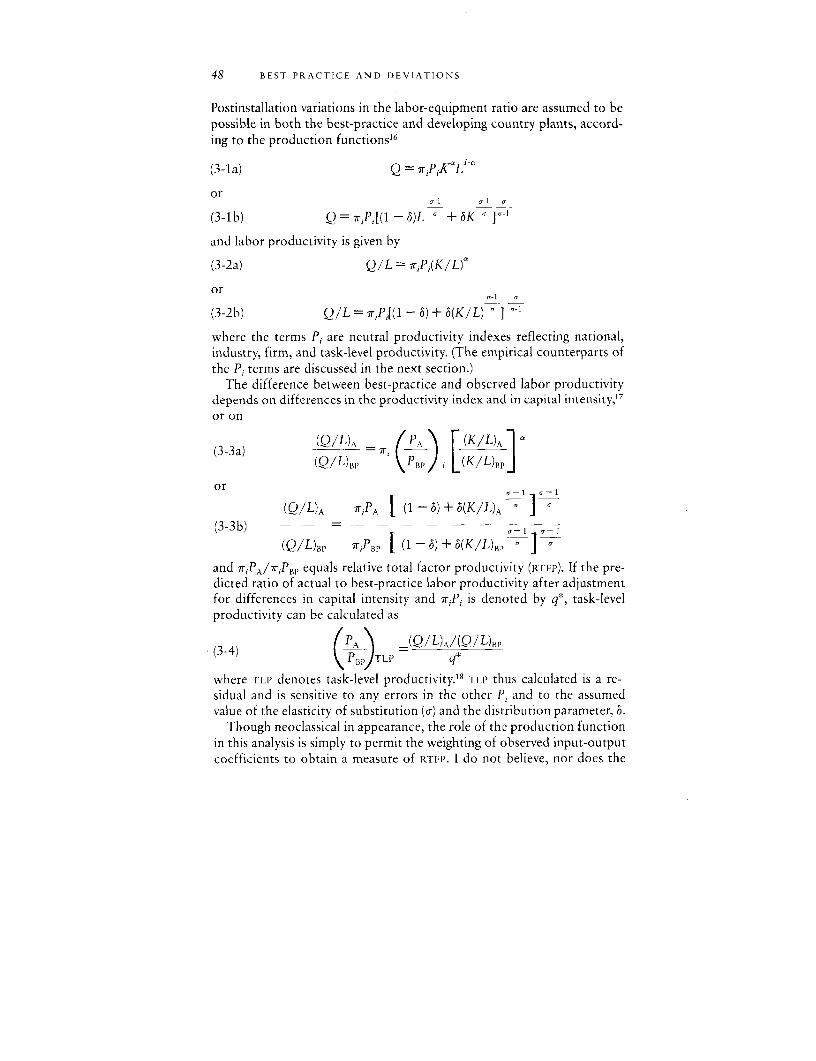
48 BEST PRACTICE AND DEVIATIONS
Postinstallation variations in the labor-equipment ratio are assumed to bepossible in both the best-practice and developing country plants, accord-ing to the production functions"6
(3-la) Q = 7riPijKL
ora-l a-l a
(3-1lb) Q =7riPi [(1 -6)L a +6Ka -
and labor productivity is given by
(3-2a) QIL = 7riPi(KIL)'
or
(3-2b) Q/L = ri Pi[(l - 6) + 6(K/L) a
where the terms Pi are neutral productivity indexes reflecting national,industry, firm, and task-level productivity. (The empirical counterparts ofthe P1 terms are discussed in the next section.)
The difference between best-practice and observed labor productivitydepends on differences in the productivity index and in capital intensity,17
or on
(Q/L)A = _P_ F (K/L)\ 1a(3-3a) (Q/L)BP \ PBP L (K/L)BP]
or
(Q/L)A r;iA| (1 - 6) + 6(K/L)A a ] a
(3-3b)=a-I-I(Q/L)BP -i;BP [(1- 6) + 6(K/L)B l 1
and riPA/7riPBP equals relative total factor productivity (RTFP). If the pre-dicted ratio of actual to best-practice labor productivity after adjustmentfor differences in capital intensity and 7riP1 is denoted by q*, task-levelproductivity can be calculated as
(34) TPqsidua) an is ( )T =(Q/L)A/(Q/L)BP
where TLP denotes task-level productivity.1 8TLP thus calculated is a re-
idual and 's sensitive to any errors in the other Pi and to the assumedvalue of the elasticity of substitution (o) and the distribution parameter, 5.
Though neoclassical in appearance, the role of the production functionin this analysis is simply to permit the weighting of observed input-outputcoefficients to obtain a measure of RTFP. I do not believe, nor does the
THE DECOMPOSITION 49
evidence show, that firms are in fact operating within a well-understoodneoclassical production environment in which all share freely available,identical technical knowledge. Rather firms using similar equipment ob-tain widely varying levels of output, the variations being considerablylarger than can be explained by differences in employment. Indeed, thevarious sources of productivity differentials enumerated above have beenintroduced precisely to obtain a better understanding of why firmsachieve such disparate results with similar levels of productive inputs.Thus the spirit in which RTFP values are calculated and in which observeddifferentials are decomposed into a number of components much moreclosely approaches the recent articulation of production theory in Nelsonand Winter (1982) than the standard neoclassical production frameworkin which all firms are able to move along the same freely available, fullyunderstood production frontier. Much of what follows is closer to thegrowing literature on econometric estimation of production frontiersthan to conventional analysis of sources of growth.19 Insofar as the formeris largely concerned with estimating the intracountry production frontierrather than with comparing this frontier to the international one,however, its main focus differs from that of the present study, though theresults are complementary.
One useful interpretation of the numerical decomposition results is toview them as indicative of the achievable growth of short-term productiv-ity over, say, one to three years. The estimates of industry, firm, and task-level deficiencies indicate the upper limits of potential gains in total-factorproductivity from selective interventions, which could involve reorgan-ization of the industry to rationalize the production structure and avoidshort production runs, assignment of a group of foreign technicians to afirm, or introduction of incentive payment systems. These estimates aremaximum ones, because some of the potential productivity growth maynot be realized unless complementary action occurs simultaneously at thenational level. In the absence of sufficient domestic competition, a liber-alized trade regime may be necessary to provide incentives to utilize suchhelp as becomes available. Policies designed to foster the growth of mod-ern sector employment may be needed to allay workers' fears that im-proved task-level productivity may lead to job losses. Less restrictivepolicies on technology licensing or payments to consultants may be animportant component of a productivity enhancement program.
The Choice of Best-Practice Coefficients
Of interest are not only the several sources of low productivity but alsothe product of all of them, 7rw(PA/PB,)i, or relative total-factor productiv-
50 BEST PRACTICE AND DEVIATIONS
ity, RTFP. Three issues related to its measurement, and more generally tothe empirical implementation of equation 3-3b, warrant attention. Theseare the choice of best-practice production coefficients; the particularfunctional form used, including the effect of differing values of the elas-ticity of substitution; and the role of economies of scale.
The values of (K/L)A are obtained from the operating performance ofplants in Kenya and the Philippines. Data have been collected in each plantabout the specific equipment employed as well as about labor, raw mate-rials, space, and power at each stage of production. Given this informa-tion, a technologically matched developed country best-practice plantemploying essentially identical equipment is used for comparison. Thevalues of the best-practice variables are largely obtained from those shownin tables 3-1 and 3-2 (the latter adjusted to other product specifications asnecessary), which show the performance of mills at the upper quartile ofthe U.K. textile plant distribution.
For some purposes, particularly those related to questions of interna-tional trade, it would be preferable to employ production coefficients forcountries that are important international exporters of textile products.The data from the United Kingdom, however, have an important advan-tage; they include a large amount of detailed technical information thatconforms to the data needs of the decomposition undertaken here-suchas spindle speed, twists per inch in spinning, loom efficiency, and so on.Given the critical importance of these variables, the employment of theU.K. best-practice coefficients would be indicated by the requirements ofthe analysis even where other best-practice data were available but wereunaccompanied by such detail.
Two factors suggest that the use of the U.K. data does not limit theusefulness of the analysis. First, the better U.K. firms are, in fact, fairlyefficient (see the international comparisons in chapter 7), particularly inweaving, and careful inference permits deductions about the potentialcompetitiveness of firms of Kenya and the Philippines, given their perfor-mance relative to U.K. best practice. The United Kingdom's lack of com-petitiveness in some products reflects its factor prices rather than itstechnical inefficiency. Second, the best-practice capital and labor coeffi-cients are available from the same source for the other major textile-producing nations as well (Textile Council 1969). Thus the sensitivity ofthe particular set of results presented in chapters 4 and 5 to the choice ofthe United Kingdom as a standard of comparison can be explicitly deter-mined by use of the cross-country results presented in chapter 7. Finally,1976 evidence carefully collected by Pickett and Rcbinson (1981) permitscomparisons with the data I have employed for best practice. There is verylittle difference between their 1976 figures and the input coefficients
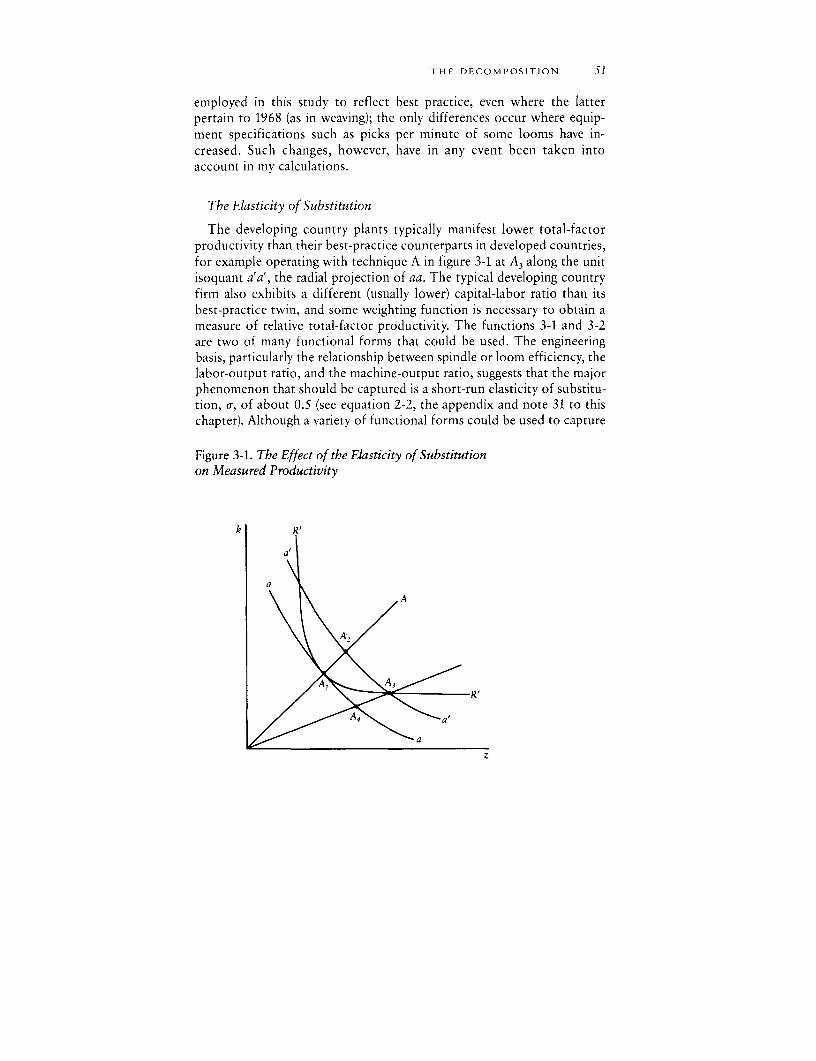
THE DECOMPOSITION 51
employed in this study to reflect best practice, even where the latterpertain to 1968 (as in weaving); the only differences occur where equip-ment specifications such as picks per minute of some looms have in-creased. Such changes, however, have in any event been taken intoaccount in my calculations.
The Elasticity of Substitution
The developing country plants typically manifest lower total-factorproductivity than their best-practice counterparts in developed countries,for example operating with technique A in figure 3-1 at A3 along the unitisoquant a'a', the radial projection of aa. The typical developing countryfirm also exhibits a different (usually lower) capital-labor ratio than itsbest-practice twin, and some weighting function is necessary to obtain ameasure of relative total-factor productivity. The functions 3-1 and 3-2are two of many functional forms that could be used. The engineeringbasis, particularly the relationship between spindle or loom efficiency, thelabor-output ratio, and the machine-output ratio, suggests that the majorphenomenon that should be captured is a short-run elasticity of substitu-tion, a, of about 0.5 (see equation 2-2, the appendix and note 31 to thischapter). Although a variety of functional forms could be used to capture
Figure 3-1. The Effect of the Elasticity of Substitutionon Measured Productivity
k R
a'
a~~~~~~~~
A~~~~~
52 BEST PRACTIC E ANI) DEVIATIONS
this fact, the increased complexity of the exposition when they are em-ployed does not appear to me to be offset by any increase in the veri-similitude with which it represents the underlying engineering reality. ACobb-Douglas function is used to capture the upper-bound results thatwould occur with a = 1.0, and a CES with or = 0.2 is used to obtain lower-bound results.
The critical assumption made to permit the comparison is that the expost elasticity of substitution along aa and a'a' in figure 3-1 is identical.2 0
This assumption is plausible because knowledge of the possible ways ofvarying the amount of labor used in conjunction with a given set ofmachines is quite widely diffused. Likely to be less well known, for exam-ple, between firms in different countries, are those aspects of tech-nological mastery that determine the height or level of the productionfunction.
To determine the sensitivity of the productivity calculations to possibledifferences in the ex post elasticity of substitution, I will present calcula-tions using the three values of the parameter. Although it would be possi-ble to estimate conventional (average) production functions or frontierproduction functions and to use the parameter estimates thus obtained inthe calculation of relative total productivity, there are several problemswith such estimates that reduce their reliability, and this approach will notbe attempted here.
In the calculations in chapters 4 and 5, it will be seen that a lower valueof the ex post substitution elasticity results in greater relative productivityof developing country plants. The reason can be seen in figure 3-1, whereaa and a'a' are the ex post unit isoquants exhibiting greater values of orthan R'R'. Assume that the best-practice technique is OA and the plant isproducing at A,, whereas the developing country plant has adopted thesame equipment but uses it with more labor (point A3). If the "true" expost unit isoquants are aa and a'a', then the developing country plant'srelative productivity will be OA,/OA2 (or OA4 /OA3 ), less than unity. Incontrast, if the "true" elasticity of substitution is lower, and 'R' is therelevant isoquant, then A, and A3 lie on the same isoquant, and total-factor productivity is the same in both plants.
Returns to Scale
The use of Cobb-Douglas and CES production functions does not, ofcourse, preclude the introduction of increasing returns to scale. The roleof increasing returns is not taken into account in the various analyses,however, as a number of studies using detailed engineering and economicinformation have concluded that economies of scale have been exhausted
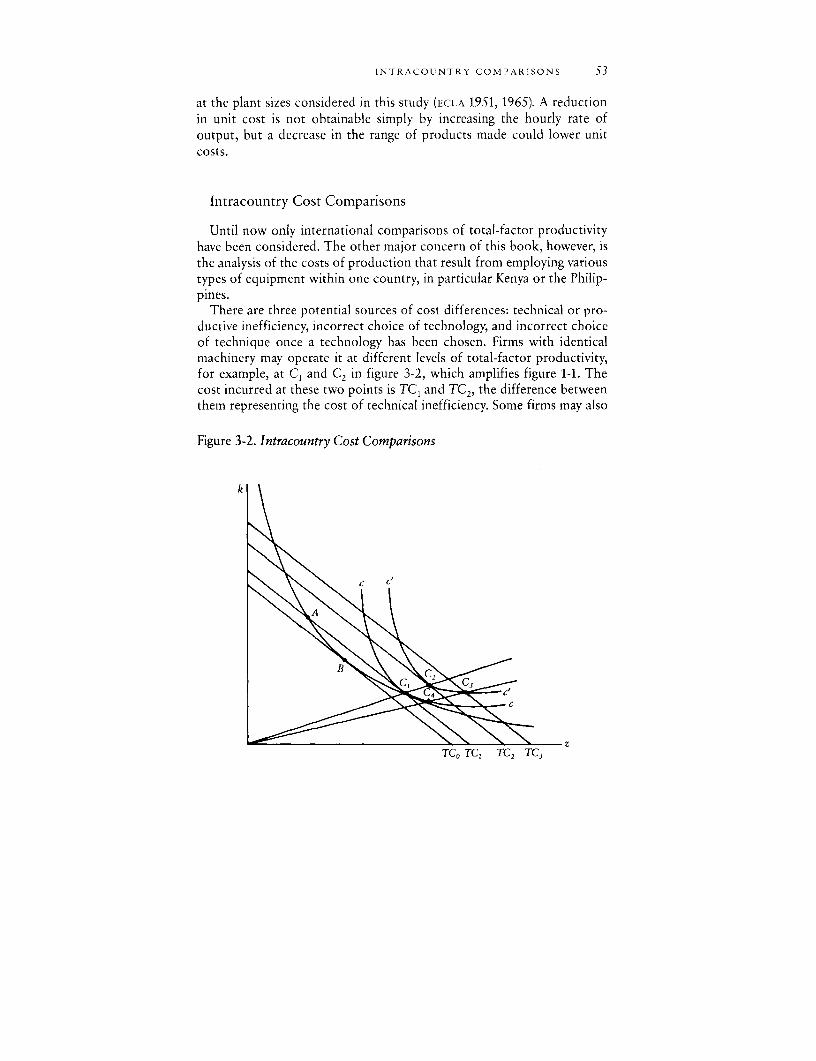
INTRACOUNTRY COMPARISONS 53
at the plant sizes considered in this study (ECLA 1951, 1965). A reductionin unit cost is not obtainable simply by increasing the hourly rate ofoutput, but a decrease in the range of products made could lower unitcosts.
Intracountry Cost Comparisons
Until now only international comparisons of total-factor productivityhave been considered. The other major concern of this book, however, isthe analysis of the costs of production that result from employing varioustypes of equipment within one country, in particular Kenya or the Philip-pines.
There are three potential sources of cost differences: technical or pro-ductive inefficiency, incorrect choice of technology, and incorrect choiceof technique once a technology has been chosen. Firms with identicalmachinery may operate it at different levels of total-factor productivity,for example, at Cl and C2 in figure 3-2, which amplifies figure 1-1. Thecost incurred at these two points is TC, and TC2, the difference betweenthem representing the cost of technical inefficiency. Some firms may also
Figure 3-2. Intracountry Cost Comparisons
k
C,
zTCo TC, TC2 TC3
54 BEST PRACTICE AND DEVIATIONS
be characterized by inefficient choice of technique, operating at C3 alongc'c', whereas the cost-minimizing capital-labor ratio occurs at C2; thiserror raises cost further, from TC2 to TC3. Thus if a technology is oper-ated at less than best-practice productivity and with an incorrect choiceof technique, the excess cost relative to a firm that is efficient in bothdimensions is TC 3 - TC, = (TC2 - TCJ) + (TC3 - TC2).
Nevertheless, TC1 may not be the lowest cost obtainable at the givenwage-rental ratio. In particular, the choice of technology B, if it wereoperated at B, would lower costs to TCO. Usually allocative efficiency isused to denote the cost reduction stemming from the move from Cl to B.It will also be used in the following chapters, however, to denote costreductions stemming from improved choice of technique. The contextwill make clear which type of allocative gain is of concern.
This framework implies three potential routes by which a firm couldlower its cost: greater technical efficiency, an improved choice of tech-nique with a given technology already in place, and a different choice oftechnology. The first two are obtainable by improving the firm's perfor-mance with existing equipment, but better technology can be obtainedonly by selling the firm's current machinery and purchasing the moreappropriate type.
Two broad choices of technology are considered in the following chap-ters: first, that between currently produced conventional equipment andrecently introduced machinery of radically new design; second, that be-tween older equipment still available in used machinery markets and newequipment (whether of conventional or newly introduced design). Thecontext will make it clear which choices are involved. Although extensivediscussions exist about the uncertainties associated with the employmentof used equipment (Cooper and Kaplinsky 1975), many of them pertain tothe difficulty of purchasing it in an imperfect market; this difficulty isirrelevant to the problems considered in the succeeding chapters, insofaras firms already possess the machinery. In this case, the major issuesrevolve about the effectiveness with which equipment is employed. As willbe seen, older machinery is, on the average, more efficiently employedthan new equipment.
The actual cost comparisons involve the calculation of each firm'stransformation cost, defined as the sum of capital, labor, fuel, and waste.(See the appendix to this chapter for details regarding the factor pricesused.) The information employed could be transformed from con-ventional unit cost of individual firms to a measure of social optimalitysuch as the domestic resource cost (DRC).21 This has not been done be-cause much of what follows is concerned with investigating the determi-nants of private behavior. Nevertheless, firms exhibiting lower private unit
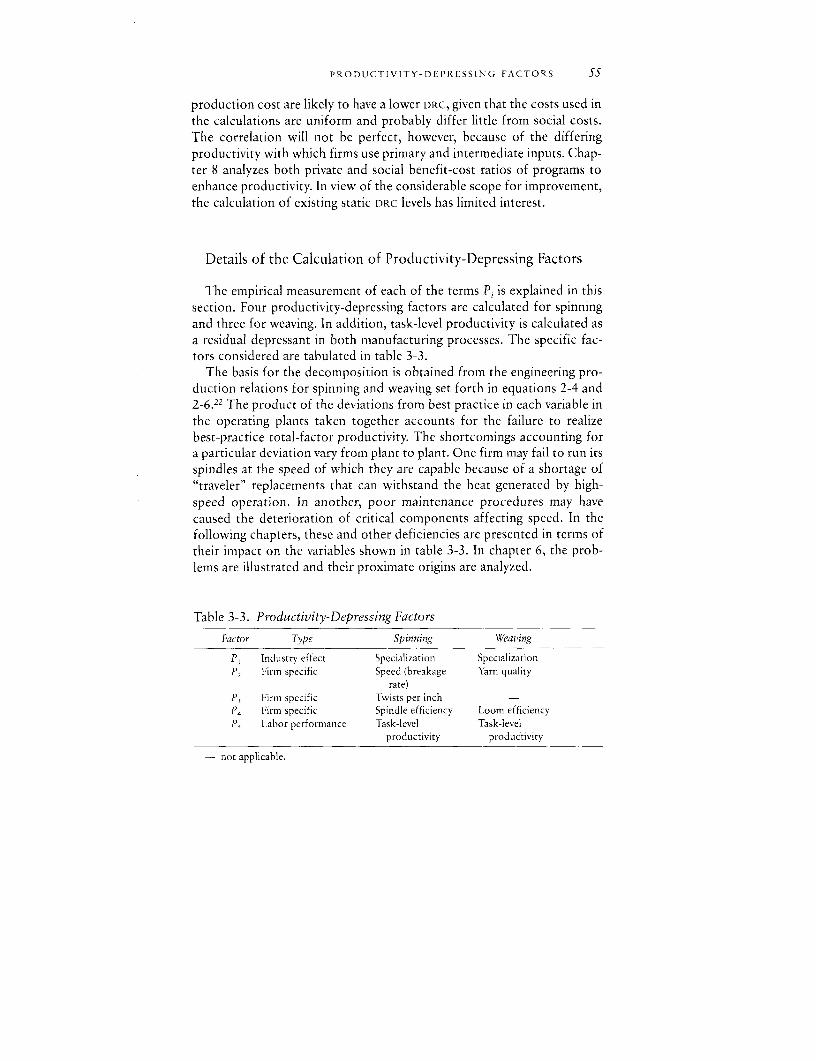
PRODUCTIVITY-DEPRESSING FACTORS 55
production cost are likely to have a lower DRC, given that the costs used inthe calculations are uniform and probably differ little from social costs.The correlation will not be perfect, however, because of the differingproductivity with which firms use primary and intermediate inputs. Chap-ter 8 analyzes both private and social benefit-cost ratios of programs toenhance productivity. In view of the considerable scope for improvement,the calculation of existing static DRC levels has limited interest.
Details of the Calculation of Productivity-Depressing Factors
The empirical measurement of each of the terms Pi is explained in thissection. Four productivity-depressing factors are calculated for spinningand three for weaving. In addition, task-level productivity is calculated asa residual depressant in both manufacturing processes. The specific fac-tors considered are tabulated in table 3-3.
The basis for the decomposition is obtained from the engineering pro-duction relations for spinning and weaving set forth in equations 2-4 and2-6.22 The product of the deviations from best practice in each variable inthe operating plants taken together accounts for the failure to realizebest-practice total-factor productivity. The shortcomings accounting fora particular deviation vary from plant to plant. One firm may fail to run itsspindles at the speed of which they are capable because of a shortage of"traveler" replacements that can withstand the heat generated by high-speed operation. In another, poor maintenance procedures may havecaused the deterioration of critical components affecting speed. In thefollowing chapters, these and other deficiencies are presented in terms oftheir impact on the variables shown in table 3-3. In chapter 6, the prob-lems are illustrated and their proximate origins are analyzed.
Table 3-3. Productivity-Depressing Factors
Factor Type Spinning Weaving
P1 Industry effect Specialization SpecializationP, Firm specific Speed (breakage Yarn quality
rate)P3 Firm specific Twists per inchP4 Firm specific Spindle efficiency Loom efficiencyP, Labor performance Task-level Task-level
productivity productivity
- not applicable.
56 BEST PRACTICE AND DEVIATIONS
Spinning
INDUSTRY EFFECT. It will be recalled from the earlier discussion thateconomywide, or national, determinants of relative total-factor produc-tivity are not calculated, factors having an impact at the industry levelbeing the most macroscopic considered. Of the potential industry-levelsources of low productivity, excessive product variety receives attentionhere. Executives concerned with profitability and technicians dealingwith productivity agree that inadequate specialization and the consequentshort production runs raise unit cost. Other sources of low productivityrelating to insufficiently developed industrywide institutions (such astraining institutes) are generally thought to have considerably lower quan-titative importance.
It is difficult to obtain precise quantitative assessments of the impact onproductivity of short production runs. Estimates of these effects havebeen made for both spinning and weaving; production engineers withexperience in developing countries agree that these have roughly the cor-rect order of magnitude.
Improved productivity from specialization in spinning depends on (1)reducing the output of counts that diverge widely from those for whichthe plant was designed (such counts will be manufactured inefficiently asa result of machine imbalances and the use of less appropriate equipment)and (2) decreasing the number of yarn sorts produced where each sort isdescribed by its count, twists per inch, and the fiber mix (for example,cotton-polyester). Because such rationalization of production involveschanging several output characteristics simultaneously, establishing theimpact on productivity of a decrease in count range and in the number ofsorts requires a carefully controlled multiplant experiment. A study ofthis type being impossible to locate in the textile engineering literature, Ihave used the description in an internal World Bank report of one effortat rationalization to estabtish orders of magnitude. Although only roughestimates, they permit some quantitative assessment of a phenomenonthat is widely acknowledged to be of considerable importance in theeconomics of textile production.
Using the discussion in the World Bank document, I have estimated theeffect on productivity when a plant produces counts different from thosefor which it was designed. This procedure provides a conservative esti-mate of the true cost involved, as it omits the impact of excessive yarnsorts, which is generally believed to be an important potential source oflow productivity. The relationship used to describe the interdependenceof best practice and actual productivity resulting from variation in therange of counts is illustrated by the following figures (in percent):
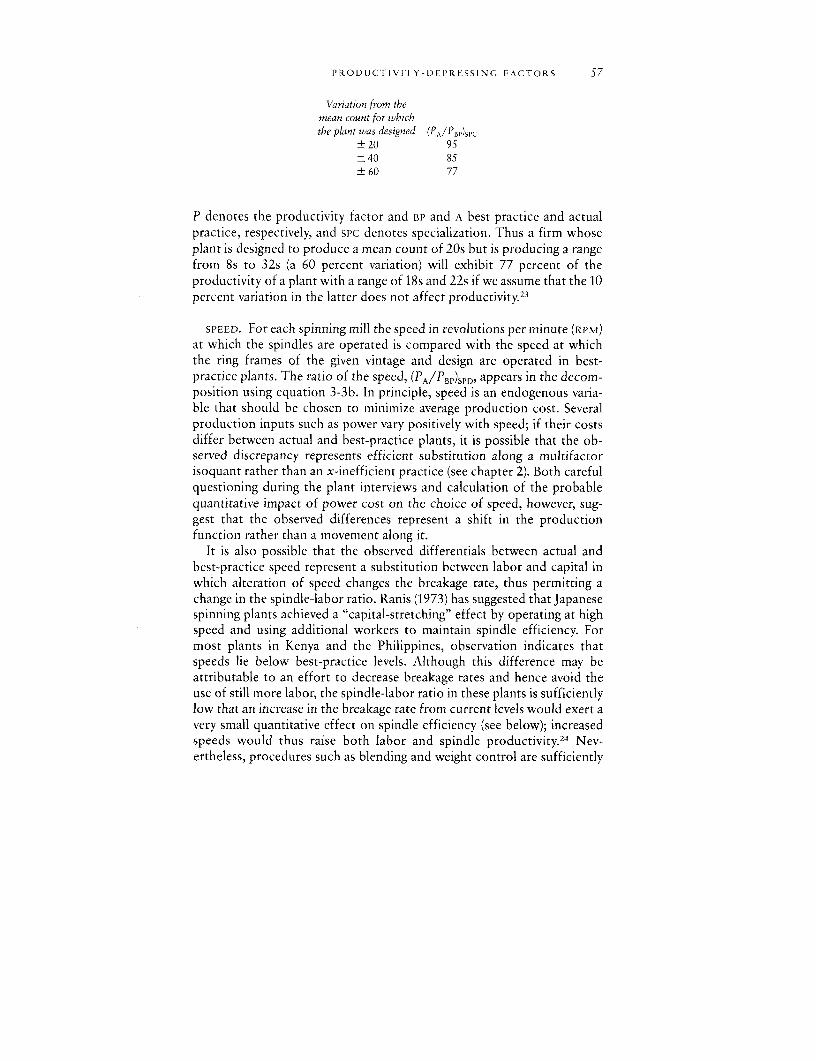
PRODUCTIVITY-DEPRESSING FACTORS 57
Variation from themean count for whichthe plant was designed (PA/PBI')Sl'C
±20 95± 40 85+60 77
P denotes the productivity factor and BP and A best practice and actualpractice, respectively, and spc denotes specialization. Thus a firm whoseplant is designed to produce a mean count of 20s but is producing a rangefrom 8s to 32s (a 60 percent variation) will exhibit 77 percent of theproductivity of a plant with a range of 18s and 22s if we assume that the 10percent variation in the latter does not affect productivity.2 3
SPEED. For each spinning mill the speed in revolutions per minute (RPM)
at which the spindles are operated is compared with the speed at whichthe ring frames of the given vintage and design are operated in best-practice plants. The ratio of the speed, (PA/PBP)SPD, appears in the decom-position using equation 3-3b. In principle, speed is an endogenous varia-ble that should be chosen to minimize average production cost. Severalproduction inputs such as power vary positively with speed; if their costsdiffer between actual and best-practice plants, it is possible that the ob-served discrepancy represents efficient substitution along a multifactorisoquant rather than an x-inefficient practice (see chapter 2). Both carefulquestioning during the plant interviews and calculation of the probablequantitative impact of power cost on the choice of speed, however, sug-gest that the observed differences represent a shift in the productionfunction rather than a movement along it.
It is also possible that the observed differentials between actual andbest-practice speed represent a substitution between labor and capital inwhich alteration of speed changes the breakage rate, thus permitting achange in the spindle-labor ratio. Ranis (1973) has suggested that Japanesespinning plants achieved a "capital-stretching" effect by operating at highspeed and using additional workers to maintain spindle efficiency. Formost plants in Kenya and the Philippines, observation indicates thatspeeds lie below best-practice levels. Although this difference may beattributable to an effort to decrease breakage rates and hence avoid theuse of still more labor, the spindle-labor ratio in these plants is sufficientlylow that an increase in the breakage rate from current levels would exert avery small quantitative effect on spindle efficiency (see below); increasedspeeds would thus raise both labor and spindle productivity.24 Nev-ertheless, procedures such as blending and weight control are sufficiently
58 BEST PRACTICE AND DEVIATIONS
bad in some firms to make it likely that past efforts to increase speedresulted in a significant growth in end breakages and a decrease in spindleefficiency even at the low prevailing spindle-labor ratio. In these firms,primarily in the Philippines, below-normal speed is attributable to lack ofmastery of the early stages of processing as well as to deficient mainte-nance and housekeeping.
Those firms exhibiting speeds higher than best practice do not appearto be substituting labor for capital in a capital-stretching fashion, as theyalso exhibit spindle-labor ratios in a range in which increased breakagerates have little impact on spindle efficiency (see below). Hence it seemsreasonable to infer that high speed permits these firms to increase bothcapital and labor productivity, an inference supported by their typicallyhigh capital-labor ratios and TFP as compared with those of other firmsusing similar equipment.
TWISTS l'ER INCH. As seen in chapter 2, the number of twists or turnsper inch inserted into yarn in best-practice plants is determined by use ofthe rule T = tVc, where t equals the twist multiple and c the yarn count.For any given count of yarn, the twist multiple, and hence T, will differslightly according to variations in the properties of the yarn up throughroving, but the range in t is usually quite small. Nevertheless, in a few ofthe firms in the sample, deviation in the twist multiple (and hence in T)
from best practice constitutes an important source of the difference be-tween actual and best-practice productivity. Although a high value of T
might reflect practices designed to redress the undesirable properties ofvery cheap fiber, evidence from interviews (particularly with regard tocharacteristics of the type of fiber currently employed), and also thefeasible technical substitution of greater T for shorter fibers, suggest thatthe observed ratio of (PA/PBP)T in these firms largely represents x-ineffi-ciency, not factor substitution. In other words, large numbers of twistsper inch are introduced to correct weaknesses resulting from inadequatecommand of the earlier stages of processing.
SPINDLE EFFICIENCY. In chapter 2 it was shown that the observed levelof efficiency, e*, equals qe(b,L) and depends on three variables: theamount of labor used in conjunction with the ring frame, the rate of yarnbreakage, and other factors reflected in q, such as the frequency andquality of maintenance. It was noted in chapter 2 that an increase inbreakage rates, the spindle-worker ratio being constant, leads to a down-ward shift in the production function, whereas any response in the cap-ital-labor ratio to differential breakage rates constitutes a movementalong the isoquant. There are thus three effects that need to be consid-
PRODUCTIVITY-DEPRESSING FACTORS 59
ered: (1) differences between actual and best-practice breakage rates andtheir impact on labor and spindle productivity; (2) given b and the labor-spindle ratio, the expected level of efficiency, e; and (3) the differencebetween expected efficiency, e, and observed efficiency, e*, where e* = qe.Given the calculated value of attainable or normal efficiency, q is calcu-lated as e*/e and provides an estimate of (PA/PBP)EF, where EF denotesefficiency.
Although the breakage rates in all of the Kenyan plants and a few of thePhilippine plants exceed those found in best-practice mills, no productiv-ity-depressing correction is introduced for breaks per se or for the effectnoted under (1) in the preceding paragraph. The reasoning is as follows. Atobserved spindle-spinner ratios in both countries, about 600-800 spin-dles, end breakage rates of even eighteen per 100 spindle hours (whichconsiderably exceed that of most plants in the sample) permit a spindleefficiency of over 99 percent.25 Efficiency can remain high because spin-ners with a relatively small number of spindles to check are able to iden-tify and repair any breaks quickly, thus keeping machine interferencequite low; the only loss in efficiency arises from creeling and doffing time.Once the efficiency that should be achieved (given observed breakage andcapital-labor ratios) has been calculated, the effect of other productivitydepressants is obtained as q = e*/e. Values less than unity are due todefective maintenance, inadequate supplies of spare parts, and so on.
TASK-LEVEL PRODUCTIVITY. Task-level productivity is calculated as aresidual according to equation 3-4. Given the nature of the calculation,any error in estiniates of other Pi or the use of a value for the elasticity ofsubstitution that differs from the true value will lead to an incorrectestimate of P.
Weaving
INDUSTRY EFFECT. To establish the effect of product diversity in weav-ing, I have used the results of a study of the British textile sector thatmeasured the impact on labor and loom productivity of the number ofwarp beam changes per 10,000 loom shifts.26 Some warp beam changes areinherent in the process, as the initial warp supply is exhausted and must bereplaced even if no alteration in product is planned. More frequent re-placements occur when the product is altered before a given beam hasbeen completely exhausted. A firm that can halve the number of its warpchanges per 10,000 loom shifts from eighty (approximately the bottomquartile in the U.K. sample of plants) to twenty (roughly the top-quartile
60 BEST PRACTICE AND DEVIATIONS
value) for example, can increase its total-factor 1productivity by 59 per-cent, so that PA/PBP =1/1.59 = 0.63. Given difficulties in establishingprecisely how many different fabrics are produced, 0.63 will be used as astandard for the ratio of actual to best-practice productivity in the Kenyanplants and 0.70 in the Philippine plants, with mills in the Philippinesreporting slightly longer production runs than their Kenyan counter-parts. 2 7
YARN QUALITY. The impact of breakage is greater in weaving than inspinning. The difference arises from the fact that, when a warp or weftyarn breaks, the entire loom is shut down, whereas in spinning only thespindle on which the break occurs is halted, and the rest of the spindleson the ring frame continue to spin. The impact of increased breakagerates on TFP will be smaller in weaving mills in which the loom-labor ratiois lower, for reasons similar to those set forth in the discussion of spindleefficiency. In both Kenya and the Philippines, the ratio of looms toweavers is low. In the Philippines, for example, the mean ratio is 6.5, therange being 3 to 14, whereas 24 to 36 looms per worker is the norm inbest-practice plants, depending on the particular product. Nevertheless,because the entire loom stops when a break occurs, each break entails theloss of some small percentage of potential production.
The impact on total-factor productivity of higher stoppage rates occa-sioned by excessive breaks is calculated by means of the expression(1 - br/60), where b is the breakage rate per hour and r is average repairtime. If we use the values of b and r in best-practice and actual mills, theexpression provides an estimate of the maximum number of minutes perhour that a loom could run in each mill if repairs occurred immediately,that is, if machine interference were zero. This is the maximum efficiencylevel, given the limitations imposed by existing breakage rates. The esti-mate thus obtained yields the value of (PA/PBP)YQ, where YQ denotes yarnquality.
LOOM EFFICIENCY. In practice, loom interference is not zero, as as-sumed in the preceding paragraph, though it is very small, given the exist-ing loom-weaver ratios. The (high) potential level of loom efficiency, e,that could be realized, given the current levels of breakage rates andlooms per weaver, is calculated and compared with the observed value, e*.The value P3, or (WA/PBP)LE, where LE denotes loom efficiency, is calcu-lated as e7e.21
Appendix
The data obtained from visits to firms include the manufacturer of themachinery used at each step in the production process, together with
APPENDIX 61
information on its labor, raw materials, space, and power requirements.Knowledge of the manufacturer also allows identification of the perfor-mance capabilities embodied in equipment according to the manufac-turer's estimates. Finally, critical engineering variables such as speed,breakage rates, and twists per inch were collected.
This appendix presents a brief discussion of the measurement of capitaland labor inputs and the choice of values used for the parameters ofequations 3-3a and 3-3b.
Labor and Capital Inputs
SPINNING. Two calculations are frequently carried out in the chaptersthat follow: measurement of the difference in total-factor productivitybetween plants in two countries and estimation of the variation in cost ofproduction between different firms in the same country. In both calcula-tions the measured labor input is the unweighted labor hours per kilogramof yarn; the time of operatives, mechanics, and auxiliary workers (such ascleaners) in all processes from opening through spinning is included,whereas that of supervisory labor is excluded. Unweighted labor hours areused because wage differences between the various categories of labor areminor and based largely on seniority.
In international productivity comparisons, the quantity measure ofcapital input is spindle hours per kilogram of yarn in each plant; allcomparisons involve mills employing physically similar equipment ofroughly the same age. Use of this variable may somewhat understate theefficiency of developing country spinning plants, as their machine-outputratios in the earlier stages (opening through carding) are closer to those ofdeveloped country plants than is the ratio in spinning; the main differencein machine-output ratios, particularly in the Philippine mills, is in rovingand spinning. Sensitivity tests embodying various assumptions, however,suggest that, for the plants with the worst spinning performance, theoverstatement of the capital-output ratio resulting from omission ofequipment from earlier stages is about 10 percent. The ensuing under-statement of total-factor productivity for these spinning mills comparedwith best-practice mills is about 3-4 percent. Given measured RTFP
differentials of 30-40 percent, the effect of potential misestimates of thecapital stock in the productivity calculations is relatively small.
In calculations of production cost variations among firms in Kenya andthe Philippines with different types of equipment, new machines arepriced at current market prices provided by equipment manufacturers.The value of all equipment, from opening machines to ring frames, isincluded in the cost measure. Older equipment is employed by many
62 BEST PRACTICE AND DEVIATIONS
firms. The price of used equipment in a competitive market should ideallyreflect the market evaluation of the quasi-rents to be earned from itsemployment. Neither Kenya nor the Philippines, however, has an activeused equipment market. The second-best solution employed here relieson estimates of potential resale value provided by textile manufacturers ineach country and on informed guesses by textile engineers.29 The pro-cedure followed is to use the same price for spinning equipment of eachvintage rather than trying to establish different estimates of the value ofeach plant's equipment, depending on its actual condition. Firms are thuscharged with the opportunity cost of using machinery of a given vintageeven if the value of their own machinery is not equal to that of the averagefirm. This procedure may lead to some biases, for example overstating thecapital cost of production in plants that have ignored maintenance andwhose equipment reflects such neglect. Such firms are likely, however, toface greater current costs for maintenance and spare parts in order tocompensate for past laxness. Although current maintenance costs are notexplicitly considered (most firms having limited and unreliable informa-tion), the overstatement of opportunity cost and the understatement ofmaintenance should partially cancel each other.
In the cost calculations, the hourly user cost of capital is derived byusing the capital recovery factor and assuming an interest rate of 10percent. The number of years remaining for each type of equipmentdepends on its vintage and is uniform for each vintage rather than varyingwith past or future maintenance.30 It is assumed that every firm operatesits plant for 7,200 hours per year. The hourly wage used in the costcalculations is the current market wage in Kenya or the Philippines, in-clusive of standard fringe benefits.
WEAVING. The capital input in weaving for international comparisonsof productivity is loom hours per meter of woven cloth. Comparisons aremade between mills employing looms with similar operating principlesand of similar vintages. Cost comparisons between firms within eachdeveloping country use loom prices that are derived on the same princi-ples as equipment prices in spinning. Labor input is measured as thenumber of hours per meter of cloth and includes the hours of operatives,cleaners, and mechanics in weaving, excluding preparatory processes suchas sizing.
Capital and labor input per unit of output have been adjusted to acommon product specification in both spinning and weaving. In spinning,all inputs have been adjusted to those that would hold if a plant wereproducing an average 20s count yarn rather than its current mean count.In weaving, the standardization is to a cloth with the same number of ends
AlPPENDIX 63
and picks per inch, width, yarn count in both warp and weft, and type ofweave. Such adjustments are necessary, as unit inputs differ significantlywith product characteristics; for example, higher-count yarns in spinningand fabrics using higher-count yarns in weaving are subject to greaterbreakage rates that raise both labor and equipment inputs per unit ofoutput.
Power costs reflect the current charges for electricity in Kenya and thePhilippines, whereas the cost of floor space reflects the same charge forplants in each country, based on current reproduction costs and a capitalrecovery factor that presupposes a thirty-year life and a 10 percent interestrate.
Parameter Values
To obtain a measure of total-factor productivity, it is assumed that afterinstallation the ratio in which workers and machines can be combined isdescribed either by a Cobb-Douglas function or by a constant elasticity ofsubstitution production function, with or alternatively equal to 0.5 and 0.2in the latter case.31 Our assumption is thus that knowledge of the produc-tion process is sufficiently diffused that the postinstallation factor sub-stitution possibilities for developed and developing country producers aresimilar, even though the efficiency of production may differ among coun-tries. If, in fact, the substitution possibilities in Kenya and the Philippinesdiffer from those in the United Kingdom, even when similar equipment isin use, the correct procedure for deriving relative productivity indexes isthe use of mean values (across countries) of the elasticity of substitutionand other relevant production parameters (see Caves, Christensen, andDiewert 1982; Christensen, Cummings, and Jorgenson 1980). There islittle reason, however, to believe that the simple technological knowledgereflected in the substitution parameters (as opposed to those determiningefficiency levels) is not well diffused.32
To perform the calculation, it is necessary to obtain factor shares forthe Cobb-Douglas function and their analogues, the distribution param-eters for the CES. The factor shares are obtained from best-practice plantprofiles and reflect only the costs incurred in manufacturing operations.These differ from the national accounts data that are normally used(which include remuneration of factors not directly involved in plantoperations). There is only a small discrepancy, however, between the twosets of estimates of factor shares. When the CES is employed, a value for t,the distribution parameter, is calculated, and the same value is used forboth the developing country plants and the U.K. plants.33
64 BEST PRACTICE AND DEVIATIONS
Notes
1. A detailed description of some of the procedures needed to achieve best practice isprovided in chapter 6.
2. This focus on the spindle-output ratio is also justified by the substantial share of rovingand ring-frame costs in total spinning, as shown in chapter 2. Technical advances in roving havegenerally reflected those in spinning.
3. Pickett and Robinson (1981). On questions of the optimal choice of technology, theirstudy is a useful complement to the present volume, as is Amsalem (1978).
4. For a summary, see Hagen (1975), chap. 6; see also Leibenstein (1976, 1978). The mostthorough attempt to measure micro-level sources of productivity differences between operat-ing and best-practice firms is that of ECLA (1951). 1 have recast some of its findings into theframework outlined below; see Pack (1982b). The ECLA study was extremely imaginative andcareful. Unfortunately, the results it obtained cannot be directly compared with those in thetwo following chapters; not surprisingly, given the date of the study, the theoretical frameworkdid not reflect concepts that have since become standard. In particular, the effects of down-ward shifts in the production function and movements along it are lumped together, and giventhe presentation of the data, the two cannot be separated with certainty.
S. Saxonhouse (1978) emphasizes the role of the national education system in Japan inproviding a basic education upon which firm-specific technical training could build.
6. The implications of this statement in terms of average and marginal cost curves of the firmare extensively discussed in Alchian (1959) and Hirschleifer (1962).
7. Economies of specialization imply that, with full utilization of fixed equipment, increasedproduct diversity results in higher unit cost because, for example, setup time increases. Thisfinding contrasts with recent discussions of economies of scope, which see unit cost as fallingand total output as rising when more products are manufactured and each type of machinery isutilized more intensively because all of the products use the same equipment. In the rypicaltextile mill, all equipment is already fully utilized on three daily shifts. There are no costreductions obtainable from economies of scope, but substantial decreases in unit cost may berealized from greater specialization.
8. The extensive literature on intraindustry trade considers a number of related issues at thenational level but does not explore the origin or stability of the initial nonspecializing equi-librium in the case in which identical products are produced by all firms. See, for example,Grubel and Lloyd (1975) and Krugman (1981).
9. These issues, in the context of multiplant firms in developed countries, are carefullyexplored by Scherer and others (1975), particularly chaps. 2 and 7, which also contain refer-ences to much of the literature. The problems posed by insufficient specialization within smalldomestic markets have been a dominant theme in analyses of industrial performance inAustralia and Canada. See Caves (1984) on Australia and the references therein to the literatureon both countries.
10. A good discussion is provided by Hillier and Lieberman (1967). Scherer and others(1975) also discuss the issue of lot size within the context of specialization.
11. Saxonhouse (1976) provides a fascinating account of the Japanese spinners' association'scollection and dissemination of information on the performance of its member firms. Severalindustry-financed textile research institutes pursue similar objectives in India and producehigh-quality research germane to the industry (ATIRA 1977). Nevertheless, results have beendisappointing in terms of industry performance.
12. For a survey and an excellent synthesis of the many types of analyses purporting toexplain the productivity of individual firms, see Nelson (1981), particularly sec. 2. Other useful
NOTES 65
summaries and analyses include Freeman and Jucker (1981), Marsh and Mannari (1976), andHorton and King (1981).
13. See the discussion of uneven diffusion of technical knowledge by Nelson and Winter(1982).
14. The dependence of a firm's productivity level on the size of the industry underlies theconcept of irreversible dynamic-scale economies developed by Marshall as well as the greatfaith in the external effects of industrialization embodied in many early development plans.
15. See, for example, Hagen (1975) and Moore (1951). Leibenstein's work on x-efficiency(1978) applies to firm- and task-level determinants of productivity but does not take intoaccount the influences of the industry and national contexts.
16. The productivity comparisons could also be carried out with superlative index numbers,as suggested by Caves, Christensen, and Diewert (1982). Their work assumes that the underly-ing production function is translogarithmic, whereas the textile engineering literature impliesthat a simpler CES form is appropriate.
17. It is necessary to analyze the technology carefully to discriminate between shifts in theproduction function and movements along it. Thus low-quality yarn that leads to high break-age rates will, other things being equal, decrease labor and machine productivity by roughlythe same percentages. Though a firm may react to this phenomenon by increasing the labor-machine ratio to restore the initial machine-output ratio, this substitution effect is separablefrom the initial neutral downward shift in the production function and constitutes a move-ment along the production function. See chapter 2 and the next section in this chapter.
18. The term q* is the right-hand side of equations 3-3a and 3-3b after the inclusion ofnational, industry, and firm-level effects and differences in capital intensity.
19. For an early and interesting application of the production frontier approach, see Timmer(1971). The most original recent application of the method is that of Nishimizu and Page(1982). A recent survey of the literature appears in Forsund, Knox-Lovell, and Schmidt (1980).
20. It is also assumed that efficiency differences are factor neutral and that the distributionparameter in the CES function or its analogue, the elasticity of output with respect to eachfactor, is the same for both firms in the comparison. The neutrality assumption is justified bythe nature of the production process (see chapter 2, where it is noted that most productionproblems such as excessive end breaks reduce the productivity of labor and equipment byequal percentages). There may also be a movement along the production function if an attemptis made to maintain machine efficiency rates.
21. For a recent review of alternative definitions, see Lucas (1984). On the relation betweenallocative and technical efficiency and the DRC, see Page (1980).
22. The omission of the impact of breakage rates in spinning is discussed below.23. Most plants do not exhibit a range count that is symmetrical about the mean count. I
have used the smaller deviation as if it were symmetrical, thus introducing a conservative biasinto the calculation. A simple functional form is used to derive actual values of PA/PBP.
24. In cost comparisons across firms within Kenya and the Philippines, low spindle-laborrates are treated as allocatively inefficient. In the international productivity comparisons, onlytechnical efficiency is considered.
25. See tables 1.2-1.4 in Subramanian and Garde (1974). Firms' decision to operate with alow capital-labor ratio to begin with is explainable in terms of differential relative factor prices;in the decomposition the effect of the difference in capital-labor ratios is captured by thecapital-labor terms in equations 3-3a and 3-3b.
26. Textile Council (1969), vol. 1, p. 73. The figures have been adjusted to measure thedownward shift in the production function before any changes occur in factor proportions.
66 BEST PRACTICE AND DEVIATIONS
27. A limited sample of the nature of product variety appears in table 2-3. Among thediffering properties of fabrics are the yarn count of the warp and weft, the number of yarns(ends and picks) per inch, and the type of weave (plain, twill, satin, and so on).
28. The Kemp-Mack tables of machine interference are used to calculate e. See Ormerod(1979), chap. 2.
29. One alternative considered for valuing used equipment was the amount for whichmachinery, but not the plant, was insured. It was not possible to obtain sufficiently detailedinformation to pursue this idea, however.
30. For an endogenous determination of the remaining life of equipment, see Rhee andWestphal (1977).
31. Recall that the optimum machine assignment per worker is (K/L)* = (wC/r)"'', where Cis a constant (equation 2-2). Then if we define a as d log(K/L)/d log(w/r), a = 0.5. This is ameasure of the ex post elasticity of substitution and establishes a presumptive case for using0.5 as the best approximation for the desired parameter.
32. For an explanation of the sources of technical substitution possibilities, see the discus-sion in chapter 2 of the determinants of machine efficiency.
33. The calculations that follow are insensitive to 10-20 percent variations in 6.
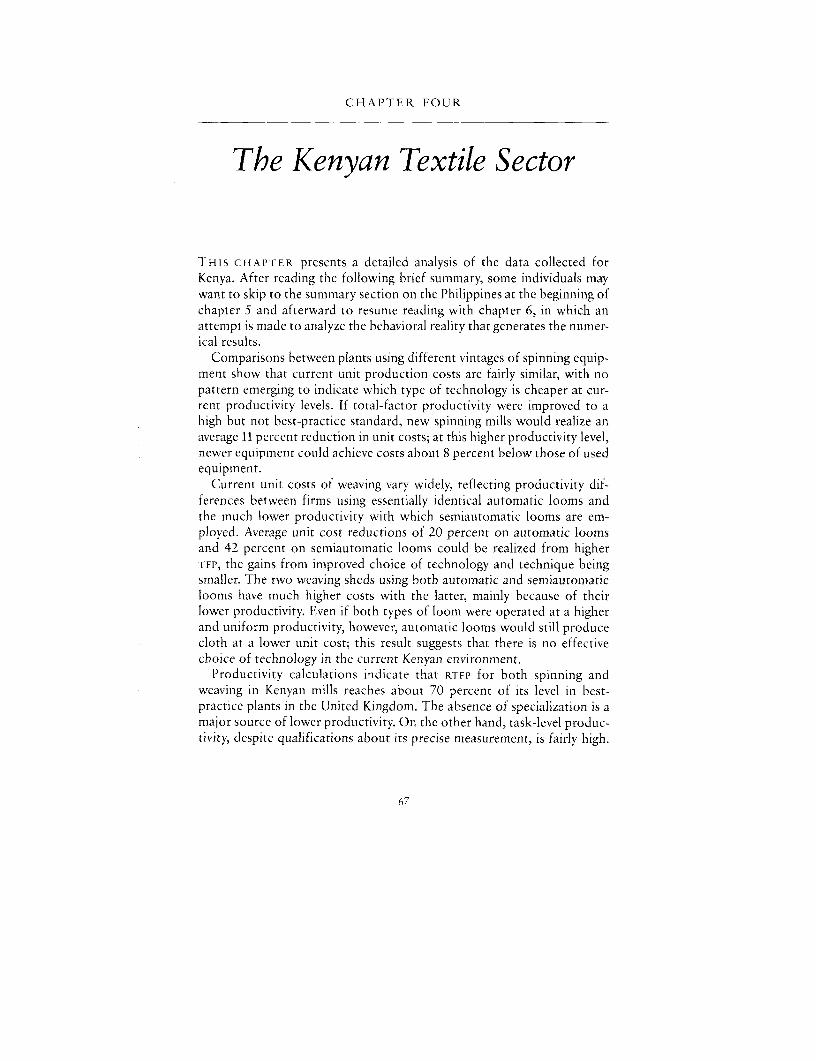
CHAPTER FOUR
The Kenyan Textile Sector
THIS CHAPTER presents a detailed analysis of the data collected forKenya. After reading the following brief summary, some individuals maywant to skip to the summary section on the Philippines at the beginning ofchapter 5 and afterward to resume reading with chapter 6, in which anattempt is made to analyze the behavioral reality that generates the numer-ical results.
Comparisons between plants using different vintages of spinning equip-ment show that current unit production costs are fairly similar, with nopattern emerging to indicate which type of technology is cheaper at cur-rent productivity levels. If total-factor productivity were improved to ahigh but not best-practice standard, new spinning mills would realize anaverage 11 percent reduction in unit costs; at this higher productivity level,newer equipment could achieve costs about 8 percent below those of usedequipment.
Current unit costs of weaving vary widely, reflecting productivity dif-ferences between firms using essentially identical automatic looms andthe much lower productivity with which semiautomatic looms are em-ployed. Average unit cost reductions of 20 percent on automatic loomsand 42 percent on semiautomatic looms could be realized from higherTFP, the gains from improved choice of technology and technique beingsmaller. The two weaving sheds using both automatic and semiautomaticlooms have much higher costs with the latter, mainly because of theirlower productivity. Even if both types of loom were operated at a higherand uniform productivity, however, automatic looms would still producecloth at a lower unit cost; this result suggests that there is no effectivechoice of technology in the current Kenyan environment.
Productivity calculations indicate that RTFP for both spinning andweaving in Kenyan mills reaches about 70 percent of its level in best-practice plants in the United Kingdom. The absence of specialization is amajor source of lower productivity. On the other hand, task-level produc-tivity, despite qualifications about its precise measurement, is fairly high.
67
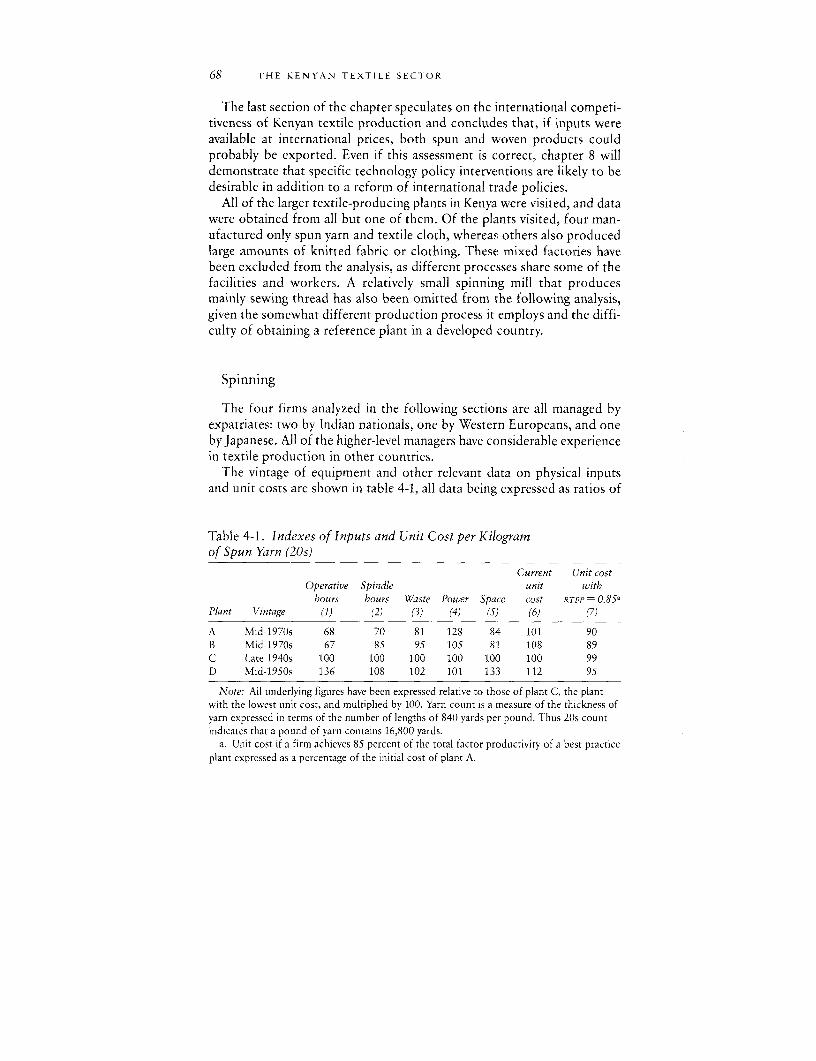
68 THE KENYAN TEXTILE SECTOR
The last section of the chapter speculates on the international competi-tiveness of Kenyan textile production and concludes that, if inputs wereavailable at international prices, both spun and woven products couldprobably be exported. Even if this assessment is correct, chapter 8 willdemonstrate that specific technology policy interventions are likely to bedesirable in addition to a reform of international trade policies.
All of the larger textile-producing plants in Kenya were visited, and datawere obtained from all but one of them. Of the plants visited, four man-ufactured only spun yarn and textile cloth, whereas others also producedlarge amounts of knitted fabric or clothing. These mixed factories havebeen excluded from the analysis, as different processes share some of thefacilities and workers. A relatively small spinning mill that producesmainly sewing thread has also been omitted from the following analysis,given the somewhat different production process it employs and the diffi-culty of obtaining a reference plant in a developed country.
Spinning
The four firms analyzed in the following sections are all managed byexpatriates: two by Indian nationals, one by Western Europeans, and oneby Japanese. All of the higher-level managers have considerable experiencein textile production in other countries.
The vintage of equipment and other relevant data on physical inputsand unit costs are shown in table 4-1, all data being expressed as ratios of
Table 4-1. Indexes of Inputs and Unit Cost per Kilogramof Spun Yarn (20s)
Current Unit costOperative Spindle unit with
hours hours Waste Power Space cost RTFP = 0.85aPlant Vintage (1) (2) (3) (4) (5) (6) (7)
A Mid-1970s 68 70 81 128 84 101 90B Mid-1970s 67 85 95 105 81 108 89C Late 1940s 100 100 100 100 100 100 99D Mid-1950s 136 108 102 101 133 112 95
Note: All underlying figures have been expressed relative to those of plant C, the plantwith the lowest unit cost, and multiplied by 100. Yarn count is a measure of the thickness ofyarn expressed in terms of the number of lengths of 840 yards per pound. Thus 20s countindicates that a pound of yarn contains 16,800 yards.
a. Unit cost if a firm achieves 85 percent of the total factor productivity of a best-practiceplant expressed as a percentage of the initial cost of plant A.
SI'INNING 69
plant C's figures multiplied by 100. (For a discussion of the input pricesemployed see the appendix to chapter 3.) For the moment the readershould ignore column 7. There are two pairs of roughly matching plants,(A, B) and (C, D). The machines used by each pair are technically compara-ble, and subjective judgment suggests that each pair also shares a dis-tinctive kind of management experience. Plants A and B are managed byexpatriates whose background is primarily in modern textile plants,whereas the managers of plants C and D have worked mainly in olderplants in other developing countries. The newer plants, A and B, exhibitgreater physical productivity: spindle hours, labor, raw material waste,and space per unit of output are all lower than in the older plants; onlyelectricity input is greater. The slightly lower unit cost of plant C (column6) relative to plants A and B, despite the latter pair's better performance inmost physical input-output coefficients, reflects the lower cost of plantC's used machinery. Firm-specific differentials that are not solely depen-dent on equipment vintage are clearly important. Firm D, for example,operating a mid-1950s plant, has greater unit cost than plant C, which usesa modernized mid-1940s plant. Moreover, plant D has higher unit require-ments for every input. The other pair of firms, A and B, use almostidentical machinery, but the former's unit cost is lower.
The determinants of unit cost are discussed further below, in terms ofthe variables used in chapter 3-technical efficiency, choice of technique,and choice of technology. Later in this chapter I present estimates of eachfirm's relative total-factor productivity. Assume that, whatever its currentRTFP, each firm could move to a level of 85 percent and thus eliminatemuch of its current technical inefficiency relative to its best-practicecounterpart.' The unit cost that would be realized at an RTFP of 85percent is shown in column 7 of table 4-1.2 The average unit cost reduc-tion for the four plants from improved technical efficiency is 11 percent;individual reductions of 1-18 percent reflect current differences in RTFP.
Once a technology has been chosen, variations in the choice of techniqueare of smaller importance. These can be read directly as the unit costdifferences between firms once productivity differentials have been elimi-nated.3 They are 1 percent between plants A and B and 4 percent betweenplants C and D, a sectoral average of 2 percent.
Finally, the cost reduction to be obtained from superior choice oftechnology A or B rather than technology C or D, at identical RTFP,
averages 8 percent, with the newer technology exhibiting the lower cost.4
Where capacity is to be expanded, more modern equipment has a lowerexpected unit cost than older equipment, provided that reasonably highRTFP can be achieved with the former. Otherwise, it may in fact be cheaperto use older equipment: compare the current unit cost of plants B and C,
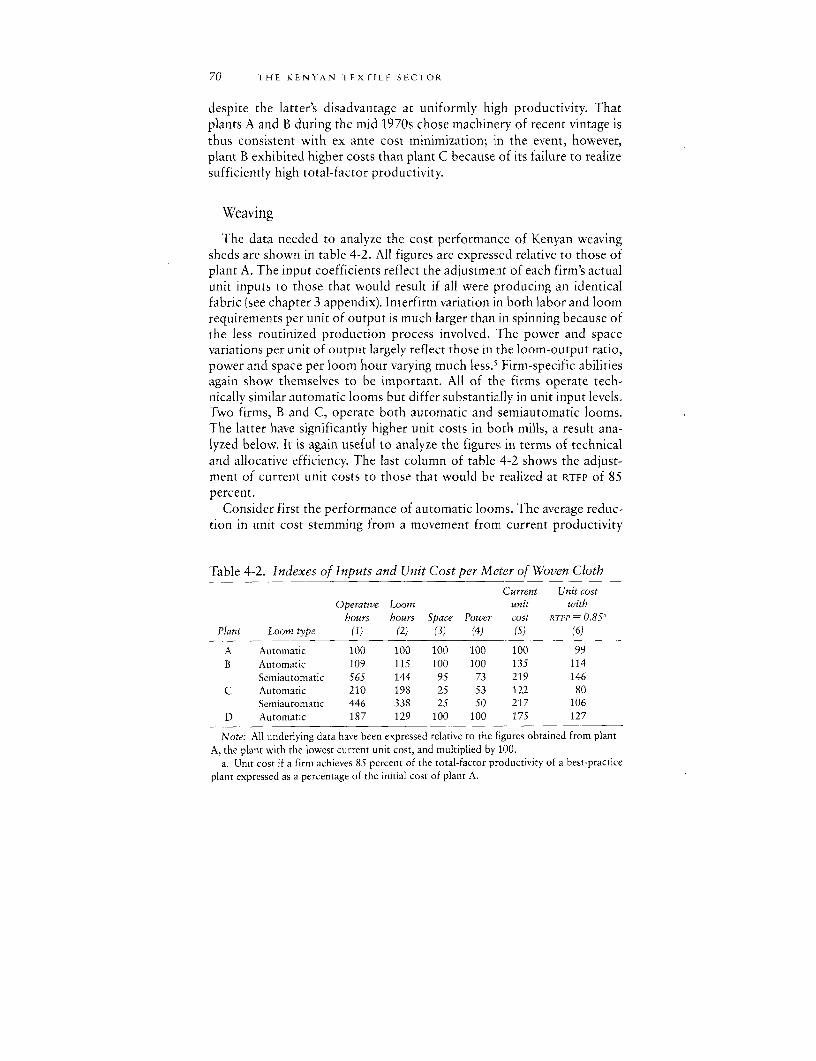
70 THE KENYAN TEXTILE SECTOR
despite the latter's disadvantage at uniformly high productivity. Thatplants A and B during the mid 1970s chose machinery of recent vintage isthus consistent with ex ante cost minimization; in the event, however,plant B exhibited higher costs than plant C because of its failure to realizesufficiently high total-factor productivity.
Weaving
The data needed to analyze the cost performance of Kenyan weavingsheds are shown in table 4-2. All figures are expressed relative to those ofplant A. The input coefficients reflect the adjustment of each firm's actualunit inputs to those that would result if all were producing an identicalfabric (see chapter 3 appendix). Interfirm variation in both labor and loomrequirements per unit of output is much larger than in spinning because ofthe less routinized production process involved. The power and spacevariations per unit of output largely reflect those in the loom-output ratio,power and space per loom hour varying much less.5 Firm-specific abilitiesagain show themselves to be important. All of the firms operate tech-nically similar automatic looms but differ substantially in unit input levels.Two firms, B and C, operate both automatic and semiautomatic looms.The latter have significantly higher unit costs in both mills, a result ana-lyzed below. It is again useful to analyze the figures in terms of technicaland allocative efficiency. The last column of table 4-2 shows the adjust-ment of current unit costs to those that would be realized at RTFP of 85percent.
Consider first the performance of automatic looms. The average reduc-tion in unit cost stemming from a movement from current productivity
Table 4-2. Indexes of Inputs and Unit Cost per Meter of Woven ClothCurrent Unit cost
Operative Loom unit withhours hours Space Power cost RTFP = 0.85'
Plant Loom type (1) (2) (3) (4) (5) (6)
A Automatic 100 100 100 100 100 99B Automatic 109 115 100 100 135 114
Semiautomatic 565 144 95 73 219 146C Automatic 210 198 25 53 122 80
Semiautomatic 446 338 25 50 217 106D Automatic 187 129 100 100 175 127
Note: All underlying data have been expressed relative to the figures obtained from plantA, the plant with the lowest current unit cost, and multiplied by 100.
a. Unit cost if a firm achieves 85 percent of the total-factor productivity of a best-practiceplant expressed as a percentage of the initial cost of plant A.
PERFORMANCE 71
levels to the higher one is 20 percent. There is also a reversal in the unitcost ranking of sheds A and C, the former employing an automatic Euro-pean-made loom, the latter a similar loom of Japanese manufacture. Thecurrent disparity in unit cost is not inherent in the properties of the loomsbut reflects the difference in RTFP achieved by each firm. Except in thecase of shed D, little of the cost differential remaining after the uniformproductivity adjustment (column 6) reflects variation in the choice oftechnique; A, B, and C all exhibit similar labor-loom ratios (column 1divided by column 2). Rather it stems mainly from differences betweensheds A and B in the acquisition cost of essentially identical looms andfrom shed C's gain from the lower capital charge of its used looms.6 Someof shed C's cost advantage is also a result of the lower power requirementsof its Japanese looms. Finally, shed D's high cost relative to that of theother three firms even at RTFP of 85 percent mainly reflects its excessivelabor-loom ratio relative to that of the others. The reason for this discrep-ancy cannot easily be identified.
Consider now the performance of the semiautomatic looms. The aver-age reduction in unit cost obtainable from an improvement in technicalefficiency is 42 percent, considerably larger than that obtainable withautomatics. Thus part of the current cost advantage enjoyed by automaticlooms stems from their operation at productivity levels closer to bestpractice than those attained by semiautomatic looms. Furthermore, al-though firm C's unit cost when employing semiautomatics at 85 percentRTFP would be lower than that realized by firms B and D with automaticlooms at the same RTFP level, it remains true that firm C's own cost at thehigher productivity level would be about 25 percent less than with semi-automatics.
The implications of the choice of technique with a given technologyalso appear clearly in a comparison of the results from the use of semi-automatic looms in two firms. At the uniform 85 percent RTFP level, plantC's unit cost is 27 percent below plant B's, mainly reflecting the former'smuch lower labor-capital ratio (column 1 divided by column 2). Even atlow Kenyan wages, too much substitution of labor for capital can occur. Itis difficult to determine why firm B used so much more labor per unit ofcapital.
Performance Relative to Best Practice
Spinning
The two older Kenyan plants, C and D, are compared with best-practicefirms of 1950 and 1955.7 The newer plants, A and B, established in the
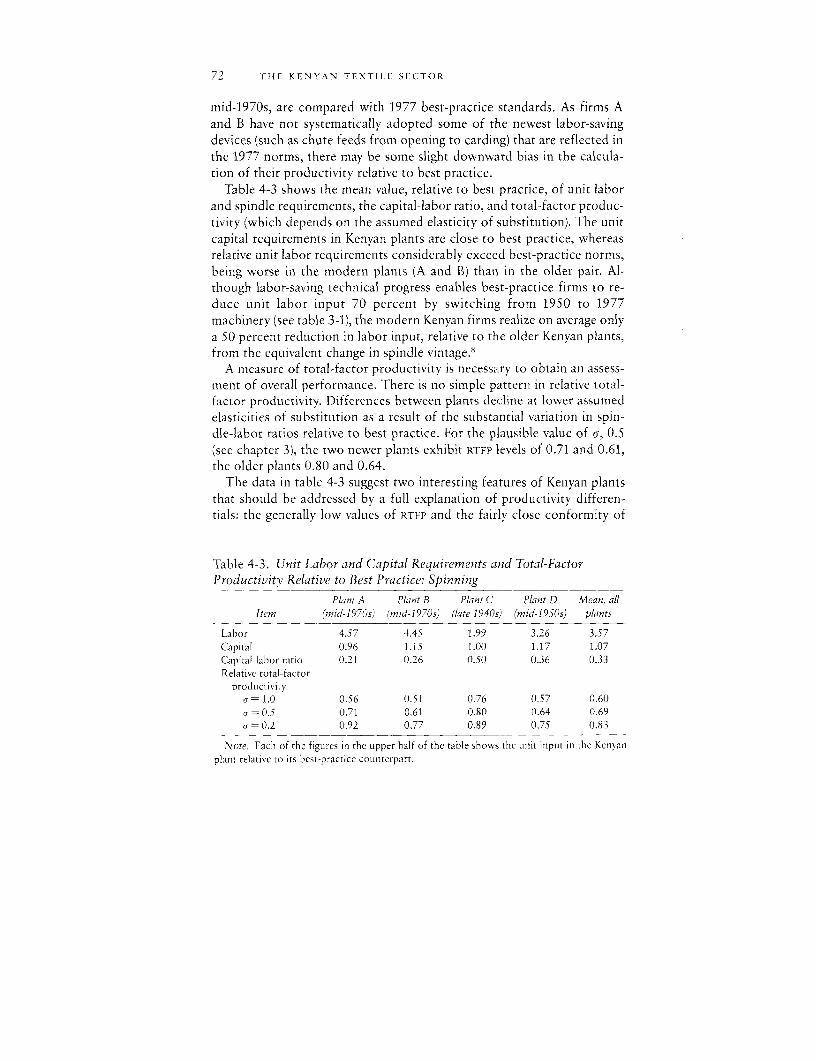
72 THE KENYAN TEXTILE SECTOR
mid-1970s, are compared with 1977 best-practice standards. As firms Aand B have not systematically adopted some of the newest labor-savingdevices (such as chute feeds from opening to carding) that are reflected inthe 1977 norms, there may be some slight downward bias in the calcula-tion of their productivity relative to best practice.
Table 4-3 shows the mean value, relative to best: practice, of unit laborand spindle requirements, the capital-labor ratio, and total-factor produc-tivity (which depends on the assumed elasticity of substitution). The unitcapital requirements in Kenyan plants are close to best practice, whereasrelative unit labor requirements considerably exceed best-practice norms,being worse in the modern plants (A and B) than in the older pair. Al-though labor-saving technical progress enables best-practice firms to re-duce unit labor input 70 percent by switching from 1950 to 1977machinery (see table 3-1), the modern Kenyan firms realize on average onlya 50 percent reduction in labor input, relative to the older Kenyan plants,from the equivalent change in spindle vintage.8
A measure of total-factor productivity is necessalry to obtain an assess-ment of overall performance. There is no simple pattern in relative total-factor productivity. Differences between plants decline at lower assumedelasticities of substitution as a result of the substantial variation in spin-dle-labor ratios relative to best practice. For the plausible value of r, 0.5(see chapter 3), the two newer plants exhibit RTFP levels of 0.71 and 0.61,the older plants 0.80 and 0.64.
The data in table 4-3 suggest two interesting features of Kenyan plantsthat should be addressed by a full explanation of productivity differen-tials: the generally low values of RTFP and the fairly close conformity of
Table 4-3. Unit Labor and Capital Requirements and Total-FactorProductivity Relative to Best Practice: Spinning
Plant A Planit B Plant C Plant D Mean, allItem (mid-1970s) (niid-l197S' (late 1940s) (mid-1950s) plants
Labor 4.57 4.45 1.99 3.26 3.57Capital 0.96 1.15 1.00 1.17 1.07Capital-labor ratio 0.21 0.26 0.50 0.36 0.33Relative total-factor
producrivitya = 1.0 0.56 0.51 0.76 0.57 0.60
= 0.5 0.71 0.61 0.80 0.64 0.69= 0.2 0.92 0.77 0.89 0.75 0.83
Note: Each of the figures in the upper half of the table shows the unit input in the Kenyanplant relative to its besr-practice counterpart.
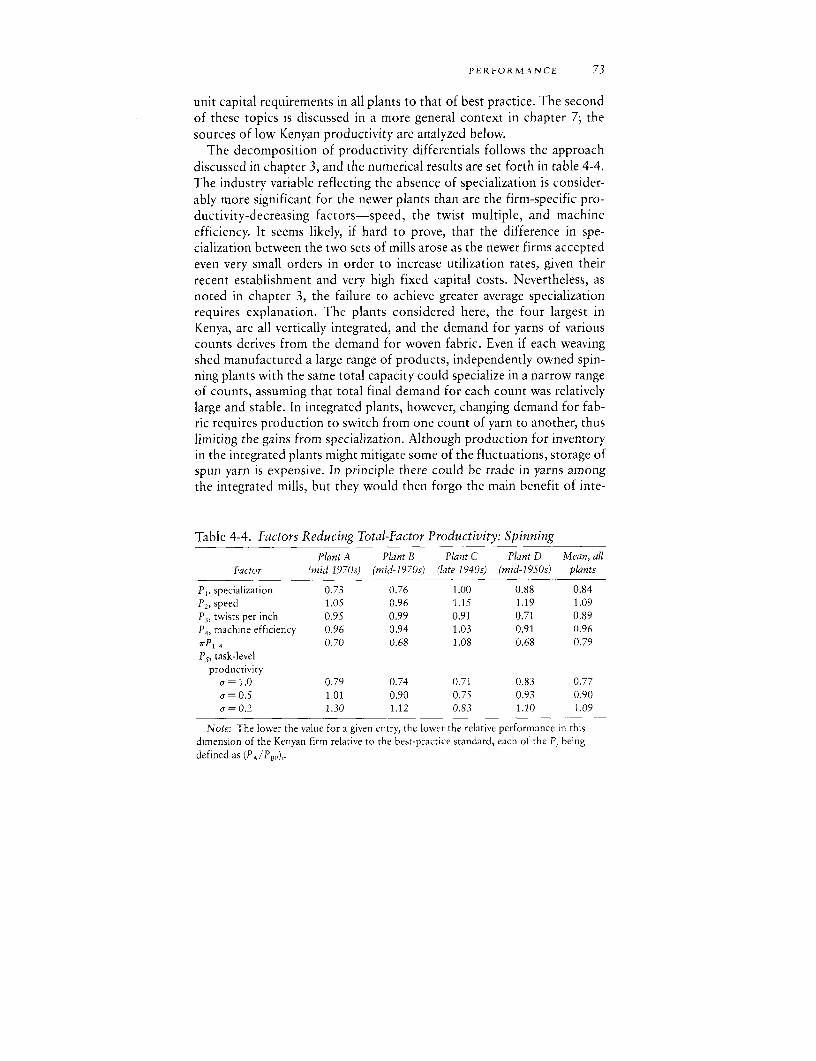
PERFORMANCE 73
unit capital requirements in all plants to that of best practice. The secondof these topics is discussed in a more general context in chapter 7; thesources of low Kenyan productivity are analyzed below.
The decomposition of productivity differentials follows the approachdiscussed in chapter 3, and the numerical results are set forth in table 4-4.The industry variable reflecting the absence of specialization is consider-ably more significant for the newer plants than are the firm-specific pro-ductivity-decreasing factors-speed, the twist multiple, and machineefficiency. It seems likely, if hard to prove, that the difference in spe-cialization between the two sets of mills arose as the newer firms acceptedeven very small orders in order to increase utilization rates, given theirrecent establishment and very high fixed capital costs. Nevertheless, asnoted in chapter 3, the failure to achieve greater average specializationrequires explanation. The plants considered here, the four largest inKenya, are all vertically integrated, and the demand for yarns of variouscounts derives from the demand for woven fabric. Even if each weavingshed manufactured a large range of products, independently owned spin-ning plants with the same total capacity could specialize in a narrow rangeof counts, assuming that total final demand for each count was relativelylarge and stable. In integrated plants, however, changing demand for fab-ric requires production to switch from one count of yarn to another, thuslimiting the gains from specialization. Although production for inventoryin the integrated plants might mitigate some of the fluctuations, storage ofspun yarn is expensive. In principle there could be trade in yarns amongthe integrated mills, but they would then forgo the main benefit of inte-
Table 4-4. Factors Reducing Total-Factor Productivity: Spinning
Plant A Plant B Plant C Plant D Mean, allFactor (mid-1970s) (mid-1970s) (late 1940s) (mid-1950s) plants
P,, specialization 0.73 0.76 1.00 0.88 0.84P., speed 1.05 0.96 1.15 1.19 1.09P3, twists per inch 0.95 0.99 0.91 0.71 0.89P4 , machine efficiency 0.96 0.94 1.03 0.91 0.967rP,-4 0.70 0.68 1.08 0.68 0.79P5, task-level
productivitya= 1.0 0.79 0.74 0.71 0.83 0.77o 0.5 1.01 0.90 0.75 0.93 0.90sr=0.2 1.30 1.12 0.83 1.10 1.09
Note: The lower the value for a given entry, the lower the relative performance in thisdimension of the Kenyan firm relative to the best-practice standard, each of the P, beingdefined as (PA/P,p),.
74 THE KENYAN TEXTILE SECTOR
gration, namely, low transportation cost between spinning and weavingsheds. More important, in an oligopolistic market, competitors might bereluctant to supply each other with yarn that would ultimately permitother mills to compete with them.
These results demonstrate that nothing in the technology itself preventsthe modern plants from obtaining the higher RTFI' of plant C (table 4-3,v= 0.5). Rather the decomposition shows that the newer plants' poorerperformance stems from their lack of product specialization.
One result of particular interest is that firms operating older spindlesnot only ran them at a greater speed (relative to best practice) than didnewer firms but also imparted a greater number of twists per inch, tendingto offset some of the greater spindle speed. The higher speed of spindlesconfirms empirical findings in other countries that developing countryfirms may attempt to "stretch" their capital and achieve lower capital-output ratios (Ranis, 1973). The concomitant higher twist multiple,however, shows that such capital-augmenting activity may be partly offsetby the firms' inability to master the preparatory processes (see chapter 6for details) and that the capital-stretching achievement implied by focus-ing solely on speed may seem less important with fuller documentation ofall of a firm's production parameters.9
Firms C and D use a smaller percentage of longer staple yarns than dofirms A and B, and their use of a high twist multiple reflects, to a quan-titatively small extent, a lower-quality fiber mix. Both firms attribute theirbehavior to quotas on imports of non-Kenyan cotton, though plants Aand B deny the significance of quotas. The difference in the fiber mix,however, cannot alone account for the particularly high twist multipleused by plant D: other deficiencies, such as inadequate blending, arepresent.
Task-level productivity is quite close to unity for three of the firms,with values of 0.90, 0.93, and 1.01, assuming that 0.5 is the correct valuefor the elasticity of substitution. Even the remaining firm's value of 0.75 ishigher than might be inferred from the literature o0] labor inefficiency indeveloping countries (see chapter 3). Are these relatively high values anartifact owing to the decomposition procedure, or do they capture thereality of the production process? Here it is important to recall that task-level productivity is calculated as a residual. If one or more productivity-depressing factors whose value relative to best practice is less than unityhave been omitted, Kenyan relative task-level productivity will be under-stated in the computations. Similarly, if any of the PA/PBP terms that areincluded have a mistakenly high value, then measured TLP will again betoo low. Both of these errors, particularly the first, are more likely thantheir opposites. It is thus probable that any misestimate of task-level
PIERFORMANCE 75
productivity understates it and that the calculated figure represents alower bound of its actual value; this in turn suggests that performancegaps in individual tasks are not major sources of low productivity inKenyan spinning.
A related question is whether high TLP would continue to hold ifmachine loads per worker were increased or whether the current resultobtains precisely because of the low capital-labor ratio chosen by theplants.'0 One weak test of the last hypothesis is the relationship betweenobserved values of the capital-labor ratio and task-level productivity.There is no systematic relationship in spinning, although the plants withthe highest and lowest TLP exhibit the lowest and highest relative capital-labor ratios; in weaving, no relationship exists despite the greater oper-ative skills required. More generally, given the simple nature of the indi-vidual operative's tasks in cotton textile manufacturing, there is littlereason to expect nonneutral productivity differences such that TLP
decreases with an increase in machine load per worker."1 Although thepossibility of overestimating task-level productivity cannot be ruled out,the more extensive evidence from the Philippines shows no relationshipbetween the equipment-worker ratio in individual plants and their mea-sured task-level productivity, despite 100 percent variations in the spindle-labor ratio.
The high measured value of TLP is partly attributable to the carefuleducation programs that have been instituted by the Kenyan firms. Theseinclude training for up to four years in other developing country subsidi-aries of the controlling company and intensive year-long programs withinthe local mills. The regional isolation of each firm within Kenya has theinteresting effect of reducing its fear of losing locally trained workers,while education at more advanced mills in other developing countries,rather than in Western Europe, increases the probability that trainees willreturn to Kenya.
Consider now the question of the optimal choice of technology. Intable 4-1 it was shown that, when all firms achieve RTFP of 85 percent,plant B realizes the lowest cost. Table 4-4 sheds light on the possibilitiesfor such uniform moves toward best practice and the varieties of ca-pabilities needed if these gains are to be realized. Firm C, using olderequipment, is already close to or above best practice in all dimensions ofperformance except task-level productivity. Indeed, one sees that its suc-cessful performance is linked to a high degree of specialization as well asits specifically technological capacities measured by relative performancein speed (P,) and spindle efficiency (P4). The main potential source of stillgreater productivity is task-level productivity, which is likely to be themost difficult activity to improve because it requires changes in manage-
76 THE KENYAN TEXTILE SECTOR
ment style, including the introduction of wage incentive systems andtraining and recruiting programs.
In contrast, firms A and B suffer mainly from inadequate specialization,which could be remedied by industrywide coordination to rationalizeproduction combined with a liberalized trade regime to prevent monop-oly profits (chapter 9 discusses these issues). For these firms, a movetoward best practice from current productivity levels and the resultantchange in unit cost rankings is unlikely without some policy interventionthat would encourage greater specialization.'2
Weaving
In weaving, both single-input requirements relative to best practice arehigher than they are in spinning, the mean relative labor requirement in allsheds is 5.15, the mean relative capital requirement is 1.21, and the relativetotal-factor productivity for all sheds is 0.62, if we assume that cr = 0.5(table 4-5). Both the single-input requirements and total-factor productiv-ity are worse for semiautomatic looms than for automatic ones.
The decomposition of the differences in total-factor productivityshown in table 4-6 provides some insight into the nature of low productiv-ity in the Kenyan weaving sector. A major source is the typically very smallsize of production runs. The particular result shiown, that total-factorproductivity in all sheds decreases by 37 percent on average, reflects theassumption that Kenyan plants exhibit an average length of run (measuredby the number of warp changes per 10,000 hours) that would place themat the lower quartile of British firms.'3 Clearly, the precise magnitude, firmby firm, is open to some degree of uncertainty.
The second potential source of low productivity is below-norm ma-chine efficiency (see table 4-6). It will be remembered that the measure ofinefficiency is deviation from achievable utilization rates, given the cur-rent loom assignment per worker, breakage rates, and patrol and relaxa-tion time. The automatic looms in all sheds except shed C are operated atefficiency rates relatively close to best practice. In contrast, nonautomaticsheds in plants B and C realize efficiency levels that are 82 percent and 54percent of best practice. Poor performance in these sheds is partly at-tributable to the failure to use warp stop mechanisms to detect brokenends, a puzzling deficiency, given good general performance in mainte-nance. Moreover, this difficulty did not reflect a temporary shortage butrepresented a long-term decision not to introduce warp stop mechanisms.
The relatively high efficiency levels in the automatic loom sheds ofplants A, B, and D are achieved by devoting considerable effort to bothmaintenance and inventory control. The general manager of plant A, for
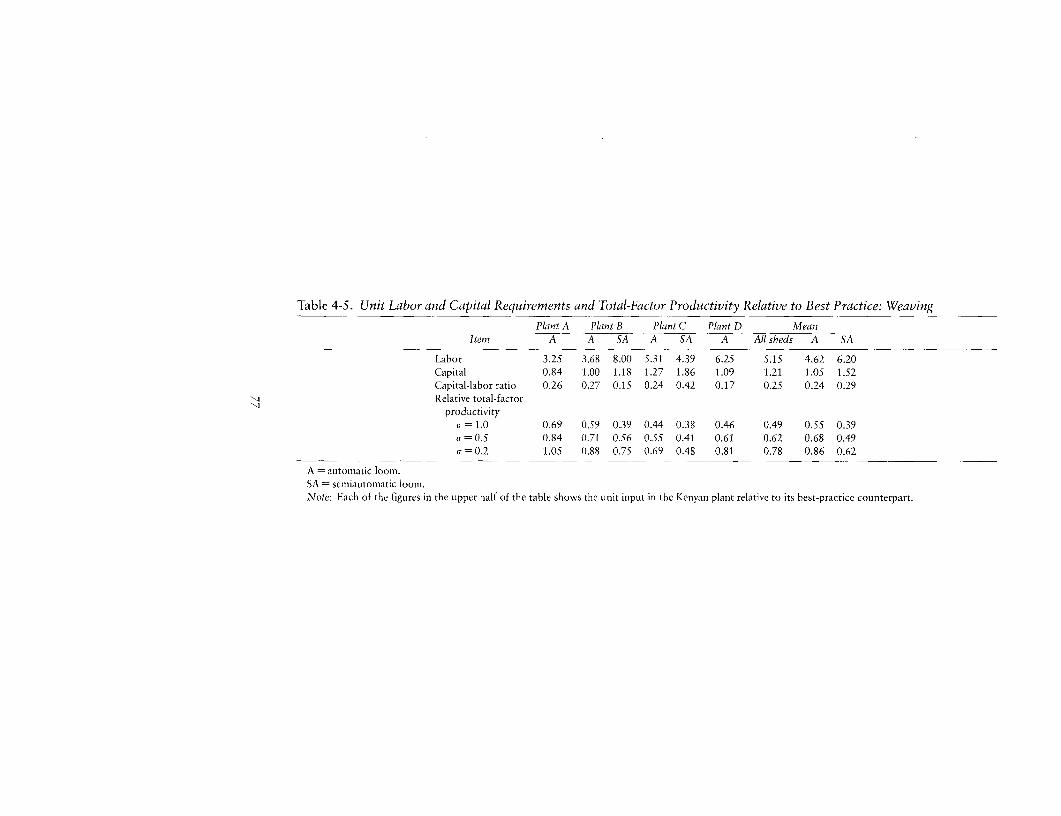
Table 4-5. Unit Labor and Capital Requirements and Total-Factor Productivity Relative to Best Practice: Weaving
Plant A Plant B Plant C Plant D MeanItem A A SA A SA A All sheds A SA
Labor 3.25 3.68 8.00 5.31 4.39 6.25 5.15 4.62 6.20Capital 0.84 1.00 1.18 1.27 1.86 1.09 1.21 1.05 1.52Capital-labor ratio 0.26 0.27 0.15 0.24 0.42 0.17 0.25 0.24 0.29Relative total-factor
productivitya = 1.0 0.69 0.59 0.39 0.44 0.38 0.46 0.49 0.55 0.39a = 0.5 0.84 0.71 0.56 0.55 0.41 0.61 (1.62 0.68 0.49cr = 0.2 1.05 0.88 0.75 0.69 0.48 0.81 0.78 0.86 0.62
A automatic loom.SA semiautomatic loom.Note: Each of the figures in the upper half of the table shows the unit input in the Kenyan plant relative to its best-practice counterpart.
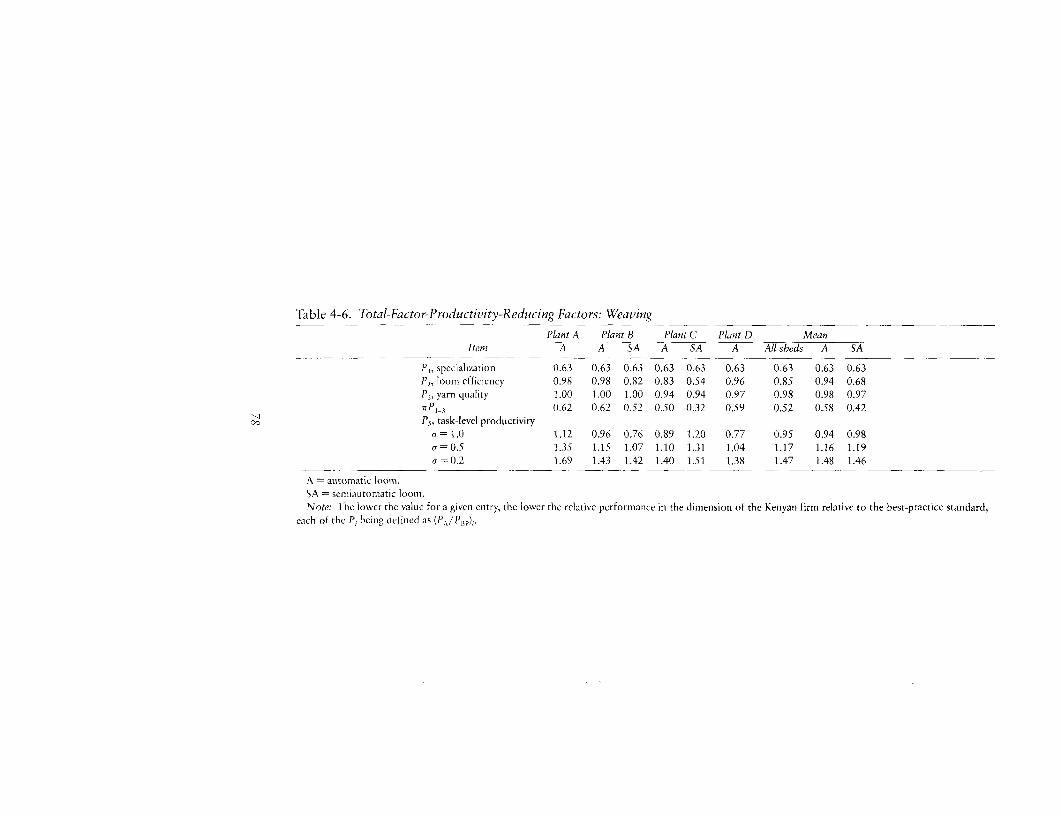
Table 4-6. Iotal-Factor-Productivity-Reducing Factors: Weaving
Plant A Plant B Plant C Plant D MeanItem A A SA A SA A All sheds A sA
P1, specialization 0.63 0.63 0.63 0.63 0.63 0.63 0.63 0.63 0.63P, loom efficiency 0.98 0.98 0.82 0.83 0.54 0.96 0.85 0.94 0.68P3, yarn quality 1.00 1.00 1.00 0.94 0.94 0.97 0.98 0.98 0.972rP1 3 0.62 0.62 0.52 0.50 0.32 0.59 0.52 0.58 0.42P5, task-level productivity
a= 1.0 1.12 0.96 0.76 0.89 1.20 0.77 0.95 0.94 0.98a = 0.5 1.3.5 1.15 1.07 1.10 1.31 1.04 1.17 1.16 1.19a= 0.2 1.69 1.43 1.42 1.40 1.51 1.38 1.47 1.48 1.46
A automatic loom.SA = semiautomatic loom.Note: Thc lower the value for a given entry, the lower thc relative performance in the dimension of the Kenyan firm relative to the best-practice standard,
each of the Pi being defined as (P,IPI)i.
PERFORMANCE 79
example, reports that 50 percent of his work week is devoted to ensuringthat supplies of raw materials and spare parts are adequate; the firmemploys twenty-three expatriates, including a large number of technicianswho provide the basic preventive maintenance program. In contrast, plantC trains and employs domestic maintenance personnel who are frequentlylured away by firms in other sectors. For this reason it applied for workpermits for foreign technicians, requests not acted upon with alacrity,given the government's interest in ensuring that technical skills were trans-ferred to Kenyan residents. The resulting inability to provide continuousmaintenance and to service defective equipment is one source of the lowerrelative productivity in plant C. The problem also provides one exampleof a nationwide shortcoming, inadequate vocational training, that is diffi-cult to remedy for individual firms.
Finally, although plant C, unlike the other firms, has encouraged localmachine shops to produce simple spare parts, more complicated parts areobtained abroad. It reports delays in obtaining foreign-made spares be-cause of the existence of quantitative restrictions on imports, althoughthis difficulty would not hamper production if sufficient inventories weremaintained. Assuming that the firm could finance higher inventory levels,its failure to do so in the face of the substantial costs implied by lowerthan technically feasible equipment utilization suggests a failure of ra-tional calculation.14 This may in turn reflect the difficulty, particularly invery complex and shifting economic environments, of scanning the wholerange of desirable actions and choosing among them. Even in more stablecircumstances, bounded rationality clearly limits the set of actions thatcan reasonably be evaluated (see Nelson and Winter 1982).
To ascertain the impact on unit cost of equalizing relative loom effi-ciency in both automatic and nonautomatic sheds, the level of unit coststhat would be realized if loom efficiency relative to best practice were thesame in each shed has been calculated.'5 Thus the value of P2 (in table 4-6)for semiautomatic looms is set equal to that for automatic looms oper-ated by the same firm. The relative unit costs (automatic versus semi-automatic) before and after this change in machine efficiency levels are:
Plant B Plant CCurrent loom efficiencv 0.62 0.56Equalized relative loom efficiency 0.74 0.87
The difference in unit costs is narrowed. The results indicate, however,that, given existing firm and worker abilities, semiautomatic looms do notcurrently provide an efficient technological alternative to conventionalautomatic looms. It is equally clear from other evidence, however, thatthis result is not inherent in the physical equipment but is decisively
80 THE KENYAN TEXTILE SECTOR
affected by changeable features of the economic environment, includingboth managerial and labor skills.'6
Potential Competitiveness
Despite the lower total-factor productivity exhibited in Kenyan plantsrelative to best practice, most of them could probably export cloth if theirpurchased inputs were available at international prices and were not sub-ject to tariffs, quotas, and the uncertain availability of specific qualities offibers. Because each of the plants is integrated, the potential for clothexports depends on efficiency not only in weaving but also in spinning.17
The potential costs of each process in 1980 had liberalization occurredare considered in turn.
In spinning, the input coefficients used are thosc prevailing in Kenya in1980 and those characterizing U.K. best practice in the late 1970s; inweaving, the comparisons are between input coefficients for Kenya in1980 and U.K. best-practice coefficients in 1968. As noted in chapter 3,however, more recent estimates of U.K. performance for 1976 by Pickettand Robinson indicate relatively little difference between the 1968 and1976 coefficients. Thus the rough cost estimates are a guide to competi-tiveness relative to the better U.K. firms that do export, although as notedbelow a more relevant market test requires comparisons with low-costexporters of East Asia.
The comparison of Kenyan spinning plants using equipment of 1970svintage with best-practice British plants of the late 1970s allows a fairlygood approximation of comparative yarn production costs then prevailingand permits a generalization to the two other older mills. In the late1970s, British textile wages for operatives were roughly nine times thoseof Kenya, while labor productivity was at most 450 percent greater (table4-3). Capital productivity was comparable, as were market rates of interestin the two countries. Power costs per unit were also similar, althoughspace was somewhat cheaper in Kenya. Hence apart from raw materialcosts, unit production cost was less in Kenya despite lower total-factorproductivity. Competitiveness in relation to British plants cannot be ad-vanced as a demonstration of the ability to export, though the betterBritish plants do meet international competition. Information on thecosts of East Asian producers is clearly more germane.
Wages in the major exporting nations of East Asia were considerablyabove those in Kenya, their shipping costs to most of the countries of theOrganization for Economic Co-operation and Development (OECD) weregreater, and it is likely that their fiber costs were also higher for geograph-
NOTES 81
ical reasons. Unless the productivity of the Asian mills was markedlysuperior to that of the better British firms, it seems likely that the twomodern Kenyan firms could, in fact, have matched the cost of yarn ifinputs had been freely available at international prices. This statement istrue of the two older plants as well, insofar as table 4-1 reports costsresembling those of the newer plants. Moreover, the admittedly roughcost calculations in this section are purely static, with no allowance forthe benefits likely to accrue from the specialization made possible by ashift to exports. These would be particularly large for the two modernplants that exhibited relatively low degrees of specialization (table 4-4).Other productivity gains could also be expected; for example, to theextent that the use of inferior fiber requires a higher twist multiple than istechnically desirable, a small decrease in twists per inch-a possibility iflowered trade barriers made better fiber available-would decrease unitcost. More generally, a growing body of literature attests to the impor-tance of learning from technical advice provided by foreign purchasers(Morawetz 1981; Westphal, Rhee, and Pursell 1981) and these would pre-sumably accrue in Kenya as well if foreign firms became significant pur-chasers of cloth. As the analysis of the sources of productivitydifferentials demonstrates, there is considerable scope for such learning inyarn production."8
In the case of weaving, even the largest labor productivity differentialsshown in table 4-5 for automatic looms would have yielded lower laborcost in Kenyan plants.'9 Moreover, British weaving plants had relativelygood comparative labor productivity in the late 1960s (chapter 7). Giventhe similarity of 1968 and 1976 best-practice coefficients, the Kenyanfirms, even at actual 1980 levels of productivity, should have been able toexport if their yarn costs were similar to those prevailing internationally.Furthermore, as in the case of spinning, the dynamic cost picture couldwell change if firms were to export, and the potential benefits of spe-cialization would loom quite large.
Although these questions of current and potential international costcomparisons are of great interest, it is impossible to pursue them furtherwithout comparably detailed data from the major producer countries.Unfortunately obtaining such data is a major project in its own right.2 0
Notes
1. Some uniform figure is necessary to carry out the analysis; 85 percent is often used in exante project appraisal. The assumed change in productivity affects all input requirementsuniformly (except for waste, which is close to best-practice levels in all plants). Both electricityand space requirements are affected, as they vary directly with the spindle-output ratio. The
82 THE KENYAN TEXTILE SECTOR
feasibility of the postulated change in productivity is discussed below. The shift to RTF1' = 0.85corresponds to a move from C2 to C] or C3 to C4 in figure 3-2, if we assume, to keep thegeometry simple, that CC represents RTFP of 0.85 rather than best practice itself, as it does inthe discussion of that figure.
2. The precise value of the decrease in unit cost depends on the initial value of RTFP, whichitself varies with the size of the elasticity of substitution. See table 4-3 and the discussion of therole of the elasticity of substitution in chapter 3. The calculation of unit cost in the lastcolumn of table 3-1 is based on the improvement from the current RT1FP with u = 0.5, the mostplausible value of the parameter, given the technological basis of short-run factor substitution.See the discussion in chapter 2 and chapter 3.
3. The cost differences correspond to those incurred in producing at C4 and C] in figure 3-2.4. Some of firm B's equipment is manufactured in India under license from a European
manufacturer. If the lower price of this Indian-produced equipment had been employed in thecost calculation rather than the price of European-manufactured equipment, firm B wouldexhibit still lower cost. The European price is employed, as it was not possible to obtain pricequotations from the Indian supplier, although the firm using the equipment indicated that theprice was considerably below that of the European licenser.
5. The lower use of power in firm C despite its greater loom-output ratio reflects the designof its Japanese loom. The smaller space requirement arises because much smaller aisles sepa-rate looms in this plant rather than because the dimensions of the looms themselves differ.
6. See the appendix to chapter 3 for a brief discussion of equipment prices. It could beargued that the failure to obtain the lowest available price for equipment of a given designconstitutes still another form of inefficiency that merits a separate category, perhaps searchinefficiency. I think this argument would overextend the benefits of the existing taxonomy. Inthe categories suggested in chapter 2, disparities in equipment prices may reflect one of thosesecond-level allocational decisions that I do not pursue in the current book.
7. The comparison presents some problems for plant C. The basic equipment in plant C is of1930-50 vintage. The slight improvement embodied in 1950 best-practice relative to thissomewhat older machinery may lead to an overstatement of unit labor requirements relative tobest practice. Some of C's equipment has been modernized, however, and thus unit laborinputs have been reduced. Although the net result of these two factors is not easily quantified,textile engineers claim that the use of 1950 best practice for comparisons with plant C is notbiased.
8. This result uses the absolute level of labor input per unit of output for each firm andcannot be calculated from table 4-3.
9. Analyses of international data presented in chapter 7 indicate that the East Asian coun-tries, but not other developing countries, have been able to increase speed without sustainingoffsetting reductions in twists per inch or efficiency.
10. This is the same question as whether task-level productivity is neutral with respect to thecapital-labor ratio, an assumption that underlies the calculations. The plausibility of thisassumption is also suggested by the analysis of the spinning process in chapter 2. This assump-tion has been a staple of the econometric production function literature, and many tests,including the original Arrow, Chenery, Minhas, and Solow (1961) article, have confirmed it.
11. See, for example, ito (1972).12. As will be noted below, access to inputs at world market prices would allow at least
some of the manufacturers to realize profitable exports, thus also promoting specialization.13. The reason for using a uniform assumption about the length of runs is the inability of
some of the firms to provide an estimate of either the number of warp changes per period orthe average length of run. Most firms reported that they were willing to produce a batch assmall as 2,000 yards; the two newest firms reported weaving thirty-eight and forty fabric types
NOTES 83
(different yarn count and construction combinations). Even if the minimum acceptable orderwere 6,000 yards, and if twenty looms were devoted to weaving a given style, only three days ofthree-shift production would be needed to complete the order. Thus the assumption of auniform 37 percent reduction in productivity may well be conservative. Although it is impossi-ble to discriminate between firms in this dimension, all of the statements indicate so muchvariation in product that the uniform approximation is unlikely to be grossly in error.
14. As noted in chapter 2, it is difficult to explore the rationality of such second-levelintrafirm decisions. For some numerical results regarding the benefits and costs of differentinventory policies, see chapter 6.
15. The implication is still that semiautomatic looms are operated at a lower level ofabsolute efficiency, given that best-practice machine efficiency is greater on automatic looms.
16. Rhee and Westphal (1977); also see chapter 2 above.17. It is occasionally argued that the textile sector should not have integrated factories; that
is, spinning and weaving should be done in physically separate plants so that management canconcentrate on one process or the other. As noted in chapter 2, evaluation of the organizationof the sector requires detailed information on transport and other costs that are beyond thescope of this study.
18. As shown in chapter 7, international differences in total-factor productivity among thedeveloped countries are substantial in spinning and are most likely attributable to variations inlevels of specialization.
19. Unless there were radical changes in the productivity of semiautomatic looms, theywould not be relevant for the production of exports as they were in the case of Korea analyzedby Rhee and Westphal (1977).
20. For a sample of the information needed and the extensive organizational requirementsfor obtaining it, see Textile Council (1969), vols. I and 2, especially chaps. 5 and 8 and relevantappendixes. These studies were carried out by a large international textile consulting firm andrely extensively on closely guarded commercial information.
CHAPTER FIVE
The Philippine Textile Sector
ELEVEN COMPANIES were visited; with one exception, all were inte-grated mills operating both spinning and weaving plants. Several had tworelated but separate spinning mills. Fifteen spinning plants were examined,including two that used open-end spinning. All firms were owned andlargely managed by Philippine nationals; in a fevv instances, importantmanagerial personnel came from other countries in East Asia.
Unit costs vary considerably in spinning, the interfirm differentialsbeing much larger than they are in Kenya. The plant with the lowest unitcost employs equipment of mid-1950s vintage, although its competitorsgenerally use newer m.achinery. At a uniformly high level of productivityfor all firms, the current lowest-cost plant maintains its rank, but the sizeof its advantage is considerably diminished. At the assumed high level ofproductivity, both very old equipment and very new open-end equipmentmanifest greater costs than recently made conventional ring frames. Unitcost could be reduced by an average of 15 percent if all firms were able toachieve a uniform level of 85 percent relative total-factor productivity.
Unit cost also varies widely in weaving, despite the fact that most firmsuse similar looms. A 65 percent average cost reduction could be obtainedfrom a combination of improved technical efficiency and an alteration inthe labor-loom ratio, with the former accounting for three-fifths of thegain.
In spinning, average productivity performance as measured by relativetotal-factor productivity exhibits a mean of 73 percent, fairly similar tothat in Kenya. The average level realized in weaving is considerably lower,however, at 55 percent. In both activities, the inability to realize produc-tivity gains from greater specialization accounts for a major part of theshortfall in productivity, although in weaving a considerable fraction isalso attributable to low loom efficiency-some of which stems from alack of spare parts. As in Kenya, in neither spinning nor weaving is poortask-level productivity a principal source of low total-factor productivity.
84
SPINNING 85
Spinning
Interfirm Cost Comparisons within the Philippines
Summary data for spinning plants by vintage, all expressed relative tothe lowest-cost mid-1950s mill (plant L) are shown in table 5-1. For onevintage group the coefficient of variation of the relevant characteristics isalso shown.'
It is striking that the plant with the lowest unit cost is of mid-1950svintage. Mills with much more modern ring spindles as well as ones usingopen-end spinning incur greater costs (column 7). The characteristics ofthe low-cost firm that seem to be critical in achieving this success arediscussed in chapter 6. The present chapter is largely descriptive andincludes only a limited examination of the actions of firms that result inthe observed patterns. If we ignore plant L for the moment, comparisonsof the three groups employing ring spindles (rows 1, 3, and 5) show thatnewer conventional equipment permits a reduction in labor and spindlesper unit of output. For the only group for which there are several observa-tions (plants with machinery that dates from the period 1960-70),however, there is substantial interfirm variation in performance, and thedate of a machine's manufacture within this period is not a good predictorof the productivity that can be obtained from its use. The coefficients ofvariation of both labor per unit of output and capital per unit of outputare fairly large, and some of the older plants exhibit better performancethan newer ones.
In production characteristics most often thought to be purely tech-nological-for example, power and space per unit of output-the perfor-mance of many newer plants is worse than that of plant L. The reason isthat power and space use are defined per unit of output, not per spindlehour. Insofar as the spindle-output ratio varies among firms, the powerand space unit input requirements vary along with it. Thus even wherenew vintages are designed to require less space per spindle, this advantageis partly or totally offset by a greater spindle-output ratio.
Although newer equipment embodies designs that reduce the waste perkilogram of final output, even here there is not a strict correspondence ofunit requirements with vintage. Thus the lowest-cost firm, L, has a lowerwaste percentage than the average of the 1960-70 vintage plants, thoughthe latter's machinery incorporates devices explicitly intended to reducewaste. Such reversals in actual use of the performance characteristicsembodied in equipment reflect differing knowledge of the technology notembodied in equipment, such as the ability to choose cotton fibers with
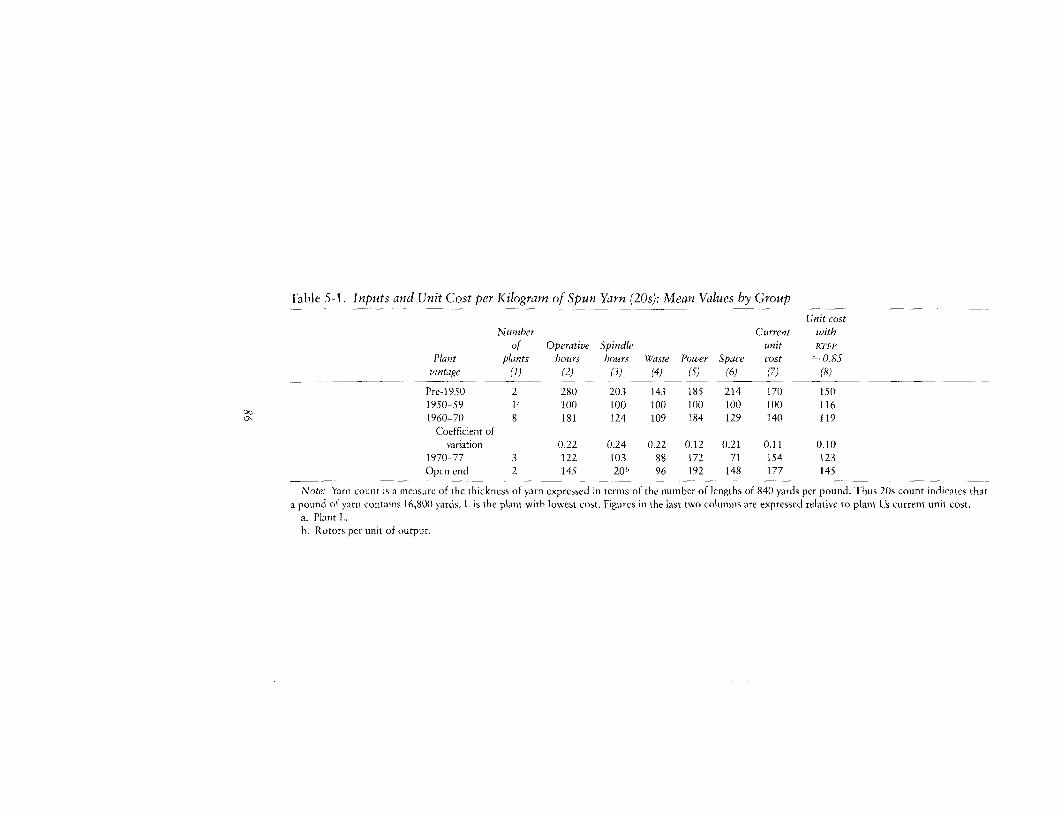
Table 5-1. Inputs and Unit Cost per Kilogram of Spun Yarn (20s): Mean Values by GroupUJnit cost
Number Current withof Operative Spindle unit RTFP
Plant plants hours hours Waste Power Space cost 0.85vintage (1) (2) (3) (4) (5) (6) (7) (8)
Pre-1950 2 280 203 143 185 214 170 1501950-59 la 100 100 100 100 100 100 1161960-70 8 181 124 109 184 129 140 119
Coefficient ofvariation 0.22 0.24 0.22 0.12 0.21 0.11 0.10
1970-77 3 122 103 88 172 71 154 123Open cnd 2 145 20" 96 192 148 177 145
Note: Yarn count is a measure of the thickness of yarn expressed in terms of the number of lengths of 840 yards per pound. Thus 20s count indicates thata pound of yarn contains 16,800 yards. L is the plant with lowest cost. Figures in the last two columns are expressed relative to plant L's current unit cost.
a. Plant L..h. Rotors per unit of output.
SIIINNING 87
properties (for example, length) best suited to a particular set of ma-chines.
Most important, consider unit cost. The costs of the open-end plantsexceed those of firm L by 77 percent; at the other end of the technologyspectrum, the two pre-1950 plants exhibit costs 70 percent above those offirm L. The three ring-spinning plants of mid-1970s vintage exceed firmL's costs by 54 percent. The best group average is achieved by firmsemploying 1960s equipment. The reason is partly that, like firm L, theircost of using equipment is lower than that for the 1970s or open-endplants, the cost of older equipment being taken as the current marketresale value as estimated by plant managers (though the interest rate as-sumed is the same for all plants); see chapter 3 appendix. With respect tothe differences in cost between conventional modern ring spinning (1970s)and the open-end plants, the machinery in both is valued at the currentnew price, so that the lower unit cost of the ring-spinning plants is notattributable to the use of depreciated values for equipment.
As mentioned immediately above, the lower cost currently obtainedwith existing equipment of older vintages partly reflects the fact that it isvalued at a fraction of the price of new equipment. A firm planning tobegin production might not find a given older technology as profitable ifthe relevant equipment could not be obtained at the prices used in thecalculation, though a margin of superiority would remain even at a higherequipment price if the firm could achieve high productivity.2
In summary, the evidence in table 5-1 indicates that the rapid changes inbest-practice input coefficients shown in chapter 3, though not fullyrealized in the Philippines, nevertheless have enough effect that each suc-cessive vintage of equipment is operated on the average with generallygreater physical productivity than its predecessors. Nevertheless, none ofthe mills employing newer machinery are able to match the cost perfor-mance of shed L; this statement is true for 1970s plants embodying quitehigh speeds and many innovations. These results are explained by the lowrelative total-factor productivity realized by the newer plants, a charac-teristic that is examined below. It is not only shed L that does well incomparison with the newest ring frames; several plants in the 1960-70group also have lower costs than the 1970s firms, including one owned bythe same firm as shed L. This plant, with 1960s equipment, exhibitsroughly the same unit labor and spindle requirements as the 1970s plants;given the lower opportunity cost of its equipment, its unit costs are lower.
The introduction of the most modern equipment, open-end spinning,achieves no cost reduction relative to new conventional equipment. La-bor, waste, and power and space requirements are all greater than on1970s ring-spinning equipment, although comparisons of best productiv-
88 THE PHILIPPINE TEXTILE SECTOR
ity specifications indicate that only power requirements should be greater.It is particularly surprising that neither of the tvvo open-end plants cansurpass plant L of mid-1950s vintage in several input dimensions, althoughthe comparisons of best-practice plants (see table 3-1) leave no doubtabout the potential differences.
The Effect on Cost of Changes in Productivity and Technology
It is again useful to put the discussion of the determinants of unit costinto the analytical framework set forth in chapter 3. The effect on unitcost if every firm were to achieve RTFP of 85 percent is shown in column 8of table 5-1, the improvement in productivity being based on the assump-tion that 0.5 is the correct ex post elasticity of substitution. All costfigures in column 8 are indexed on the initial cost of plant L. Because itscurrent RTFP exceeds 0.85, plant LUs own unit cost increases when costsare recalculated.3
Comparisons of the adjusted unit cost figures in column 8 and theexisting ones in column 7 show that significant excess cost is incurred byoperating at productivity below best practice. The 1960-70 and 1970-77plant could, on average, reduce their unit cost by 15 and 20 percentrespectively, whereas smaller decreases of 12 and 18 percent could beobtained by the pre-1950 and open-end plants. (See table 5-2 for a sum-mary.)
The reduction in unit cost from correct choice of technology can alsobe given a numerical value. The benefits from improved choice of tech-nique can be calculated as well, but they are relatively small and are thusdisregarded here.4 Along the "efficient" (85 percent RTFP) isoquants, thecost reduction from choosing an appropriate technology (defined as onethat minimizes private costs), in this case the 1950s one, is 22 percentwhen the comparison involves pre-1950 equipment, 2 percent relative to1960-70 equipment, and 6 percent relative to machines produced in the1970s.5 These results are summarized in table 5.2.
The newest technology, open-end spinning, does not become optimaleven when used efficiently, exhibiting a unit cost of 25 percent above thatof 1950s equipment (table 5-1, column 8) and 18 percent above that ofnew 1970s ring-spinning equipment, if it is assumed, as in the other cases,that the relevant value of ur is 0.5. Moreover, a comparison of ring andbreak spinning makes it clear that the correct elasticity of substitution islower in the latter. If the relevant elasticity is 0.2, then a further improve-ment in cost performance could not be achievecl by merely moving toRTFP of 0.85, as this level is already being achieved. At Philippine relativefactor prices, the new technology will exhibit a quite high unit cost even
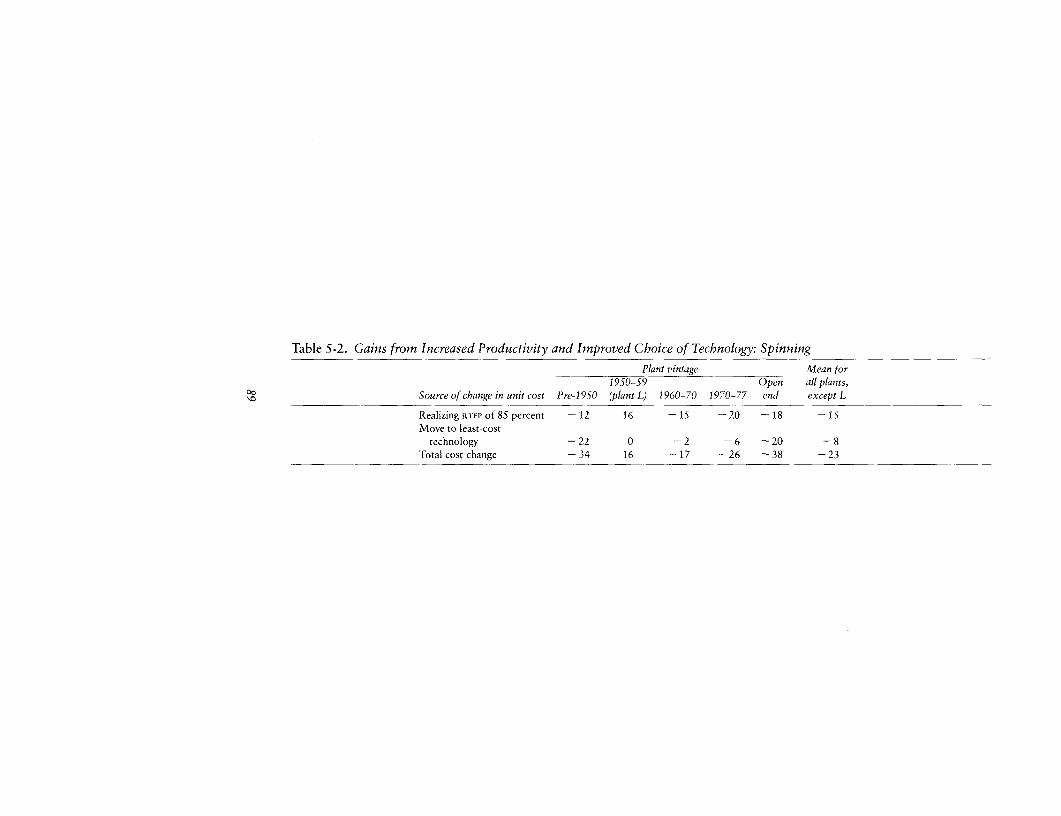
Table 5-2. Gains from Increased Productivity and Improved Choice of Technology: Spinning
Plant vintage Mean for1950-59 Open all plants,
co Source of change in unit cost Pre-1950 (plant L) 1960-70 1970-77 end except L
Realizing RI FP of 85 percent - 12 16 -15 -20 - 18 -15Move to least-cost
technology -22 0 -2 -6 -20 -8Total cost change -34 16 -17 -26 -38 23
90 THE I'HILIPPINE TEXTILE SECTOR
at 100 percent RTFP, and choice of the conventional technology is war-ranted at both current and high productivity levels.
If we view the above discussion in the framework of figure 3-2 andassume for ease of exposition that the isoquant exhibiting 85 percent RTFP
is ABC,, improved choices of technology among the points of this iso-quant (table 5-2, row 2) generally generate smaller cost reductions than doincreases in RTFP from currently inefficient points such as C, (row 1).6 Thegains from improved choice of technology are largest for the oldest(pre-1950) and the most modern (open-end) spinning plants. The precisenumbers presented here are best viewed as orders of magnitude only: Iwould not want to specify, on the basis of them alone, whether improvedallocational or technical efficiency offers larger potential cost reductions,but it is clear that both are quantitatively important.7 Because the realiza-tion of either type of gain requires some expenditures, the choice betweenraising productivity and achieving a better choice of technology must beviewed as an investment decision. Neither productivity improvements norbetter information about the range of production technologies can beobtained without explicit outlays on consultants, trips to foreign plantsand trade fairs, and other activities that enhance firms' knowledge. Inaddition to explicit expenditures, the implicit cost to the firm of therequired managerial attention is likely to be substantial. The gains notedin the preceding paragraphs are gross of these costs but, once achieved,will accrue to the firm for a long time. Given the magnitude of the costreductions, investment undertaken to obtain these improvements is likelyto yield a high rate of return. Quantitative estimates of these benefits andcosts are provided in chapter 8.
The Rationality of Investment Decisions
Comparison of the figures in the last two columns of table 5-1 suggestsa tentative answer to a puzzling phenomenon-did the plants establishedor expanded in the 1970s knowingly purchase new equipment that wouldresult in an average unit cost (154) above what they presumably knew werethe average unit costs (100 and 140) of their existing competitors, who hadbenefited from the lower opportunity (and accounting) cost of olderequipment? The explanation could lie in the unavailability of sufficientamounts of older machinery, the costs of acquiring information aboutsuch equipment, and misestimates of the cost saving to be realized by theadoption of older equipment.
Although the hypotheses just mentioned cannot be directly addressed(for example, was sufficient older equipment available to outfit an entireplant?), the evidence here accords with the hypothesis that the purchase of
WEAVING 91
1970s machinery was consistent with cost minimization. If the 1970s firmsassumed that their competitors would continue to realize their currentunit cost while they themselves attained RTFP of 85 percent, they wouldhave an anticipated unit cost of 123, below the 1960-70 group's average of140 and indeed lower than that of all but one firm in that group. Onlyafter the fact, with the realization of RTFP below a plausibly expectedlevel, did the particular choice of technology appear to be inappropriate.
Weaving
The relevant data for analyzing interfirm cost comparisons in the weav-ing sector are shown in table 5-3. The mill with the lowest unit cost (plantL) used Japanese and American-made automatic looms produced between1956 and 1961. All of the data are normalized on plant L. All other firmsbut one also used conventional automatic looms of about the same vin-tage but achieved widely varying results with them. Thus three mills,group N, used them as semiautomatic looms. The semiautomatic mode ofoperation was attributed by managers to the absence of spare parts,though the other plants utilizing identical looms had no such problems.One mill, plant 0, purchased a water jet loom in the mid-1970s and hasachieved quite low cost with it. Recently several companies purchasedlooms that use newly perfected devices such as rapiers and grippers. Theresults obtained from the use of these mechanisms (and of a new Chineseautomatic loom) are not reported here, because the equipment had notbeen fully absorbed into the production process and the existing inputcoefficients were clearly not those that would ultimately be obtained.One of the automatic looms in use was produced in Eastern Europe,although it is based on a Western design. The results obtained with it arereported separately, because performance in the weaving shed that em-ploys it seems to be inferior to performance involving Western Europeanequipment of the same design.
Column 6 presents the standard result of the effect of firms moving to auniform RTFP level of 85 percent, whereas column 7 shows the cost thatwould be realized if choice of technique also improved. In terms of figure3-2, column 5 shows TC3 , and column 7, TC1. The move from column 5to column 6 is equivalent to the cost reduction TC2 - TC, and that fromcolumn 6 to column 7 equals TC3 - TC2 , the sum being TC3 - TCI.Because all firms use the same technology, differences in unit cost shownin column 6 represent the effects of variations in the choice of technique,whereas this source of difference is eliminated in column 7.
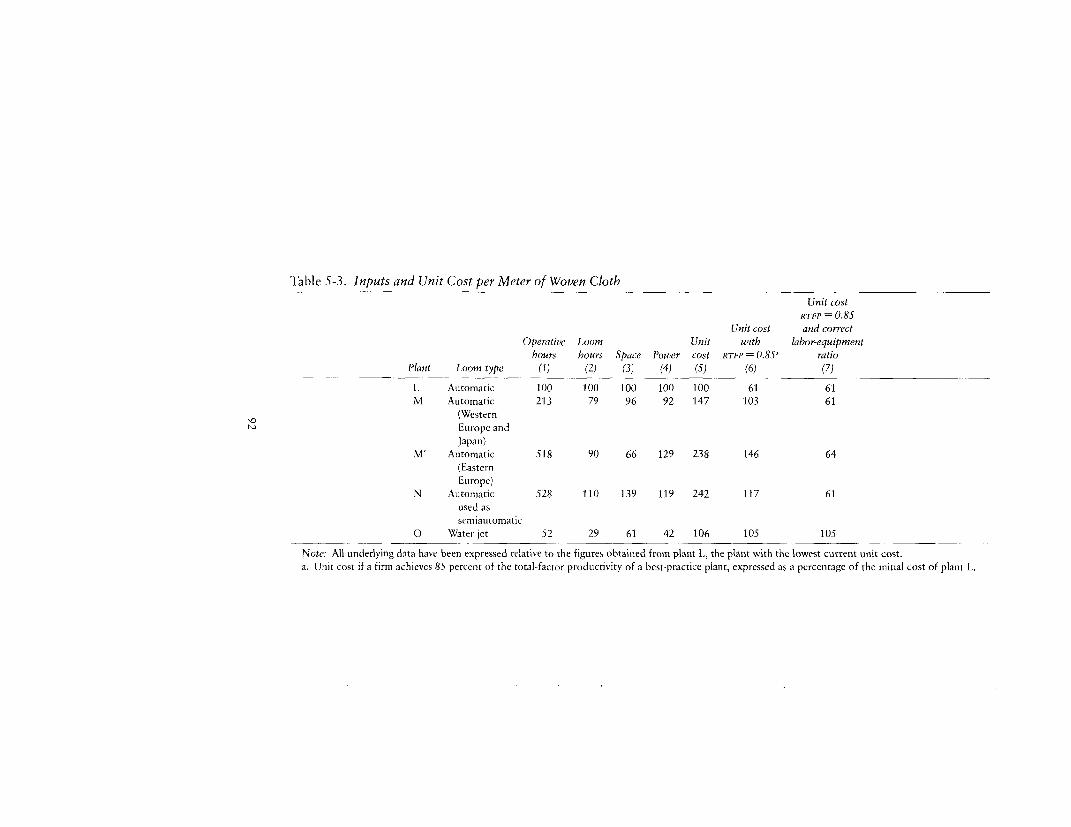
Table 5-3. Inputs and Unit Cost per Meter of Woven Cloth
Unit costRTFP = 0.85
Unit cost and correctOperative Loom Unit with labor-equipment
hours hours Space Power cost RTFP = 0.85 ratio
Plant Loom type (1) (2) (3) (4) (5) (6) (7)
L Automatic 100 l00 100 100 100 61 61M Automatic 213 79 96 92 147 103 61
(WesternEurope and
Japan)M' Automatic 518 90 66 129 238 146 64
(EasternEurope)
N Automatic 528 110 139 119 242 117 61
used assemiautomatic
0 Water jct 52 29 61 42 106 105 105
Note: All underlying data have been expressed relative to the figures obtained from plant L, the plant with the lowest current unit cost.
a. Unit cost if a firm achieves 85 percent of the total-factor productivity of a best-practice plant, expressed as a percentage of the initial cost of plant L.
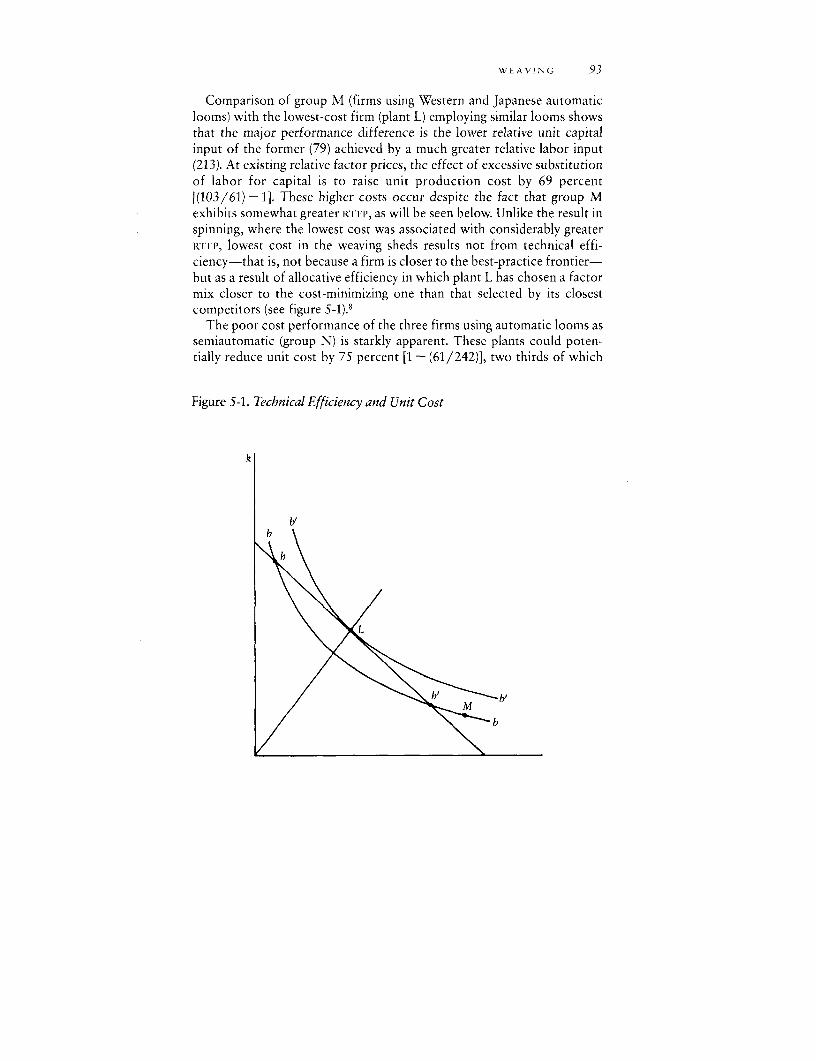
WEAVING 93
Comparison of group M (firms using Western and Japanese automaticlooms) with the lowest-cost firm (plant L) employing similar looms showsthat the major performance difference is the lower relative unit capitalinput of the former (79) achieved by a much greater relative labor input(213). At existing relative factor prices, the effect of excessive substitutionof labor for capital is to raise unit production cost by 69 percent[(103/61) - 1]. These higher costs occur despite the fact that group Mexhibits somewhat greater RTFP, as will be seen below. Unlike the result inspinning, where the lowest cost was associated with considerably greaterRTFP, lowest cost in the weaving sheds results not from technical effi-ciency-that is, not because a firm is closer to the best-practice frontier-but as a result of allocative efficiency in which plant L has chosen a factormix closer to the cost-minimizing one than that selected by its closestcompetitors (see figure 5-1).8
The poor cost performance of the three firms using automatic looms assemiautomatic (group N) is starkly apparent. These plants could poten-tially reduce unit cost by 75 percent [1 - (61/242)], two thirds of which
Figure 5-1. Technical Efficiency and Unit Cost
k
b'
h
94 THE PHILIPPINE TEXTILE SECTOR
would be obtained by improved productivity and one-third by betterchoice of technique. The considerably greater space per loom in group N(relative to experience in plants L and M with quite similar looms) con-tributes to group N's higher cost level; this less economic use of space,together with the inability to obtain spare parts that other firms domanage to acquire, suggests that the high cost of this operation ultimatelyderives from weak management rather than from any problems inherent inthe equipment currently in use.
Perhaps surprisingly to advocates of labor-intensive technology, theshed (plant 0) using the most modern of the looms reported on hereexhibits almost the same current unit cost as plant L despite the muchlower opportunity cost of the latter's 1960 equipment. The firm using thewater jet realizes a saving in every input cost except capital, because of thehigh price of such looms. The small difference in columns 5 and 6 indi-cates that its good performance relative to plants L and M is largelyattributable to its operating closer to best-practice standards than dofirms in the other groups. Were plant L able to achieve 85 percent RTFP,
plant O's costs would exceed plant L's by 72 percent (column 6); theaverage cost in group M would also be slightly lower than the average costin plant 0.
Table 5-4 summarizes the potential reductions in cost obtainable fromimproved productivity and more appropriate factor proportions with ex-isting technology. The percentages shown have been calculated from col-umns 5-7 in table 5-3. The numbers shown in row 3 correspond to thetotal cost reduction in figure 3-2 obtained by the move from TC3 to TC,;the average for all firms is 65 percent. Of this total, about three-fifths (row1) is attributable to potential gains in total-factor productivity, the re-mainder (row 2) to improved choice of technique. Chapter 8 will estimatethe costs of achieving such benefits.
Table 5-4. Gains from Increased Productivity and Improved Choiceof Technique: Weaving
Plant Plant Plant PlantSource of change in unit cost L M M' N Average
Realizing RTFP of 85 percent - 39 30 -3 9 -52 -39Move to least-cost
technique 0 -29 -34 -23 -26Total cost change -39 -59 - 73 -75 - 65
THE CHOICE OF TECHNOLOGIES 95
The Choice of Current Textile Technologies
Analysis of the only significant choice of technology, that of water jetsversus conventional automatic looms (plant 0 versus plants L, M, N),demonstrates that the desirability of introducing more advanced machin-ery depends on the ability of plants using each technology to attain thecorrect factor mix and productive efficiency. If current performance pa-rameters, including managerial skills, are immutable, the water jet will beclose to cost minimizing, at least in terms of current market prices forfactors of production. If current firm capabilities can be altered by suita-ble investment, however, including changing factor proportions to thoseof plant L, the conventional technology may be optimal; the benefit fromadopting it would be a reduction in unit cost of 42 percent [1 - (61/105)](table 5-3, column 7).
It was shown above that the most modern technology available, open-end spinning, exhibited considerably higher unit costs than the currentring-frame technology if both are purchased at current new equipmentprices and are operated at a uniform 85 percent RTFP (table 5-1, column 8).As noted earlier, only one Philippine firm has installed the most modernand highest-cost gripper loom, generally known as the Sulzer loom, andthe installation has been too recent to permit comparisons with eitherbest-practice norms or other firms in the Philippines. Nevertheless, it isstill possible to compare the firm's unit cost if it were operated at RTFP of85 percent with that of running a new conventional automatic loom at thesame relative productivity.
At the input prices used in the preceding calculations, unit cost for theSulzer loom is 72 percent greater than that of the conventional loom,reinforcing the conclusion reached in spinning that, at factor prices pre-vailing in the Philippines, the decision to introduce the most advancedequipment is not based purely on cost.9 The firm that had purchased thenew loom claimed that this was the only way to guarantee the productionof export-quality denim under Philippine conditions, although otherfirms were weaving precisely such denim with considerably less sophisti-cated machinery. Interestingly enough, the rationalization for adoptingopen-end spinning equipment is also based on an argument about export-quality yarn to be used for denim. Where cost-increasing technologychoices are substitutes for other ways of obtaining competence in produc-tion engineering, the potential rate of return on human capital invest-ments designed to develop such competence may be quite high.
96 THE PHILIPPINE TEXTILE SECTOR
Performance Relative to Best Practice
Spinning
In contrast to the previous section, which compared the performanceof individual firms within the Philippines, this section compares eachplant's productivity with best practice in the United Kingdom. The salientstylized facts (table 5-5) are:
* Unit labor requirements in Philippine plants considerably exceedthose in best-practice plants using similar equipment.
* Unit capital requirements also exceed best practice but by a smallerpercentage than holds for labor.
* Capital-labor ratios in the Philippine plants are lower than those inbest-practice plants.
* Except in the lowest-cost plant, RTFP is less than 75 percent of bestpractice in conventional ring spinning. If a is assumed to be 0.5, mostplants exhibit about two-thirds of the total-factor productivity ofbest-practice plants.
Greater unit labor requirements and a lower capital]-output ratio are to beexpected as a result of the lower wage-rental ratio than in the UnitedKingdom. The higher capital-output ratio despite the lower capital-laborratio, however, reflects the lower total-factor productivity in the Philip-pines. I next consider the values of each of the productivity-reducingfactors discussed in chapter 3, which appear in table 5-6.
The largest productivity-depressing factor for all plants (0.79) arisesfrom the inability of firms to realize sufficient product specialization. Forall firms (except open end) the combined effect of excessive productdiversity, low spindle efficiency, the operation of ring frames at lowspeeds, and high twist multiples is 0.72. Thus, apart from task-level pro-ductivity, total-factor productivity is decreased by an average of 28 per-cent in Philippine firms relative to best practice. In contrast, task-levelproductivity-the feature often emphasized in discussions of indus-trialization and certainly foremost in the minds of plant managers as thesource of poor performance-lowers productivity by only 8 percent (onthe average) when the Cobb-Douglas is the assumed ex post productionfunction and not at all when u = 0.5 and 0.2. Because TLP is a residual, itsvalue depends on the value of total-factor productivity, the magnitude ofother productivity depressants, and on factor propcirtions, hence on a. Asthe substitutability of labor for capital falls, more of the shortfall in laborproductivity is attributed to the effect of the lower capital-labor ratio andless to the residual task-level productivity (see chapter 3). It will be noted
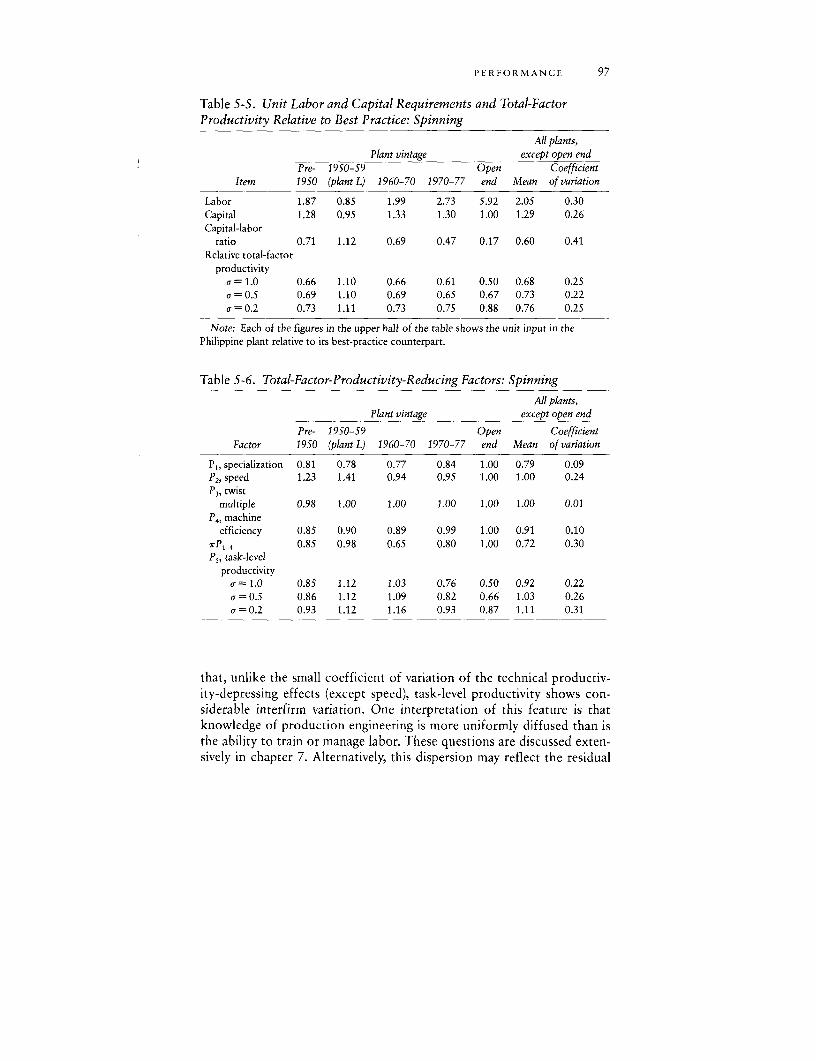
PERFORMANCE 97
Table 5-5. Unit Labor and Capital Requirements and Total-FactorProductivity Relative to Best Practice: Spinning
All plants,Plant vintage except open end
Pre- 1950-59 Open CoefficientItem 1950 (plant L) 1960-70 1970-77 end Mean of variation
Labor 1.87 0.85 1.99 2.73 5.92 2.05 0.30Capital 1.28 0.95 1.33 1.30 1.00 1.29 0.26Capital-labor
ratio 0.71 1.12 0.69 0.47 0.17 0.60 0.41Relative total-factor
productivitya = 1.0 0.66 1.10 0.66 0.61 0.50 0.68 0.25a = 0.5 0.69 1.10 0.69 0.65 0.67 0.73 0.22a = 0.2 0.73 1.11 0.73 0.75 0.88 0.76 0.25
Note: Each of the figures in the upper half of the table shows the unit input in thePhilippine plant relative to its best-practice counterpart.
Table 5-6. Total-Factor-Productivity-Reducing Factors: Spinning
All plants,Plant vintage except open end
Pre- 1950-59 Open CoefficientFactor 1950 (plant L) 1960-70 1970-77 end Mean of variation
P,, specialization 0.81 0.78 0.77 0.84 1.00 0.79 0.09P2, speed 1.23 1.41 0.94 0.95 1.00 1.00 0.24P3 , tWist
multiple 0.98 1.00 1.00 1.00 1.00 1.00 0.01P4 , machine
efficiency 0.85 0.90 0.89 0.99 1.00 0.91 0.107,Pl 4 0.85 0.98 0.65 0.80 1.00 0.72 0.30P5, task-level
productivityv- 1.0 0.85 1.12 1.03 0.76 0.50 0.92 0.22or = O.S 0.86 1.12 1.09 0.82 0.66 1.03 0.26a = 0.2 0.93 1.12 1.16 0.93 0.87 1.11 0.31
that, unlike the small coefficient of variation of the technical productiv-ity-depressing effects (except speed), task-level productivity shows con-siderable interfirm variation. One interpretation of this feature is thatknowledge of production engineering is more uniformly diffused than isthe ability to train or manage labor. These questions are discussed exten-sively in chapter 7. Alternatively, this dispersion may reflect the residual
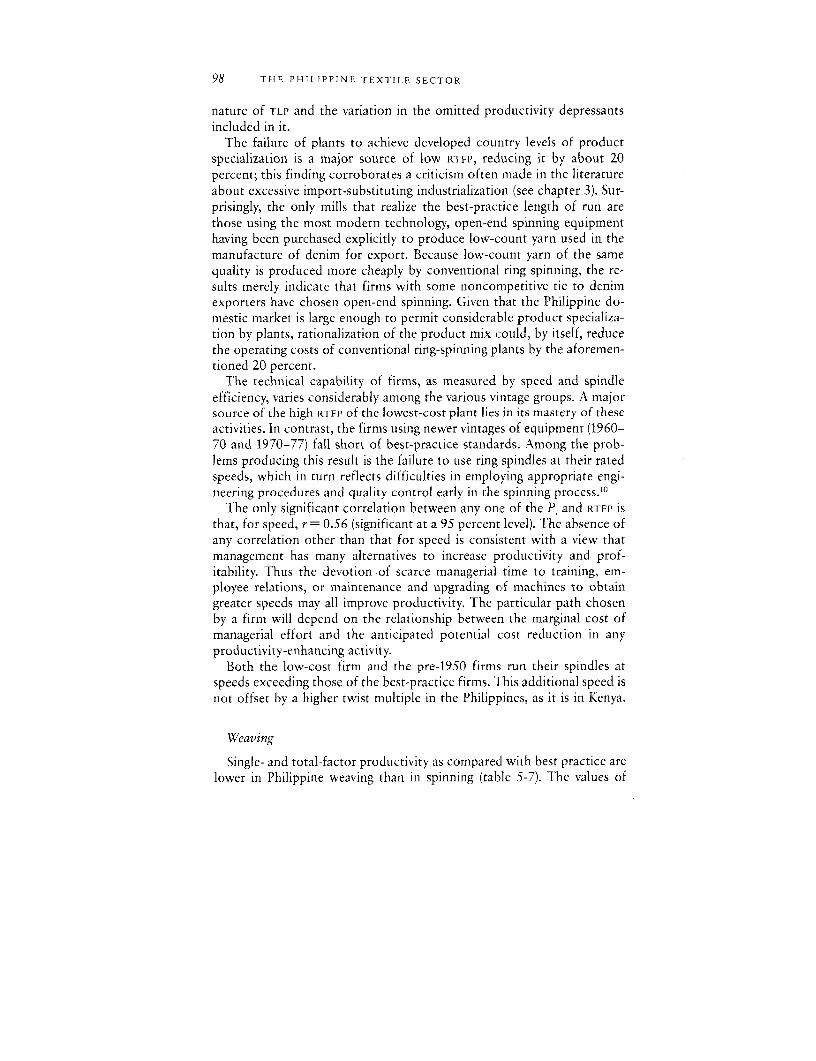
98 THE PHILIPPINE TEXTILE SECTOR
nature of TLP and the variation in the omitted productivity depressantsincluded in it.
The failure of plants to achieve developed country levels of productspecialization is a major source of low RTFP, reducing it by about 20percent; this finding corroborates a criticism often made in the literatureabout excessive import-substituting industrialization (see chapter 3). Sur-prisingly, the only mills that realize the best-practice length of run arethose using the most modern technology, open-end spinning equipmenthaving been purchased explicitly to produce low-count yarn used in themanufacture of denim for export. Because low-count yarn of the samequality is produced more cheaply by conventional ring spinning, the re-sults merely indicate that firms with some noncompetitive tie to denimexporters have chosen open-end spinning. Given that the Philippine do-mestic market is large enough to permit considerable product specializa-tion by plants, rationalization of the product mix could, by itself, reducethe operating costs of conventional ring-spinning plants by the aforemen-tioned 20 percent.
The technical capability of firms, as measured by speed and spindleefficiency, varies considerably among the various vintage groups. A majorsource of the high RTFP of the lowest-cost plant lies in its mastery of theseactivities. In contrast, the firms using newer vintages of equipment (1960-70 and 1970-77) fall short of best-practice standards. Among the prob-lems producing this result is the failure to use ring spindles at their ratedspeeds, which in turn reflects difficulties in employing appropriate engi-neering procedures and quality control early in the spinning process.10
The only significant correlation between any one of the Pi and RTFP iS
that, for speed, r= 0.56 (significant at a 95 percent level). The absence ofany correlation other than that for speed is consistent with a view thatmanagement has many alternatives to increase productivity and prof-itability. Thus the devotion of scarce managerial time to training, em-ployee relations, or maintenance and upgrading of machines to obtaingreater speeds may all improve productivity. The particular path chosenby a firm will depend on the relationship between the marginal cost ofmanagerial effort and the anticipated potential cost reduction in anyproductivity-enhancing activity.
Both the low-cost firm and the pre-1950 firms run their spindles atspeeds exceeding those of the best-practice firms. This additional speed isnot offset by a higher twist multiple in the Philippines, as it is in Kenya.
Weaving
Single- and total-factor productivity as compared with best practice arelower in Philippine weaving than in spinning (table 5-7). The values of
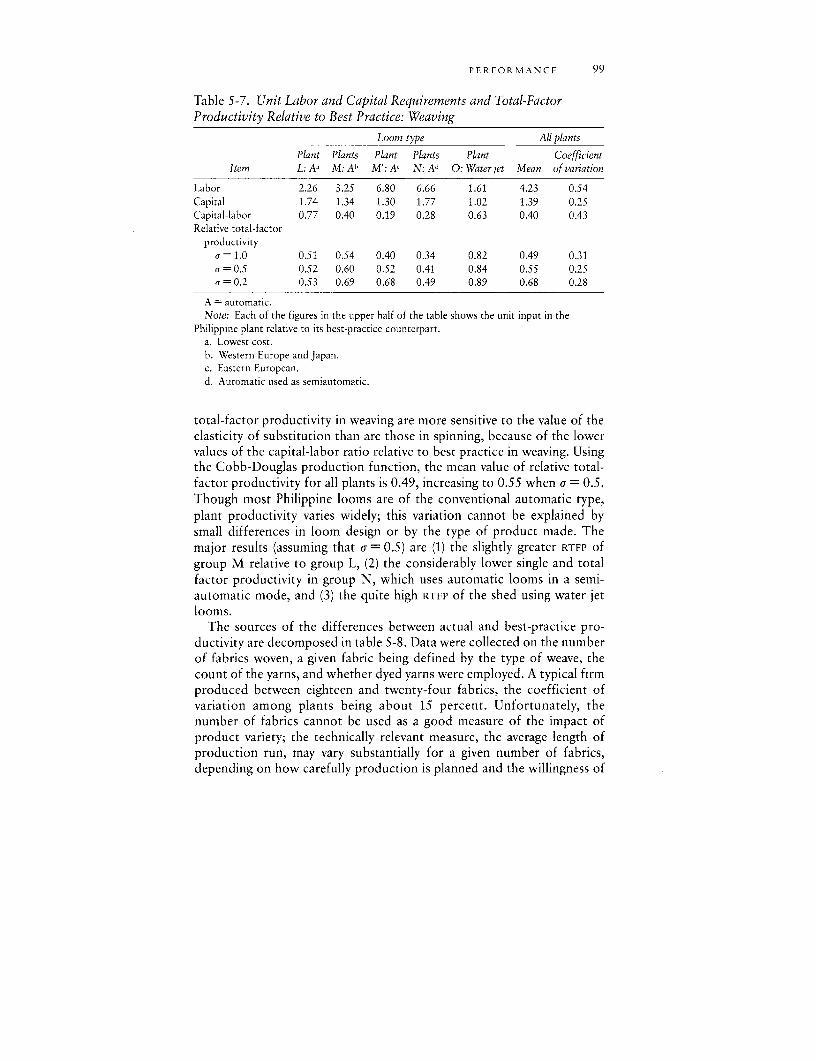
PERFORMANCE 99
Table 5-7. Unit Labor and Capital Requirements and Total-FactorProductivity Relative to Best Practice: Weaving
Loom type All plants
Plant Plants Plant Plants Plant CoefficientItem L: Al M: Ah M': Al N: Ad 0: Water jet Mean of variation
Labor 2.26 3.25 6.80 6.66 1.61 4.23 0.54Capital 1.74 1.34 1.30 1.77 1.02 1.39 0.25Capital-labor 0.77 0.40 0.19 0.28 0.63 0.40 0.43Relative total-factor
productivitya 1.0 0.51 0.54 0.40 0.34 0.82 0.49 0.31
0.5 0.52 0.60 0.52 0.41 0.84 0.55 0.25a = 0.2 0.53 0.69 0.68 0.49 0.89 0.68 0.28
A automatic.Note: Each of the figures in the upper half of the table shows the unit input in the
Philippine plant relative to its best-practice counterpart.a. Lowest cost.b. Western Europe and Japan.c. Eastern European.d. Automatic used as semiautomatic.
total-factor productivity in weaving are more sensitive to the value of theelasticity of substitution than are those in spinning, because of the lowervalues of the capital-labor ratio relative to best practice in weaving. Usingthe Cobb-Douglas production function, the mean value of relative total-factor productivity for all plants is 0.49, increasing to 0.55 when a = 0.5.Though most Philippine looms are of the conventional automatic type,plant productivity varies widely; this variation cannot be explained bysmall differences in loom design or by the type of product made. Themajor results (assuming that ai = 0.5) are (1) the slightly greater RTFP ofgroup M relative to group L, (2) the considerably lower single and totalfactor productivity in group N, which uses automatic looms in a semi-automatic mode, and (3) the quite high RTFP of the shed using water jetlooms.
The sources of the differences between actual and best-practice pro-ductivity are decomposed in table 5-8. Data were collected on the numberof fabrics woven, a given fabric being defined by the type of weave, thecount of the yarns, and whether dyed yarns were employed. A typical firmproduced between eighteen and twenty-four fabrics, the coefficient ofvariation among plants being about 15 percent. Unfortunately, thenumber of fabrics cannot be used as a good measure of the impact ofproduct variety; the technically relevant measure, the average length ofproduction run, may vary substantially for a given number of fabrics,depending on how carefully production is planned and the willingness of
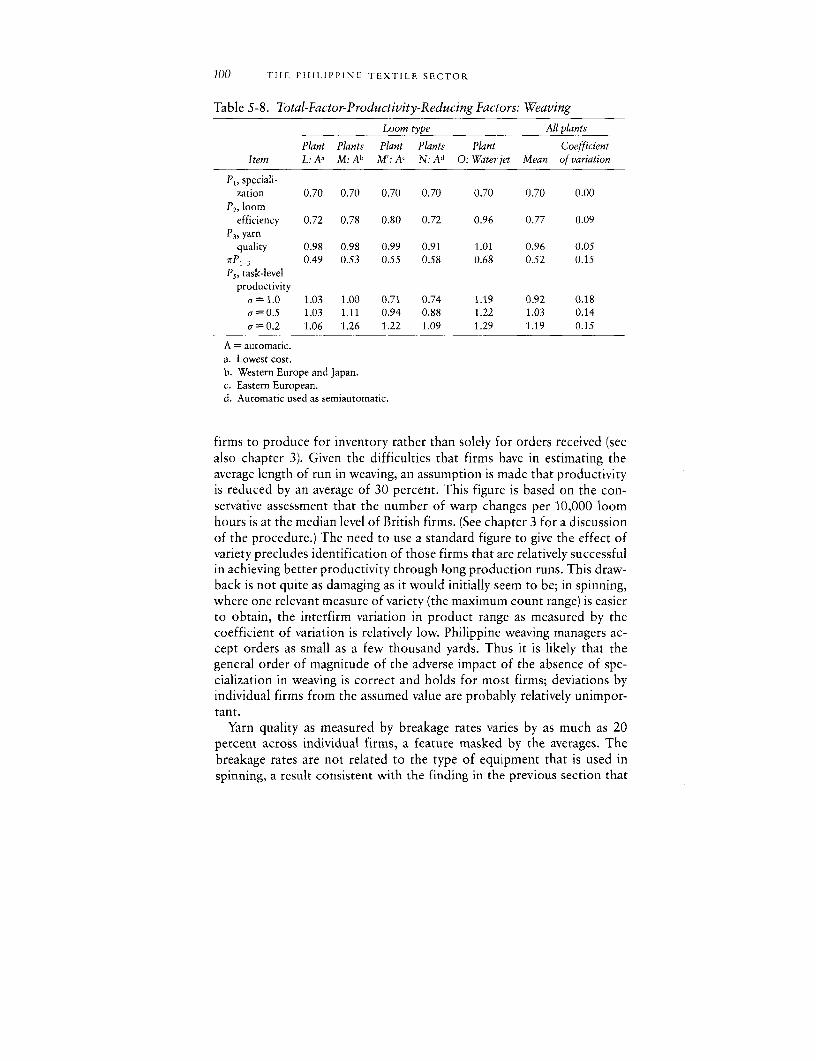
100 THE PHILIPPINE TEXTILE SECTOR
Table 5-8. Total-Factor-Productivity-Reducing Factors: Weaving
Loom type All plants
Plant Plants Plant Plants Plant CoefficientItem L: Aa M: Ab M': Ac N: Ad 0: Water jet Mean of variation
P,, speciali-zation 0.70 0.70 0.70 0.70 0.70 0.70 0.00
P', loomefficiency 0.72 0.78 0.80 0.72 0.96 0.77 0.09
P3 , yarnquality 0.98 0.98 0.99 0.91 1.01 0.96 0.05
grP,-3 0.49 0.53 0.55 0.58 0.68 0.52 0.15P5 , task-level
productivitya = 1.0 1.03 1.00 0.71 0.74 1.19 0.92 0.18a=0.5 1.03 1.11 0.94 0.88 1.22 1.03 0.14u = 0.2 1.06 1.26 1.22 1.09 1.29 1.19 0.15
A = automatic.a. Lowest cost.b. Western Europe and Japan.c. Eastern European.d. Automatic used as semiautomatic.
firms to produce for inventory rather than solely for orders received (seealso chapter 3). Given the difficulties that firms have in estimating theaverage length of run in weaving, an assumption is made that productivityis reduced by an average of 30 percent. This figure is based on the con-servative assessment that the number of warp changes per 10,000 loomhours is at the median level of British firms. (See chapter 3 for a discussionof the procedure.) The need to use a standard figure to give the effect ofvariety precludes identification of those firms that are relatively successfulin achieving better productivity through long production runs. This draw-back is not quite as damaging as it would initially seem to be; in spinning,where one relevant measure of variety (the maximum count range) is easierto obtain, the interfirm variation in product range as measured by thecoefficient of variation is relatively low. Philippine weaving managers ac-cept orders as small as a few thousand yards. Thus it is likely that thegeneral order of magnitude of the adverse impact of the absence of spe-cialization in weaving is correct and holds for most firms; deviations byindividual firms from the assumed value are probably relatively unimpor-tant.
Yarn quality as measured by breakage rates varies by as much as 20percent across individual firms, a feature masked by the averages. Thebreakage rates are not related to the type of equipment that is used inspinning, a result consistent with the finding in the previous section that
COMPETITIVENESS 101
the major sources of productivity variation are firm-specific differences inknow-how. Yarn quality is lowest in firms that use automatic looms assemiautomatics; this characteristic is indicative of a generally low level oftechnical mastery throughout all processes in these integrated plants. Thesame spinning equipment that they employ is capable, in the hands ofother firms, of producing higher-quality yarn.
The last source of low productivity considered is the level of loomefficiency. In chapter 2, the efficiency of weaving sheds (the percentage ofan hour during which looms actually insert weft) was seen to be a criticalvariable in determining the level of output achievable from a given com-plement of looms. It was also noted that, when weavers tend a substantialnumber of looms, any increase in efficiency requires a decrease in thenumber of looms per weaver. Most Philippine weaving sheds are currentlycharacterized by a very low ratio of looms per weaver, however, the meanratio for all plants being below 6. Nevertheless, loom efficiency is low, themean percentage for all plants being 0.63.11 This low efficiency level isattributable to a number of firm-level deficiencies, ranging from the ab-sence of warp stop mechanisms (see chapter 2), to nonoperating pirn-changing mechanisms (owing to the alleged impossibility of obtainingspare parts), to bad housekeeping that allows dust accumulation (which inturn requires stopping the looms periodically to avoid problems with thequality of the woven fabric). Loom efficiency is also the only one of theproductivity-reducing factors exhibiting a significant correlation withRTFP, r = 0.80 (significant at the 95 percent level). Increasing average effi-ciency and bringing all firms up to best practice would largely eliminatethe variation in RTFP among plants, although the average level of RTFP
would still be considerably below best practice unless greater specializa-tion could be achieved.
If the true elasticity of substitution is in fact 0.5, several firms (plants Land 0, and some in group M) exhibit task-level productivity close to orslightly above best-practice levels. (Best practice is defined as the standardof the upper quartile of U.K. firms, and many firms in the United King-dom will exceed the performance of these better Philippine firms evenwhen the relative TLP of the latter is unity.) The decomposition suggeststhat the main deficiencies causing low productivity in many Philippineweaving mills stem from the inability to achieve long production runs andtechnological mastery rather than from the absence of sufficiently skilledworkers or other factors included in the residual.
Potential Competitiveness
The argument in the preceding chapter for the potential competi-tiveness of Kenyan textile mills could be replicated for Philippine plants.
102 THE PHILIPPINE TEXTILE SECTOR
Nevertheless, moving to a situation in which firms faced internationalprices for their inputs would not enable all of them to compete in theinternational market, as would be the case in Kenya. Many of the Philip-pine firms suffer from substantial technical inefficiencies that precludetheir attaining internationally competitive production costs. Trade liber-alization would have to be accompanied by a program to raise productiv-ity and promote product specialization. These issues are discussed atlength in chapter 8.
Notes
1. The coefficient of variation is the standard deviation of the observations for the groupdivided by the mean of the group.
2. The price at which any two technologies would exhibit identical costs can, of course, becalculated. Because productivity differentials are likely to be more important and are morelikely to vary considerably, the calculation is not carried out. For an earlier exercise along theselines, see Pack (1975).
3. Inasmuch as the best-practice coefficients were derived from the performance coeffi-cients of the top quartile of British plants, a firm in the Philippi:nes exhibiting relative total-factor productivity above 100 is not outperforming the very best British plants.
4. The differences between plants of similar vintage in the sum of labor cost and the usercost of machinery are extremely small. For example, for the 1960-70 vintage group, thecoefficient of variation is 0.06. The major gains from improved allocation arise from the choiceof technology. The same is not true in weaving, as will be seen below.
5. A calculation could also be done at shadow prices to find the social cost reduction.Estimation of shadow prices is a considerable enterprise in its own right, however, and iseschewed here.
6. In principle, gains are also to be obtained from improved choice of technique, that is, theuse of varying amounts of labor with the same equipment. See note 4 above.
7. For the different relative importance attached to allocative and technical efficiency in astudy of nontextile Ghanaian plants, see Page (1980).
8. This result is illustrated in figure 5-1, in which the ex post substitution possibilities areshown by the unit isoquants bb and b'b', the latter requiring more of both inputs to achieve thesame level of output. The low-cost firm L, despite being on the less efficient isoquant, achieveslower costs than the M firms by choosing a more appropriate capital-labor ratio than they do.The fact that greater technical efficiency has not conferred a cos: advantage in this case doesnot, of course, imply that it is irrelevant. If production were to occur along bb, operation atany point between h and h' yields lower cost than that achieved at L.
9. Differences in the productivity with which each loom is operated are unlikely to alter thisconclusion. If a shed employing Sulzers were operated at RTFP of 85 percent, then the con-ventional loom shed could operate at productivity relative to its best-practice counterpart of58 percent and still match the Sulzer's unit cost. Although many Philippine conventional loomsheds realize levels of RTFI' above 58 percent, the mean value (table 5-8) for a group of firmsusing conventional looms is 60 percent (a = 0.5). As will be seen, however, much of thisshortfall from best practice is due to the absence of spare parts, a deficiency to which theSulzer loom is not immune.
10. A Philippine government task force in 1978 also found widespread failure to achieve thespeeds of which spindles were capable. See Philippines, Interagency Technical Subcommittee(1978a).
11. This is the average absolute efficiency for all firms, not the average relative to bestpractice; the latter is shown in table 5-8.
CHAPTER SIX
Behind the ProductivityDifferentials
CHAPTER 2 provided an overview of many of the important textile engi-neering relationships. The production functions for spinning and weavinggiven in that chapter are best regarded as engineering production func-tions showing the maximum output (of a well-defined product) obtain-able with given inputs. As seen in the last two chapters, the total-factorproductivity of most Kenyan and Philippine mills falls considerably shortof the standard set by best-practice firms. This chapter discusses some ofthe requirements for realization of the best-practice production function.It then presents descriptive evidence collected in the Philippines andKenya about the types of failure that prevent the attainment of technicallyfeasible levels of productivity. This chapter may thus be viewed as describ-ing some of the nuts and bolts of the required know-how, the lack ordeficiency of which in many factories in developing countries creates theproductivity shortfalls measured in the preceding chapters.
This chapter has five sections. The first presents a brief account ofsome of the production routines that must be mastered before high pro-ductivity can be realized. It is meant to illustrate the type of processingknowledge that is critical for achieving the potential output permitted byexisting equipment and workers. I then present selected anecdotal evi-dence about the nature of the inadequacies experienced in contemporaryPhilippine and Kenyan plants-and, it should be added, in most otherdeveloping countries for which such descriptive material is available.'There follows a detailed description of some salient characteristics ofthree Philippine textile mills with greatly varying productivity. A subse-quent section examines several failures in technical performance and cal-culates the benefits and costs to firms of remedying these deficiencies,together with a brief discussion of why such corrective measures have notbeen undertaken. A final section outlines some issues related to the avail-ability of spare parts.
103
104 BEHIIND THE DIFFERENTIALS
Selected Issues in Production Engineering
Spinning
Inadequate knowledge about production management and the inabilityto implement it manifest themselves either as low physical productivity orin a low price for the final product, owing to imperfections in one or moreyarn qualities. The following subsections briefly describe some key as-pects of three branches of know-how-blending, weight control, andmaintenance-in which substantial shortcomings were identified in manyof the plants visited. Poor blending and weight-control practices areamong the factors giving rise to less than best-practice performance inspeed and twist multiple in Philippine spinning, whereas insufficient main-tenance contributes to spindle efficiency below best-practice standards.These three areas of technological deficiency are not necessarily those inwhich firm performance is worst, nor are they the most significant inquantitative terms: many other examples could be provided. The func-tional problems chosen, however, are representative of others encoun-tered, and the nature of the desirable practice and of likely divergencesfrom it is relatively easy to elucidate.
BLENDING. Before the preparatory processes begin, choices must bemade about the length, strength, fineness, trash content, and so on ofcotton and other fibers that should be mixed together to obtain specificphysical and aesthetic properties2 in the final output, yarn. In well-runfirms, the procedure used to obtain the required properties is based onsampling theory. Given the desired mean and acceptable variance in thedesired yarn attributes and the mean and variance of the relevant charac-teristics obtained from samples of bales of cotton fiber, the necessarynumber of bales from which raw materials should be mixed in order toobtain the required properties can be determined from readily availabletables. Although the procedure sometimes informally considers the costof various fiber attributes, there is in the literature or in firm practices noreference to the use of a full optimizing procedure such as linear program-ming to obtain the best mixing pattern. Rather the main concern is withobtaining the necessary physical properties of ya.rn (within probabilitylimits), the average cost of all inputs being used as a rough check on thereasonableness of the mix.
The task of blending is, however, more complex than simply establish-ing the correct number of bales from which to feed the opener. The balesof fiber must be tested, labeled correctly, stored in warehouses so thatthose with the required properties can quickly be located, and so on.
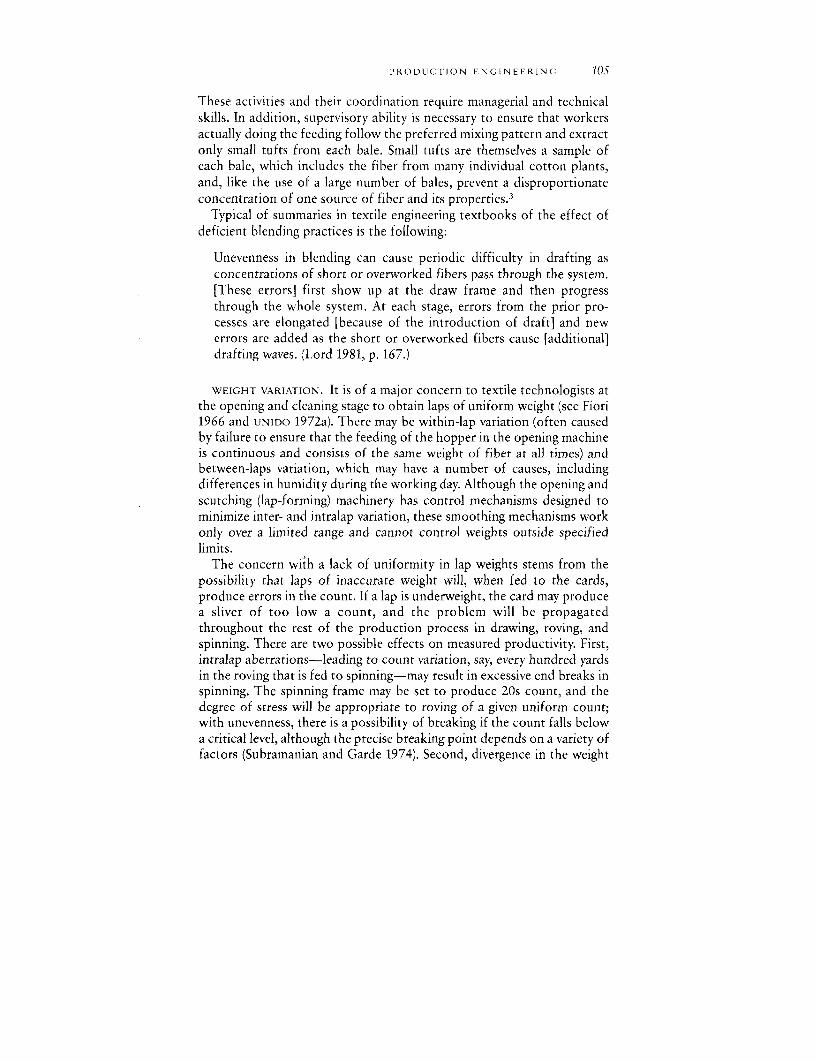
PRODUCTION ENGINEERING 1os
These activities and their coordination require managerial and technicalskills. In addition, supervisory ability is necessary to ensure that workersactually doing the feeding follow the preferred mixing pattern and extractonly small tufts from each bale. Small tufts are themselves a sample ofeach bale, which includes the fiber from many individual cotton plants,and, like the use of a large number of bales, prevent a disproportionateconcentration of one source of fiber and its properties.3
Typical of summaries in textile engineering textbooks of the effect ofdeficient blending practices is the following:
Unevenness in blending can cause periodic difficulty in drafting asconcentrations of short or overworked fibers pass through the system.[These errors] first show up at the draw frame and then progressthrough the whole system. At each stage, errors from the prior pro-cesses are elongated [because of the introduction of draft] and newerrors are added as the short or overworked fibers cause [additional]drafting waves. (Lord 1981, p. 167.)
WEIGHT VARIATION. It is of a major concern to textile technologists atthe opening and cleaning stage to obtain laps of uniform weight (see Fiori1966 and UNIDO 1972a). There may be within-lap variation (often causedby failure to ensure that the feeding of the hopper in the opening machineis continuous and consists of the same weight of fiber at all times) andbetween-laps variation, which may have a number of causes, includingdifferences in humidity during the working day. Although the opening andscutching (lap-forming) machinery has control mechanisms designed tominimize inter- and intralap variation, these smoothing mechanisms workonly over a limited range and cannot control weights outside specifiedlimits.
The concern with a lack of uniformity in lap weights stems from thepossibility that laps of inaccurate weight will, when fed to the cards,produce errors in the count. If a lap is underweight, the card may producea sliver of too low a count, and the problem will be propagatedthroughout the rest of the production process in drawing, roving, andspinning. There are two possible effects on measured productivity. First,intralap aberrations-leading to count variation, say, every hundred yardsin the roving that is fed to spinning-may result in excessive end breaks inspinning. The spinning frame may be set to produce 20s count, and thedegree of stress will be appropriate to roving of a given uniform count;with unevenness, there is a possibility of breaking if the count falls belowa critical level, although the precise breaking point depends on a variety offactors (Subramanian and Garde 1974). Second, divergence in the weight
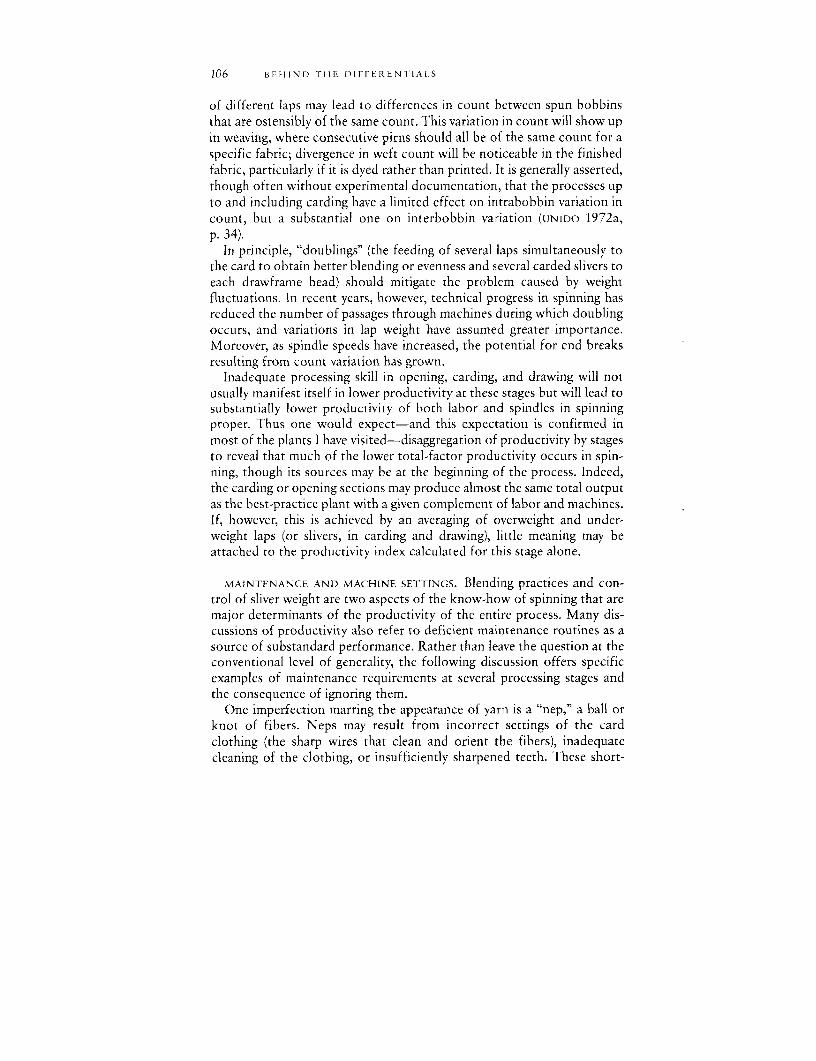
106 BEHIND THE DIFFERENTIALS
of different laps may lead to differences in count between spun bobbinsthat are ostensibly of the same count. This variation in count will show upin weaving, where consecutive pirns should all be of the same count for aspecific fabric; divergence in weft count will be noticeable in the finishedfabric, particularly if it is dyed rather than printed. It is generally asserted,though often without experimental documentation, that the processes upto and including carding have a limited effect on intrabobbin variation incount, but a substantial one on interbobbin variation (UNIDO 1972a,p. 34).
In principle, "doublings" (the feeding of several laps simultaneously tothe card to obtain better blending or evenness and several carded slivers toeach drawframe head) should mitigate the problem caused by weightfluctuations. In recent years, however, technical progress in spinning hasreduced the number of passages through machines during which doublingoccurs, and variations in lap weight have assumed greater importance.Moreover, as spindle speeds have increased, the potential for end breaksresulting from count variation has grown.
Inadequate processing skill in opening, carding, and drawing will notusually manifest itself in lower productivity at these stages but will lead tosubstantially lower productivity of both labor and spindles in spinningproper. Thus one would expect-and this expectation is confirmed inmost of the plants I have visited-disaggregation of productivity by stagesto reveal that much of the lower total-factor productivity occurs in spin-ning, though its sources may be at the beginning of the process. Indeed,the carding or opening sections may produce almost the same total outputas the best-practice plant with a given complement of labor and machines.If, however, this is achieved by an averaging of overweight and under-weight laps (or slivers, in carding and drawing), little meaning may beattached to the productivity index calculated for this stage alone.
MAINTENANCE AND MACHINE SETTINGS. Blending practices and con-trol of sliver weight are two aspects of the know-how of spinning that aremajor determinants of the productivity of the entire process. Many dis-cussions of productivity also refer to deficient maintenance routines as asource of substandard performance. Rather than leavve the question at theconventional level of generality, the following discussion offers specificexamples of maintenance requirements at several processing stages andthe consequence of ignoring them.
One imperfection marring the appearance of yarn is a "nep," a ball orknot of fibers. Neps may result from incorrect settings of the cardclothing (the sharp wires that clean and orient the fibers), inadequatecleaning of the clothing, or insufficiently sharpened teeth. These short-
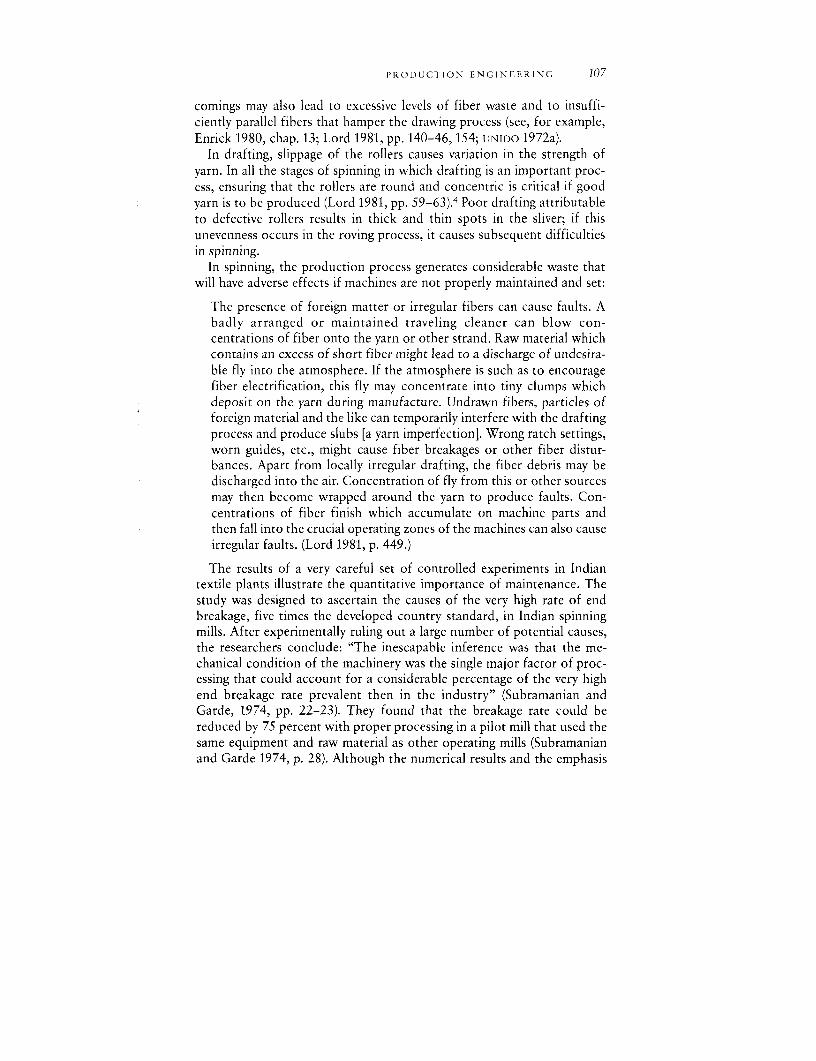
IPRODUCTION ENGINEERING 107
comings may also lead to excessive levels of fiber waste and to insuffi-ciently parallel fibers that hamper the drawing process (see, for example,Enrick 1980, chap. 13; Lord 1981, pp. 140-46,154; UNIDO 1972a).
In drafting, slippage of the rollers causes variation in the strength ofyarn. In all the stages of spinning in which drafting is an important proc-ess, ensuring that the rollers are round and concentric is critical if goodyarn is to be produced (Lord 1981, pp. 59-63).4 Poor drafting attributableto defective rollers results in thick and thin spots in the sliver; if thisunevenness occurs in the roving process, it causes subsequent difficultiesin spinning.
In spinning, the production process generates considerable waste thatwill have adverse effects if machines are not properly maintained and set:
The presence of foreign matter or irregular fibers can cause faults. Abadly arranged or maintained traveling cleaner can blow con-centrations of fiber onto the yarn or other strand. Raw material whichcontains an excess of short fiber might lead to a discharge of undesira-ble fly into the atmosphere. If the atmosphere is such as to encouragefiber electrification, this fly may concentrate into tiny clumps whichdeposit on the yarn during manufacture. Undrawn fibers, particles offoreign material and the like can temporarily interfere with the draftingprocess and produce slubs [a yarn imperfection]. Wrong ratch settings,worn guides, etc., might cause fiber breakages or other fiber distur-bances. Apart from locally irregular drafting, the fiber debris may bedischarged into the air. Concentration of fly from this or other sourcesmay then become wrapped around the yarn to produce faults. Con-centrations of fiber finish which accumulate on machine parts andthen fall into the crucial operating zones of the machines can also causeirregular faults. (Lord 1981, p. 449.)
The results of a very careful set of controlled experiments in Indiantextile plants illustrate the quantitative importance of maintenance. Thestudy was designed to ascertain the causes of the very high rate of endbreakage, five times the developed country standard, in Indian spinningmills. After experimentally ruling out a large number of potential causes,the researchers conclude: "The inescapable inference was that the me-chanical condition of the machinery was the single major factor of proc-essing that could account for a considerable percentage of the very highend breakage rate prevalent then in the industry" (Subramanian andGarde, 1974, pp. 22-23). They found that the breakage rate could bereduced by 75 percent with proper processing in a pilot mill that used thesame equipment and raw material as other operating mills (Subramanianand Garde 1974, p. 28). Although the numerical results and the emphasis
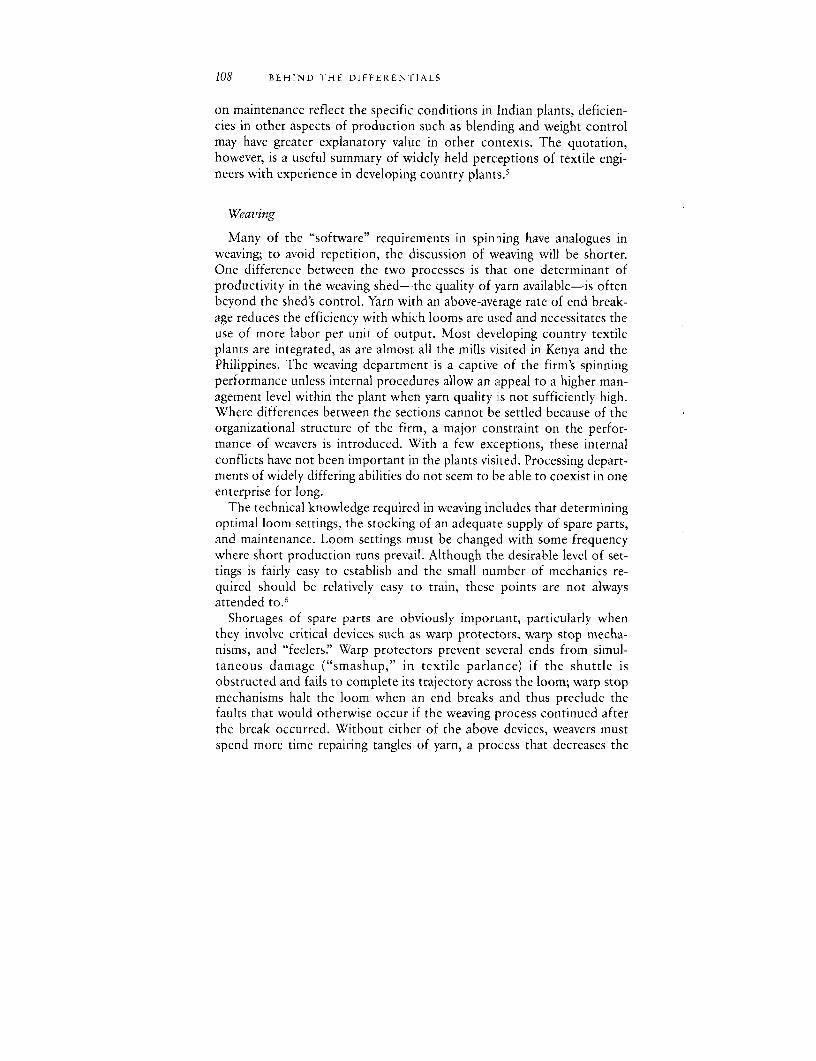
108 BEHIND THE DIFFERENTIALS
on maintenance reflect the specific conditions in Indian plants, deficien-cies in other aspects of production such as blending and weight controlmay have greater explanatory value in other contexts. The quotation,however, is a useful summary of widely held perceptions of textile engi-neers with experience in developing country plants.5
Weaving
Many of the "software" requirements in spinning have analogues inweaving; to avoid repetition, the discussion of weaving will be shorter.One difference between the two processes is that one determinant ofproductivity in the weaving shed-the quality of yarn available-is oftenbeyond the shed's control. Yarn with an above-average rate of end break-age reduces the efficiency with which looms are used and necessitates theuse of more labor per unit of output. Most developing country textileplants are integrated, as are almost all the mills visited in Kenya and thePhilippines. The weaving department is a captive of the firm's spinningperformance unless internal procedures allow an appeal to a higher man-agement level within the plant when yarn quality is not sufficiently high.Where differences between the sections cannot be settled because of theorganizational structure of the firm, a major constraint on the perfor-mance of weavers is introduced. With a few exceptions, these internalconflicts have not been important in the plants visited. Processing depart-ments of widely differing abilities do not seem to be able to coexist in oneenterprise for long.
The technical knowledge required in weaving includes that determiningoptimal loom settings, the stocking of an adequate supply of spare parts,and maintenance. Loom settings must be changecl with some frequencywhere short production runs prevail. Although the desirable level of set-tings is fairly easy to establish and the small nurnber of mechanics re-quired should be relatively easy to train, these points are not alwaysattended to.6
Shortages of spare parts are obviously important, particularly whenthey involve critical devices such as warp protectors, warp stop mecha-nisms, and "feelers' Warp protectors prevent several ends from simul-taneous damage ("smashup," in textile parlance) if the shuttle isobstructed and fails to complete its trajectory across the loom; warp stopmechanisms halt the loom when an end breaks and thus preclude thefaults that would otherwise occur if the weaving process continued afterthe break occurred. Without either of the above devices, weavers mustspend more time repairing tangles of yarn, a process that decreases the
PRODUCTION ENGINEERING 109
productivity of both weavers and looms for a given loom assignment perweaver.
The feelers in an automatic loom monitor the pirn to ascertain thatsufficient weft remains to allow continued weaving. When the pirn isabout to be depleted, a signal is sent to the shuttle box containing filledpirns ordering one to be moved up to the "picker," or shuttle projectingmechanism. If feelers are missing, an automatic loom must be operated asa semiautomatic one; pirns may run out of weft, at which point the loomis stopped, a new pirn is placed into position, and the loom is adjusted torestore the required tension in the cloth and is then restarted. The rate ofutilization or machine efficiency will clearly be much lower for a givenloom assignment per weaver when the automatic changing mechanismsare not available.
Quality Control
For most of the problems mentioned in spinning (and for innumerableones not discussed) one quality-control technique or another is availablefor monitoring production at each stage, for attributing observed defectsto specific processing deficiencies, and for altering engineering parametersto eliminate the problem.7 The last two steps are not a routinized pro-cedure but follow an elaborate decision tree much as medical diagnosisdoes. Even with good quality-control equipment and competent techni-cians, there is an art to identifying and remedying production defects, andit is largely a learned art, depending on experience. It does not accrueinevitably as a function of cumulated production, as in simple models oflearning by doing. A conscious management policy of insisting on highperformance at each stage is necessary to elicit the effort to master thevarious techniques. But the mere existence of such a policy does notguarantee results. As in most arts, the success of the endeavor seems todepend on the availability of competent instructors; it is unlikely to belearned solely from available published materials, though these may help.8
Instructors are unlikely to be available domestically and hence must oftenbe brought from abroad for extended periods. Salaries for instructors,usually employees of other firms, are one of the many types of investmentto increase output that constitute an alternative to further purchases ofequipment.
Summary
Deficiencies in one or more of the procedures discussed in this chapterare fairly common in some of the plants considered in chapters 4 and 5.
110 BEHIND THE DIFFERENTIALS
What is critical is that some mills have achieved mastery of a large numberof the required routines and are thus able efficiently to utilize equipmentthat other firms insist is not capable of better performance. Such differen-tial ability in production engineering is one of the factors that accountsfor the absence of any systematic relationship between the vintage or typeof equipment and the unit costs achieved in operating it, particularly inthe Philippines. None of the skills required for successful productionnoted in this section is embodied in machines; rather these skills representthe purposeful accumulation of knowledge, or know-how by individualfirms. The managers of a number of mills do not recognize the impor-tance of acquiring such expertise and try to redress current disparities inproduction costs by purchasing still more moderr[ equipment despite theevidence (see tables 5-6 and 5-8) that the acquisition of such machineryoffers no guarantee of improved performance. The differential success intechnological mastery forms part of the basis for the suggestions aboutthe nature and desirable phasing of policies to enhance productivity thatare discussed in chapters 8 and 9.
Operating Characteristics of Philippine and Kenyan Plants
The following selective description of flaws in production managementis designed to convey a more concrete picture of the deviations of actualpractice from the desirable procedures described in the previous sectionsof this chapter. There is no attempt to report the frequency with whichany specific practice is found or to establish quantitatively the impact ofeach deficiency on aggregate plant productivity. Cumulatively, however,these shortcomings must account for most of the firm-specific productiv-ity-depressing factors relative to best-practice counterpart mills. Diffi-culties occurring in both Kenya and the Philippines are presentedtogether, although where a practice most often appears in factories in onecountry this is noted. Some mills in both countries were free of most ofthe problems, but these were exceptions.9
Widespread, particularly in the Philippines, are the absence of care inpurchasing cotton fiber with appropriate qualities, inadequate (or no)testing and classification of purchased bales, and a casual attitude towardfiber mixing to obtain a desirable set of yarn properties. In some plantsonly two or three bales of cotton are used at one time as sources of fiber,whereas a well-run spinning mill is likely to use a minimum of thirty orforty bales (Fiori 1966). To compound the harmfu] effects, in some facto-ries the workers feeding the opening hoppers draw large amounts of fiberfrom each bale.
OPERATING CHARACTERISTICS ill
There are other problems in the preparatory processes in spinning.Although it is possible to install automatic lap weighers at the end of theopening and cleaning stage, most firms have not done so because weighingis easily done by an unskilled worker. In some plants, however, workers donot reject scutcher laps of incorrect weight. Where a receipt from thescale recording the lap weight must be attached to the lap, a variety ofstrategems have been introduced, such as bouncing palpably underweightlaps on the scale so that they register the desired weights.10 The motiva-tion here may be to prevent the detection of defective fiber feeding bycoworkers; alternatively, employees may simply not understand the reasonfor obtaining laps of correct weight and view the requirement as arbitrary,a game with no consequence played against management.
Many mills pay little attention to keeping environments relatively freeof waste material. Moreover, the generation of waste is occasionally exac-erbated by the use of fibers that are too short. Inadequate cleaning hasparticularly bad effects in weaving, as some of the waste becomes embed-ded in fabric and accounts for excessive imperfections.
Despite the high humidity of the Philippines, humidity is often not wellcontrolled by air conditioning, nor are the effects of humidity measured.Although this may be partly a rational response, given the costliness ofelectricity, few of the inexpensive devices available to measure and miti-gate its effects are employed (for example, systematic tests for humidityregain in fiber at the various stages of processing).
In a number of mills, primarily in the Philippines, equipment of recentvintage is operated at much below potential machine efficiency becausespare parts have not been stocked in sufficient quantities. The moredepressing examples of the problem include quite good automatic loomsproduced during the mid- to late 1960s that are operated in a semi-automatic mode with assignments of two looms per weaver, in contrast tothe thirty- or forty-loom standard in the United States and the eight-to-ten-loom standard in those Philippine firms that are able to obtain spareparts. The most important missing parts are mechanisms sensing brokenwarp yarns and the imminent emptying of weft pirns.
Examples of worker laxity are less frequent than would be expected,given received wisdom on the sources of inefficiency. Nevertheless, thereare some examples. In some plants (particularly in Kenya), pirns con-taining weft yarns of differing count are incorrectly placed in the shuttlebox. As a result cloth produced on new automatic looms shows quiteobvious differences in appearance within a meter. Although some man-agers use color-coded pirns to prevent this, others do not. Stains in thefinished cloth produced by the dirty hands of weavers or cloth handlersare also frequent in some Kenyan plants.
112 BEHINI) THE DIFFERENTIALS
Although machine mechanisms were not inspected, there is little reasonto doubt the continued applicability in some plants of a description of atechnical aid mission to the Philippines in the early 1970s, which noted"shredded drafting aprons, bulging drafting rollers, eccentric rollers anddrive drums, worn bearings, shredded gears and vvobbly spindles" and afactory with four-year-old Swiss ring frames in which every moving partwas worn out (UNIDO 1972b, pp. 21-22). The World Bank found thatscheduled maintenance programs are rare and standard loom settingswidely ignored. Yet incorrect loom settings can reduce both physicalproductivity and fabric quality.'"
In preceding chapters the quantitative impact of excessive product di-versity has been shown to play an important role in reducing total-factorproductivity. In chapter 2, the absence of long production runs was linkedto two phenomena, high setup costs and the inability to correct flawsquickly. Examples of the second phenomenon abound, but only a few willbe cited. In some Philippine plants, incorrect loom setting were noted in anumber of weaving sheds in 1972 (UNIDO 1972b). These conditions stillexist, producing a flaw in the fabric once in ten linear yards, or every twoor three hours. By the time the flaws are noted, the loom that producedthe defective cloth identified, and the problem with settings understood,a substantial fraction of a given production run has been completed, andmuch of the fabric produced will fetch a lower price than it would have ifit had been perfect. More accurate loom setting has the potential tomitigate some of the adverse effects of short production runs.
Similar difficulties arise in spinning. When too many neps are producedby inaccurate card settings, the absence of quality-control devices (nep-counting templates) does not allow sufficiently rapid correction beforeproduction of another fiber combination or yarn count begins. Althoughquality-control devices exist that would permit faster correction, theyhave not been introduced despite the relatively small expenditure involvedand the knowledge that the instruments are available. Thus short produc-tion runs do not present an immutable obstacle to higher productivity;they do, however, place a premium on the firm's capacity to understand itseconomic environment and on its correct assessment of the value ofinternationally available technology.
Additional insight into the organizational basis of low productivity canbe obtained from a comparison of selected practices and characteristicsof three Philippine textile mills. The profiles in table 6-1 provide someobservable behavioral characteristics likely to be associated with manage-ment interest in (1) obtaining a competent labor force (careful recruitingpractices); (2) getting high performance from it (wage incentive plans); (3)improving technical knowledge (the employment of expatriates); and (4)
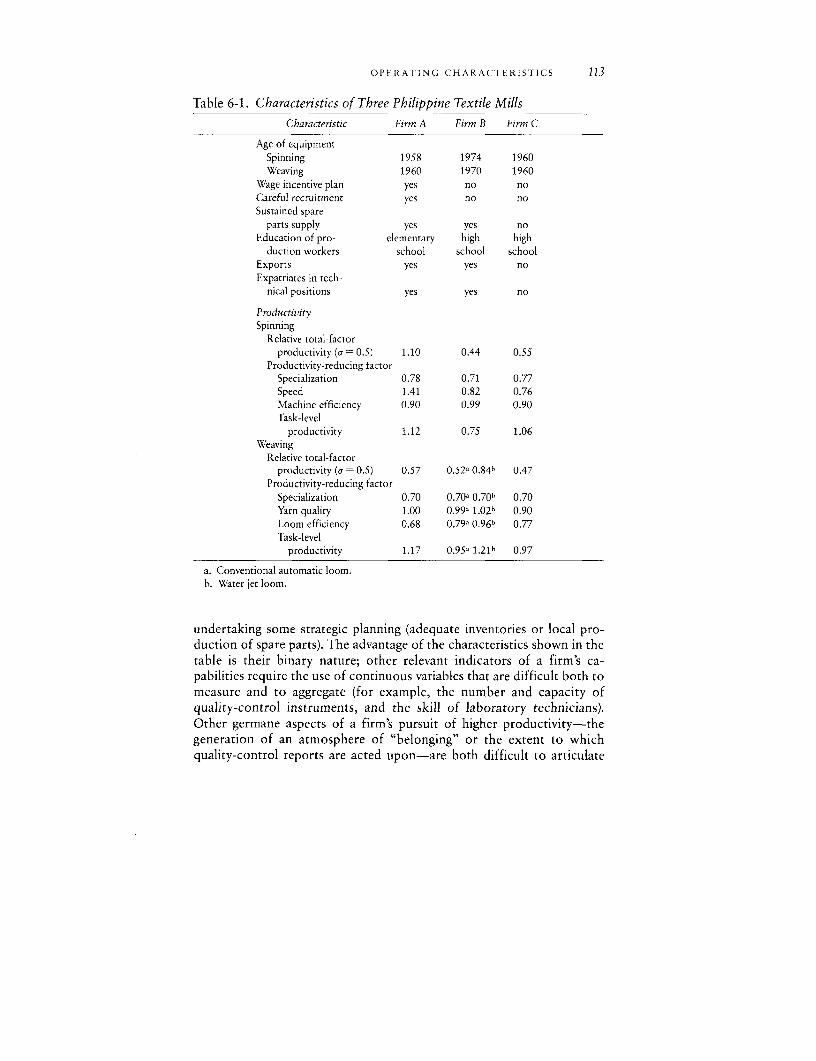
OPERATING CHARACTERISTICS 113
Table 6-1. Characteristics of Three Philippine Textile Mills
Characteristic Firm A Firm B Firm C
Age of equipmentSpinning 1958 1974 1960Weaving 1960 1970 1960
Wage incentive plan yes no noCareful recruitment yes no noSustained spare
parts supply yes yes noEducation of pro- elementary high high
duction workers school school schoolExports yes yes noExpatriates in tech-
nical positions yes yes no
ProductivitySpinning
Relative total-factorproductivity (a = 0.5) 1.10 0.44 0.55
Productivity-reducing factorSpecialization 0.78 0.71 0.77Speed 1.41 0.82 0.76Machine efficiency 0.90 0.99 0.90Task-level
productivity 1.12 0.75 1.06Weaving
Relative total-factorproductivity (a = 0.5) 0.57 0.52D 0.84h 0.47
Productivity-reducing factorSpecialization 0.70 0.70a 0.70b 0.70Yarn quality 1.00 0.99a 1.02b 0.90Loom efficiency 0.68 0.79a 0.96b 0.77Task-level
productivity 1.17 0.95a 1.21h 0.97
a. Conventional automatic loom.b. Water jet loom.
undertaking some strategic planning (adequate inventories or local pro-duction of spare parts). The advantage of the characteristics shown in thetable is their binary nature; other relevant indicators of a firm's ca-pabilities require the use of continuous variables that are difficult both tomeasure and to aggregate (for example, the number and capacity ofquality-control instruments, and the skill of laboratory technicians).Other germane aspects of a firm's pursuit of higher productivity-thegeneration of an atmosphere of "belonging" or the extent to whichquality-control reports are acted upon-are both difficult to articulate
114 BEHIND THE DIFFERENTIALS
and by their very nature hard to measure.'2 My general impression is thatfirms that perform well on the more easily measured variables are quitegood in less easily quantifiable activities."3
The three firms are denoted by A, B, and C. Firm A is very efficient(both technically and allocatively) and employs mrachinery dating to thelate 1950s and early 1960s. Firm B operates both conventional automaticand water jet looms at fairly high RTFP. Firm C uses equipment similar tothat of firm A but obtains much lower productivity.
Firm A's high RTFP is at least partly explicable in terms of the variablesmeasuring firm effort. Rather than considering its labor pool to consist ofanyone who appears at the factory gate, as do firms B and C, the companysends recruiters around the country. It does not require a high schooldiploma of its production workers-a sensible practice, given the rela-tively simple and repetitious nature of most production operations. It isone of the few plants to have established a wage incentive program, whichit estimates has raised labor productivity by 10 percent. Despite the factthat its equipment is fairly old, it has no problems with spare parts; it hashelped to establish a local independent plant to manufacture these itemsand continues to give this plant substantial technical help.'4 Firm A em-ployes a large number of Japanese expatriates in technical positions; theirconsiderable production and other managerial experience is demon-strated by the relatively high speeds achieved with older ring spindles byslight modifications, including the use of internally produced parts. Thehigher speed operation is also conditional upon the plant's above-averagemaintenance record. The mill's success is shown by the fact that most ofits output is used by a clothing manufacturer whose production is ex-ported without subsidies.
The main characteristic of firm B that requires explanation is its lowertask-level productivity. Firm B also employs a large contingent of foreigntechnicians who are important in achieving its high technical perfor-mance, including a supply of spare parts from other Asian countries.Unlike firm A or other companies in the sector, it employs a large numberof college graduates in supervisory positions. Nevertheless, it is much lesscareful in its recruitment of production workers and does not utilize awage incentive program; these shortcomings probably explain its in-feriority in TLP relative to firm A.
Company C uses equipment that is almost identical to that of firm A.Much of its behavior is inimical to efficient, high-quality production.Planned recruitment and performance-based remuneration are absent,high school graduation being taken as a sign of aptitude. The speed withwhich its spindles are used is quite low, largely because of an absence ofmaintenance and spare parts. The firm has done little to initiate its own
OPERATING CHARACTERISTICS 115
production of spares, to identify reliable foreign suppliers, or to helpestablish a local independent machine shop. Significantly, it has no ex-patriates from countries with a more mature textile industry, and there isan unmistakable sense that the know-how, or tacit production knowl-edge, enjoyed by the staffs of firms A and B is largely absent in firm C.One measurable consequence is the low quality of its yarn (measured byend breakage rates).
A comparison of the three mills offers some insights into the methodsthat firms choose to improve their competitiveness with other companiesin the industry. Plant B currently possesses some of the newest spinningand weaving equipment in the sector but has the lowest task-level produc-tivity of the three firms (except on its water jet loom). In contrast, mea-sures of its technical proficiency such as yarn quality and machineefficiency imply considerable competence in these areas. Despite the re-sidual nature of calculated TLP, it is likely that the measured differencescapture a substantive phenomenon. The implication is that B's difficultyin obtaining high labor productivity, even with its quite new spinningequipment, leads it to seek productivity gains through the use of still moremodern equipment that will supposedly lower its costs relative to those ofother firms.
The preceding discussion has focused on the determinants of produc-tivity, but interfirm comparisons can also offer insights about the choiceof technology. It is often suggested that the absence of sufficiently skilledworkers or supervisors may make it economic to substitute more modernequipment for the missing skills (see Baer and Herve 1966). Firm B may,however, exemplify an opposite kind of causality: its hiring of collegegraduates may have instilled a built-in bias toward the purchase of rela-tively modern equipment on the grounds that it is hard to meet theexpectations of college graduates by hiring them as supervisors in a plantthat uses thirty-year-old machinery. The firm's adoption and efficient useof quite modern water jet looms may thus partly reflect the presence ofthese highly educated supervisors.
The implications of these interfirm contrasts and the more generalquestions they raise for national governments and international agenciesconcerned with improving economic performance will be discussed inchapters 8 and 9. Here it can be noted that firms clearly need to work on awide range of productivity-enhancing activities that conspicuously ex-clude the purchase of new equipment. To draw a parallel to agriculturaldevelopment, the necessary policy instruments are more analogous toresearch on biological and chemical production factors and their dis-semination through extension services than to the acquisition of morelarge tractors.
116 BEHIND THE DIFFERENTIALS
Performance Gaps
Further comparisons of these and other firms could be made, but it isalready clear that the plants visited lack many of the requirements for highproductivity and quality. Why this should be so will be discussed inchapter 7 in a more general framework, but some observations may alsobe appropriate at this point.
The performance gaps noted above may be divided into two types. Thefirst probaby (but not certainly) consists of cost-rninimizing responses tothe specific economic environment faced by the firm, whereas the secondreflects either an absence of knowledge about technically and econom-ically appropriate behavior or an unwillingness to act upon it. As anexample of the first type, consider the use of excessively short fibers inKenyan spinning and the failure to use air conditioning in humid condi-tions in some Philippine mills. It is difficult to establish whether thesefactors are responses to tariffs on imported cotton in Kenya or highelectricity rates in the Philippines, or whether they reflect gaps in firms'knowledge. If the former, then they are not a true source of differencebetween actual and best-practice productivity but only appear so when aninsufficiently detailed production function is used. In particular, if theproduction function employed to calculate RTFP were expanded to in-clude cotton fiber qualities such as length or the quantity of air-con-ditioning equipment, measured RTFP would be greater, and some of theproductivity differences attributed to firm-specific technical abilities orto task-level productivity would be lower. The technical literature sug-gests, however, that these (perhaps) rational responses could not accountfor more than 5 to 10 percent of total-factor productivity differentialsthat range from 30 to 200 percent.
Thus even if some of the measured low RTFP overstates the differencebetween developing country and best-practice plants, there is still a con-siderable amount to explain. Moreover, the preceding discussion has giventhe benefit of the doubt to the strict neoclassical view by allowing, forargument's sake, that some of the observed deficiencies are attributable tocost-minimizing responses rather than to the absence of knowledge or ofinterest in economizing. Many of the observed practices are relativelyunambiguous, however: most of the observed performance gaps that ac-count for poor productivity, particularly in the Philippines, do not appearto be responses to economic incentives (or therefore movements along theproduction function). Rather they represent a downward shift in theproduction function, and rectifying them would considerably reduce unitcosts, even at current input prices. Without still more detailed engineeringand economic information for each firm, this assertion is difficult to
PERFORMANCE GAPS 117
validate directly by the use of a multifactor production function. Indirectconfirmation is possible, however, and several types of evidence can beadduced to support the hypothesis that most of the firm-specific sourcesof low productivity represent examples of x-inefficiency. Three instancesof deficient practice that confirm this view are discussed below: the smallnumber of fiber bales used at the beginning of the spinning process, thetype of fiber purchased, and the inventory of spare parts that firms main-tain.
Of the three illustrations, only that of the insufficient stocking of spareparts can be related directly to one of the generally important productiv-ity depressants measured in chapters 4 and 5, namely low loom efficiencyin Philippine weaving sheds. Many similar instances could be adducedfrom the evidence collected, however (for example, the failure to employsimple and well-known methods to correct for excess humidity). Themajor point of these examples is that, given the ease and low cost withwhich the deficiencies could be corrected, it is particularly tempting toconclude that their continuation reflects a lack of maximizing behavior,bounded rationality, or both, rather than a negative decision based on acareful calculation of benefits and costs (see Leibenstein 1976, 1978, andNelson and Winter 1982). The main reason for caution before we acceptthis plausible alternative to the conventional view of economists is thatthe benefit-cost calculations presented in the next few pages include onlyimmediate or narrowly defined direct costs of altering the existing situa-tion. They do not include implicit and explicit overhead, such as the costof revamping the organizational structure so that performance gaps are infact perceived as a problem and addressed. In some of the specific casesconsidered, these indirect costs may be substantial. A more inclusivebenefit-cost ratio, including some allowance for these organizational ex-penses, will be carried out in chapter 8.
Blending Routines
Consider the marginal costs and benefits that would accrue from theuse of, say, forty rather than three bales of raw fiber to supply the openingmachines. Although the benefits are difficult to quantify (Lord 1981;Subramanian and Garde 1974), it is known that improved blending raisesproductivity at all stages of spinning. A rough indicator of potential bene-fits is the increase in revenue that could be obtained from improved speedin Philippine plants. From table 5-6, it can be seen that perhaps a 5percent increase in total output could be realized in two vintage groups,1960-70 and 1970-77.
118 BEHIND THE DIFFERENTIALtS
What marginal costs, apart from a minor rise in power use as speedincreases, are associated with obtaining these benefits? The two majorcosts of enlarging the number of bales from which the openers are fed areexpansion of the factory floor area devoted to opening and the interestcost of the growth in the steady-state inventory. The data on utilization ofspace show that plants that use a small number of bales typically havemuch greater than average square footage per unit of equipment. More-over, this excessive footage characterizes all stages of spinning, not justopening. Thus rather than engaging in a tradeoff between space and yarnquality that would support the economizing hypothesis, the firms in ques-tion are technically inefficient in the use of space throughout the plants.Indeed, in all cases the current size of the opening room would permit alarge expansion in the number of bales from which the opening line is fed.
With respect to the potentially greater interest cost associated withhigher inventory levels, the firms' balance sheets and income statementsshow no systematic interfirm differences in inventory-sales ratios-if any-thing, the firms with worse blending behavior have slightly larger overallinventory-sales ratios. Interfirm differentials in borrowing costs mightwarrant varying ratios, but most firms report very similar short-run bor-rowing costs. The qualitative picture is thus fairly clear: firms with poorerblending forgo the potential benefits of a different: routine, but the depar-ture from the best-practice procedures does not reflect an effort to econ-omize on either inventory costs or space. It is a purely x-inefficientpractice rather than a cost-minimizing response to substitution oppor-tunities.
Fiber Quality
A similar conclusion results from examination of another source ofpoor performance, the purchase of fiber that is not consistent with thedesign of existing equipment. Although the specific instance cited herewas noted in UNIDO (1972b), my interviews and other recent studies of thePhilippine textile industry suggest that similar problems remain (see Phil-ippines, Board of Investment 1979; Philippines Interagency Technical Sub-committee 1978a, 1978b). A firm encountering considerable difficulty inspinning requested help from the Philippine Textile Research Institute, ajoint government-industry venture whose purpose is to improve produc-tivity. It was found that the chief financial officer, who handled fiberpurchases, often chose the cheapest fiber available without consulting thetechnical staff in his spinning department. The fiber being purchased,however, was too short a staple to be spun by the plant's existing equip-ment. Because the degree of substitutability between fiber of different
PERFORMANCE GAPS 119
qualities (below some threshold) and the equipment currently in place wasnil, no economically efficient substitution was possible. This again was acase of x-inefficiency rather than one of optimization along a more disag-gregated isoquant.
Spare Parts Inventory
A third, more detailed example may consolidate the point being made.As noted in chapter 5, lack of spare parts is a major source of poor relativetotal-factor productivity in the Philippines, particularly in weaving. Theaverage rate of loom efficiency for all firms is 63 percent, whereas theattainable rate at current loom-labor ratios and end breakage rates isabout 91 percent. Assume that improved maintenance by itself could raisethe current average efficiency rate to 70 percent. Then the loss in effi-ciency and hence in output per loom largely attributable to inadequatesupplies of spare parts is equal to roughly 30 percent of current output.Denote by v the ratio of variable cost (materials, electricity, and so forth)to the price of this additional output. No more labor is required toproduce the expanded output, as potential efficiency has been calculatedfor the existing labor-loom and breakage rates. More spare parts would,in fact, reduce labor requirements per machine, as looms could be oper-ated without the current level of attention to warp breaks and pirn deple-tion. Let i equal the current cost of short-term borrowing, ,B theinventory-sales ratio, a the ratio of spare parts to all inventories, and Rtotal sales. The marginal net revenues from storing enough spares torealize potential efficiency is
(6-1) AR =R (Ae )(1 v)
where Ae/e is the achievable percentage change in the utilization rate.The marginal cost of holding additional inventories of spare parts is
(6-2) AC = il ce (A
Information from the seven Philippine firms for which detailed incomeand balance sheet data are available yields the following average values forthe relevant variables: i = 0.15, d = 0.54, Ae/e = 0.30, and 1 - v = 0.38.Values of spare parts inventories, a, are not reported by any firm. Assumea very high value, such as 0.20. Then, given the value of the other variablesin equation 6-2, a doubling of spare parts inventories would result in
120 BEHIND THE DIFFERENTIALS
additional annual costs equal to 1.6 percent of current sales, whereasequation 6-1 suggests that the increase in efficiency of 30 percent permit-ted by greater availability of spares would result in an increase in netrevenues of 11.4 percent of current sales. The annual benefit is thus 7.1times the annual cost. The sectorwide average, as indicated by evidencefrom individual firms, suggests that inadequate stocks of spares are morelikely to represent the absence of a marginal benefit-cost calculus than acost-minimizing effort.
If sectorwide values for the variables are replaced by the firm-specificvalues for the variables, the marginal benefit-cost ratios for the seven millsare 5.6, 24.6, 18.6, 5.0, 7.0,19.6, and 11.0. Thus even the firm that exhibitsthe lowest ratio, 5.0, is currently forgoing a one-year rate of return of 400percent (if it is assumed that all of the increase in stock occurs at thebeginning of the year and the additional output is forthcoming at the endof the year). These figures are offered only to suggest orders of magnitude;they are probably conservative, however, as the assumed ratio of spareparts to total inventory is probably overstated severalfold. Firm invento-ries consist of fiber, finished goods, and work in process. Given the magni-tude of fiber requirements, it seems unlikely that spare parts wouldaccount for even 5 percent of total inventories.
The Persistence of Poor Performance
Why have defective practices not been corrected? One important strainin the international trade literature attributes such laxity to a degree ofprotection from competitive forces that allows rnanager and owners, ifnot workers, to obtain part of their enhanced real income in the form oflow work effort. In this view, the necessary conditions for raising produc-tivity are liberalization of trade restrictions and intensification of compet-itive pressures. As Corden (1974) has noted, however, it is not analyticallynecessary that a monopolistic position leads to managerial failure to cutcosts-as in other behavioral relationships there are income and substitu-tion effects. Very specific assumptions about managerial utility functionsare required to obtain a result showing that the entire blame rests on theabsence of competition. Although most economists believe strongly in therole of competition in stimulating higher productivity, there have been noempirical studies of changes in sectoral factor prodluctivity in the wake oftrade liberalization."5
The detailed examples given above suggest that even relatively simpleprocedures could substantially reduce firms' costs. Not only are suchactions feasible in principle, but they have been brought to the attentionof plant managers in the Philippines and the expertise to correct the
PERFORMANCE GAPS 121
existing flaws was offered at zero cost.16 Nevertheless there has been noprogress in this or other directions in a decade. It is possible to argue,though implausible in the specific cases noted, that the organizationalcost of considering, adopting, and implementing the required changes issignificant and the decision is consistent with global cost minimization. Ithink it is necessary to seek other explanations, however. Nelson andWinter place a related issue within a context of bounded rationality:
There is similarly a fundamental difference between a situation inwhich a decision maker is uncertain about the state of X and a situa-tion in which the decision maker has not given any thought to whetherX matters or not, between a situation in which a prethought eventjudged of low probability occurs and a situation in which somethingoccurs that never has been thought about, between judging an actionunlikely to succeed and never thinking about an action. The lattersituations in each pair are not adequately modeled in terms of lowprobabilities. Rather, they are not in the decision makers' considera-tions at all. To treat them calls for a theory of attention, not a theorythat assumes that everything always is attended to but that some thingsare given little weight (for objective reasons). (Nelson and Winter 1982,p. 67.)
The observations from the Philippines suggest that precisely such atheory of attention is needed. The entire burden of explanation could beplaced on the protective trade regime and firms behaving as satisficers, butas noted above, there are income and substitution effects, and it is notobvious that the failure to engage in such simple activities returns much inthe way of an easier life.
More generally, it is evident that many firms simply do not understandthe fine points of the production function with which best-practice firmsoperate. The firms' own technologists, particularly in the Philippines, areinsufficiently trained in a formal sense, do not adequately appreciate therelevance of readily available information for their own plants, and do notbring knowledge about international best-practice production engineer-ing to their work. To the extent that firms learn by doing, there is littlediffusion of this knowledge within the textile industry itself (again in thePhilippines), partly because there is little interfirm mobility of technicians(a reflection of the firms' origin in local family businesses) and partlybecause secretiveness is engendered by the perception that the market isan oligopolistic one in which any competitor's improvement may come atone's own expense. In short, the Philippine firms are not on the interna-tional technical frontier but do not know this or are unable to move there.Furthermore, they do not augment their technical and organizational
122 BEHIND THE DIFFERENTIALS
abilities to enable them to move toward the technical frontier despite thealmost certain improvement in profits obtainable from such a move.
A critical issue from a policy perspective is whether these firms wouldtry to learn about the practices necessary to attain this frontier if theywere subjected to competition. It seems to me that the only sensible viewon the probable outcome is skepticism, pending a study of the results ofliberalization in some areas that are currently inefficient and protec-tionist. The success of textile industries in Hong Kong, the Republic ofKorea, and Taiwan does not, I believe, demonstrate that liberalizationwould guarantee a move to sufficiently high levels of productivity topermit world competitiveness. In particular, entrepreneurs and technicalmanagers in these countries have had quite long experience with textileproduction, in contrast to their counterparts in both Kenya and the Phil-ippines (see Chin 1965; Koh 1966; Stifel 1963; and United Nations 1953).Indeed, in Kenya there was little in the way of traditional hand spinningand weaving before the advent of large mills. Productivity improvementmay require specific technological intervention as well as a more competi-tive trade regime, an issue discussed at length in chapter 8.
Costs and Profitability
One other interpretation of performance gaps that must be directlyaddressed is the possibility that high production costs are consistent withglobal profit maximization. Given the constraints on total organizationalresources, firms may be spending their scarce managerial abilities on ac-tivities, such as marketing or manipulating the trade regime, that yield agreater increase in profitability than would further efforts to raise al-locative and technical efficiency. Thus plants might show similar prof-itability despite variations in production costs. Do firms neglect toremedy production deficiencies because other pursuits are more profita-ble?
Firms were, not surprisingly, unwilling to divulge any information onprofitability other than statements submitted to various government agen-cies. Most of the data throughout this study have a large number of built-in technical consistency checks and could also be partially verified withobservations on the plant floor; this is not the case with income state-ments and is reason to have less confidence in them. Even if firms made agoodwill effort to depict their global profitability accurately, problemswould arise from the fact that many textile manufacturers are part ofvertically integrated firms. Depending on specific tax provisions and theeffective tax rate in each sector in which they operate, transfer pricesmight be altered to show greatest profits in the low tax sectors.
SPARE PARTS 123
There is thus no reliable evidence against which to test the hypothesisthat rates of return are similar across firms. Available income statementsshow low profits on sales; rate of return on equity defined by profitsrelative to any of several measures of capital is not meaningful given theabsence of efforts to revalue historical data for inflation. The recordedprofits-sales ratios are not systematically related to the cost and produc-tivity measures shown in chapter 5, but given the limitations of the in-come statements, the absence of such a relation is not particularlysigntficant.
It is also possible to try to infer something about profitability from thepattern of firm expansion and contraction. (Local Philippine lore suggeststhat any relationship between the two would be considerably attenuatedby the propensity of high-profitability firms to reinvest in the financialsector.) Most of the growth in physical capacity occurred during the1950s and 1960s (Philippines, Interagency Technical Subcommittee 1978a,1978b). Since then only a small amount of additional spinning and weavingcapacity has been installed, mostly in newly established mills. This fact,along with only slight growth in physical output during the period, impliesthat most existing plants expanded production by little during the pastfifteen years. And there is no evidence that any firms went bankruptduring the same period. Although detailed historical data on the output ofeach mill are not available, the aggregates suggest that large changes prob-ably did not occur in market shares in response to rates of return. Rathereach firm's total output was probably relatively constant regardless ofprofitability, because tariffs precluded the existence of a selection en-vironment in which profitability determined growth patterns. Hence, it isall the more impossible to determine whether growth patterns and lowunit production costs are related. If rates of return do in fact vary withunit cost, some firms are obtaining very high rents. Conversely, the exis-tence of high costs does not imply that, despite them, firms are somehowobtaining normal profits and the failure to reduce costs is part of someglobal maximization strategy. Although there is a puzzle about why plantswith presumably low returns remain in the sector, such behavior is hardlyunusual among firms in the textile and other sectors in the OECD
countries.
Spare Parts
There is an extensive literature on the difficulty of obtaining spare partsfor older equipment and the implications of this problem for the choiceof appropriate technology. The view that this literature embodies is too
124 BEHIND THE DIFFERENTIALS
simple, and the question that it poses about choice of technology must berephrased to focus on the benefit-cost ratio of establishing spare partscapacity. In both Kenya and the Philippines, but most prominently in thelatter, the availability of spare parts is a critical determinant of total-factorproductivity. Indeed, it may accurately be claimed that the ability of firmsto obtain an adequate supply of spare parts is a good predictor of theirtotal-factor productivity.
The best firms in the Philippines have helped several medium-size ma-chine shops (with about one hundred employees) to begin manufacturingneeded parts. This aid has included the provision of drawings and closeinteraction to assure correct dimensions. Other mills with relatively goodproductivity have been creative in establishing relations with producers ofspare parts in India and Taiwan. In contrast, the least efficient firmsbemoan the absence of any local supplies and typically do not carryinventories of parts from the original manufacturers. When questionedabout the possibilities of establishing a local machine shop as a supplier,they adduce many ad hoc reasons why such a step would be impossible. Itis not surprising, then, that the weaker plants are those most anxious tomodernize; modernization is an admission of their shortcomings ratherthan a cure for it.
Notes
1. Many of the most interesting descriptions and insights are, unfortunately, available only inunpublished documents. See, for example, Byrd and Tidrick (1984).
2. Tensile and tear strength, elasticity, durability, wrinkle resistance, color, luster, softness,and so on. Much of this discussion is based on Fiori (1965) and Enrick (1980).
3. Automatic bale pluckers are available, but these make little economic sense at Kenyan andPhilippine relative factor prices if we assume that supervisors can be trained.
4. It will be recalled that drafting involves the use of a series of rollers moving at successivelyhigher speeds, so that the sliver is elongated.
5. A World Bank study in 1975 provided an independent and similar confirmation of thestate of Indian plants.
6. Standard checklists for loom settings exist; see, for example, Enrick (1980), chap. 21.Incorrect settings largely affect product quality, although sonie may decrease productivity aswell.
7. For accounts of quality-control possibilities, see Enrick (1980), Lord (1981), pt. 6, andOrmerod (1979), chap. 3. There are instruments for checking weight gain from humidity, forautomatically weighing samples of laps, for calculating the coefficient of variation of the sliver'scount (the Uster percentage), and so on. Also, some types of processing equipment introducecontrol features as an integral part of the production process. Thus the autoleveler has beendeveloped for use in drawing. It measures the count of the sliver produced in the first stage ofdrafting, "compares it to a standard and sends out an error signal which is proportional to thedifference. The error signal causes the draft ratio to be altered to correct the error" (Lord1981, p. 59). Nevertheless, the autoleveler cannot completely correct for all deficient practices
NOTES 125
at earlier stages, as it can redress errors only within a limited range that is likely to be exceededwhen earlier procedures are very defective.
8. Nelson and Winter (1982) label the information conveyed "tacit knowledge.'9. For the Philippines, a firm-by-firm documentation of the incidence in 1972 of some of
these deficient practices is contained in UNIDO (1972b). Many problems had not yet beencorrected by 1980, according to the textile engineer R. Grills of the Shirley Institute, whoaccompanied me on the visits to the plants.
10. The 1972 UNIDO study notes that 7-20 percent of laps are rejected, but only whensupervisors are present.
11. For a detailed discussion of the nature of the required settings and the consequences ofignoring them, see Marks and Robinson (1976).
12. On the importance of firmwide atmosphere, see the summary by Nelson (1981). Oneeffort to measure firm efforts in these more subjective dimensions is that of Marsh andMannari (1976).
13. In many cases the assessments reflect those of R. Grills.14. This firm and the few others that had obtained or established a good local spare parts
supplier were more reluctant to divulge the latter's name than any other single piece ofinformation-hardly a surprising reaction, in view of the competitive advantage conferred bythese supplies.
15. There has been little direct effort, and even less success, in demonstrating a link betweentrade regime and factor productivity within sectors. A recent exception is Nishimizu andRobinson (1984). A survey of the issues is provided by Pack (forthcoming). Most attention hasbeen given to intersectoral allocation effects. Most analyses of potential sources of x-ineffi-ciency, such as those stemming from excess inventory holdings or low-capacity utilization,have considered aggregate effects rather than those manifest in individual sectors. For asummary of one major set of studies, see Bhagwati (1978), chap. 5.
16. UNIDO (1972b) describes many technical problems that were identified in each mill anddiscussions with senior management and technicians. Offers to help rectify deficient practiceswere almost never considered by the firms.
CHAPTER SEVEN
Comparative Analysis
THIS CHAPTER considers the findings of chapters 4-6 in a broaderframework and relates them to the existing theory of production andfirm-level behavior. Many of the phenomena presented in the earlier chap-ters are not easily explained within the neoclassical model usually em-ployed in firm-level analysis. Because this format provides the standardanalytical framework and vocabulary for discussing productivity, I willfirst present a stylized version of an augmented neoclassical productionmodel. This will be used to help explain intracountry and intercountrydifferences in productivity that are often ignored in conventional anal-yses. I will then provide data on the extent of such variations in productiv-ity within and between countries, concluding with observations on therole of proprietary information in the achievement of high productivity.
The Availability and Cost of Technology
Neoclassical production theory attempts to explain both the growth ofan economy over time and differences in observed productivity at a givenpoint in time. Most analyses of the sources of growth over time focus onaggregates: they implicitly assume that a changing technology is adoptedby a set of identical firms, so that observed variations in aggregate growthrates for an industry or the entire economy stem solely from differentialgrowth of natural (or augmented) factors, economnies of scale (often notmentioned in theoretical analyses but noted in empirical analyses such asDenison 1972), and other factors, broadly categorized as technology, thataffect all firms in an identical manner. In effect, the economy or theindustry consists of the Marshallian representative firm writ large; varia-tions between constituent firms have generated limited interest. Studies ofinternational productivity differences have been carried out in the samespirit, typically utilizing sectorwide data and analyzing the individual in-dustry as if it were a large firm.' Studies of this latter type have oftenneglected intraindustry dispersion because the only available source of
126
AVAILABILITY AND COST 127
data was sectorwide, but the root of the omission in some cases goesbeyond data scarcity and reflects an implicit theoretical model.
If technology is costlessly available and assimilable, any intraindustryvariation in total-factor productivity that is not attributable to nationaland industry sources is presumably small. Because such variation is hy-pothesized to be largely due to differences in equipment vintage andincomplete adjustment to changed technology, it is a not very interestingphenomenon.2 Differential abilities of firms and the costs they face inlearning about various technologies are omitted. Although the suppres-sion of these relatively complex aspects has facilitated the development ofa powerful set of theoretical insights in growth theory and major break-throughs in empirical measurement, excluded factors that may be of lim-ited importance in the analysis of the growth of advanced countriesbecome very important when poorer countries are being analyzed. Intra-industry differences in unit costs of 77 percent in spinning and 142 per-cent in weaving, for example, are observed in the Philippines. They cannotbe explained by the different vintages of equipment used by the firmsconcerned.
The data presented in chapters 4 and 5 permit an exploration of theusefulness of the fiction of the representative firm and an examination ofthe extent and nature of intraindustry variations in productivity. More-over, because very detailed data characterizing the machinery in use werecollected, it is possible to go beyond the date of manufacture in order toexplain the impact of specific equipment on observed productivity. Thusthe present study has greater explanatory power than some of the pre-vious research on productivity, which assumed that diversity in vintagewas the major explanation of measured differences among firms.
The three preceding chapters demonstrate that firms using essentiallyidentical equipment achieve widely varying levels of both single factorand, more important, total-factor productivity. The decomposition pro-cedure identified and measured the proximate sources of productivitydifferences relative to best practice. If technology were costlessly availableand assimilable, and if firms acted to minimize their costs, the relativelylarge interfirm variation in productivity-reducing factors (other than spe-cialization) should not be observed. One objective of this chapter is tocompare the level and variation of these factors for Kenya and the Philip-pines and to infer, if possible, the most likely underlying sources of dif-ferential firm-level performance.
The preceding chapters have compared the productivity of Kenyan andPhilippine producers to a conveniently available set of detailed U.K. best-practice standards. It is also useful to provide an additional perspective bycomparing these sets of productivity measures with those achieved in
128 COMI'ARATIVE ANALYSIS
other countries. A plausible conjecture based on the assumption of acostlessly available international technology is that the better firms ineach country, say, those in the highest quartile, should exhibit similarproductivity (apart from differential specialization), particularly in a tech-nologically mature sector such as cotton textiles.3 Even if disembodiedtechnology is not "in the air" or in journals, individuals who understandthe relevant technical or organizational skills are internationally mobileand hence allow equalization of total-factor productivities. Single-factorproductivities would, however, still reflect differences in relative factorprices that themselves stem from different relative factor endowments.
International equality of total-factor productivity among the betterfirms may coexist with substantial international variation in average sec-torwide productivity if there is nonsymmetric intracountry variation.Moreover, international dispersion may also be reflected in intracountrydispersion. One has only to consider the possibility that each domesticfirm learns (through licensing agreements, technical advice from pur-chasers of its products, and so on) from a representative sample of foreigncompanies. If each of the purveyors of technology is itself a best-practicefirm within its own country, then any intercountry variations in produc-tivity that exist among best-practice plants may be replicated in, say, thePhilippines. Such replication would result if the technical mastery of eachdomestic developing country firm is more closely related to these externalsources than to the knowledge (costlessly available) within its borders.4
Evidence of either substantial variations in firm-specific productivity ofthe kind found in Kenya and the Philippines, or of significant variationsbetween the better firms in different countries, undermines the plau-sibility of the usual, very convenient assumption of an identical, freelyavailable international production function along which all firms are ableto move.
An important question, separate from intracountry variations, is thelevel of peformance of Kenyan and Philippine firms relative to each other.Although the large-scale textile sector in both countries arose after WorldWar II, the Philippine firms are generally older than those in Kenya andmight be expected to have achieved higher productivity levels if infantindustry arguments are correct.5 Thus bilateral comparisons are of inter-est for the light they throw on this question as well as on the efficacy ofalternative modes of international technology transfer.
An Augmented Neoclassical Model
The foregoing discussion of the sources of variation in internationaland intraindustry productivity can be represented in a number of ways. A
AN AUGUMENTED NEOCLASSICAL MODEL 129
simple augmented neoclassical model can capture the essence of the argu-ment. Assume that the production function is
(7-1) Q = Q(K, L, T, 0)
where Q is net output, K is plant and equipment, L the number ofproduction workers, and T and 0 two types of knowledge, which we willcall technical and organizational. Technology as employed here consistsof such information as the optimal number of bales to be used in opening,desirable humidity levels, standard preventive maintenance routines, andso on. It can be learned from books and periodicals or obtained by hiringindividuals in command of such knowledge. Organizational knowledgeincludes the ability to motivate, coordinate, and implement-activitiesthat determine the intensity of various productive efforts within the firmand link them. There is no simple way to separate the two sets of skills.Whatever the form in which technical knowledge is obtained, someonewill have to incorporate it into the routines of the firm; this may be theindividual embodying the knowledge or someone else. The main reasonfor noting them separately is that, in principle, technical knowledge canbe obtained from many sources, whereas organizational competence willalways be embodied in people. Inevitably there are gray areas, for exam-ple, some types of coordination such as production scheduling routinescan be obtained in written form; nevertheless, improvements in this di-mension depend on ensuring that various departments adhere to theschedule, an organizational problem requiring individual supervision.
Technology is a factor of production that partly determines the pro-ductivity of capital and labor; such knowledge can be purchased exter-nally (as journals, consultants, computer programs, or new personnelpossessing the relevant skills) or can be obtained through expenditure ofinternal resources (study of journals) or as a combination of the two(sending present staff members to study in other plants or in traininginstitutes). Whatever the combination of implicit and explicit costs, tech-nology is costly to obtain. In contrast, the standard model assumes thatknowledge is costlessly available to shift the production function or toaugment the productivity of one or another primary factor.
The first-order condition for maximizing output for a given cost is
(7-2) FK - FL = FT = LOhK hL hT ho
where Fi denotes the partial derivative of Q with respect to each factorand hi the marginal cost to the firm of employing each factor. Both Fi andhi are affected by the firm's initial endowments and a succession of deci-sions that alter these over time. The marginal productivity of new tech-nical information will be greater in those firms that have implemented
130 COMPARATIVE ANALYSIS
organizational changes that allow effective use of new knowledge. Newquality-control procedures, for example, will have greater marginal pro-ductivity if a firm's organizational structure permits senior management aswell as technical supervisors to be informed about important operatingproblems. In noncompetitive markets, bT will be affected by the firm'sknowledge of suppliers of alternative technology as well as by its bargain-ing skills.
Organizational abilities and technical knowledge can be accumulatedonly as a result of explicit firm decisions. Interfirm variations in this areamay be attributable to differences in time preference, initial managerialability that determines the values of Fi early in the firm's life history, creditrationing that results in different interest rates for each firm, and so on.The main point is that these considerations would not be relevant if theconventional production function, defined in terms of capital and laboronly, were everywhere the same and the cost of knowledge were zero.
If firms are currently maximizing output for a given cost, increasedtotal-factor productivity, defined in terms of L and K alone, can be ob-tained in the short run only by an increase in costs associated with obtain-ing additional "nonstandard" inputs. Given the conventional result thateach element in equation 7-2 equals the inverse of short-run marginalcosts, MC, the use of more T or 0 increases MC because of fallingmarginal productivity or rising marginal factor cost.'
If hT = ho = 0, the output obtainable from capital and labor will be thesame in every plant or country (if we assume cost-minimizing behavior),because all firms can costlessly achieve best-practice standards in the useof equipment and labor by employing sufficient quantities of T and 0-inthis case the standard neoclassical shift version is a useful fiction.7 Ifknowledge is not costlessly available, then differing ,quantities of T and 0will be utilized, depending on their marginal cost in various countries andfirms and differences in FT and Fo. The cost of T and 0 to a firm will, at aminimum, reflect the opportunity cost to sellers-that is, their marginalcost of transmitting knowledge (for example, the cost of time spent con-ferring with buyers). The cost may also include an economic rent whosesize will depend on the extent of competition in the specific market forknowledge and the relative bargaining skills of buyers and sellers. Firmswhose managers are unfamiliar with the technical and organizational re-quirements of production or with the technology market (including thebargaining process) thus suffer from two disadvantages: they perceive aprice that considerably exceeds the seller's reservaotion price, and theyprobably underestimate the productivity of additional units of T and 0.The net effect is likely to be that they employ less of these factors8 andobtain correspondingly lower productivity of equipment and workers.
AN AUGUMENTED NEOCLASSICAL MODEL 131
The resulting variation in the intensity of use of T and 0 may be aspronounced among firms within a country as it is between firms in dif-ferent countries. Because the quantities of T and 0 used by companiescannot be measured directly, such differences can only be inferred fromobserved interfirm variations in specific aspects of production that aremore likely to be related to one or the other factor.
The model just outlined provides one simplified view of some sourcesof interfirm productivity differences. It differs from the standard neo-classical model by implying that firms in the same and different countriesmay not operate with the same productivity defined solely in terms of Kand L and by attributing this phenomenon to variations in the amounts ofT and 0 employed. The height of the production function in terms ofprimary inputs is here viewed as a function of other inputs, rather than asbeing the same in all countries or a function of an exogenous variable,"the state of knowledge" Even with a suitably expanded list of inputs,including technology and organizational abilities, the same productionfunction may not hold in different countries if Fr and Fo differ as a resultof previous decisions of the firm that affect them.9
The preceding discussion has been based on the cost minimizationrepresented by equation 7-2 and is not consistent with some of the obser-vations of inefficiency and calculations of the profitability of redressingspecific shortcomings noted in chapter 6. The examples presented theresuggest that, in some dimensions, firms are not paying attention to fairlyegregious deficiencies and that a theory is needed to explain how specificshortcomings enter into the purview of management. In contrast, theformulation of this section implies that the defects cited in chapter 6 andthe entire set of firm-specific productivity depressants may reflect thefailure of firms to invest enough in organizational and technical abilities.It might be argued, however, that even if such acquisition had been at-tempted, a combination of bounded rationality and satisficing could limitthe relevance of the cost-minimizing formulation.
It is difficult to discriminate empirically between these alternative for-mulations of firm behavior. A weak test is suggested in the next chapter, inwhich each company's benefit-cost ratio from investments in improvingits production engineering capabilities is calculated, but the results areinconclusive. Although the potential importance of behavioral propen-sities is not captured in the cost-minimizing approach, this approachnonetheless permits some clear-cut and plausible inferences about thesource of interfirm differences in the components of production engi-neering competence. A still better understanding could be obtained byusing the bounded rationality-satisficing paradigm to extract systematic
132 COMPARATIVE ANALYSIS
insights from the same set of data. Unfortunately, the empirical implemen-tation of this approach still lies beyond the capacity of economists.1 0
Intracountry-Intraindustry Variations in Productivity
If technical and organizational skills were costlessly available, measuresof their impact would be the same for all firms; that is, firm-specific andtask-level productivity-depressing (or residual-depressing) factors pre-sented in the earlier chapters should vary relatively slightly between plantsusing roughly the same equipment. If firms differ in either their marginalacquisition cost of these factors or their ability to absorb available knowl-edge (FT and FO), however, then interfirm productivity at a disaggregatedlevel should also differ. Some of the data presented earlier permit thesequestions to be addressed. In the Philippines there are eight observationsof plants using spinning equipment of a similar vintage (1960-70) and nineobservations of weaving sheds employing looms that use essentially thesame method for injecting the weft. In Kenya, four weaving sheds usesimilar looms; however, only two plants use each of two vintages of ringframes, so that it is difficult to employ these observations in the generaldiscussion.
Spinning
Tables 7-1 and 7-2 present the relevant data for spinning and weaving,respectively. First consider Philippine spinning plants using 1960-70equipment. These plants differ considerably in their labor and spindlerequirements per unit of output as well as in their spindle-labor ratios (seethe coefficient of variation).1" These differences arise primarily not frommovement along an identical isoquant in response to variation in relativefactor prices but from inrerfirm differences in total-factor productivity, ascan be inferred from the relatively large coefficient of variation of total-factor productivity for the 1960s mills. Examination of the variance inproductivity-reducing factors gives some insight into the nature of thedifferences between plants.
Specialization, twist multiple, and machine efficiency have relativelylow coefficients of variation, whereas speed and task-level productivityvary considerably. Given that improvements in all productivity depres-sants have the same payoff in additional output and therefore in marginalrevenue, the lower variation in the twist multiple and spindle efficiencyimplies either that interfirm variation in the cost of mastering them is lessor that there is less diversity in the firms' marginal productivities, FT and
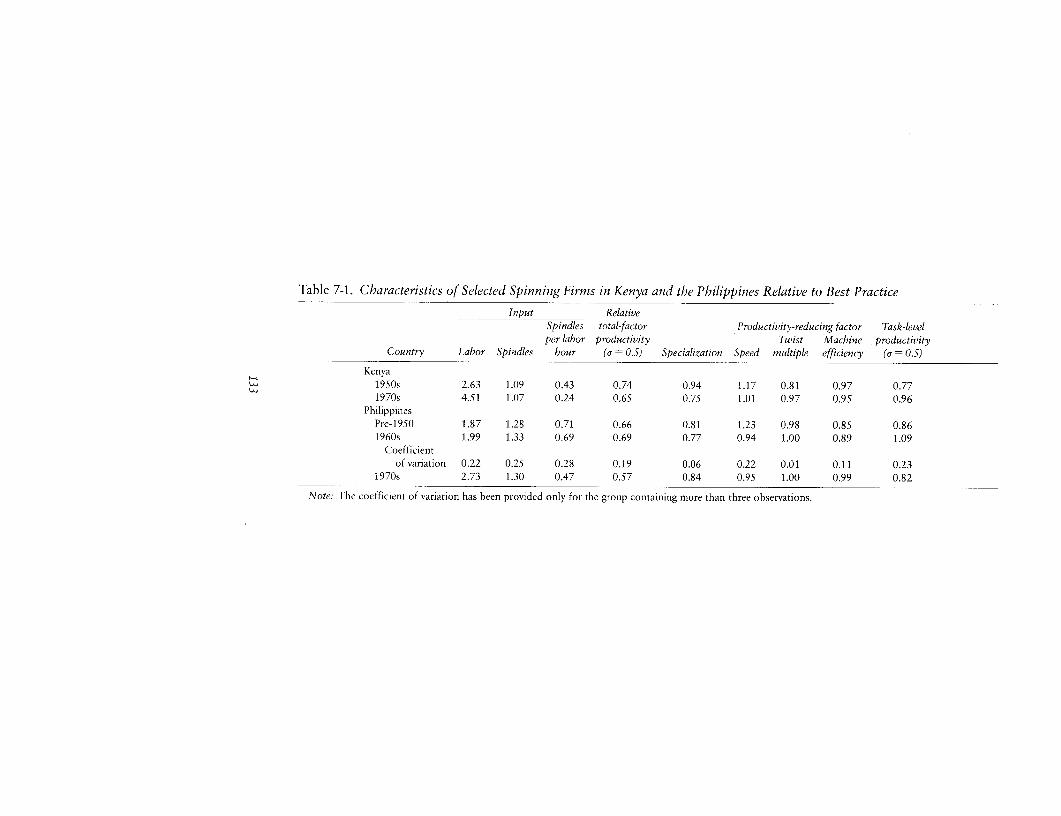
Table 7-1. Characteristics of Selected Spinning Firms in Kenya and the Philippines Relative to Best Practice
Input RelativeSpindles total-factor Productivity-reducing factor Task-levelper labor productivity Twist Machine productivity
Country Labor Spindles hour (a = 0.5) Specialization Speed multiple efficiency (a = 0.5)
Kenya1950s 2.63 1.09 0.43 0.74 0.94 1.17 0.81 0.97 0.771970s 4.51 1.07 0.24 0.65 0.75 1.01 0.97 0.95 0.96
PhilippinesPre-1950 1.87 1.28 0.71 0.66 0.81 1.23 0.98 0.85 0.861960s 1.99 1.33 0.69 0.69 0.77 0.94 1.00 0.89 1.09
Coefficientof variation 0.22 0.25 0.28 0.19 0.06 0.22 0.01 0.11 0.23
1970s 2.73 1.30 0.47 0.57 0.84 0.95 1.00 0.99 0.82
Note: I he coefficient of variation has heen provided only for the group containing more than three observations.
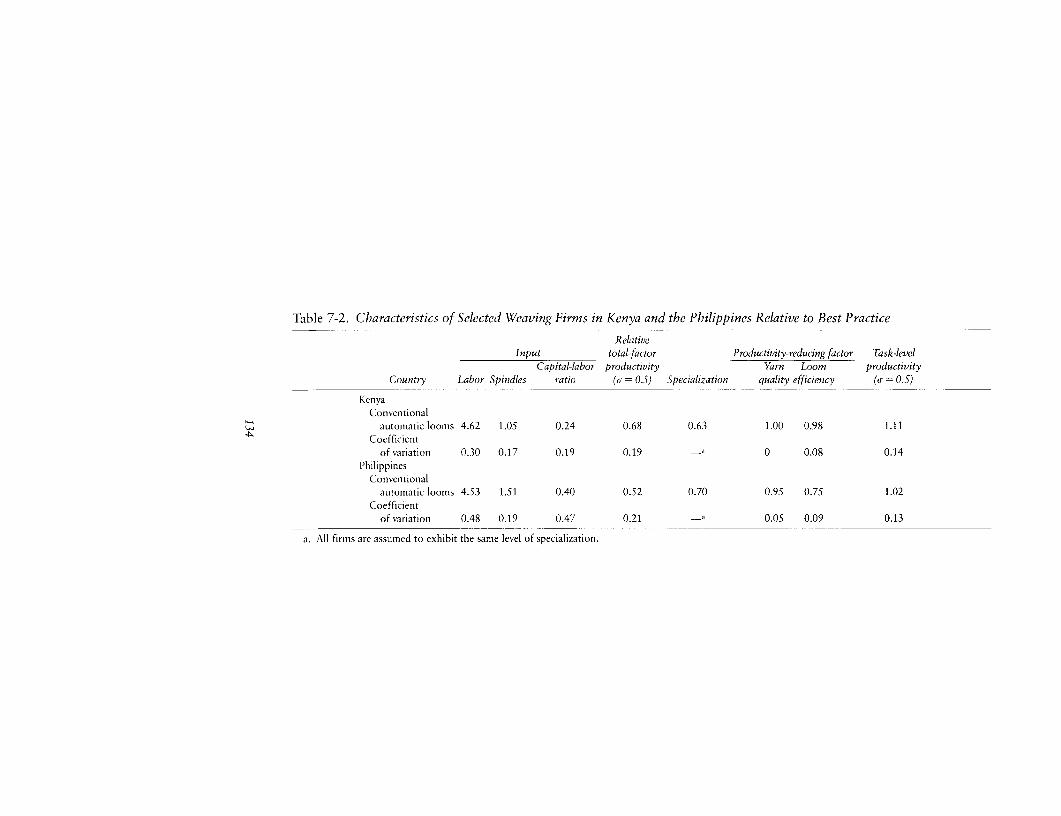
Table 7-2. Characteristics of Selected Weaving Firms in Kenya and the Philippines Relative to Best Practice
RelativeInput total-factor Productivity-reducing factor Task-level
Capital-labor productivity Yarn Loom productivityCountry Labor Spindles ratio ( r= 0.5) Specialization quality efficiency (ar= 0.5)
KenyaConventionial
w automatic looms 4.62 1.05 0.24 0.68 0.63 1.00 0.98 1.11Coefficient
of variation 0.30 0.17 0.19 0.19 0 0.08 0.14Philippines
Conventionalautomatic looms 4.53 1.51 0.40 0.52 0.70 0.95 0.75 1.02
Coefficientof variation 0.48 0.19 0.47 0.21 0.05 0.09 0.13
a. All firms are assumed to exhihit the same level of specialization.
INTRACOUNTRY-INTRAINI)USTRY VARIATIONS 135
F,. Variation in spindle efficiency (as discussed in chapter 2) largely re-flects differences in planned maintenance and "housekeeping" activitiessuch as dust removal. Although the coefficient of variation (0.11) indicatesthat all firms do not command identical abilities, its relatively low valuesuggests that the largely technical skills required to achieve a given level ofefficiency are more evenly diffused than the technical and organizationalskills necessary to achieve best-practice speed and task-level productivity,the coefficient of variation of these being 0.22 and 0.23.12 The formerrequires competence in quality control early in the spinning process.Where quality control is poor, higher speeds, which even under the bestconditions produce greater breakage rates, will have an even greater im-pact. Significant levels of both technical and organizational abilities (suchas ensuring that quality-control results are actually used) are needed.
It will be recalled from chapters 2 and 6 that defective skills in the earlystages of spinning (opening, carding, and drawing) can be partly rectifiedin spinning proper by imparting a higher twist to strengthen the yarn andby running spindles at a lower speed in order to reduce the stress placedupon the roving. The twist multiple and speed must be considered jointly.Although there is very little diversity in the twist multiple about its highaverage level, there are considerable differences in speed relative to bestpractice. The lack of mastery over early operations in spinning manifestsitself in some firms in reduced speed and the effort to limit breakagerates, although other factors such as poor maintenance also contribute tothis outcome.
Because firm-level deficiencies in opening, carding, drawing, and rovingare proximately technical and much of the requisite knowledge is wellunderstood and standardized,13 interfirm variance in marginal factor costis unlikely to explain the significant observed speed differentials. Indeed,records of earlier technical aid missions to the Philippines (UNIDO 1972b)document in detail the free information readily available to firms andtheir unwillingness or inability to use it despite ready access to it. Al-though it is easy to ascribe this failure to the absence of incentives becauseof the high levels of protection for the sector, the variance in speedrelative to best practice indicates that some firms did in fact use suchknowledge. Moreover, even with protection, the marginal firms had lowrates of return and would have benefited from improved productivityunless the managers had strong preferences for an "easy life" A moreplausible explanation is that the firms had done little to accumulate thenecessary organizational capacity to apply the readily available informa-tion in their plants; that is, FT was relatively low because of the low levelof 0, the complementary factor.
136 COMPARATIVE ANALYSIS
The above suggests that without a mechanism to ensure proper organi-zational responsibility for the necessary technical activities, knowledgewill not be adopted or will be little utilized, even when it is available atlow cost. It may, for example, make a critical difference whether a firm'stechnical department perceives management as taking a serious and sus-tained interest in quality control and responding to any sustained defi-ciencies. Seemingly mundane details, such as whether the laboratoryreports to upper management or to the spinning and weaving director,may significantly affect plantwide attitudes toward obtaining high pro-ductivity as well as the approach of key subsections such as spinning andweaving. In sum, a technical production characteristic such as speed rela-tive to best practice may vary considerably and can depend critically onthe capacity of the organization to absorb and act on relevant technicalknowledge, even when the know-how necessary to attain best-practiceperformance is available at low and uniform cost.
There is considerable interfirm variation in task-level productivity (as-suming some systematic component within this residual) relative to bestpractice, and the activities needed to strengthen this productivity arelikely to have a largely organizational basis. Recruiting, training, modes ofsupervision, and the establishment of productivity norms and connectionof them to wage incentive systems all depend on high-quality organiza-tional abilities and interpersonal interactions (see chapter 6).
Weaving
Relevant data on weaving are available for ten Philippine weaving shedsand four Kenyan ones, all of which use quite similar looms. In the Philip-pines (table 7-2), interfirm variation in loom efficiency is low, as is its levelrelative to best practice. The low variation is not surprising; informationon how to obtain greater loom efficiency is readily available in the liter-ature of equipment manufacturers, trade journals, and special publica-tions of textile research institutes. It is one of the easier skills mastered byall textile engineers. Differences in the marginal cost of this informationcannot be large. Most firms are able to master such simple organizationalskills as ensuring that machines are cleaned, lubricated, and tuned wellenough for looms to function without an unusual number of stoppages.14
Most firms thus cluster around a low average level, the major exceptionsbeing the few firms that successfully maintain an adequate supply of spareparts.
In contrast, high average task-level productivity is accompanied by sub-stantial interfirm variance-some firms devoted considerable resources toaccumulating skills in recruiting, screening, and training, whereas others
INTRACOUNTRY-INTRAINDUSTRY VARIATIONS 137
have not. These differences are presumably reflected in the current organ-izational capacities of the firms. Although the details of particular defi-ciencies and their variation are interesting (see chapter 6), the moststriking feature of the Philippine weaving data is the large interfirm vari-ance in task-level productivity. The major variation among firms in theKenyan weaving sector (table 7-2) is also task-level productivity.
Comparisons of Kenya and the Philippines
The relevant data for spinning firms in each country using similar vintagesof equipment are shown in table 7-1. As noted in chapter 5, Philippinefirms are more productive relative to best practice when they employolder (pre-1950 and 1960s) equipment. The same pattern emerges inKenya, but for different reasons. In the Philippines, the 1970s plants havelower RTFP than do those of older vintage because of their lower thanbest-practice speeds or their lower task-level productivity. The lower pro-ductivity of the newer Kenyan plants arises primarily from their inabilityto realize long production runs rather than from any technical or organi-zational deficiency. The older Kenyan spinning plants suffer less fromspecialization losses, probably because of their better ties to wholesalersand retailers. Moreover, the older plants benefited historically fromspeeds exceeding best practice, which suggests a good mastery of theearlier stages of spinning. The failure of the newer plants to realize speedsabove best practice lies in their very closeness to the frontier and the factthat greater speeds are not easily (physically) achievable.
Thus the poorer performance in both countries of newer spinningequipment is not related to characteristics of technology embodied inmachines. In the Philippines, the potential gains from newer vintages arereduced by the firms' limited capacity for quality control in the earlystages of production (rather than difficulty in operating new spindles) andby organizational deficiencies that make it hard to get high labor perfor-mance. In Kenya, the pattern results mainly from shorter production runsas newer firms attempt to enter the market.
Consider now the relative performance of weaving sheds in the twocountries (table 7-2). In Kenya, weaving sheds using automatic loomsoperate, on the average, at close to best-practice standards in all dimen-sions except specialization, whereas the Philippine sheds exhibit poorloom efficiency as well as low specialization. At the plausible value for theelasticity of substitution, 0.5, Kenyan plants exhibit considerably greaterRTFP despite their more recent origins, largely because of the difference inloom efficiency.
138 COMPARATIVE ANALYSIS
The fact that Kenyan firms using the same spinning or weaving equip-ment as those in the Philippines display higher total-factor productivity inboth spinning and weaving provides some clues about the nature of tech-nology transfer and the requisites for successful industrialization. Becausethe Kenyan firms are newer, they might have been predicted to exhibitlower productivity, given conventional arguments about learning bydoing, although in neither country have there been competitive pressuresto improve productivity. The surprising success in Kenya is almost cer-tainly due to the presence of international managers of high quality whohave been able to implant the procedures followed by some of the betterfirms of India, Japan, and Western Europe. These abilities, embodied infive to twenty expatriates per firm, have been critical to Kenyan success, asmanifested in the high level and limited variation in most determinants oftotal-factor productivity. In effect, for most of the Kenyan firms themarginal cost of acquiring additional technical or organizational skills wasclose to zero once these expatriates were present, and the marginal pro-ductivity of such knowledge was high. Where the staff did not possesstechnical information it knew where to identify relevant sources quicklyand cheaply and how to incorporate such information productivelywithin the plant-hence the closeness to best practice and limited inter-plant variation in most dimensions.
In contrast, the textile sector in the Philippines has not benefited froma similar infusion of international expertise. Although a few firms haveemployed two or three expatriate managers (on fixed-term contracts)from other countries on an ad hoc basis, most plants have relied ondomestic managers whose training has rarely included sustained exposureto international best practice. Should an unusual production problemarise, it is more easily rectified internally by the Kenyan firms. Whereexternal help is required, the search process is almost certainly quickerand less expensive than in Philippine firms.'s Whether the issue involvesunusual spare parts or evaluation of the utility of a new process, theKenyan firms also have a better idea of the appropriate price, whereas thePhilippine firms may be discouraged by an initially high quotation that ismerely a bargaining price.
Although the sustainability of industrialization based on foreign tech-nical expertise may be questioned, the Kenyan experience provides a basisfor optimism for countries desiring rapid industrialization; the road tointernationally competitive productivity levels is not necessarily slow.16 Asindicated in chapter 4, the evidence suggests that a change of interna-tional trade policies could well make the Kenyan industry capable ofsustained exporting. The same is true of many individual Philippine firms:the industry has existed for a much longer period in that country, and if
INTERNATIONAL COMPARISONS 139
learning by doing is a plausible model, Philippine textile firms shouldexhibit considerably greater total-factor productivity than technicallycomparable Kenyan firms.
International Comparisons
Spinning
For a reliable indication of the productivity of the Kenyan and Philip-pine textile plants relative to those in other countries, it is necessary toobtain data similar to those used in the preceding comparisons. The dataon individual plants' operating characteristics must show sufficient engi-neering detail to instill some confidence that comparisons are not beingmade between mills with very disparate equipment. Although sectorwideaggregates are often used in international comparisons, the necessaryassumptions about the deflation of capital stock and value added andabout the translation of local currencies into a common one entail uncer-tainty about the robustness and interpretation of such results (Kravis1976). Fortunately, data with the requisite technical information werecollected for a number of countries in the late 1960s. They are presentedin the U.K. study (Textile Council 1969) that I have used in previouschapters to obtain estimates of best-practice coefficients and thus im-plicitly allow the comparison of Kenyan and Philippine productivity in1980 with that achieved elsewhere during the late 1960s. It is likely thatthe best-practice plants have achieved still higher productivity levels sincethe 1960s, in part because of improved technology embodied in newequipment (see chapter 3) and in part because of disembodied technicalprogress. Thus, although the results are helpful for analyzing the evolu-tion of productivity, they cannot be used to infer current comparativeadvantage. 17
Table 7-3 presents indexes of unit labor and capital requirements forupper-quartile firms"8 in each country and an index of total-factor pro-ductivity; a Cobb-Douglas function with the same output elasticities usedin chapters 4 and 5 is assumed, and a CES function with 6r= 0.5. Forreasons given earlier, I believe that the latter value is a more realisticreflection of the possibilities of substitution after a basically similar tech-nology has been installed in each of the firms represented in the sample.The capital-output ratios shown reveal a relatively small variation aroundthe mean of 0.94, the coefficient of variation being 0.15; they do notincrease with a rise in the capital-labor ratio. Simultaneously, there is ahigh positive correlation, 0.91, between total-factor productivity and the
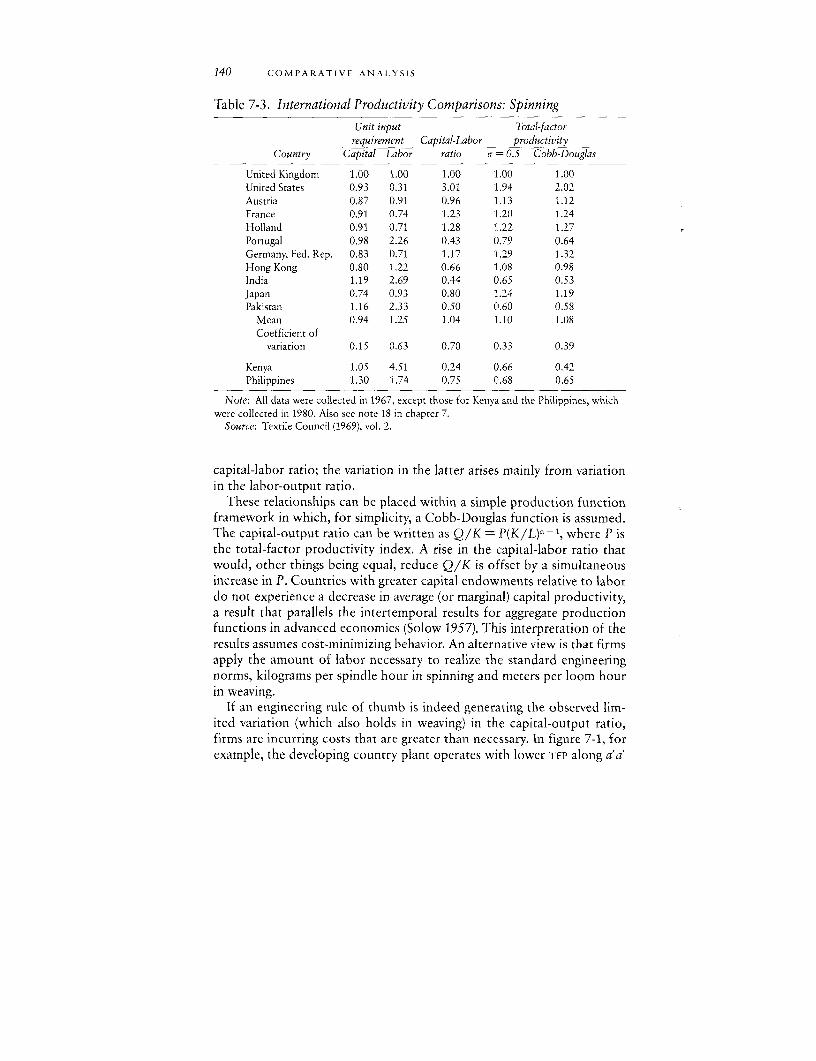
140 COMPARATIVE ANALYSIS
Table 7-3. International Productivity Comparisons: Spinning
Unit input Total-factorrequirement Capital-Labor productivity
Country Capital Labor ratio -= 0.5 Cobb-Douglas
United Kingdom 1.00 1.00 1.00 1.00 1.00United States 0.93 0.31 3.01 1.94 2.02Austria 0.87 0.91 0.96 1.13 1.12France 0.91 0.74 1.23 1.20 1.24Holland 0.91 0.71 1.28 1.22 1.27Portugal 0.98 2.26 0.43 0.79 0.64Germany, Fed. Rep. 0.83 0.71 1.17 1.29 1.32Hong Kong 0.80 1.22 0.66 1.08 0.98India 1.19 2.69 0.44 0.65 0.53Japan 0.74 0.93 0.80 1.24 1.19Pakistan 1.16 2.33 0.50 0.60 0.58
Mean 0.94 1.25 1.04 1.10 1.08Coefficient of
variation 0.15 0.63 0.70 0.33 0.39
Kenya 1.05 4.51 0.24 C.66 0.42Philippines 1.30 1.74 0.75 0.68 0.65
Note: All data were collected in 1967, except those for Kenya and the Philippines, whichwere collected in 1980. Also see note 18 in chapter 7.
Source: Textile Council (1969), vol. 2.
capital-labor ratio; the variation in the latter arises mainly from variationin the labor-output ratio.
These relationships can be placed within a simple production functionframework in which, for simplicity, a Cobb-Douglas function is assumed.The capital-output ratio can be written as Q/K = P(K/L) - 1, where P isthe total-factor productivity index. A rise in the capital-labor ratio thatwould, other things being equal, reduce Q/K is offset by a simultaneousincrease in P. Countries with greater capital endowments relative to labordo not experience a decrease in average (or marginal) capital productivity,a result that parallels the intertemporal results for aggregate productionfunctions in advanced economies (Solow 1957). This interpretation of theresults assumes cost-minimizing behavior. An alternative view is that firmsapply the amount of labor necessary to realize the standard engineeringnorms, kilograms per spindle hour in spinning and meters per loom hourin weaving.
If an engineering rule of thumb is indeed generating the observed lim-ited variation (which also holds in weaving) in the capital-output ratio,firms are incurring costs that are greater than necessary. In figure 7-1, forexample, the developing country plant operates with lower TFP along a'a'
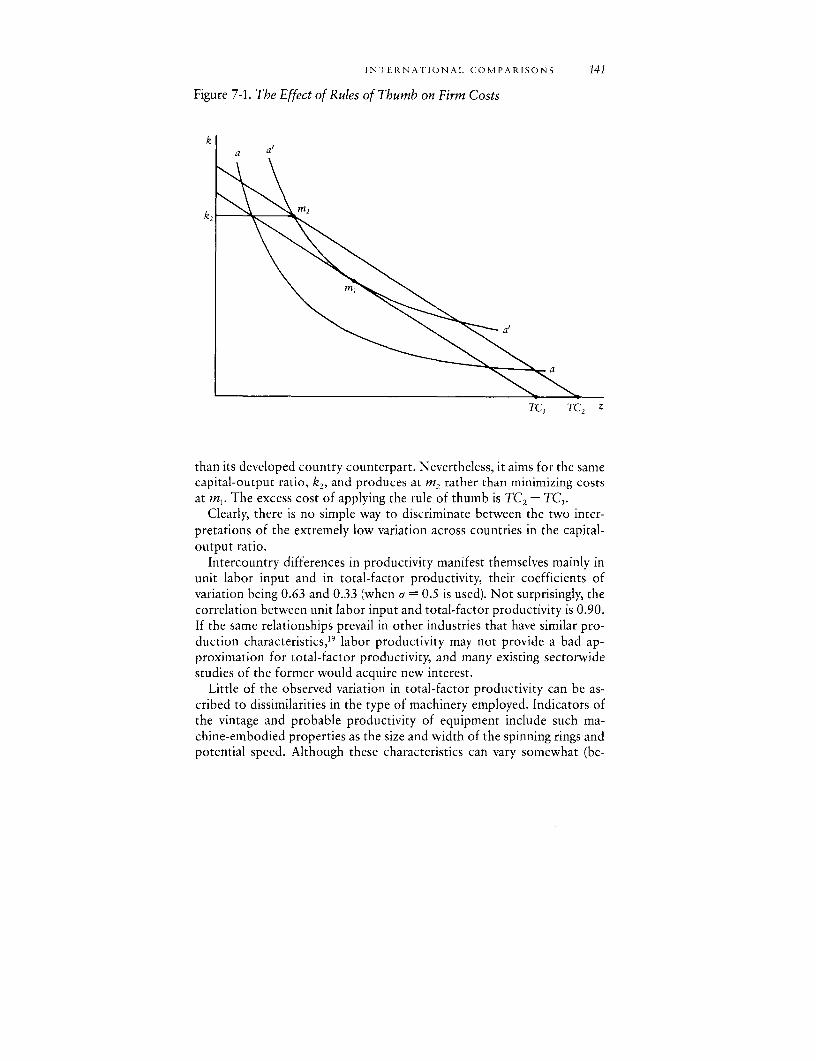
INTERNATIONAL COMPARISONS 141
Figure 7-1. The Effect of Rules of Thumb on Firm Costs
ka a'
k, M2
at
TC, TC2 Z
than its developed country counterpart. Nevertheless, it aims for the samecapital-output ratio, k2 , and produces at m, rather than minimizing costsat m,. The excess cost of applying the rule of thumb is TC2 - TC,.
Clearly, there is no simple way to discriminate between the two inter-pretations of the extremely low variation across countries in the capital-output ratio.
Intercountry differences in productivity manifest themselves mainly inunit labor input and in total-factor productivity, their coefficients ofvariation being 0.63 and 0.33 (when a = 0.5 is used). Not surprisingly, thecorrelation between unit labor input and total-factor productivity is 0.90.If the same relationships prevail in other industries that have similar pro-duction characteristics,"9 labor productivity may not provide a bad ap-proximation for total-factor productivity, and many existing sectorwidestudies of the former would acquire new interest.
Little of the observed variation in total-factor productivity can be as-cribed to dissimilarities in the type of machinery employed. Indicators ofthe vintage and probable productivity of equipment include such ma-chine-embodied properties as the size and width of the spinning rings andpotential speed. Although these characteristics can vary somewhat (be-
142 COMPARATIVE ANALYSIS
tween the Western European countries and the United States, on the onehand, and the Asian countries plus Portugal, on the other), the differencesare surprisingly small and could not account for even 10 percent of mea-sured differences in total-factor productivity. The homogeneity of equip-ment is rather surprising, given that the data were collected from firmsfacing widely differing relative factor prices that militate in favor of thepurchase of disparate machinery. The international diffusion of engineer-ing knowledge seems to engender uniformity in behavior among the bet-ter (upper-quartile) firms, which is manifested not only in the type ofequipment purchased but also in the remarkably small variation in theircapital-output ratios.
The dominance of engineering over economic desiderata is not com-plete, however. Firms in different countries do use different quantities oflabor with the same equipment, as is shown by the substantial variation incapital-labor ratios (presumably in response to differences in relative fac-tor prices). A cross-country regression of the logarithm of the capital-labor ratio on the logarithm of the wage-rental ratio yields a regressioncoefficient of 0.42, not significantly different from the value of 0.5 for theshort-run elasticity of substitution suggested by engineering considera-tions (chapter 3 appendix). The regression coefficient is significantly dif-ferent from zero at the 1 percent level.
Table 7-4 shows three characteristics of the spinning mills: the speed atwhich the spindles are operated, R; twists per inch, T; and spindle effi-ciency, e. It will be recalled from chapter 2 that the expression (R/T)e isequal to the output per spindle and that each comrponent of this expres-sion reflects an endogenous decision of the firm. One way of raisingoutput per spindle is to increase speed and simultaneously raise the labor-spindle ratio in order to forestall a decline in the efficiency rate; thispractice is most likely to make sense where a low wage rate prevails. Towhat extent have the developing countries included in table 7-4 taken thisstep and moved along an efficient, high-productivity isoquant?
The last column of the table presents the value of (R/T)e indexed onthe value for the United Kingdom. It can be seen that firms in Hong Kongand Japan operate their spindles at very high speeds that are not offset bya high T or a low e; they employ large amounts of labor per spindle tomaintain spindle efficiency.2 0 The ability to substitute labor for capital inresponse to lower wages and to maintain high TFP distinguishes these twocountries from other low-wage producers (India, Kenya, Pakistan, thePhilippines, and Portugal) in which a lower capital-labor ratio is accom-panied by low total-factor productivity (table 7-3). The inability of thesecond group of countries to move along an efficient isoquant reflects theeffect of the factors considered in the decomposition of total productiv-
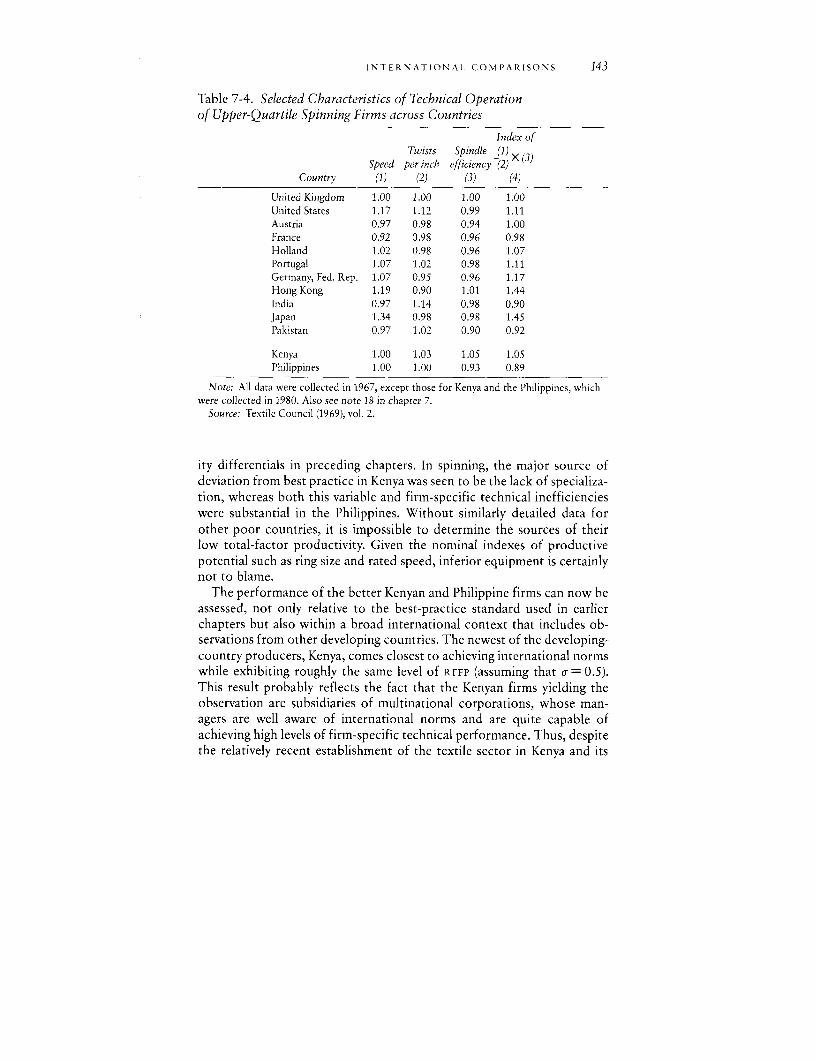
INTERNATIONAL COMI'ARISONS 143
Table 7-4. Selected Characteristics of Technical Operationof Upper-Quartile Spinning Firms across Countries
Index ofTwists Spindle (1)
Speed per inch efficiency (2)X(3)Country (1) (2) (3) (4)
United Kingdom 1.00 1.00 1.00 1.00United States 1.17 1.12 0.99 1.11Austria 0.97 0.98 0.94 1.00France 0.92 0.98 0.96 0.98Holland 1.02 0.98 0.96 1.07Portugal 1.07 1.02 0.98 1.11Germany, Fed. Rep. 1.07 0.95 0.96 1.17Hong Kong 1.19 0.90 1.01 1.44India 0.97 1.14 0.98 0.90Japan 1.34 0.98 0.98 1.45Pakistan 0.97 1.02 0.90 0.92
Kenya 1.00 1.03 1.05 1.05Philippines 1.00 1.00 0.93 0.89
Note: All data were collected in 1967, except those for Kenya and the Philippines, whichwere collected in 1980. Also see note 18 in chapter 7.
Source: Textile Council (1969), vol. 2.
ity differentials in preceding chapters. In spinning, the major source ofdeviation from best practice in Kenya was seen to be the lack of specializa-tion, whereas both this variable and firm-specific technical inefficiencieswere substantial in the Philippines. Without similarly detailed data forother poor countries, it is impossible to determine the sources of theirlow total-factor productivity. Given the nominal indexes of productivepotential such as ring size and rated speed, inferior equipment is certainlynot to blame.
The performance of the better Kenyan and Philippine firms can now beassessed, not only relative to the best-practice standard used in earlierchapters but also within a broad international context that includes ob-servations from other developing countries. The newest of the developing-country producers, Kenya, comes closest to achieving international normswhile exhibiting roughly the same level of RTFP (assuming that or = 0.5).This result probably reflects the fact that the Kenyan firms yielding theobservation are subsidiaries of multinational corporations, whose man-agers are well aware of international norms and are quite capable ofachieving high levels of firm-specific technical performance. Thus, despitethe relatively recent establishment of the textile sector in Kenya and its
144 COMPARATIVE ANALYSIS
workers' lack of previous experience in either home or small-scale factoryproduction, its better spinning firms have equaled the productivity ofthose in India and Pakistan-countries with considerably longer historiesof factory textile production and general industrial experience.21 Thisresult will be seen below to hold for weaving as well; it is probablyattributable not only to the fact of multinational corporation manage-ment noted earlier but also to the nature of textile manufacturing, whichmakes it unusually suitable for a successful transplant of technology. Inparticular, textile production requires relatively little interaction (com-pared with other sectors) with other domestic industrial suppliers.22 Al-though spare parts are necessary-as witness the difficulties in somePhilippine firms-they can be obtained abroad, and even when largeinventories are held, they do not constitute a major cost.
Weaving
Table 7-5 shows the relevant data for weaving. Both labor and loomcoefficients per unit of output have been adjusted for differences in loomspeed, the major machine-embodied characteristic that varies amonglooms.23 Because all the looms used by the upper-quartile firms are con-ventional automatic ones, and if it is assumed that upper-quartile firmsmaintain their equipment adequately and stock sufficient inventories ofspare parts, most of the remaining variation in productivity is attributableto disembodied productivity-reducing factors. Again, the very small vari-ance in loom-output ratios, k, is striking, the coefficient of variation being0.03 around the mean of 1.05. In contrast, the mean unit labor require-ment (z) in the sample equals 2.10, and its coefficient of variation is 0.58.The range of RTFP is thus strongly affected by that of z, and its coefficientof variation is 0.29. The correlation coefficient between z and RTFP is .91,which confirms the conclusion reached in the case of spinning that theuse of labor coefficients may be a cheap and accurate substitute for moreelaborate calculations of total-factor productivity.
The figures for total-factor productivity in Kenya and the Philippines in1980 put both countries close to or above the position of Hong Kong in1968. Although the latter has undoubtedly improved in the succeedingperiod, the fact that its earlier level of productivity has been matched is ofconsiderable interest. Given the rapid progress of Hong Kong's produc-tion and exports from its 1967 base, it can be inferred that Kenya and thePhilippines have at least moved toward the starting position for the inter-national race. Their task is to transform this potential into current inter-national competitiveness through increased technological andorganizational competence and changes in the economic policy environ-
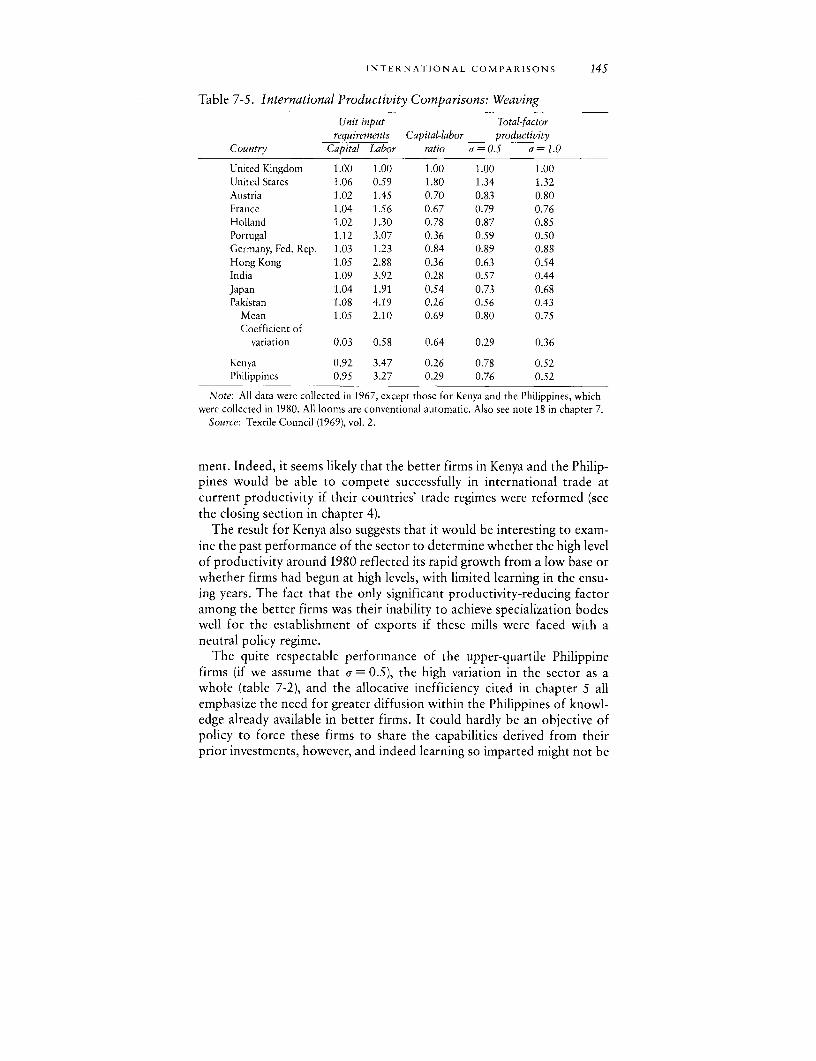
INTERNATIONAL COMPARISONS 145
Table 7-5. International Productivity Comparisons: Weaving
Unit input Total-factorrequirements Capital-labor productivity
Country Capital Labor ratio a = 0.5 a = 1.0
United Kingdom 1.00 1.00 1.00 1.00 1.00United States 1.06 0.59 1.80 1.34 1.32Austria 1.02 1.45 0.70 0.83 0.80France 1.04 1.56 0.67 0.79 0.76Holland 1.02 1.30 0.78 0.87 0.85Portugal 1.12 3.07 0.36 0.59 0.50Germany, Fed. Rep. 1.03 1.23 0.84 0.89 0.88Hong Kong 1.05 2.88 0.36 0.63 0.54India 1.09 3.92 0.28 0.57 0.44Japan 1.04 1.91 0.54 0.73 0.68Pakistan 1.08 4.19 0.26 0.56 0.43
Mean 1.05 2.10 0.69 0.80 0.75Coefficient of
variation 0.03 0.58 0.64 0.29 0.36
Kenya 0.92 3.47 0.26 0.78 0.52Philippines 0.95 3.27 0.29 0.76 0.52
Note: All data were collected in 1967, except those for Kenya and the Philippines, whichwere collected in 1980. All looms are conventional automatic. Also see note 18 in chapter 7.
Source: Textile Council (1969), vol. 2.
ment. Indeed, it seems likely that the better firms in Kenya and the Philip-pines would be able to compete successfully in international trade atcurrent productivity if their countries' trade regimes were reformed (seethe closing section in chapter 4).
The result for Kenya also suggests that it would be interesting to exam-ine the past performance of the sector to determine whether the high levelof productivity around 1980 reflected its rapid growth from a low base orwhether firms had begun at high levels, with limited learning in the ensu-ing years. The fact that the only significant productivity-reducing factoramong the better firms was their inability to achieve specialization bodeswell for the establishment of exports if these mills were faced with aneutral policy regime.
The quite respectable performance of the upper-quartile Philippinefirms (if we assume that a = 0.5), the high variation in the sector as awhole (table 7-2), and the allocative inefficiency cited in chapter 5 allemphasize the need for greater diffusion within the Philippines of knowl-edge already available in better firms. It could hardly be an objective ofpolicy to force these firms to share the capabilities derived from theirprior investments, however, and indeed learning so imparted might not be
146 COMPARATIVE ANALYSIS
absorbed. Specific policies designed to increase absorptive capacity areneeded, along with incentive structures to generate a business environ-ment in which firms ignore such know-how at their peril.
The Importance of Proprietary Information
There is currently much concern about the allegedly excessive cost todeveloping countries of acquiring proprietary technical information. (Fordiscussion of the issues and an extensive biblioglraphy, see Cortes andBocock 1984.) Such costs, it is claimed, retard the industrial developmentprocess in developing countries. In textiles, however, almost all the infor-mation relevant for achieving high productivity is not proprietary. Mostoperational deficiencies that can be remedied by acquiring technical in-formation fall under the rubric of production engineering. For a relativelylow fee, a large number of individuals, consulting firms, experts employedby international agencies, and other purveyors of information are readilyobtainable. Nevertheless, developing country firms at the upper quartiletypically exhibit lower total-factor productivity th,an do firms from de-veloped countries; it is not known how much this feature reflects firm-specific factors affected by technology as opposed to factors beyond thecontrol of firms.
Another result suggesting the limited importance of proprietary tech-nical knowledge is the fact that RTFP varies more widely within the Philip-pines than it does among the upper-quartile firms of the developedcountries (tables 7-3 and 7-5). Given the low intra--Philippine variance infirm-specific technical abilities and the large variation in organization-related productivity, still greater access to production engineering knowl-edge is of less importance than an augmentation of the organizationalabilities of weaker firms. Considerable gains in productivity could beobtained in the Philippines by successful transmission to weaker firms ofthe organizational competence of stronger firms now operating in thecountry. Transfers of this kind are far from easy, however, and cannot berealized by the provision of organization charts and manuals. Indeed, thewhole issue of the mechanisms and requirements for diffusing organiza-tional skills is not understood with any certainty.
Summary
* In a mature industrial activity in which most technical advances resultfrom incremental improvements in a basically unchanged technology (this
SUMMARY 147
restriction limits the discussion to ring spinning and conventional weav-ing), and in which most production engineering knowledge is widely avail-able at very low marginal cost, substantial shortfalls from developedcountry total-factor productivity may still be experienced by developingcountry firms. Analysis of the sources of this deficiency indicates thatboth the economic environment within which firms operate (specializa-tion effects) and a lack of organizational skills (for example, the ability toensure adequate inventories of spare parts) are important phenomena.
* Organizational ability is not only lower in developing countries butalso unevenly diffused. Even in those activities in which average perfor-mance is good (for example, task-level productivity in both spinning andweaving in the Philippines), substantial interfirm differentials are revealedby the high coefficient of variation in these activities.
* The identification of organization as the critical element is supportedby the high average levels of Kenyan firms in most of the disaggregatedmeasures of productivity and their relatively small variance despite therecent establishment and growth of the sector. Except for the effect ofspecialization, which largely reflects national economic policy, interna-tional management teams have been successful in achieving high levels ofrelative total-factor productivity.
* The preceding observations imply that neither increased diffusion ofnew equipment nor lower charges for narrowly defined technology trans-fer are likely to be sufficient for successful industrialization, even in anindustry in which most technological problems have a traditional andfairly simple mechanical and chemical basis. And in newer manufacturingsectors based on electronics and more advanced chemical and biologicalknowledge, the problem is compounded. Inadequate command over tech-nology that is not embodied in machines does not bode well for theestablishment of plants in these newer industries, because the technicalproblems inherent in nontraditional and rapidly changing know-how areadded to organizational deficiencies.
Much of the preceding is consistent with a large body of work, recentlysummarized by Nelson (1981), that emphasizes the critical role of organi-zational behavior in the determination of productivity. As Nelson notes,within the broad framework of organizational analyses there are twoviews, classical and "new." The former, Taylorism (Taylor 1911), empha-sizes the scientific management of physical production activity and thecorrect structuring of particular functions (centralized versus de-centralized maintenance) as the major activities of management. In thisview firms can identify the specific technical operations that need to beimproved and can choose from well-defined alternatives for achievinghigher productivity. In contrast, more recently developed management
148 COMPARATIVE ANALYSIS
theory suggests that a firm is best viewed as a social system in which manycritical dimensions of performance, such as worker effort, are not easilycontrolled by management. Rather, the firm's social system-a complexset of interactions among individuals, departments, and divisions-setswork norms, enforces them, and may resist management pressures tochange.
Both of these perceptions contribute to an understanding of the pre-ceding chapters. The relatively good performance documented earlier infirm-specific technical characteristics indicates that the easier manage-ment tasks, those identified under the older view, are often successfullyimplemented in many developing country firms; their low coefficient ofvariation indicates that most firms possess these abilities. But functionsrequiring substantial organizational ability are less uniformly present.Firms differ considerably in their ability to institute quality-control pro-cedures and employ them fruitfully, to establish external suppliers ofspare parts, and to ensure that adequate inventories from foreign suppliersare maintained. Unlike the management tasks that Taylor emphasized,these activities are intrinsically difficult to implement and are not likely tobe evenly diffused unless firms have made conscious efforts to accumulatethe relevant abilities.
Notes
1. Some studies, for example, Pratten (1976), present comparisons between single firms indifferent countries. Kravis (1976) offers a thorough survey of international comparisons oflabor productivity through the mid-1970s.
2. Productivity differentials from this source would disappear if correct equipment priceswere utilized.
3. As shown in chapter 3, the prevailing conception of textiles as a technologically stagnantand labor-intensive industry is not apt.
4. There is little personal contact among the employees of manufacturers in developingcountries, in contrast with the considerable interaction in developed countries. Thus one ofthe potential benefits of industrialization programs, the reaping of Marshallian external econo-mies, is largely absent. Such interaction is undoubtedly of great importance in transmittingknowledge (Arrow 1969); its absence is partly due to the typically small number and lowregional density of firms in developing countries. With few manufacturers in a limited domes-tic market, firms view the market as having an oligopolistic rather than a competitive ormonopolistically competitive structure. Under such conditions, to divulge any technical "se-crets" may have more serious consequences than in a more competitive structure. Theoligopolistic structure may also imply that firms cannot expect, in any statistical sense, to learnas much as they reveal. Similar arguments have long been used to explain the reluctance to trainworkers who may be lost to competitors. Leff (1978) has noted the pervasive importance offamily-owned businesses in which key positions are held by family members. It is easy to spinout plausible scenarios about why such structures may generate less interchange of informa-tion than a more impersonal structure.
NOTES 149
S. See Stifel (1963) for an analysis of the development of the Philippine textile sector throughthe early 1960s.
6. Leibenstein (1976, 1978) noting interfirm differences in (labor) productivity, postulatesthat x-inefficiency (a deviation from best practice) is attributable to deficient motivation orsupervision, difficulty in contract enforcement, and so on. Stigler (1976), criticizing the con-cept of x-inefficiency, argues that firms are currently minimizing costs, having equated mar-ginal revenue and marginal cost in each activity, although such minimization may yield lowobserved productivity in conventionally measured factors. In the terms used here, he is arguingthat equation 7-2 is currently satisfied and that any improvement in current total-factorproductivity would entail increased unit costs.
7. As noted earlier, Saxonhouse (1976) has documented the information-diffusion mecha-nism of the early Japanese cotton-spinning industry. The industry's monthly publication in-cluded detailed cost data for each plant, which, surprisingly, was identified. More thoroughevaluations and criticisms were occasionally published. In addition, one major British spindlemanufacturer accounted for a very high percentage of installed spindles, and its local represen-tatives acted as important disseminators of technical knowledge. It is also shown that Japaneseindustrialists had considerable information about foreign practices from representatives ofJapanese trading companies, overseas missions, and consular staffs. One consequence is thateconometric testing (Saxonhouse 1974) cannot reject the hypothesis that all firms operated onthe same production function, although it is not known whether this differed from interna-tional best practice. Saxonhouse's work thus supports the hypothesis that information acquisi-tion costs may be an important determinant of the diffusion of the knowledge of best practice.
8. Unless FT and F, are greater where h, and ho are higher. Such a positive correlation seemsunlikely. Firms lacking managers with the relevant skills should find it profitable to hire betterones, whereas managers should in turn be able to obtain higher wages in less well-endowedfirms. These considerations partly explain the willingness of some developed country man-agers to locate in Kenya as well as some recent contracts signed by Philippine firms withnationals of developing countries that are currently more advanced in textile productionmethods. If factor markets were perfect, competition for able managers should yield rents tothem and should equalize average cost across firms. The fact that such equalization does notoccur suggests considerable imperfection in the market for such skills.
9. Thus if the underlying production function were of a Cobb-Douglas kind, the exponentsof T and 0 would differ among firms at a given point and reflect prior efforts. In this case themarginal productivities of K and L would be affected.
10. Simulation with synthetic data does, however, offer insights about competitive pro-cesses. See Nelson and Winter (1982).
1 1. Although some slight differences in interest rates are reported by the firms, the resultingvariation in the user cost of capital and in the wage-rental ratio could not generate the range ofdifferences observed in capital-labor ratios.
12. "Abilities" is used to denote the skills determining the values of FT, hb, F0, and ho.13.Technical details are widely available in engineering texts, in trade publications, and from
consulting firms.14. The underlying calculation for actual loom efficiency relative to best-practice loom
efficiency has already adjusted for deficient yarn quality, a largely organizational phenomenon.1S. This statement is not inconsistent with the point made earlier about the low and
uniform price of technical information as the result of various aid missions to the Philippines.There the reference is largely to routine quality-control problems that repeatedly manifestthemselves, whereas the search costs referred to here are incurred to deal with extraordinaryoccurrences.
150 COMI'ARATIVE ANALYSIS
16. This discussion does not address a number of questions, in particular the net socialbenefit to the Kenyan economy of this form of industrialization. In the short term, the ex postbenefits and costs of an industrial plant's operation can be evalutated by the criterion of thedomestic resource cost, suitably expanded to reflect the foreign exchange cost of expatriatemanagers and repatriated profits. In the longer run, an important issue in many countries is therate of transfer of the relevant technological skills from expatriate to domestic managers. Thevalue attached to such diffusion reflects nonquantifiable objectives that may nevertheless be ofconsiderable importance to policymakers. It is still too early to evaluate this dimension ofKenya's industrial experience.
17. Inferences about comparative advantage in chapter 4 employed recent best-practiceproduction coefficients as the norm against which current Kenyan plants were compared.
18. Given the absence of a large sample or a census, I have used an average of the two bestfirms in Kenya instead of the upper quartile. In the Philippines, where the sample is larger, thecoefficients in the upper-quartile firm have been employed. Thus in neither case are the figurecontained in tables 7-3 and 7-4 to be found in the tables in chapters 4 and 5.
19. These would comprise machine-paced industries but not continuous-process ones suchas chemicals. Examples of such processes can be found in many subbranches of food process-ing, printing, and shoe production.
20. Such behavior is rational only if hourly wage costs are relatively low. When the data werecollected, the wage costs per hour indexed on the U.K. wage were United Kingdom, 100;Japan, 44; United States, 249; and Hong Kong, 33. Ranis (1973) documents the important roleof the high speeds achieved in the Japanese development experience.
21. For careful studies of the development of other deveLoping country textile industries, seeChin (1965) and Koh (1966).
22. In his well-known article on the product cycle, Vernon (1966) suggested that textileswould be a primary candidate for production in developing countries precisely for suchreasons.
23. Loom speed is rarely altered from manufacturers' recommended levels, a feature thatdifferentiates weaving from spinning.
CHAPTER EIGHT
Project Design
As INDICATED in the introduction, analyses of individual plants' pro-ductivity and the sources of their deficiencies can be used to formulateand evaluate proposed industrial projects. In particular, low productivitysuggests the possibility of a type of industrial project that has not usuallybeen considered: one solely to improve the performance of existing plantsrather than to add to physical productive capacity.' This chapter describesthe type of project design and evaluation that becomes feasible if carefulattention is given to the collection and analysis of data from operatingfactories. Such information provides the basis for a comprehensivefomulation of industrial project analysis in which the social benefit-costratio of a project to expand physical capacity is compared with that ofone for raising the productivity of existing facilities.
The technical characteristics of plants already operating in a countryalso provide a benchmark for the plausibility of the technical input-output coefficients contained in feasibility studies of proposed new plantsin the same nation. Coefficients considerably better than those currentlyachieved in similar plants should initially be viewed with skepticism andrequire explanation in terms of such variables as better management, newquality-control procedures, or new or improved training programs.Equipment containing new features is not among the more persuasivejustifications. Otherwise, a not overly conservative working hypothesis isthat of a regression to the mean, which assumes that the most probableoperating parameters of a new plant will be those currently manifested inlocal firms employing roughly similar technology.
Formulation of Alternative Industrial Projects
Two of many possible examples of project analysis will be given in thischapter. One is based on an actual case study of the desirability of build-ing a completely new textile factory in Tanzania as compared with im-proving the effectiveness of existing plants. The second considers the
151
152 PROJECT DESIGN
potential benefit-cost ratios to be obtained by improving the productivityof Philippine textile mills and uses some of the results of chapter 5. TheTanzanian project is typical of many industrial projects proposed in de-veloping countries: adding a substantial new factory to a sector in whichconsiderable production capacity already exists, albeit inefficiently de-ployed. The rich set of analyses of the sector that are available allowssome confidence in the results obtained. In contrast, the issue in thePhilippines is to assess the benefits to be derived from improving theproductivity of existing plants in a large sector that is generally consideredto operate inefficiently. Both types of analysis can be extended further,but the presentation here is mainly intended to inclicate a way of evaluat-ing industrial projects from a new perspective and to suggest that a broad-ened view of industrial project design should be an intrinsic part of everyproposal to augment physical capacity.
There is only limited evidence of the success of attempts to improveproductivity in existing firms. Early efforts by the ILO (Kilby 1962) re-sulted in substantial growth in labor productivity, apparently with noincrease in equipment per worker. The permanence of the achievementwas not investigated. A carefully described experiment in Indian weavingplants (Rice 1958) notes short-run increases in output of 19 percent and100 percent in automatic and semiautomatic loom sheds solely as a resultof rearranging equipment and work assignments. Again, the duration ofthis improvement is not known. Recent World Bank efforts along similarlines, often combined with loans to rehabilitate equipment, have yet to besystematically evaluated (de Vries and Brakel 1983).
Both the ILO and Indian improvements in productivity were obtainedwith a much less systematic program than that envisioned here at the firmlevel, and with no attempts to reorganize the industry or alter the econo-mywide incentive structure. The initial success in these cases, despite theirlimited scope, provides an empirical basis for optimism about the poten-tial benefits of a comprehensive program to increase productivity.
The Role of Individuals in Technology Diffusion
Individuals perform a critical role in the successful transfer of tech-nology, and especially in the specific form envisioned in this chapter: agroup of individuals hired by textile mills with low productivity toprovide technical and organizational help for a number of years. Becauseother ways of raising production engineering skills exist, there is justifica-tion for a short discussion of why this method is lilkely to be superior toalternative ones such as centralized aid provided by a consulting group.
Al-TERNATIVE PROJECTS 153
A considerable literature, based largely on historical evidence, suggeststhat the diffusion of technology-both new processes and new prod-ucts-results mainly from the movements of individuals from firm to firmand from country to country.2 The precise behavioral reason for theimportance of person-to-person contact is rarely articulated (but see Ar-row 1969): possible interpretations include the role of tacit or uncodifiedknowledge (Nelson and Winter 1982); the importance of an advocate of aparticular change in breaking down an organizational equilibrium thatfavors the status quo (Pack and Pack 1977); and the reduction in uncer-tainty and in the cost of information acquisition when a person withproduction experience is on hand-as opposed to the abstract and un-tested technical possibilities available from other sources. Whatever ulti-mate combination of reasons accounts for the decisive role of individualsin the transmission of operational command over new processes andproducts, there is no evidence that the diffusion of best-practice routinescan be effectively achieved by other modes. Information recently col-lected in the Republic of Korea confirms the role in knowledge diffusionof informal personal contacts, although other more formal modes, suchas advice from purchasers of exports and knowledge obtained from re-cently returned Koreans with U.S. work experience, are also important(Westphal, Kim, and Dahlman 1984; Westphal, Pursell, and Rhee 1981).
There appears to be little interfirm mobility in middle and upper man-agement in the Philippines, partly because of the family basis of manyfirms (see chapter 7, note 4). It can plausibly be argued that successfulindustrialization is characterized by a fairly uniform diffusion of bestpractice and is thus impeded by the absence of job switching amongfirms.3 In addition to the absence of actual interfirm transfers embodiedin individuals, there is also a loss of the kind of informal exchange ofinformation that occurs as technicians suggest to each other that theymight confer substantial benefits on another firm if they were to be hired.Anecdotal evidence suggests that such information exchange is importantin some sectors of U.S. industry.
Given the absence of interfirm mobility, limited informal contact, andno transmission of foreign methods by returning nationals or purchasersof exports, some mechanism to substitute for such processes is desirable.Licenses, technical aid from foreign manufacturers, and a central con-sulting group composed of domestic technicians constitute alternatives tothe long-term hiring of individuals by firms proposed in this chapter.Although a similar benefit-cost analysis could be carried out for any ofthese alternatives, this chapter reflects the view that any method that doesnot rely on individual contact on a sustained basis is unlikely to be
154 PROJECT DESIGN
effective. The nature of the problems discussed in chapter 6 suggests thatchanges in production engineering are not likely to be implemented on aone-shot or short-term basis; problems arising frorn the variation in prod-ucts or the processing environment occur frequently. Changes in thenature of raw materials, new product designs, and new developments inproduction engineering will pose unanticipated problems whose solutionswilI differ from those obtained with earlier practices. Successful absorp-tion of improved production engineering practices requires not only ini-tial learning but also an ability to modify practices as circumstanceschange. Given the current levels of skill, it is improbable that a centralizedpool of consultants or a foreign license accompanied by some initialpersonal help can instill the requisite adaptive ability. With skills initiallyhigher, one-time infusions of this type from licensers or purchasers of afirm's exports may be adequate, but even in the case of Korea, individualmobility and employment in the firm seem to have been an important wayof obtaining mastery in production engineering.
The Role of Competition in Obtaining Greater Productivity
A textbook view of industry dynamics might suggest that explicit pol-icy efforts to spread knowledge are redundant. Faced with sufficientcompetitive pressure, firms will be compelled to devote greater effort tothe search for the technical knowledge that will allow them to maintainprofit rates equal to those in other endeavors. This position has muchforce and partly explains why any policy effort to promote the diffusionof information should be embedded within a wider framework (set forthin chapter 9) to increase competition; nevertheless, the view that competi-tion is all that is required is too facile. Attribution of the success of thesuperexporters of East Asia solely to their reliance on market forces, forexample, does not accord with the facts.4 In these countries, competitiveforces have been allowed full sway only after substantial technical learninghas taken place. A liberalized economic milieu and a policy to increasetechnical competence are the two blades of the scissors, to use the Mar-shallian image, necessary to achieve decreased cost. Either is likely to beconsiderably less effective without the other.
In the present context, the most relevant argument for an explicittechnology policy is the relatively low level of technical skills in Tanzaniaand, to a smaller degree, in the Philippines. Williams (1975) has docu-mented the poor technical performance of the Tanzanian textile sectorduring the 1970s. Mlawa (1983) has presented detailed evidence of thepoor preparation of technicians and the small number of individuals withrelevant training. If the sector were exposed to competition without an
C'OST-EFFECTIVENESS 155
attempt to improve its performance, most plants would probably go outof business. The fact that this is likely to be true of almost all industrialsectors-the Tanzanian example being just one instance of prematureimport-substituting industrialization-means that the following discus-sion of the benefit-cost ratio of improving existing technical competencein one sector has broad general significance.
Despite the noncompetitive nature of existing textile plants, still otheradditions to capacity are being considered. Below I consider the eco-nomic desirability of one very large project relative to a program designedto improve the performance of existing firms. I then address the issuesmore generally, using the results from chapter 5 on the Philippines andrelating the question to more traditional infant industry arguments.
Cost-Effectiveness of Two Alternative Projects
The first case to be discussed is that of a proposed investment in a newUS$100 million integrated textile mill in Tanzania in the late 1970s. Theavailability of detailed information on the specific project, together with aconsiderable amount of background data on the textile sector (Mlawa1983; Williams 1975), permits an analysis of the cost-effectiveness of twoalternative proposals: a new textile plant designed to increase annualoutput by 19 million linear meters and a project designed to raise theproductivity of existing plants within the context of a general effort toimprove industrial performance via internal and external liberalization.Rather than using benefit-cost ratios, the analysis compares the cost ofobtaining the same target increase in output by each of the two methods.The cost-effectivness approach precludes the need to analyze the value ofthe increase in output, which is the same in both cases.5
In the case of the improvement project, five major textile plants existedat the time of the planned expansion in capacity. During the preceding fiveyears, average labor productivity for these plants had declined by 28percent, but the size of the capital stock remained roughly constant dur-ing this period in all plants.6 For the two largest mills, accounting for two-thirds of total output, it is possible to calculate factor inputs relative tobest practice as well as relative total-factor productivity calculated in thesame way as the figures for Kenya and the Philippines. The relevant dataare shown in table 8-1.
The capital-labor ratio in both spinning plants is higher than best prac-tice, an anomalous result, given the country's low wage-rental ratio. Rela-tive capital inputs are very high in both spinning and weaving (comparetables 7-3 and 7-5). At best, RTFP for both segments of textile production
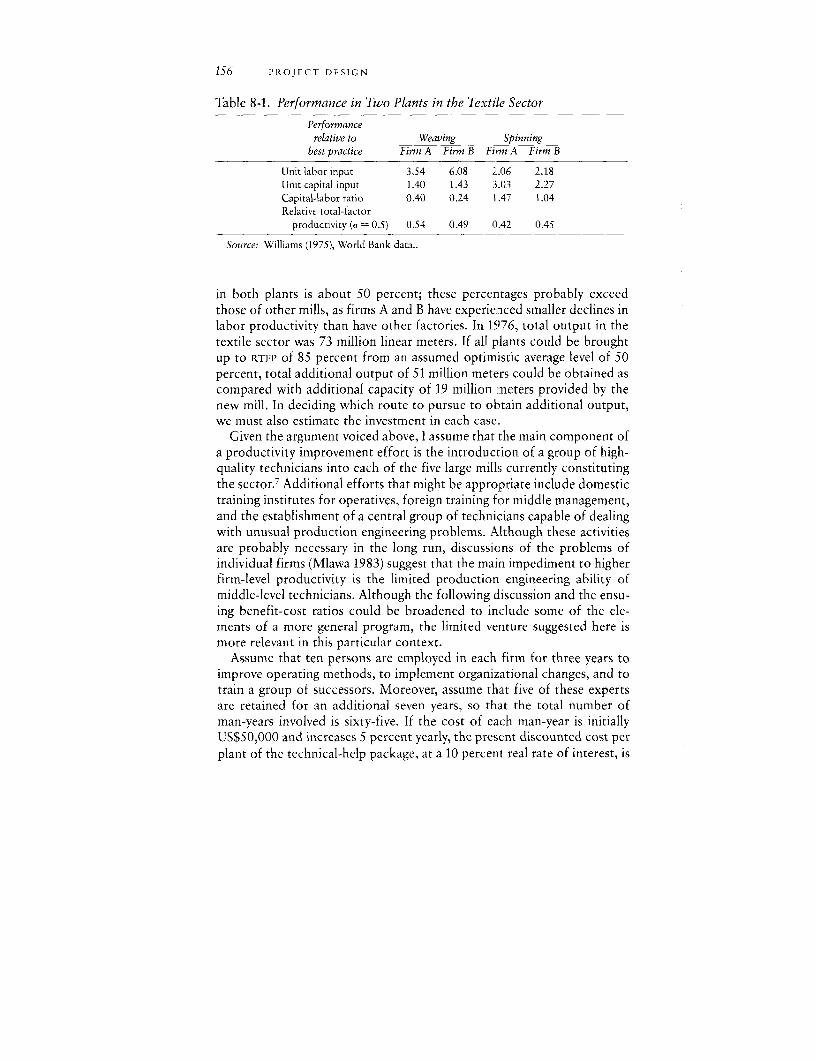
156 PROJECT DESIGN
Table 8-1. Performance in Two Plants in the Textile Sector
Performancerelative to Weaving Spinning
best practice Firm A Firm B Firm A Firm B
Unit labor input 3.54 6.08 2.06 2.18Unit capital input 1.40 1.43 3.03 2.27Capital-labor ratio 0.40 0.24 1.47 1.04Relative total-factor
productivity (a = 0.5) 0.54 0.49 0.42 0.45
Source: Williams (1975), World Bank data..
in both plants is about 50 percent; these percentages probably exceedthose of other mills, as firms A and B have experienced smaller declines inlabor productivity than have other factories. In 1976, total output in thetextile sector was 73 million linear meters. If all plants could be broughtup to RTFP of 85 percent from an assumed optimistic average level of 50percent, total additional output of 51 million meters could be obtained ascompared with additional capacity of 19 million meters provided by thenew mill. In deciding which route to pursue to obtain additional output,we must also estimate the investment in each case..
Given the argument voiced above, I assume that the main component ofa productivity improvement effort is the introduction of a group of high-quality technicians into each of the five large mills currently constitutingthe sector.7 Additional efforts that might be appropriate include domestictraining institutes for operatives, foreign training for middle management,and the establishment of a central group of technicians capable of dealingwith unusual production engineering problems. Although these activitiesare probably necessary in the long run, discussions of the problems ofindividual firms (Mlawa 1983) suggest that the main impediment to higherfirm-level productivity is the limited production engineering ability ofmiddle-level technicians. Although the following discussion and the ensu-ing benefit-cost ratios could be broadened to include some of the ele-ments of a more general program, the limited venture suggested here ismore relevant in this particular context.
Assume that ten persons are employed in each firm for three years toimprove operating methods, to implement organizational changes, and totrain a group of successors. Moreover, assume that five of these expertsare retained for an additional seven years, so that the total number ofman-years involved is sixty-five. If the cost of each man-year is initiallyUS$50,000 and increases 5 percent yearly, the present discounted cost perplant of the technical-help package, at a 10 percent real rate of interest, is
BENEFIT-COST ANALYSIS 157
US$2.5 million. This figure will be used in calculations throughout thischapter, including those involving the Philippines. Although small costincreases might be incurred if the remedies for some inefficient prac-tices-for example low current inventories of spare parts-require addi-tional investment, my calculations suggest that these increases are minor.Thus the investment necessary to obtain 51 million meters of additionalcloth per year from the five existing plants is equivalent to an investmentof US$12.5 million; this figure contrasts with US$100 million estimate inthe feasibility study that proposed producing 19 million meters of cloth ina new plant. Even if other institutional mechanisms, such as traininginstitutes for operatives, were provided to improve productivity, theywould probably not greatly narrow the gap between the costs of the twoprojects.
If the productivity improvement effort were limited to the two largerexisting plants, the potential increase in output would be considerablylarger than that anticipated from the new mill and would cost only US$5million. Moreover, the projected output for the new plant is almost cer-tainly too high, as the feasibility study is predicated on higher productiv-ity than that currently realized in similar Tanzanian mills.
One possible justification for the new mill is the benefit conferred bythe domestic output of a new product, polyester-cotton blends. Propo-nents of this argument would have to show, however, that the difference inconsumer surplus between the two types of products would have a presentdiscounted value of more than US$95 million, the difference in invest-ment in the two projects, and that this increase in consumer surplus ismost efficiently obtained by domestic production rather than by imports.Both assumptions are implausible.
Benefit-Cost Analysis of Productivity-Enhancing Projects
The above discussion has taken a cost-effectiveness approach where aproductivity improvement project constitutes an alternative to a new fac-tory. In many cases, however, the relevant question is likely to be thebenefit-cost ratio of a productivity improvement project that is part of alarger program to improve the functioning of a particular sector. Otherelements of the program should include liberalization of the trade regime(to provide a more competitive environment that encourages firms tomake productive use of additional technical capacity) and explicit effortsto encourage greater product specialization. The relations between theelements of a productivity-enhancing program are considered in the next
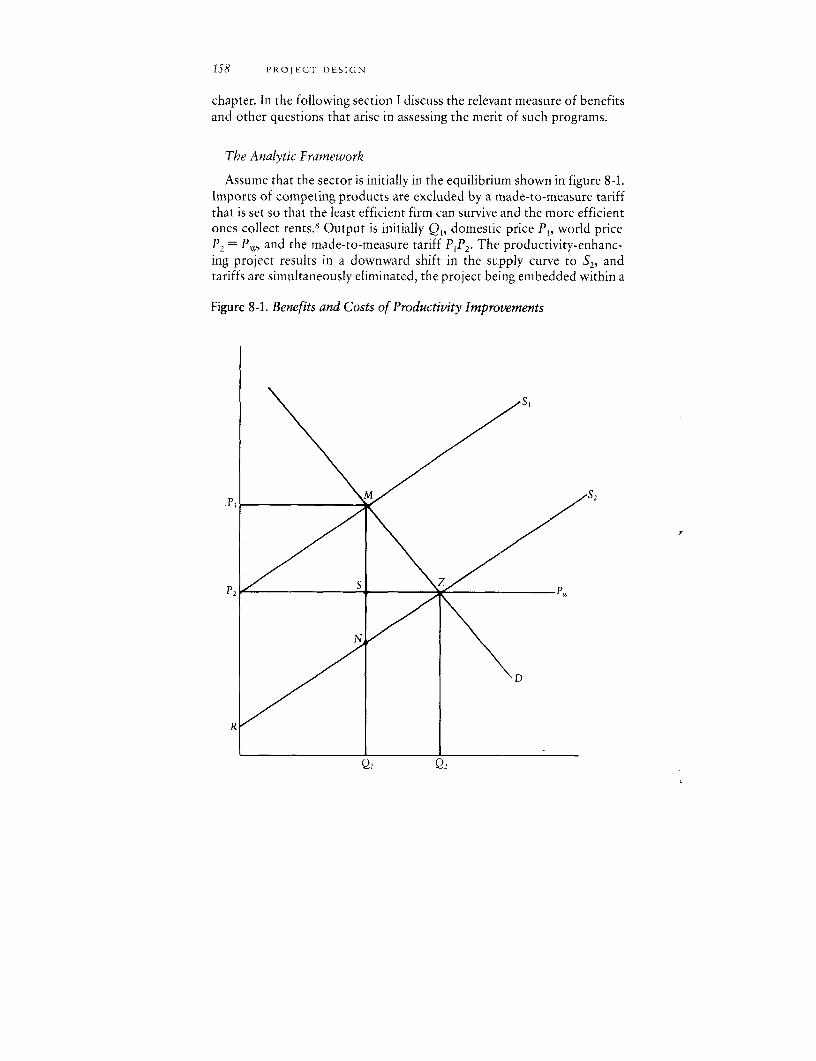
i58 PROJECT DESIGN
chapter. In the following section I discuss the relevant measure of benefitsand other questions that arise in assessing the meri.t of such programs.
The Analytic Framework
Assume that the sector is initially in the equilibrium shown in figure 8-1.Imports of competing products are excluded by a made-to-measure tariffthat is set so that the least efficient firm can survive and the more efficientones collect rents.8 Output is initially Q, domestic price PI, world priceP2 = Pw, and the made-to-measure tariff PIP2. The productivity-enhanc-ing project results in a downward shift in the supply curve to S2, andtariffs are simultaneously eliminated, the project being embedded within a
Figure 8-1. Benefits and Costs of Productivity Improvements
PI S2
BENFFIT-COST ANALYSIS 159
more general structural adjustment program. There are two effects of theliberalization-cum-learning effort: (1) an increase in consumer surplus ofP1P2ZM and (2) a change in producer surplus of P,ZR - PIP2M. The netgain is thus P,MZR, which can be decomposed into two areas, P2MNRand MNZ. A downward shift in the industry's supply curve reflects theshift in the marginal cost curves of the component firms. Thus P2MNRrepresents the fall in the (private) marginal cost of producing initial outputQ1 and can be approximated by the decrease in the sum of the marginalcosts of the firms constituting the sector. MNZ is the social gain from theexpansion of output from Q, to Q2 and consists of the additional pro-ducer surplus, SZN, and consumer surplus, MSZ.
Given that area P2MZ9 could, in principle, be obtained simply by theelimination of protection without a concomitant learning program,10
should the entire gain, P2MZR, be attributed to the productivity-enhanc-ing project and its impact on the supply curve? The answer depends on anassessment of the probability of liberalization: if it is thought likely tooccur without a productivity-enhancing program, P2MZR overstates thesocial benefit from an investment in learning. The constellation of politi-cal forces, however, may preclude a reduction in tariffs without a simul-taneous productivity-enhancing project, given the possible bankruptcy ofinfluential but inefficient firms."1 In this case, the total gains will beachievable only when a learning project is attached to the liberalizationprogram. Because of the possibility that a number of workers and plantowners would be significant losers and therefore hostile to a pure liber-alization effort, however, such policy changes are rare. The more inclusivemeasure of benefits is thus a defensible view of the gains stemming di-rectly from the productivity-enhancing component. Nevertheless, the"pure" effect of the intensified learning effort should exclude P2MZ, andonly the remainder RP2Z should be counted as a true benefit.
Some might argue that even the smaller measure represents an over-statement insofar as liberalization, even if not supplemented by explicitmeasures to encourage productivity, would cause a downward shift in theindustry supply curve as individual firms facing more intense competitionwould seek to reduce costs on their own. Managements, for example,would try to improve their production engineering abilities, and greatercompetition would produce a more rational pattern of product specializa-tion or, at the least, production for inventory and the cost reductionsassociated with larger lot sizes.
These outcomes are theoretically possible. Skepticism about their inev-itability may be warranted, however, as such opportunities for profit al-ready exist (see chapter 6) and have not been exploited. Moreover, themore competitive pricing induced by liberalization does not guarantee
160 PROJECT DESIGN
greater product specialization. Very little is understood about the dynam-ics of product specialization, the conditions under which it emerges, andthe stability of any structure that is achieved.12 It requires a fundamen-talist's faith in the strength of the invisible hand tc, believe that the requi-site specialization will develop, without guidance, simply fromliberalization. Even the European Common Market countries, with con-siderably larger domestic markets than most developing countries, sub-stantial exports, and much lower levels of effective protection, haverecently resorted to explicit, legally sanctioned, cartel-like arrangementsto encourage greater specialization in the textile sector."3
The implication is that the time required for adjustment of the supplycurve is likely to be longer, and the ultimate height of the supply curvegreater, if firms are left to their own devices than if a program focusingdirectly on productivity issues is implemented. If these views are correct,ignoring the potential shift in the supply curve that might result solelyfrom liberalization is not likely to exaggerate beneifits by much.
Given the preceding arguments, two measures of the gain from a learn-ing program are calculated, RP2MN and '/2RP2MN. Use of '/2RP2MN iscomputationally convenient and provides a fair approximation of theactual value of RP2SN as calculated from individual plant data. The largerof the two values would be correct if it were true that no liberalizationwould occur without a learning program. The smaller estimate, however,does not take into account the possibility that learning may occur in a freetrade regime. Both measures omit MZN, all of which should be added toRP2MN under the more comprehensive measure, whereas only part,SZN, should be added to Y/2RP2MN under the more restricted view.Estimation of these areas requires supply and demriand elasticities in therelevant range, both of which are unavailable. Calculations with plausiblevalues of these parameters suggest that the omission decreases calculatedbenefits by a maximum of 15 percent and introduces a downward bias ofthis magnitude into the benefit-cost ratios.
It is of use to relate this discussion to the traditional infant industrycase. The conventional argument is that initial social costs, P2MZ, areincurred during a learning period, whereas benefits RP2Z accrue later aslearning shifts the supply curve from S, to S2. To mTeet the Mill-Bastablecriterion, the present discounted value of the benefits over some suitableperiod must exceed the present discounted value of the social costs.Similarly, the benefit from a productivity improvement program is thepresent discounted value of RP2Z (calculated here as '/2RP2MN), and thecost of obtaining this is the investment in the project rather than thepresent discounted value of P2MZ. The supply curve shifts not as a resultof passive but inevitable learning by doing over time, as in the infant
AN APPLICATION 161
industry argument, but in response to investment explicitly designed toshift it quickly. In the conventional view, the producer surplus RP2Z,which constitutes the potential benefit, accrues over time even if nothingis done to force the pace of learning. If this were the likely evolution overtime (for an evaluation of the realism of this view see Bell, Ross-Larson,and Westphal 1984), the benefit from the productivity-augmenting effortas measured here would be overstated, and the true benefit would consistof the discounted differences in producer surplus given by the two timepaths of shifting supply curves.
Introduction of a New Product
The analytic framework just established allows a more precise analysisof the potential benefits and costs of local production of goods that mustcurrently be imported. One of the alleged benefits of the new mill inTanzania is its ability to produce blended yarns and fabrics, in this casepolyester-cotton. Assuming for the sake of argument that it is difficultand therefore very costly to convert existing equipment to such produc-tion, how does the analysis of the preceding section change? The assertionthat blended products are more desirable than pure cotton, perhaps be-cause of their increased durability and easy care, implies that the demandcurve for the good lies above that shown for pure cotton products infigure 8-1.14 If the firm established to satisfy cotton-polyester demandswere as inefficient as those producing pure cotton products, the forgoneconsumer surplus and excess production cost would thus be a loss stillgreater than that shown in figure 8-1. If consumers perceive the newlyproduced good to be superior, as is claimed, the potential economic lossfrom inefficient domestic production is particularly great. Rather thanconstituting an argument for initiating production, a higher demand curvesuggests the need for an even more careful appraisal of the proposedplant.
An Application to the Philippine Textile Sector
The cost-benefit framework described above has been implementedusing the data obtained from individual Philippine firms. The numericalestimates of benefits are derived by computing the reduction in currentcost that would be obtained, with the prevailing output, if each firm couldincrease its relative total-factor productivity to 85 percent of best practicein both spinning and weaving. In addition, a quantitatively importantbenefit in weaving is the cost reduction obtained by moving from thecurrent capital-labor ratio to the cost-minimizing one.
162 IPROJECT DESIGN
Benefits from Industry- and Firm-Level Improvements
It was noted in chapter 5 that the average reduction from improvedallocational performance was 26 percent of current total weaving costs.15
One of the tasks of technical personnel would be tc capture these benefitsin addition to those derived from the realization of higher total-factorproductivity. Although not directly attributable to improved technicalcapability, the measured benefits include those obtained from greaterspecialization, because the productivity improvement program is assumedto be embedded in a general effort to rationalize the industry. Some of theimplications of the inability to realize gains from specialization are pre-sented in the next section.
Benefits are calculated as the present discounted value of the totalreduction in cost over ten years, and a 10 percent discount rate is assumed.The cost of the program is based on the assumption (used earlier in regardto Tanzanian productivity improvement) that expatriate staff would behired for several years. It is assumed that they are equally divided betweenthe spinning and weaving sections, and the cost is allocated on this basisto each process.
In principle, the desired transfer of technological capabilities could behandled in other ways-for example, by acquiring foreign licenses forspecific process technologies, by organizing a central pool of technicians,by establishing a worker training institute, and by hiring short-term con-sultants. Many of these approaches have already been tried without suc-cess in the Philippines, however (see chapters 6 and 7). It can plausibly beargued that their failure was attributable to the lack of any prior effort bythe firms to improve their own ability to assimilate technology and thatplacing expatriate technicians at the firm level would be the best way ofquickly expanding the stock of human capital to obtain greater absorptivecapacity. Moreover, given the nature of the accumulated deficiencies, theexpatriates must be present for a lengthy period-because their job is toprovide a stock of skills that is otherwise nonexistent rather than toimprove slightly the quality of an existing stock. Within the context ofgreater rationalization of the product structure and a more competitiveenvironment (see chapter 9), this strategy seems the most promisingsource of greater firm-level productivity. Certainly the quite good com-parative performance of the Kenyan firms seems to be based on the pres-ence of such a group of technicians in each firm (see chapters 4 and 7).
The emphasis in this example on improved production engineeringstems from the results of the decomposition of the sources of low pro-ductivity in the Philippines. As tables 5-6 and 5-8 show, firm-specifictechnical deficiencies are a major source of the deviation from best prac-
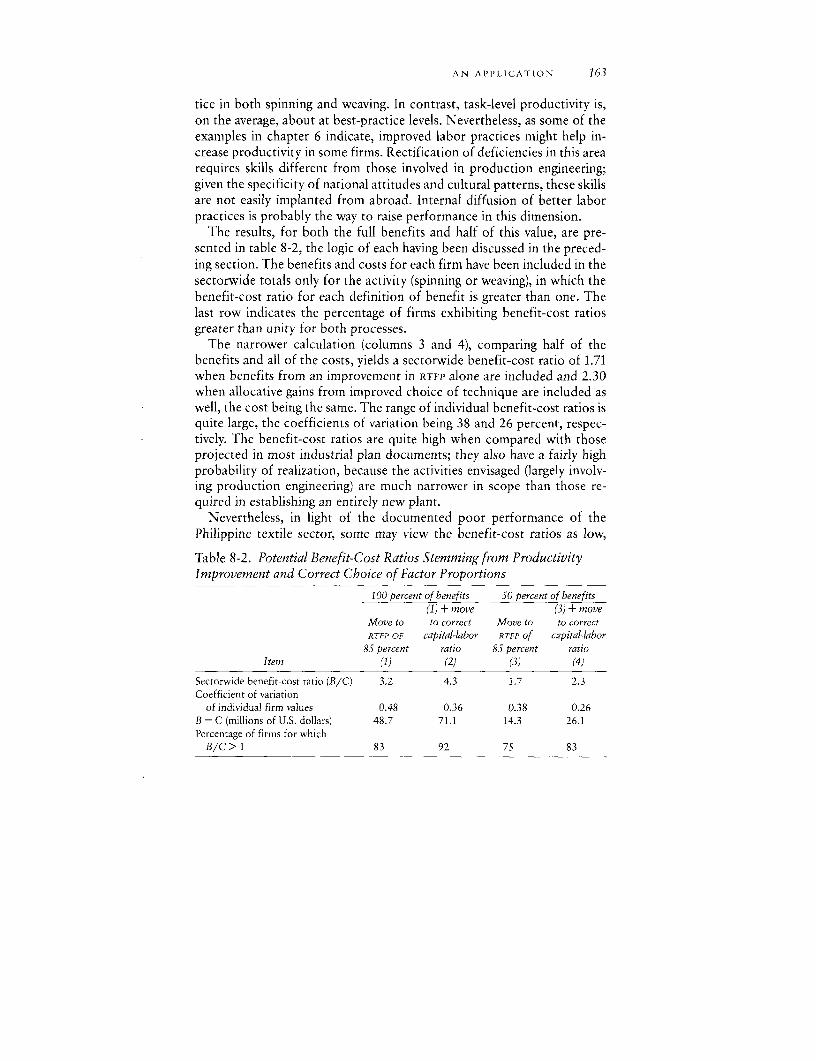
AN APPLICATION 163
tice in both spinning and weaving. In contrast, task-level productivity is,on the average, about at best-practice levels. Nevertheless, as some of theexamples in chapter 6 indicate, improved labor practices might help in-crease productivity in some firms. Rectification of deficiencies in this arearequires skills different from those involved in production engineering;given the specificity of national attitudes and cultural patterns, these skillsare not easily implanted from abroad. Internal diffusion of better laborpractices is probably the way to raise performance in this dimension.
The results, for both the full benefits and half of this value, are pre-sented in table 8-2, the logic of each having been discussed in the preced-ing section. The benefits and costs for each firm have been included in thesectorwide totals only for the activity (spinning or weaving), in which thebenefit-cost ratio for each definition of benefit is greater than one. Thelast row indicates the percentage of firms exhibiting benefit-cost ratiosgreater than unity for both processes.
The narrower calculation (columns 3 and 4), comparing half of thebenefits and all of the costs, yields a sectorwide benefit-cost ratio of 1.71when benefits from an improvement in RTFP alone are included and 2.30when allocative gains from improved choice of technique are included aswell, the cost being the same. The range of individual benefit-cost ratios isquite large, the coefficients of variation being 38 and 26 percent, respec-tively. The benefit-cost ratios are quite high when compared with thoseprojected in most industrial plan documents; they also have a fairly highprobability of realization, because the activities envisaged (largely involv-ing production engineering) are much narrower in scope than those re-quired in establishing an entirely new plant.
Nevertheless, in light of the documented poor performance of thePhilippine textile sector, some may view the benefit-cost ratios as low,
Table 8-2. Potential Benefit-Cost Ratios Stemming from ProductivityImprovement and Correct Choice of Factor Proportions
100 percent of benefits 50 percent of benefits(1) + move (3) + move
Move to to correct Move to to correctRTFP OF capital-labor RTFP of capital-labor
85 percent ratio 85 percent ratioItem (1) (2) (3) (4)
Sector-wide benefit-cost ratio (B/C) 3.2 4.3 1.7 2.3Coefficient of variation
of individual firm values 0.48 0.36 0.38 0.26B - C (millions of U.S. dollars) 48.7 71.1 14.3 26.1Percentage of firms for which
B/C> 1 83 92 75 83
164 PROJECT DESIGN
although they are substantially greater than unity. As the first two col-umns in table 8-2 show, this is attributable to the conservative nature ofthe preceding social benefit-cost calculation insofar as the part of thegains that might be obtained simply from liberalization has been excludedin the last two columns. Including these gains as part of the benefit(columns 1 and 2) yields sectorwide benefit-cost :ratios of 3.16 and 4.33and absolute net benefits of US$49 million or US$71 million as comparedwith US$14 million and US$26 million when half of total benefits areincluded.'6
Benefits Restricted to the Firm Level
Of the calculations that have been done, those with the more inclusivedefinition of benefits, full rather than half, correspond to what an individ-ual firm would gain from an investment in technical and organizationalupgrading.'7 If the potential benefit-cost ratios are so favorable (and onthe assumption that financing is not a problem), why do firms not under-take productivity improvements on their own? Are they failing to mini-mize costs or to make rational investment calculations, or are theyengaging in one form or another of nonmaximizing behavior?
One obvious possibility is that companies in the existing environmentcould not look forward to obtaining benefits accruing from greater spe-cialization, because product specialization depends on explicit coordina-tion among all firms. Without such industrywide changes, which have apublic goods character and well-known attendant problems (Olson 1965),companies calculating the potential benefits from improving their owntechnical competence as well as their task-level productivity would antici-pate an upper limit in their performance of perhaps 90 percent of best-practice total-factor productivity. If the absence of greater specializationin Philippine weaving is a given, for example, that sets a limit to RTFP of 70percent, the best that individual plants might expect to attain is RTFP of0.90 (0.70) = 0.63. The private benefit-cost calculus can then be recalcu-lated on the assumption that firms are successful in achieving this level.
To return to the question of the economic rationality of firms, anoutcome consistent with cost minimization requires that individual plantsexhibit a prospective benefit-cost ratio of less than one from undertakingtheir own improvement efforts. This criterion is weak, as it rests on theassumption that the posited minimum-cost level (based on the calculationthat is given above) of the technical aid program is indivisible; companieswith potential benefits below this fixed cost would not purchase such aid.In contrast, if technical aid could be bought in continuously variableamounts, each firm capable of obtaining any positive marginal benefits
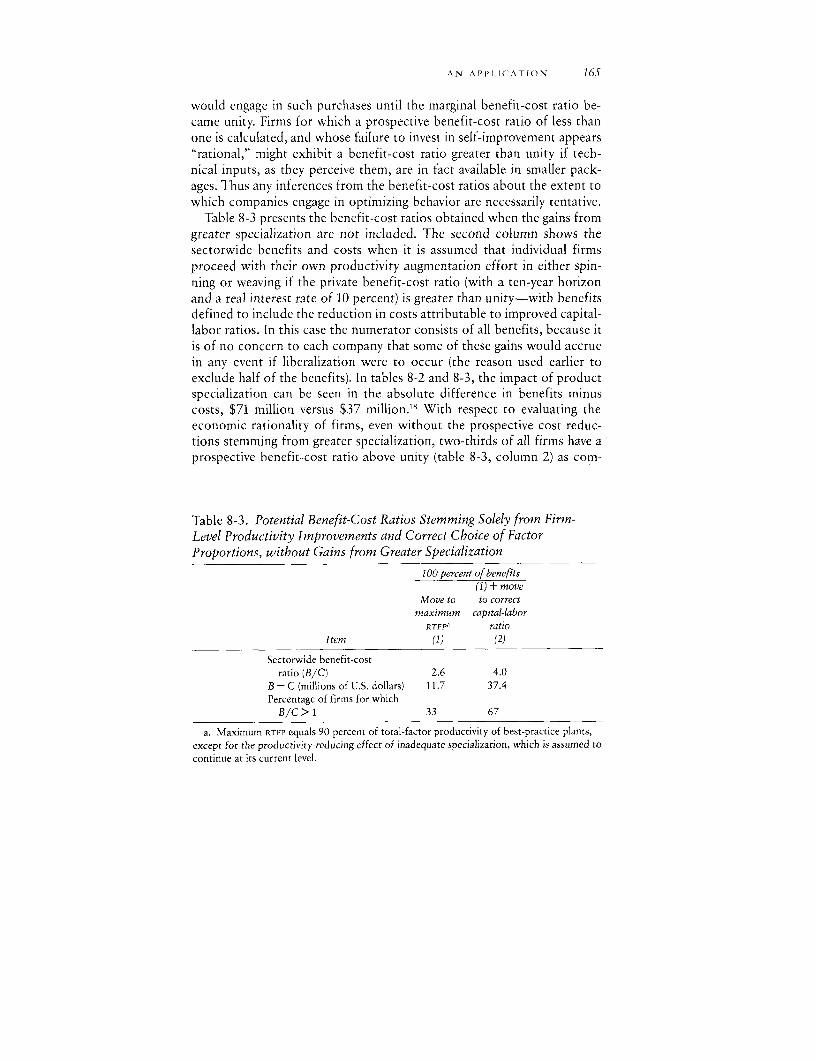
AN APPLICATION 165
would engage in such purchases until the marginal benefit-cost ratio be-came unity. Firms for which a prospective benefit-cost ratio of less thanone is calculated, and whose failure to invest in self-improvement appears"rational," might exhibit a benefit-cost ratio greater than unity if tech-nical inputs, as they perceive them, are in fact available in smaller pack-ages. Thus any inferences from the benefit-cost ratios about the extent towhich companies engage in optimizing behavior are necessarily tentative.
Table 8-3 presents the benefit-cost ratios obtained when the gains fromgreater specialization are not included. The second column shows thesectorwide benefits and costs when it is assumed that individual firmsproceed with their own productivity augmentation effort in either spin-ning or weaving if the private benefit-cost ratio (with a ten-year horizonand a real interest rate of 10 percent) is greater than unity-with benefitsdefined to include the reduction in costs attributable to improved capital-labor ratios. In this case the numerator consists of all benefits, because itis of no concern to each company that some of these gains would accruein any event if liberalization were to occur (the reason used earlier toexclude half of the benefits). In tables 8-2 and 8-3, the impact of productspecialization can be seen in the absolute difference in benefits minuscosts, $71 million versus $37 million.'8 With respect to evaluating theeconomic rationality of firms, even without the prospective cost reduc-tions stemming from greater specialization, two-thirds of all firms have aprospective benefit-cost ratio above unity (table 8-3, column 2) as com-
Table 8-3. Potential Benefit-Cost Ratios Stemming Solely from Firm-Level Productivity Improvements and Correct Choice of FactorProportions, without Gains from Greater Specialization
100 percent of benefits(1) + move
Move to to correctmaximum capital-labor
RTFPS ratioItem (1) (2)
Sectorwide benefit-costratio (B/C) 2.6 4.0
B - C (millions of U.S. dollars) 11.7 37.4Percentage of firms for which
B/C> 1 33 67
a. Maximum RTFP equals 90 percent of total-factor productivity of best-practice plants,except for the productivity-reducing effect of inadequate specialization, which is assumed tocontinue at its current level.
166 I'ROJECT DESIGN
pared with 92 percent of firms when such gains are included in potentialbenefits. Not surprisingly, without the lure of gains from specializationand with the assumption of a minimum size for the technical effort re-quired, a smaller fraction of firms will find it in their interest to undertakea productivity enhancement program of their own.
The fact that two-thirds of plants should currently find it worthwhile(column 2, row 3), given the assumptions made, to invest in their ownimprovement program, whereas only one-third are in least-cost equi-librium in the sense indicated earlier, might be viewed as a refutation ofthe neoclassical view underlying equation 7-2 and more generally as arebuttal of the view that neoclassical theory, suitably extended, is anadequate model for the behavior of firms. I do not think that such strongconclusions can be drawn. Although firms may believe that outside helpcould improve their technical efficiency, for example, they may be doubt-ful about the possibility of altering existing machine assignments perworker; hence gains in allocative efficiency could appear less certain andmight not be included in the calculus of prospective benefits. If this werethe case, then only one-third of firms (table 8-3, column 1) would cur-rently have anticipated benefit-cost ratios greater than unity."9 The pro-spective benefit-cost ratios and the percentage of firms with ratios aboveunity vary with the assumption made. Although they are useful for delin-eating the range of issues involved in undertaking improvement programs,the data cannot be invoked to strengthen the claims of either those whoview cost minimization as the only view of firm behavior or those whobelieve that a bounded rationality-satisficing model is superior. As in mostserious issues, the result retains some ambiguity--except to those whohold strong prior views to which empirical information contributes only asmall amount of additional insight.
The preceding calculations demonstrate the potential benefits of elim-inating two common features of the developing country industrial land-scape: firm-specific inefficient practices and efficiency losses that requirethe reorganization of the industry. The approach taken here implies thatneither source of inefficiency can be eliminated without a consciouseffort, whether it involves the introduction of technicians into individualfirms to redress inefficient practices or a purposeful, industry-wide pro-gram to rationalize the division of products among firms. The opening ofthe sector to competitive forces is a necessary adjunct to these activities,but it is unlikely to be sufficient to guarantee the desired outcome. Thesize of the prospective gain from sectorwide reorganization is particularlyimportant if the productivity improvement programs can be carried outonly on a minimum scale. In this case, the prospective benefits of product
NOTES 167
specialization provide the necessary bonus that makes it economic formany firms to incur the cost of eliminating purely internal inefficiencies.
The method of achieving adequate product specialization is of par-ticular importance.2 0 In principle, adequate price competition stimulatedby the entry of foreign products should encourage and enforce optimalspecialization. When each firm produces a wide range of products, open-ing the economy to price competition should lead to a new situation inwhich each plant makes only a few products and obtains the advantage oflong production runs. Although the comparative static equilibria are clear,the dynamics of moving from the initial situation to the final one aredifficult to envision, and there is certainly no guidance from the literatureon the likely adjustment process. Indeed, it is easy to imagine scenarios inwhich the path to the desirable equilibrium will be diverted time andagain, so that its eventual achievement is thwarted.
A relatively direct approach could be a two-part policy of assigningproducts to plants and lowering tariffs to prevent monopolistic exploita-tion of each plant's position. The precise legal structure for assigningproducts cannot be given in detail here, but some issues can be foreseenand some precedents can be examined.2" Questions clearly arise about thedynamic stability of such an arrangement: for example, in the face ofdeclining international or domestic demand, forces similar to those thathave led to the current fragmented state of production may reassert them-selves. Such difficulties, and their likely costs, must be weighed against thegains from greater specialization (compare tables 8-2 and 8-3). The admin-istrative costs associated with reorganization must also be considered.Nevertheless, to do nothing purposeful to foster the requisite specializa-tion is to grant the possibility that quite substantial gains in real incomewill be forgone. As noted earlier, neither the size of an economy nor thecompetitive forces at work appear to have guaranteed the realization ofgains from product specialization in other countries. Although the poten-tial problems of administrative interference in the market must be exam-ined carefully, the gains are sufficiently large to warrant carefulexamination of the approach outlined here.
Notes
1. For a recent survey of a number of World Bank efforts along these lines in the textilesector, see de Vries and Brakel (1983).
2. See Landes (1969) and Rosenberg (1976). Jeremy (1981) provides detail on the diffusion oftextile technology in the nineteenth century. Also see Saxonhouse (1974, 1976, 1978).
168 PROJECT DESIGN
3. An apparently contradictory argument often made in support of infant industry protec-tion is that turnover is harmful because it reduces the incentive for firms to provide training toworkers unless the cost is borne by trainees. Two issues associated with mobility are its impacton the level of privately financed training provided by the sector and its social benefit from thediffusion of knowledge. Whether high mobility reduces the incentive of firms to providetraining depends on the incidence of training costs. In the case of technicians with considera-ble formal education, it is unlikely that firms bear much of the training cost, and mobilityshould have net beneficial effects on industrywide performance.
4. For documentation in the case of Korea and an analysis of the nature of the policiesactually followed, see Pack and Westphal (1986).
5. In fact, as will be seen, the potential increase in output from improving the productivityof existing plants exceeds that obtainable from the proposed new plant. Proponents of thenew investment would, however, argue that manufacture of a different product, polyester-cotton blends, confers a benefit that must also be included when evaluating the project. Thisissue is addressed below.
6. This figure for the decline is based on meters of cloth produced, divided by total plantemployment. It is thus assumed that the plants were roughly balanced so that each was fairlyself-sufficient in producing yarn for its own weaving needs. In this case, production of clothprovides a good approximation of total mill output.
7. It is not possible to learn from existing studies how much of the low current productivityis attributable to insufficient product specialization. If excess product diversity is one sourceof low productivity, it is relatively easy to effect a solution in Tanzania, where most textileplants are owned by the government. The role of greater specialization is explicitly discussedbelow.
8. The discussion would be similar within the more conventional geometric framework thatdepicts imports and domestic production occurring simultaneously, with the tariff set to yielda domestic price below the supply-demand intersection. The made-to-measure tariff is usedbecause it portrays more accurately the current situation in the Philippines, the country forwhich the empirical analysis is carried out.
9. P2MZ equals the net cost imposed by the initial protective regime, namely, excess produc-tion cost plus the loss in comsumer surplus minus the increase in producer surplus.
10. Although, as depicted, domestic production would fall to zero, this result reflects aneffort to keep the geometry simple. Under present conditions some firms would survive theexposure to international competition.
11. A good example of the fears of weaker firms thwarting the introduction of liberalizationis provided by a recent account of Mexican efforts in this direction. See the Wall StreetJournal(1985).
12. See Scherer (1980), pp. 133-38, and Scherer and others (1975). Some of the literature onintraindustry specialization sheds some light on general questions but fails to address thespecific issues of interest in this study. See, for example, Grubel and Lloyd (1975).
13. New York Times, February 16, 1980, "U.S. Pricing Roils Europe Textile Makers'Examples of rationalization cartels are given by Scherer and others (1975), pp. 313-15. For adiscussion of European efforts at industrial rationalization in the nineteenth century, seeEncyclopedia of the Social Sciences (1934), s.v. "rationalization." and Landes (1969). For arecent study and many relevant citations, see Muller and Owen (1983).
14. Ad hoc arguments can be adduced on either side of the issue, and an empirical resolu-tion requires the estimation of hedonic demand functions that include specific characterisics,such as durability, ease of care, and comfort of various fabrics. As far as I know, no suchstudies have been carried out.
15. In spinning, the potential gains from improved choice of technique are minor.
NOTES 169
16. The benefit-cost ratio does not double when 100 percent rather than 50 percent ofbenefits are included, because in a few firms the increase in benefits still does not yield abenefit-cost ratio greater than unity; hence the benefits to these firms are not included in thesectorwide totals.
17. This statement assumes no loss to other firms of staff members trained in the program.18. The large decrease in B - C is not reflected in a commensurate decline in the benefit-
cost ratio, because the number of firms for which the prospective benefits outweighs costsdeclines, and it is assumed that the costs of augmenting productivity are not incurred by thosewhose prospective benefit-cost ratio is less than unity.
19. One of the firms whose prospective benefit-cost ratio is greater than unity has, on itsown initiative, already begun such a program, with initially impressive results.
20. This topic is also discussed in the following chapter.21. See, for example, OECD (1982) and other annual reviews as well. For a brief survey of the
magnitude of potential gains that may be realized in mergers, see Scherer (1980), pp. 33-38.
CHAPTER NINE
Conclusions
THIS BOOK set out to investigate two related issues, the appropriatechoice of technology and the productivity wit]h which specific tech-nologies are employed within developing countries. Before discussing pol-icy guidelines and the relevance of the evidence to broader issues oftechnology transfer, I present the main conclusions to be drawn from thedetailed empirical analysis.
The Choice of Technology
The determination of the appropriate capital-labor ratio for manufac-turing a given product has several components: the choice of machineryfrom the range of models that are currently manufactured, the choicebetween new and used machinery of the relevant iype, and the choice ofthe amount of labor to be used with whatever machinery is finally decidedupon. The empirical results confirm that none of these questions can beresolved simply by using the input coefficients supplied by machineryproducers or those for best-practice firms in developed countries. Neithercan one rely on input coefficients observed in operating developing coun-try plants, because these may obscure some cost-minimizing choices thatwould be relevant if greater productivity could be achieved in individualplants. Thus two alternative calculations are appropriate: the econom-ically efficient technology if current developing country productivity ismaintained and the efficient alternative if it were possible to obtain pro-ductivity that approaches best practice.
Three broad conclusions emerge from this book.- At both current and high productivity, new conventional equipment
offers a cost advantage over new machinery from either the highest or thelowest end of the capital-intensity spectrum; thus in weaving, both waterjet looms in the Philippines and semiautomatic loorns in Kenya are inferiorto conventional automatic looms. Radically new or very old designs arenot competitive within the economic environments studied, although in
170
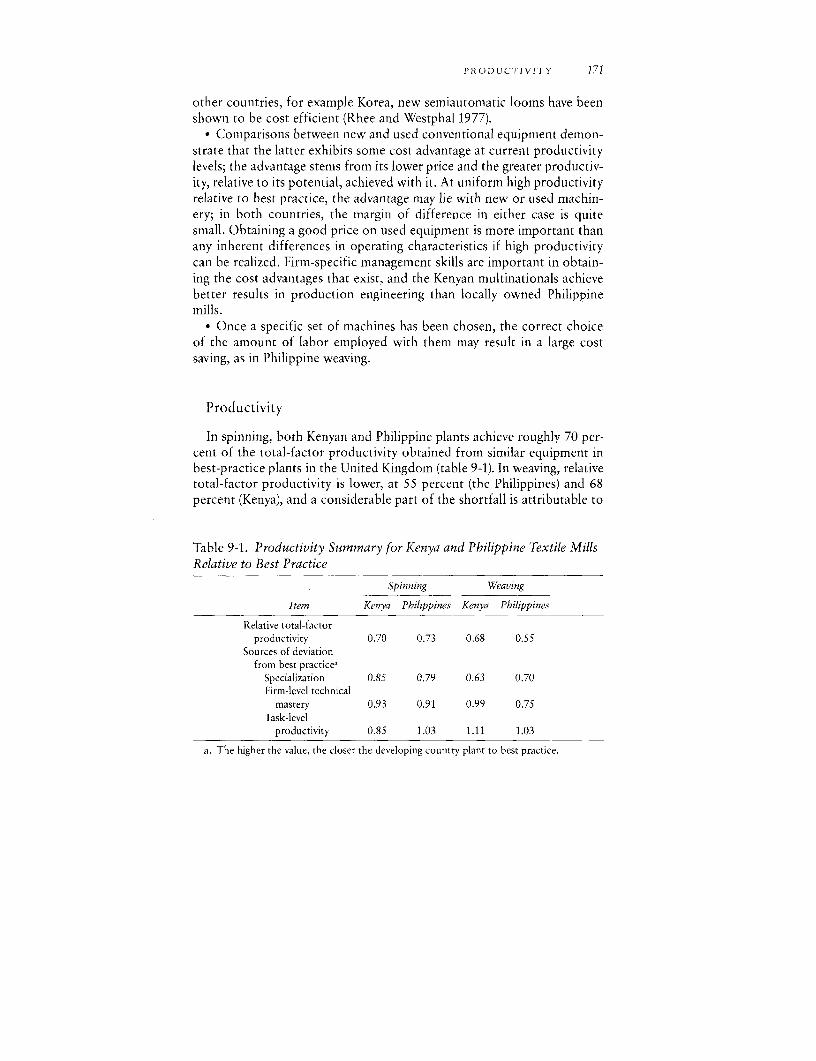
PRODUCTIVITY 171
other countries, for example Korea, new semiautomatic looms have beenshown to be cost efficient (Rhee and Westphal 1977).
* Comparisons between new and used conventional equipment demon-strate that the latter exhibits some cost advantage at current productivitylevels; the advantage stems from its lower price and the greater productiv-ity, relative to its potential, achieved with it. At uniform high productivityrelative to best practice, the advantage may lie with new or used machin-ery; in both countries, the margin of difference in either case is quitesmall. Obtaining a good price on used equipment is more important thanany inherent differences in operating characteristics if high productivitycan be realized. Firm-specific management skills are important in obtain-ing the cost advantages that exist, and the Kenyan multinationals achievebetter results in production engineering than locally owned Philippinemills.
* Once a specific set of machines has been chosen, the correct choiceof the amount of labor employed with them may result in a large costsaving, as in Philippine weaving.
Productivity
In spinning, both Kenyan and Philippine plants achieve roughly 70 per-cent of the total-factor productivity obtained from similar equipment inbest-practice plants in the United Kingdom (table 9-1). In weaving, relativetotal-factor productivity is lower, at 55 percent (the Philippines) and 68percent (Kenya), and a considerable part of the shortfall is attributable to
Table 9-1. Productivity Summary for Kenya and Philippine Textile MillsRelative to Best Practice
Spinning Weaving
item Kenya Philippines Kenya Philippines
Relative total-factorproductivity 0.70 0.73 0.68 0.55
Sources of deviationfrom best practiceJ
Specialization 0.85 0.79 0.63 0.70Firm-level technical
mastery 0.93 0.91 0.99 0.75Task-level
productivity 0.85 1.03 1.11 1.03
a. The higher the value, the closer the developing country plant to best practice.
172 CONCLUSIONS
inadequate product specialization. Firm-specific sources of low produc-tivity are more significant in weaving than in spinning, particularly in thePhilippines.
The empirical findings on productivity confirm results on productivitydifferences that have usually been established at more aggregate levelsemploying sectorwide averages rather than firm-level observations.' Theproductivity gap is attributable partly to intercountry differences in theextent of product specialization and partly to the absence of tech-nological mastery in a number of aspects of production engineering (table9-1). The failure of plants in the Philippines to achieve greater specializa-tion, despite the large number of textile firms and the low concentrationratio within the country, is consistent with difficulties experienced inother countries, including developed ones. International experience sug-gests that a liberal trade regime is a necessary but not sufficient conditionfor realizing the economies of product specialization.
Detailed analysis in chapter 7 of the variation in intercountry technicalperformance suggests a reason for the deviation between developed anddeveloping countries in a technically mature sector in which proprietaryinformation is relatively unimportant. The variation reflects the failure ofthe developing country firms to invest in the accumulation of sufficienttechnical and organizational skills to absorb fruitfully a considerableamount of freely available knowledge. Technological mastery is the out-come of purposeful efforts and expenditures and does not appear toaccrue costlessly simply as a result of accumulated past experience.
Guidelines for Policy
Chapter 8 presented benefit-cost ratios obtainable from productivity-enhancing projects. These projects must be part of a more general liber-alization effort that increases competitive pressures upon all firms in anindustry and perhaps on the industry relative to all other industries. It isenvisioned that tariffs on both the inputs and the products of the sectorwould be lowered, with the goal of reducing the effective rate of protec-tion to the same rate that applies to other sectors, a commonly accepteduniform level being 20 percent. The entire policy package should com-prise four elements: (1) an imminent change in tariff rates and other formsof protection on both inputs and outputs would be announced; (2) theavailability of collateral-backed loans for improving production engineer-ing would simultaneously be announced; (3) the only condition for loaneligibility would be a firm's agreement to engage in product specialization;
GUIDEI.JNES FOR POLICY 173
(4) loans for new equipment or rehabilitation of older equipment wouldbecome available at the end of a prespecified period.
The analysis presented in earlier chapters of the sources of low produc-tivity provides the basis for a specific set of recommendations about thesequence of liberalization measures. Before we embark upon a detaileddiscussion, it is worth asking whether productivity enhancement is neces-sary-why not simply liberalize and allow a competitive environment toeliminate inefficient firms from the industry? This may seem a particularlyattractive option, given the great quantitive importance of product diver-sity in increasing production costs in the textile sector. One of the moreprobable results of liberalization, it might be argued, is the natural realiza-tion of the benefits of greater specialization as firms strive to remaincompetitive.
Evidence demonstrating the desirability of a productivity-enhancingprogram in addition to liberalization was provided in table 8-2, where itwas shown that, when greater specialization is realized, the benefit-costratios from efforts to improve firm-level capabilities are, depending on theassumptions, 4.3 and 2.3. Few industrial loans to expand capacity offerthe high rates of return implied by these ratios.
A more complex reason for pursuing productivity improvement in-volves the politics of liberalization. As noted in chapter 8, there willinevitably be a number of losers from any liberalization effort. The pos-sibility of obtaining loans to improve firm-specific performance will giveall firms a chance to survive in a more competitive atmosphere and islikely to mute opposition to the reform. This feature is particularly impor-tant, given the well-known difficulty of mobilizing the diffused potentialbeneficiaries of liberalization to support the program. The argument isnot solely political, however. Public provision of information on how toimprove performance and the reduction of firm-level costs of acquiringinformation are socially desirable on the assumption that economies ofscale exist in the acquisition and dissemination of information.2
The program of liberalization and productivity enhancement envi-sioned here offers firms the opportunity to borrow from an industrialdevelopment bank to finance their efforts to augment productivity. It islikely that not all firms would take advantage of this offer. If collateralrequirements are imposed, only companies with some reasonable pros-pect of postliberalization competiveness would enter the program. Whilethe productivity-enhancing effort is being pursued, tariffs (or quantitativerestrictions) should be reduced, first on inputs, then on the final product.Typical components of earlier rehabilitation efforts-the financing ofspare parts and new equipment to break bottlenecks and of new machin-
174 CONCLUSIONS
ery to augment capacity-should be delayed until the very end of theeffort rather than being allowed to proceed concomitantly.
The first (temporally) component of a rehabilitation program should beto improve production engineering and task-level productivity by assign-ing individuals to a firm for sustained periods, as suggested in chapter 8.This process is likely to have its greatest impact if the addition of technicalpersonnel is not accompanied by a parallel attempt to rehabilitate theexisting equipment. Although such improvements may be necessary atsome point, the management of the firm is unlikely to be able to absorbsimultaneously the results of both nonembodied technology transfer andphysical rehabilitation; their independent effects may be confounded bythe potential beneficiaries. In particular, the introduction of new equip-ment to alleviate bottlenecks or the rehabilitation of older equipment maybe mistakenly viewed as the sole source of improved productivity. Thiscould encourage firms to believe (as many currently do) in the decisiverole of reequipment. The perception of the contribution of productionengineering and greater product specialization might therefore be lost,with a consequent diminution in future attention to both. Reequipment isappropriate only after the marginal gains from improving productivitywithout additional equipment is estimated to equal the marginal costs offurther such changes; moreoever, the necessary funds should be obtainedfrom conventional nonconcessionary financial markets rather than from anewly formed component of an aid program.
Before any new machinery is introduced, other macroscopic policiesshould be in operation to liberalize the trade regirne and to organize thestructure of production. The liberalization effort should be designed toreinforce the learning program by enabling firms to obtain inputs at worldprices. Firms would thus learn the extent to which they could becomecompetitive by moving toward best-practice productivity. Their improvedcompetitiveness should reinforce their desire to absorb the ongoing tech-nology transfer and should increase their confidence in their ability towithstand the gradual lowering of protection on their own output. To theextent that their existing equipment cannot make them competitive, evenat high productivity levels and even with inputs purchased at lower inter-national prices, some firms may face unpromising prospects. Recognitionof this threat will force them, early in the program, to reassess theirprospects of profitability in the period before loans for reequipmentbecome available. A fairly long transition period before these loans be-come available will encourage the scrapping of truly dated equipment. Incontrast, if reequipment begins after a short period, firms with eitherobsolete equipment (unit costs above world price even at best-practiceproductivity) or poor management may be willing to sustain short-term
GUIDELINES FOR POLICY 175
losses in the expectation that the promised machinery will soon savethem.
Policies to increase product specialization are particularly difficult toformulate. It is possible to do nothing explicit and to assume that liber-alization in both output and input markets, combined with improvedtechnical abilities of firms, will inevitably result in an appropriate degreeof interfirm product specialization. Unfortunately, as indicated earlier,there is little evidence on which to base such an optimistic prognosiseither in developed or developing country experience.3 Recently, thecountries of the European Economic Community engaged in cartelizationof their textile industries specifically to obtain greater specialization.
If there is to be an explicit concern with the range of products, thereare two policy options: (1) a large country such as the Philippines mightmanufacture the entire range of products, but each firm would produce avery small subset of yarns and fabrics; or (2) the entire industry mightspecialize and all firms would produce a similar, small range of products;the industry would thus be compelled to export and products not man-ufactured locally would have to be imported. The relative merits of eachoutcome will not be set forth here. The important issue is the strategy forrealizing a desirable industrial structure and the complementarity of thisstrategy with other policies.
The case in which each firm produces a different set of products is themore complex, the difficulty being how product allocation is to be de-cided. In principle, the firms can decide among themselves, basing theirdecisions on a presumptively superior knowledge of their own com-parative advantage across products. But firms that are currently operatingwell below best practice may not be able to predict correctly their ulti-mate relative costs for different products; better forecasts may not beavailable until they are fairly far along their learning curves. Because partof the advantage among products should reflect differences in equipment-embodied specifications, however, there is some basis for attempting todetermine relative costs early in the program. In any case, agreement on anarrowing of product range should be a prerequisite for a firm's participa-tion in any restructuring program. It also should occur at the beginning ofthe program, because a considerable part of the learning process couldprofitably concentrate on a small range of products.
The lower costs arising from increasing specialization should reinforcethe confidence that stems from improving firm-level productivity andlowering input prices toward world levels. The inevitable lowering ofprotection on firms' own output will be seen as less of a threat-but itshould be emphasized that it will be implemented to prevent monopolistic
176 CONCLUSIONS
rents from being earned in the domestic market because of a limitednumber of suppliers of any given product.
The need to encourage product specialization also militates against theearly provision of additional equipment or rehabilitation of the existingstock. The opportunities afforded by the product specificity of newequipment may deflect attention from raising productivity and towardobtaining machines that might allow rents to be earned in a particularmarket segment. Although the eventual reduction of tariffs on all prod-ucts should serve to deter firms from such behavior, past experience offailed liberalization efforts may make such a strategy particularly attrac-tive and may subvert the productivity improvemenit program.
More generally, although the precise details of any industry restructur-ing will depend on country-specific circumstances, including current mac-roeconomic performance, the provision of new machinery should be lowon the agenda of planned industrial policies. One of the most importantlessons of the past two decades of development history and analysis is therelatively minor role of simple physical capital accumulation. The evi-dence and analysis presented here and much current research confirmsthis conclusion.
Some Issues in the Transfer of Technology
Many of the empirical results described in this book are relevant inanalyzing the international transfer of technology (Mansfield and others1982; Rosenberg 1976, 1982). In particular, they are helpful for assessingthe cost of alternative modes of transfer (direct foreign investment, licens-ing, joint ventures, and turnkey plants) and the extent to which skills aretransmitted to local managers and workers.
Modes of Technology Transfer
One striking conclusion to be drawn from the data is the ability ofmultinational management teams to bring Kenyan firms relatively close tointernational best practice in production engineering and task-level pro-ductivity within a relatively short time. Nevertheless, to demonstrate thesocial profitability of direct foreign investment as a mode of technologytransfer, we must know something about its cost. It is at least theoreticallypossible that payments for foreign knowledge and management skills aresufficiently large to offset the relatively low production costs that theymake possible. Some social profitability criterion such as domestic re-source cost (DRC), corrected for factors beyond the firm's control (such as
THE TRANSFER OF TECHNOLOGY 177
product diversification), would have to be calculated for each firm toestablish the economic optimality of direct foreign investment.4 DRCS havenot been estimated in this book because the focus is on the determinantsof private behavior, given existing price structures. Even if standard DRC
calculations had been done, however, modifying them to incorporate thecosts of technology transfers would require a major independent study. Itis necessary to determine not only the nominal explicit costs (fixed feesand percentage of sales) but also the opportunity costs of restrictionssuch as the prohibition on exports to third markets.5
Although this study does not address these broader questions of eval-uating alternative modes of technology transfer, one important caution-ary lesson emerges: it is not sufficient to examine only the firms' realizedcost, productivity, or expanded DRCS where they are available. Because theperformance of companies will be affected by national and industry fac-tors that are beyond their control, a meaningful evaluation of past suc-cesses of technology transfer requires some form of disaggregation of theelements affecting productivity to permit a detailed analysis of those thatare truly controlled by the firm. Otherwise, a study might conclude thatlicensing or turnkey plants were inefficient and that an expensive localtechnology effort was warranted, when in fact the transfer was leading tohigh firm-specific and task-level productivity. Development of indigenouscapability might still be warranted, but it should be encouraged only afterconsideration of more finely honed measures of the success of alternativemethods of technological development. These considerations also applyto efforts to assess the validity of infant industry arguments. Firms thatstart from a position of firm-specific technical inferiority may close thegap between themselves and international best practice but may still beunable to compete in world markets because costs are raised by industryor national factors beyond their control. Analyses of the success of infantindustries have often neglected this dimension of their evolution.
Transfer of Skills to the Domestic Labor Force
In Kenya it appears that nationals have not acquired critical productionengineering skills, the capability to replicate existing plants, and the abil-ity to modify products or processes.6 Given Kenya's per capita income andthe current degree of importance to its economy of the generation ofadditional modern sector employment, the transfer of such skills is not amatter of immediate urgency. If technology acquisition costs have notbeen excessive, the cost performance of multinational corporations maybe all that is of interest. In countries with a larger stock of appropriatelyeducated workers and a greater base of industrial skills, however, the
178 CONCLUSIONS
transfer of additional technological capabilities will loom larger. Mean-while, evidence from the Philippines suggests that there is no simplecausal link between the nationality of ownership and the local absorptionof skills. As seen in chapters 5-7, there has been little domestic acquisi-tion of high-quality production engineering skills by locally owned firmsin the Philippines, despite several attempts by international agencies topromote transfers of this kind. The failure of previous modes of tech-nology transfer provides part of the basis for the precise form of theproductivity-enhancing project suggested in chapter 8.
The observations in Kenya and the Philippines suggest that inquiriesinto the determinants of local accumulation of technological capabilitywill have to go beyond simple dichotomies of ownership and toward morecomplex formulations. In particular, it will be necessary to specify theappropriate conditions for local absorption of technology and the meth-ods for effecting its transfer; furthermore, the economic desirability of atechnology transfer, compared with purely local efforts to accumulatesuch capabilities, must be carefully analyzed.
Notes
1. See, for example, the comparisons of the United States and the Philippines based onsectoral data from the national accounts in Pack (1984) and the references there to otherstudies of productivity. The differences in RTFP between the United States and the Philippinescalculated from secondary data sources are greater than those implied in this book using theUnited Kingdom-Philippine comparisons in chapter 5 and the United Kingdom-United Statescomparison in chapter 7. Given the problems of collecting accurate sectoral data, convertingexchange rates, and defining the sector, I have little doubt that the results reported in thisstudy are the more accurate ones.
2. For a detailed discussion of this issue in the context of industrial development strategies,see Pack and Westphal (1986).
3. Some tentative evidence is beginning to accumulate in the study of recent efforts towardliberalization in the Southern Cone. See, for example, Corbo and de Melo (1983).
4. If a high DRC were the result of large payments for technology, the activity might becomesocially profitable if a lower set of technology charges could be obtained. Skilled bargainingrather than improved productivity as a source of lower DRCS suggests one drawback to usingthis criterion as a definitive standard in this context.
5. A full evaluation would also require measurement of improvements in productivity overtime and detailed time series on performance characteristics used in this study. Use of timeseries requires an amplification of the DRC procedure. Research orn intertemporal productivitychanges at this level of detail has been undertaken by Katz and by others, but these interestingstudies surveyed by Katz (1982) have been concerned largely with the domestic generation oftechnology rather than with the desirability of alternative mechanisms of technology transfer.
6. For a discussion of these issues, see Dahlman and Westphal (1981) and Katz (1982).
References
Acharya, S. N. 1974. Fiscal/Financial Intervention, Factor Prices, and Factor Pro-portions: A Review of the Issues. World Bank Staff Working Paper 183.Washington, D.C.
Aitken, J. B. 1964. Automatic Weaving. Manchester, Eng.: Columbine Press.Alchian, A. 1959. "Costs and Outputs" In M. Abramovitz and others, eds., The
Allocation of Economic Resources. Stanford, Calif.: Stanford University Press.Amsalem, M. 1983. Technology Choice in Developing Countries: The Textile and
Pulp and Paper Industries. Cambridge, Mass.: MIT Press.Arrow, K. J. 1969. "Classificatory Notes on the Production and Transmission of
Technological Knowledge." American Economic Review, vol. 59, no. 2 (May),pp. 29-35.
Arrow, K. J., H. B. Chenery, B. S. Minhas, and R. M. Solow. 1961. "Capital-LaborSubstitution and Economic Efficiency.' Review of Economics and Statistics, vol.43 (August), pp. 225-50.
ATIRA (Ahmedabad Textile Industry's Research Association). 1977. Modernizationand Renovation in Textile Industry. Ahmedabad.
Baer, Werner, and Michel Herve. 1966. "Employment and Industrialization inDeveloping Countries" Quarterly Journal of Economics, vol. 80, no. 1 (Febru-ary), pp. 88-107.
Behrman, J. R. 1982. "Country and Sectoral Variations in Manufacturing Elas-ticities of Substitution between Capital and Labor" In A. 0. Krueger, ed., Tradeand Employment in Developing Countries. Chicago: University of ChicagoPress.
Bell, M., B. Ross-Larson, and L. E. Westphal. 1984. "The Cost and Benefit ofInfant Industries" Journal of Development Economics, vol. 16, no. 2 (October),pp. 101-28.
Bentancourt, Roger, and Christopher Clague. 1981. Capacity Utilization: A The-oretical and Empirical Analysis. Cambridge, Eng.: Cambridge University Press.
Bhagwati, J. 1978. Foreign Trade Regimes and Economic Development: Anatomyand Consequences of Exchange Control Regimes. Cambridge, Mass.: Ballinger.
Byrd, William, Gene Tidrick, and others. 1984. Recent Chinese Economic Reform:Studies of Two Industrial Enterprises. World Bank Staff Working Paper 652.Washington, D.C.
Caves, D. W., L. Christensen, and W. E. Diewert. 1982. "Multilateral Comparisonsof Output, Input, and Productivity Using Superlative Index Numbers?' Eco-nomic Journal, vol. 92, no. 365 (March), pp. 73-86.
179
180 REFERENCES
Caves, Richard E. 1984. "Scale, Openness, and Productivity in ManufacturingIndustries' In Richard E. Caves and Lawrence B. Krause, eds., The AustralianEconomy: A View from the North. Washington, D.C.: Brookings Institution.
Chenery, H. B. 1953. "Process and Production Functions from Engineering Data"In W. Leontief and others, Studies in the Structure of the American Economy.New York: Oxford University Press.
Chin, R. 1965. Management, Industrialization, and Trade in Cotton Textiles. NewHaven, Conn.: College and Universities Press.
Christensen, L. R., D. Cummings, and D. W. Jorgenson. 1980. "Relative Productiv-ity Levels, 1947-73: An International Comparison" In J. Kendrick and B. Vac-cara, eds., New Developments in Productivity Measurement and Analysis.Chicago: University of Chicago Press.
Cooper, Charles, and Raphael Kaplinsky. 1975. "Second-hand Equipment in De-veloping Countries: Jute Processing Machinery in Kenya" In Ajit Bhalla, ed.,Technology and Employment in Industry. Geneva: International Labour Office.
Corbo, V., and J. de Melo. 1983. "Measuring Technical Efficiency: A Comparisonof Alternative Methodologies with Census Data.' Washington, D.C.: WorldBank, Development Research Department; processed.
Corden, W. M. 1974. Trade Policy and Economic Welfare. Oxford, Eng.: OxfordUniversity Press.
Cortes, Mariluz, and Peter Bocock. 1984. North-South Techhnology Transfer: ACase Study of Petrochemicals in Latin America. Baltimore, Md.: Johns HopkinsUniversity Press.
Dahlman, C. J., and L. E. Westphal. 1981. "The Meaning of Technological Masteryin Relation to Transfer of Technology." Annals of the American Academy ofPolitical and Social Science, vol. 458 (November), pp. 12-26.
Daniels, Mark R. 1969. "Differences in Efficiency among Industries in DevelopingCountries" American Economic Review, vol. 49, no. 1 (March), pp. 159-71.
de Vries, Barend A., and Willem Brakel. 1983. Restructuring of ManufacturingIndustry: The Experience of the Textile Industry in Pakistan, Philippines, Por-tugal, and Turkey. World Bank Staff Working Paper 558. Washington, D.C.
Duxbury, V., and G. R. Wray. 1962. Modern Developments in Weaving Machinery.Derbyshire, Eng.: Columbine Press.
ECLA (United Nations Economic Commission for Latin America). 1951. "LabourProductivity of the Cotton Textile Industry in Five Latin American Countries."New York: United Nations, Department of Economic Affairs.
. 1965. Economies of Scale in the Cotton Spinning and Weaving Industry.New York: United Nations.
Enrick, Norbert L. 1978. Industrial Engineering Manual for the Textile Industry.2d ed. Huntington, N.Y.: Krieger.
1980. Management Control Manual for the Textile Industry. 2d ed. Hunt-ington, N.Y.: Krieger.
Fiori, Louis A. 1966. "Blending'" In D. S. Hamby, ed., The American CottonHandbook, 3d ed. New York: Wiley.
REFERENCES 181
Forsund, E R., C. A. Knox-Lovell, and P. Schmidt. 1980. "A Survey of FrontierProduction Functions and of Their Relationship to Efficiency Measurement"Journal of Econometrics, vol. 13, no. 1 (May), pp. 27-57.
Freeman, H. J., and J. V. Jucker. 1981. "Experimental Design for Comparing theProductivity of Traditional and Innovative Work Organization.' In N. R. Adamand A. Dogramaci, eds., Productivity Analysis at the Organizational Level.Boston, Mass.: Martinus Nijhoff.
Gaude, J. 1975. "Capital-Labor Substitution Possibilities: A Review of EmpiricalEvidence: In Ajit Bhalla, ed., Technology and Employment in Industry. Geneva:International Labour Office.
Grills, R. 1978. "The Spinning Costs of Polyester-Cotton Yarns" Shirley InstituteBulletin, vol. 51, no. 4, pp. 81-84.
Grubel, H. G., and P. J. Lloyd. 1975. Intra-Industry Trade. New York: Wiley.Hagen, E. E. 1975. The Economics of Development. Homewood, Ill.: Irwin.Hamby, D. S., ed. 1966. The American Cotton Handbook. 2 vols. 3d ed. New
York: Wiley.Hillier, E S., and G. J. Lieberman. 1967. Introduction to Operations Research. San
Francisco, Calif.: Holden Day.Hirschman, A. 0. 1958. The Strategy of Economic Development. New Haven,
Conn.: Yale University Press.Hirshleifer, J. 1962. "The Firm's Cost Function: A Successful Reconstruction?"
Journal of Business, vol. 35, no. 3 (July), pp. 235-55.Horton, Susan, and Timothy King. 1981. Labor Productivity: Un Tour d'Horizon.
WVorld Bank Staff Working Paper 497. Washington, D.C.ILO (International Labour Office). 1972. Work Study in the Textile Industry.
Geneva.Jeremy, D. J. 1981. Transatlantic Industrial Revolution: The Diffusion of Textile
Technologies between Britain and America, 1790-1830s. Cambridge, Mass.: MIT
Press.Katz, Jorge. 1982. "Technology and Economic Development: An Overview of
Research Findings" In M. Syrguin and S. Teitel, eds., Trade, Stability, Tech-nology, and Equity in Latin America. New York: Academic Press.
Kilby, P. 1962. "Organization and Productivity in Backward Economies." QuarterlyJournal of Economics, vol. 76, no. 305 (May), pp. 303-10.
Koh, S. J. 1966. Stages of Industrial Development in Asia: A Comparative Historyof the Cotton Industry in Japan, India, China, and Korea. Philadelphia: Univer-sity of Pennsylvania Press.
Kravis, 1. B. 1976. "A Survey of International Comparisons of Productivity." Eco-nomic Journal, vol. 86, no. 341 (March), pp. 1-44.
Krugman, P. 1981. "Intraindustry Specialization and the Gains from Trade.'Journalof Political Economy, vol. 89, no. S (October), pp. 959-73.
Landes, David. 1969. The Unbound Prometheus. Cambridge, Eng.: CambridgeUniversity Press.
Lazonick, W. 1981. "Factor Costs and the Diffusion of Ring Spinning in BritainPrior to World War I " Quarterly Journal of Economics, vol. 95, no. 1 (February),pp. 89-109.
182 REFERENCES
Leff, N. H. 1978. "Industrial Organization and Entrepreneurship in DevelopingCountries: The Economic Groups.' Economic Development and CulturalChange, vol. 28, no. 4 July), pp. 661-76.
Leibenstein, H. 1976. Beyond Economic Man. Cambridge, Mass.: Harvard Univer-sity Press.
. 1978. General X-Efficiency Theory and Economic Development. NewYork: Oxford University Press.
Lord, Peter R. 1981. Economics, Science, and Technology of Yarn Production.Manchester, Eng.: Textile Institute.
Lord, Peter R., and M. H. Mohamed. 1976. Weaving: Conversion of Yarn to Fabric.Durham, Eng.: Merrow.
Lucas, Robert E. B. 1984. "On the Theory of DRC Criteria." Journal of Develop-ment Economics, vol. 14, no. 3 (April), pp. 407-18.
Mansfield, E., A. Romeo, M. Schwartz, D. Teece, S. Wagner, and P. Brach. 1982.Technology Transfer, Productivity, and Economic Policy. New York: Norton.
Marks, R., and A. T. C. Robinson. 1976. Principles of Weaving. Manchester, Eng.:Textile Institute.
Marsh, R. M., and H. Mannari. 1976. Modernization and the Japanese Factory.Princeton, N.J.: Princeton University Press.
Martin, J. P. 1978. "X-Inefficiency, Managerial Effort, and Protection" Econom-ica, vol. 45, no. 179, pp. 273-86.
Mlawa, Hasa Mfaume. 1983. "The Acquisition of Technology, Technological Ca-pability, and Technical Change: A Study of the Textile Industry in Tanzania.'Ph.D. diss., University of Sussex.
Moore, W. E. 1951. Industrialization and Labor. Ithaca, N.Y.: Cornell UniversityPress.
Morawetz, David. 1974. "Employment Implications of Industrialization in De-veloping Countries-A Survey." Economic Journal, vol. 84, no. 335 (September),pp. 491-542.
. 1976a. "Elasticities of Substitution in Industry: What Do We Learn fromEconometric Estimates?" World Development, vol. 4, no. 1 (January), pp. 11-15.
. 1976b. "The Electricity Measure of Capital Utilization" World Develop-ment, vol. 4, no. 8 (August), pp. 643-53.
.1981. Why the Emperor's New Clothes Are Not Made in Colombia: A CaseStudy in Latin American and East Asian Manufactured Exports. New York:Oxford University Press.
Muller, J., and N. Owen. 1983. "Economic Effects of Free Trade in ManufacturedProducts with the EEC." Berlin: Deutsches Institut fur Wirtschaftsforschung.
Nelson, R. R. 1981. "Research on Productivity Growth and Productivity Dif-ferences: Dead Ends and New Departures." Journal of Economic Literature, vol.19, no. 3 (September), pp. 1029-64.
Nelson, R. R., and S. G. Winter. 1982. An Evolution Theory of Economic Change.Cambridge, Mass.: Harvard University Press.
Nerlove, M. 1967. "Recent Empirical Studies of the CES and Related ProductionFunctions." In M. Brown, ed., The Theory and Empirical Analysis of Produc-tion. New York: Columbia University Press.
REFERENCES 183
Nishimizu, M., and J. M. Page. 1982. "Total Factor Productivity Growth, Tech-nological Progress, and Technical Efficiency Change: Dimensions of Productiv-ity Change in Yugoslavia, 1965-78." Economic Journal, vol. 92, no. 367(December), pp. 920-36.
Nishimizu, M., and S. Robinson. 1984. "Trade Policies and Productivity Change inSemi-Industrialized Countries" Journal of Development Economics, vol. 16, no.1-2 (September-October), pp. 177-206.
OECD (Organisation for Economic Co-operation and Development). Various years."Competition Policy" Paris.
Olson, Mancur. 1965. The Logic of Collective Action. Cambridge, Mass.: HarvardUniversity Press.
Ormerod, A. 1979. Management of Textile Production. London: Butterworths.Pack, H. 1975. "The Choice of Technique and Employment in the Textile Indus-
try." In Ajit Bhalla, ed., Technology and Employment in Industry. Geneva: Inter-national Labour Office.
-_____ 1981. "Fostering the Capital Goods Sector in LDCS." World Development,vol. 9, no. 3 (March), pp. 227-50.
.1982a. "Aggregate Implications of Factor Substitution in Industrial Proc-esses." Journal of Development Economics, vol. 11, no. 1 (August), pp. 1-38.-_____ 1982b. "Productivity during Industrialization: Some Latin American Evi-
dence" In Frances Stewart and Jeffrey James, eds., The Economics of NewTechnology in Developing Countries. Boulder, Colo.: Westview.-_____. 1984. "Total Factor Productivity and Its Determinants: Some Interna-
tional Comparisons" In G. Ranis and R. West, eds., Essays Presented to LloydReynolds. Boulder, Colo.: Westview.
- Forthcoming. "Industrialization and Trade." In Hollis B. Chenery and T.N. Srinivasan, eds., Handbook of Development Economics. Amsterdam: North-Holland Press.
Pack, H., and J. R. Pack. 1977. "Urban Land-Use Models: The Determinants ofAdoption and Use." Policy Sciences, vol. 8, no. 1 (March), pp. 79-101.
Pack, H., and Larry E. Westphal. 1986. "Industrial Strategy and TechnologicalChange: Theory versus Reality" Journal of Development Economics vol. 22, no.1 June), pp. 87-128.
Page, J. M. 1980. "Technical Efficiency and Economic Performance: Some Evi-dence from Ghana? Oxford Economic Papers, vol. 32, no. 2 (July), pp. 319-39.
Philippines, Interagency Technical Subcommittee. 1978a. "A Technical Survey ofthe Philippine Spinning Industry" Manila; processed.
.1978b. "Textile Industry Status.? Manila; processed.Philippines, Board of Investments. 1979. "The Philippine Textile Industry" Ma-
nila; processed.Pickett, J., and R. Robson. 1981. The Choice of Technology in the Production of
Cotton Cloth. Edinburgh: Scottish Academic Press.Pratten, C. E 1976. A Comparison of the Performance of Swedish and United
Kingdom Companies. Cambridge, Eng.: Cambridge University Press.
184 REFERENCES
Ranis, G. 1973. "Industrial Sector Labor Absorption." Economic Development andCultural Change, vol. 21, no. 3 (April), pp. 387-408.
Ranis, G., and Gary M. Saxonhouse. 1978. "Technology Choice, Adaptation, andthe Quality Dimension in the Japanese Cotton Textile Industry." In Japan'sHistorical Development Experience and the Contemporary Developing Coun-tries: Issues for Comparative Analysis. Tokyo: International Development Cen-ter of Japan.
Rhee, Y. W., and L. E. Westphal. 1977. "A Micro-econometric Investigation ofChoice of Technique" Journal of Development Economics, vol. 4, no. 3 (Sep-tember), pp. 205-38.
Rice, A. K. 1958. Productivity and Social Organization: The Ahmedabad Experi-ment. London: Tavistock.
Rosenberg, N. 1976. Perspectives on Technology. Cambridge, Eng.: CambridgeUniversity Press.
. 1982. Inside the Black Box: Technology and Economics. Cambridge, Eng.:Cambridge University Press.
Saxonhouse, Gary M. 1974. "A Tale of Japanese Technological Diffusion in theMeiji Period." Journal of Economic History, vol. 34, no. 1 (March), pp. 149-65.
. 1976. "Country Girls and Communications among Competitors in theJapanese Cotton-Spinning Industry." In Hugh Patrick, ed., Japanese Indus-trialization and Its Social Consequences. Berkeley: University of CaliforniaPress.
. 1978. "The Supply of Quality Workers and the Demand for Quality inJobs in Japan's Early Industrialization" Explorations in Economic History, vol.15, no.1 (January), pp. 40-68.
Saxonhouse, Gary, and Gavin Wright. 1983. "Two Forms of Cheap Labor inTextile History." In Gary Saxonhouse and Gavin Wright, Research in EconomicHistory, Supplement 3: Technique, Spirit, and Form in the Making of the Mod-ern Economies: Essays in Honor of William N. Parker. Greenwich, Conn.: JaiPress.
Scherer, F M. 1980. Industrial Market Structure and Economic Performance. Chi-cago: Rand McNally.
Scherer, E M., Alan Beckenstein, Erich Kaufer, and R. Dennis Murphy. 1975. TheEconomics of Multi-Plant Operation. Cambridge, A/Mass.: Harvard UniversityPress.
Sen, A. K. 1968. Choice of Techniques. 3d ed. New York: Kelley.Stewart, Frances. 1974. "Technology and Employment in LDCS." In E. Edwards,
ed., Employment in Developing Nations. New York: Columbia University Press.. 1975. "Manufacture of Cement Blocks in Kenya" In Ajit Bhalla, ed.,
Technology and Employment in Industry. Geneva: International Labour Office..1977. Technology and Underdevelopment. Boulder, Colo.: Westview.
Stifel, L. D. 1963. "The Textile Industry: A Case Study of Industrial Developmentin the Philippines." Ithaca, N.Y.: Cornell University, Department of AsianStudies.
REFERENCES 185
Stigler, George J. 1976. "The Xistence of X-Efficiency." American Economic Re-view, vol. 66, no. 1 (March), pp. 213-16.
Subramanian, T. A., and A. R. Garde. 1974. End Breaks in Spinning. Ahmedabad:Ahmedabad Textile Industry's Research Association (ATIRA).
Taylor, Frederick W. 1911. The Principles of Scientific Management. New York:Harper.
Teece, D. 1976. The Multinational Corporation and the Resource Cost of Interna-tional Technology Transfer. Cambridge, Mass.: Ballinger.
Textile Council. 1969. Cotton and Allied Textiles. 2 vols. Manchester, Eng.Timmer, C. Peter. 1971. "Using a Probabilistic Frontier Production Function to
Measure Technical Efficiency" Journal of Political Economy, vol. 79, no. 4(July-August), pp. 776-94.
UNIDO (United Nations Industrial Development Organization). 1967a. "Report ofthe Expert Group Meeting on the Selection of Textile Machinery." Vienna.
_____. 1967b. "Technological and Economic Aspects of Establishing TextileIndustries in Developing Countries" Vienna.
_____. 1972a. "Quality Control in the Textile Industry." New York: UnitedNations.
___ . 1972b. "Final Report to the Philippine Textile Research Institute." Ma-nila: UNIDO; processed.
United Nations. 1953. Handweaving in the Philippines. New York: UN TechnicalAssistance Program.
Vernon, Raymond. 1966. "International Investment and International Trade in theProduct Cycle." Quarterly Journal of Economics, vol. 80 (May), pp. 190-206.
Wall Street Journal. 1985. "Mexican Industry Is Opposing Plan That Would OpenMexico to Imports." April 9, p. 35.
Westphal, Larry E., Yung W. Rhee, and Garry Pursell. 1981. Korean IndustrialCompetence: Where It Came From. World Bank Staff Working Paper 469.Washington, D.C.
Westphal, L. E., L. Kim, and C. J. Dahlman. 1985. "Reflections on Korea's Acquisi-tion of Technological Capability." In Nathan Rosenberg and Claudio Frischtak,eds., International Technology Transfer. New York: Praeger.
White, L. J. 1978. "The Evidence on Appropriate Factor Proportions for Man-ufacturing in Less Developed Countries: A Survey." Economic Development andCultural Change, vol. 27, no. 1 (October), pp. 27-60.
Williams, David. 1975. "National Planning and the Choice of Technology: TheCase of Textiles in Tanzania." Ph.D. diss., Harvard School of BusinessAdministration.
Winston, Gordon C. 1973. "The Theory of Capacity Utilization and Idleness."Journal of Economic Literature, vol. 21, no. 4 (December), pp. 1301-20.


INDEX 193
performance of, 120-22; production Yarn breakage, 20-21, 24, 25, 59, 60,skills and, 110, 115; productivity 105-6, 108differentials and, 41,111, 112,114, Yarn comparisons, 30; best practice115; ratio to equipment, 75; quality and, 56; in Kenya, 73, 74control and, 109; task-level Yarn production: blending and, 45;productivity and, 47, 49; technology equipment and, 16; spinning and,transfer and, 177-78. See also 12-22; twist per inch and, 58Technicians Yarn quality, 20-21, 24, 60, 100-1,
World Bank, 56,112,152 108, 110, 118-19; blending and, 104-Wright, Gavin, 29 5, 117-18
The most recent World Bank publications are described in the catalog NewPublications, which is issued in the spring and fall of each year. The completebacklist of publications is shown in the annual Index of Publications, whichcontains an alphabetical title list and indexes of subjects, authors, and countriesand regions; it is of value principally to libraries and institutional purchasers. Thecontinuing research program is described in The World Bank Research Program:Abstracts of Current Studies, which is issued annually. The latest edition of each isavailable from Publications Sales Unit, The World Bank, 1818 H Street, N.W.,Washington, D.C. 20433, U.S.A., or from Publications, The World Bank, 66,avenue d'1lna, 75116 Paris, France.
Index
Analytic model, 7-9; and best Blending of fiber, 45, 104-5, 117-18practice, 37-38, 39, 47-51, 63
Capacity utilization, 42Benefit-cost ratio, 131, 172, 173; Capital: best practice and, 61-63; in
defining benefits and, 164; Kenya, 72, 75; excess, 47; finishedPhilippine analysis and, 152, 161-67; fabrics and, 32; spinning and, 61-62;project design and, 157-61 weaving and, 62-63
Best practice: analytic model and, 7; Capital-labor ratio, 1, 41; analyticcapital and labor inputs and, 39, 40, model and, 8; best practice and, 61-61-63; coefficients of, 37-38, 39, 63; international comparisons of,47-51, 63; elasticity of substitution 139, 140-41; in Kenya, 72, 75; loomsand, 50, 51-52, 63, 101; equipment and, 25; project design and, 155; forand, 36-38, 39; firms and, 45-46, spinning, 30, 140-41; for weaving,48, 49, 177; industrialization and, 31, 32; yarn quality and, 20-21153; intracountry cost comparisons Chenery, H. B., 36and, 53-55; Kenyan spinning and, Cloth production. See Weaving71-76; Kenyan weaving and, 76-80; Cobb-Douglas production function,looms and, 51, 59-60; national 35, 52, 63, 96, 99, 139, 140economy and, 42; Philippine Coefficients: for best-practice, 37-38,spinning and, 87, 96-98; Philippine 39, 40, 49-51; for project design,weaving and, 98-101; productivity- 151, 163depressing factors and, 55-60; Comparative analysis. See Firms;productivity in Kenya and Productivity differentials; Spinning;Philippines and, 41-47, 50, 57, 60, Weaving61-62, 63, 171; product Competition, 3, 50, 166, 173; forspecialization and, 43-45; relative Kenyan textile industry, 80-81; fortotal-factor productivity and, 48- Philippine textile industry, 101-2;49; returns to scale and, 52-53; productivity differentials and, 115;shortfall relative to, 17; spinning productivity and, 154-55, 157, 162.and, 37, 39-40, 51, 56-59, 61-62; See also Tradetariffs and quota barriers and, 3; Constant elasticity of substitutiontask-level productivity and, 46-47; (cEs), 35, 52, 63, 101, 139technology and, 36-38, 50, 176; Consultants, 154weaving and, 40-41, 59-60, 62-63 Corden, W. M., 120
187
188 INDEX
Cost comparisons: for equipment, 61- production function and, 21-22,62; among firms, 53-55; for power, 26-27; productivity and, 127, 137,63 141, 170-71, 174, 176; project design
Cost-effectiveness of project design, and, 6; ratio to workers, 75;155-57 spinning and, 12-15, 17-20, 21-22;
Cost minimization, 166; productivity technology choice and, 1-2; weavingdifferentials and, 110, 116-23, 131; and, 24-25, 26-27; yarn breakageyarn quality and, 20-21 and, 20-21, 24, 25, 59; yarn
Costs: administrative, 167; of domestic production and, 16. See alsoresources, 176, 177; of equipment, Maintenance of equipment; Spare54, 61-62, 109-10; intraindustry parts; Technologydifferences in, 127; in Kenya, 69, European Economic Community, 17570-71, 79, 80, 81; of maintenance, Expatriates, 69, 11462; in Philippines, 84, 85-91, 93, 96, Exports, 44, 50; Kenyan textile sector98; production runs and, 27-28, 44, and, 68, 80-81; Philippine textile45, 56; technology transfer and, sector and., 98176, 177; variation in weaving, 67
Cotton textile industry as study Factor substitution: spinning and, 18-choice, 6-7 20; weaving and, 25-26
Cotton textile production. See Fiber blending, 45, 104-5, 117-18Production of cotton textiles Fiber purchasing, 110
Fiber quality, 118-19Demand (domestic), 44, 167 Firms: best practice and, 45-46, 48,Design. See Project design 49; cost comparisons among 53-55;Developing countries, 3-4, 103, 166. in Kenya, 68, 70; in Philippines,
See also specific countries 162-67; productivity differencesDomestic demand, 44,167 among, 128-32; technicalDomestic resource costs. See Costs knowledge and, 129-31, 146-47;Drawing process, 12, 106 technology and, 126-28
Flaws during textile production, 112
Economies of scale, 52-53 Foreign investment, 176, 177. See alsoEfficiency, 17, 166; factor substitution Investment decisions
(spinning) and, 19-20Elasticity of substitution, 35, 52, 63, Hong Kong, .142,144
101, 139; best practice and, 50, 51- Humidity control, 37, 111, 11652, 63, 101
Electricity costs, 63, 116 Imports, 79, 157Employment, 47, 49. See also Workers Import substitution, 44Engineering standards, 35 Improvement programs. See ProjectEquipment: best practice and, 36-38, design
39; cost comparisons for, 54, 61-62, Incentive payment system, 49, 112109-10; defined, 7; factor India, 25, 107-8, 124, 138, 142, 152substitution and, 19-20, 25-26; in Industrialization, 138; best practiceKenya, 68-71, 76-80; in Philippines, and, 15385-88, 90-91, 92-94, 96-101; Industrial projects. See Project design
INDEX 189
Industrial strategy, 5-6, 160-61, 177 62; technology choice and, 171; forIndustry improvements, 162-64, 166 weaving, 62-63Inefficiency, 166; spinning and, 17-18 Laps of cotton, 12, 105, 111Infant industry strategy, 160-61, 177 Learning program (productivity-Inflation, 123 enhancing), 159, 160-61, 174International Labour Office (lLO), 152 Leibenstein, H., 1Inventory: production for, 44, 45, 73, Liberalization of trade regime, 76, 157,
100; spare parts and, 119-20, 147, 158-60, 165, 172, 173157; steady state, 118 Licenses, 153, 154
Investment: decisions about, 131; Loans, 172-73, 174foreign, 176, 177; in Philippines, 90- Looms, 136, 144; best practice and, 51,91; project design and, 155-57, 164, 59-60; capital-labor ratio and, 25;166 defining types of, 7; economic merit
of, 25-26; efficiency of, 23-24;Japan, 138, 142 fabric comparisons and, 31-32;Job opportunities, 47, 49 Indian experiment with, 152; in
Kenya, 67, 70-71, 76, 79; laborKenya, 3, 7, 35, 108, 111, 122, 127, 128, requirements and, 26, 27; modern
162, 171; best-practice productivity technology and, 95; new types of,and, 41-47, 50, 57, 60, 61-62, 63, 170; in Philippines, 84, 91-94, 99,171; best-practice spinning and, 71- 101; productivity differentials and,76; best-practice weaving and, 76- 108, 109; weaving and, 22, 24. See80; capital-labor ratio and, 8; also Weavingcompetitiveness in internationaltrade, 80-81; costs in, 69, 70-71, Machinery. See Equipment79, 80, 81; equipment in, 68-71, 76- Machine settings, 105-680; industrial strategy in, 5;performance gaps and, 116; prices Maintenance of equipment, 55,135;in, 68, 69, 80-81; production runs costs and, 62; i Kenya, 79;and, 28; spare parts and, 124; productivity differentials and, 106-spinning in, 23, 68-70; technology 8, 112transfer and, 4, 177, 178; textile Management mobility (Philippines),exports and, 68, 80-81; weaving in, 15323, 70-71 Management theory, 147-48
Korea, Republic of, 25, 153 Managers, 94; foreign, 5; in Kenya, 68,Kravis, I. B., 2 69; in Philippines, 98, 100;
productivity differentials and, 105,
Labor. See Workers 110-15; technology choice and, 171Labor legislation, 42 Mill characteristics, 112Labor productivity, 2, 141 Mlawa, H. M., 154Labor requirements: best practice and, Model: analytic, 7-9; production, 126
36, 39, 40, 61-63; excess, 47;finished fabrics and, 32; in Kenya, National economy, 4272, 75, 81; loom type and, 26, 27; in Nelson, R. R., 49, 121, 147Philippines, 15, 96; for spinning, 61- New product introduction, 161
190 INDEX
Organizational behavior, 147-48 and, 12-15; total-factor productivityOrganizational knowledge, 129-31, and, 24-25: weaving and, 22-23
135, 136, 147, 152 Production function: best practiceand, 35, 37,, 51-52, 63, 96, 99;
Pakistan, 142, 144 efficiency changes and shifts in, 17;Parameter values, 63 spinning and, 21-22; weaving and,Payment incentives, 49, 112 26-27Philippines, 3, 7, 35, 112, 118, 119, 121, Productivity: ranalytic model and, 8-9;
127, 128, 154, 171; benefit-cost ratio benefit-cost ratio i Philppines and,and, 152, 161-67; best-practice 152, 161-67; competition and, 154-productivity and, 41-47, 50, 57, 60, 55, 157,162; equipment and, 127,61-62, 63, 171; best-practice 137, 141, 170-71; industrial strategyspinning and, 87, 96-98; best- and, 5-6; production routines and,practice weaving and, 98-101; 103; product specialization and, 27-cprtacticeo rtoad ;29; project design and, 151; incapital-labor ratio and, 8; spinning, 12-22; technology choice
tradet 101-2 costs in 84 85-91 93 and, 3, 126; in weaving, 22-27. Seetrde 10-2 cot in, 84 8591 ' also Relative total-factor96, 98; cotton fiber in, 110; . .equipment in, 85-88, 90-91, 92-94, productivity; Task-level
industrial strategy i, 5 v productivity; Total-factor96-101; dustral strategyproductivitmanagers in, 98, 100, 153; Productivity-depressing factors, 55-60performance gaps and, 116; Productivity clifferentials amongproduction runs and, 28; roving and textile firms: blending and, 104-5,spinning time in, 15; spare parts and, 117-18; comparing Kenya and124; spinning in, 23, 85-91, 96-98; Philippines and, 171-72; costtechnology transfer and, 4, 178; minimizaticn and, 116-23; cottontextile exports and, 98; weaving in, fiber purchasing and, 110; cross-23, 91-94, 98-101, 161 country, 41-53; in developing
Pickett, J., 50 countries, 3-4, 103; fiber qualityPirns, 111 and, 118-19; humidity control and,Planning (strategic production), 113 111; lap weights and, 111; looms and,Plant size (returns to scale), 52-53 108, 109; machine type and vintagePolicy guidelines, 172-76 and, 109-10; maintenance and, 106-Power costs, 63, 116 8, 112; managers and, 105, 110-15;Prices, 138, 175; in Kenya, 68, 69, mill characteristics and, 112;
80-81 organizational basis for, 112-16;Production of cotton textiles: analytic poor performance persistence and,
model of, 7-9; flaws during, 112; for 120-22; prciduction flaws and, 110-inventory, 44, 45, 73, 100; in Kenya, 15; profits and costs and, 122-23;68-70, 71-76, 77-80; loom quality conitrol and, 109; spare partsefficiency and, 23-24; output and, 108, 111, 114, 119-20, 123-24;quality and factor substitution and, spinning and, 104-8, 110, 111-12,25-26; product specification and, 117-18, 171; strategic planning and,29-32; routines for, 103; spinning 113; wage incentives and, 112; waste
INDEX 191
material and, 111; weaving and, 108- Retailers, 449, 111-12, 171; weight variations (in Republic of Korea, 25, 153spinning) and, 105-6; workers and, Returns to scale, 52-53111, 112, 114, 115 Rhee, Y. W., 30
Productivity improvement policy Risk aversion, 43-44guidelines, 172-76. See also Project Robinson, R., 50design Roving process, 14
Product specialization, 96, 132, 147,167; benefit-cost analysis (project Saxonhouse, Gary, 29, 30design) and, 157, 160, 164, 165, 166; Scale, economies of, 52, 53best practice and, 43-45; policy Setup time and costs, 28and, 172-76; productivity and, 27- Social profitability, 176-7729, 172; spinning and, 56 Spare parts, 136; inventory for, 119-20,
Product specification, 29-32 147,157; in Kenya, 79; productionProfits, 122-23, 174 differentials and, 108, 111, 114, 119-Project design: benefit assessment and, 20,123-24. See also Equipment
152; benefit-cost ratio and, 157-61; Specialization. See Productcapital-labor ratio and, 155; specializationcoefficients for, 151, 163; cost- Specification (product), 29-32effectiveness and, 155-57, 166; Speed (spinning), 57-58, 74, 98, 117-equipment and, 6; established plants 8, 142and, 151; industrial strategy and, 5; Spindle efficiency, 58-59, 74, 98,142investment and, 155-57, 164, 166; in Spinning: best practice and, 37, 39-40,Philippines, 152, 161-67; 51, 56-59, 61-62; blending of rawproductivity and, 151; Tanzania fiber and, 45; cost-effectiveness of(new textile factory example) and, project design and, 155; factor151, 152, 154, 155-57, 161 substitution in, 19-20; industry
Proprietary information, 146 effect of, 56-57; inefficiency and,Protected economies, 3, 4 17-18; international comparisons of,Protectionist trade system, 47, 121 139-44; intracountry-intraindustry
comparisons and, 132-36, 137; inQuality control, 28, 108, 109, 135, 148 Kenya, 68-70, 71-76; labor andQuotas on trade, 3 capital inputs and, 30, 61-62, 140-
41; in Philippines, 85-91, 96-98;Ranis, G., 30, 57 production function and, 21-22;Raw cotton, 12 production process and, 12-15, 28;Rehabilitation programs, 173-74 productivity and, 12-22;Relative total-factor productivity productivity differentials and, 104-
(RTFP): analytic model and, 8; best 8, 110, 111-12, 117-18, 171; productpractice and, 48-49; cost- specialization and, 56; speed and,effectiveness and, 156, 163, 164; in 57-58, 74, 98, 117-18, 142; spindleKenya, 67, 69, 72-73; in Philippines, efficiency and, 58-59; task-level84, 88-90, 91, 93, 96, 98, 101; productivity and, 59; total-factorproductivity differentials and, 114, productivity and, 16-19, 56; twists116, 143, 144, 146 per inch and, 58; yarn comparisons
192 INDEX
Spinning (continued) textile industry, 80-81; liberalizedand, 30-31; yarn quality and, 20-21, regime of, 76, 157, 158-60, 165, 172,24, 60 173; for Philippine textile industry,
Stewart, Frances, 27 101-2; protectionist, 47Strategic planning of production, 113Substitution. See Elasticity of United Kingdom, 30, 38, 39, 59, 67,
substitution; Import substitution 80, 81, 96, ]100, 101, 139, 142, 171;
best practice and, 50; yarn countsTaiwan, 124 and, 29Tanzania, 151, 152, 154, 155-57, 161,
162 United States, 153; yarn counts and,Tariffs, 3, 116, 158, 159, 167, 172 28-29Task-level productivity, 46-47, 48, 49, Wage incentives, 49, 112
59, 74-75, 96, 97, 114, 115, 164, 174, Waste material, 107, 111177 Waste reduction, 85
Taylor, E W., 147,148 Weaving: best practice and, 40-41, 59-Technical aid, 153 60, 62-63; cloth productTechnical innovation, 40 comparisons and, 31-32; cost-Technical knowledge, 129-31, 135, effectiveness of project design and,
146-47, 152, 154 155; cost variations in, 67; factorTechnicians, 49, 79, 114, 153, 156, 162 substitution in, 25-26; industryTechnology: analytic model and, 7-9; effect of, 59-60; international
availability of, 126-28; best practice comparisons of, 144-46;and, 36-38, 50, 176; choice of, 1, 2, intracounty-intraindustry3, 170-71; cost of, 53-54, 126-28; comparisons of, 136-37; in Kenya,defined, 7; the firm and, 45-46; in 76-80; labor and capital inputs and,Kenya, 67, 69, 71, 74, 75; in 31, 32, 62-63; looms and, 7, 22, 23-Philippines, 88-90, 91-94, 95; 24; new machinery and, 170; inproductivity and, 1-2, 172. See also Philippines, 91-94, 98-101, 161;Equipment production function and, 26-27;
Technology transfer, 162, 176-78; production process and, 22-23;productivity and, 4-5; role of productivity differentials and, 108-individuals in, 152-54 9, 111-12, 171; setup costs and, 28;
Total-factor productivity (TFP), 2, 103; total-factor productivity and, 24-analytic model and, 8; best practice 25; yarn quality and, 20-21, 24, 60and, 76; calculation of, 35; Weight of yarn: lap, 105, 111; spinningcomparative analysis and, 127-28, and variations in, 105-6; yarn count138, 139-43; intraindustry, 128-32; and, 14-15in Kenya, 80; in Philippines, 96, 99; Westphal, L. E., 30product diversity and, 112; spinning Wholesalers, 44and, 16-19, 56; technology transfer Williams, David, 154and, 4; weaving and, 24-25; yarn Winter, S. G., 49,121quality and, 60 Workers: expatriate, 69, 114; in Kenya,
Trade: international, 50; for Kenyan 79, 80; loom choice and, 26;

co The World Bank
A realistic assessment of productivity in a particular country isessential in determining the least-cost technology for an industrialproject. Yet the large differences in productivity between indus-trial and developing countries are rarely taken mto account Thisbook investigates productivity differences in technically similarcotton textile mills in Kenya, the Philippines, and the UnitedKingdom and places these comparisons within a larger interna-tional context
It examines the concept of best practice, derives measures ofthe total factor productivity of plants in the developing countriesrelative to best practice, and uses economic and engineeringinformation to identify the reasons for the measured differencesin productivity. Those reasons include differences not only in theskill of the work force but also in the technical competence ofmanagers and in the range of products manufactured. The booksuggests economic policies for achieving greater productivityfrom existing plants and draws implications for the transfer oftechnology and the design and implementation of industrialprojects in developing countnes
Howard Pack, a consultant to the World Bank, is professor ofcity and regional planning and economics at the University ofPennsylvania and director of the Program in Appropriate Tech-nology for Development.
Oxford University Press ISBN 0-19-520543-x
Cover design by Bril Fra,er