Embed Size (px)
Citation preview
Public Employees’ Retirement System of New Jersey
Actuarial Valuation Report as of July 1, 2019
Produced by Cheiron
April 2020
TABLE OF CONTENTS Section Page Letter of Transmittal ........................................................................................................................ i Section I Board Summary .......................................................................................................1 Section II Assessment and Disclosure of Risk .......................................................................21 Section III Assets .....................................................................................................................48 Section IV Liabilities ...............................................................................................................55 Section V Contributions..........................................................................................................64 Appendices Appendix A Membership Information .......................................................................................73 Appendix B Actuarial Assumptions and Methods ....................................................................84 Appendix C Summary of Plan Provisions ...............................................................................101 Appendix D Historical Data and Required CAFR Exhibits ....................................................112 Appendix E Early Retirement Incentive Programs ..................................................................123 Appendix F Chapter 19, P. L. 2009 ........................................................................................131 Appendix G Glossary of Terms ................................................................................................141
LETTER OF TRANSMITTAL April 23, 2020 Board of Trustees Public Employees’ Retirement System of New Jersey State of New Jersey Department of the Treasury Division of Pension and Benefits, CN 295 Trenton, NJ 08625-0295 Dear Board Members: At your request, we have performed the July 1, 2019 Actuarial Valuation of the Public Employees’ Retirement System of New Jersey (PERS or System). In preparing our report, we relied on information (some oral and some written) supplied by the Division of Pensions and Benefits (DPB). This information includes, but is not limited to, plan provisions, employee data, and financial information. We performed an informal examination of the obvious characteristics of the data for reasonableness and consistency in accordance with Actuarial Standard of Practice No. 23. The results of this report are only applicable to the System’s contribution for Fiscal Year Ending 2021. Future results may differ significantly from the current results presented in this report due to such factors as the following: plan experience differing from that anticipated by the assumptions; changes in assumptions; and changes in plan provisions or applicable law. The demographic and economic (other than the investment rate of return) actuarial assumptions are based on the recommendations from the July 1, 2014 – June 30, 2018 Experience Study, which were approved by the Board of Trustees on February 19, 2020. The investment return assumption of 7.30% is based on the recommendation of the State Treasurer. This report and its contents have been prepared in accordance with generally recognized and accepted actuarial principles and practices and our understanding of the Code of Professional Conduct and applicable Actuarial Standards of Practice set out by the Actuarial Standards Board as well as applicable laws and regulations. Furthermore, as credentialed actuaries we meet the Qualification Standards of the American Academy of Actuaries to render the opinion contained in this report. This report does not address any contractual or legal issues. We are not attorneys and our firm does not provide any legal services or advice.
Public Employees’ Retirement System of New Jersey April 23, 2020 Page 2
This actuarial valuation report was prepared exclusively for the Public Employees’ Retirement System of New Jersey for the purposes described herein and for the plan auditor in completing an audit related to the matters herein. Other users of this report are not intended users as defined in the Actuarial Standards of Practice, and Cheiron assumes no duty or liability to such other users. Sincerely, Cheiron Janet Cranna, FSA, FCA, MAAA, EA Principal Consulting Actuary Anu Patel, FSA, MAAA, EA Principal Consulting Actuary Jonathan Chipko, FSA, FCA, MAAA, EA Consulting Actuary cc: Kenneth Kent, FSA, FCA, MAAA, EA
PUBLIC EMPLOYEES’ RETIREMENT SYSTEM OF NEW JERSEY JULY 1, 2019 ACTUARIAL VALUATION
SECTION I – BOARD SUMMARY
1
The primary purpose of the actuarial valuation and this report is to disclose the following as of the valuation date: • The financial condition of the Public Employees Retirement System of New Jersey,
• Past and expected future trends and risks to the System’s financial condition, and
• The State’s and Local employers’ contributions for the Fiscal Year Ending (FYE) 2021. In this Section we present a summary of the principal valuation results. This includes the basis on which the July 1, 2019 valuation was completed and an examination of the current financial condition of the System. In addition, we present a review of the key historical trends followed by the System’s projected financial outlook. The stress testing in accordance with the requirements set out in Chapter 277, P.L. 2017 follows in Section II. This report does not include calculations under GASB Statements Nos. 67 and 68 which were provided in separate reports. Results shown in this report for years prior to July 1, 2018 are based on the prior actuary’s valuation reports.
PUBLIC EMPLOYEES’ RETIREMENT SYSTEM OF NEW JERSEY JULY 1, 2019 ACTUARIAL VALUATION
SECTION I – BOARD SUMMARY
2
Valuation Basis The July 1, 2019 valuation results are based on the same actuarial methods as used in the July 1, 2018 valuation, with the exception of a phase-in of the impact on Local employers of assumption changes related to the recent experience study. The demographic and economic assumptions, aside from the valuation interest rate, are based on the July 1, 2014 – June 30, 2018 Experience Study, which was approved by the Board of Trustees on February 19, 2020. The valuation is based on a 7.30% interest rate, which was recommended by the State Treasurer. This valuation is based on plan provisions in effect as of July 1, 2019 and does not reflect the impact of any changes in benefits that may have been approved after the valuation date. The valuation reflects a new DPB policy regarding the crediting of interest on member contributions for the purpose of refunds of accumulated deductions. This report is prepared using census data and financial information as of July 1, 2019 provided by the Division of Pensions and Benefits and does not reflect any subsequent changes in the membership or the assets. The Appropriations Act of Fiscal Year 2019 reduced the State pension contribution of $1,406,859,836 to $859,648,884. The $859,648,884 includes revenue of $232,271,000 from the Lottery Enterprise Contribution Act. In addition, there was a Chapter 259, P.L. 2009 contribution of $622,116, which was payable by fund transfer from the Second Injury Fund. The potential impact of the Appropriations Act of 2020 reduces the State pension contribution for Fiscal Year Ending 2020 from the Statutory amount of $1,432,190,871 to $1,002,769,973 (70% of the State Statutory contribution less the Lottery Enterprise Contribution offset plus expected revenue from the Lottery Enterprise Contribution Act {70% x $1,432,190,871 - $225,008,822 + $225,245,185}). The $1,002,769,973 also includes expected State-paid Local contributions of $8,246,893. In addition, there is a Chapter 259, P.L. 2009 contribution of $595,242, which is payable by fund transfer from the Second Injury Fund. This valuation reflects the potential impact of the Appropriations Act of 2020. Chapter 83, P.L. 2016 requires the State to make the required pension contributions on a quarterly basis: at least 25% by September 30, at least 50% by December 31, at least 75% by March 31, and at least 100% by June 30. As such, State contributions are assumed to be made on a quarterly basis. In accordance with Chapter 78, P.L. 2011, a pension committee is to be established for the State portion of the System and the Local portion of the System when the employer’s “target funded ratio” is achieved. The “target funded ratio” is defined as the ratio of the actuarial value of assets divided by the actuarial liability expressed as a percentage that is 75% in fiscal year 2012 and increased annually by equal increments in each of the subsequent seven fiscal years, until the funded ratio equals 80% at which time it will remain at 80% for all subsequent fiscal years. The Local employers’ portion of the System attained the required “target funded ratio” in Fiscal Year Ending 2012, establishing the committee for the Local employers’ portion of the System. The State portion of the System has not attained the required “target funded ratio” and thus the pension committee has not been established for the State portion of the System.
PUBLIC EMPLOYEES’ RETIREMENT SYSTEM OF NEW JERSEY JULY 1, 2019 ACTUARIAL VALUATION
SECTION I – BOARD SUMMARY
3
Under Chapter 98, P.L. 2017, the Lottery Enterprise Contribution Act, the Public Employees' Retirement System receives 21.02% of the proceeds of the Lottery Enterprise, based on its members' past or present employment in schools and institutions in the State for a term of 30 years. As of the July 1, 2019 valuation, 27 years remain. Revenues from Chapter 98, P.L. 2017, the Lottery Enterprise Contribution Act are assumed to be contributed to the trust on a monthly basis. The Chapter 78, P.L. 2011 "target funded ratio" is based on the actuarial value of assets plus the allocable special asset value. The special asset value is the present value of remaining lottery contributions to the retirement systems as provided to us by the Division of Pensions and Benefits. Effective with the fiscal year 2018, the State's pension contribution shall be reduced by the product of the allocable percentage for such retirement system, the adjustment percentage for such retirement system and the special asset adjustment. The valuation reflects Chapter 78, P.L. 2011, which increased the member contribution rate from 5.5% to 6.5% of compensation effective October 2011. Further, beginning July 2012, the member contribution rate was increased by 1/7th of 1% each July until a 7.5% member contribution rate was reached in July 2018. Chapter 78, P.L. 2011 also increased the member contribution rate for members who are eligible to retire under the Prosecutors Part of the Retirement System as provided by Chapter 366, P.L. 2001 from 8.5% to 10.0% of compensation with the increase effective October 2011. The valuation excludes assets and liabilities under the Non-Contributory Group Insurance Premium Fund. The Non-Contributory Group Insurance premiums are separately funded on a pay-as-you-go basis. For Local employers, the Non-Contributory Group Insurance Contribution is calculated as the present value of expected benefit payments for the upcoming year based on valuation assumptions. Key Results Following are Table I-1 and Table I-2 which summarize the key results of the valuation with respect to the System’s membership, assets and liabilities, and contributions for State and Local employers. The results are presented and compared for both the current and prior year.
PUBLIC EMPLOYEES’ RETIREMENT SYSTEM OF NEW JERSEY JULY 1, 2019 ACTUARIAL VALUATION
SECTION I – BOARD SUMMARY
4
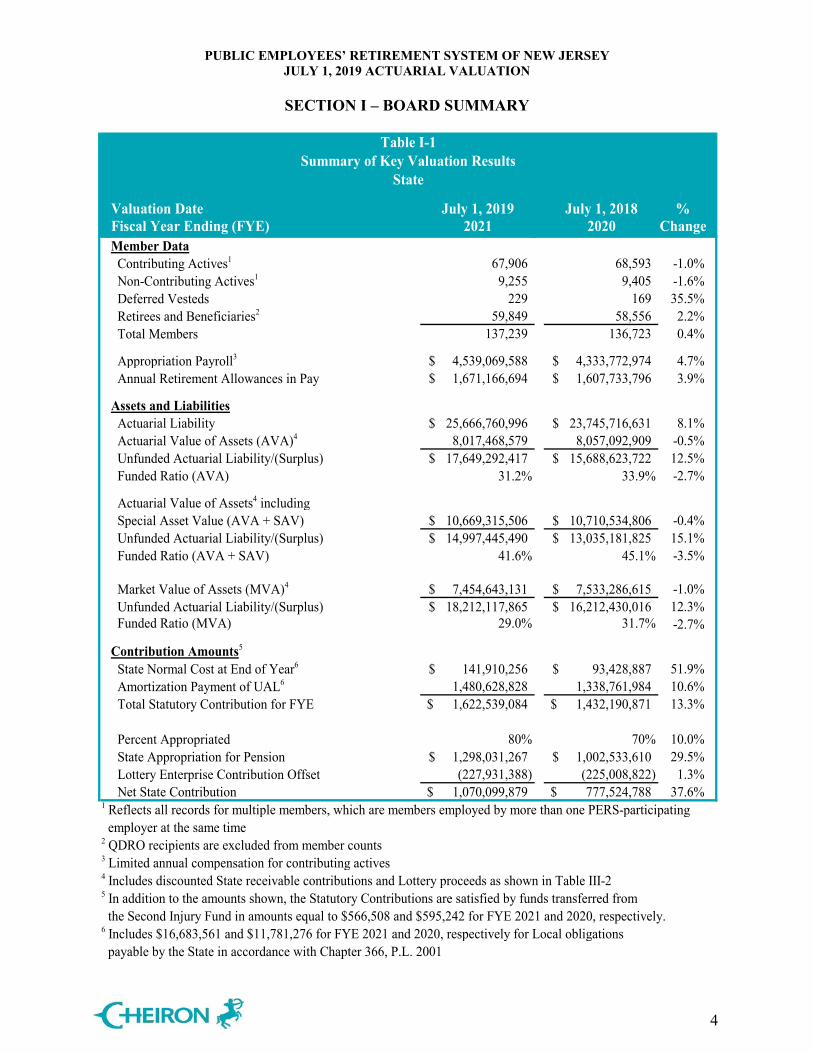
Valuation Date July 1, 2019 July 1, 2018 %Fiscal Year Ending (FYE) 2021 2020 ChangeMember Data Contributing Actives1 67,906 68,593 -1.0% Non-Contributing Actives1 9,255 9,405 -1.6% Deferred Vesteds 229 169 35.5% Retirees and Beneficiaries2 59,849 58,556 2.2% Total Members 137,239 136,723 0.4%
Appropriation Payroll3 4,539,069,588$ 4,333,772,974$ 4.7% Annual Retirement Allowances in Pay 1,671,166,694$ 1,607,733,796$ 3.9%
Assets and Liabilities Actuarial Liability 25,666,760,996$ 23,745,716,631$ 8.1% Actuarial Value of Assets (AVA)4 8,017,468,579 8,057,092,909 -0.5% Unfunded Actuarial Liability/(Surplus) 17,649,292,417$ 15,688,623,722$ 12.5% Funded Ratio (AVA) 31.2% 33.9% -2.7% Actuarial Value of Assets4 including Special Asset Value (AVA + SAV) 10,669,315,506$ 10,710,534,806$ -0.4% Unfunded Actuarial Liability/(Surplus) 14,997,445,490$ 13,035,181,825$ 15.1% Funded Ratio (AVA + SAV) 41.6% 45.1% -3.5%
Market Value of Assets (MVA)4 7,454,643,131$ 7,533,286,615$ -1.0% Unfunded Actuarial Liability/(Surplus) 18,212,117,865$ 16,212,430,016$ 12.3% Funded Ratio (MVA) 29.0% 31.7% -2.7%
Contribution Amounts5
State Normal Cost at End of Year6 141,910,256$ 93,428,887$ 51.9% Amortization Payment of UAL6 1,480,628,828 1,338,761,984 10.6% Total Statutory Contribution for FYE 1,622,539,084$ 1,432,190,871$ 13.3%
Percent Appropriated 80% 70% 10.0% State Appropriation for Pension 1,298,031,267$ 1,002,533,610$ 29.5% Lottery Enterprise Contribution Offset (227,931,388) (225,008,822) 1.3% Net State Contribution 1,070,099,879$ 777,524,788$ 37.6%
1 Reflects all records for multiple members, which are members employed by more than one PERS-participating employer at the same time2 QDRO recipients are excluded from member counts3 Limited annual compensation for contributing actives4 Includes discounted State receivable contributions and Lottery proceeds as shown in Table III-25 In addition to the amounts shown, the Statutory Contributions are satisfied by funds transferred from the Second Injury Fund in amounts equal to $566,508 and $595,242 for FYE 2021 and 2020, respectively.6 Includes $16,683,561 and $11,781,276 for FYE 2021 and 2020, respectively for Local obligations payable by the State in accordance with Chapter 366, P.L. 2001
Table I-1Summary of Key Valuation Results
State
PUBLIC EMPLOYEES’ RETIREMENT SYSTEM OF NEW JERSEY JULY 1, 2019 ACTUARIAL VALUATION
SECTION I – BOARD SUMMARY
5
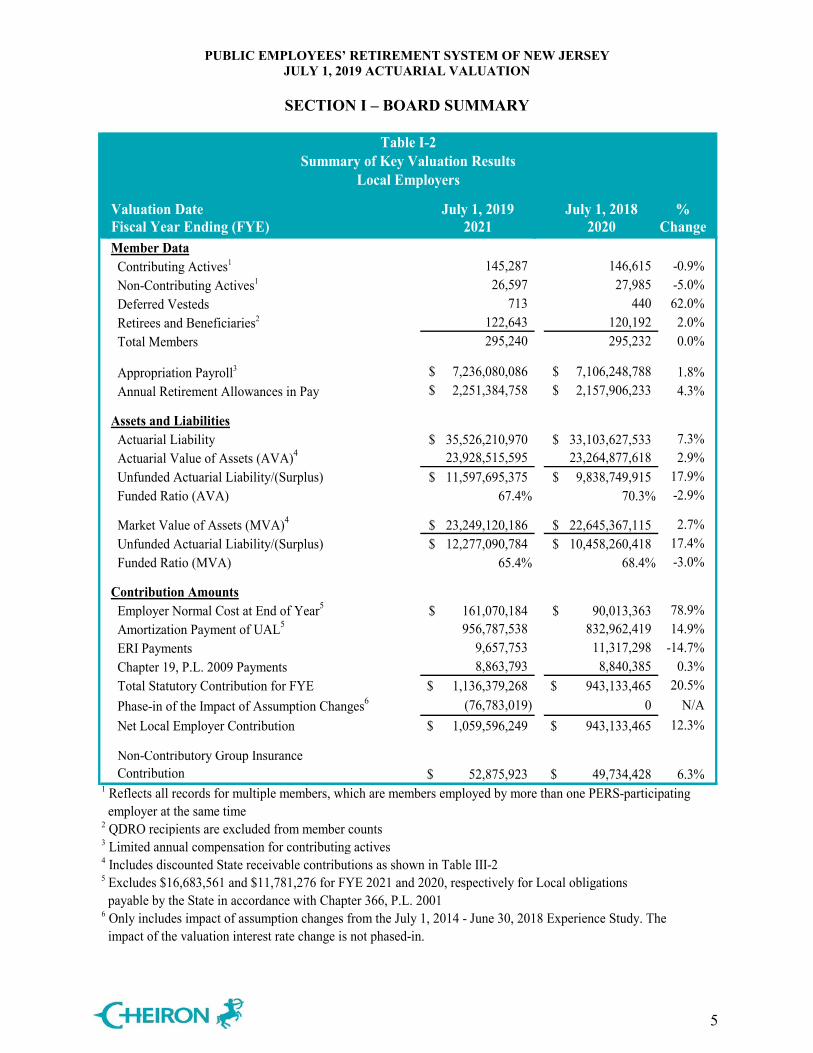
Valuation Date July 1, 2019 July 1, 2018 %Fiscal Year Ending (FYE) 2021 2020 ChangeMember Data Contributing Actives1 145,287 146,615 -0.9% Non-Contributing Actives1 26,597 27,985 -5.0% Deferred Vesteds 713 440 62.0% Retirees and Beneficiaries2 122,643 120,192 2.0% Total Members 295,240 295,232 0.0%
Appropriation Payroll3 7,236,080,086$ 7,106,248,788$ 1.8% Annual Retirement Allowances in Pay 2,251,384,758$ 2,157,906,233$ 4.3%
Assets and Liabilities Actuarial Liability 35,526,210,970$ 33,103,627,533$ 7.3% Actuarial Value of Assets (AVA)4 23,928,515,595 23,264,877,618 2.9% Unfunded Actuarial Liability/(Surplus) 11,597,695,375$ 9,838,749,915$ 17.9% Funded Ratio (AVA) 67.4% 70.3% -2.9%
Market Value of Assets (MVA)4 23,249,120,186$ 22,645,367,115$ 2.7% Unfunded Actuarial Liability/(Surplus) 12,277,090,784$ 10,458,260,418$ 17.4% Funded Ratio (MVA) 65.4% 68.4% -3.0%
Contribution Amounts Employer Normal Cost at End of Year5 161,070,184$ 90,013,363$ 78.9% Amortization Payment of UAL5 956,787,538 832,962,419 14.9% ERI Payments 9,657,753 11,317,298 -14.7% Chapter 19, P.L. 2009 Payments 8,863,793 8,840,385 0.3% Total Statutory Contribution for FYE 1,136,379,268$ 943,133,465$ 20.5% Phase-in of the Impact of Assumption Changes6 (76,783,019) 0 N/A Net Local Employer Contribution 1,059,596,249$ 943,133,465$ 12.3%
Non-Contributory Group Insurance Contribution 52,875,923$ 49,734,428$ 6.3%
1 Reflects all records for multiple members, which are members employed by more than one PERS-participating employer at the same time2 QDRO recipients are excluded from member counts3 Limited annual compensation for contributing actives4 Includes discounted State receivable contributions as shown in Table III-25 Excludes $16,683,561 and $11,781,276 for FYE 2021 and 2020, respectively for Local obligations payable by the State in accordance with Chapter 366, P.L. 20016 Only includes impact of assumption changes from the July 1, 2014 - June 30, 2018 Experience Study. The impact of the valuation interest rate change is not phased-in.
Local Employers
Table I-2Summary of Key Valuation Results
PUBLIC EMPLOYEES’ RETIREMENT SYSTEM OF NEW JERSEY JULY 1, 2019 ACTUARIAL VALUATION
SECTION I – BOARD SUMMARY
6
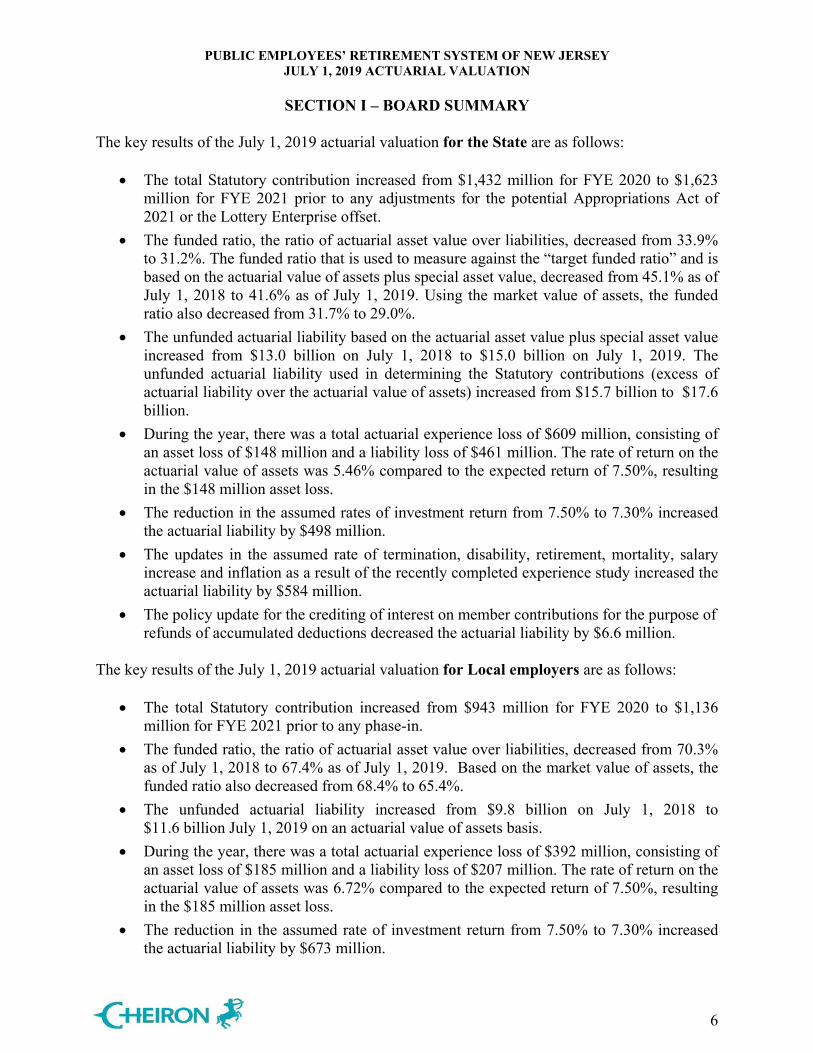
The key results of the July 1, 2019 actuarial valuation for the State are as follows:
• The total Statutory contribution increased from $1,432 million for FYE 2020 to $1,623 million for FYE 2021 prior to any adjustments for the potential Appropriations Act of 2021 or the Lottery Enterprise offset.
• The funded ratio, the ratio of actuarial asset value over liabilities, decreased from 33.9% to 31.2%. The funded ratio that is used to measure against the “target funded ratio” and is based on the actuarial value of assets plus special asset value, decreased from 45.1% as of July 1, 2018 to 41.6% as of July 1, 2019. Using the market value of assets, the funded ratio also decreased from 31.7% to 29.0%.
• The unfunded actuarial liability based on the actuarial asset value plus special asset value increased from $13.0 billion on July 1, 2018 to $15.0 billion on July 1, 2019. The unfunded actuarial liability used in determining the Statutory contributions (excess of actuarial liability over the actuarial value of assets) increased from $15.7 billion to $17.6 billion.
• During the year, there was a total actuarial experience loss of $609 million, consisting of an asset loss of $148 million and a liability loss of $461 million. The rate of return on the actuarial value of assets was 5.46% compared to the expected return of 7.50%, resulting in the $148 million asset loss.
• The reduction in the assumed rates of investment return from 7.50% to 7.30% increased the actuarial liability by $498 million.
• The updates in the assumed rate of termination, disability, retirement, mortality, salary increase and inflation as a result of the recently completed experience study increased the actuarial liability by $584 million.
• The policy update for the crediting of interest on member contributions for the purpose of refunds of accumulated deductions decreased the actuarial liability by $6.6 million.
The key results of the July 1, 2019 actuarial valuation for Local employers are as follows:
• The total Statutory contribution increased from $943 million for FYE 2020 to $1,136 million for FYE 2021 prior to any phase-in.
• The funded ratio, the ratio of actuarial asset value over liabilities, decreased from 70.3% as of July 1, 2018 to 67.4% as of July 1, 2019. Based on the market value of assets, the funded ratio also decreased from 68.4% to 65.4%.
• The unfunded actuarial liability increased from $9.8 billion on July 1, 2018 to $11.6 billion July 1, 2019 on an actuarial value of assets basis.
• During the year, there was a total actuarial experience loss of $392 million, consisting of an asset loss of $185 million and a liability loss of $207 million. The rate of return on the actuarial value of assets was 6.72% compared to the expected return of 7.50%, resulting in the $185 million asset loss.
• The reduction in the assumed rate of investment return from 7.50% to 7.30% increased the actuarial liability by $673 million.
PUBLIC EMPLOYEES’ RETIREMENT SYSTEM OF NEW JERSEY JULY 1, 2019 ACTUARIAL VALUATION
SECTION I – BOARD SUMMARY
7
• The updates in the assumed rates of termination, disability, retirement, mortality, salary increase and inflation as a result of the recently completed experience study increased the actuarial liability by $719 million.
• The policy update for the crediting of interest on member contributions for the purpose of refunds of accumulated deductions decreased the actuarial liability by $6.4 million.
• In addition, the FYE 2021 Statutory pension contribution increased by $115 million due to the assumption changes from the recently completed experience study. The Board of Trustees adopted a three-year phase-in of this impact. As a result, the FYE 2021 Local employers’ net pension contribution reflects 1/3rd of the impact, or $38 million. This results in a reduction in the Local employers’ FYE 2021 net pension contribution of $77 million ($115 million - $38 million).
PUBLIC EMPLOYEES’ RETIREMENT SYSTEM OF NEW JERSEY JULY 1, 2019 ACTUARIAL VALUATION
SECTION I – BOARD SUMMARY
8
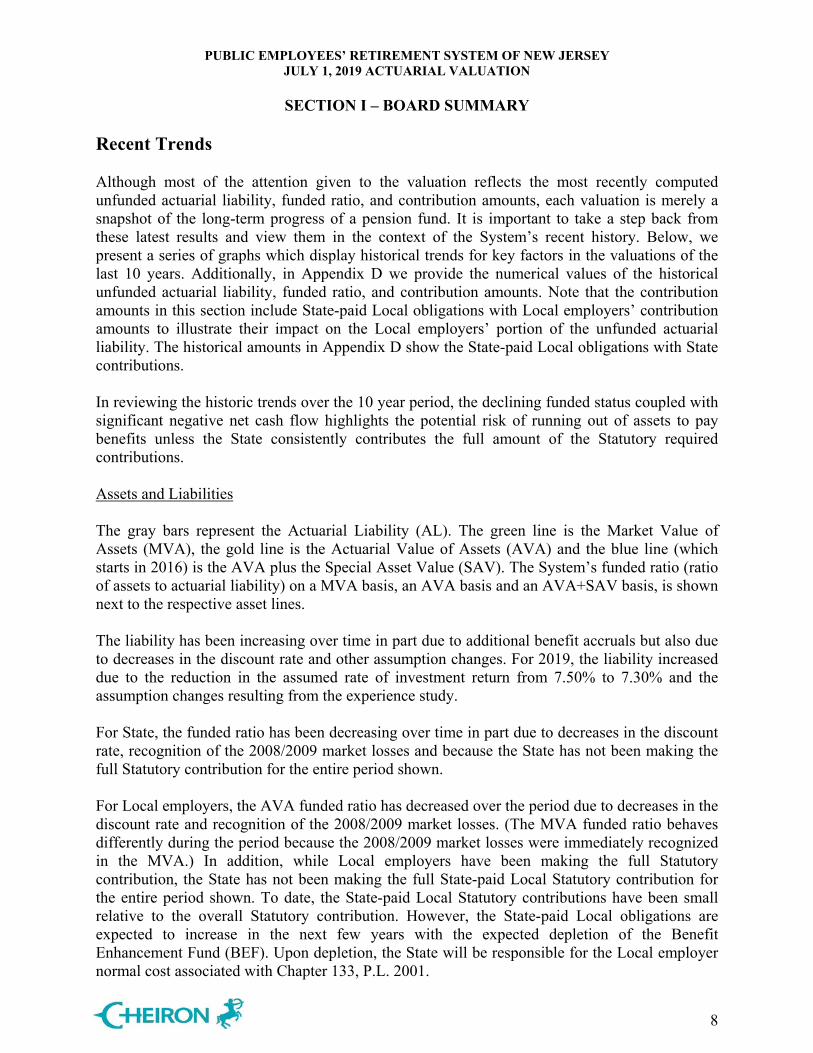
Recent Trends Although most of the attention given to the valuation reflects the most recently computed unfunded actuarial liability, funded ratio, and contribution amounts, each valuation is merely a snapshot of the long-term progress of a pension fund. It is important to take a step back from these latest results and view them in the context of the System’s recent history. Below, we present a series of graphs which display historical trends for key factors in the valuations of the last 10 years. Additionally, in Appendix D we provide the numerical values of the historical unfunded actuarial liability, funded ratio, and contribution amounts. Note that the contribution amounts in this section include State-paid Local obligations with Local employers’ contribution amounts to illustrate their impact on the Local employers’ portion of the unfunded actuarial liability. The historical amounts in Appendix D show the State-paid Local obligations with State contributions. In reviewing the historic trends over the 10 year period, the declining funded status coupled with significant negative net cash flow highlights the potential risk of running out of assets to pay benefits unless the State consistently contributes the full amount of the Statutory required contributions. Assets and Liabilities The gray bars represent the Actuarial Liability (AL). The green line is the Market Value of Assets (MVA), the gold line is the Actuarial Value of Assets (AVA) and the blue line (which starts in 2016) is the AVA plus the Special Asset Value (SAV). The System’s funded ratio (ratio of assets to actuarial liability) on a MVA basis, an AVA basis and an AVA+SAV basis, is shown next to the respective asset lines. The liability has been increasing over time in part due to additional benefit accruals but also due to decreases in the discount rate and other assumption changes. For 2019, the liability increased due to the reduction in the assumed rate of investment return from 7.50% to 7.30% and the assumption changes resulting from the experience study. For State, the funded ratio has been decreasing over time in part due to decreases in the discount rate, recognition of the 2008/2009 market losses and because the State has not been making the full Statutory contribution for the entire period shown. For Local employers, the AVA funded ratio has decreased over the period due to decreases in the discount rate and recognition of the 2008/2009 market losses. (The MVA funded ratio behaves differently during the period because the 2008/2009 market losses were immediately recognized in the MVA.) In addition, while Local employers have been making the full Statutory contribution, the State has not been making the full State-paid Local Statutory contribution for the entire period shown. To date, the State-paid Local Statutory contributions have been small relative to the overall Statutory contribution. However, the State-paid Local obligations are expected to increase in the next few years with the expected depletion of the Benefit Enhancement Fund (BEF). Upon depletion, the State will be responsible for the Local employer normal cost associated with Chapter 133, P.L. 2001.
PUBLIC EMPLOYEES’ RETIREMENT SYSTEM OF NEW JERSEY JULY 1, 2019 ACTUARIAL VALUATION
SECTION I – BOARD SUMMARY
9
State
48% 50% 43% 43% 42% 38%33% 32% 32% 29%
38% 35% 34% 31%
59% 55% 50% 48% 44% 41%
50% 47% 45% 42%
$0
$5
$10
$15
$20
$25
$30
2010 2011 2012 2013 2014 2015 2016 2017 2018 2019
Billi
ons
Actuarial Valuation as of July 1,
Actuarial Liability Actuarial Value of Assets (without SAV)Market Value of Assets Actuarial Value of Assets (with SAV)
Local Employers
62%67% 65%
67%72% 70% 64%
67%68% 65%
77% 77% 74% 74% 73% 73% 71% 70% 70% 67%
$0
$5
$10
$15
$20
$25
$30
$35
$40
2010 2011 2012 2013 2014 2015 2016 2017 2018 2019
Billi
ons
Actuarial Valuation as of July 1,
Actuarial Liability Actuarial Value of AssetsMarket Value of Assets
PUBLIC EMPLOYEES’ RETIREMENT SYSTEM OF NEW JERSEY JULY 1, 2019 ACTUARIAL VALUATION
SECTION I – BOARD SUMMARY
10
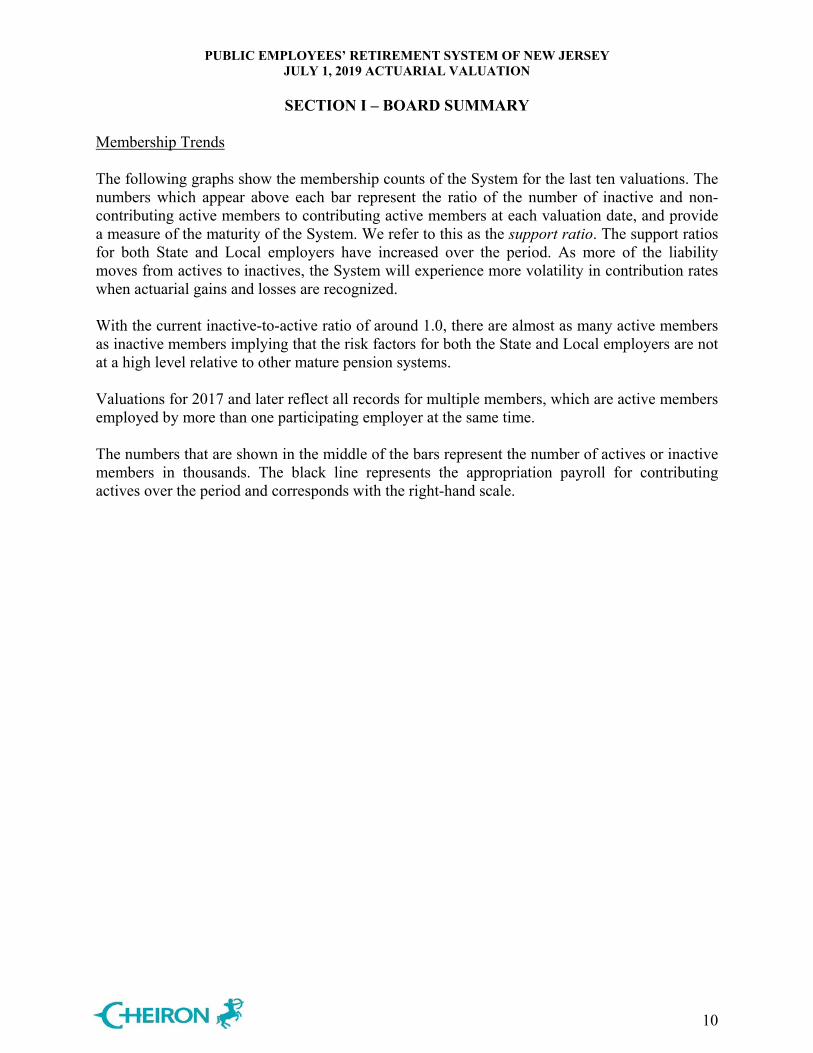
Membership Trends The following graphs show the membership counts of the System for the last ten valuations. The numbers which appear above each bar represent the ratio of the number of inactive and non-contributing active members to contributing active members at each valuation date, and provide a measure of the maturity of the System. We refer to this as the support ratio. The support ratios for both State and Local employers have increased over the period. As more of the liability moves from actives to inactives, the System will experience more volatility in contribution rates when actuarial gains and losses are recognized. With the current inactive-to-active ratio of around 1.0, there are almost as many active members as inactive members implying that the risk factors for both the State and Local employers are not at a high level relative to other mature pension systems. Valuations for 2017 and later reflect all records for multiple members, which are active members employed by more than one participating employer at the same time. The numbers that are shown in the middle of the bars represent the number of actives or inactive members in thousands. The black line represents the appropriation payroll for contributing actives over the period and corresponds with the right-hand scale.
PUBLIC EMPLOYEES’ RETIREMENT SYSTEM OF NEW JERSEY JULY 1, 2019 ACTUARIAL VALUATION
SECTION I – BOARD SUMMARY
11
State
0.7 0.8 0.8 0.8 0.8 0.9 0.9 1.0 1.0 1.0
45 48 49 50 52 54 56 57 59 60
10 10 10 9 9 9 9 9 9 9
81 77 75 74 73 70 69 68 69 68
$0
$2
$4
$6
$8
$10
$12
0
20
40
60
80
100
120
140
160
2010 2011 2012 2013 2014 2015 2016 2017 2018 2019
Billi
ons
Thou
sand
s
Actuarial Valuation as of July 1,
Contributing Actives Non-Contributing ActivesRetirees and Deferred Vesteds Payroll
Local Employers
0.7 0.8 0.8 0.8 0.9 0.9 1.0 1.0 1.0 1.0
97 101 104 107 110 113 115 119 121 123
30 33 31 29 28 28 28 27 28 27
188 172 164 160 156 152 149 149 147 145
$0
$2
$4
$6
$8
$10
$12
$14
$16
$18
$20
0
50
100
150
200
250
300
350
2010 2011 2012 2013 2014 2015 2016 2017 2018 2019
Billi
ons
Thou
sand
s
Actuarial Valuation as of July 1,
Contributing Actives Non-Contributing ActivesRetirees and Deferred Vested Payroll
PUBLIC EMPLOYEES’ RETIREMENT SYSTEM OF NEW JERSEY JULY 1, 2019 ACTUARIAL VALUATION
SECTION I – BOARD SUMMARY
12
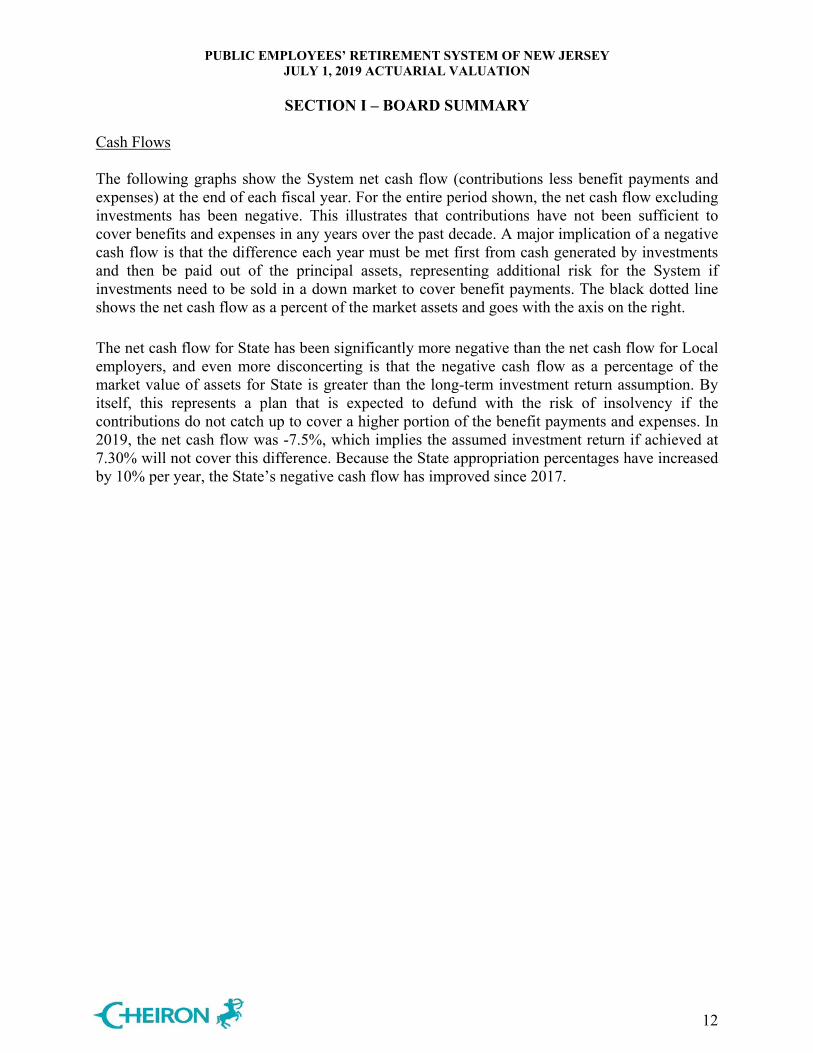
Cash Flows The following graphs show the System net cash flow (contributions less benefit payments and expenses) at the end of each fiscal year. For the entire period shown, the net cash flow excluding investments has been negative. This illustrates that contributions have not been sufficient to cover benefits and expenses in any years over the past decade. A major implication of a negative cash flow is that the difference each year must be met first from cash generated by investments and then be paid out of the principal assets, representing additional risk for the System if investments need to be sold in a down market to cover benefit payments. The black dotted line shows the net cash flow as a percent of the market assets and goes with the axis on the right.
The net cash flow for State has been significantly more negative than the net cash flow for Local employers, and even more disconcerting is that the negative cash flow as a percentage of the market value of assets for State is greater than the long-term investment return assumption. By itself, this represents a plan that is expected to defund with the risk of insolvency if the contributions do not catch up to cover a higher portion of the benefit payments and expenses. In 2019, the net cash flow was -7.5%, which implies the assumed investment return if achieved at 7.30% will not cover this difference. Because the State appropriation percentages have increased by 10% per year, the State’s negative cash flow has improved since 2017.
PUBLIC EMPLOYEES’ RETIREMENT SYSTEM OF NEW JERSEY JULY 1, 2019 ACTUARIAL VALUATION
SECTION I – BOARD SUMMARY
13
State
Local Employers
PUBLIC EMPLOYEES’ RETIREMENT SYSTEM OF NEW JERSEY JULY 1, 2019 ACTUARIAL VALUATION
SECTION I – BOARD SUMMARY
14
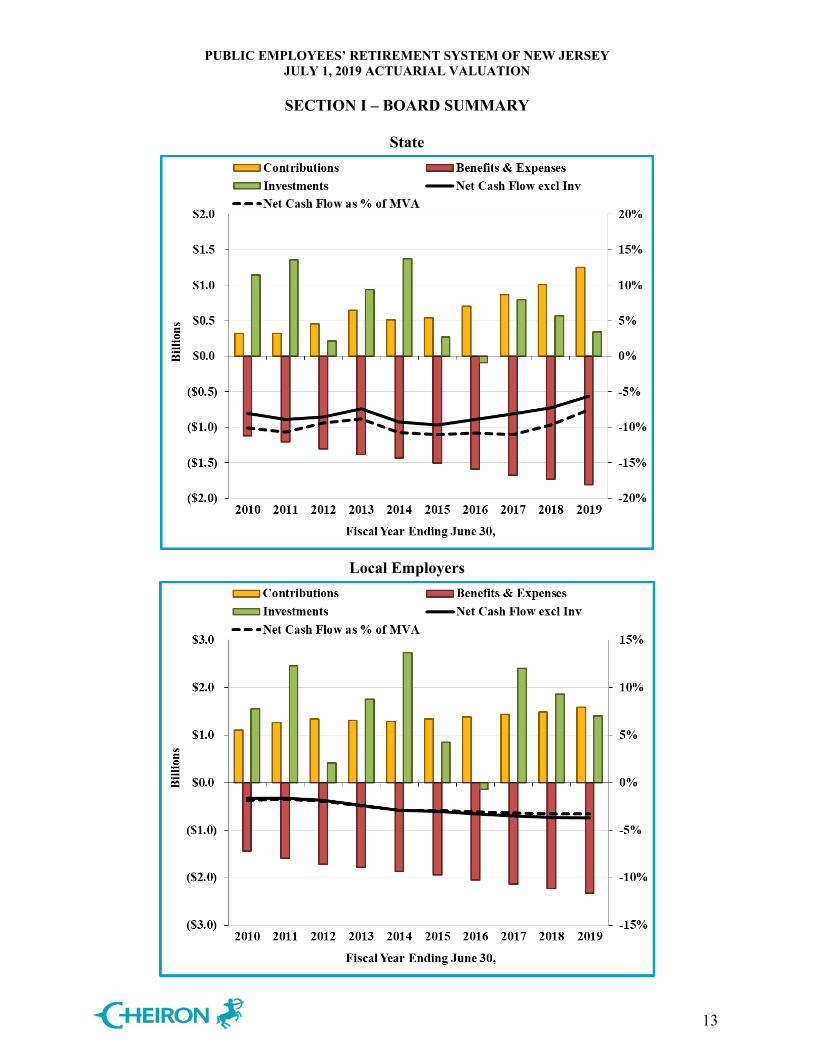
Contributions These graphs show the historical trends for the State and Local employer contributions. The Local employer contributions include the State-paid Local obligations, but not Early Retirement Incentive (ERI) or Chapter 19, P.L. 2009 payments. The Statutory contributions are comprised of the normal cost (blue bars) and the amortization of the UAL (gold bars). The green line shows the actual contributions over the period. For FYE 2020 and 2021, the green line has a lighter shade to indicate that these are expected, rather than actual, contributions. The expected contributions are based on the anticipated appropriations shown in Table I-1 and Table I-2. The red line is the tread water line, which is the normal cost plus the interest on the UAL. The tread water line shows the minimum contributions needed to avoid an increase in the UAL. The graph for State shows that not only has the State been making contributions less than required by Statute, but that the State contributions have historically been significantly below the tread water line. When contributions are lower than the normal cost plus interest on the UAL, the unfunded actuarial liability is expected to grow from one year to the next. For FYE 2020 and 2021, the State is expected to appropriate 70% and 80% of the Statutory contribution, respectively. The graph for Local employers shows that the Local employers have consistently made their Statutory contributions. While the State has not been contributing the full State-paid Local obligations, the total contributions have still been greater than the tread water line. In FYE 2021, actual contributions are expected to be lower than the Statutory contribution because the Board adopted a three-year phase-in of the impact of the assumption changes from the July 1, 2014 – June 30, 2018 Experience Study. Even with the phase-in, actual contributions are expected to exceed the tread water line. Actual contributions are expected to return to the Statutory contribution level in FYE 2023 when the impact of the assumption changes is fully phased-in.
PUBLIC EMPLOYEES’ RETIREMENT SYSTEM OF NEW JERSEY JULY 1, 2019 ACTUARIAL VALUATION
SECTION I – BOARD SUMMARY
15
State
Local Employers
PUBLIC EMPLOYEES’ RETIREMENT SYSTEM OF NEW JERSEY JULY 1, 2019 ACTUARIAL VALUATION
SECTION I – BOARD SUMMARY
16
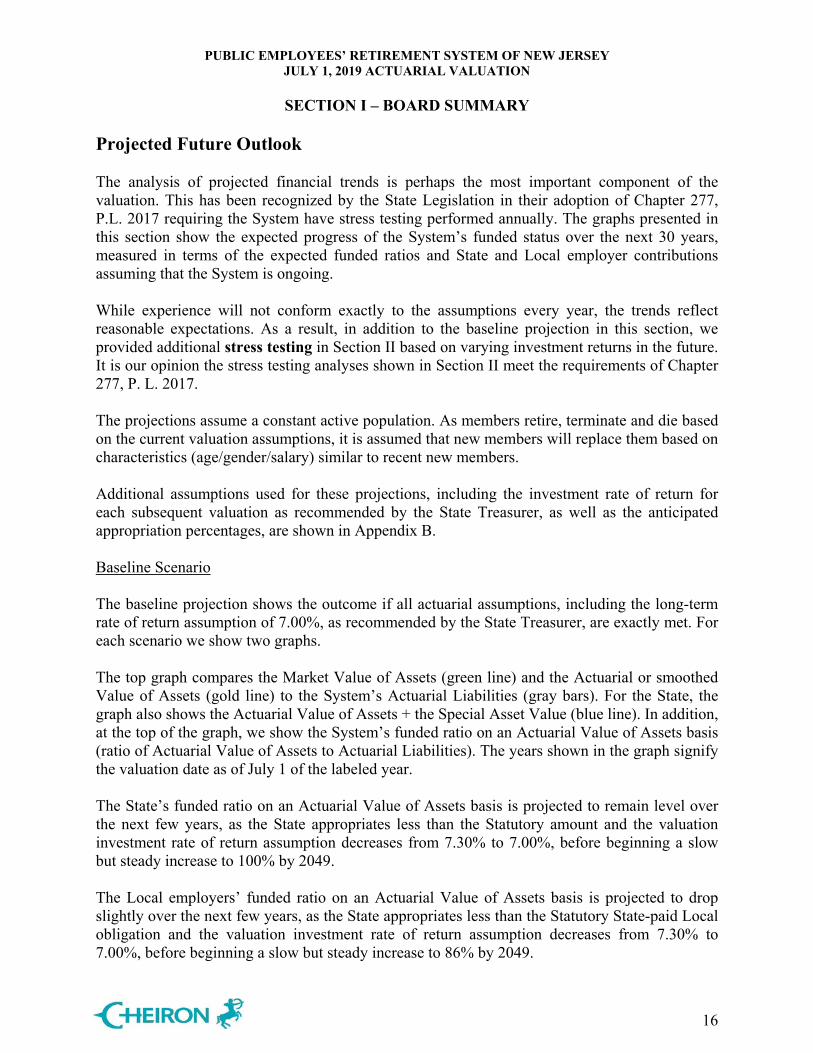
Projected Future Outlook The analysis of projected financial trends is perhaps the most important component of the valuation. This has been recognized by the State Legislation in their adoption of Chapter 277, P.L. 2017 requiring the System have stress testing performed annually. The graphs presented in this section show the expected progress of the System’s funded status over the next 30 years, measured in terms of the expected funded ratios and State and Local employer contributions assuming that the System is ongoing. While experience will not conform exactly to the assumptions every year, the trends reflect reasonable expectations. As a result, in addition to the baseline projection in this section, we provided additional stress testing in Section II based on varying investment returns in the future. It is our opinion the stress testing analyses shown in Section II meet the requirements of Chapter 277, P. L. 2017. The projections assume a constant active population. As members retire, terminate and die based on the current valuation assumptions, it is assumed that new members will replace them based on characteristics (age/gender/salary) similar to recent new members. Additional assumptions used for these projections, including the investment rate of return for each subsequent valuation as recommended by the State Treasurer, as well as the anticipated appropriation percentages, are shown in Appendix B. Baseline Scenario
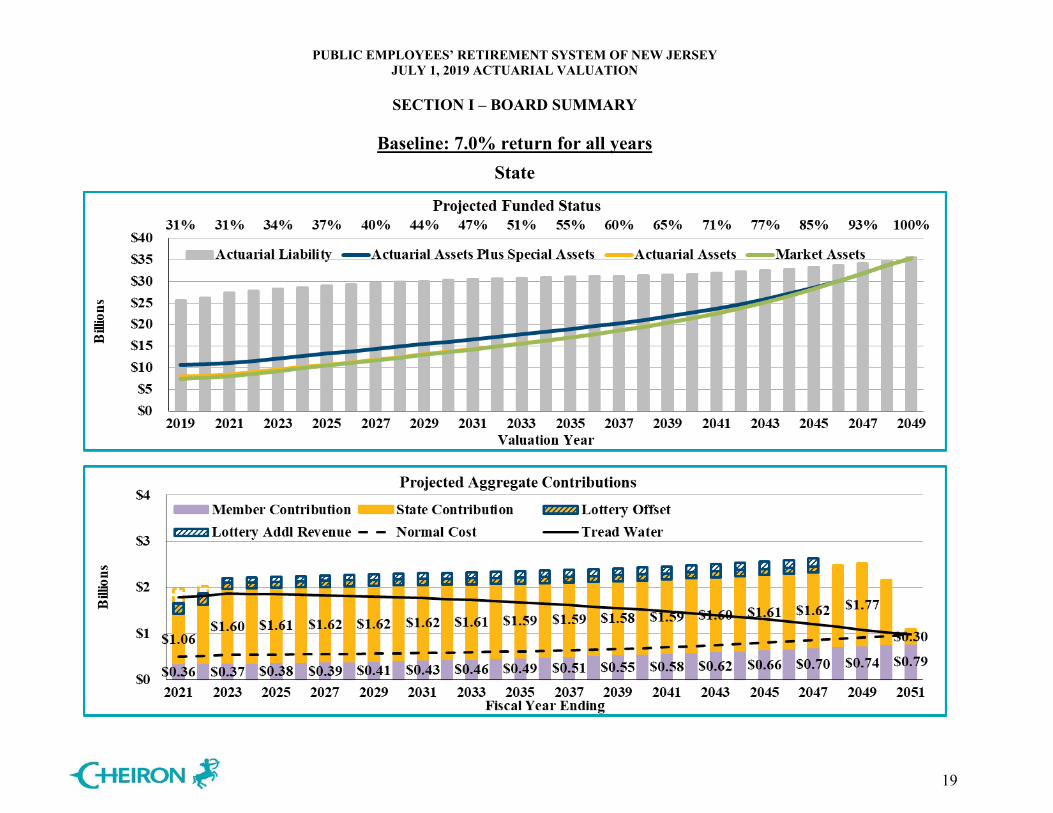
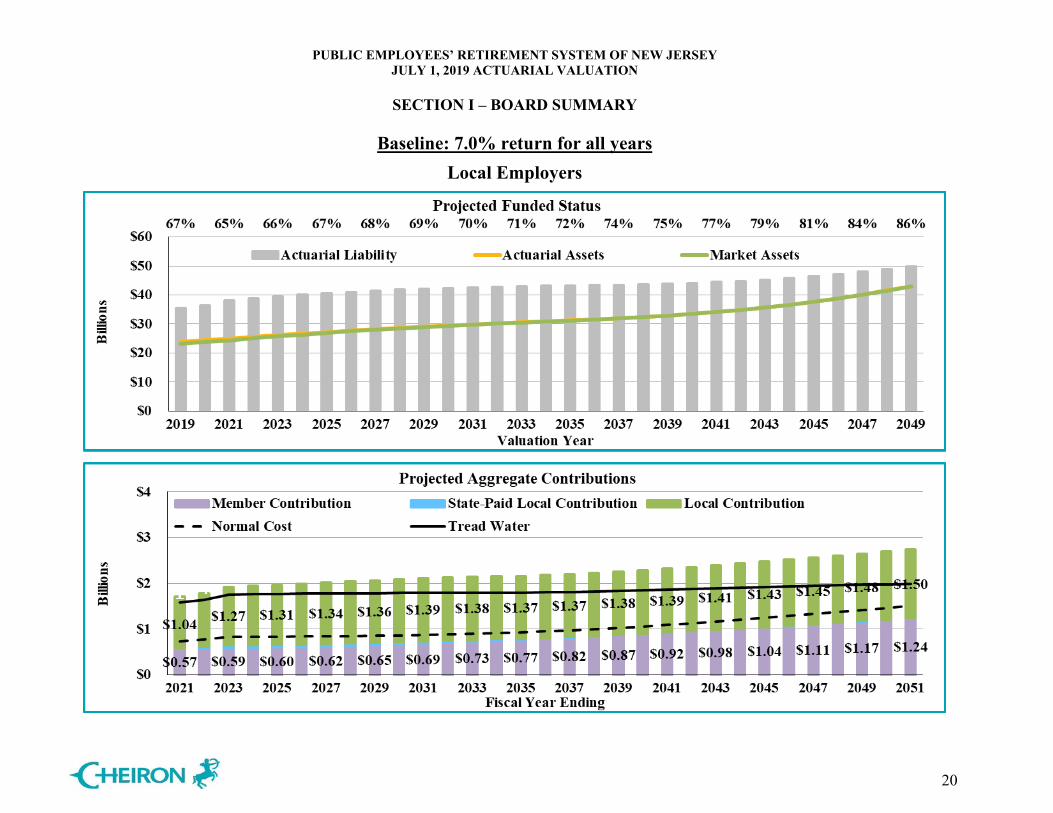
The baseline projection shows the outcome if all actuarial assumptions, including the long-term rate of return assumption of 7.00%, as recommended by the State Treasurer, are exactly met. For each scenario we show two graphs. The top graph compares the Market Value of Assets (green line) and the Actuarial or smoothed Value of Assets (gold line) to the System’s Actuarial Liabilities (gray bars). For the State, the graph also shows the Actuarial Value of Assets + the Special Asset Value (blue line). In addition, at the top of the graph, we show the System’s funded ratio on an Actuarial Value of Assets basis (ratio of Actuarial Value of Assets to Actuarial Liabilities). The years shown in the graph signify the valuation date as of July 1 of the labeled year. The State’s funded ratio on an Actuarial Value of Assets basis is projected to remain level over the next few years, as the State appropriates less than the Statutory amount and the valuation investment rate of return assumption decreases from 7.30% to 7.00%, before beginning a slow but steady increase to 100% by 2049. The Local employers’ funded ratio on an Actuarial Value of Assets basis is projected to drop slightly over the next few years, as the State appropriates less than the Statutory State-paid Local obligation and the valuation investment rate of return assumption decreases from 7.30% to 7.00%, before beginning a slow but steady increase to 86% by 2049.
PUBLIC EMPLOYEES’ RETIREMENT SYSTEM OF NEW JERSEY JULY 1, 2019 ACTUARIAL VALUATION
SECTION I – BOARD SUMMARY
17
The funded ratio for State increases faster than the Local employers' portion and reaches 100% compared to 86% for Local employers by the end of the projection period because of the expected lottery revenue that is contributed each year in excess of the Statutory contributions. This additional revenue helps pays down the UAL sooner for the State portion. The bottom graph shows the contributions by fiscal year. The member contributions are in purple, the State contributions are in gold, the State-paid Local contributions are in light blue and the Local employers’ contributions are in green. We show the contribution values in dollars except for the State-paid Local contributions which are small compared to total contributions. The gold and green outline shows the full Statutory contributions for the State and Local employers, respectively, with the shaded portion showing the anticipated appropriated amount. The projected lottery revenue is provided by the DPB and is outlined in blue. Lottery revenue amounts shaded in gold are offsets to Statutory contributions. Lottery revenue amounts shaded white are additional contributions in excess of the Statutory contributions that pay down the UAL. The lottery revenue through FYE 2022 largely offsets the Statutory contribution while lottery amounts after that include additional payments toward the UAL. The lottery offsets during the projection period are calculated based on the methodology as defined in Chapter 98, P.L. 2017. The projection assumes the State appropriates 80% of the Statutory contribution in FYE 2021, and increases the percent by 10% a year, until reaching 100% of the Statutory contribution beginning with FYE 2023. Local employers contribute 100% of the Statutory amount, except in FYE 2021 and 2022 as the impact of the assumption changes from the July 1, 2014 – June 30, 2018 Experience Study is phased in. Both the appropriated State and Local employer contributions and the member contributions are labeled. The contributions exclude amounts payable for the Non-Contributory Group Insurance. The dashed black line in the bottom graph shows the gross normal cost. The difference between the dashed black line and the purple bar is the State and Local employers’ portion of the normal cost. The solid black line is the tread water line based on the Actuarial Value of Assets. Because the tread water metric equals the normal cost plus interest on the UAL, the difference between the solid black line and the dashed black line is the interest on the UAL. When contributions fall below the solid black line, as is the case through FYE 2021 for the State, the UAL is expected to increase and the funded ratio is expected to decrease. When the contributions exceed the solid line, as is the case beginning in FYE 2022 for State and in all years for Local employers, the UAL is expected to decrease and the funded ratio is expected to increase. The Statutory State contributions increase steadily through FYE 2023 as the State appropriates less than the Statutory amount and the valuation investment rate of return assumption decreases from 7.30% to 7.00%. Thereafter, the Statutory contributions remain relatively steady until the lottery revenue stops. Once the appropriated amount equals the Statutory contribution, beginning in FYE 2023, the contributions reach the level necessary to pay down the UAL and the tread water line begins to decrease relative to the Statutory contribution.
PUBLIC EMPLOYEES’ RETIREMENT SYSTEM OF NEW JERSEY JULY 1, 2019 ACTUARIAL VALUATION
SECTION I – BOARD SUMMARY
18
The Local employers’ contributions increase steadily through FYE 2023 as the State appropriates less than the Statutory State-paid Local obligation and the valuation investment rate of return assumption decreases from 7.30% to 7.00%. Thereafter, the Local employers’ contributions gradually increase. The State-paid Local contributions are expected to increase starting in FYE 2022 as the Benefit Enhancement Fund becomes depleted and the State becomes responsible for the Local employers Chapter 133, P.L. 2001 normal cost. Soon after that, the State-paid Local contributions gradually decrease as the population eligible for the Chapter 133, P.L. 2001 benefit enhancements decreases.
PUBLIC EMPLOYEES’ RETIREMENT SYSTEM OF NEW JERSEY JULY 1, 2019 ACTUARIAL VALUATION
SECTION I – BOARD SUMMARY
19
Baseline: 7.0% return for all years
State
PUBLIC EMPLOYEES’ RETIREMENT SYSTEM OF NEW JERSEY JULY 1, 2019 ACTUARIAL VALUATION
SECTION I – BOARD SUMMARY
20
Baseline: 7.0% return for all years
Local Employers
PUBLIC EMPLOYEES’ RETIREMENT SYSTEM OF NEW JERSEY JULY 1, 2019 ACTUARIAL VALUATION
SECTION II – ASSESSMENT AND DISCLOSURE OF RISK
21
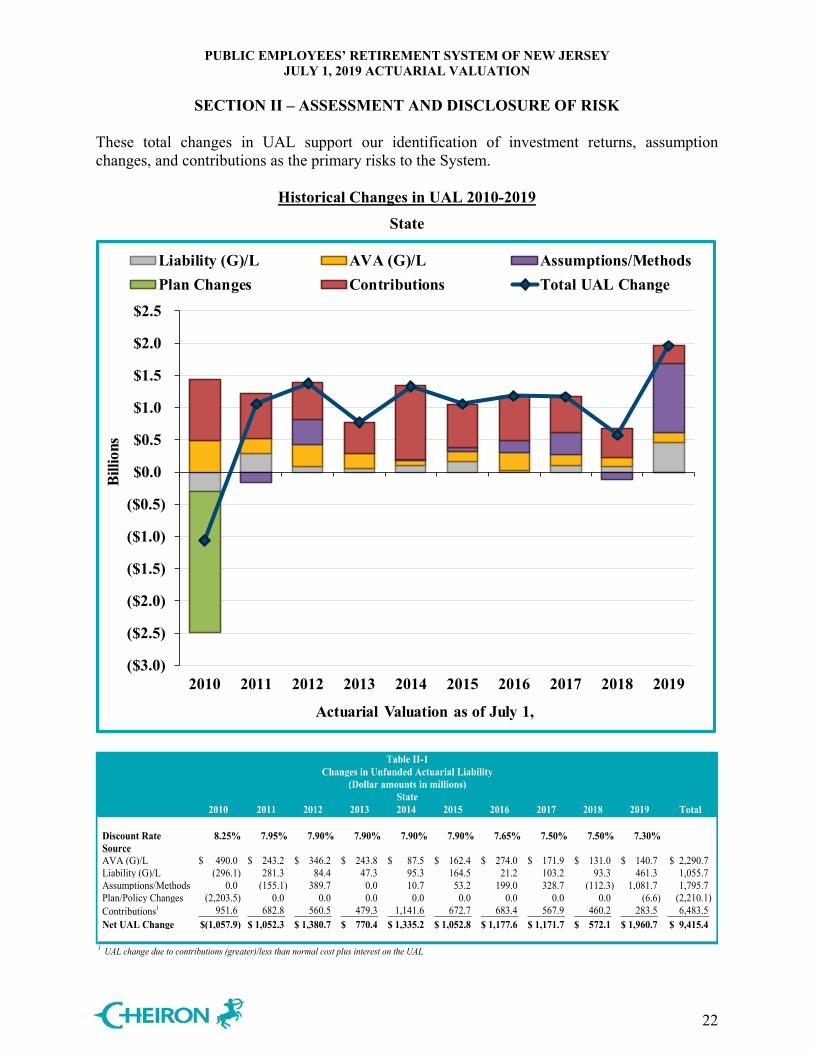
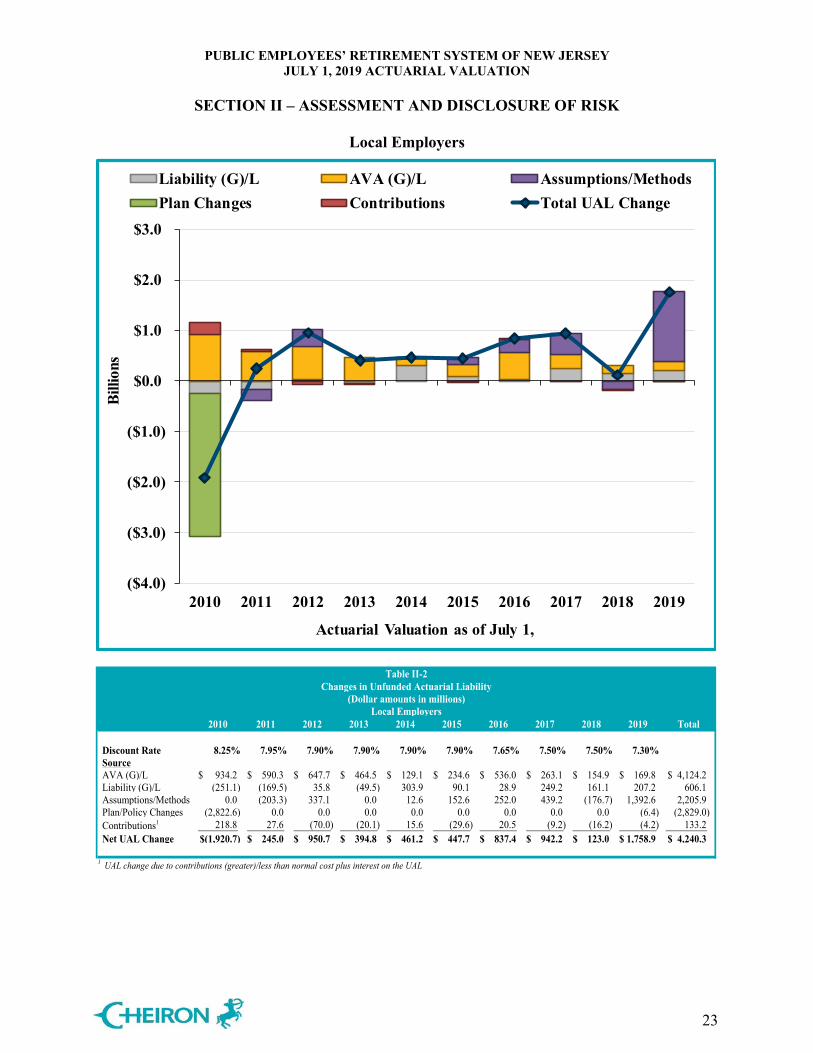
Actuarial valuations are based on a set of assumptions about future economic and demographic experience. These assumptions represent a reasonable estimate of future experience, but actual future experience will undoubtedly be different and may be significantly different. This section of the report is intended to identify the primary risks to the plan, provide some background information about those risks, and provide an assessment of those risks. Identification of Risks The fundamental risk to the System is that the contributions needed to pay the benefits become unaffordable. While there are a number of factors that could lead to contribution amounts becoming unaffordable, we believe the primary risks are: • Investment risk, • Assumption change risk, and • Contribution risk. Other risks that we have not identified may also turn out to be important. Investment risk is the potential for investment returns to be different than expected. Lower investment returns than anticipated will increase the unfunded actuarial liability necessitating higher contributions in the future unless there are other gains that offset these investment losses. The potential volatility of future investment returns is determined by the System’s asset allocation and the affordability of the investment risk is determined by the amount of assets invested relative to the size of the plan sponsor or other contribution base. Assumption change risk is the potential for the environment to change such that future valuation assumptions are different than the current assumptions. For example, declines in interest rates over the last three decades resulted in higher investment returns for fixed income investments, but lower expected future returns necessitating either a change in investment policy, a reduction in discount rate, or some combination of the two. Assumption change risk is an extension of the other risks identified, but rather than capturing the risk as it is experienced, it captures the cost of recognizing a change in environment when the current assumption is no longer reasonable. Contribution risk is the potential for actual future contributions to deviate from expected future Statutory contributions. There are different sources of contribution risk ranging from the sponsor choosing to not make contributions in accordance with the funding policy to material changes in the contribution base (e.g., covered employees, covered payroll, sponsor revenue) that affect the amount of contributions the System can collect. The charts below show the components of changes in the Unfunded Actuarial Liability (UAL) for the State and Local employers over the last 10 years, including investment gains and losses on the Actuarial Value of Assets, liability gains and losses, assumption and plan/policy changes, and contributions compared to the tread water level of contributions (normal cost plus interest on the UAL.) The net UAL change is shown by the dark blue line. Tables II-1 and II-2 below the chart summarize the changes in the UAL over the last 10 years.
PUBLIC EMPLOYEES’ RETIREMENT SYSTEM OF NEW JERSEY JULY 1, 2019 ACTUARIAL VALUATION
SECTION II – ASSESSMENT AND DISCLOSURE OF RISK
22
These total changes in UAL support our identification of investment returns, assumption changes, and contributions as the primary risks to the System.
Historical Changes in UAL 2010-2019 State
($3.0)
($2.5)
($2.0)
($1.5)
($1.0)
($0.5)
$0.0
$0.5
$1.0
$1.5
$2.0
$2.5
2010 2011 2012 2013 2014 2015 2016 2017 2018 2019
Billi
ons
Actuarial Valuation as of July 1,
Liability (G)/L AVA (G)/L Assumptions/MethodsPlan Changes Contributions Total UAL Change
Table II-1Changes in Unfunded Actuarial Liability
(Dollar amounts in millions)State
2010 2011 2012 2013 2014 2015 2016 2017 2018 2019 Total
Discount Rate 8.25% 7.95% 7.90% 7.90% 7.90% 7.90% 7.65% 7.50% 7.50% 7.30%SourceAVA (G)/L 490.0$ 243.2$ 346.2$ 243.8$ 87.5$ 162.4$ 274.0$ 171.9$ 131.0$ 140.7$ 2,290.7$ Liability (G)/L (296.1) 281.3 84.4 47.3 95.3 164.5 21.2 103.2 93.3 461.3 1,055.7 Assumptions/Methods 0.0 (155.1) 389.7 0.0 10.7 53.2 199.0 328.7 (112.3) 1,081.7 1,795.7 Plan/Policy Changes (2,203.5) 0.0 0.0 0.0 0.0 0.0 0.0 0.0 0.0 (6.6) (2,210.1) Contributions1 951.6 682.8 560.5 479.3 1,141.6 672.7 683.4 567.9 460.2 283.5 6,483.5 Net UAL Change (1,057.9)$ 1,052.3$ 1,380.7$ 770.4$ 1,335.2$ 1,052.8$ 1,177.6$ 1,171.7$ 572.1$ 1,960.7$ 9,415.4$
1 UAL change due to contributions (greater)/less than normal cost plus interest on the UAL
PUBLIC EMPLOYEES’ RETIREMENT SYSTEM OF NEW JERSEY JULY 1, 2019 ACTUARIAL VALUATION
SECTION II – ASSESSMENT AND DISCLOSURE OF RISK
23
Local Employers
($4.0)
($3.0)
($2.0)
($1.0)
$0.0
$1.0
$2.0
$3.0
2010 2011 2012 2013 2014 2015 2016 2017 2018 2019
Billi
ons
Actuarial Valuation as of July 1,
Liability (G)/L AVA (G)/L Assumptions/MethodsPlan Changes Contributions Total UAL Change
Table II-2Changes in Unfunded Actuarial Liability
(Dollar amounts in millions)Local Employers
2010 2011 2012 2013 2014 2015 2016 2017 2018 2019 Total
Discount Rate 8.25% 7.95% 7.90% 7.90% 7.90% 7.90% 7.65% 7.50% 7.50% 7.30%SourceAVA (G)/L 934.2$ 590.3$ 647.7$ 464.5$ 129.1$ 234.6$ 536.0$ 263.1$ 154.9$ 169.8$ 4,124.2$ Liability (G)/L (251.1) (169.5) 35.8 (49.5) 303.9 90.1 28.9 249.2 161.1 207.2 606.1 Assumptions/Methods 0.0 (203.3) 337.1 0.0 12.6 152.6 252.0 439.2 (176.7) 1,392.6 2,205.9 Plan/Policy Changes (2,822.6) 0.0 0.0 0.0 0.0 0.0 0.0 0.0 0.0 (6.4) (2,829.0) Contributions1 218.8 27.6 (70.0) (20.1) 15.6 (29.6) 20.5 (9.2) (16.2) (4.2) 133.2 Net UAL Change (1,920.7)$ 245.0$ 950.7$ 394.8$ 461.2$ 447.7$ 837.4$ 942.2$ 123.0$ 1,758.9$ 4,240.3$
1 UAL change due to contributions (greater)/less than normal cost plus interest on the UAL
PUBLIC EMPLOYEES’ RETIREMENT SYSTEM OF NEW JERSEY JULY 1, 2019 ACTUARIAL VALUATION
SECTION II – ASSESSMENT AND DISCLOSURE OF RISK
24
On a smoothed asset basis, the investment gains and losses (gold bars) from 2010 to 2019 reflect material investment losses driven by the market decline of 2008 and 2009, which was spread over the five successive years. In aggregate, over the 10-year period, investment losses have added approximately $2,290.7 million to the State’s UAL and approximately $4,124.2 million to the Local employers’ UAL. On the liability side (gray bars), the System has experienced a combination of gains and losses, however smaller in magnitude compared to the assets, increasing the UAL by approximately $1,055.7 million for the State and $606.1 million for Local employers over the 10-year period. Assumption and method changes (purple bars) over the last 10 years have increased the UAL by approximately $1,795.7 million for the State and $2,205.9 million for Local employers. The significant assumption changes have included reductions in the discount rate from 8.25% to 7.30% as well as decreases in mortality rates and projected mortality improvement. It is important to note that the discount rate changes simply reflect a downward revision to the estimate of future investment earnings and ultimately costs will be determined by actual investment earnings. Plan changes (green bars) over the last 10 years have decreased the UAL by approximately $2,210.1 million for the State and $2,829.0 million for Local employers. The significant plan change that occurred in 2010 was the suspension of future COLAs. Each year, the UAL is expected to increase for benefit accruals attributable to the current year (the normal cost) and interest on the UAL. This expected increase is referred to as the tread water level. If contributions are greater than the tread water level, the UAL is expected to decrease. Conversely, if contributions are less than the tread water level, the UAL is expected to increase. Changes due to contributions greater or less than the tread water level (red bars) have increased the State’s UAL by approximately $6,483.5 million and increased Local employers’ UAL by approximately $133.2 million over the last 10 years. In general, the amortization methods used to determine the Statutory contributions are designed to collect more than the tread water level. However, contributions may be less than this threshold due to the State appropriating less than the Statutory contributions. Plan Maturity Measures The future financial condition of a mature pension plan is more sensitive to each of the risks identified above than a less mature plan. Before assessing each of these risks, it is important to understand the maturity of the plan compared to other plans and how the maturity has changed over time. Plan maturity can be measured in a variety of ways, but they all get at one basic dynamic - the larger the plan is compared to the contribution or revenue base that supports it, the more sensitive the plan will be to risk. The measures below have been selected as the most important in understanding the primary risks identified for the System.
PUBLIC EMPLOYEES’ RETIREMENT SYSTEM OF NEW JERSEY JULY 1, 2019 ACTUARIAL VALUATION
SECTION II – ASSESSMENT AND DISCLOSURE OF RISK
25
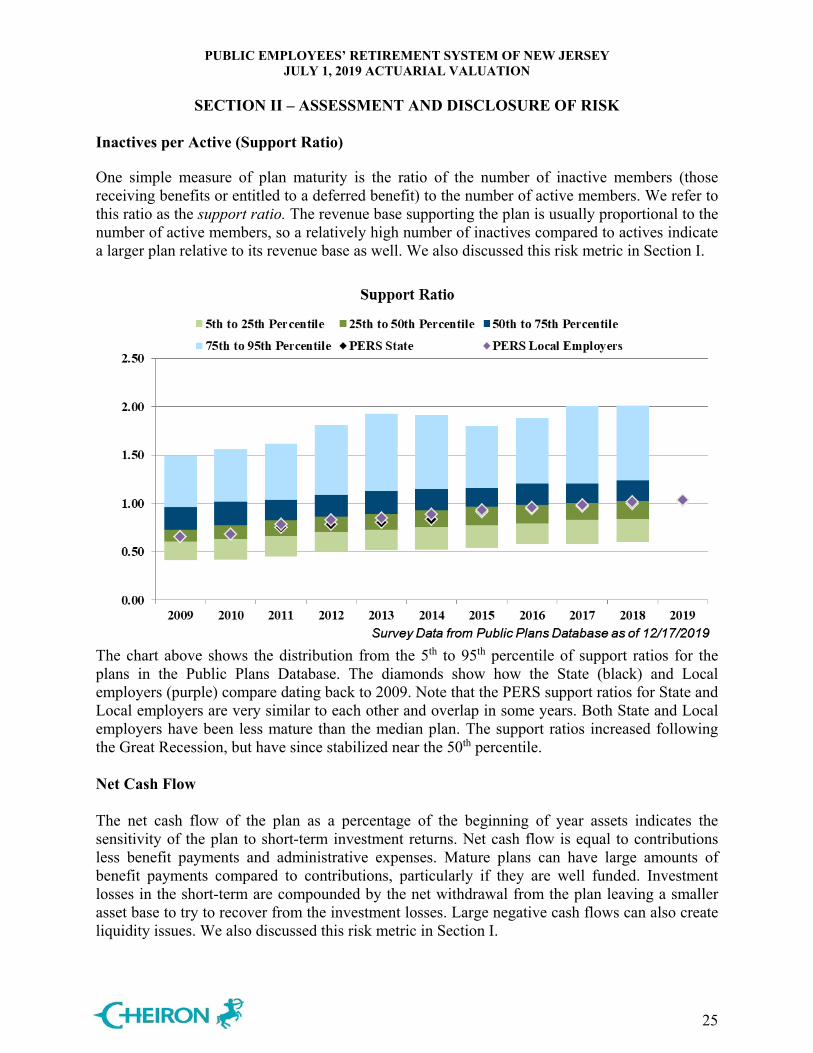
Inactives per Active (Support Ratio) One simple measure of plan maturity is the ratio of the number of inactive members (those receiving benefits or entitled to a deferred benefit) to the number of active members. We refer to this ratio as the support ratio. The revenue base supporting the plan is usually proportional to the number of active members, so a relatively high number of inactives compared to actives indicate a larger plan relative to its revenue base as well. We also discussed this risk metric in Section I.
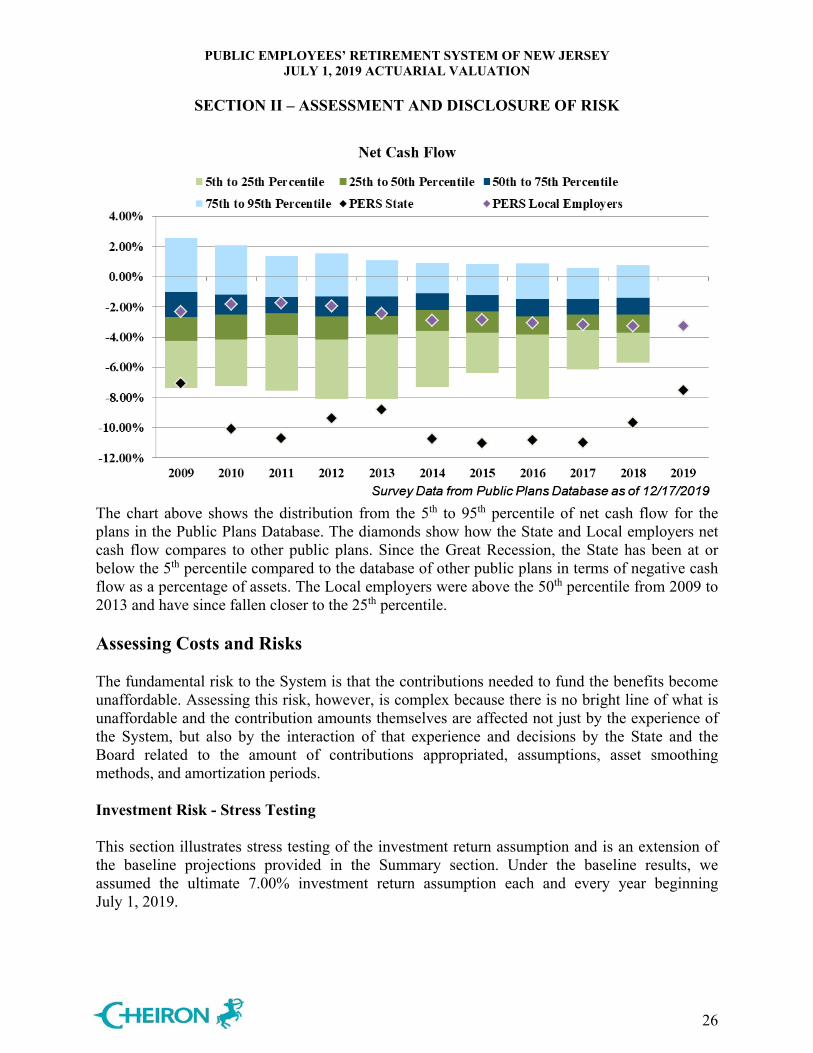
The chart above shows the distribution from the 5th to 95th percentile of support ratios for the plans in the Public Plans Database. The diamonds show how the State (black) and Local employers (purple) compare dating back to 2009. Note that the PERS support ratios for State and Local employers are very similar to each other and overlap in some years. Both State and Local employers have been less mature than the median plan. The support ratios increased following the Great Recession, but have since stabilized near the 50th percentile. Net Cash Flow The net cash flow of the plan as a percentage of the beginning of year assets indicates the sensitivity of the plan to short-term investment returns. Net cash flow is equal to contributions less benefit payments and administrative expenses. Mature plans can have large amounts of benefit payments compared to contributions, particularly if they are well funded. Investment losses in the short-term are compounded by the net withdrawal from the plan leaving a smaller asset base to try to recover from the investment losses. Large negative cash flows can also create liquidity issues. We also discussed this risk metric in Section I.
PUBLIC EMPLOYEES’ RETIREMENT SYSTEM OF NEW JERSEY JULY 1, 2019 ACTUARIAL VALUATION
SECTION II – ASSESSMENT AND DISCLOSURE OF RISK
26
The chart above shows the distribution from the 5th to 95th percentile of net cash flow for the plans in the Public Plans Database. The diamonds show how the State and Local employers net cash flow compares to other public plans. Since the Great Recession, the State has been at or below the 5th percentile compared to the database of other public plans in terms of negative cash flow as a percentage of assets. The Local employers were above the 50th percentile from 2009 to 2013 and have since fallen closer to the 25th percentile. Assessing Costs and Risks The fundamental risk to the System is that the contributions needed to fund the benefits become unaffordable. Assessing this risk, however, is complex because there is no bright line of what is unaffordable and the contribution amounts themselves are affected not just by the experience of the System, but also by the interaction of that experience and decisions by the State and the Board related to the amount of contributions appropriated, assumptions, asset smoothing methods, and amortization periods. Investment Risk - Stress Testing This section illustrates stress testing of the investment return assumption and is an extension of the baseline projections provided in the Summary section. Under the baseline results, we assumed the ultimate 7.00% investment return assumption each and every year beginning July 1, 2019.
PUBLIC EMPLOYEES’ RETIREMENT SYSTEM OF NEW JERSEY JULY 1, 2019 ACTUARIAL VALUATION
SECTION II – ASSESSMENT AND DISCLOSURE OF RISK
27
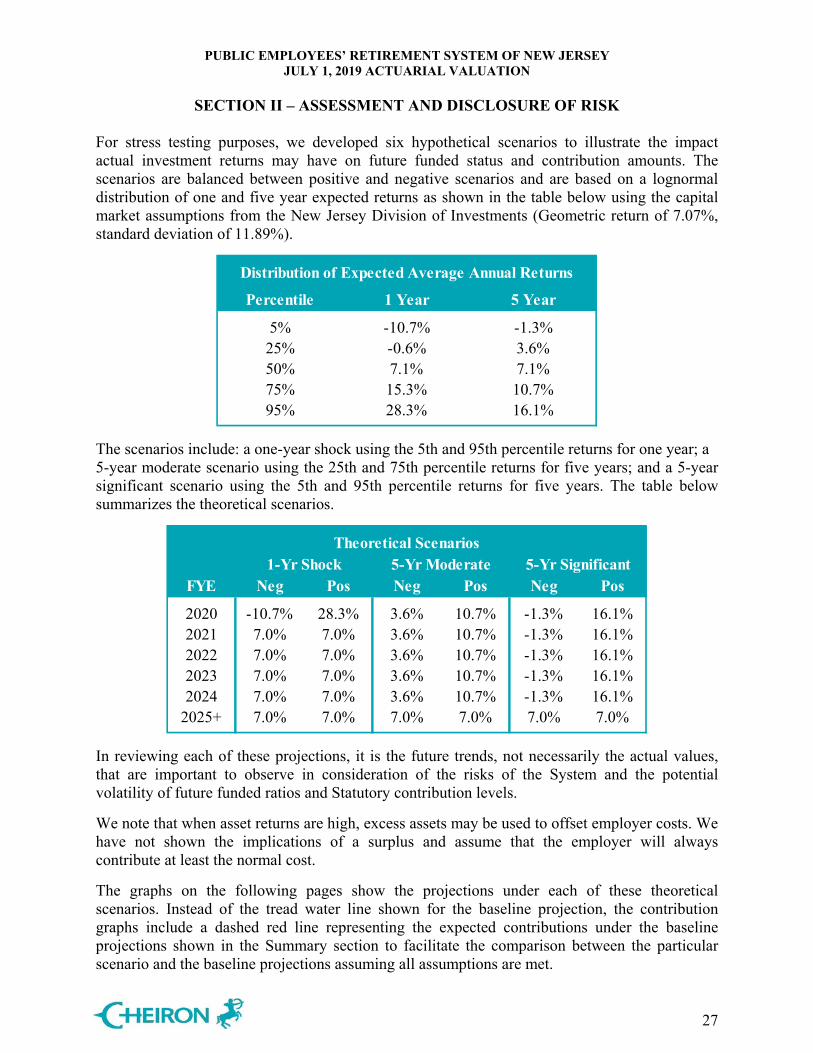
For stress testing purposes, we developed six hypothetical scenarios to illustrate the impact actual investment returns may have on future funded status and contribution amounts. The scenarios are balanced between positive and negative scenarios and are based on a lognormal distribution of one and five year expected returns as shown in the table below using the capital market assumptions from the New Jersey Division of Investments (Geometric return of 7.07%, standard deviation of 11.89%).
Distribution of Expected Average Annual Returns
Percentile 1 Year 5 Year
5% -10.7% -1.3%25% -0.6% 3.6%50% 7.1% 7.1%75% 15.3% 10.7%95% 28.3% 16.1%
The scenarios include: a one-year shock using the 5th and 95th percentile returns for one year; a 5-year moderate scenario using the 25th and 75th percentile returns for five years; and a 5-year significant scenario using the 5th and 95th percentile returns for five years. The table below summarizes the theoretical scenarios.
Theoretical Scenarios1-Yr Shock 5-Yr Moderate 5-Yr Significant
FYE Neg Pos Neg Pos Neg Pos
2020 -10.7% 28.3% 3.6% 10.7% -1.3% 16.1%2021 7.0% 7.0% 3.6% 10.7% -1.3% 16.1%2022 7.0% 7.0% 3.6% 10.7% -1.3% 16.1%2023 7.0% 7.0% 3.6% 10.7% -1.3% 16.1%2024 7.0% 7.0% 3.6% 10.7% -1.3% 16.1%
2025+ 7.0% 7.0% 7.0% 7.0% 7.0% 7.0%
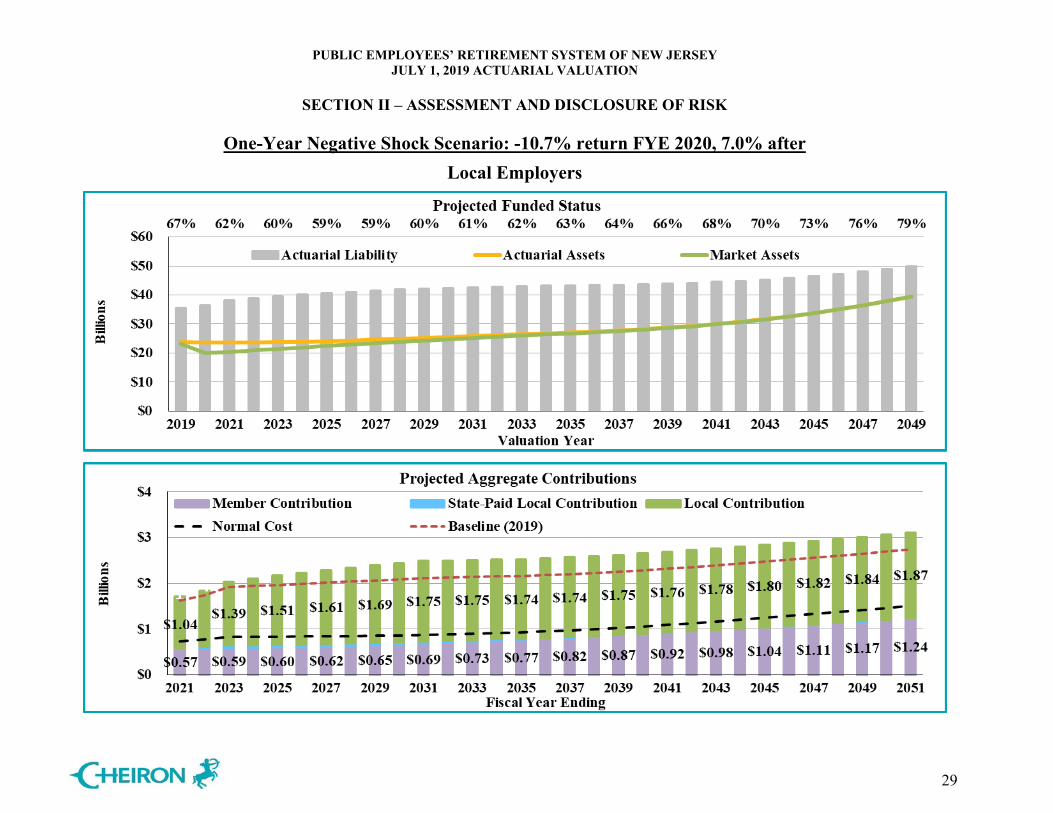
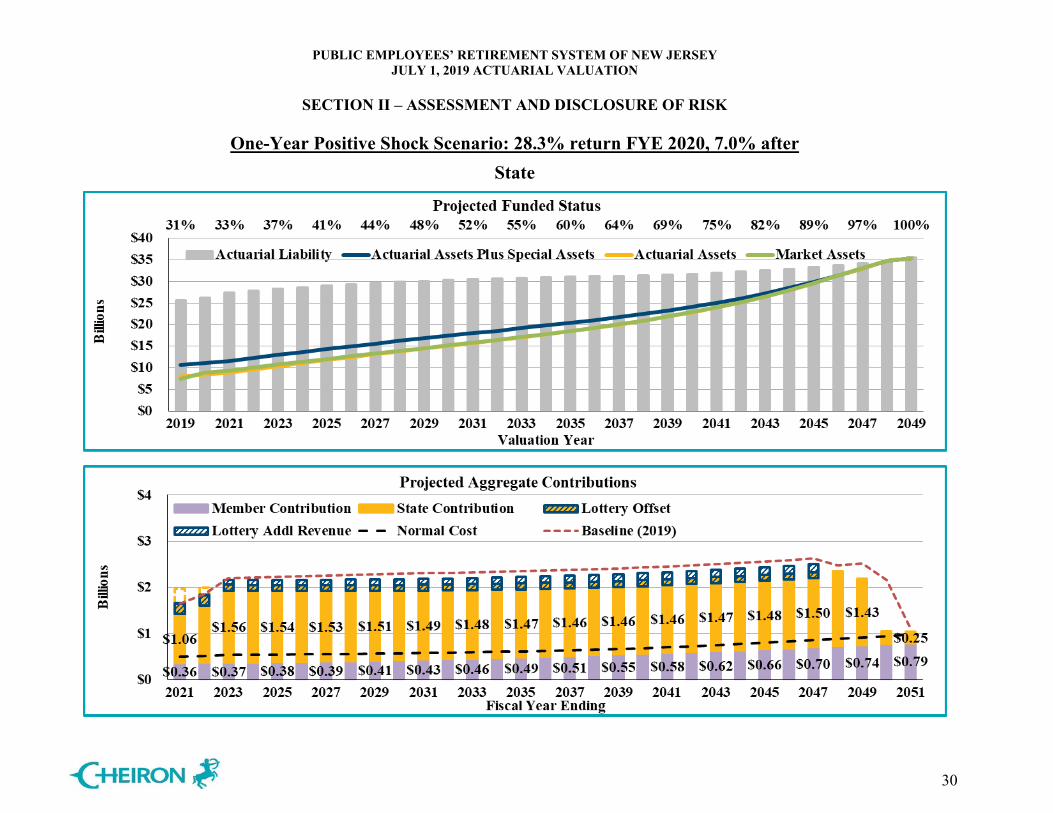
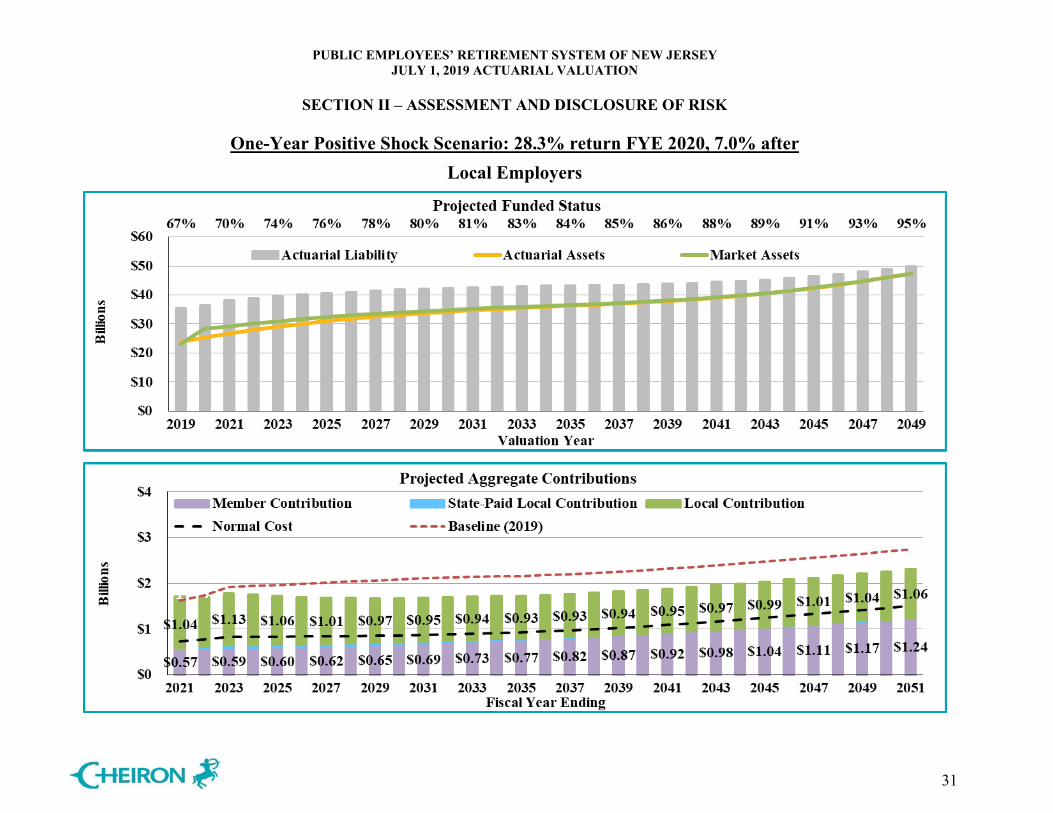
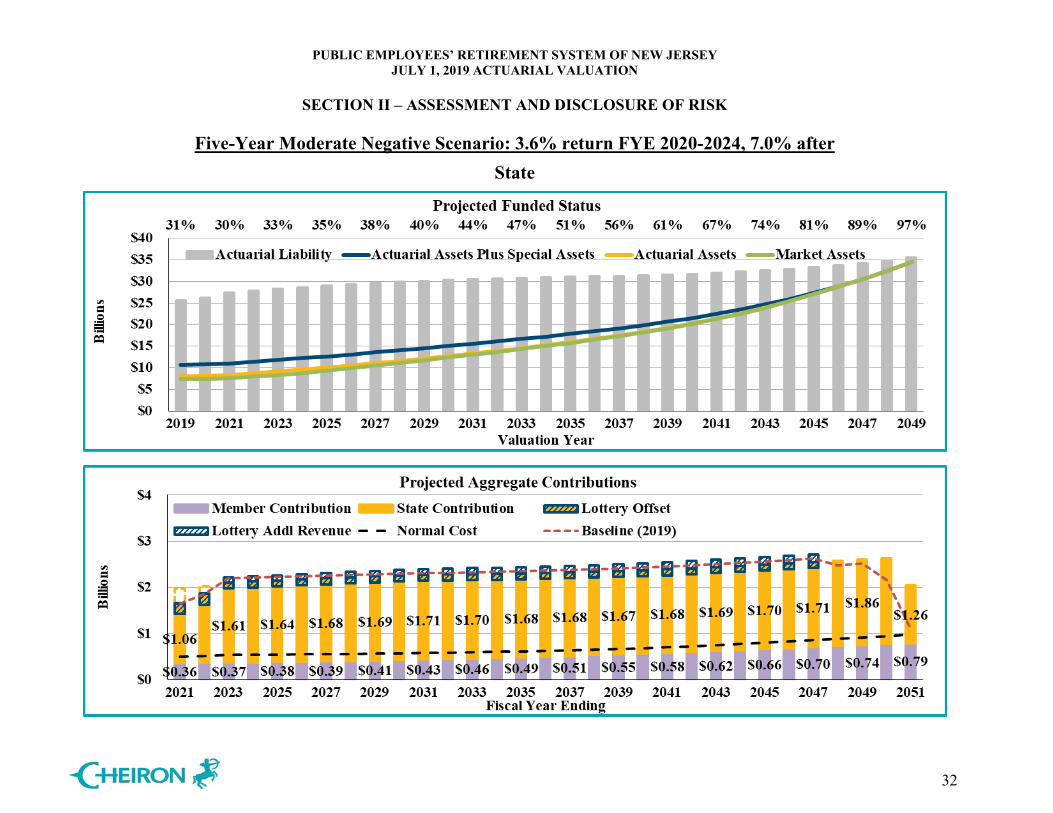
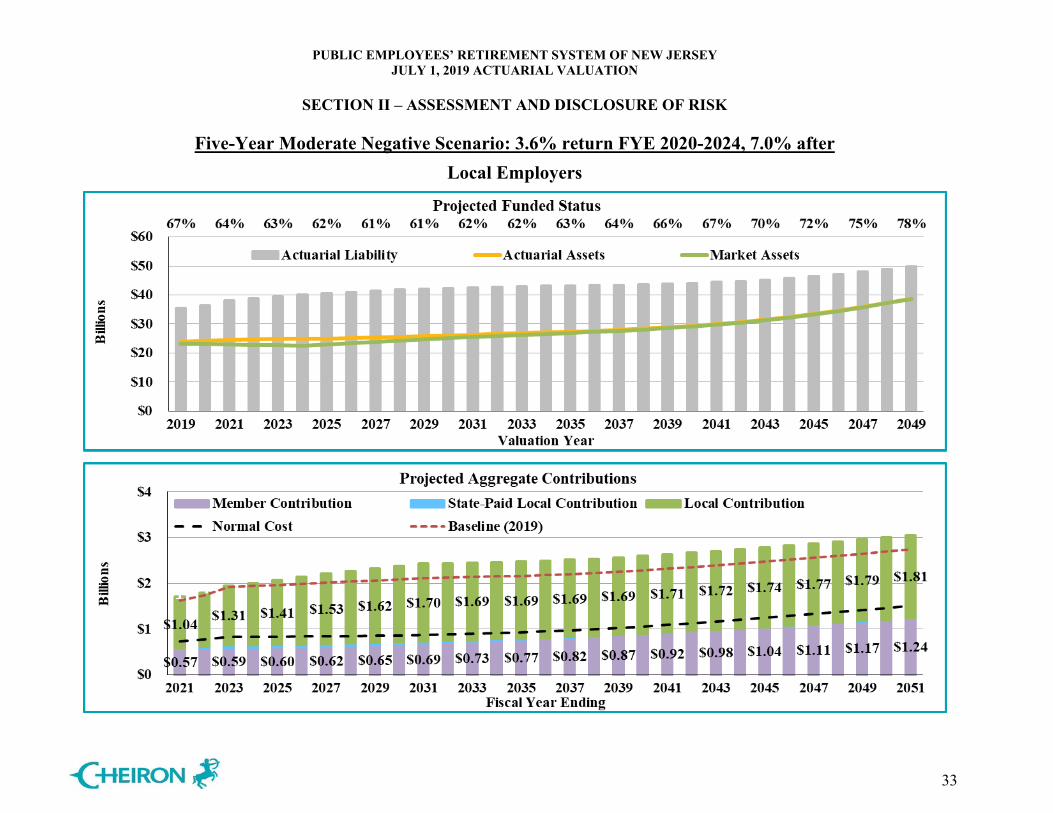
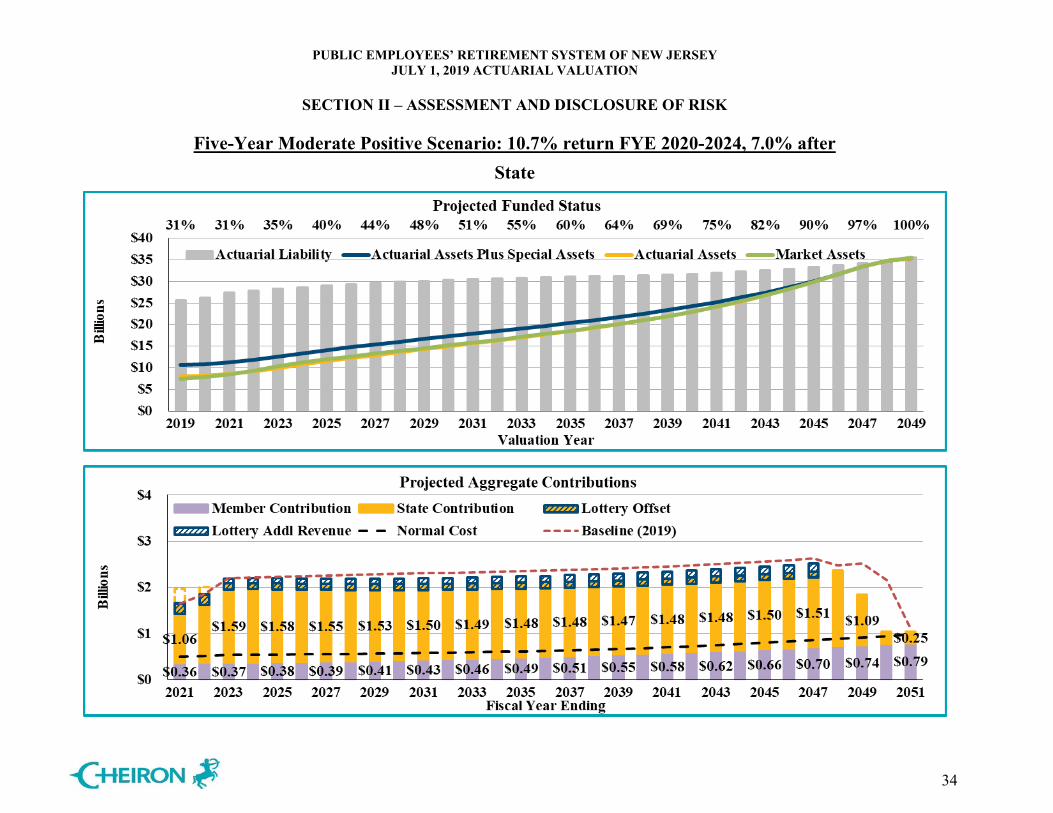
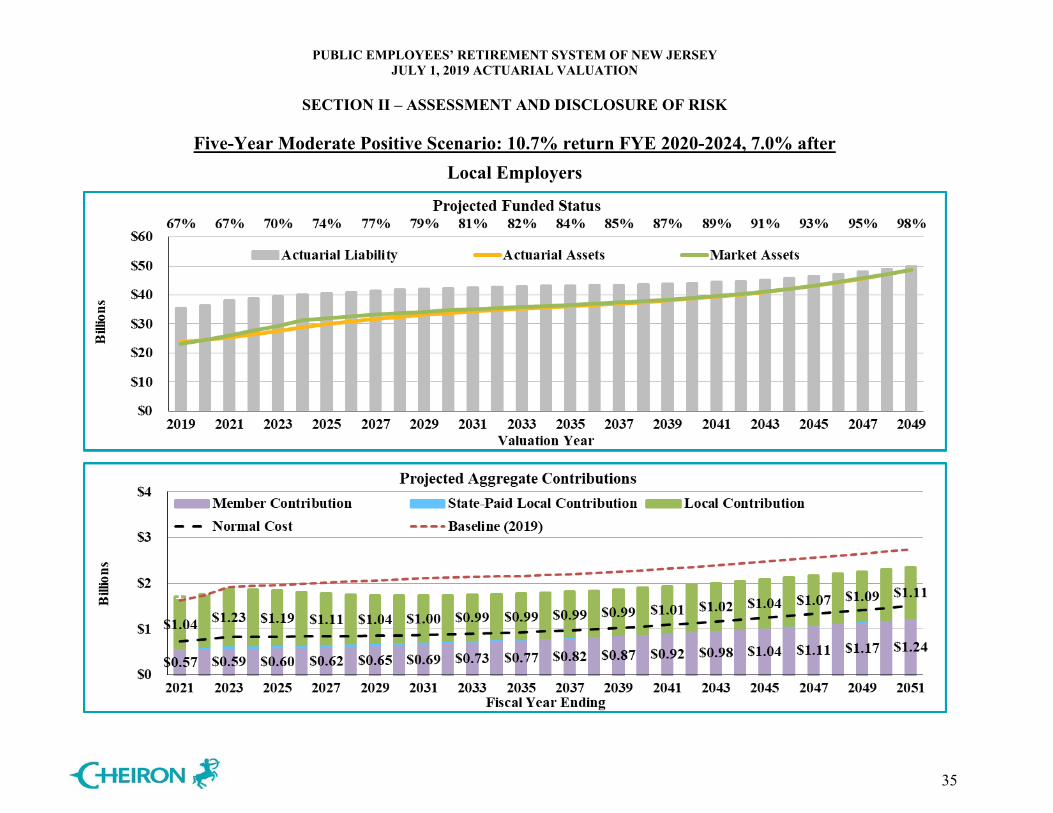
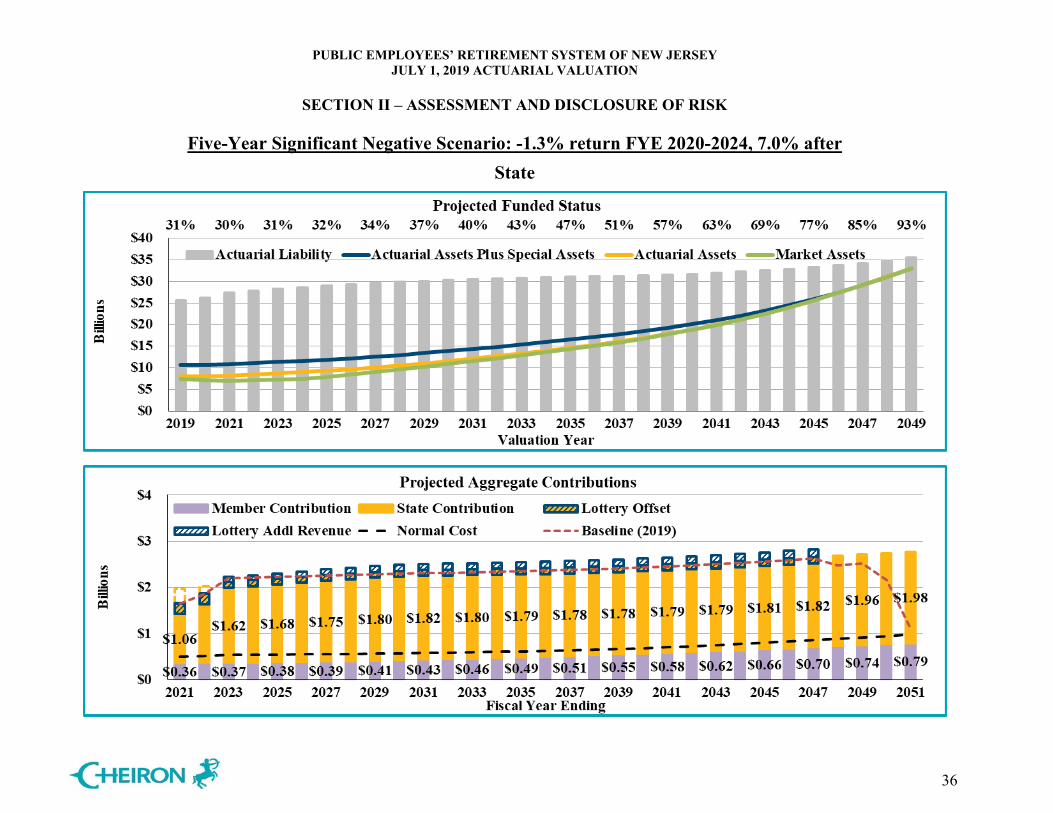
In reviewing each of these projections, it is the future trends, not necessarily the actual values, that are important to observe in consideration of the risks of the System and the potential volatility of future funded ratios and Statutory contribution levels. We note that when asset returns are high, excess assets may be used to offset employer costs. We have not shown the implications of a surplus and assume that the employer will always contribute at least the normal cost. The graphs on the following pages show the projections under each of these theoretical scenarios. Instead of the tread water line shown for the baseline projection, the contribution graphs include a dashed red line representing the expected contributions under the baseline projections shown in the Summary section to facilitate the comparison between the particular scenario and the baseline projections assuming all assumptions are met.

PUBLIC EMPLOYEES’ RETIREMENT SYSTEM OF NEW JERSEY JULY 1, 2019 ACTUARIAL VALUATION
SECTION II – ASSESSMENT AND DISCLOSURE OF RISK
28
One-Year Negative Shock Scenario: -10.7% return FYE 2020, 7.0% after State
PUBLIC EMPLOYEES’ RETIREMENT SYSTEM OF NEW JERSEY JULY 1, 2019 ACTUARIAL VALUATION
SECTION II – ASSESSMENT AND DISCLOSURE OF RISK
29
One-Year Negative Shock Scenario: -10.7% return FYE 2020, 7.0% after
Local Employers
PUBLIC EMPLOYEES’ RETIREMENT SYSTEM OF NEW JERSEY JULY 1, 2019 ACTUARIAL VALUATION
SECTION II – ASSESSMENT AND DISCLOSURE OF RISK
30
One-Year Positive Shock Scenario: 28.3% return FYE 2020, 7.0% after
State
PUBLIC EMPLOYEES’ RETIREMENT SYSTEM OF NEW JERSEY JULY 1, 2019 ACTUARIAL VALUATION
SECTION II – ASSESSMENT AND DISCLOSURE OF RISK
31
One-Year Positive Shock Scenario: 28.3% return FYE 2020, 7.0% after
Local Employers
PUBLIC EMPLOYEES’ RETIREMENT SYSTEM OF NEW JERSEY JULY 1, 2019 ACTUARIAL VALUATION
SECTION II – ASSESSMENT AND DISCLOSURE OF RISK
32
Five-Year Moderate Negative Scenario: 3.6% return FYE 2020-2024, 7.0% after
State
PUBLIC EMPLOYEES’ RETIREMENT SYSTEM OF NEW JERSEY JULY 1, 2019 ACTUARIAL VALUATION
SECTION II – ASSESSMENT AND DISCLOSURE OF RISK
33
Five-Year Moderate Negative Scenario: 3.6% return FYE 2020-2024, 7.0% after
Local Employers
PUBLIC EMPLOYEES’ RETIREMENT SYSTEM OF NEW JERSEY JULY 1, 2019 ACTUARIAL VALUATION
SECTION II – ASSESSMENT AND DISCLOSURE OF RISK
34
Five-Year Moderate Positive Scenario: 10.7% return FYE 2020-2024, 7.0% after
State
PUBLIC EMPLOYEES’ RETIREMENT SYSTEM OF NEW JERSEY JULY 1, 2019 ACTUARIAL VALUATION
SECTION II – ASSESSMENT AND DISCLOSURE OF RISK
35
Five-Year Moderate Positive Scenario: 10.7% return FYE 2020-2024, 7.0% after
Local Employers
PUBLIC EMPLOYEES’ RETIREMENT SYSTEM OF NEW JERSEY JULY 1, 2019 ACTUARIAL VALUATION
SECTION II – ASSESSMENT AND DISCLOSURE OF RISK
36
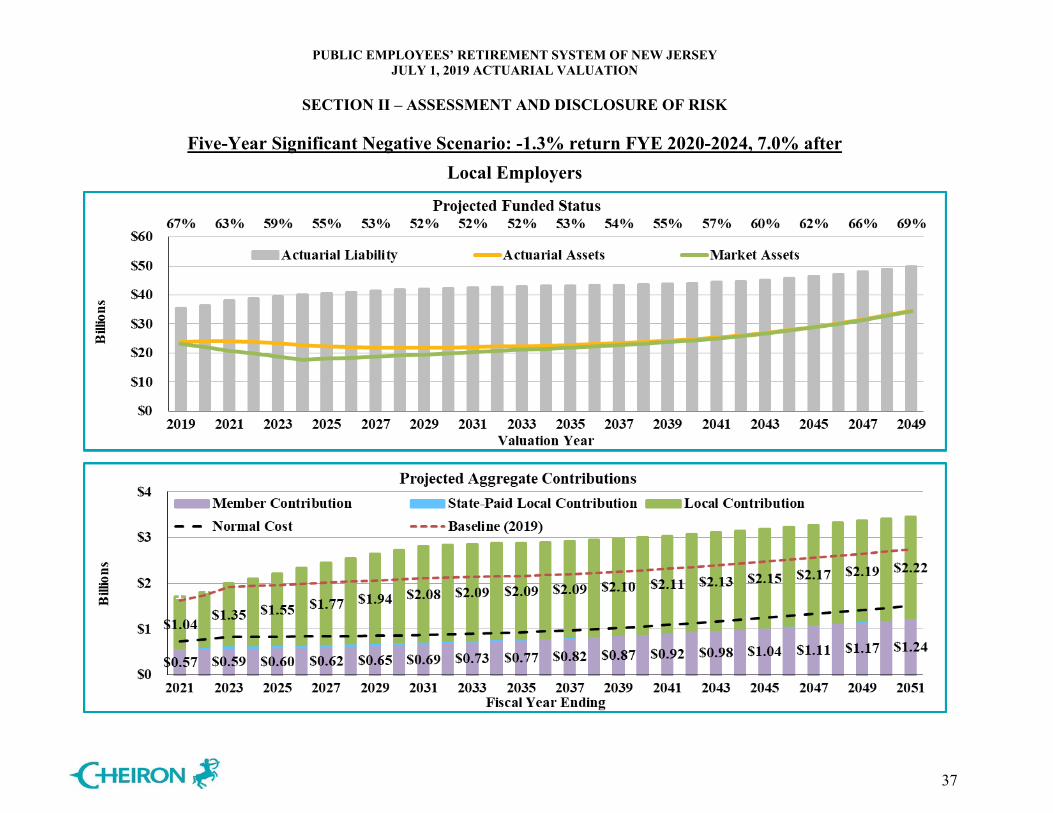
Five-Year Significant Negative Scenario: -1.3% return FYE 2020-2024, 7.0% after
State
PUBLIC EMPLOYEES’ RETIREMENT SYSTEM OF NEW JERSEY JULY 1, 2019 ACTUARIAL VALUATION
SECTION II – ASSESSMENT AND DISCLOSURE OF RISK
37
Five-Year Significant Negative Scenario: -1.3% return FYE 2020-2024, 7.0% after
Local Employers
PUBLIC EMPLOYEES’ RETIREMENT SYSTEM OF NEW JERSEY JULY 1, 2019 ACTUARIAL VALUATION
SECTION II – ASSESSMENT AND DISCLOSURE OF RISK
38
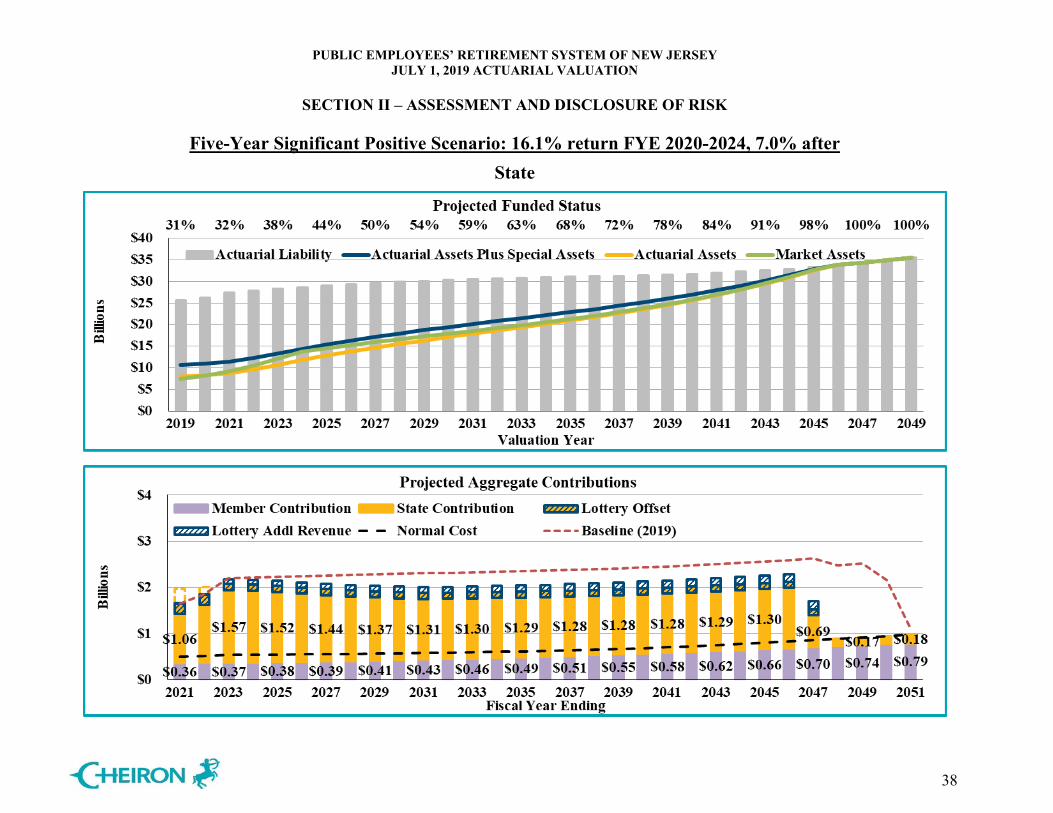
Five-Year Significant Positive Scenario: 16.1% return FYE 2020-2024, 7.0% after
State
PUBLIC EMPLOYEES’ RETIREMENT SYSTEM OF NEW JERSEY JULY 1, 2019 ACTUARIAL VALUATION
SECTION II – ASSESSMENT AND DISCLOSURE OF RISK
39
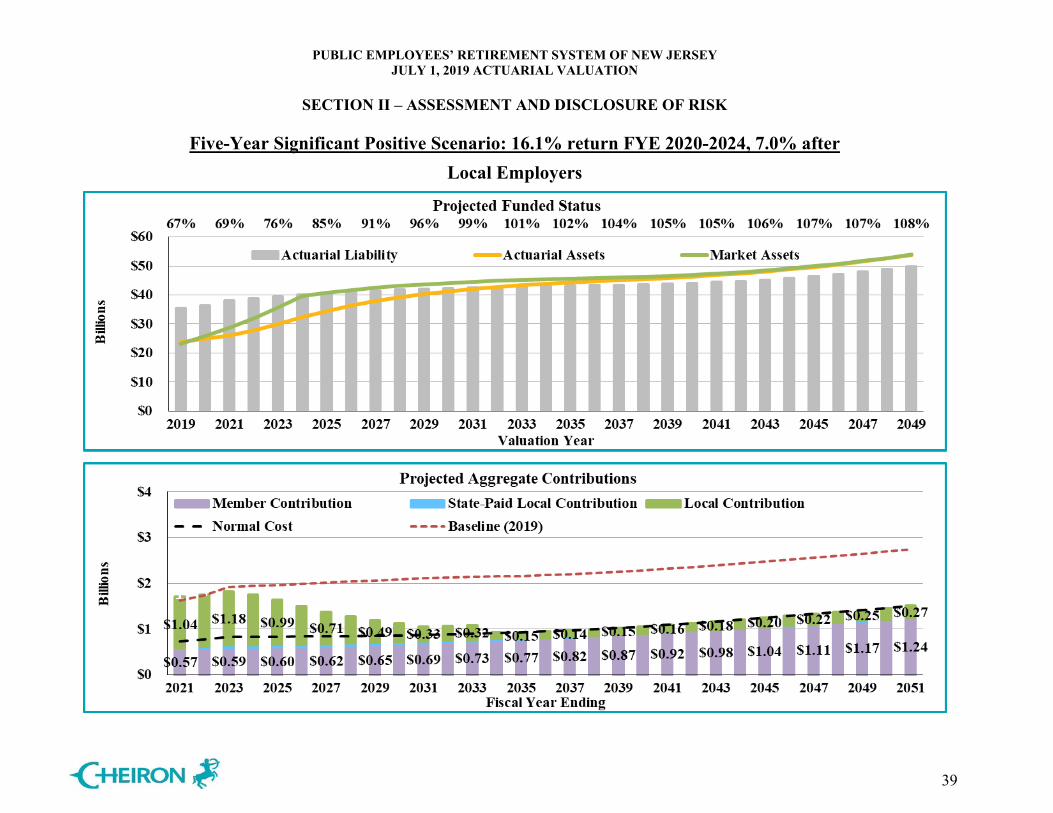
Five-Year Significant Positive Scenario: 16.1% return FYE 2020-2024, 7.0% after
Local Employers
PUBLIC EMPLOYEES’ RETIREMENT SYSTEM OF NEW JERSEY JULY 1, 2019 ACTUARIAL VALUATION
SECTION II – ASSESSMENT AND DISCLOSURE OF RISK
40
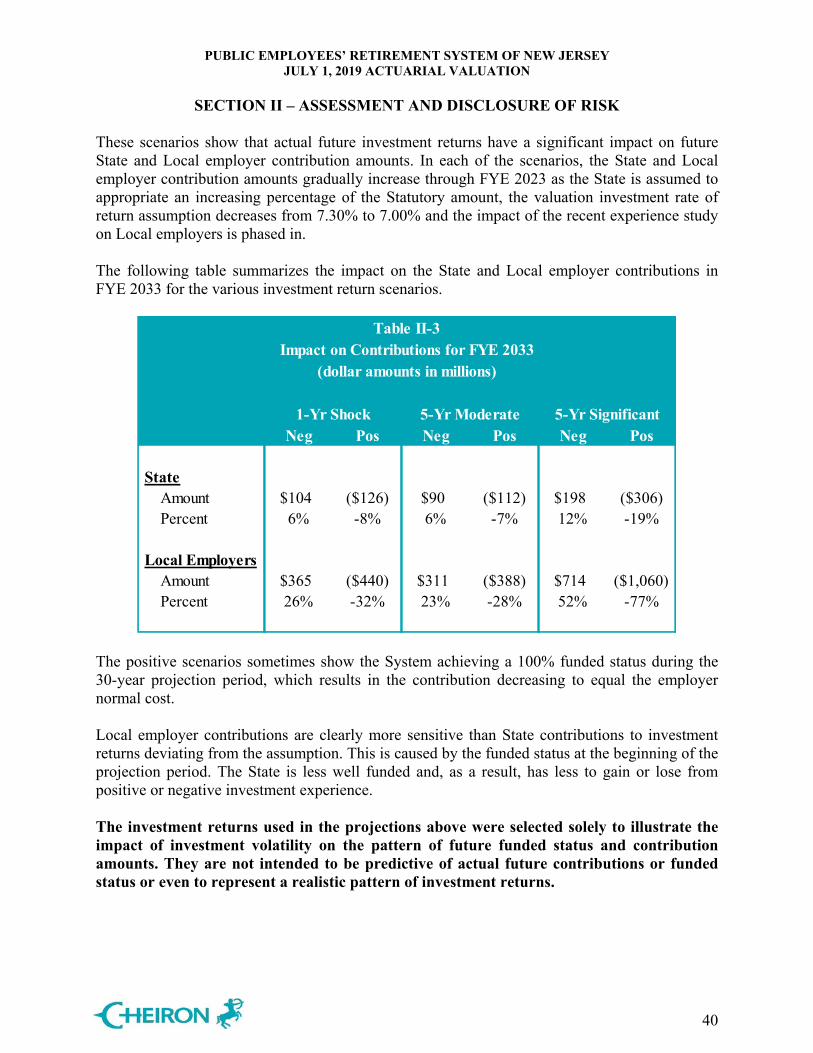
These scenarios show that actual future investment returns have a significant impact on future State and Local employer contribution amounts. In each of the scenarios, the State and Local employer contribution amounts gradually increase through FYE 2023 as the State is assumed to appropriate an increasing percentage of the Statutory amount, the valuation investment rate of return assumption decreases from 7.30% to 7.00% and the impact of the recent experience study on Local employers is phased in. The following table summarizes the impact on the State and Local employer contributions in FYE 2033 for the various investment return scenarios.
Table II-3Impact on Contributions for FYE 2033
(dollar amounts in millions)
1-Yr Shock 5-Yr Moderate 5-Yr SignificantNeg Pos Neg Pos Neg Pos
State Amount $104 ($126) $90 ($112) $198 ($306) Percent 6% -8% 6% -7% 12% -19%
Local Employers Amount $365 ($440) $311 ($388) $714 ($1,060) Percent 26% -32% 23% -28% 52% -77%
The positive scenarios sometimes show the System achieving a 100% funded status during the 30-year projection period, which results in the contribution decreasing to equal the employer normal cost. Local employer contributions are clearly more sensitive than State contributions to investment returns deviating from the assumption. This is caused by the funded status at the beginning of the projection period. The State is less well funded and, as a result, has less to gain or lose from positive or negative investment experience. The investment returns used in the projections above were selected solely to illustrate the impact of investment volatility on the pattern of future funded status and contribution amounts. They are not intended to be predictive of actual future contributions or funded status or even to represent a realistic pattern of investment returns.
PUBLIC EMPLOYEES’ RETIREMENT SYSTEM OF NEW JERSEY JULY 1, 2019 ACTUARIAL VALUATION
SECTION II – ASSESSMENT AND DISCLOSURE OF RISK
41
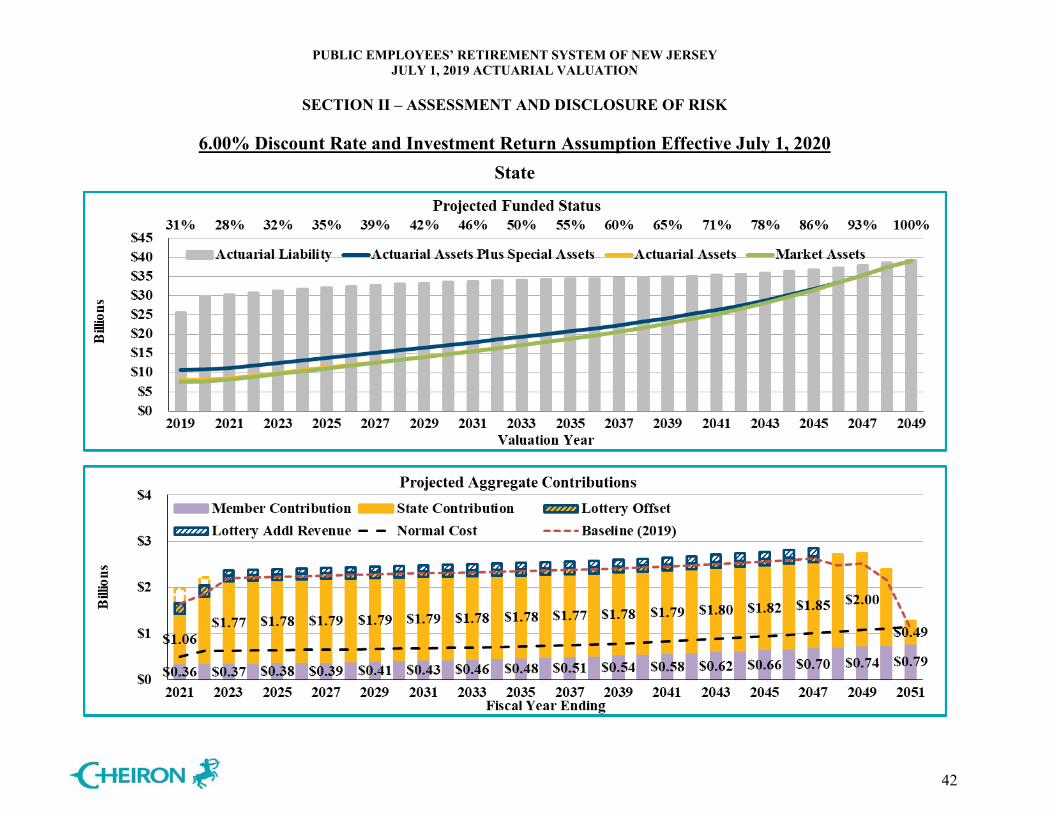
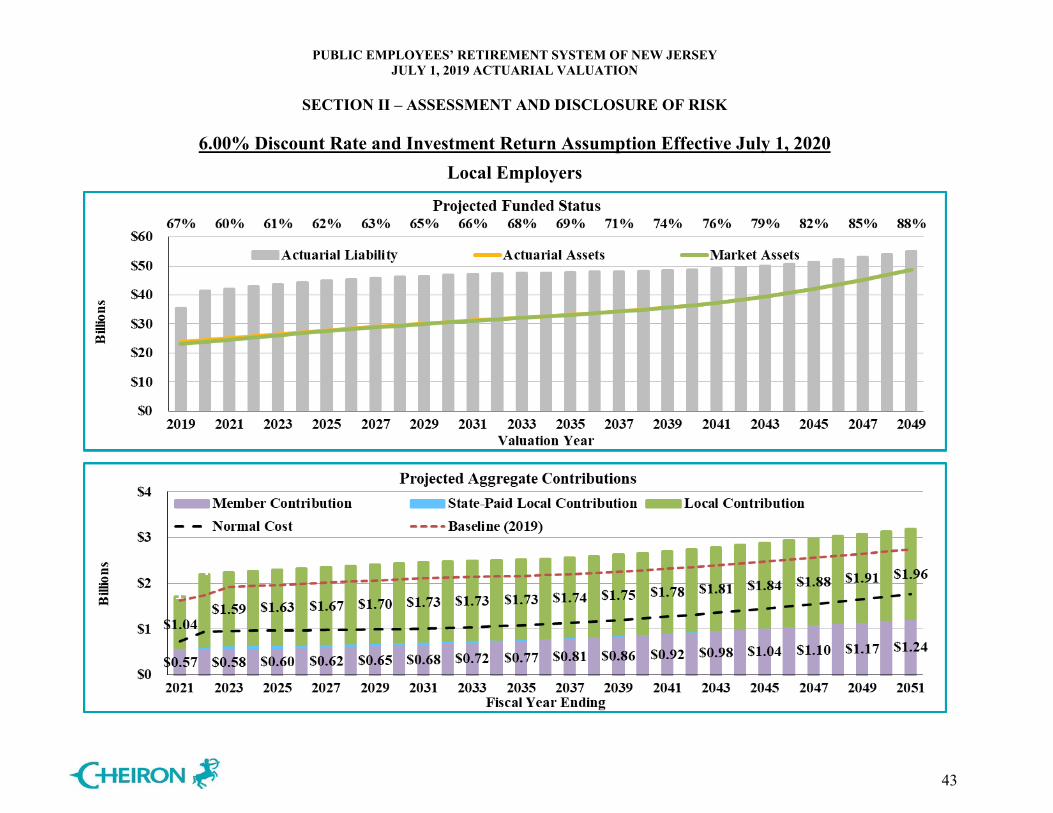
Assumption Change Risk – Sensitivity Testing As shown in Tables II-1 and II-2, assumption changes over the last decade have increased the State’s UAL by approximately $1,795.7 million and increased the Local employers’ UAL by approximately $2,205.9 million. The most significant changes were reductions in the discount rate, decreases in mortality rates and projections of mortality improvement. The reductions in discount rates have been largely driven by declines in interest rates that affect expectations of future investment returns. If there are further declines in interest rates or if there is a desire or need to reduce investment risk that reduces expected returns, the discount rate and expected returns may need to be reduced further. The charts on the following page show the impact on projected future funded status and contribution amounts if the discount rate and expected returns were reduced by 100 basis points to 6.00% beginning with the July 1, 2020 valuation. This scenario results in Statutory contributions that are about 11% higher for State and 25% higher for Local employers in FYE 2033 when compared to the baseline projection. Again, the contributions for Local employers are more sensitive to assumption changes because of the funded status at the time of the change.
PUBLIC EMPLOYEES’ RETIREMENT SYSTEM OF NEW JERSEY JULY 1, 2019 ACTUARIAL VALUATION
SECTION II – ASSESSMENT AND DISCLOSURE OF RISK
42
6.00% Discount Rate and Investment Return Assumption Effective July 1, 2020 State
PUBLIC EMPLOYEES’ RETIREMENT SYSTEM OF NEW JERSEY JULY 1, 2019 ACTUARIAL VALUATION
SECTION II – ASSESSMENT AND DISCLOSURE OF RISK
43
6.00% Discount Rate and Investment Return Assumption Effective July 1, 2020 Local Employers
PUBLIC EMPLOYEES’ RETIREMENT SYSTEM OF NEW JERSEY JULY 1, 2019 ACTUARIAL VALUATION
SECTION II – ASSESSMENT AND DISCLOSURE OF RISK
44
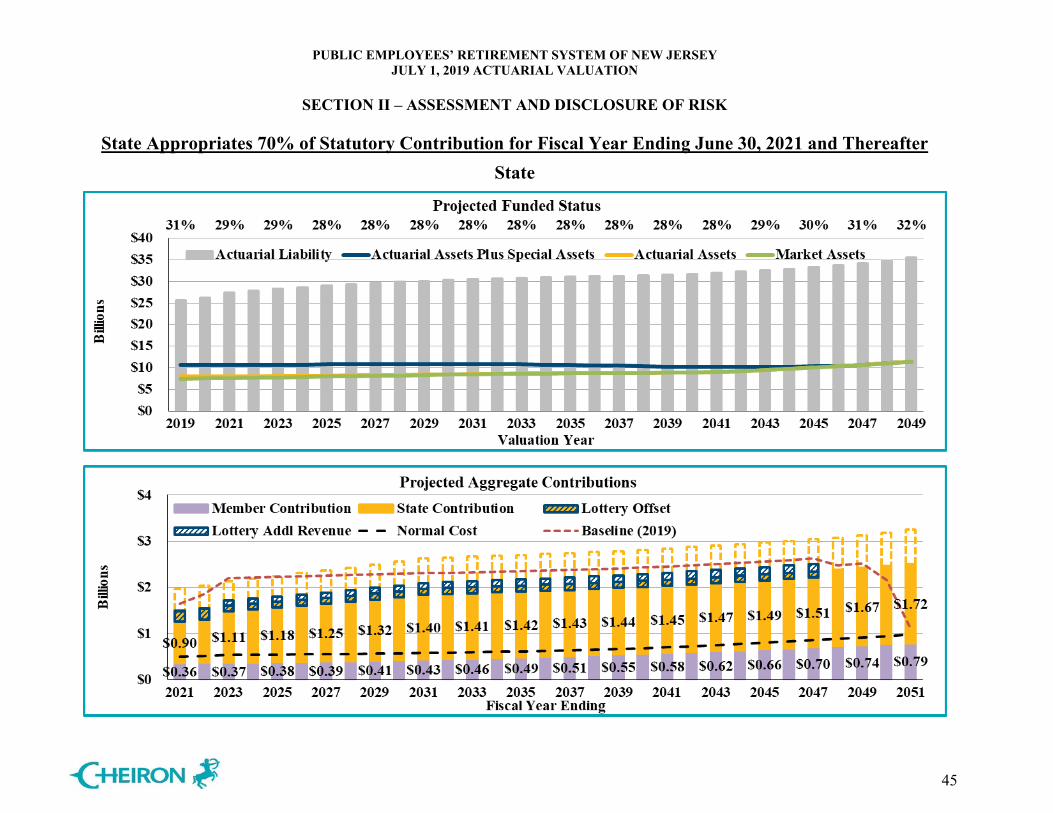
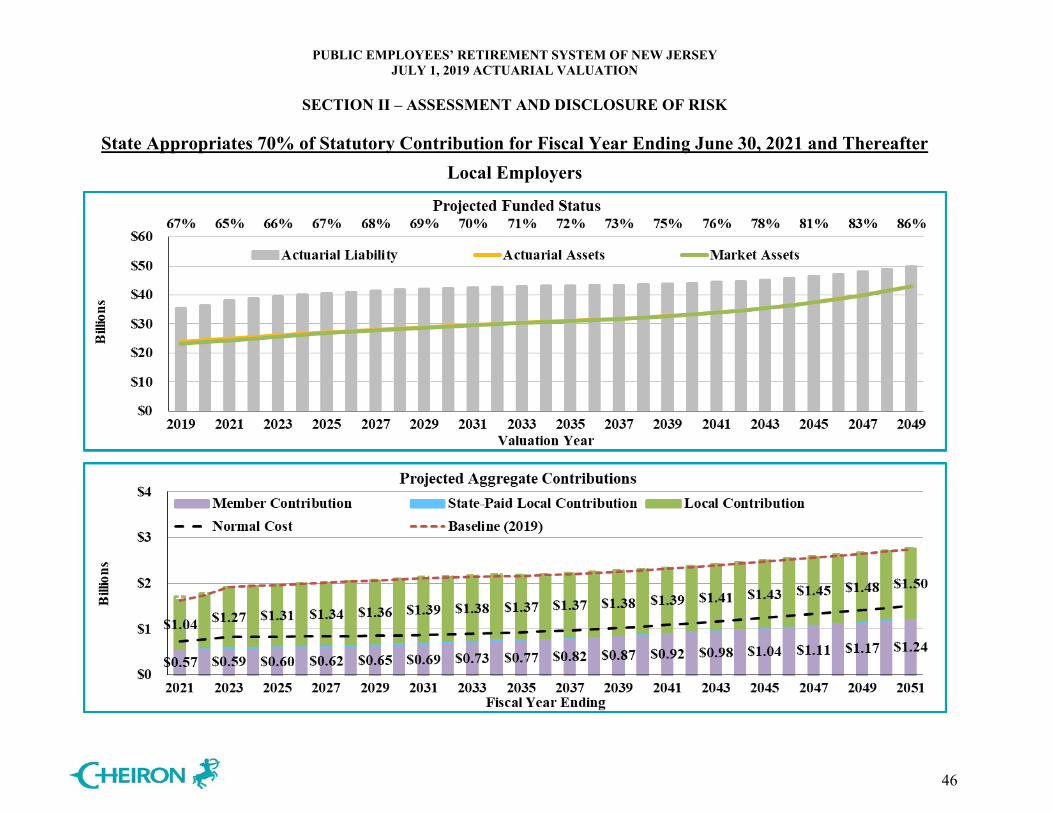
Contribution Risk – Sensitivity Testing The amortization method used to determine the Statutory contributions is designed to collect more than the tread water level and, therefore, gradually pay down the UAL. However, State appropriated contributions have consistently been less than the Statutory contributions and the tread water level, increasing the State’s UAL by $6,483.5 million and the Local employers’ UAL by $133.2 million over the last 10 years. The baseline projections assume the State appropriates 80% of the Statutory contribution in FYE 2021, and increases the percent by 10% a year, until reaching 100% of the Statutory contribution beginning with FYE 2023. State contributions are projected to be greater than the tread water level starting in FYE 2022. Contribution risk is the potential for actual future contributions to deviate from expected future contributions. The charts on the following pages illustrate the impact on projected future funded status and contribution amounts if the State appropriation remains at 70% of the Statutory contribution for each year in the future, rather than gradually increasing to 100% of the Statutory contribution. In illustrating contribution risk sensitivity, we assume the State appropriation percent remains at the current level of 70%; however, we assume that Local employers will continue to contribute 100% of the Statutory contribution as they have done historically, with the exception of FYE 2021 and 2022 when the impact of assumption changes from the recent experience study are phased-in. This scenario shows both the Statutory and appropriated State contributions gradually increasing over time. The State Statutory contributions quickly exceed the baseline. The appropriated State contributions are below the baseline initially and eventually grow to reach the same level, but with a lower funded ratio. The funded ratio at the end of the projection period is 32% compared to 100% under the baseline projections for the State portion. The projection of the Local employers’ portion of the System changes relatively little from the baseline because the State-paid Local obligation represents a relatively small portion of the total contributions for Local employers.
PUBLIC EMPLOYEES’ RETIREMENT SYSTEM OF NEW JERSEY JULY 1, 2019 ACTUARIAL VALUATION
SECTION II – ASSESSMENT AND DISCLOSURE OF RISK
45
State Appropriates 70% of Statutory Contribution for Fiscal Year Ending June 30, 2021 and Thereafter State
PUBLIC EMPLOYEES’ RETIREMENT SYSTEM OF NEW JERSEY JULY 1, 2019 ACTUARIAL VALUATION
SECTION II – ASSESSMENT AND DISCLOSURE OF RISK
46
State Appropriates 70% of Statutory Contribution for Fiscal Year Ending June 30, 2021 and Thereafter Local Employers

PUBLIC EMPLOYEES’ RETIREMENT SYSTEM OF NEW JERSEY JULY 1, 2019 ACTUARIAL VALUATION
SECTION II – ASSESSMENT AND DISCLOSURE OF RISK
47
More Detailed Assessment While a more detailed assessment is always valuable to enhance the understanding of the risks identified above, we believe the scenarios illustrated above cover the primary risks facing the Fund at this time. We would be happy to provide the Board with a more in-depth analysis at their request.
PUBLIC EMPLOYEES’ RETIREMENT SYSTEM OF NEW JERSEY JULY 1, 2019 ACTUARIAL VALUATION
SECTION III – ASSETS
48
The System uses and discloses two different asset measurements for funding, which are presented in this section of the report: market value and actuarial value of assets. The market value represents the value of the assets if they were liquidated on the valuation date. The actuarial value of assets is a value that smooths annual investment returns to reduce annual investment volatility and is used in determining contribution levels. In compliance with New Jersey Statute, the method used to calculate the actuarial value of assets recognizes 20% of the difference between the market value of assets and the expected actuarial value of assets each year. Actuarial Standards of Practice (ASOP) No. 44 states that the asset valuation method should produce an actuarial value of assets that falls within a reasonable range of market value, recognizes the difference between the market value and actuarial value of assets within a reasonably short period of time, and is likely to produce actuarial value of assets that are sometimes greater than and sometimes less than the corresponding market values. The asset method required under N. J. Statute does not meet the requirements of ASOP No. 44 because this method has produced actuarial value of assets which have consistently been greater than the market value of assets and recognizes investment losses slowly over time. Additionally, the method may produce an actuarial value of assets that falls outside of a reasonable range of the market value.
On the following pages, we present detailed information on the System’s assets: • Disclosure of assets at July 1, 2018 and July 1, 2019,
• Statement of cash flows during the year,
• Development of the actuarial value of assets,
• Disclosure of investment performance for the year,
• Development of the Special Asset Value (SAV), and
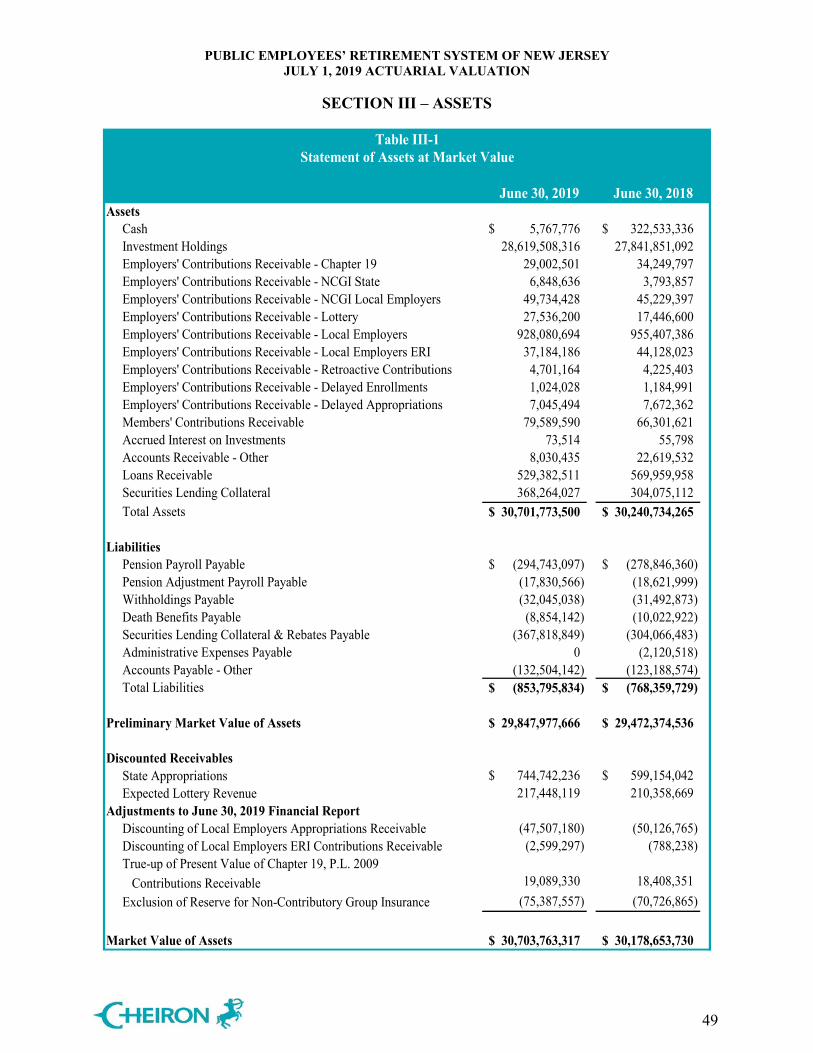
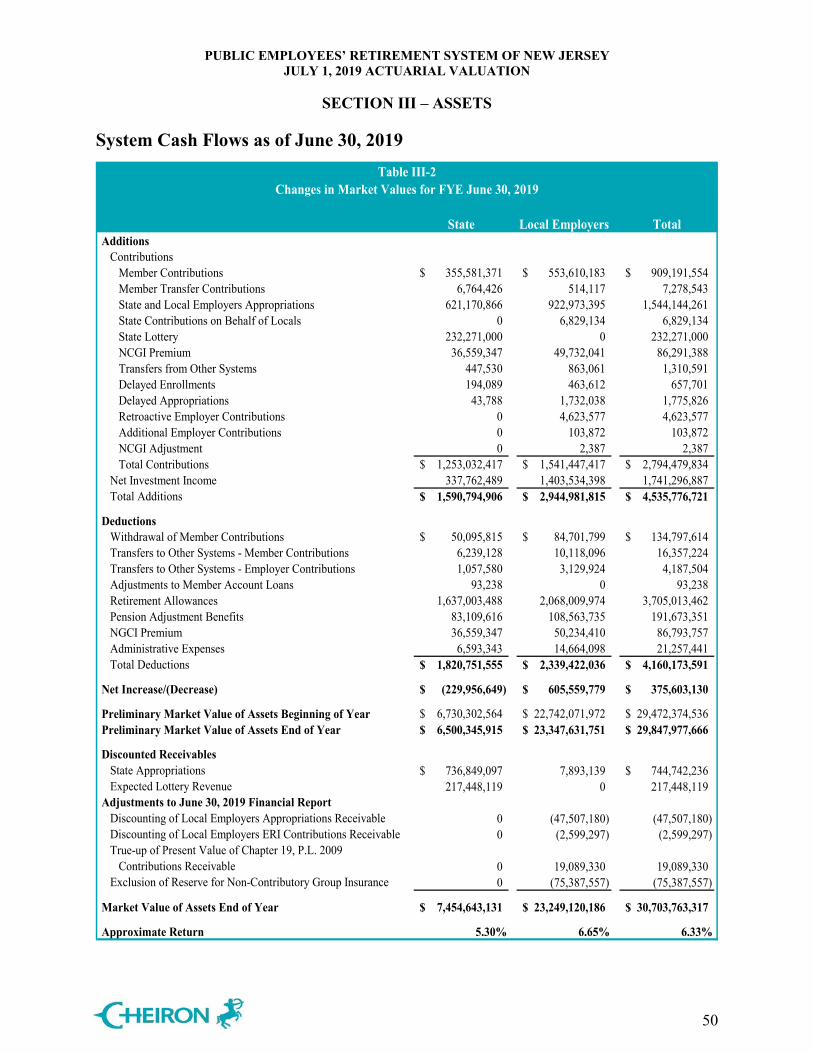
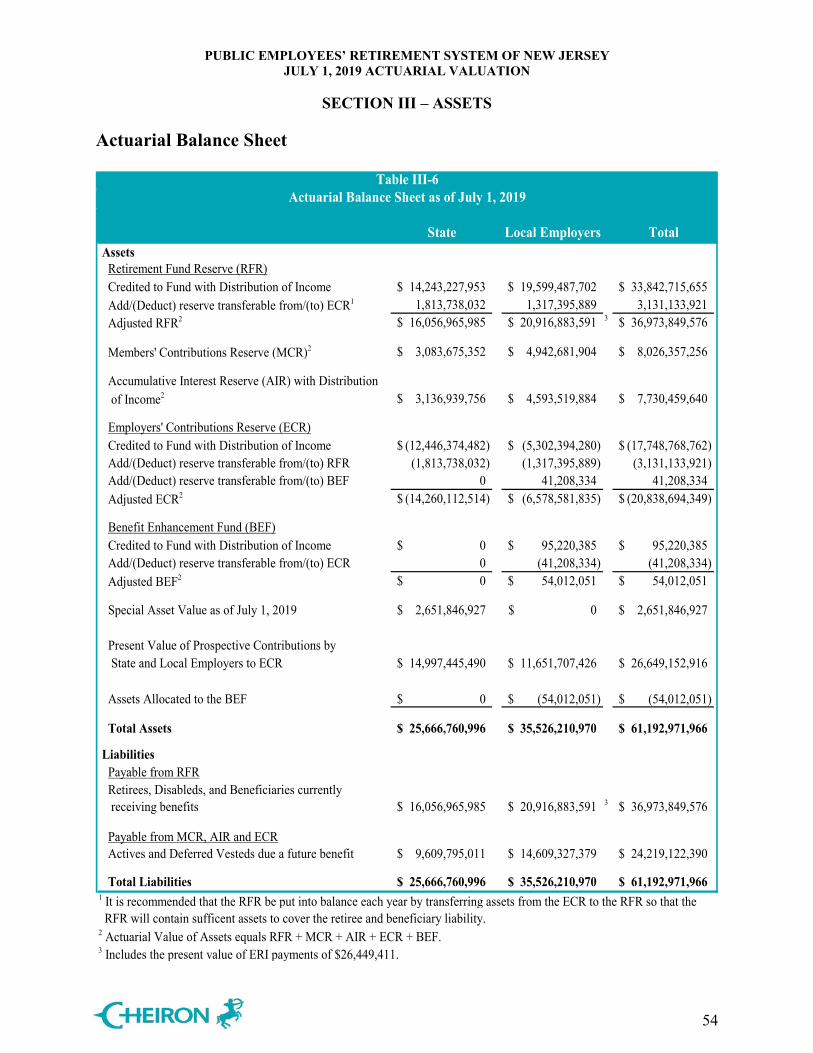
• Development of the Actuarial Balance Sheet. Disclosure The market value of assets represents a “snap-shot” value as of the last day of the fiscal year that provides the principal basis for measuring financial performance from one year to the next. Market values, however, can fluctuate widely with corresponding swings in the value of the investments. Because these fluctuations would cause volatility in employer contributions, an actuarial value of assets is developed. Table III-1 on the following page presents the market value as of June 30, 2018 and June 30, 2019. Table III-2 presents the System’s net cash flows from June 30, 2018 to June 30, 2019. Table III-3 presents the development of the Actuarial Value of Assets as of July 1, 2019.
PUBLIC EMPLOYEES’ RETIREMENT SYSTEM OF NEW JERSEY JULY 1, 2019 ACTUARIAL VALUATION
SECTION III – ASSETS
49
Table III-1Statement of Assets at Market Value
June 30, 2019 June 30, 2018Assets
Cash 5,767,776$ 322,533,336$ Investment Holdings 28,619,508,316 27,841,851,092 Employers' Contributions Receivable - Chapter 19 29,002,501 34,249,797 Employers' Contributions Receivable - NCGI State 6,848,636 3,793,857 Employers' Contributions Receivable - NCGI Local Employers 49,734,428 45,229,397 Employers' Contributions Receivable - Lottery 27,536,200 17,446,600 Employers' Contributions Receivable - Local Employers 928,080,694 955,407,386 Employers' Contributions Receivable - Local Employers ERI 37,184,186 44,128,023 Employers' Contributions Receivable - Retroactive Contributions 4,701,164 4,225,403 Employers' Contributions Receivable - Delayed Enrollments 1,024,028 1,184,991 Employers' Contributions Receivable - Delayed Appropriations 7,045,494 7,672,362 Members' Contributions Receivable 79,589,590 66,301,621 Accrued Interest on Investments 73,514 55,798 Accounts Receivable - Other 8,030,435 22,619,532 Loans Receivable 529,382,511 569,959,958 Securities Lending Collateral 368,264,027 304,075,112 Total Assets 30,701,773,500$ 30,240,734,265$
LiabilitiesPension Payroll Payable (294,743,097)$ (278,846,360)$ Pension Adjustment Payroll Payable (17,830,566) (18,621,999) Withholdings Payable (32,045,038) (31,492,873) Death Benefits Payable (8,854,142) (10,022,922) Securities Lending Collateral & Rebates Payable (367,818,849) (304,066,483) Administrative Expenses Payable 0 (2,120,518) Accounts Payable - Other (132,504,142) (123,188,574) Total Liabilities (853,795,834)$ (768,359,729)$
Preliminary Market Value of Assets 29,847,977,666$ 29,472,374,536$
Discounted ReceivablesState Appropriations 744,742,236$ 599,154,042$ Expected Lottery Revenue 217,448,119 210,358,669
Adjustments to June 30, 2019 Financial ReportDiscounting of Local Employers Appropriations Receivable (47,507,180) (50,126,765) Discounting of Local Employers ERI Contributions Receivable (2,599,297) (788,238) True-up of Present Value of Chapter 19, P.L. 2009 Contributions Receivable 19,089,330 18,408,351 Exclusion of Reserve for Non-Contributory Group Insurance (75,387,557) (70,726,865)
Market Value of Assets 30,703,763,317$ 30,178,653,730$
PUBLIC EMPLOYEES’ RETIREMENT SYSTEM OF NEW JERSEY JULY 1, 2019 ACTUARIAL VALUATION
SECTION III – ASSETS
50
System Cash Flows as of June 30, 2019
State Local Employers TotalAdditions
ContributionsMember Contributions 355,581,371$ 553,610,183$ 909,191,554$ Member Transfer Contributions 6,764,426 514,117 7,278,543 State and Local Employers Appropriations 621,170,866 922,973,395 1,544,144,261 State Contributions on Behalf of Locals 0 6,829,134 6,829,134 State Lottery 232,271,000 0 232,271,000 NCGI Premium 36,559,347 49,732,041 86,291,388 Transfers from Other Systems 447,530 863,061 1,310,591 Delayed Enrollments 194,089 463,612 657,701 Delayed Appropriations 43,788 1,732,038 1,775,826 Retroactive Employer Contributions 0 4,623,577 4,623,577 Additional Employer Contributions 0 103,872 103,872 NCGI Adjustment 0 2,387 2,387 Total Contributions 1,253,032,417$ 1,541,447,417$ 2,794,479,834$
Net Investment Income 337,762,489 1,403,534,398 1,741,296,887 Total Additions 1,590,794,906$ 2,944,981,815$ 4,535,776,721$
DeductionsWithdrawal of Member Contributions 50,095,815$ 84,701,799$ 134,797,614$ Transfers to Other Systems - Member Contributions 6,239,128 10,118,096 16,357,224 Transfers to Other Systems - Employer Contributions 1,057,580 3,129,924 4,187,504 Adjustments to Member Account Loans 93,238 0 93,238 Retirement Allowances 1,637,003,488 2,068,009,974 3,705,013,462 Pension Adjustment Benefits 83,109,616 108,563,735 191,673,351 NGCI Premium 36,559,347 50,234,410 86,793,757 Administrative Expenses 6,593,343 14,664,098 21,257,441 Total Deductions 1,820,751,555$ 2,339,422,036$ 4,160,173,591$
Net Increase/(Decrease) (229,956,649)$ 605,559,779$ 375,603,130$
Preliminary Market Value of Assets Beginning of Year 6,730,302,564$ 22,742,071,972$ 29,472,374,536$ Preliminary Market Value of Assets End of Year 6,500,345,915$ 23,347,631,751$ 29,847,977,666$
Discounted ReceivablesState Appropriations 736,849,097$ 7,893,139 744,742,236$ Expected Lottery Revenue 217,448,119 0 217,448,119
Adjustments to June 30, 2019 Financial ReportDiscounting of Local Employers Appropriations Receivable 0 (47,507,180) (47,507,180) Discounting of Local Employers ERI Contributions Receivable 0 (2,599,297) (2,599,297) True-up of Present Value of Chapter 19, P.L. 2009 Contributions Receivable 0 19,089,330 19,089,330 Exclusion of Reserve for Non-Contributory Group Insurance 0 (75,387,557) (75,387,557)
Market Value of Assets End of Year 7,454,643,131$ 23,249,120,186$ 30,703,763,317$
Approximate Return 5.30% 6.65% 6.33%
Table III-2Changes in Market Values for FYE June 30, 2019
PUBLIC EMPLOYEES’ RETIREMENT SYSTEM OF NEW JERSEY JULY 1, 2019 ACTUARIAL VALUATION
SECTION III – ASSETS
51
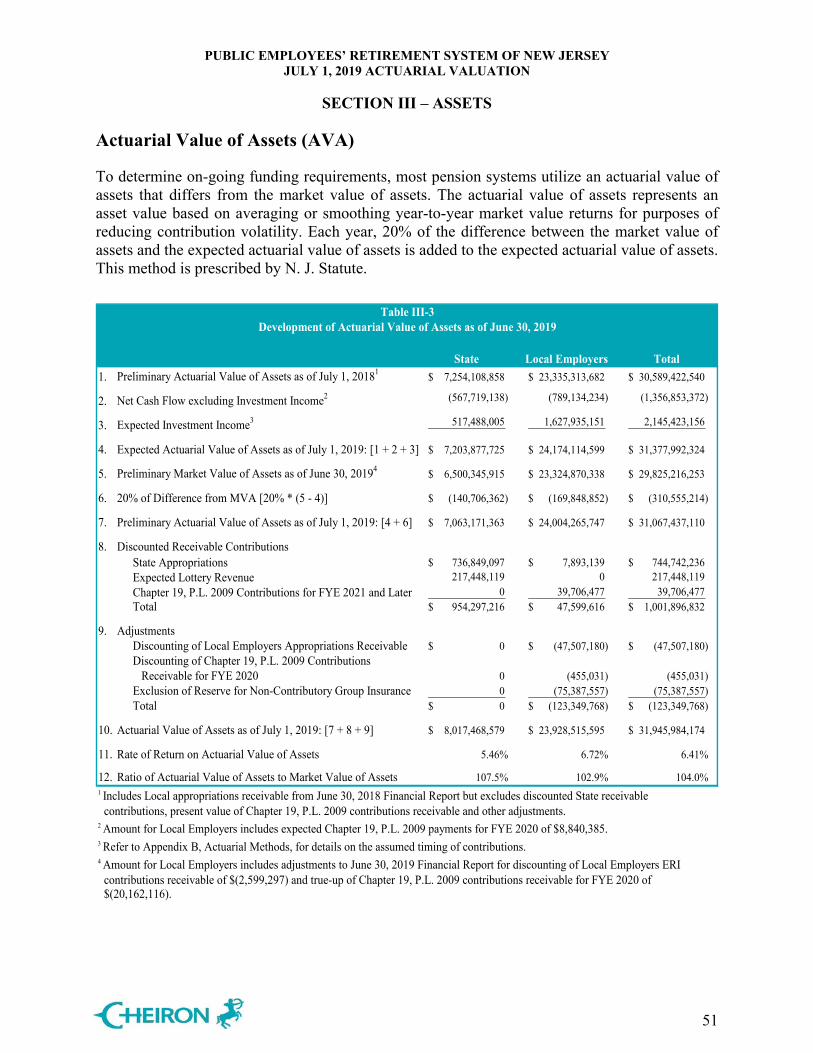
Actuarial Value of Assets (AVA)
To determine on-going funding requirements, most pension systems utilize an actuarial value of assets that differs from the market value of assets. The actuarial value of assets represents an asset value based on averaging or smoothing year-to-year market value returns for purposes of reducing contribution volatility. Each year, 20% of the difference between the market value of assets and the expected actuarial value of assets is added to the expected actuarial value of assets. This method is prescribed by N. J. Statute.
State Local Employers Total1. Preliminary Actuarial Value of Assets as of July 1, 20181 7,254,108,858$ 23,335,313,682$ 30,589,422,540$
2. Net Cash Flow excluding Investment Income2 (567,719,138) (789,134,234) (1,356,853,372)
3. Expected Investment Income3 517,488,005 1,627,935,151 2,145,423,156
4. Expected Actuarial Value of Assets as of July 1, 2019: [1 + 2 + 3] 7,203,877,725$ 24,174,114,599$ 31,377,992,324$
5. Preliminary Market Value of Assets as of June 30, 20194 6,500,345,915$ 23,324,870,338$ 29,825,216,253$
6. 20% of Difference from MVA [20% * (5 - 4)] (140,706,362)$ (169,848,852)$ (310,555,214)$
7. Preliminary Actuarial Value of Assets as of July 1, 2019: [4 + 6] 7,063,171,363$ 24,004,265,747$ 31,067,437,110$
8. Discounted Receivable Contributions State Appropriations 736,849,097$ 7,893,139$ 744,742,236$ Expected Lottery Revenue 217,448,119 0 217,448,119 Chapter 19, P.L. 2009 Contributions for FYE 2021 and Later 0 39,706,477 39,706,477 Total 954,297,216$ 47,599,616$ 1,001,896,832$
9. Adjustments Discounting of Local Employers Appropriations Receivable 0$ (47,507,180)$ (47,507,180)$ Discounting of Chapter 19, P.L. 2009 Contributions Receivable for FYE 2020 0 (455,031) (455,031) Exclusion of Reserve for Non-Contributory Group Insurance 0 (75,387,557) (75,387,557) Total 0$ (123,349,768)$ (123,349,768)$
10. Actuarial Value of Assets as of July 1, 2019: [7 + 8 + 9] 8,017,468,579$ 23,928,515,595$ 31,945,984,174$
11. Rate of Return on Actuarial Value of Assets 5.46% 6.72% 6.41%
12. Ratio of Actuarial Value of Assets to Market Value of Assets 107.5% 102.9% 104.0%1 Includes Local appropriations receivable from June 30, 2018 Financial Report but excludes discounted State receivable contributions, present value of Chapter 19, P.L. 2009 contributions receivable and other adjustments.2 Amount for Local Employers includes expected Chapter 19, P.L. 2009 payments for FYE 2020 of $8,840,385.3 Refer to Appendix B, Actuarial Methods, for details on the assumed timing of contributions.4 Amount for Local Employers includes adjustments to June 30, 2019 Financial Report for discounting of Local Employers ERI contributions receivable of $(2,599,297) and true-up of Chapter 19, P.L. 2009 contributions receivable for FYE 2020 of $(20,162,116).
Table III-3Development of Actuarial Value of Assets as of June 30, 2019
PUBLIC EMPLOYEES’ RETIREMENT SYSTEM OF NEW JERSEY JULY 1, 2019 ACTUARIAL VALUATION
SECTION III – ASSETS
52
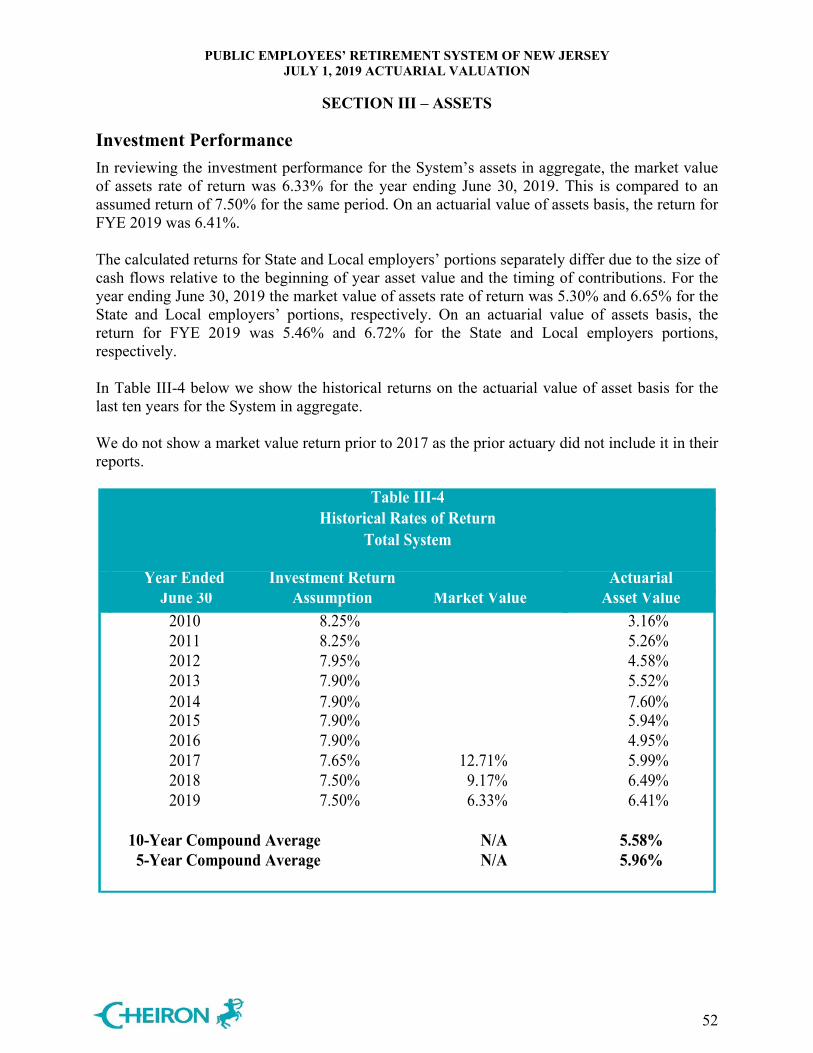
Investment Performance In reviewing the investment performance for the System’s assets in aggregate, the market value of assets rate of return was 6.33% for the year ending June 30, 2019. This is compared to an assumed return of 7.50% for the same period. On an actuarial value of assets basis, the return for FYE 2019 was 6.41%. The calculated returns for State and Local employers’ portions separately differ due to the size of cash flows relative to the beginning of year asset value and the timing of contributions. For the year ending June 30, 2019 the market value of assets rate of return was 5.30% and 6.65% for the State and Local employers’ portions, respectively. On an actuarial value of assets basis, the return for FYE 2019 was 5.46% and 6.72% for the State and Local employers portions, respectively. In Table III-4 below we show the historical returns on the actuarial value of asset basis for the last ten years for the System in aggregate. We do not show a market value return prior to 2017 as the prior actuary did not include it in their reports.
Table III-4Historical Rates of Return
Total System
Year Ended Investment Return A Actuarial June 30 Assumption Market Value A Asset Value
2010 8.25% 3.16%2011 8.25% 5.26%2012 7.95% 4.58%2013 7.90% 5.52%2014 7.90% 7.60%2015 7.90% 5.94%2016 7.90% 4.95%2017 7.65% 12.71% 5.99%2018 7.50% 9.17% 6.49%2019 7.50% 6.33% 6.41%
10-Year Compound Average N/A 5.58% 5-Year Compound Average N/A 5.96%
PUBLIC EMPLOYEES’ RETIREMENT SYSTEM OF NEW JERSEY JULY 1, 2019 ACTUARIAL VALUATION
SECTION III – ASSETS
53
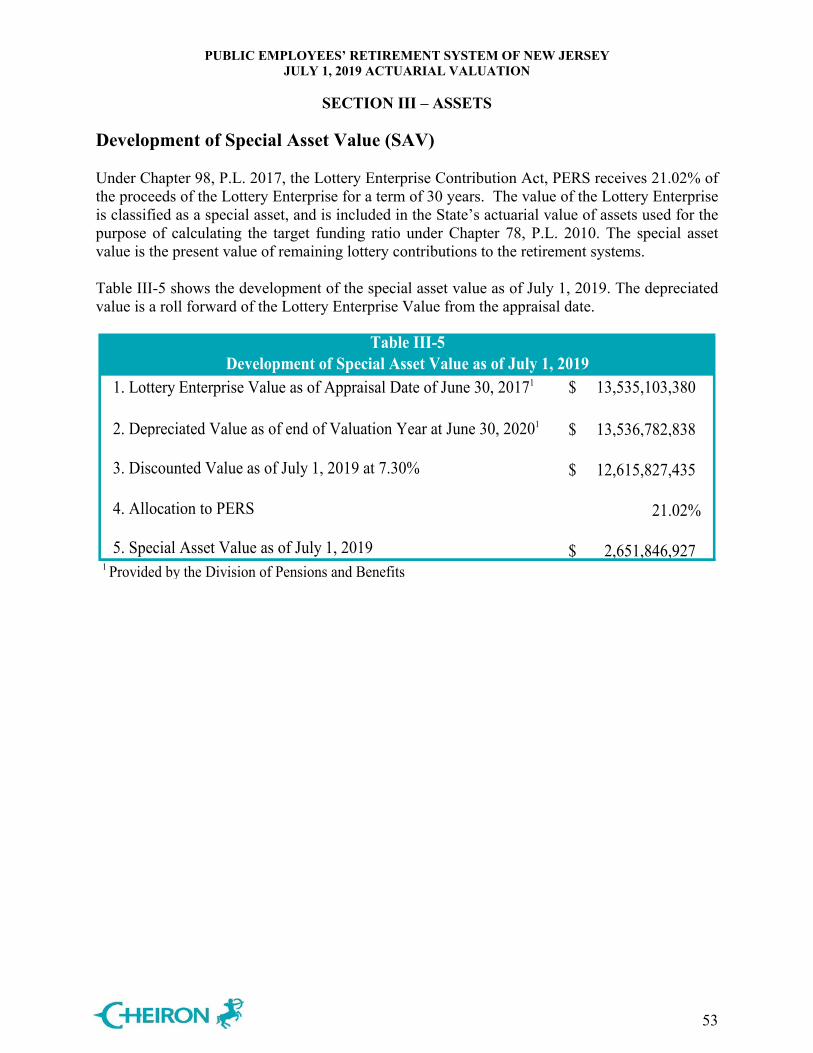
Development of Special Asset Value (SAV) Under Chapter 98, P.L. 2017, the Lottery Enterprise Contribution Act, PERS receives 21.02% of the proceeds of the Lottery Enterprise for a term of 30 years. The value of the Lottery Enterprise is classified as a special asset, and is included in the State’s actuarial value of assets used for the purpose of calculating the target funding ratio under Chapter 78, P.L. 2010. The special asset value is the present value of remaining lottery contributions to the retirement systems. Table III-5 shows the development of the special asset value as of July 1, 2019. The depreciated value is a roll forward of the Lottery Enterprise Value from the appraisal date.
Table III-5
1. Lottery Enterprise Value as of Appraisal Date of June 30, 20171 13,535,103,380$
2. Depreciated Value as of end of Valuation Year at June 30, 20201 13,536,782,838$
3. Discounted Value as of July 1, 2019 at 7.30% 12,615,827,435$
4. Allocation to PERS 21.02%
5. Special Asset Value as of July 1, 2019 2,651,846,927$ 1 Provided by the Division of Pensions and Benefits
Development of Special Asset Value as of July 1, 2019
PUBLIC EMPLOYEES’ RETIREMENT SYSTEM OF NEW JERSEY JULY 1, 2019 ACTUARIAL VALUATION
SECTION III – ASSETS
54
Actuarial Balance Sheet
State Local Employers TotalAssets Retirement Fund Reserve (RFR) Credited to Fund with Distribution of Income 14,243,227,953$ 19,599,487,702$ 33,842,715,655$ Add/(Deduct) reserve transferable from/(to) ECR1 1,813,738,032 1,317,395,889 3,131,133,921 Adjusted RFR2 16,056,965,985$ 20,916,883,591$ 3 36,973,849,576$
Members' Contributions Reserve (MCR)2 3,083,675,352$ 4,942,681,904$ 8,026,357,256$
Accumulative Interest Reserve (AIR) with Distribution of Income2 3,136,939,756$ 4,593,519,884$ 7,730,459,640$
Employers' Contributions Reserve (ECR) Credited to Fund with Distribution of Income (12,446,374,482)$ (5,302,394,280)$ (17,748,768,762)$ Add/(Deduct) reserve transferable from/(to) RFR (1,813,738,032) (1,317,395,889) (3,131,133,921) Add/(Deduct) reserve transferable from/(to) BEF 0 41,208,334 41,208,334 Adjusted ECR2 (14,260,112,514)$ (6,578,581,835)$ (20,838,694,349)$
Benefit Enhancement Fund (BEF) Credited to Fund with Distribution of Income 0$ 95,220,385$ 95,220,385$ Add/(Deduct) reserve transferable from/(to) ECR 0 (41,208,334) (41,208,334) Adjusted BEF2 0$ 54,012,051$ 54,012,051$
Special Asset Value as of July 1, 2019 2,651,846,927$ 0$ 2,651,846,927$
Present Value of Prospective Contributions by State and Local Employers to ECR 14,997,445,490$ 11,651,707,426$ 26,649,152,916$
Assets Allocated to the BEF 0$ (54,012,051)$ (54,012,051)$
Total Assets 25,666,760,996$ 35,526,210,970$ 61,192,971,966$
Liabilities Payable from RFR Retirees, Disableds, and Beneficiaries currently receiving benefits 16,056,965,985$ 20,916,883,591$ 3 36,973,849,576$
Payable from MCR, AIR and ECR Actives and Deferred Vesteds due a future benefit 9,609,795,011$ 14,609,327,379$ 24,219,122,390$
Total Liabilities 25,666,760,996$ 35,526,210,970$ 61,192,971,966$ 1 It is recommended that the RFR be put into balance each year by transferring assets from the ECR to the RFR so that the RFR will contain sufficent assets to cover the retiree and beneficiary liability.2 Actuarial Value of Assets equals RFR + MCR + AIR + ECR + BEF.3 Includes the present value of ERI payments of $26,449,411.
Table III-6Actuarial Balance Sheet as of July 1, 2019
PUBLIC EMPLOYEES’ RETIREMENT SYSTEM OF NEW JERSEY JULY 1, 2019 ACTUARIAL VALUATION
SECTION IV – LIABILITIES
55
In this section, we present detailed information on the liabilities of the System, including: • Disclosure of liabilities at July 1, 2018 and July 1, 2019,
• Active liabilities broken down by Tier, and
• The development of the actuarial gain and loss. Disclosure The Actuarial Liability is used for determining employer contributions. For PERS, the funding method employed is the Projected Unit Credit (PUC) Actuarial Cost Method. Under this funding method, the actuarial liability is calculated as the actuarial present value of the projected benefits allocated to periods prior to the valuation year. This liability is determined for funding purposes and is not appropriate for measuring the cost of settling plan liabilities by purchasing annuities or paying lump sums.
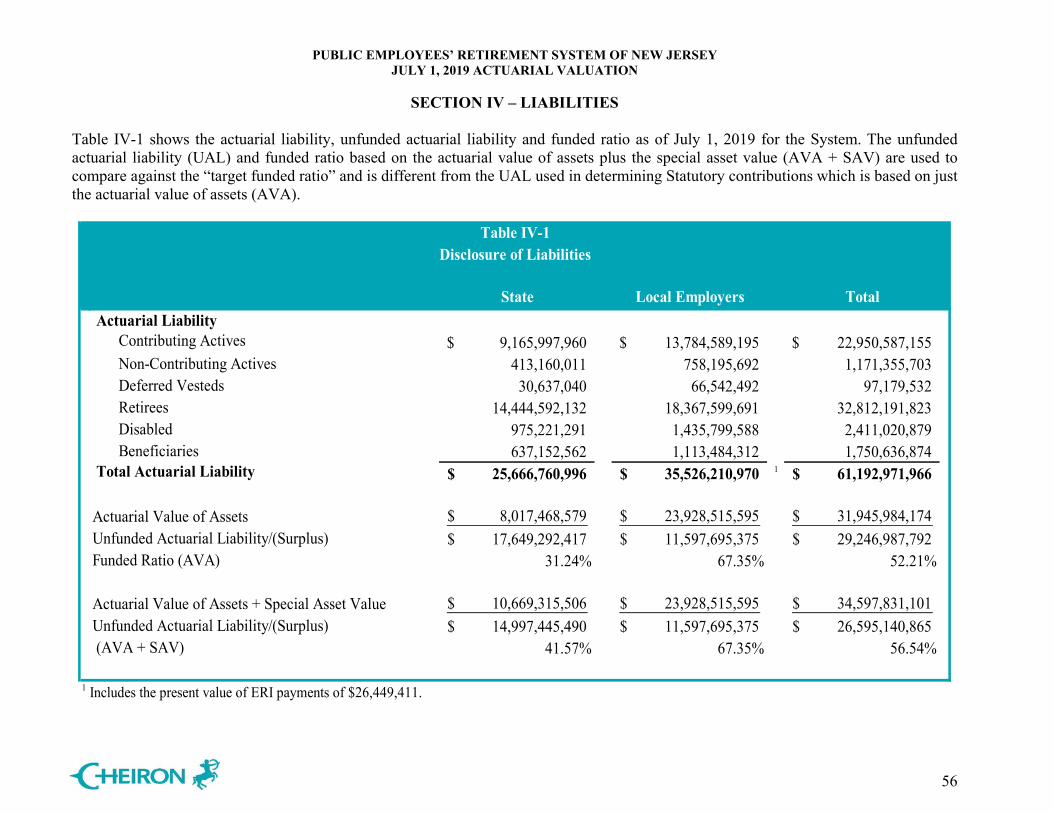
PUBLIC EMPLOYEES’ RETIREMENT SYSTEM OF NEW JERSEY JULY 1, 2019 ACTUARIAL VALUATION
SECTION IV – LIABILITIES
56
Table IV-1 shows the actuarial liability, unfunded actuarial liability and funded ratio as of July 1, 2019 for the System. The unfunded actuarial liability (UAL) and funded ratio based on the actuarial value of assets plus the special asset value (AVA + SAV) are used to compare against the “target funded ratio” and is different from the UAL used in determining Statutory contributions which is based on just the actuarial value of assets (AVA).
Table IV-1 Disclosure of Liabilities
State Local Employers Total Actuarial Liability
Contributing Actives 9,165,997,960$ 13,784,589,195$ 22,950,587,155$ Non-Contributing Actives 413,160,011 758,195,692 1,171,355,703 Deferred Vesteds 30,637,040 66,542,492 97,179,532 Retirees 14,444,592,132 18,367,599,691 32,812,191,823 Disabled 975,221,291 1,435,799,588 2,411,020,879 Beneficiaries 637,152,562 1,113,484,312 1,750,636,874
Total Actuarial Liability 25,666,760,996$ 35,526,210,970$ 1 61,192,971,966$
Actuarial Value of Assets 8,017,468,579$ 23,928,515,595$ 31,945,984,174$ Unfunded Actuarial Liability/(Surplus) 17,649,292,417$ 11,597,695,375$ 29,246,987,792$ Funded Ratio (AVA) 31.24% 67.35% 52.21%
Actuarial Value of Assets + Special Asset Value 10,669,315,506$ 23,928,515,595$ 34,597,831,101$ Unfunded Actuarial Liability/(Surplus) 14,997,445,490$ 11,597,695,375$ 26,595,140,865$ (AVA + SAV) 41.57% 67.35% 56.54%
1 Includes the present value of ERI payments of $26,449,411.
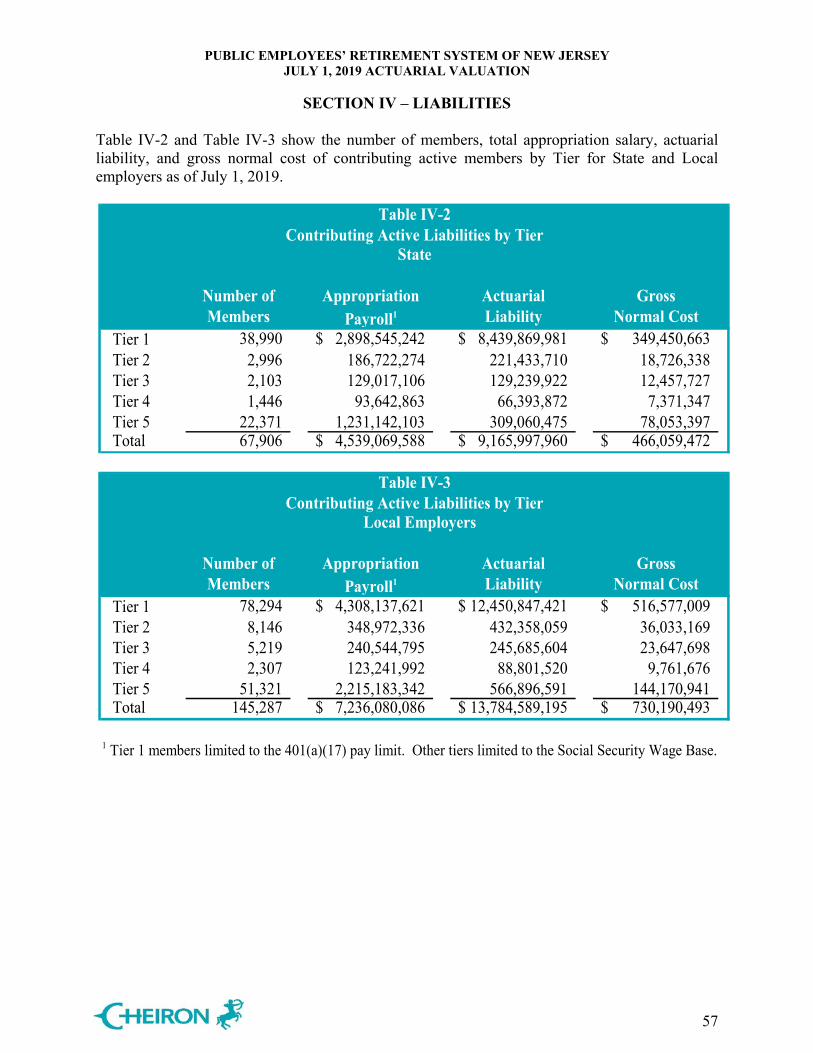
PUBLIC EMPLOYEES’ RETIREMENT SYSTEM OF NEW JERSEY JULY 1, 2019 ACTUARIAL VALUATION
SECTION IV – LIABILITIES
57
Table IV-2 and Table IV-3 show the number of members, total appropriation salary, actuarial liability, and gross normal cost of contributing active members by Tier for State and Local employers as of July 1, 2019.
Table IV-2
Contributing Active Liabilities by Tier State
Number of Appropriation Actuarial GrossMembers Payroll1 Liability Normal Cost
Tier 1 38,990 2,898,545,242$ 8,439,869,981$ 349,450,663$ Tier 2 2,996 186,722,274 221,433,710 18,726,338 Tier 3 2,103 129,017,106 129,239,922 12,457,727 Tier 4 1,446 93,642,863 66,393,872 7,371,347 Tier 5 22,371 1,231,142,103 309,060,475 78,053,397 Total 67,906 4,539,069,588$ 9,165,997,960$ 466,059,472$
Table IV-3
Contributing Active Liabilities by Tier Local Employers
Number of Appropriation Actuarial GrossMembers Payroll1 Liability Normal Cost
Tier 1 78,294 4,308,137,621$ 12,450,847,421$ 516,577,009$ Tier 2 8,146 348,972,336 432,358,059 36,033,169 Tier 3 5,219 240,544,795 245,685,604 23,647,698 Tier 4 2,307 123,241,992 88,801,520 9,761,676 Tier 5 51,321 2,215,183,342 566,896,591 144,170,941 Total 145,287 7,236,080,086$ 13,784,589,195$ 730,190,493$
1 Tier 1 members limited to the 401(a)(17) pay limit. Other tiers limited to the Social Security Wage Base.
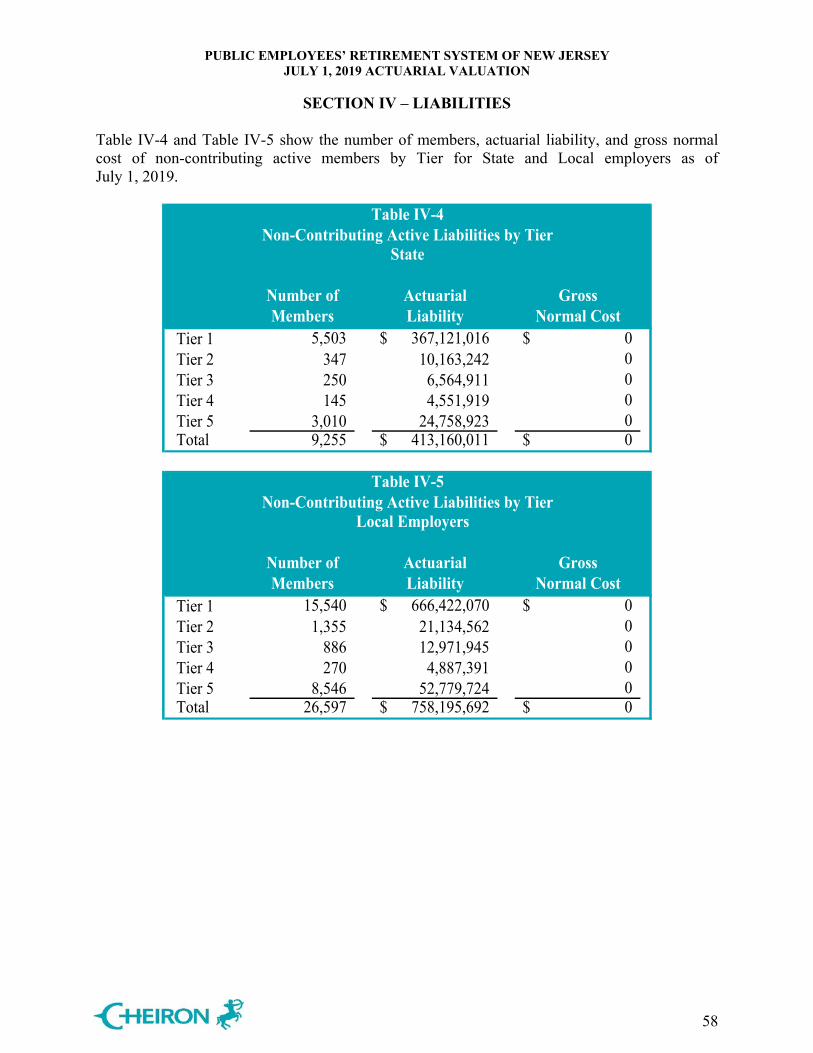
PUBLIC EMPLOYEES’ RETIREMENT SYSTEM OF NEW JERSEY JULY 1, 2019 ACTUARIAL VALUATION
SECTION IV – LIABILITIES
58
Table IV-4 and Table IV-5 show the number of members, actuarial liability, and gross normal cost of non-contributing active members by Tier for State and Local employers as of July 1, 2019.
Table IV-4
Non-Contributing Active Liabilities by Tier State
Number of Actuarial GrossMembers Liability Normal Cost
Tier 1 5,503 367,121,016$ 0$ Tier 2 347 10,163,242 0 Tier 3 250 6,564,911 0 Tier 4 145 4,551,919 0 Tier 5 3,010 24,758,923 0 Total 9,255 413,160,011$ 0$
Table IV-5
Non-Contributing Active Liabilities by TierLocal Employers
Number of Actuarial GrossMembers Liability Normal Cost
Tier 1 15,540 666,422,070$ 0$ Tier 2 1,355 21,134,562 0 Tier 3 886 12,971,945 0 Tier 4 270 4,887,391 0 Tier 5 8,546 52,779,724 0 Total 26,597 758,195,692$ 0$
PUBLIC EMPLOYEES’ RETIREMENT SYSTEM OF NEW JERSEY JULY 1, 2019 ACTUARIAL VALUATION
SECTION IV – LIABILITIES
59
Tables IV-6 and IV-7 present the change in the actuarial liabilities, actuarial assets, and unfunded actuarial liability during the plan year for State and Local employers. In general, the unfunded actuarial liability (UAL) of any retirement system is expected to change at each subsequent valuation for a variety of reasons. In each valuation, we report on those elements of change in the UAL which are of particular significance, potentially affecting the long-term financial outlook of the System. For this purpose, we focus on the UAL without considering the SAV because this UAL is used to determine the Statutory contribution. The UAL is also prior to any adjustments for State-paid Local obligations.

PUBLIC EMPLOYEES’ RETIREMENT SYSTEM OF NEW JERSEY JULY 1, 2019 ACTUARIAL VALUATION
SECTION IV – LIABILITIES
60
Development of 2019 Experience (Gain)/LossState
UnfundedActuarial Actuarial Value ActuarialLiability of Assets Liability/(Surplus)
1. Value as of July 1, 2018 23,745,716,631$ (8,057,092,909)$ 15,688,623,722$
2. AdditionsNormal Cost 408,584,037$ 0$ 408,584,037$ Statutory State Contributions 0 (1,421,004,837) (1,421,004,837) Expected Member Contributions 0 (334,980,771) (334,980,771) Total Additions 408,584,037$ (1,755,985,608)$ (1,347,401,571)$
3. DeductionsBenefit Payments (1,770,302,157)$ 1,770,302,157$ 0$ Expected Administrative Expenses 0 0 0 Total Deductions (1,770,302,157)$ 1,770,302,157$ 0$
4. Net Transfers from Other SystemsState Contributions (610,050)$ 610,050$ 0$ Member Contributions 525,298 (525,298) 0 Total Net Transfers (84,752)$ 84,752$ 0$
5. Expected Interest 1,746,383,244$ (551,427,346)$ 1,194,955,898$
6. Expected Value as of July 1, 2019: [1 + 2 + 3 + 4 + 5] 24,130,297,003$ (8,594,118,954)$ 15,536,178,049$
7. Other ChangesAppropriation Adjustment 0$ 424,817,068$ 424,817,068$ Contribution Timing 0 40,821,106 40,821,106 Actual Lottery Revenue 0 (14,924,492) (14,924,492) Other Employer Contributions 0 (246,636) (246,636) Actual Member Contributions 0 (21,359,157) (21,359,157) Change in Methods/Assumptions Experience Study 583,912,087 0 583,912,087 Investment Rate of Return 497,830,312 0 497,830,312 Change in Benefits/Policy (6,603,404) 0 (6,603,404) Total Other Changes 1,075,138,995$ 429,107,889$ 1,504,246,884$
8. Expected value after changes: [6 + 7] 25,205,435,998$ (8,165,011,065)$ 17,040,424,933$
9. Actual Value as of July 1, 2019 25,666,760,996$ (8,017,468,579)$ 17,649,292,417$
10. Actuarial (Gain)/Loss: [9 - 8] 461,324,998$ 147,542,486$ 608,867,484$
Table IV-6
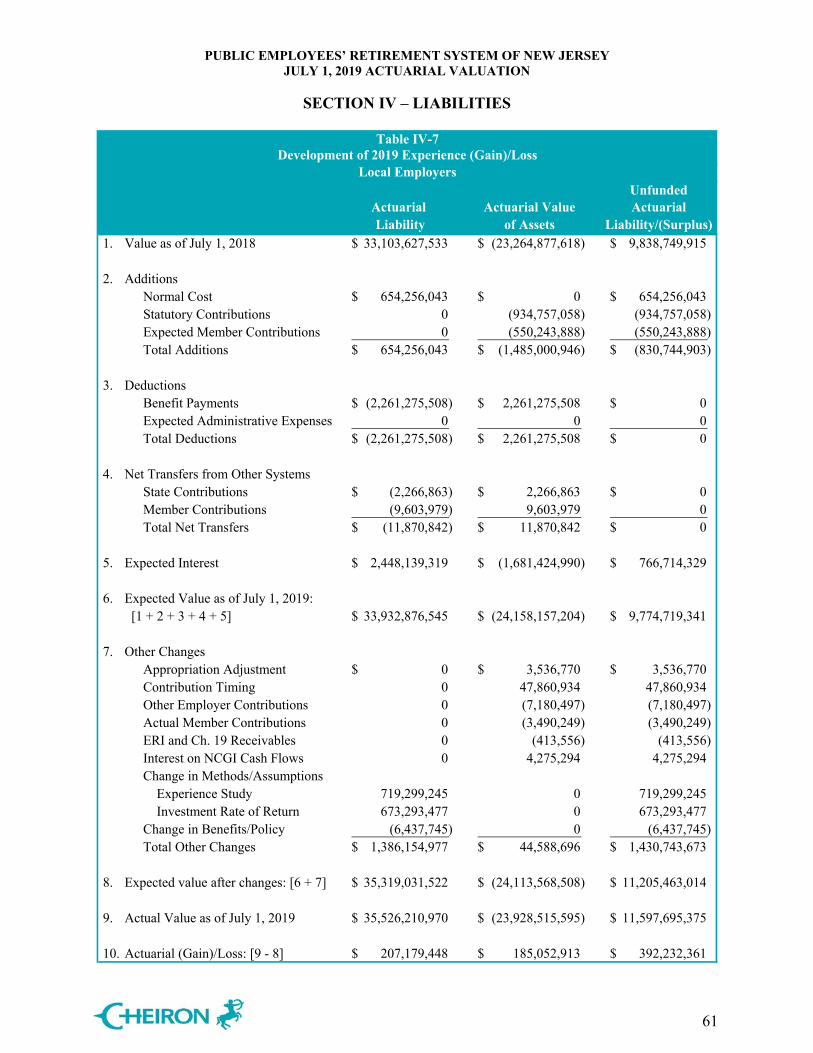
PUBLIC EMPLOYEES’ RETIREMENT SYSTEM OF NEW JERSEY JULY 1, 2019 ACTUARIAL VALUATION
SECTION IV – LIABILITIES
61
Table IV-7Development of 2019 Experience (Gain)/Loss
Local EmployersUnfunded
Actuarial Actuarial Value ActuarialLiability of Assets Liability/(Surplus)
1. Value as of July 1, 2018 33,103,627,533$ (23,264,877,618)$ 9,838,749,915$
2. AdditionsNormal Cost 654,256,043$ 0$ 654,256,043$ Statutory Contributions 0 (934,757,058) (934,757,058) Expected Member Contributions 0 (550,243,888) (550,243,888) Total Additions 654,256,043$ (1,485,000,946)$ (830,744,903)$
3. DeductionsBenefit Payments (2,261,275,508)$ 2,261,275,508$ 0$ Expected Administrative Expenses 0 0 0 Total Deductions (2,261,275,508)$ 2,261,275,508$ 0$
4. Net Transfers from Other SystemsState Contributions (2,266,863)$ 2,266,863$ 0$ Member Contributions (9,603,979) 9,603,979 0 Total Net Transfers (11,870,842)$ 11,870,842$ 0$
5. Expected Interest 2,448,139,319$ (1,681,424,990)$ 766,714,329$
6. Expected Value as of July 1, 2019: [1 + 2 + 3 + 4 + 5] 33,932,876,545$ (24,158,157,204)$ 9,774,719,341$
7. Other ChangesAppropriation Adjustment 0$ 3,536,770$ 3,536,770$ Contribution Timing 0 47,860,934 47,860,934 Other Employer Contributions 0 (7,180,497) (7,180,497) Actual Member Contributions 0 (3,490,249) (3,490,249) ERI and Ch. 19 Receivables 0 (413,556) (413,556) Interest on NCGI Cash Flows 0 4,275,294 4,275,294 Change in Methods/Assumptions Experience Study 719,299,245 0 719,299,245 Investment Rate of Return 673,293,477 0 673,293,477 Change in Benefits/Policy (6,437,745) 0 (6,437,745) Total Other Changes 1,386,154,977$ 44,588,696$ 1,430,743,673$
8. Expected value after changes: [6 + 7] 35,319,031,522$ (24,113,568,508)$ 11,205,463,014$
9. Actual Value as of July 1, 2019 35,526,210,970$ (23,928,515,595)$ 11,597,695,375$
10. Actuarial (Gain)/Loss: [9 - 8] 207,179,448$ 185,052,913$ 392,232,361$
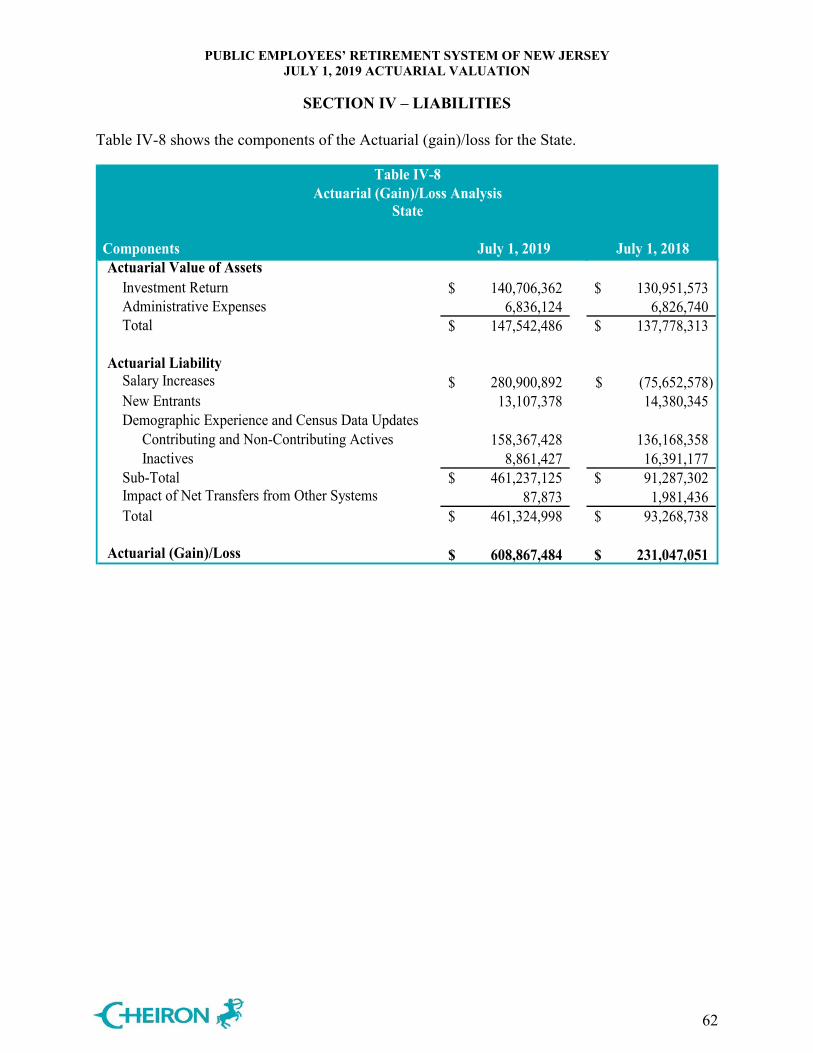
PUBLIC EMPLOYEES’ RETIREMENT SYSTEM OF NEW JERSEY JULY 1, 2019 ACTUARIAL VALUATION
SECTION IV – LIABILITIES
62
Table IV-8 shows the components of the Actuarial (gain)/loss for the State.
Table IV-8Actuarial (Gain)/Loss Analysis
State
Components July 1, 2019 July 1, 2018Actuarial Value of Assets
Investment Return 140,706,362$ 130,951,573$ Administrative Expenses 6,836,124 6,826,740 Total 147,542,486$ 137,778,313$
Actuarial LiabilitySalary Increases 280,900,892$ (75,652,578)$ New Entrants 13,107,378 14,380,345 Demographic Experience and Census Data Updates
Contributing and Non-Contributing Actives 158,367,428 136,168,358 Inactives 8,861,427 16,391,177
Sub-Total 461,237,125$ 91,287,302$ Impact of Net Transfers from Other Systems 87,873 1,981,436 Total 461,324,998$ 93,268,738$
Actuarial (Gain)/Loss 608,867,484$ 231,047,051$
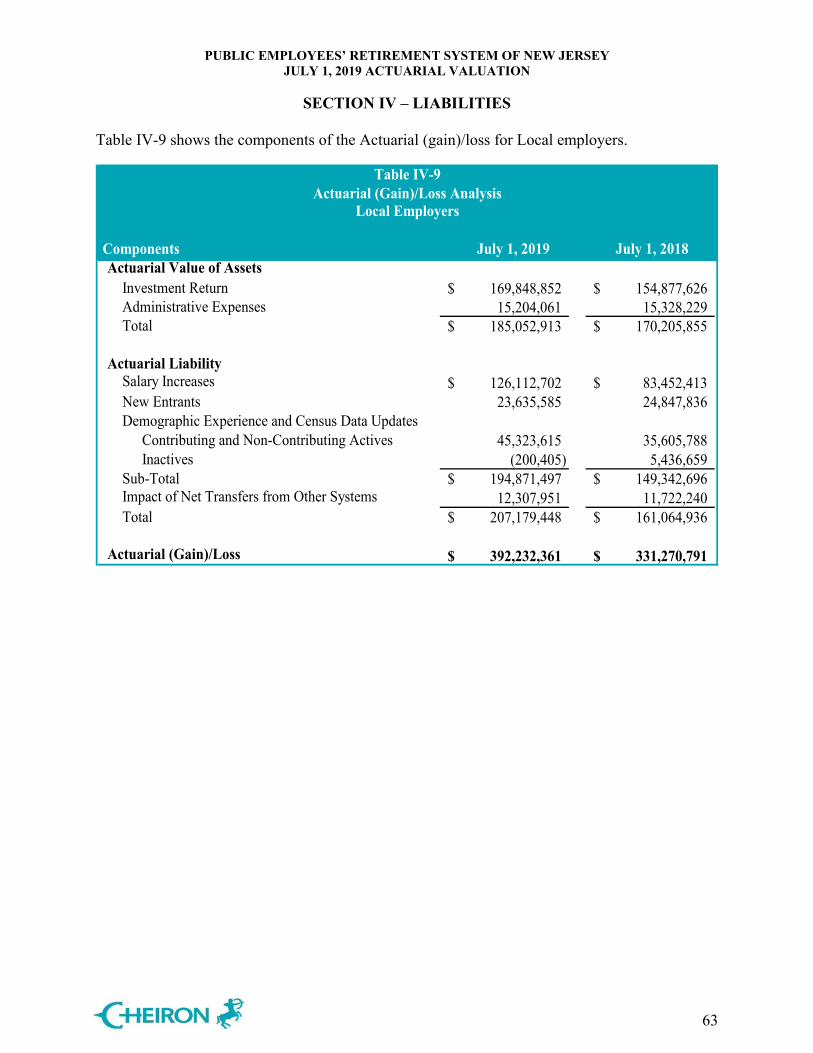
PUBLIC EMPLOYEES’ RETIREMENT SYSTEM OF NEW JERSEY JULY 1, 2019 ACTUARIAL VALUATION
SECTION IV – LIABILITIES
63
Table IV-9 shows the components of the Actuarial (gain)/loss for Local employers.
Table IV-9Actuarial (Gain)/Loss Analysis
Local Employers
Components July 1, 2019 July 1, 2018Actuarial Value of Assets
Investment Return 169,848,852$ 154,877,626$ Administrative Expenses 15,204,061 15,328,229 Total 185,052,913$ 170,205,855$
Actuarial LiabilitySalary Increases 126,112,702$ 83,452,413$ New Entrants 23,635,585 24,847,836 Demographic Experience and Census Data Updates
Contributing and Non-Contributing Actives 45,323,615 35,605,788 Inactives (200,405) 5,436,659
Sub-Total 194,871,497$ 149,342,696$ Impact of Net Transfers from Other Systems 12,307,951 11,722,240 Total 207,179,448$ 161,064,936$
Actuarial (Gain)/Loss 392,232,361$ 331,270,791$
PUBLIC EMPLOYEES’ RETIREMENT SYSTEM OF NEW JERSEY JULY 1, 2019 ACTUARIAL VALUATION
SECTION V – CONTRIBUTIONS
64
In the process of evaluating the financial condition of any pension plan, the actuary analyzes the assets and liabilities to determine what level (if any) of contributions is needed to properly maintain the funding status of the Plan. Typically, the actuarial process will use a funding technique that will result in a pattern of contributions that are both stable and predictable. Under the current funding policy, the State and Local employer funding requirements contain two components: the employer normal cost and an amortization of the unfunded actuarial liability (UAL). The UAL for this purpose does not include the special asset value. The funding methodology prescribed by NJ State Statute does not include a cost component for administrative expenses, and therefore administrative expenses are implicitly covered by the investment rate of return assumption. Because the investment rate of return assumption is recommended by the State Treasurer, we provide no opinion on the reasonableness of the assumption. For PERS, the funding method employed is the Projected Unit Credit (PUC) Actuarial Cost Method. Under this funding method, the actuarial liability is calculated as the actuarial present value of the projected benefits allocated to periods prior to the valuation year. Refunds are valued as the Accumulated Deductions with interest as of the valuation date as provided by the Division of Pensions and Benefits. The unfunded actuarial liability is the actuarial liability on the valuation date less the actuarial value of assets. In accordance with Chapter 78, P. L. 2011, the unfunded actuarial liability for the July 1, 2018 valuation was amortized over an open 30 year period as a level dollar amount. Beginning with the July 1, 2019 valuation, the unfunded actuarial liability is amortized over a closed 30 year period as a level dollar amount.
Under Chapter 98, P.L. 2017, the Lottery Enterprise Contribution Act, PERS receives 21.02% of the proceeds of the Lottery Enterprise for a term of 30 years. As of July 1, 2019 there are 27 years remaining. The State's pension contribution shall be reduced by the product of the allocable percentage for such retirement system, the adjustment percentage for such retirement system and the special asset adjustment. The FYE 2021 Local employers’ Statutory pension contribution increased by $115,174,528 due to the assumption changes from the July 1, 2014 – June 30, 2018 Experience Study. As an alternative funding policy to allow employers to better manage the financial impact, the Board of Trustees adopted a phase-in of the cost impact by spreading the increase over a three year fixed period. Therefore, the FYE 2021 Local employers’ net pension contribution would reflect 1/3rd of the cost impact, or $38,391,509. This results in a reduction in the Local employers’ FYE 2021 net pension contribution of $76,783,019 ($115,174,528 - $38,391,509) in the first year as 2/3rds of the cost increase is deferred to the following two years. In FYE 2022, the Local employers’ net pension contribution will reflect 2/3rds of the cost impact, or $76,783,019, plus an amortization of the deferred cost from the first year with interest. In FYE 2023, the Local employers’ contribution will be the full cost impact, or $115,174,528, plus an amortization of the deferred cost from the prior two years with interest. This will define the Statutory contribution amount from the assumption changes for all subsequent years.
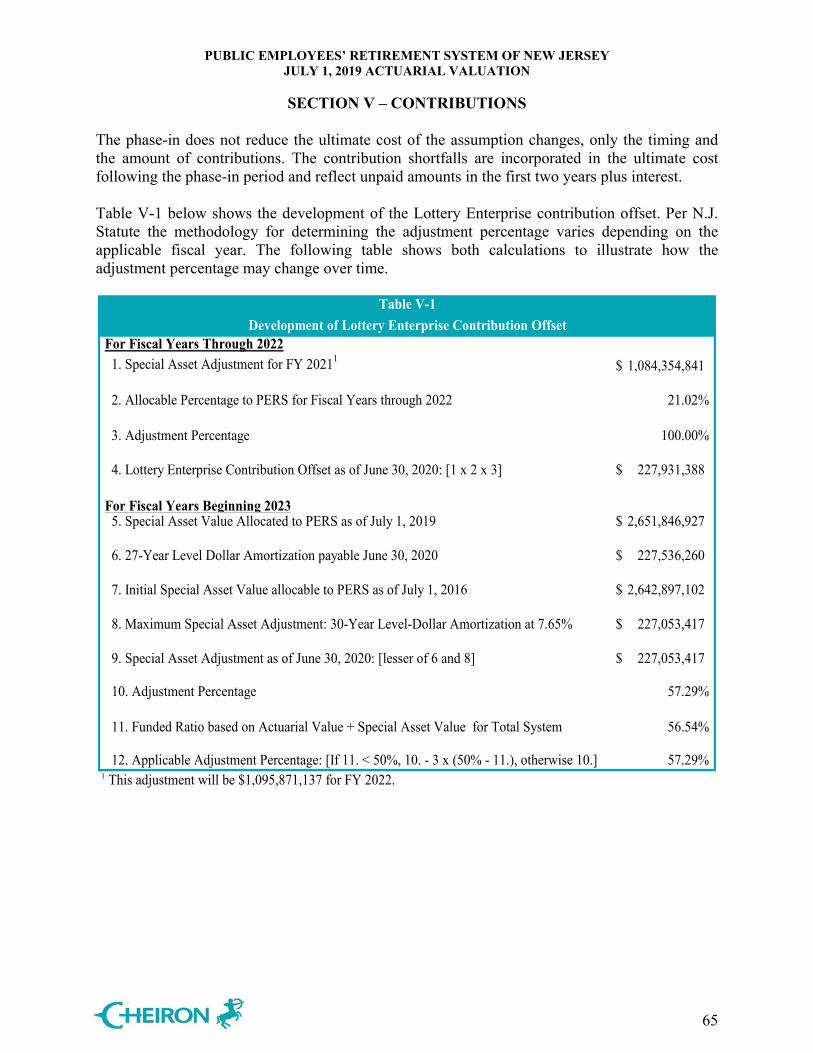
PUBLIC EMPLOYEES’ RETIREMENT SYSTEM OF NEW JERSEY JULY 1, 2019 ACTUARIAL VALUATION
SECTION V – CONTRIBUTIONS
65
The phase-in does not reduce the ultimate cost of the assumption changes, only the timing and the amount of contributions. The contribution shortfalls are incorporated in the ultimate cost following the phase-in period and reflect unpaid amounts in the first two years plus interest. Table V-1 below shows the development of the Lottery Enterprise contribution offset. Per N.J. Statute the methodology for determining the adjustment percentage varies depending on the applicable fiscal year. The following table shows both calculations to illustrate how the adjustment percentage may change over time.
For Fiscal Years Through 2022 1. Special Asset Adjustment for FY 20211 1,084,354,841$
2. Allocable Percentage to PERS for Fiscal Years through 2022 21.02%
3. Adjustment Percentage 100.00%
4. Lottery Enterprise Contribution Offset as of June 30, 2020: [1 x 2 x 3] 227,931,388$
For Fiscal Years Beginning 2023 5. Special Asset Value Allocated to PERS as of July 1, 2019 2,651,846,927$
6. 27-Year Level Dollar Amortization payable June 30, 2020 227,536,260$
7. Initial Special Asset Value allocable to PERS as of July 1, 2016 2,642,897,102$
8. Maximum Special Asset Adjustment: 30-Year Level-Dollar Amortization at 7.65% 227,053,417$
9. Special Asset Adjustment as of June 30, 2020: [lesser of 6 and 8] 227,053,417$
10. Adjustment Percentage 57.29%
11. Funded Ratio based on Actuarial Value + Special Asset Value for Total System 56.54%
12. Applicable Adjustment Percentage: [If 11. < 50%, 10. - 3 x (50% - 11.), otherwise 10.] 57.29%1 This adjustment will be $1,095,871,137 for FY 2022.
Table V-1Development of Lottery Enterprise Contribution Offset
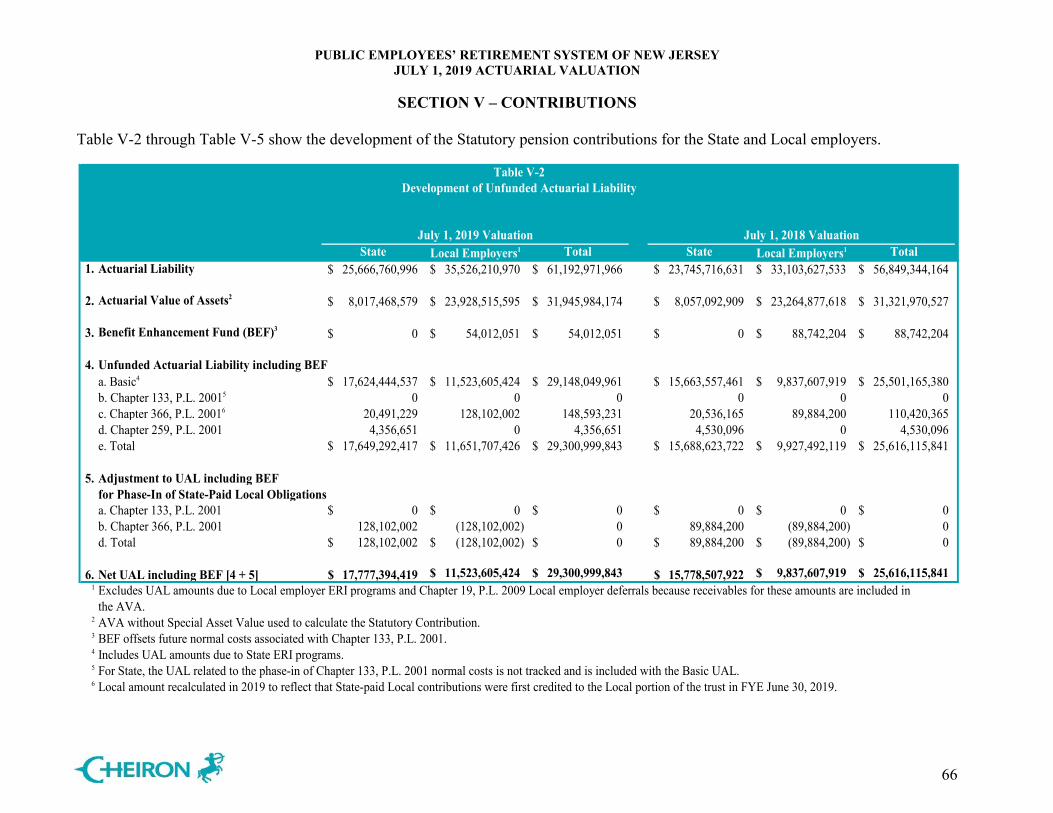
PUBLIC EMPLOYEES’ RETIREMENT SYSTEM OF NEW JERSEY JULY 1, 2019 ACTUARIAL VALUATION
SECTION V – CONTRIBUTIONS
66
Table V-2 through Table V-5 show the development of the Statutory pension contributions for the State and Local employers.
Table V-2 Development of Unfunded Actuarial Liability
July 1, 2019 Valuation July 1, 2018 ValuationState Local Employers1 Total State Local Employers1 Total
1. Actuarial Liability 25,666,760,996$ 35,526,210,970$ 61,192,971,966$ 23,745,716,631$ 33,103,627,533$ 56,849,344,164$
2. Actuarial Value of Assets2 8,017,468,579$ 23,928,515,595$ 31,945,984,174$ 8,057,092,909$ 23,264,877,618$ 31,321,970,527$
3. Benefit Enhancement Fund (BEF)3 0$ 54,012,051$ 54,012,051$ 0$ 88,742,204$ 88,742,204$
4. Unfunded Actuarial Liability including BEFa. Basic4 17,624,444,537$ 11,523,605,424$ 29,148,049,961$ 15,663,557,461$ 9,837,607,919$ 25,501,165,380$ b. Chapter 133, P.L. 20015 0 0 0 0 0 0 c. Chapter 366, P.L. 20016 20,491,229 128,102,002 148,593,231 20,536,165 89,884,200 110,420,365 d. Chapter 259, P.L. 2001 4,356,651 0 4,356,651 4,530,096 0 4,530,096 e. Total 17,649,292,417$ 11,651,707,426$ 29,300,999,843$ 15,688,623,722$ 9,927,492,119$ 25,616,115,841$
5. Adjustment to UAL including BEFfor Phase-In of State-Paid Local Obligationsa. Chapter 133, P.L. 2001 0$ 0$ 0$ 0$ 0$ 0$ b. Chapter 366, P.L. 2001 128,102,002 (128,102,002) 0 89,884,200 (89,884,200) 0 d. Total 128,102,002$ (128,102,002)$ 0$ 89,884,200$ (89,884,200)$ 0$
6. Net UAL including BEF [4 + 5] 17,777,394,419$ 11,523,605,424$ 29,300,999,843$ 15,778,507,922$ 9,837,607,919$ 25,616,115,841$ 1 Excludes UAL amounts due to Local employer ERI programs and Chapter 19, P.L. 2009 Local employer deferrals because receivables for these amounts are included in
the AVA.2 AVA without Special Asset Value used to calculate the Statutory Contribution.3 BEF offsets future normal costs associated with Chapter 133, P.L. 2001.4 Includes UAL amounts due to State ERI programs.5 For State, the UAL related to the phase-in of Chapter 133, P.L. 2001 normal costs is not tracked and is included with the Basic UAL.6 Local amount recalculated in 2019 to reflect that State-paid Local contributions were first credited to the Local portion of the trust in FYE June 30, 2019.
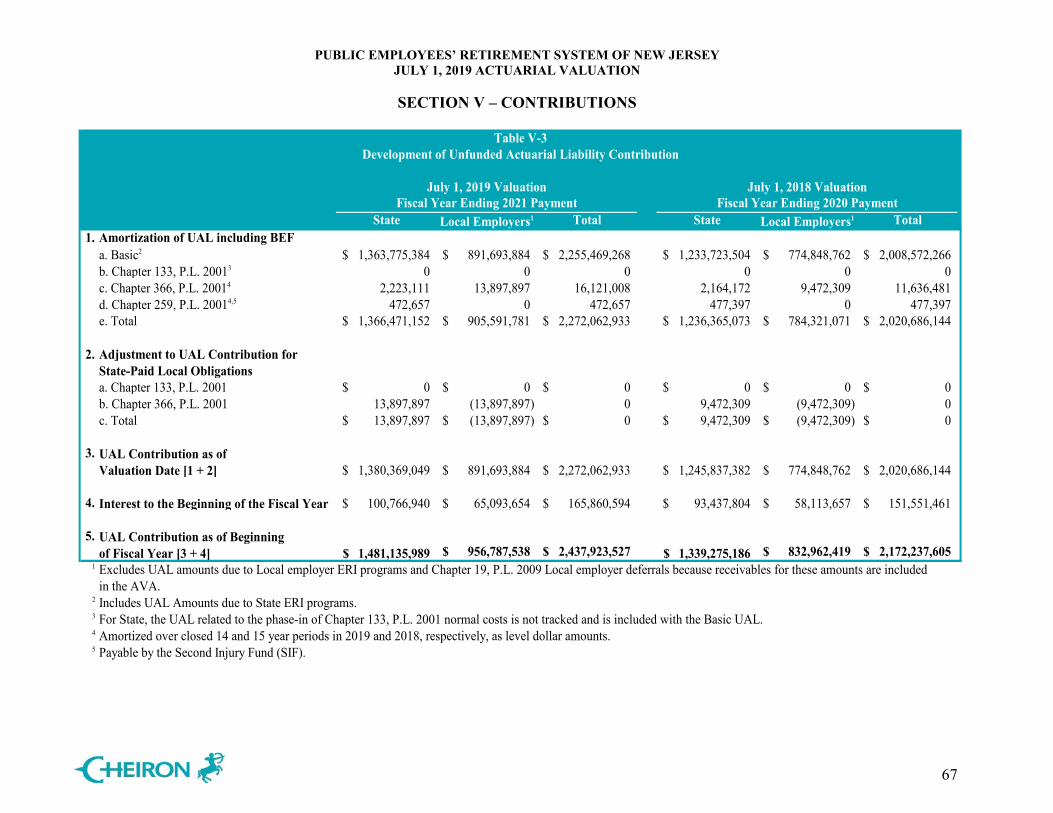
PUBLIC EMPLOYEES’ RETIREMENT SYSTEM OF NEW JERSEY JULY 1, 2019 ACTUARIAL VALUATION
SECTION V – CONTRIBUTIONS
67
Table V-3 Development of Unfunded Actuarial Liability Contribution
July 1, 2019 Valuation July 1, 2018 ValuationFiscal Year Ending 2021 Payment Fiscal Year Ending 2020 Payment
State Local Employers1 Total State Local Employers1 Total1. Amortization of UAL including BEF
a. Basic2 1,363,775,384$ 891,693,884$ 2,255,469,268$ 1,233,723,504$ 774,848,762$ 2,008,572,266$ b. Chapter 133, P.L. 20013 0 0 0 0 0 0 c. Chapter 366, P.L. 20014 2,223,111 13,897,897 16,121,008 2,164,172 9,472,309 11,636,481 d. Chapter 259, P.L. 20014,5 472,657 0 472,657 477,397 0 477,397 e. Total 1,366,471,152$ 905,591,781$ 2,272,062,933$ 1,236,365,073$ 784,321,071$ 2,020,686,144$
2. Adjustment to UAL Contribution forState-Paid Local Obligationsa. Chapter 133, P.L. 2001 0$ 0$ 0$ 0$ 0$ 0$ b. Chapter 366, P.L. 2001 13,897,897 (13,897,897) 0 9,472,309 (9,472,309) 0 c. Total 13,897,897$ (13,897,897)$ 0$ 9,472,309$ (9,472,309)$ 0$
3. UAL Contribution as ofValuation Date [1 + 2] 1,380,369,049$ 891,693,884$ 2,272,062,933$ 1,245,837,382$ 774,848,762$ 2,020,686,144$
4. Interest to the Beginning of the Fiscal Year 100,766,940$ 65,093,654$ 165,860,594$ 93,437,804$ 58,113,657$ 151,551,461$
5. UAL Contribution as of Beginningof Fiscal Year [3 + 4] 1,481,135,989$ 956,787,538$ 2,437,923,527$ 1,339,275,186$ 832,962,419$ 2,172,237,605$
1 Excludes UAL amounts due to Local employer ERI programs and Chapter 19, P.L. 2009 Local employer deferrals because receivables for these amounts are included in the AVA.
2 Includes UAL Amounts due to State ERI programs.3 For State, the UAL related to the phase-in of Chapter 133, P.L. 2001 normal costs is not tracked and is included with the Basic UAL.4 Amortized over closed 14 and 15 year periods in 2019 and 2018, respectively, as level dollar amounts.5 Payable by the Second Injury Fund (SIF).
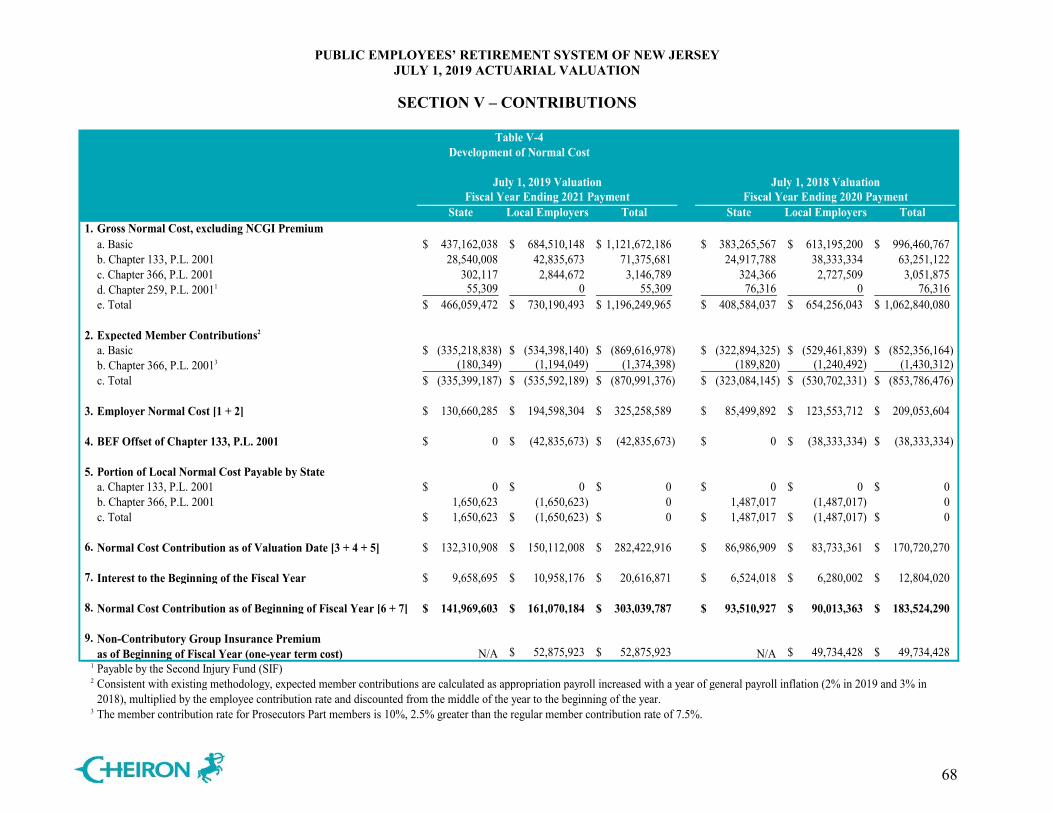
PUBLIC EMPLOYEES’ RETIREMENT SYSTEM OF NEW JERSEY JULY 1, 2019 ACTUARIAL VALUATION
SECTION V – CONTRIBUTIONS
68
Table V-4 Development of Normal Cost
July 1, 2019 Valuation July 1, 2018 ValuationFiscal Year Ending 2021 Payment Fiscal Year Ending 2020 Payment
State Local Employers Total State Local Employers Total1. Gross Normal Cost, excluding NCGI Premium
a. Basic 437,162,038$ 684,510,148$ 1,121,672,186$ 383,265,567$ 613,195,200$ 996,460,767$ b. Chapter 133, P.L. 2001 28,540,008 42,835,673 71,375,681 24,917,788 38,333,334 63,251,122 c. Chapter 366, P.L. 2001 302,117 2,844,672 3,146,789 324,366 2,727,509 3,051,875 d. Chapter 259, P.L. 20011 55,309 0 55,309 76,316 0 76,316 e. Total 466,059,472$ 730,190,493$ 1,196,249,965$ 408,584,037$ 654,256,043$ 1,062,840,080$
2. Expected Member Contributions2
a. Basic (335,218,838)$ (534,398,140)$ (869,616,978)$ (322,894,325)$ (529,461,839)$ (852,356,164)$ b. Chapter 366, P.L. 20013 (180,349) (1,194,049) (1,374,398) (189,820) (1,240,492) (1,430,312) c. Total (335,399,187)$ (535,592,189)$ (870,991,376)$ (323,084,145)$ (530,702,331)$ (853,786,476)$
3. Employer Normal Cost [1 + 2] 130,660,285$ 194,598,304$ 325,258,589$ 85,499,892$ 123,553,712$ 209,053,604$
4. BEF Offset of Chapter 133, P.L. 2001 0$ (42,835,673)$ (42,835,673)$ 0$ (38,333,334)$ (38,333,334)$
5. Portion of Local Normal Cost Payable by Statea. Chapter 133, P.L. 2001 0$ 0$ 0$ 0$ 0$ 0$ b. Chapter 366, P.L. 2001 1,650,623 (1,650,623) 0 1,487,017 (1,487,017) 0 c. Total 1,650,623$ (1,650,623)$ 0$ 1,487,017$ (1,487,017)$ 0$
6. Normal Cost Contribution as of Valuation Date [3 + 4 + 5] 132,310,908$ 150,112,008$ 282,422,916$ 86,986,909$ 83,733,361$ 170,720,270$
7. Interest to the Beginning of the Fiscal Year 9,658,695$ 10,958,176$ 20,616,871$ 6,524,018$ 6,280,002$ 12,804,020$
8. Normal Cost Contribution as of Beginning of Fiscal Year [6 + 7] 141,969,603$ 161,070,184$ 303,039,787$ 93,510,927$ 90,013,363$ 183,524,290$
9. Non-Contributory Group Insurance Premiumas of Beginning of Fiscal Year (one-year term cost) N/A 52,875,923$ 52,875,923$ N/A 49,734,428$ 49,734,428$
1 Payable by the Second Injury Fund (SIF)2 Consistent with existing methodology, expected member contributions are calculated as appropriation payroll increased with a year of general payroll inflation (2% in 2019 and 3% in
2018), multiplied by the employee contribution rate and discounted from the middle of the year to the beginning of the year.3 The member contribution rate for Prosecutors Part members is 10%, 2.5% greater than the regular member contribution rate of 7.5%.
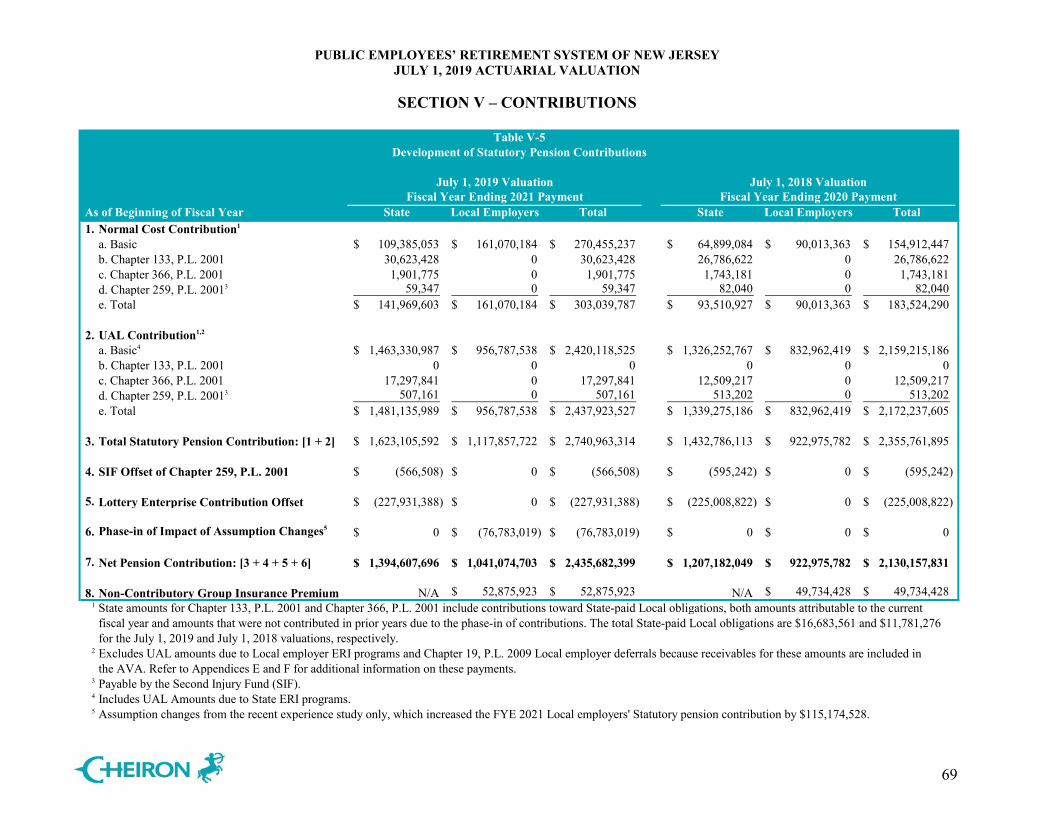
PUBLIC EMPLOYEES’ RETIREMENT SYSTEM OF NEW JERSEY JULY 1, 2019 ACTUARIAL VALUATION
SECTION V – CONTRIBUTIONS
69
Table V-5Development of Statutory Pension Contributions
July 1, 2019 Valuation July 1, 2018 ValuationFiscal Year Ending 2021 Payment Fiscal Year Ending 2020 Payment
As of Beginning of Fiscal Year State Local Employers Total State Local Employers Total1. Normal Cost Contribution1
a. Basic 109,385,053$ 161,070,184$ 270,455,237$ 64,899,084$ 90,013,363$ 154,912,447$ b. Chapter 133, P.L. 2001 30,623,428 0 30,623,428 26,786,622 0 26,786,622 c. Chapter 366, P.L. 2001 1,901,775 0 1,901,775 1,743,181 0 1,743,181 d. Chapter 259, P.L. 20013 59,347 0 59,347 82,040 0 82,040 e. Total 141,969,603$ 161,070,184$ 303,039,787$ 93,510,927$ 90,013,363$ 183,524,290$
2. UAL Contribution1,2
a. Basic4 1,463,330,987$ 956,787,538$ 2,420,118,525$ 1,326,252,767$ 832,962,419$ 2,159,215,186$ b. Chapter 133, P.L. 2001 0 0 0 0 0 0 c. Chapter 366, P.L. 2001 17,297,841 0 17,297,841 12,509,217 0 12,509,217 d. Chapter 259, P.L. 20013 507,161 0 507,161 513,202 0 513,202 e. Total 1,481,135,989$ 956,787,538$ 2,437,923,527$ 1,339,275,186$ 832,962,419$ 2,172,237,605$
3. Total Statutory Pension Contribution: [1 + 2] 1,623,105,592$ 1,117,857,722$ 2,740,963,314$ 1,432,786,113$ 922,975,782$ 2,355,761,895$
4. SIF Offset of Chapter 259, P.L. 2001 (566,508)$ 0$ (566,508)$ (595,242)$ 0$ (595,242)$
5. Lottery Enterprise Contribution Offset (227,931,388)$ 0$ (227,931,388)$ (225,008,822)$ 0$ (225,008,822)$
6. Phase-in of Impact of Assumption Changes5 0$ (76,783,019)$ (76,783,019)$ 0$ 0$ 0$
7. Net Pension Contribution: [3 + 4 + 5 + 6] 1,394,607,696$ 1,041,074,703$ 2,435,682,399$ 1,207,182,049$ 922,975,782$ 2,130,157,831$
8. Non-Contributory Group Insurance Premium N/A 52,875,923$ 52,875,923$ N/A 49,734,428$ 49,734,428$ 1 State amounts for Chapter 133, P.L. 2001 and Chapter 366, P.L. 2001 include contributions toward State-paid Local obligations, both amounts attributable to the current
fiscal year and amounts that were not contributed in prior years due to the phase-in of contributions. The total State-paid Local obligations are $16,683,561 and $11,781,276for the July 1, 2019 and July 1, 2018 valuations, respectively.
2 Excludes UAL amounts due to Local employer ERI programs and Chapter 19, P.L. 2009 Local employer deferrals because receivables for these amounts are included inthe AVA. Refer to Appendices E and F for additional information on these payments.
3 Payable by the Second Injury Fund (SIF).4 Includes UAL Amounts due to State ERI programs.5 Assumption changes from the recent experience study only, which increased the FYE 2021 Local employers' Statutory pension contribution by $115,174,528.
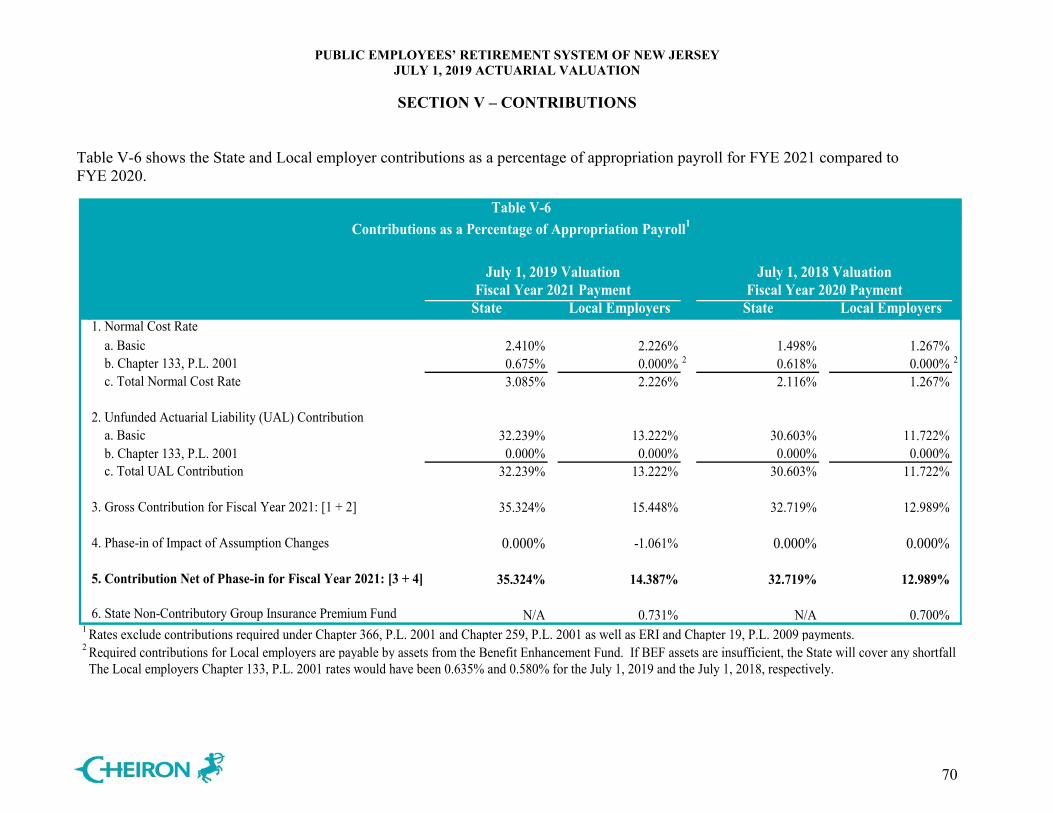
PUBLIC EMPLOYEES’ RETIREMENT SYSTEM OF NEW JERSEY JULY 1, 2019 ACTUARIAL VALUATION
SECTION V – CONTRIBUTIONS
70
Table V-6 shows the State and Local employer contributions as a percentage of appropriation payroll for FYE 2021 compared to FYE 2020.
July 1, 2019 Valuation July 1, 2018 ValuationFiscal Year 2021 Payment Fiscal Year 2020 Payment
State Local Employers State Local Employers1. Normal Cost Rate a. Basic 2.410% 2.226% 1.498% 1.267% b. Chapter 133, P.L. 2001 0.675% 0.000% 2 0.618% 0.000% 2
c. Total Normal Cost Rate 3.085% 2.226% 2.116% 1.267%
2. Unfunded Actuarial Liability (UAL) Contribution a. Basic 32.239% 13.222% 30.603% 11.722% b. Chapter 133, P.L. 2001 0.000% 0.000% 0.000% 0.000% c. Total UAL Contribution 32.239% 13.222% 30.603% 11.722%
3. Gross Contribution for Fiscal Year 2021: [1 + 2] 35.324% 15.448% 32.719% 12.989%
4. Phase-in of Impact of Assumption Changes 0.000% -1.061% 0.000% 0.000%
5. Contribution Net of Phase-in for Fiscal Year 2021: [3 + 4] 35.324% 14.387% 32.719% 12.989%
6. State Non-Contributory Group Insurance Premium Fund N/A 0.731% N/A 0.700%1 Rates exclude contributions required under Chapter 366, P.L. 2001 and Chapter 259, P.L. 2001 as well as ERI and Chapter 19, P.L. 2009 payments.2 Required contributions for Local employers are payable by assets from the Benefit Enhancement Fund. If BEF assets are insufficient, the State will cover any shortfall The Local employers Chapter 133, P.L. 2001 rates would have been 0.635% and 0.580% for the July 1, 2019 and the July 1, 2018, respectively.
Table V-6Contributions as a Percentage of Appropriation Payroll1
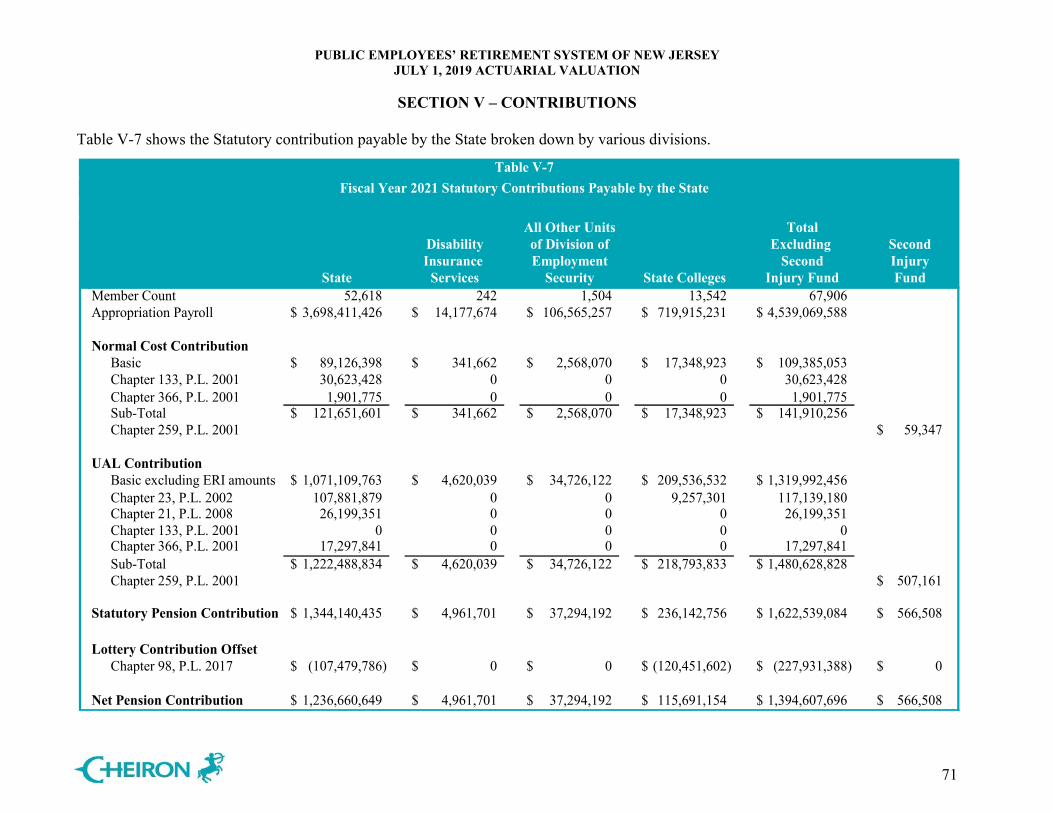
PUBLIC EMPLOYEES’ RETIREMENT SYSTEM OF NEW JERSEY JULY 1, 2019 ACTUARIAL VALUATION
SECTION V – CONTRIBUTIONS
71
Table V-7 shows the Statutory contribution payable by the State broken down by various divisions.
Table V-7Fiscal Year 2021 Statutory Contributions Payable by the State
All Other Units TotalDisability of Division of Excluding SecondInsurance Employment Second Injury
State Services Security State Colleges Injury Fund FundMember Count 52,618 242 1,504 13,542 67,906 Appropriation Payroll 3,698,411,426$ 14,177,674$ 106,565,257$ 719,915,231$ 4,539,069,588$
Normal Cost ContributionBasic 89,126,398$ 341,662$ 2,568,070$ 17,348,923$ 109,385,053$ Chapter 133, P.L. 2001 30,623,428 0 0 0 30,623,428 Chapter 366, P.L. 2001 1,901,775 0 0 0 1,901,775 Sub-Total 121,651,601$ 341,662$ 2,568,070$ 17,348,923$ 141,910,256$ Chapter 259, P.L. 2001 59,347$
UAL ContributionBasic excluding ERI amounts 1,071,109,763$ 4,620,039$ 34,726,122$ 209,536,532$ 1,319,992,456$ Chapter 23, P.L. 2002 107,881,879 0 0 9,257,301 117,139,180Chapter 21, P.L. 2008 26,199,351 0 0 0 26,199,351Chapter 133, P.L. 2001 0 0 0 0 0Chapter 366, P.L. 2001 17,297,841 0 0 0 17,297,841 Sub-Total 1,222,488,834$ 4,620,039$ 34,726,122$ 218,793,833$ 1,480,628,828$ Chapter 259, P.L. 2001 507,161$
Statutory Pension Contribution 1,344,140,435$ 4,961,701$ 37,294,192$ 236,142,756$ 1,622,539,084$ 566,508$
Lottery Contribution OffsetChapter 98, P.L. 2017 (107,479,786)$ 0$ 0$ (120,451,602)$ (227,931,388)$ 0$
Net Pension Contribution 1,236,660,649$ 4,961,701$ 37,294,192$ 115,691,154$ 1,394,607,696$ 566,508$
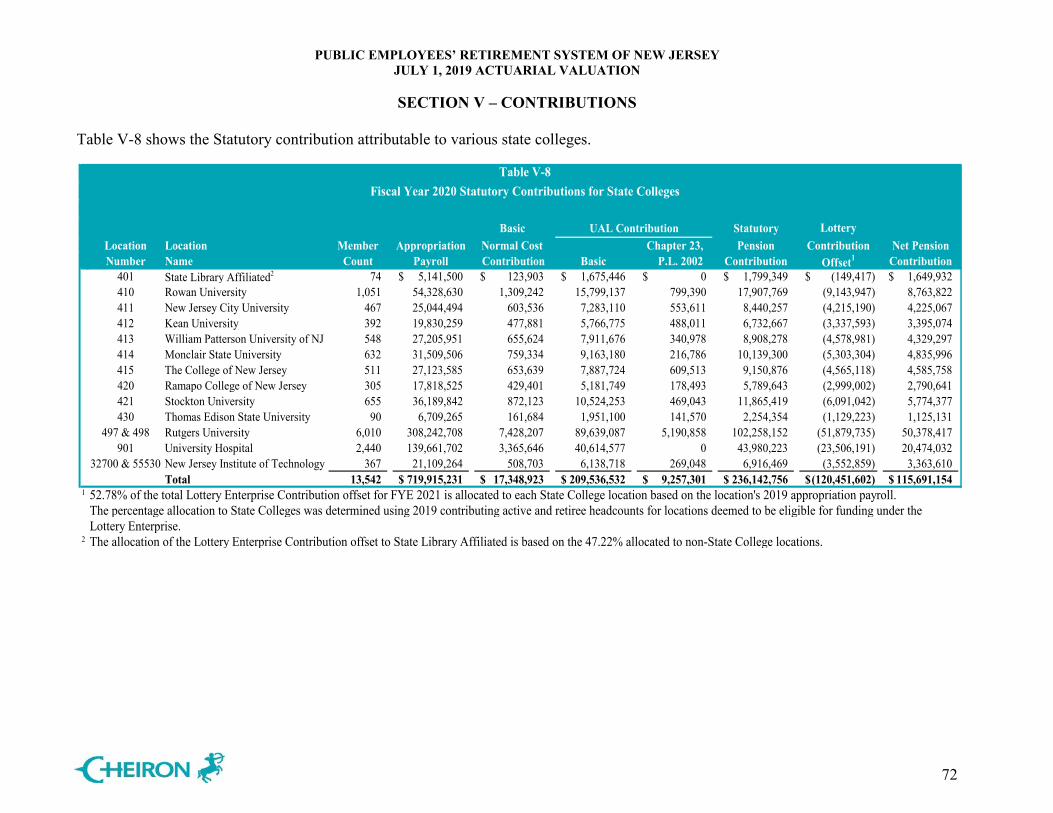
PUBLIC EMPLOYEES’ RETIREMENT SYSTEM OF NEW JERSEY JULY 1, 2019 ACTUARIAL VALUATION
SECTION V – CONTRIBUTIONS
72
Table V-8 shows the Statutory contribution attributable to various state colleges.
Table V-8Fiscal Year 2020 Statutory Contributions for State Colleges
Basic UAL Contribution Statutory Lottery Location Location Member Appropriation Normal Cost Chapter 23, Pension Contribution Net PensionNumber Name Count Payroll Contribution Basic P.L. 2002 Contribution Offset1 Contribution
401 State Library Affiliated2 74 5,141,500$ 123,903$ 1,675,446$ 0$ 1,799,349$ (149,417)$ 1,649,932$ 410 Rowan University 1,051 54,328,630 1,309,242 15,799,137 799,390 17,907,769 (9,143,947) 8,763,822 411 New Jersey City University 467 25,044,494 603,536 7,283,110 553,611 8,440,257 (4,215,190) 4,225,067 412 Kean University 392 19,830,259 477,881 5,766,775 488,011 6,732,667 (3,337,593) 3,395,074 413 William Patterson University of NJ 548 27,205,951 655,624 7,911,676 340,978 8,908,278 (4,578,981) 4,329,297 414 Monclair State University 632 31,509,506 759,334 9,163,180 216,786 10,139,300 (5,303,304) 4,835,996 415 The College of New Jersey 511 27,123,585 653,639 7,887,724 609,513 9,150,876 (4,565,118) 4,585,758 420 Ramapo College of New Jersey 305 17,818,525 429,401 5,181,749 178,493 5,789,643 (2,999,002) 2,790,641 421 Stockton University 655 36,189,842 872,123 10,524,253 469,043 11,865,419 (6,091,042) 5,774,377 430 Thomas Edison State University 90 6,709,265 161,684 1,951,100 141,570 2,254,354 (1,129,223) 1,125,131
497 & 498 Rutgers University 6,010 308,242,708 7,428,207 89,639,087 5,190,858 102,258,152 (51,879,735) 50,378,417 901 University Hospital 2,440 139,661,702 3,365,646 40,614,577 0 43,980,223 (23,506,191) 20,474,032
32700 & 55530 New Jersey Institute of Technology 367 21,109,264 508,703 6,138,718 269,048 6,916,469 (3,552,859) 3,363,610 Total 13,542 719,915,231$ 17,348,923$ 209,536,532$ 9,257,301$ 236,142,756$ (120,451,602)$ 115,691,154$
1 52.78% of the total Lottery Enterprise Contribution offset for FYE 2021 is allocated to each State College location based on the location's 2019 appropriation payroll.The percentage allocation to State Colleges was determined using 2019 contributing active and retiree headcounts for locations deemed to be eligible for funding under the Lottery Enterprise.
2 The allocation of the Lottery Enterprise Contribution offset to State Library Affiliated is based on the 47.22% allocated to non-State College locations.
PUBLIC EMPLOYEES’ RETIREMENT SYSTEM OF NEW JERSEY JULY 1, 2019 ACTUARIAL VALUATION
APPENDIX A – MEMBERSHIP INFORMATION
73
The data for this valuation was provided by the New Jersey Division of Pensions and Benefits as of July 1, 2019. Cheiron did not audit any of the data. However, we did perform an informal examination of the obvious characteristics of the data for reasonableness and consistency in accordance with Actuarial Standard of Practice No. 23. The following is a list of data charts contained in this section:
• A-1 to A-3: Contributing Active Member Data by Tier • A-4: Non-Contributing Active Member Data by Tier • A-5: Inactive Member Data by Status • A-6: Reconciliation of Plan Membership • A-7 through A-10: Contributing Active Member Data by Age and Service • A-11 through A-14: Inactive Member Data by Age and Status
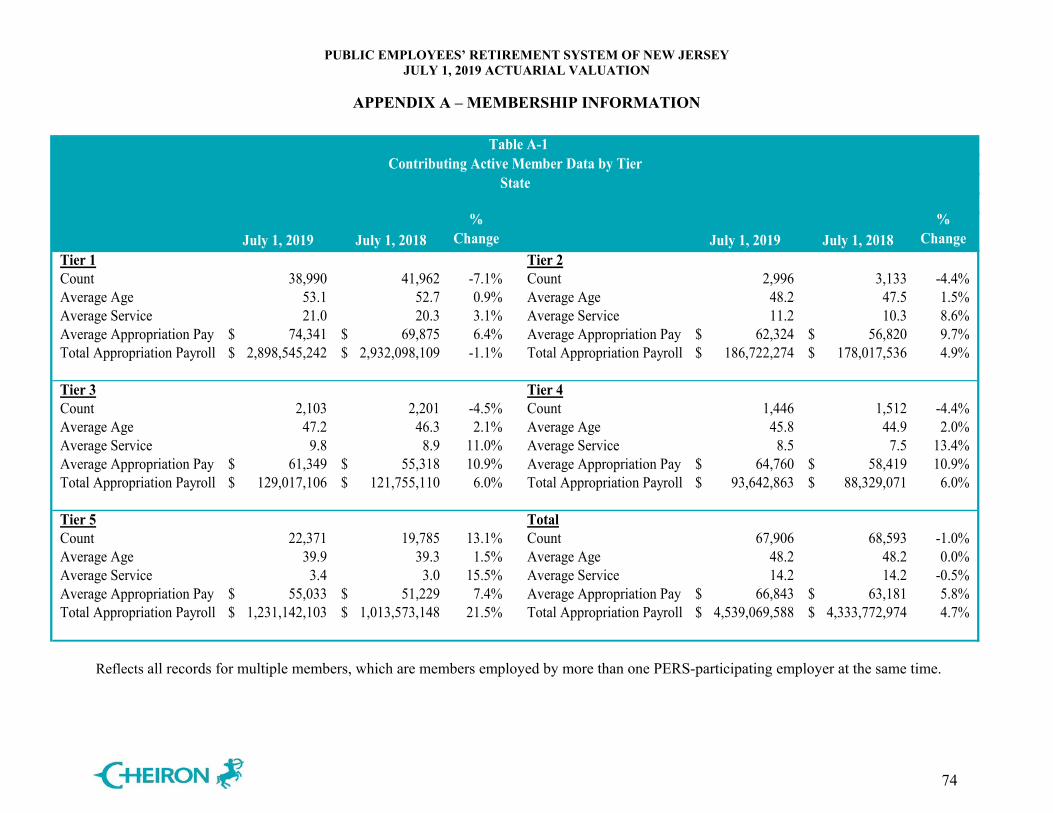
PUBLIC EMPLOYEES’ RETIREMENT SYSTEM OF NEW JERSEY JULY 1, 2019 ACTUARIAL VALUATION
APPENDIX A – MEMBERSHIP INFORMATION
74
Table A-1
July 1, 2019 July 1, 2018%
Change July 1, 2019 July 1, 2018%
ChangeTier 1 Tier 2Count 38,990 41,962 -7.1% Count 2,996 3,133 -4.4%Average Age 53.1 52.7 0.9% Average Age 48.2 47.5 1.5%Average Service 21.0 20.3 3.1% Average Service 11.2 10.3 8.6%Average Appropriation Pay 74,341$ 69,875$ 6.4% Average Appropriation Pay 62,324$ 56,820$ 9.7%Total Appropriation Payroll 2,898,545,242$ 2,932,098,109$ -1.1% Total Appropriation Payroll 186,722,274$ 178,017,536$ 4.9%
Tier 3 Tier 4Count 2,103 2,201 -4.5% Count 1,446 1,512 -4.4%Average Age 47.2 46.3 2.1% Average Age 45.8 44.9 2.0%Average Service 9.8 8.9 11.0% Average Service 8.5 7.5 13.4%Average Appropriation Pay 61,349$ 55,318$ 10.9% Average Appropriation Pay 64,760$ 58,419$ 10.9%Total Appropriation Payroll 129,017,106$ 121,755,110$ 6.0% Total Appropriation Payroll 93,642,863$ 88,329,071$ 6.0%
Tier 5 TotalCount 22,371 19,785 13.1% Count 67,906 68,593 -1.0%Average Age 39.9 39.3 1.5% Average Age 48.2 48.2 0.0%Average Service 3.4 3.0 15.5% Average Service 14.2 14.2 -0.5%Average Appropriation Pay 55,033$ 51,229$ 7.4% Average Appropriation Pay 66,843$ 63,181$ 5.8%Total Appropriation Payroll 1,231,142,103$ 1,013,573,148$ 21.5% Total Appropriation Payroll 4,539,069,588$ 4,333,772,974$ 4.7%
Contributing Active Member Data by TierState
Reflects all records for multiple members, which are members employed by more than one PERS-participating employer at the same time.
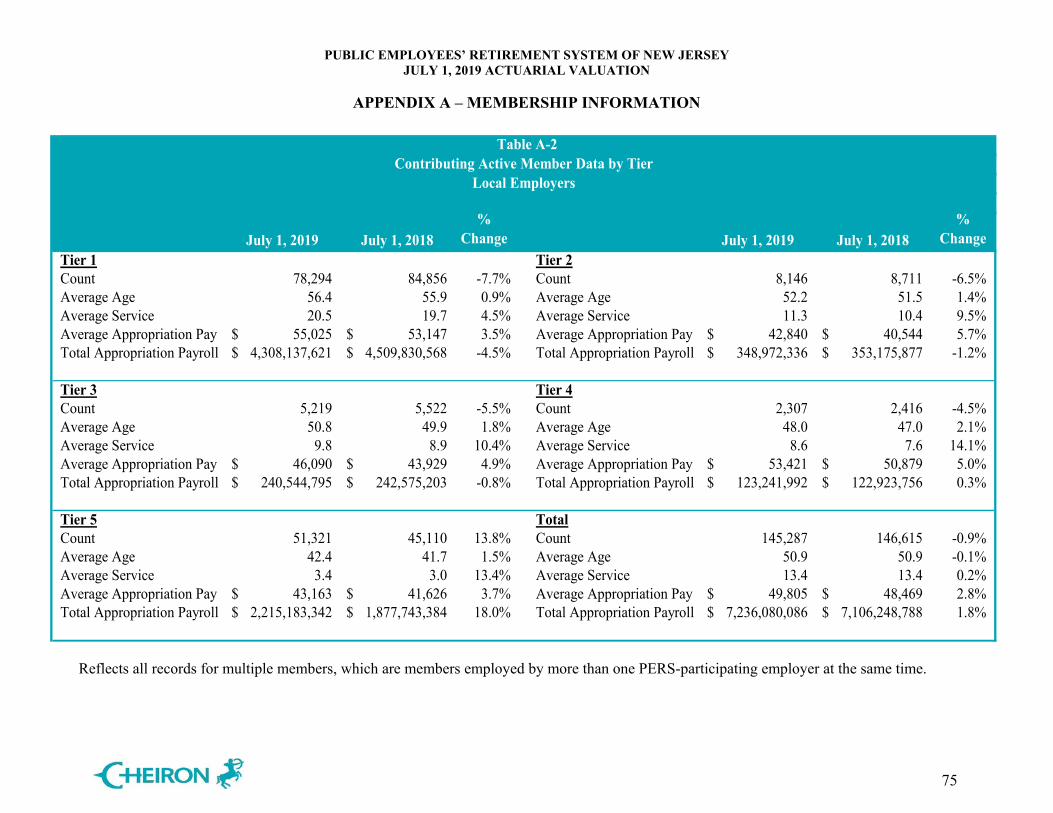
PUBLIC EMPLOYEES’ RETIREMENT SYSTEM OF NEW JERSEY JULY 1, 2019 ACTUARIAL VALUATION
APPENDIX A – MEMBERSHIP INFORMATION
75
Table A-2
July 1, 2019 July 1, 2018%
Change July 1, 2019 July 1, 2018%
ChangeTier 1 Tier 2Count 78,294 84,856 -7.7% Count 8,146 8,711 -6.5%Average Age 56.4 55.9 0.9% Average Age 52.2 51.5 1.4%Average Service 20.5 19.7 4.5% Average Service 11.3 10.4 9.5%Average Appropriation Pay 55,025$ 53,147$ 3.5% Average Appropriation Pay 42,840$ 40,544$ 5.7%Total Appropriation Payroll 4,308,137,621$ 4,509,830,568$ -4.5% Total Appropriation Payroll 348,972,336$ 353,175,877$ -1.2%
Tier 3 Tier 4Count 5,219 5,522 -5.5% Count 2,307 2,416 -4.5%Average Age 50.8 49.9 1.8% Average Age 48.0 47.0 2.1%Average Service 9.8 8.9 10.4% Average Service 8.6 7.6 14.1%Average Appropriation Pay 46,090$ 43,929$ 4.9% Average Appropriation Pay 53,421$ 50,879$ 5.0%Total Appropriation Payroll 240,544,795$ 242,575,203$ -0.8% Total Appropriation Payroll 123,241,992$ 122,923,756$ 0.3%
Tier 5 TotalCount 51,321 45,110 13.8% Count 145,287 146,615 -0.9%Average Age 42.4 41.7 1.5% Average Age 50.9 50.9 -0.1%Average Service 3.4 3.0 13.4% Average Service 13.4 13.4 0.2%Average Appropriation Pay 43,163$ 41,626$ 3.7% Average Appropriation Pay 49,805$ 48,469$ 2.8%Total Appropriation Payroll 2,215,183,342$ 1,877,743,384$ 18.0% Total Appropriation Payroll 7,236,080,086$ 7,106,248,788$ 1.8%
Contributing Active Member Data by TierLocal Employers
Reflects all records for multiple members, which are members employed by more than one PERS-participating employer at the same time.
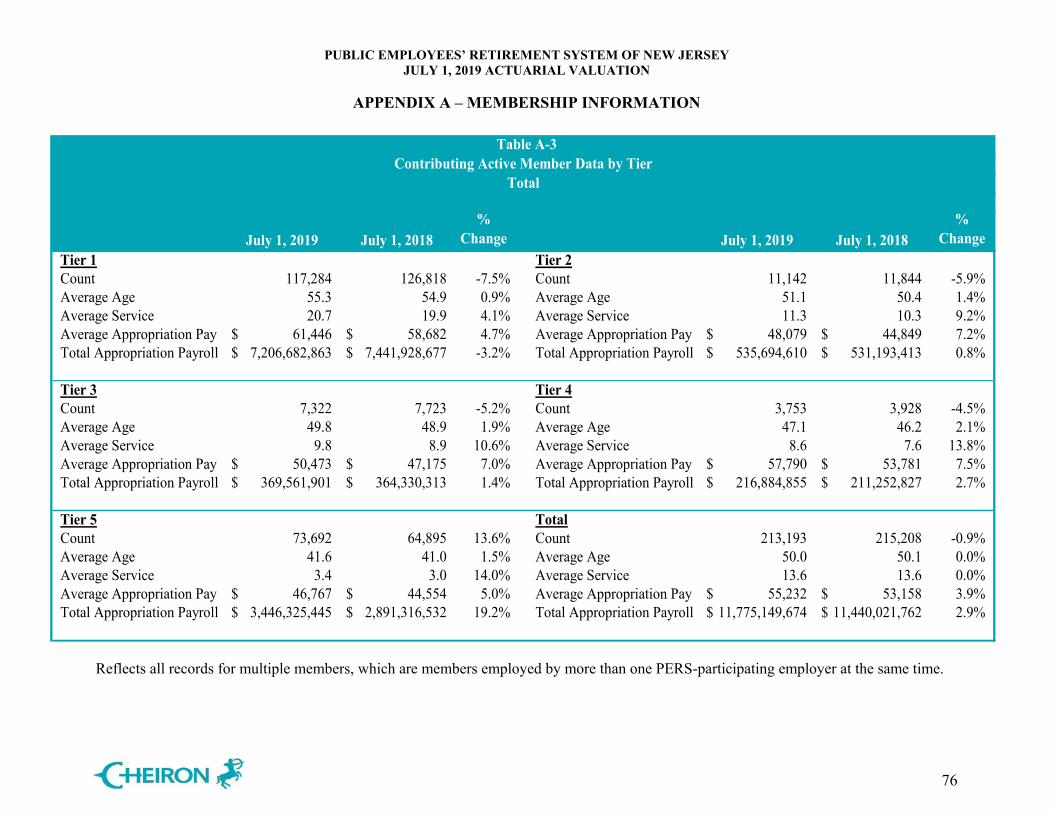
PUBLIC EMPLOYEES’ RETIREMENT SYSTEM OF NEW JERSEY JULY 1, 2019 ACTUARIAL VALUATION
APPENDIX A – MEMBERSHIP INFORMATION
76
Table A-3
July 1, 2019 July 1, 2018%
Change July 1, 2019 July 1, 2018%
ChangeTier 1 Tier 2Count 117,284 126,818 -7.5% Count 11,142 11,844 -5.9%Average Age 55.3 54.9 0.9% Average Age 51.1 50.4 1.4%Average Service 20.7 19.9 4.1% Average Service 11.3 10.3 9.2%Average Appropriation Pay 61,446$ 58,682$ 4.7% Average Appropriation Pay 48,079$ 44,849$ 7.2%Total Appropriation Payroll 7,206,682,863$ 7,441,928,677$ -3.2% Total Appropriation Payroll 535,694,610$ 531,193,413$ 0.8%
Tier 3 Tier 4Count 7,322 7,723 -5.2% Count 3,753 3,928 -4.5%Average Age 49.8 48.9 1.9% Average Age 47.1 46.2 2.1%Average Service 9.8 8.9 10.6% Average Service 8.6 7.6 13.8%Average Appropriation Pay 50,473$ 47,175$ 7.0% Average Appropriation Pay 57,790$ 53,781$ 7.5%Total Appropriation Payroll 369,561,901$ 364,330,313$ 1.4% Total Appropriation Payroll 216,884,855$ 211,252,827$ 2.7%
Tier 5 TotalCount 73,692 64,895 13.6% Count 213,193 215,208 -0.9%Average Age 41.6 41.0 1.5% Average Age 50.0 50.1 0.0%Average Service 3.4 3.0 14.0% Average Service 13.6 13.6 0.0%Average Appropriation Pay 46,767$ 44,554$ 5.0% Average Appropriation Pay 55,232$ 53,158$ 3.9%Total Appropriation Payroll 3,446,325,445$ 2,891,316,532$ 19.2% Total Appropriation Payroll 11,775,149,674$ 11,440,021,762$ 2.9%
TotalContributing Active Member Data by Tier
Reflects all records for multiple members, which are members employed by more than one PERS-participating employer at the same time.
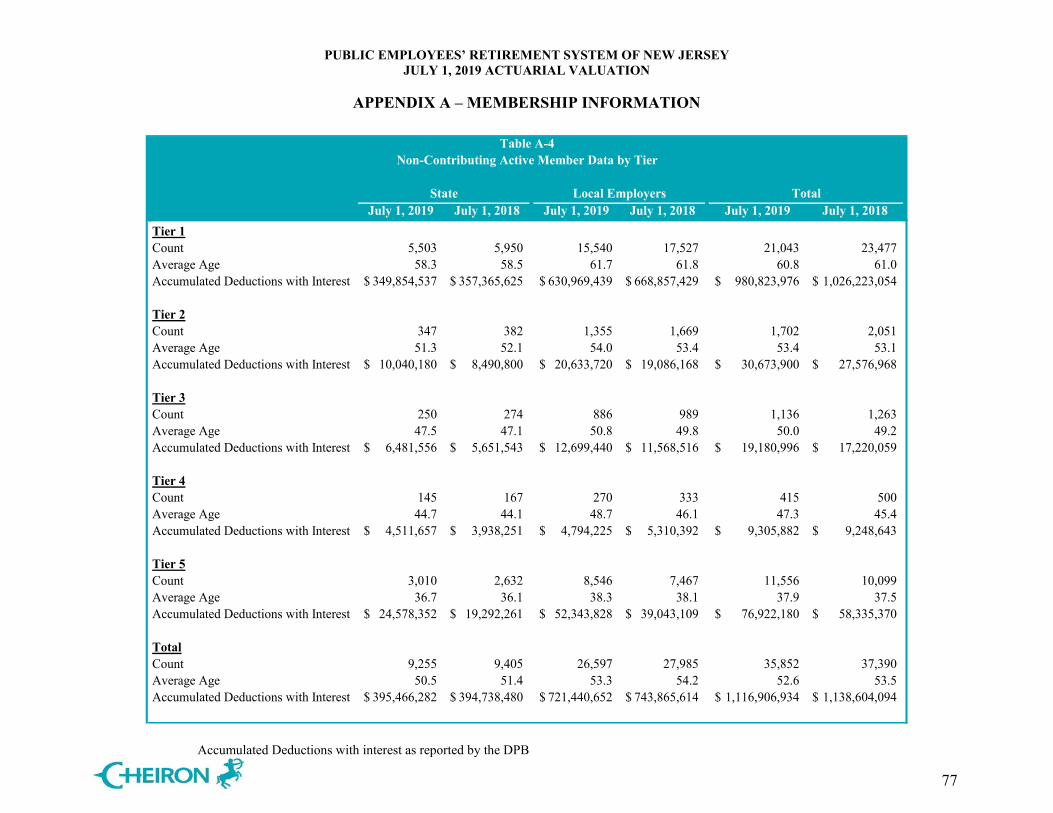
PUBLIC EMPLOYEES’ RETIREMENT SYSTEM OF NEW JERSEY JULY 1, 2019 ACTUARIAL VALUATION
APPENDIX A – MEMBERSHIP INFORMATION
77
July 1, 2019 July 1, 2018 July 1, 2019 July 1, 2018 July 1, 2019 July 1, 2018Tier 1Count 5,503 5,950 15,540 17,527 21,043 23,477 Average Age 58.3 58.5 61.7 61.8 60.8 61.0 Accumulated Deductions with Interest 349,854,537$ 357,365,625$ 630,969,439$ 668,857,429$ 980,823,976$ 1,026,223,054$
Tier 2Count 347 382 1,355 1,669 1,702 2,051 Average Age 51.3 52.1 54.0 53.4 53.4 53.1 Accumulated Deductions with Interest 10,040,180$ 8,490,800$ 20,633,720$ 19,086,168$ 30,673,900$ 27,576,968$
Tier 3Count 250 274 886 989 1,136 1,263 Average Age 47.5 47.1 50.8 49.8 50.0 49.2 Accumulated Deductions with Interest 6,481,556$ 5,651,543$ 12,699,440$ 11,568,516$ 19,180,996$ 17,220,059$
Tier 4Count 145 167 270 333 415 500 Average Age 44.7 44.1 48.7 46.1 47.3 45.4 Accumulated Deductions with Interest 4,511,657$ 3,938,251$ 4,794,225$ 5,310,392$ 9,305,882$ 9,248,643$
Tier 5Count 3,010 2,632 8,546 7,467 11,556 10,099 Average Age 36.7 36.1 38.3 38.1 37.9 37.5 Accumulated Deductions with Interest 24,578,352$ 19,292,261$ 52,343,828$ 39,043,109$ 76,922,180$ 58,335,370$
TotalCount 9,255 9,405 26,597 27,985 35,852 37,390 Average Age 50.5 51.4 53.3 54.2 52.6 53.5 Accumulated Deductions with Interest 395,466,282$ 394,738,480$ 721,440,652$ 743,865,614$ 1,116,906,934$ 1,138,604,094$
State Local Employers Total
Table A-4Non-Contributing Active Member Data by Tier
Accumulated Deductions with interest as reported by the DPB
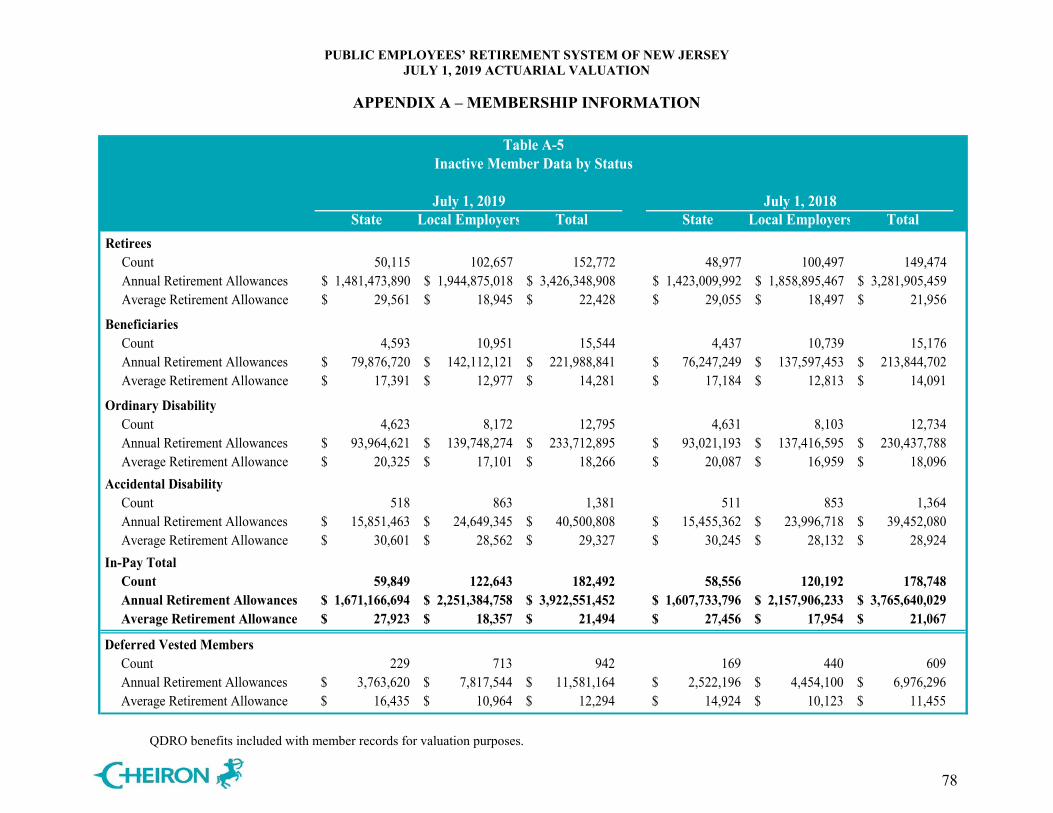
PUBLIC EMPLOYEES’ RETIREMENT SYSTEM OF NEW JERSEY JULY 1, 2019 ACTUARIAL VALUATION
APPENDIX A – MEMBERSHIP INFORMATION
78
July 1, 2019 July 1, 2018State Local Employers Total State Local Employers Total
Retirees Count 50,115 102,657 152,772 48,977 100,497 149,474 Annual Retirement Allowances 1,481,473,890$ 1,944,875,018$ 3,426,348,908$ 1,423,009,992$ 1,858,895,467$ 3,281,905,459$ Average Retirement Allowance 29,561$ 18,945$ 22,428$ 29,055$ 18,497$ 21,956$
Beneficiaries Count 4,593 10,951 15,544 4,437 10,739 15,176 Annual Retirement Allowances 79,876,720$ 142,112,121$ 221,988,841$ 76,247,249$ 137,597,453$ 213,844,702$ Average Retirement Allowance 17,391$ 12,977$ 14,281$ 17,184$ 12,813$ 14,091$
Ordinary Disability Count 4,623 8,172 12,795 4,631 8,103 12,734 Annual Retirement Allowances 93,964,621$ 139,748,274$ 233,712,895$ 93,021,193$ 137,416,595$ 230,437,788$ Average Retirement Allowance 20,325$ 17,101$ 18,266$ 20,087$ 16,959$ 18,096$ Accidental Disability Count 518 863 1,381 511 853 1,364 Annual Retirement Allowances 15,851,463$ 24,649,345$ 40,500,808$ 15,455,362$ 23,996,718$ 39,452,080$ Average Retirement Allowance 30,601$ 28,562$ 29,327$ 30,245$ 28,132$ 28,924$ In-Pay Total Count 59,849 122,643 182,492 58,556 120,192 178,748 Annual Retirement Allowances 1,671,166,694$ 2,251,384,758$ 3,922,551,452$ 1,607,733,796$ 2,157,906,233$ 3,765,640,029$ Average Retirement Allowance 27,923$ 18,357$ 21,494$ 27,456$ 17,954$ 21,067$
Deferred Vested Members Count 229 713 942 169 440 609 Annual Retirement Allowances 3,763,620$ 7,817,544$ 11,581,164$ 2,522,196$ 4,454,100$ 6,976,296$ Average Retirement Allowance 16,435$ 10,964$ 12,294$ 14,924$ 10,123$ 11,455$
Table A-5Inactive Member Data by Status
QDRO benefits included with member records for valuation purposes.
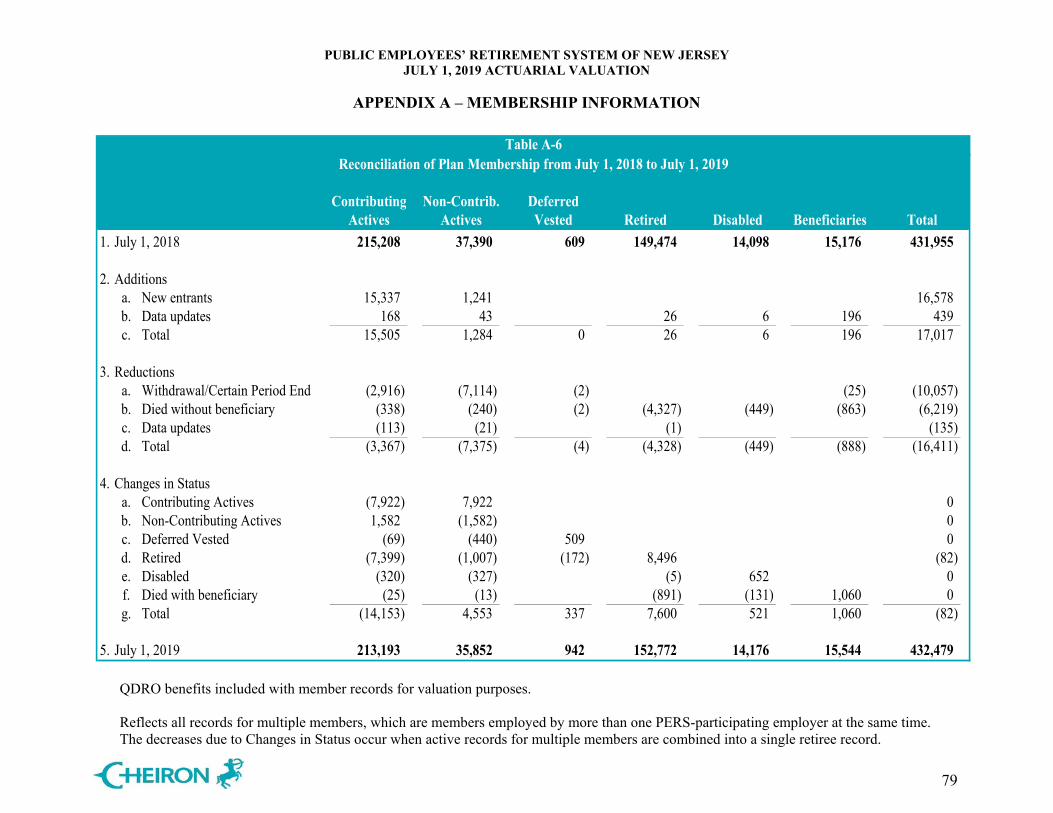
PUBLIC EMPLOYEES’ RETIREMENT SYSTEM OF NEW JERSEY JULY 1, 2019 ACTUARIAL VALUATION
APPENDIX A – MEMBERSHIP INFORMATION
79
Table A-6Reconciliation of Plan Membership from July 1, 2018 to July 1, 2019
Contributing Non-Contrib. DeferredActives Actives Vested Retired Disabled Beneficiaries Total
1. July 1, 2018 215,208 37,390 609 149,474 14,098 15,176 431,955
2. Additionsa. New entrants 15,337 1,241 16,578b. Data updates 168 43 26 6 196 439c. Total 15,505 1,284 0 26 6 196 17,017
3. Reductionsa. Withdrawal/Certain Period End (2,916) (7,114) (2) (25) (10,057)b. Died without beneficiary (338) (240) (2) (4,327) (449) (863) (6,219)c. Data updates (113) (21) (1) (135)d. Total (3,367) (7,375) (4) (4,328) (449) (888) (16,411)
4. Changes in Statusa. Contributing Actives (7,922) 7,922 0b. Non-Contributing Actives 1,582 (1,582) 0c. Deferred Vested (69) (440) 509 0d. Retired (7,399) (1,007) (172) 8,496 (82)e. Disabled (320) (327) (5) 652 0f. Died with beneficiary (25) (13) (891) (131) 1,060 0g. Total (14,153) 4,553 337 7,600 521 1,060 (82)
5. July 1, 2019 213,193 35,852 942 152,772 14,176 15,544 432,479
QDRO benefits included with member records for valuation purposes. Reflects all records for multiple members, which are members employed by more than one PERS-participating employer at the same time. The decreases due to Changes in Status occur when active records for multiple members are combined into a single retiree record.
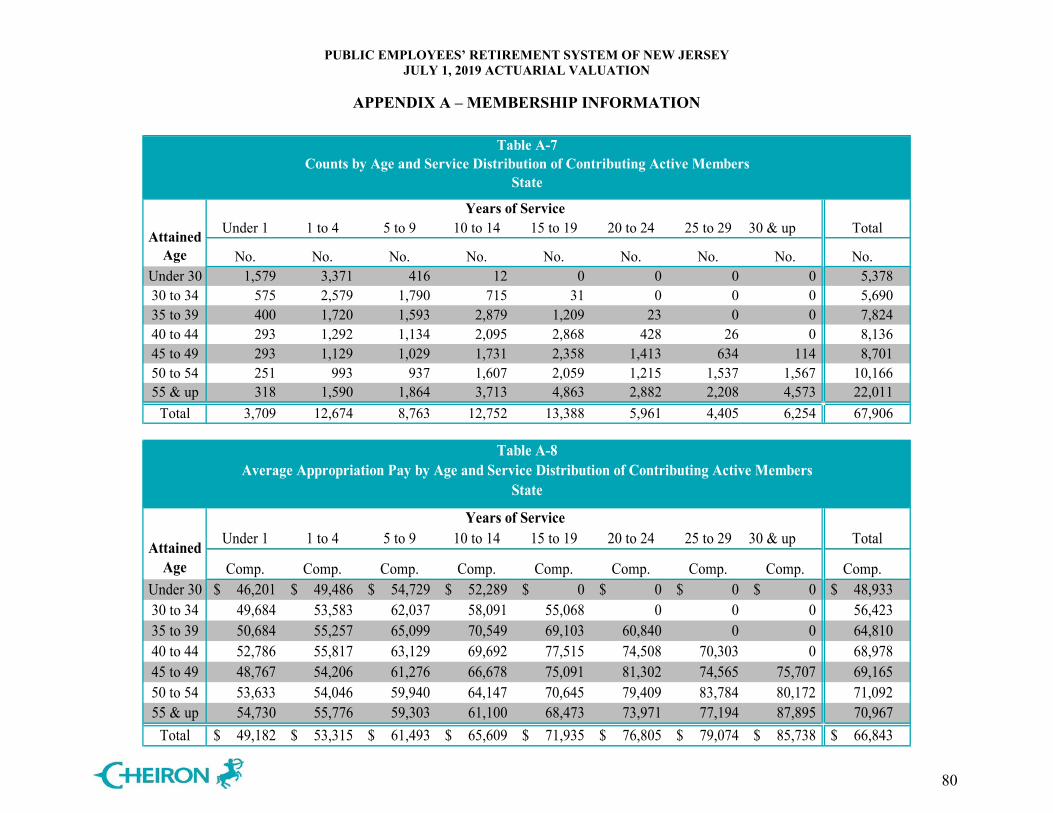
PUBLIC EMPLOYEES’ RETIREMENT SYSTEM OF NEW JERSEY JULY 1, 2019 ACTUARIAL VALUATION
APPENDIX A – MEMBERSHIP INFORMATION
80
Under 1 1 to 4 5 to 9 10 to 14 15 to 19 20 to 24 25 to 29 30 & up Total
Age No. No. No. No. No. No. No. No. No.Under 30 1,579 3,371 416 12 0 0 0 0 5,37830 to 34 575 2,579 1,790 715 31 0 0 0 5,69035 to 39 400 1,720 1,593 2,879 1,209 23 0 0 7,82440 to 44 293 1,292 1,134 2,095 2,868 428 26 0 8,13645 to 49 293 1,129 1,029 1,731 2,358 1,413 634 114 8,70150 to 54 251 993 937 1,607 2,059 1,215 1,537 1,567 10,16655 & up 318 1,590 1,864 3,713 4,863 2,882 2,208 4,573 22,011
Total 3,709 12,674 8,763 12,752 13,388 5,961 4,405 6,254 67,906
Attained
State
Years of Service
Table A-7Counts by Age and Service Distribution of Contributing Active Members
Under 1 1 to 4 5 to 9 10 to 14 15 to 19 20 to 24 25 to 29 30 & up TotalAverage Average Average Average Average Average Average Average Average
Age Comp. Comp. Comp. Comp. Comp. Comp. Comp. Comp. Comp.Under 30 46,201$ 49,486$ 54,729$ 52,289$ 0$ 0$ 0$ 0$ 48,933$ 30 to 34 49,684 53,583 62,037 58,091 55,068 0 0 0 56,42335 to 39 50,684 55,257 65,099 70,549 69,103 60,840 0 0 64,81040 to 44 52,786 55,817 63,129 69,692 77,515 74,508 70,303 0 68,97845 to 49 48,767 54,206 61,276 66,678 75,091 81,302 74,565 75,707 69,16550 to 54 53,633 54,046 59,940 64,147 70,645 79,409 83,784 80,172 71,09255 & up 54,730 55,776 59,303 61,100 68,473 73,971 77,194 87,895 70,967
Total 49,182$ 53,315$ 61,493$ 65,609$ 71,935$ 76,805$ 79,074$ 85,738$ 66,843$
Attained
State
Years of Service
Table A-8Average Appropriation Pay by Age and Service Distribution of Contributing Active Members
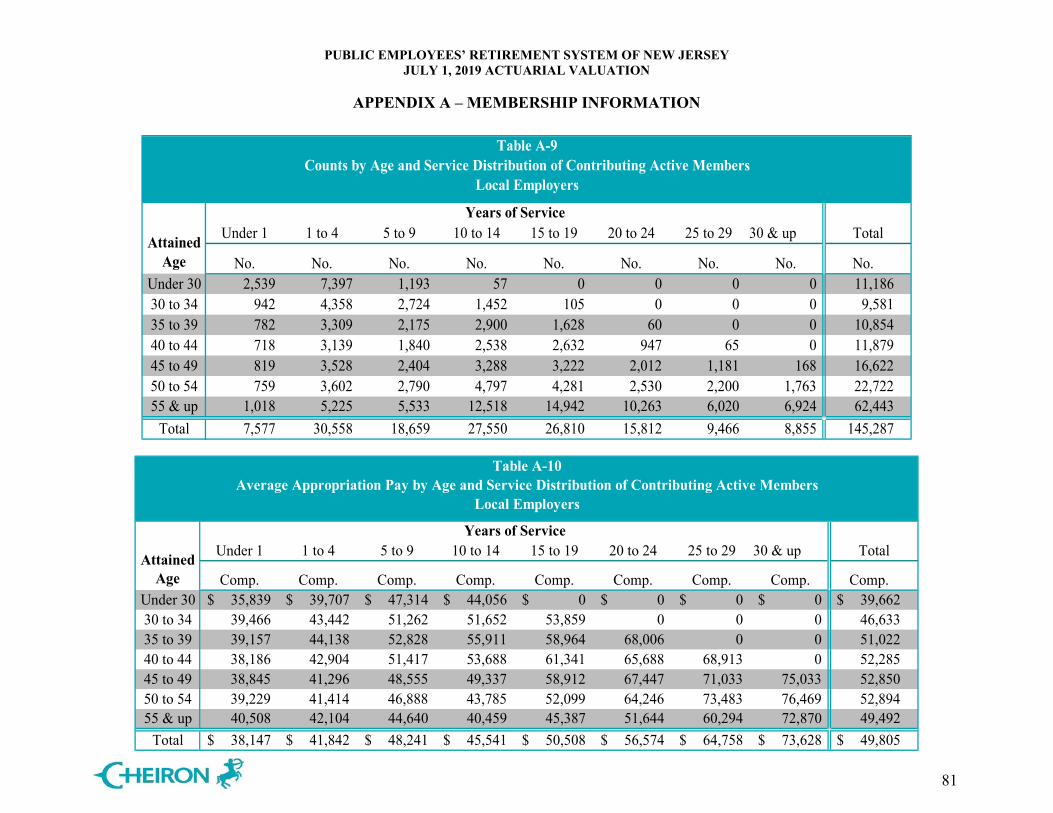
PUBLIC EMPLOYEES’ RETIREMENT SYSTEM OF NEW JERSEY JULY 1, 2019 ACTUARIAL VALUATION
APPENDIX A – MEMBERSHIP INFORMATION
81
Under 1 1 to 4 5 to 9 10 to 14 15 to 19 20 to 24 25 to 29 30 & up Total
Age No. No. No. No. No. No. No. No. No.Under 30 2,539 7,397 1,193 57 0 0 0 0 11,18630 to 34 942 4,358 2,724 1,452 105 0 0 0 9,58135 to 39 782 3,309 2,175 2,900 1,628 60 0 0 10,85440 to 44 718 3,139 1,840 2,538 2,632 947 65 0 11,87945 to 49 819 3,528 2,404 3,288 3,222 2,012 1,181 168 16,62250 to 54 759 3,602 2,790 4,797 4,281 2,530 2,200 1,763 22,72255 & up 1,018 5,225 5,533 12,518 14,942 10,263 6,020 6,924 62,443
Total 7,577 30,558 18,659 27,550 26,810 15,812 9,466 8,855 145,287
Attained
Local Employers
Years of Service
Table A-9Counts by Age and Service Distribution of Contributing Active Members
Under 1 1 to 4 5 to 9 10 to 14 15 to 19 20 to 24 25 to 29 30 & up TotalAverage Average Average Average Average Average Average Average Average
Age Comp. Comp. Comp. Comp. Comp. Comp. Comp. Comp. Comp.Under 30 35,839$ 39,707$ 47,314$ 44,056$ 0$ 0$ 0$ 0$ 39,662$ 30 to 34 39,466 43,442 51,262 51,652 53,859 0 0 0 46,63335 to 39 39,157 44,138 52,828 55,911 58,964 68,006 0 0 51,02240 to 44 38,186 42,904 51,417 53,688 61,341 65,688 68,913 0 52,28545 to 49 38,845 41,296 48,555 49,337 58,912 67,447 71,033 75,033 52,85050 to 54 39,229 41,414 46,888 43,785 52,099 64,246 73,483 76,469 52,89455 & up 40,508 42,104 44,640 40,459 45,387 51,644 60,294 72,870 49,492
Total 38,147$ 41,842$ 48,241$ 45,541$ 50,508$ 56,574$ 64,758$ 73,628$ 49,805$
Attained
Local Employers
Years of Service
Table A-10Average Appropriation Pay by Age and Service Distribution of Contributing Active Members
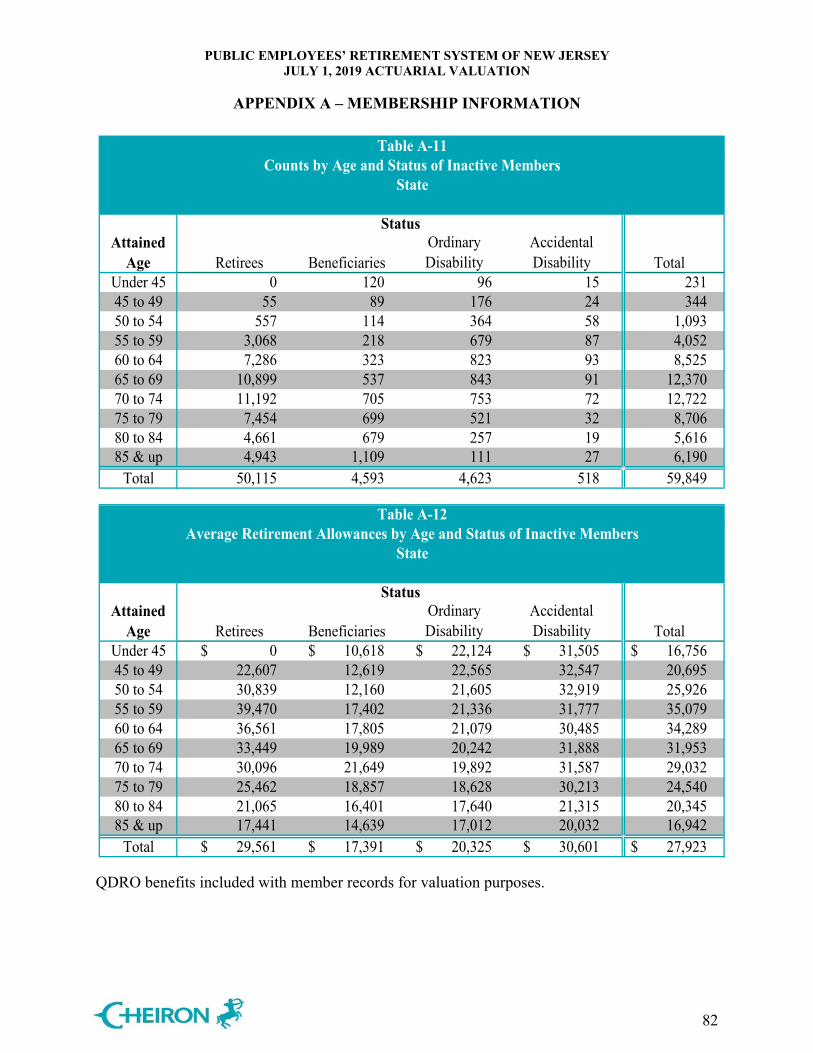
PUBLIC EMPLOYEES’ RETIREMENT SYSTEM OF NEW JERSEY JULY 1, 2019 ACTUARIAL VALUATION
APPENDIX A – MEMBERSHIP INFORMATION
82
Retirees BeneficiariesOrdinary Disability
Accidental Disability Total
Under 45 0 120 96 15 23145 to 49 55 89 176 24 34450 to 54 557 114 364 58 1,09355 to 59 3,068 218 679 87 4,05260 to 64 7,286 323 823 93 8,52565 to 69 10,899 537 843 91 12,37070 to 74 11,192 705 753 72 12,72275 to 79 7,454 699 521 32 8,70680 to 84 4,661 679 257 19 5,61685 & up 4,943 1,109 111 27 6,190
Total 50,115 4,593 4,623 518 59,849
Table A-11Counts by Age and Status of Inactive Members
State
Attained Age
Status
Retirees BeneficiariesOrdinary Disability
Accidental Disability Total
Under 45 0$ 10,618$ 22,124$ 31,505$ 16,756$ 45 to 49 22,607 12,619 22,565 32,547 20,69550 to 54 30,839 12,160 21,605 32,919 25,92655 to 59 39,470 17,402 21,336 31,777 35,07960 to 64 36,561 17,805 21,079 30,485 34,28965 to 69 33,449 19,989 20,242 31,888 31,95370 to 74 30,096 21,649 19,892 31,587 29,03275 to 79 25,462 18,857 18,628 30,213 24,54080 to 84 21,065 16,401 17,640 21,315 20,34585 & up 17,441 14,639 17,012 20,032 16,942
Total 29,561$ 17,391$ 20,325$ 30,601$ 27,923$
Table A-12Average Retirement Allowances by Age and Status of Inactive Members
State
Attained Age
Status
QDRO benefits included with member records for valuation purposes.
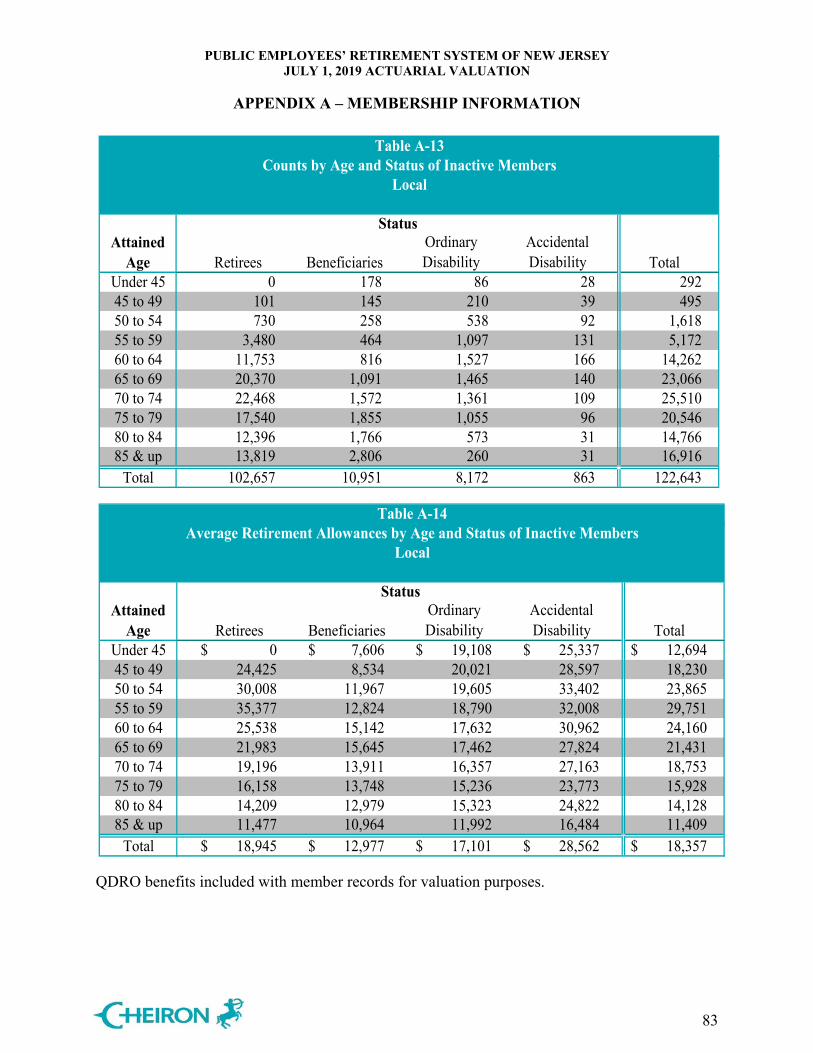
PUBLIC EMPLOYEES’ RETIREMENT SYSTEM OF NEW JERSEY JULY 1, 2019 ACTUARIAL VALUATION
APPENDIX A – MEMBERSHIP INFORMATION
83
Retirees BeneficiariesOrdinary Disability
Accidental Disability Total
Under 45 0 178 86 28 29245 to 49 101 145 210 39 49550 to 54 730 258 538 92 1,61855 to 59 3,480 464 1,097 131 5,17260 to 64 11,753 816 1,527 166 14,26265 to 69 20,370 1,091 1,465 140 23,06670 to 74 22,468 1,572 1,361 109 25,51075 to 79 17,540 1,855 1,055 96 20,54680 to 84 12,396 1,766 573 31 14,76685 & up 13,819 2,806 260 31 16,916
Total 102,657 10,951 8,172 863 122,643
Table A-13Counts by Age and Status of Inactive Members
Local
Attained Age
Status
Retirees BeneficiariesOrdinary Disability
Accidental Disability Total
Under 45 0$ 7,606$ 19,108$ 25,337$ 12,694$ 45 to 49 24,425 8,534 20,021 28,597 18,23050 to 54 30,008 11,967 19,605 33,402 23,86555 to 59 35,377 12,824 18,790 32,008 29,75160 to 64 25,538 15,142 17,632 30,962 24,16065 to 69 21,983 15,645 17,462 27,824 21,43170 to 74 19,196 13,911 16,357 27,163 18,75375 to 79 16,158 13,748 15,236 23,773 15,92880 to 84 14,209 12,979 15,323 24,822 14,12885 & up 11,477 10,964 11,992 16,484 11,409
Total 18,945$ 12,977$ 17,101$ 28,562$ 18,357$
Table A-14Average Retirement Allowances by Age and Status of Inactive Members
Local
Attained Age
Status
QDRO benefits included with member records for valuation purposes.
PUBLIC EMPLOYEES’ RETIREMENT SYSTEM OF NEW JERSEY JULY 1, 2019 ACTUARIAL VALUATION
APPENDIX B – ACTUARIAL ASSUMPTIONS AND METHODS
84
A. Actuarial Assumptions 1. Investment Rate of
Return
7.30% per annum, compounded annually.
2. Administrative Expenses
No explicit assumption is made for administrative expenses for funding purposes per the funding methodology prescribed by NJ State Statute.
3. Interest Crediting Rate on Accumulated Deductions
7.30% per annum, compounded annually. Interest credits are assumed to end upon termination.
4. Cost-of-Living Adjustments (COLAs)
No future COLAs are assumed. Previously granted COLAs are included in the data.
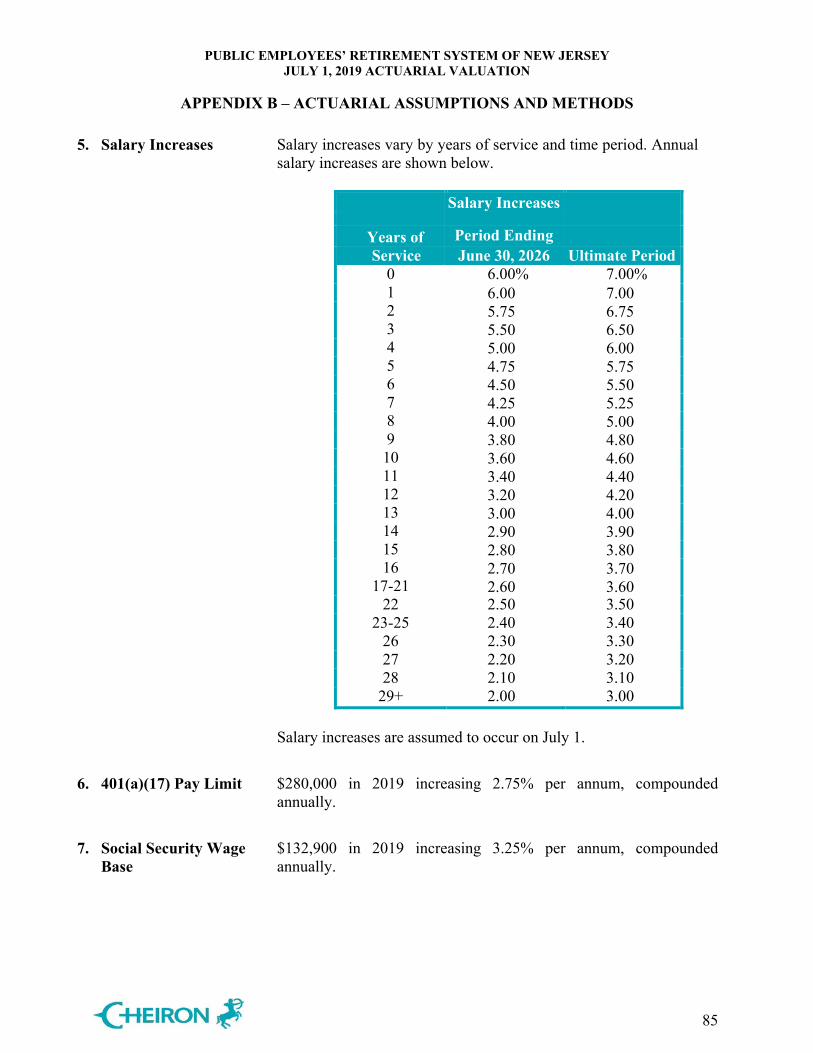
PUBLIC EMPLOYEES’ RETIREMENT SYSTEM OF NEW JERSEY JULY 1, 2019 ACTUARIAL VALUATION
APPENDIX B – ACTUARIAL ASSUMPTIONS AND METHODS
85
5. Salary Increases Salary increases vary by years of service and time period. Annual salary increases are shown below.
Salary Increases Years of Period Ending
Service June 30, 2026 Ultimate Period 0 6.00% 7.00% 1 6.00 7.00 2 5.75 6.75 3 5.50 6.50 4 5.00 6.00 5 4.75 5.75 6 4.50 5.50 7 4.25 5.25 8 4.00 5.00 9 3.80 4.80 10 3.60 4.60 11 3.40 4.40 12 3.20 4.20 13 3.00 4.00 14 2.90 3.90 15 2.80 3.80 16 2.70 3.70
17-21 2.60 3.60 22 2.50 3.50
23-25 2.40 3.40 26 2.30 3.30 27 2.20 3.20 28 2.10 3.10
29+ 2.00 3.00 Salary increases are assumed to occur on July 1.
6. 401(a)(17) Pay Limit $280,000 in 2019 increasing 2.75% per annum, compounded annually.
7. Social Security Wage Base
$132,900 in 2019 increasing 3.25% per annum, compounded annually.
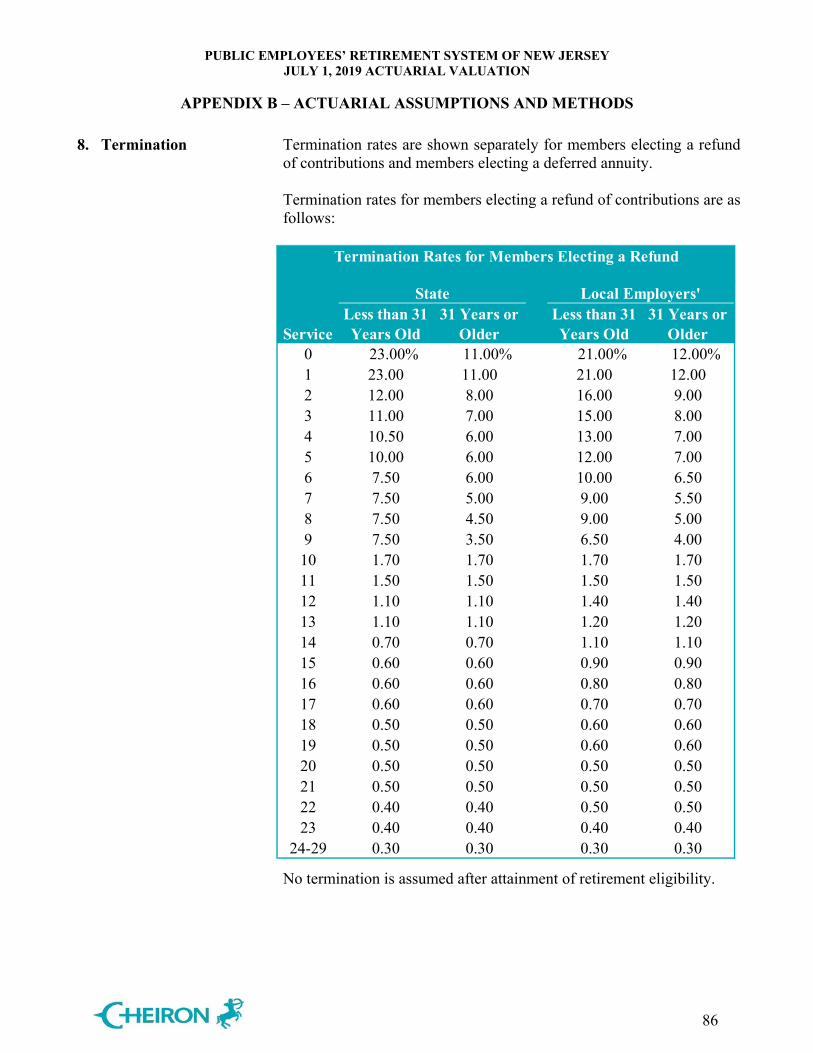
PUBLIC EMPLOYEES’ RETIREMENT SYSTEM OF NEW JERSEY JULY 1, 2019 ACTUARIAL VALUATION
APPENDIX B – ACTUARIAL ASSUMPTIONS AND METHODS
86
ServiceLess than 31 Years Old
31 Years or Older
Less than 31 Years Old
31 Years or Older
0 23.00% 11.00% 21.00% 12.00%1 23.00 11.00 21.00 12.002 12.00 8.00 16.00 9.003 11.00 7.00 15.00 8.004 10.50 6.00 13.00 7.005 10.00 6.00 12.00 7.006 7.50 6.00 10.00 6.507 7.50 5.00 9.00 5.508 7.50 4.50 9.00 5.009 7.50 3.50 6.50 4.00
10 1.70 1.70 1.70 1.7011 1.50 1.50 1.50 1.5012 1.10 1.10 1.40 1.4013 1.10 1.10 1.20 1.2014 0.70 0.70 1.10 1.1015 0.60 0.60 0.90 0.9016 0.60 0.60 0.80 0.8017 0.60 0.60 0.70 0.7018 0.50 0.50 0.60 0.6019 0.50 0.50 0.60 0.6020 0.50 0.50 0.50 0.5021 0.50 0.50 0.50 0.5022 0.40 0.40 0.50 0.5023 0.40 0.40 0.40 0.40
24-29 0.30 0.30 0.30 0.30
State Local Employers'
Termination Rates for Members Electing a Refund
8. Termination Termination rates are shown separately for members electing a refund of contributions and members electing a deferred annuity. Termination rates for members electing a refund of contributions are as follows:
No termination is assumed after attainment of retirement eligibility.
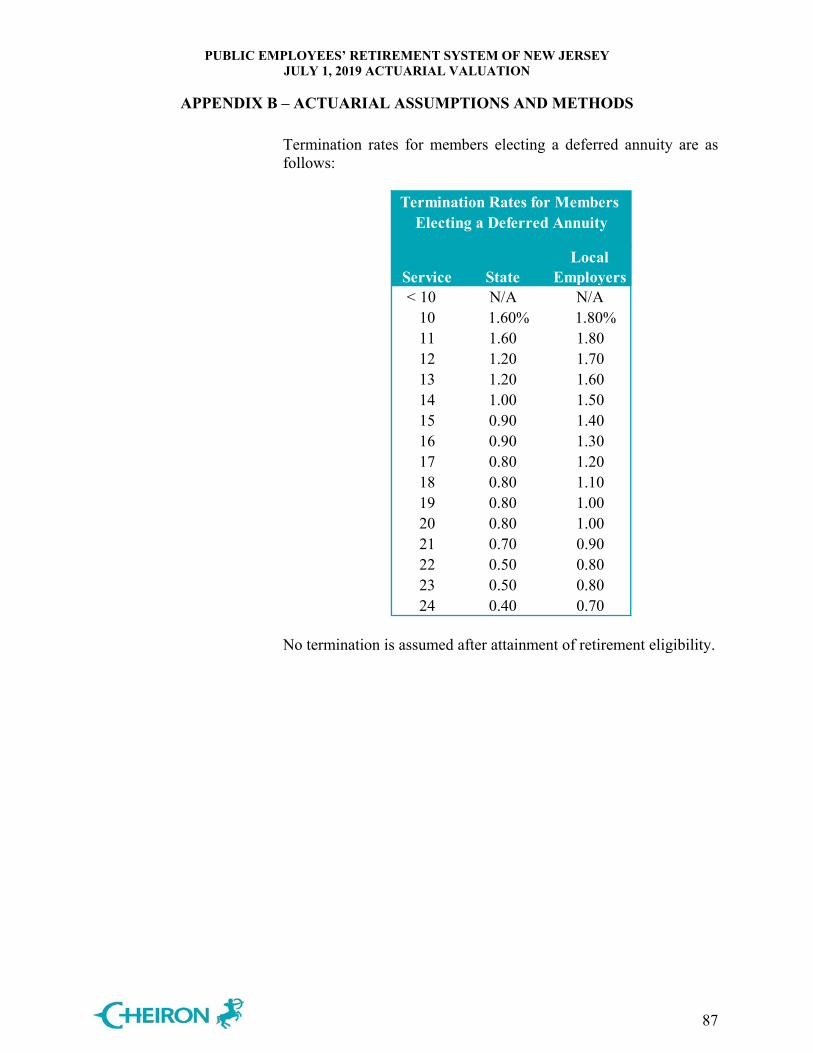
PUBLIC EMPLOYEES’ RETIREMENT SYSTEM OF NEW JERSEY JULY 1, 2019 ACTUARIAL VALUATION
APPENDIX B – ACTUARIAL ASSUMPTIONS AND METHODS
87
Termination rates for members electing a deferred annuity are as follows:
Termination Rates for Members Electing a Deferred Annuity
Service StateLocal
Employers< 10 N/A N/A
10 1.60% 1.80%11 1.60 1.8012 1.20 1.7013 1.20 1.6014 1.00 1.5015 0.90 1.4016 0.90 1.3017 0.80 1.2018 0.80 1.1019 0.80 1.0020 0.80 1.0021 0.70 0.9022 0.50 0.8023 0.50 0.8024 0.40 0.70
No termination is assumed after attainment of retirement eligibility.
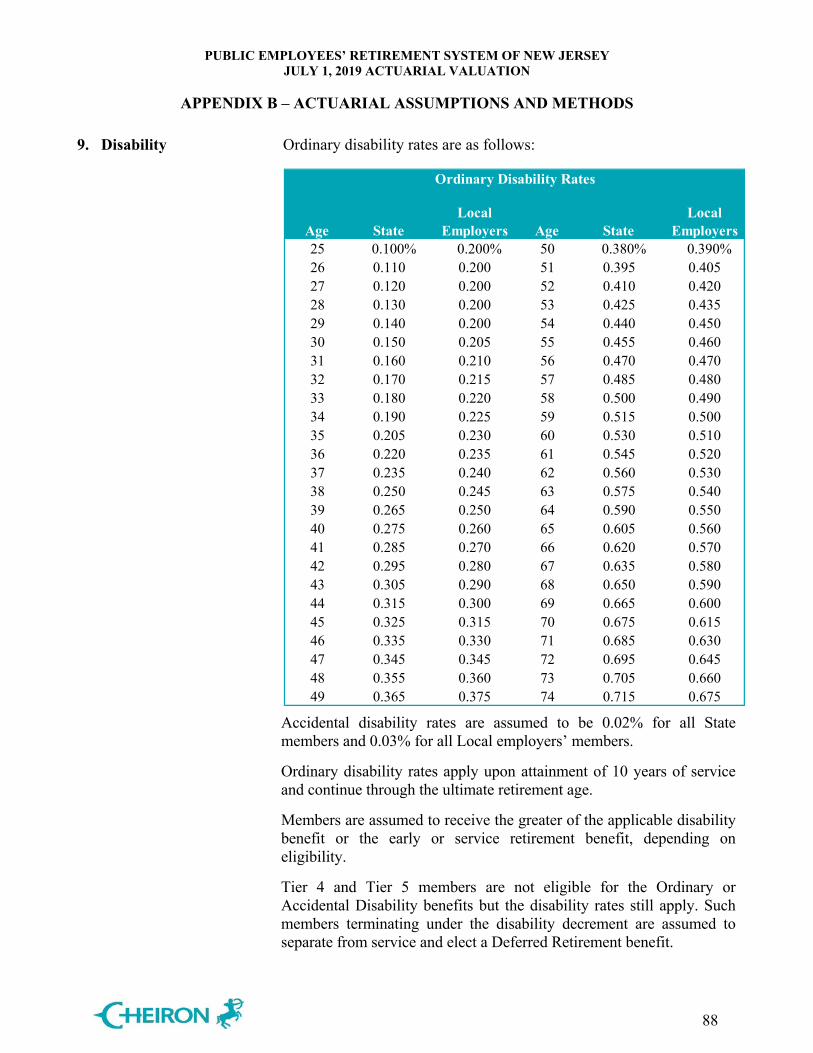
PUBLIC EMPLOYEES’ RETIREMENT SYSTEM OF NEW JERSEY JULY 1, 2019 ACTUARIAL VALUATION
APPENDIX B – ACTUARIAL ASSUMPTIONS AND METHODS
88
Ordinary Disability Rates
Age StateLocal
Employers Age StateLocal
Employers25 0.100% 0.200% 50 0.380% 0.390%26 0.110 0.200 51 0.395 0.40527 0.120 0.200 52 0.410 0.42028 0.130 0.200 53 0.425 0.43529 0.140 0.200 54 0.440 0.45030 0.150 0.205 55 0.455 0.46031 0.160 0.210 56 0.470 0.47032 0.170 0.215 57 0.485 0.48033 0.180 0.220 58 0.500 0.49034 0.190 0.225 59 0.515 0.50035 0.205 0.230 60 0.530 0.51036 0.220 0.235 61 0.545 0.52037 0.235 0.240 62 0.560 0.53038 0.250 0.245 63 0.575 0.54039 0.265 0.250 64 0.590 0.55040 0.275 0.260 65 0.605 0.56041 0.285 0.270 66 0.620 0.57042 0.295 0.280 67 0.635 0.58043 0.305 0.290 68 0.650 0.59044 0.315 0.300 69 0.665 0.60045 0.325 0.315 70 0.675 0.61546 0.335 0.330 71 0.685 0.63047 0.345 0.345 72 0.695 0.64548 0.355 0.360 73 0.705 0.66049 0.365 0.375 74 0.715 0.675
9. Disability Ordinary disability rates are as follows:
Accidental disability rates are assumed to be 0.02% for all State members and 0.03% for all Local employers’ members.
Ordinary disability rates apply upon attainment of 10 years of service and continue through the ultimate retirement age.
Members are assumed to receive the greater of the applicable disability benefit or the early or service retirement benefit, depending on eligibility.
Tier 4 and Tier 5 members are not eligible for the Ordinary or Accidental Disability benefits but the disability rates still apply. Such members terminating under the disability decrement are assumed to separate from service and elect a Deferred Retirement benefit.
PUBLIC EMPLOYEES’ RETIREMENT SYSTEM OF NEW JERSEY JULY 1, 2019 ACTUARIAL VALUATION
APPENDIX B – ACTUARIAL ASSUMPTIONS AND METHODS
89
10. Mortality Pre-Retirement Mortality: The Pub-2010 General Below-Median Income Employee mortality table [PubG-2010(B) Employee] as published by the Society of Actuaries with an 82.2% adjustment for males and 101.4% adjustment for females, and with future improvement from the base year of 2010 on a generational basis using SOA’s Scale MP-2018. All pre-retirement deaths are assumed to be ordinary deaths. Healthy Retirees and Beneficiaries (Healthy Annuitants): The Pub-2010 General Below-Median Income Healthy Retiree mortality table [PubG-2010(B) Healthy Retiree] as published by the Society of Actuaries with a 91.4% adjustment for males and 99.7% adjustment for females, and with future improvement from the base year of 2010 on a generational basis using SOA’s Scale MP-2018. Disabled Retirees (Disabled Annuitants): The Pub-2010 Non-Safety Disabled Retiree mortality table [PubNS-2010 Disabled Retiree] as published by the Society of Actuaries with a 127.7% adjustment for males and 117.2% adjustment for females, and with future improvement from the base year of 2010 on a generational basis using SOA’s Scale MP-2018.

PUBLIC EMPLOYEES’ RETIREMENT SYSTEM OF NEW JERSEY JULY 1, 2019 ACTUARIAL VALUATION
APPENDIX B – ACTUARIAL ASSUMPTIONS AND METHODS
90
11. Retirement Retirement rates for State Tier 1-4 members are as follows:
State Tiers 1-4 Retirement Rates
AgeLess Than 25
Years of Service25 Years of
Service26 or More Years
of Service < 49 N/A 3.50% 2.00%
49 N/A 3.50 2.0050 N/A 3.50 3.5051 N/A 3.50 3.5052 N/A 6.00 4.2553 N/A 6.00 5.5054 N/A 7.00 6.7555 N/A 17.50 18.0056 N/A 17.50 15.0057 N/A 17.50 14.0058 N/A 20.00 14.0059 N/A 20.00 14.0060 5.00 20.00 17.0061 5.00 30.00 17.0062 8.00 36.50 27.0063 8.00 36.50 24.0064 8.00 36.50 21.0065 12.00 44.00 25.0066 17.00 55.00 30.0067 16.00 50.00 26.0068 15.00 47.00 23.0069 15.00 47.00 23.0070 15.00 47.00 26.0071 15.00 47.00 23.0072 15.00 47.00 21.0073 15.00 47.00 21.0074 15.00 47.00 21.0075 100.00 100.00 100.00
Rates apply upon retirement eligibility by tier.
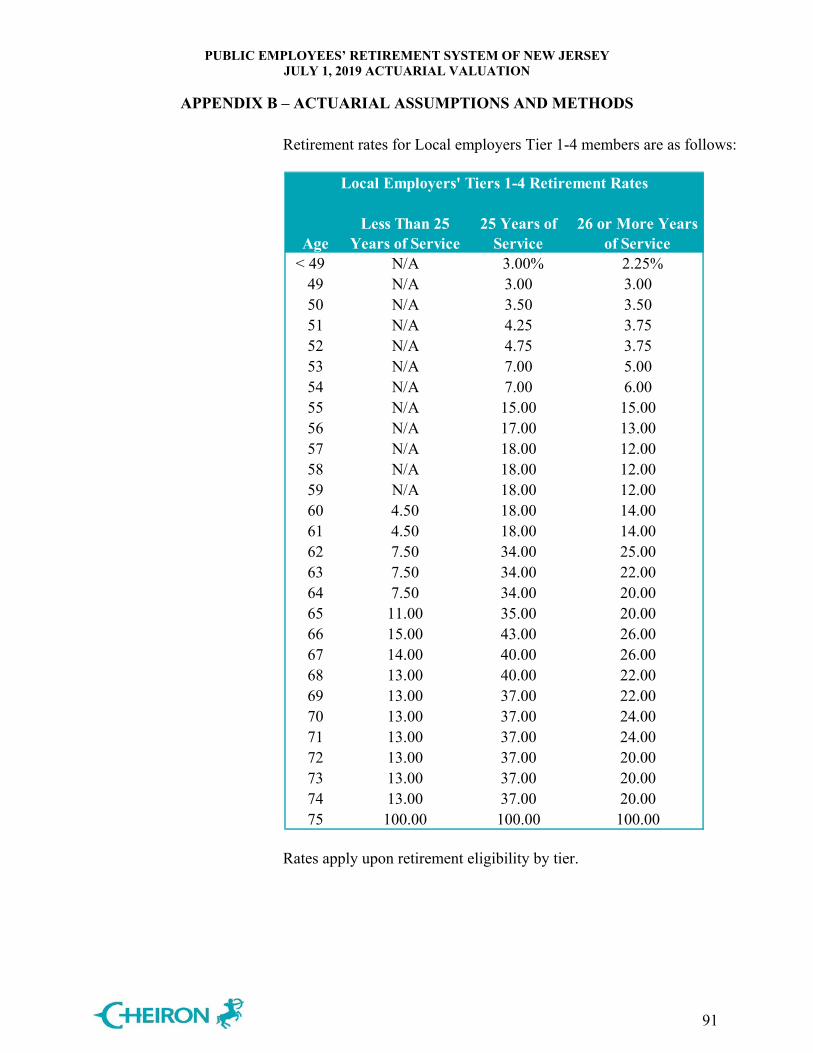
PUBLIC EMPLOYEES’ RETIREMENT SYSTEM OF NEW JERSEY JULY 1, 2019 ACTUARIAL VALUATION
APPENDIX B – ACTUARIAL ASSUMPTIONS AND METHODS
91
Retirement rates for Local employers Tier 1-4 members are as follows:
Local Employers' Tiers 1-4 Retirement Rates
AgeLess Than 25
Years of Service25 Years of
Service26 or More Years
of Service < 49 N/A 3.00% 2.25%
49 N/A 3.00 3.0050 N/A 3.50 3.5051 N/A 4.25 3.7552 N/A 4.75 3.7553 N/A 7.00 5.0054 N/A 7.00 6.0055 N/A 15.00 15.0056 N/A 17.00 13.0057 N/A 18.00 12.0058 N/A 18.00 12.0059 N/A 18.00 12.0060 4.50 18.00 14.0061 4.50 18.00 14.0062 7.50 34.00 25.0063 7.50 34.00 22.0064 7.50 34.00 20.0065 11.00 35.00 20.0066 15.00 43.00 26.0067 14.00 40.00 26.0068 13.00 40.00 22.0069 13.00 37.00 22.0070 13.00 37.00 24.0071 13.00 37.00 24.0072 13.00 37.00 20.0073 13.00 37.00 20.0074 13.00 37.00 20.0075 100.00 100.00 100.00
Rates apply upon retirement eligibility by tier.
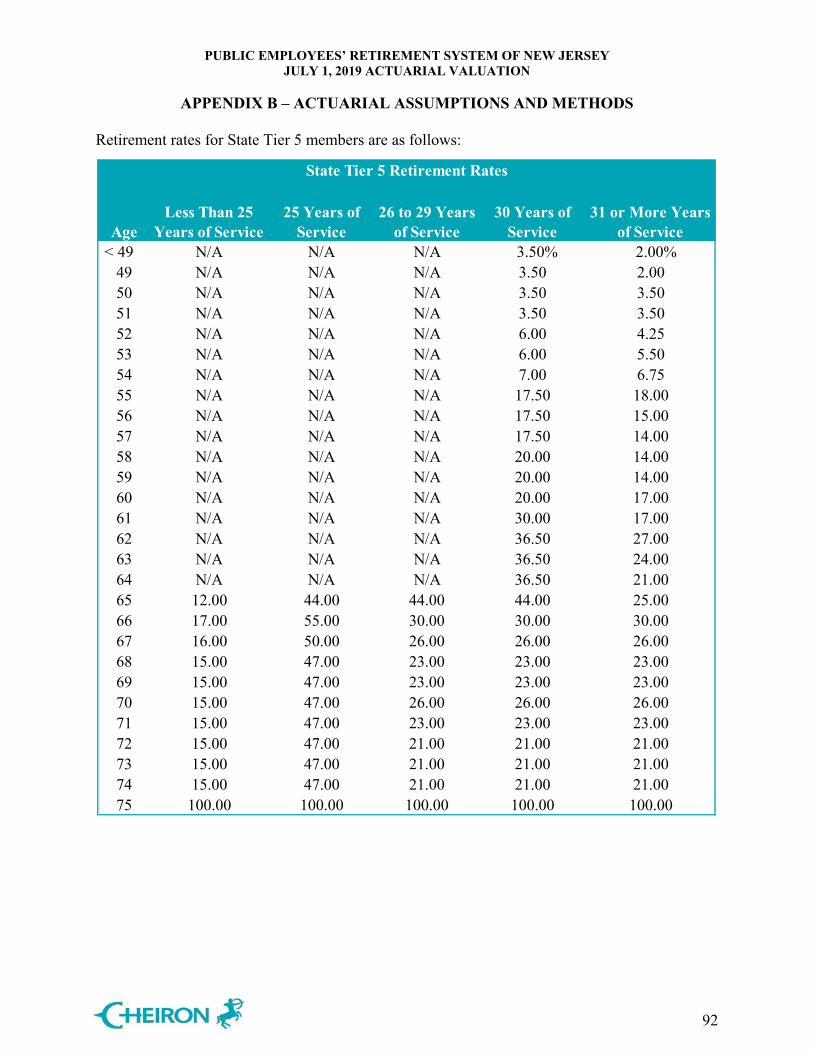
PUBLIC EMPLOYEES’ RETIREMENT SYSTEM OF NEW JERSEY JULY 1, 2019 ACTUARIAL VALUATION
APPENDIX B – ACTUARIAL ASSUMPTIONS AND METHODS
92
Retirement rates for State Tier 5 members are as follows:
State Tier 5 Retirement Rates
AgeLess Than 25
Years of Service25 Years of
Service26 to 29 Years
of Service30 Years of
Service31 or More Years
of Service < 49 N/A N/A N/A 3.50% 2.00%
49 N/A N/A N/A 3.50 2.0050 N/A N/A N/A 3.50 3.5051 N/A N/A N/A 3.50 3.5052 N/A N/A N/A 6.00 4.2553 N/A N/A N/A 6.00 5.5054 N/A N/A N/A 7.00 6.7555 N/A N/A N/A 17.50 18.0056 N/A N/A N/A 17.50 15.0057 N/A N/A N/A 17.50 14.0058 N/A N/A N/A 20.00 14.0059 N/A N/A N/A 20.00 14.0060 N/A N/A N/A 20.00 17.0061 N/A N/A N/A 30.00 17.0062 N/A N/A N/A 36.50 27.0063 N/A N/A N/A 36.50 24.0064 N/A N/A N/A 36.50 21.0065 12.00 44.00 44.00 44.00 25.0066 17.00 55.00 30.00 30.00 30.0067 16.00 50.00 26.00 26.00 26.0068 15.00 47.00 23.00 23.00 23.0069 15.00 47.00 23.00 23.00 23.0070 15.00 47.00 26.00 26.00 26.0071 15.00 47.00 23.00 23.00 23.0072 15.00 47.00 21.00 21.00 21.0073 15.00 47.00 21.00 21.00 21.0074 15.00 47.00 21.00 21.00 21.0075 100.00 100.00 100.00 100.00 100.00
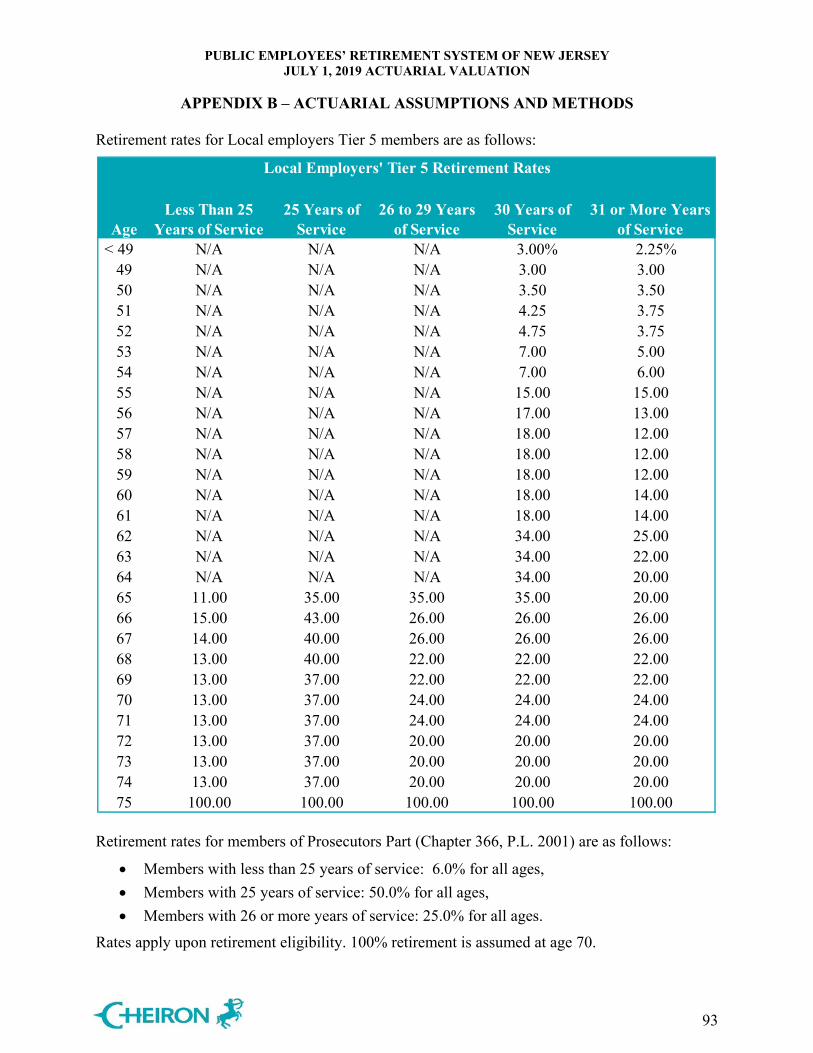
PUBLIC EMPLOYEES’ RETIREMENT SYSTEM OF NEW JERSEY JULY 1, 2019 ACTUARIAL VALUATION
APPENDIX B – ACTUARIAL ASSUMPTIONS AND METHODS
93
Retirement rates for Local employers Tier 5 members are as follows:
Local Employers' Tier 5 Retirement Rates
AgeLess Than 25
Years of Service25 Years of
Service26 to 29 Years
of Service30 Years of
Service31 or More Years
of Service < 49 N/A N/A N/A 3.00% 2.25%
49 N/A N/A N/A 3.00 3.0050 N/A N/A N/A 3.50 3.5051 N/A N/A N/A 4.25 3.7552 N/A N/A N/A 4.75 3.7553 N/A N/A N/A 7.00 5.0054 N/A N/A N/A 7.00 6.0055 N/A N/A N/A 15.00 15.0056 N/A N/A N/A 17.00 13.0057 N/A N/A N/A 18.00 12.0058 N/A N/A N/A 18.00 12.0059 N/A N/A N/A 18.00 12.0060 N/A N/A N/A 18.00 14.0061 N/A N/A N/A 18.00 14.0062 N/A N/A N/A 34.00 25.0063 N/A N/A N/A 34.00 22.0064 N/A N/A N/A 34.00 20.0065 11.00 35.00 35.00 35.00 20.0066 15.00 43.00 26.00 26.00 26.0067 14.00 40.00 26.00 26.00 26.0068 13.00 40.00 22.00 22.00 22.0069 13.00 37.00 22.00 22.00 22.0070 13.00 37.00 24.00 24.00 24.0071 13.00 37.00 24.00 24.00 24.0072 13.00 37.00 20.00 20.00 20.0073 13.00 37.00 20.00 20.00 20.0074 13.00 37.00 20.00 20.00 20.0075 100.00 100.00 100.00 100.00 100.00
Retirement rates for members of Prosecutors Part (Chapter 366, P.L. 2001) are as follows:
• Members with less than 25 years of service: 6.0% for all ages, • Members with 25 years of service: 50.0% for all ages, • Members with 26 or more years of service: 25.0% for all ages.
Rates apply upon retirement eligibility. 100% retirement is assumed at age 70.
PUBLIC EMPLOYEES’ RETIREMENT SYSTEM OF NEW JERSEY JULY 1, 2019 ACTUARIAL VALUATION
APPENDIX B – ACTUARIAL ASSUMPTIONS AND METHODS
94
12. Family Composition Assumptions
For members not currently in receipt, 100% of members are assumed married to spouses of the opposite sex. Males are assumed to be three years older than females.
For purposes of the optional form of payment death benefit for members currently in receipt, beneficiary status is based on the beneficiary allowance reported. If no beneficiary date of birth is provided, the beneficiary is assumed to be the member’s spouse of the opposite sex with males assumed to be three years older than females.
No additional dependent children or parents are assumed.
13. Form of Payment Current active members are assumed to elect the Maximum Option.
14. Non-Contributory Group Insurance Benefit Form of Payment
All benefits are assumed to be paid as lump sums.
15. Data All non-contributing members are included in the valuation with a liability based on the reported Accumulated Deductions with interest (Annuity Savings Fund or ASF), adjusted to include interest through the valuation date. Per discussions with DPB, the statuses for active records in Locations 4 – 7 (General Assembly and Senate) are based on changes in service instead of the contribution code. For current beneficiaries with incomplete information, reasonable assumptions were made based on information available in prior years. Inactive participants receiving benefits according to the 2018 data but omitted from the 2019 data are assumed to have died without a beneficiary. Tier 4 and 5 members on long-term disability appeared on the active data for the first time in 2019. The number of members on long-term disability is immaterial for valuation purposes. Therefore, we valued these members as regular contributing and non-contributing members while we gain clarity on what happens with these members.
PUBLIC EMPLOYEES’ RETIREMENT SYSTEM OF NEW JERSEY JULY 1, 2019 ACTUARIAL VALUATION
APPENDIX B – ACTUARIAL ASSUMPTIONS AND METHODS
95
16. Rationale for Assumptions
The demographic and economic assumptions used in this report, except for the investment return assumption, reflect the results of the July 1, 2014 – June 30, 2018 Experience Study, which was approved by the Board of Trustees on February 19, 2020. The investment return assumption was recommended by the State Treasurer.
17. Changes in Assumptions since Last Valuation
The assumed rates of termination, disability, retirement, mortality, salary increase and inflation were updated based on the July 1, 2014 – June 30, 2018 Experience Study, which was approved by the Board of Trustees on February 19, 2020. For a detailed description of each of the assumptions before and after the changes reflected in this valuation, please refer to the Experience Study. The assumed rate of investment return was decreased from 7.50% to 7.30% per annum, compounded annually. In connection with a new policy adopted by the DPB, interest credits are assumed to end upon termination, instead of continuing through retirement. Also in connection with the new interest credit policy adopted by the DPB, for purposes of valuing the liability for non-contributing active members, the reported ASF is adjusted to include interest through the valuation date. Previously, the ASF as reported was used to value the liability. Such a change is appropriate because many non-contributing actives will receive annuity benefits in the future. Therefore, using the ASF amounts as reported under the new policy may result in future liability losses.
PUBLIC EMPLOYEES’ RETIREMENT SYSTEM OF NEW JERSEY JULY 1, 2019 ACTUARIAL VALUATION
APPENDIX B – ACTUARIAL ASSUMPTIONS AND METHODS
96
B. Projection Assumptions
1. Investment Rate of Return
• July 1, 2020 valuation: 7.30% per annum, compounded annually. • July 1, 2021 and later valuations: 7.00% per annum, compounded
annually.
2. Appropriation Percentages
The State is assumed to appropriate 80% of the Statutory contribution in FYE 2021, and to increase the percent by 10% a year, until reaching 100% of the Statutory contribution beginning with FYE 2023.
3. Administrative Expenses
0.37% of expected pension benefit payments for the year for the State and 0.65% of expected pension benefit payments for the year for Local employers.
4. New Entrants • Contributing active population assumed to remain at 2019 levels. • Assumed to join mid-year. • Age/sex distributions based on the last three years of new hires. • Salary based on salary for most recent hires reported on 2019 data. • New entrant salary assumed to increase with the salary increase rates
applicable for members with 29 or more years of service.
5. Demographic Assumptions
Same as those used for valuation purposes.
PUBLIC EMPLOYEES’ RETIREMENT SYSTEM OF NEW JERSEY JULY 1, 2019 ACTUARIAL VALUATION
APPENDIX B – ACTUARIAL ASSUMPTIONS AND METHODS
97
C. Actuarial Methods The actuarial methods used for determining State and Local employers’ contributions are described below.
1. Actuarial Cost Method The actuarial cost method for funding calculations is the Projected Unit Credit Cost Method. The actuarial liability is calculated as the actuarial present value of the projected benefits linearly allocated to periods prior to the valuation year based on service. Refunds are valued as the reported Accumulated Deductions with interests of the valuation date. The unfunded actuarial liability is the actuarial liability on the valuation date less the actuarial value of assets. In accordance with Chapter 78, P.L. 2011:
• Beginning with the July 1, 2010 actuarial valuation, the accrued liability contribution shall be
computed so that if the contribution is paid annually in level dollars, it will amortize the unfunded accrued liability over an open 30 year period.
• Beginning with the July 1, 2019 actuarial valuation, the accrued liability contribution shall be computed so that if the contribution is paid annually in level dollars, it will amortize the unfunded accrued liability over a closed 30 year period (i.e., for each subsequent actuarial valuation the amortization period shall decrease by one year).
• Beginning with the July 1, 2029 actuarial valuation, when the remaining amortization period reaches 20 years, any increase or decrease in the unfunded accrued liability as a result of actuarial losses or gains for subsequent valuation years shall serve to increase or decrease, respectively, the amortization period for the unfunded accrued liability, unless an increase in the amortization period will cause it to exceed 20 years. If an increase in the amortization period as a result of actuarial losses for a valuation year would exceed 20 years, the accrued liability contribution shall be computed for the valuation year using a 20 year amortization period.
Certain portions of the normal cost and unfunded actuarial liabilities attributable to Local employers are payable by the State and/or over different periods in accordance with the NJ State Statutes. To the extent that the amortization period remains an open period in future years and depending upon the specific circumstances, it should be noted that in the absence of emerging actuarial gains or contributions made in excess of the actuarially determined contribution, any existing unfunded accrued liability may not be fully amortized in the future. The non-contributory group life insurance benefit is funded separately through a term cost.
PUBLIC EMPLOYEES’ RETIREMENT SYSTEM OF NEW JERSEY JULY 1, 2019 ACTUARIAL VALUATION
APPENDIX B – ACTUARIAL ASSUMPTIONS AND METHODS
98
2. Asset Valuation Method
For the purposes of determining contribution rates, an actuarial value of assets is used that dampens the volatility in the market value of assets, resulting in a smoother pattern of contributions. The actuarial value of assets is adjusted to reflect actual contributions, benefit payments and administrative expenses, and an assumed rate of return on the previous year’s assets and current year’s cash flow at the prior year’s actuarial valuation interest rate, with a further adjustment to reflect 20% of the difference between the resulting value and the actual market value of Plan assets.
3. Contributions
Chapter 83, P.L. 2016 requires the State to make pension contributions on a quarterly basis in each fiscal year according to the following schedule: at least 25 percent by September 30, at least 50 percent by December 31, at least 75 percent by March 31, and at least 100 percent by June 30. As such, contributions are assumed to be made on a quarterly basis with the first contribution 15 months after the associated valuation date. Local employers’ contributions are expected to be paid on April 1st, 21 months after the associated valuation date. The Board of Trustees adopted a three-year phase-in of the Local employers’ contribution increase due to the assumption changes from the July 1, 2014 – June 30, 2018 Experience Study, first effective in the July 1, 2019 valuation and the associated FYE 2021 contribution. The impact will be fully phased-in by the FYE 2023 contribution. Chapter 98, P.L. 2017, the Lottery Enterprise Contribution Act, allows PERS to receive 21.02% of the proceeds of the Lottery Enterprise, based upon its members' past or present employment in schools and institutions in the State for a term of 30 years. Revenues from Chapter 98, P.L. 2017, the Lottery Enterprise Contribution Act, are assumed to be contributed to the trust on a monthly basis. The State’s pension contribution is reduced by the product of the allocable percentage for the PERS, the adjustment percentage, and the special asset adjustment. Contributions payable in the fiscal year starting on the valuation date are included in the actuarial value of assets as receivable contributions, discounted by the applicable valuation interest rate. Legislation has provided for additional benefits and/or funding requirements which are included in this valuation and are described as follows.
PUBLIC EMPLOYEES’ RETIREMENT SYSTEM OF NEW JERSEY JULY 1, 2019 ACTUARIAL VALUATION
APPENDIX B – ACTUARIAL ASSUMPTIONS AND METHODS
99
Early Retirement Incentive Programs Local employers which elected to participate in various early retirement incentive programs authorized by NJ Statute make contributions to cover the cost of these programs over amortization periods elected by the employer to the extent permitted by NJ Statute. Chapter 133, P.L. 2001 Chapter 133, P.L. 2001 increased the accrual rate from 1/60 to 1/55. In addition, it lowered the age required for a veteran benefit equal to 1/55 of highest 12-month Compensation for each Year of Service from 60 to 55. Chapter 133, P.L. 2001 also established the Benefit Enhancement Fund (BEF) to fund the additional annual employer normal contribution due to the Statute’s increased benefits. (Chapter 353, P.L. 2001 extended this coverage to this Statute’s additional annual employer normal contribution.) If the assets in the BEF are insufficient to cover the normal contribution for the increased benefits for a valuation period, the State will pay such amount for both the State and Local employers. Chapter 259, P.L. 2001 Chapter 259, P.L. 2001 established the Workers’ Compensation Judges Part of the System with special retirement benefits for Workers’ Compensation Judges. See Appendix C for details. In accordance with the provisions of Chapter 259, P.L. 2001, the additional contributions for these special retirement benefits will be funded by transfers from the Second Injury Fund. Chapter 366, P.L. 2001 Chapter 366, P.L. 2001 established the Prosecutors Part of the System with special retirement benefits for Prosecutors. See Appendix C for details. Chapter 366, P.L. 2001 also requires the State be liable for any increase in pension costs to a County that results from the enrollment of Prosecutors in the Prosecutors Part. Any increase in the unfunded actuarial liability arising from the benefits established for the Prosecutors Part are to be amortized over a closed 30 year period.
PUBLIC EMPLOYEES’ RETIREMENT SYSTEM OF NEW JERSEY JULY 1, 2019 ACTUARIAL VALUATION
APPENDIX B – ACTUARIAL ASSUMPTIONS AND METHODS
100
Chapter 19, P.L. 2009
Chapter 19, P.L. 2009 provided that the State Treasurer will reduce for Local employers the normal and accrued liability contributions to 50 percent of the amount certified for fiscal year 2009. The remaining 50% of the contribution (unfunded liability) will be paid by the Local employers in level annual payments over a period of 15 years with the first payment due in the fiscal year ending June 30, 2012. The unfunded liability will be adjusted by the rate of return on the actuarial value of assets. The legislation also provided that a Local employer may pay 100 percent of the contribution for the fiscal year 2009. Such an employer will be credited with the full payment and any such amounts will not be included in their unfunded liability. In addition, certain Local employers who were eligible to defer 50% of their fiscal year 2009 pension contributions but instead paid 100% of the fiscal year 2009 pension contributions were permitted to defer 50% of their 2010 fiscal year pension contributions. The unfunded liability will be paid by these Local employers over a period of 15 years with the first payment due in the fiscal year ending June 30, 2012. The unfunded liability will be adjusted by the rate of return on the actuarial value of assets.
4. Changes Since Last Valuation The Board of Trustees adopted a three-year phase-in of the Local employers’ contribution increase due to the assumption changes from the July 1, 2014 – June 30, 2018 Experience Study, first effective in the July 1, 2019 valuation and the associated FYE 2021 contribution. The impact will be fully phased-in by the FYE 2023 contribution.

PUBLIC EMPLOYEES’ RETIREMENT SYSTEM OF NEW JERSEY JULY 1, 2019 ACTUARIAL VALUATION
APPENDIX C – SUMMARY OF PLAN PROVISIONS
101
This summary of Plan provisions provides an overview of the major provisions of the PERS used in the actuarial valuation. It is not intended to replace the more precise language of the NJ State Statutes, Title 43, Chapter 15A, and if there is any difference between the description of the plan herein and the actual language in the NJ State Statutes, the NJ State Statutes will govern. This valuation is prepared based on plan provisions in effect as of July 1, 2019 and does not reflect the impact of any changes in the benefits that may have been approved after the valuation date. 1. Eligibility for Membership
Employees of the State or any county, municipality, school district, or public agency employed on a regular basis in a position covered by Social Security and not required to be a member of any other State or local government retirement system. Certain exceptions apply. a) Class B (or Tier 1) Member: Any member hired prior to July 1, 2007. b) Class D (or Tier 2) Member: Any member hired on or after July 1, 2007 and before
November 2, 2008. c) Class E (or Tier 3) Member: Any member hired after November 1, 2008 and before
May 22, 2010. d) Class F (or Tier 4) Member: Any member hired after May 21, 2010 and before
June 28, 2011. e) Class G (or Tier 5) Member: Any member hired on or after June 28, 2011.
2. Plan Year
The 12-month period beginning on July 1 and ending on June 30.
3. Years of Service
A year of service for each year an employee is a Member of the Retirement System plus service, if any, covered by a prior service liability. Tier 4 and Tier 5 Members must be scheduled to work at least 35 hours per week for the State or 32 hours per week for a Local employer. Tier 3, 4 and 5 Members must have an annual salary of $7,500 (indexed for inflation) and other members must have an annual salary of $1,500.
4. Compensation Base salary upon which contributions by a Member to the Annuity Savings Fund were based. Chapter 113, P.L. 1997 provides that Compensation cannot exceed the compensation limitation of Section 401(a)(17) of the Internal Revenue Code. Chapter 103, P.L. 2007 provides that for a Tier 2, 3, 4 or 5 Member, Compensation cannot exceed the annual maximum wage contribution base for Social Security, pursuant to the Federal Insurance Contribution Act.
PUBLIC EMPLOYEES’ RETIREMENT SYSTEM OF NEW JERSEY JULY 1, 2019 ACTUARIAL VALUATION
APPENDIX C – SUMMARY OF PLAN PROVISIONS
102
5. Final Compensation The average annual compensation upon which contributions by a Member are made for the three consecutive years of service immediately preceding retirement, or the highest three fiscal years of service, if greater. Chapter 1, P. L. 2010 provides that for a Tier 4 or Tier 5 Member, Final Compensation is the average annual compensation upon which contributions by a Member are made for the five consecutive years of service immediately preceding retirement, or the highest five fiscal years of service, if greater.
6. Final Year Compensation The compensation upon which contributions by a Member to the Annuity Savings Fund are based in the last year of service.
7. Accumulated Deductions The sum of all amounts deducted from the compensation of a Member or contributed by the Member or on the Member’s behalf without interest.
8. Interest Credits on Accumulated Deductions
Members receive interest credits while contributing and for the first two years of inactivity. The rate depends on the type of benefit. Prior to July 1, 2018, members received interest credits for the entire period of inactivity until retirement or death.
9. Member Contributions
Each Member contributes a percentage of Compensation. Effective October 1, 2011, Chapter 78, P.L. 2011 set the member contribution rate at 6.5% and increased it by 1/7th of 1 % each July thereafter until it attained an ultimate rate of 7.5% on July 1, 2018.
For members who are eligible to retire under the Prosecutors Part as provided by Chapter 366, P.L. 2001, Chapter 78, P.L. 2011 set the member contribution rate at 10.0%, effective October 1, 2011.
10. Benefits
a) Service Retirement: For a Tier 1 or Tier 2 Member, age 60. For a Tier 3 or Tier 4 Member, age 62. For a Tier 5 Member, age 65.
Benefit is an annual retirement allowance comprised of a member annuity plus an employer pension which together will provide a total retirement allowance of: (1) For a Tier 1, 2 or 3 Member, 1/55 of Final Compensation for each Year of Service. (2) For a Tier 4 or 5 Member, 1/60 of Final Compensation for each Year of Service.
PUBLIC EMPLOYEES’ RETIREMENT SYSTEM OF NEW JERSEY JULY 1, 2019 ACTUARIAL VALUATION
APPENDIX C – SUMMARY OF PLAN PROVISIONS
103
b) Early Retirement: Prior to eligibility for Service Retirement. For a Tier 1, 2, 3 or 4 Member, 25 Years of Service. For a Tier 5 Member, 30 Years of Service. Benefit is an annual retirement allowance comprised of a member annuity plus an employer pension which together will provide a total retirement allowance of:
(1) For a Tier 1 Member, the Service Retirement benefit reduced by 1/4 of one percent
for each month the retirement date precedes age 55. (2) For a Tier 2 Member, the Service Retirement benefit reduced by 1/12 of one
percent for each month the retirement date precedes age 60 through age 55 and by 1/4 of one percent for each month the retirement date precedes age 55.
(3) For a Tier 3 or 4 Member, the Service Retirement benefit reduced by 1/12 of one percent for each month the retirement date precedes age 62 through age 55 and by 1/4 of one percent for each month the retirement date precedes age 55.
(4) For a Tier 5 Member, the Service Retirement benefit reduced by 1/4 of one percent for each month the retirement date precedes age 65.
c) Veteran Retirement: Age 55 with 25 Years of Service or Age 60 with 20 Years of
Service for a qualified military veteran who retires directly from active service. Benefit is an annual retirement allowance comprised of a member annuity plus an employer pension which together will provide a total retirement allowance of the greater of:
(1) 54.5% of highest 12-month Compensation, or (2) For a member who is at least age 55 with 35 Years of Service, 1/55 of highest 12-
month Compensation for each Year of Service. Veterans may receive a Service Retirement benefit if greater.
d) Deferred Retirement: Termination of service prior to eligibility for Service Retirement with 10 Years of Service. Benefit is either:
(1) A refund of Accumulated Deductions plus, if the member has completed three
years of service, interest accumulated at 2.0% per annum; or (2) A deferred life annuity, commencing at age 60 for a Tier 1 or Tier 2 Member, age
62 for a Tier 3 or Tier 4 Member or age 65 for a Tier 5 Member, comprised of a member annuity plus an employer pension which together will provide a total retirement allowance of the Service Retirement benefit based on Final Compensation and Years of Service at date of termination.
For Members who die during the deferral period, the benefit is a return of Accumulated Deductions with credited interest.
PUBLIC EMPLOYEES’ RETIREMENT SYSTEM OF NEW JERSEY JULY 1, 2019 ACTUARIAL VALUATION
APPENDIX C – SUMMARY OF PLAN PROVISIONS
104
e) Non-Vested Termination: Termination of service prior to eligibility for Service Retirement and less than 10 Years of Service.
Benefit is a refund of Accumulated Deductions plus, if the member has completed three years of service, interest accumulated at 2.0% per annum.
f) Death Benefits
(1) Ordinary Death Before Retirement: Death of an active contributing Member.
Benefit is equal to:
a. Lump sum payment equal to 150% of Final Year Compensation, also known as the non-contributory group life insurance benefit, plus
b. Accumulated Deductions with credited interest.
(2) Accidental Death Before Retirement: Death of an active Member resulting from injuries received from an accident during performance of duty and not a result of willful negligence. Benefit is equal to:
a. Lump sum payment equal to 150% of Final Year Compensation, also
known as the non-contributory group life insurance benefit, plus b. Spouse life annuity of 50% of Final Year Compensation payable until
spouse’s death or remarriage. If there is no surviving spouse or upon death or remarriage, a total of 20% (35%, 50%) of Final Year Compensation payable to one (two, three or more) dependent child(ren). If there is no surviving spouse or dependent child(ren), 25% (40%) of Final Year Compensation to one (two) dependent parent(s). If there is no surviving spouse, dependent child(ren) or parent(s), the benefit is a refund of Accumulated Deductions with credited interest.
(3) Death After Retirement: Death of a retired Member. Benefit is equal to:
a. Lump sum payment equal to 3/16 of Final Year Compensation for a
Member retired under Service, Early, Veteran or Deferred Retirement with 10 Years of Service. For a Member receiving a Disability benefit, lump sum payment of 150% of Final Year Compensation if death occurs prior to age 60 and 3/16 of Final Compensation if death occurs after age 60. This benefit is also known as the non-contributory group life insurance benefit, plus
b. Any survivor benefit due under the Member’s optional form of payment election. Previously granted COLAs also apply to life annuities.
Members are also eligible for a voluntary, employee-paid life insurance policy, known as the contributory group life insurance policy. This benefit is not paid through the System and is not considered for valuation purposes.
PUBLIC EMPLOYEES’ RETIREMENT SYSTEM OF NEW JERSEY JULY 1, 2019 ACTUARIAL VALUATION
APPENDIX C – SUMMARY OF PLAN PROVISIONS
105
g) Disability Retirement (1) Ordinary Disability Retirement: 10 years of service and totally and permanently
incapacitated from the performance of normal or assigned duties. Only available to Tier 1, 2 and 3 Members. Benefit is an annual retirement allowance comprised of a member annuity plus an employer pension which together will provide a total retirement allowance of:
a. 1.64% of Final Compensation for each Year of Service; or b. 43.6% of Final Compensation.
(2) Accidental Disability Retirement: Total and permanent incapacitation as a direct
result of a traumatic event occurring during and as a result of the performance of regular or assigned duties. Only available to Tier 1, 2 and 3 Members.
Benefit is an annual retirement allowance comprised of a member annuity plus an employer pension which together will provide a total retirement allowance of 72.7% of Compensation at the date of injury.
The pension portion of the benefit will be offset for any periodic Workers’ Compensation benefits.
Tier 4 and Tier 5 Members are eligible for long-term disability coverage. This benefit is not paid through the System and is not considered for valuation purposes. Both Member and employer contributions to the System continue while on long-term disability, with the policy covering the Member portion. The long-term disability benefit equals 60% of Final Year Compensation and may be offset for other periodic benefits, such as Workers’ Compensation, short-term disability or Social Security. The long-term disability benefit may continue through the earlier of age 70 or commencement of a retirement benefit under the System.
11. Benefits for Special Employee Groups
Certain members qualify for enrollment into special employee groups. Such members receive the greater of the special benefits described below or the regular PERS benefit described above. For benefit types not explicitly mentioned, the regular PERS benefit applies.
a) Law Enforcement Officers (LEOs):
Members employed in eligible job titles as well as individuals who do not meet the age or medical requirements for entry into the Police and Firemen’s Retirement System (PFRS).
PUBLIC EMPLOYEES’ RETIREMENT SYSTEM OF NEW JERSEY JULY 1, 2019 ACTUARIAL VALUATION
APPENDIX C – SUMMARY OF PLAN PROVISIONS
106
(1) Service and Special Retirement Mandatory retirement at age 65. Veterans with less than 20 Years of Service at age 65 must retire upon attainment of 20 Years of Service or age 70, whichever is earlier. Voluntary retirement prior to those ages.
a. Service Retirement: Age 55 after 20 Years of LEO Service.
Benefit is an annual retirement allowance comprised of a member annuity plus an employer pension which together will provide a total retirement allowance of 2% of Final Compensation for each Year of LEO Service up to 25 years plus 1% of Final Compensation for each Year of LEO Service over 25 years.
The Member is also eligible for a regular PERS benefit based on any non-LEO service.
b. Special Retirement: 25 Years of LEO Service.
Benefit is the Service Retirement benefit plus 5% of Final Compensation with a maximum of 70% of Final Compensation.
(2) Ordinary Disability Retirement: 5 Years of LEO Service.
Benefit is the regular PERS Ordinary Disability benefit.
(3) Death Benefits: Benefit is the regular PERS Death benefit except, upon Accidental Disability Retirement, the minimum lump sum payment is $5,000.
b) Legislative Retirement System (LRS):
Members of the State Legislature. Chapter 92, P.L. 2007 closed LRS to new members enrolled on or after July 1, 2007.
(1) Special Legislative Retirement: Age 60.
Benefit is an annual retirement allowance comprised of a member annuity plus an employer pension which together will provide a total retirement allowance of 3% of Final Compensation for each Year of Legislative Service with a maximum of two-thirds of Final Compensation.
The Member is also eligible for a regular PERS benefit based on any non-legislative service.
PUBLIC EMPLOYEES’ RETIREMENT SYSTEM OF NEW JERSEY JULY 1, 2019 ACTUARIAL VALUATION
APPENDIX C – SUMMARY OF PLAN PROVISIONS
107
(2) Deferred Retirement: Termination of service prior to eligibility for Service or Special Legislative Retirement with 8 Years of Legislative Service. Benefit is either:
a. A refund of Accumulated Deductions plus, if the Member has completed
three years of service, interest accumulated at 2.0% per annum; or b. A deferred life annuity, commencing at age 60, comprised of a member
annuity plus an employer pension which together will provide a total retirement allowance of the Service or Special Legislative Retirement benefit based on Final Compensation and Years of Service at date of termination.
c) Prosecutors Part (Chapter 366, P.L. 2001): Covers prosecutors as well as members employed in certain other related job titles. Chapter 1. P.L. 2010 closed the Prosecutors Part to new members enrolled on or after May 22, 2010. (1) Service and Special Retirement
Mandatory retirement at age 70. Voluntary retirement prior to that age. In addition to the benefits described below, the member is eligible for a regular PERS benefit based on any non-Prosecutors Part service.
a. Service Retirement: For a Prosecutors Part Member enrolled as of January 7, 2002, age 55 or 20 Years of Prosecutors Part Service. For a Prosecutors Part Member enrolled after January 7, 2002, age 55.
Benefit is an annual retirement allowance comprised of a member annuity plus an employer pension which together will provide a total retirement allowance of the greater of:
i. 2% of Final Year Compensation for each Year of Prosecutors Part Service up to 30 years plus 1% of Final Year Compensation for each Year of Prosecutors Part Service over 30 years.
ii. 50% of Final Year Compensation for Prosecutors Part Members with 20 or more Years of Prosecutors Part Service.
iii. 1/60 of Final Year Compensation for each Year of Prosecutors Part Service.
PUBLIC EMPLOYEES’ RETIREMENT SYSTEM OF NEW JERSEY JULY 1, 2019 ACTUARIAL VALUATION
APPENDIX C – SUMMARY OF PLAN PROVISIONS
108
b. Special Retirement: 25 Years of Prosecutors Part Service.
Benefit is an annual retirement allowance comprised of a member annuity plus an employer pension which together will provide a total retirement allowance of 65% of Final Year Compensation plus 1% of Final Year Compensation for each Year of Prosecutors Part Service in excess of 25 years with a maximum of 70% of Final Compensation.
(2) Deferred Retirement: Termination of service prior to eligibility for Service or
Special Retirement with 10 Years of Prosecutors Part Service. Benefit is either:
a. A refund of Accumulated Deductions plus, if the Member has completed
three years of service, interest accumulated at 2.0% per annum; or b. A deferred life annuity, commencing at age 55, comprised of a member
annuity plus an employer pension which together will provide a total retirement allowance of 2% of Final Year Compensation for each Year of Prosecutors Part Service.
(3) Death Benefits:
Benefit is the regular PERS Death benefit except, upon Service, Special or Deferred Prosecutors Part Retirement with 10 Years of Prosecutors Part Service, the lump sum payment equals 50% of Final Year Compensation.
d) Workers Compensation Judges Part (WCJ) (Chapter 259, P.L. 2001):
Member employed in an eligible job title by the Division of Workers’ Compensation. Chapter 92, P.L. 2007 closed the Workers Compensation Judges Part to new members enrolled on or after July 1, 2007. (1) Service Retirement:
Mandatory retirement age 70. Voluntary retirement prior to that age.
a. Age 70 and 10 Years of WCJ Service; or Age 65 and 15 Years of WCJ Service; or Age 60 and 20 Years of WCJ Service. Benefit is an annual retirement allowance comprised of a member
annuity plus an employer pension which together will provide a total retirement allowance of 75% of contractual Compensation at the date of retirement.
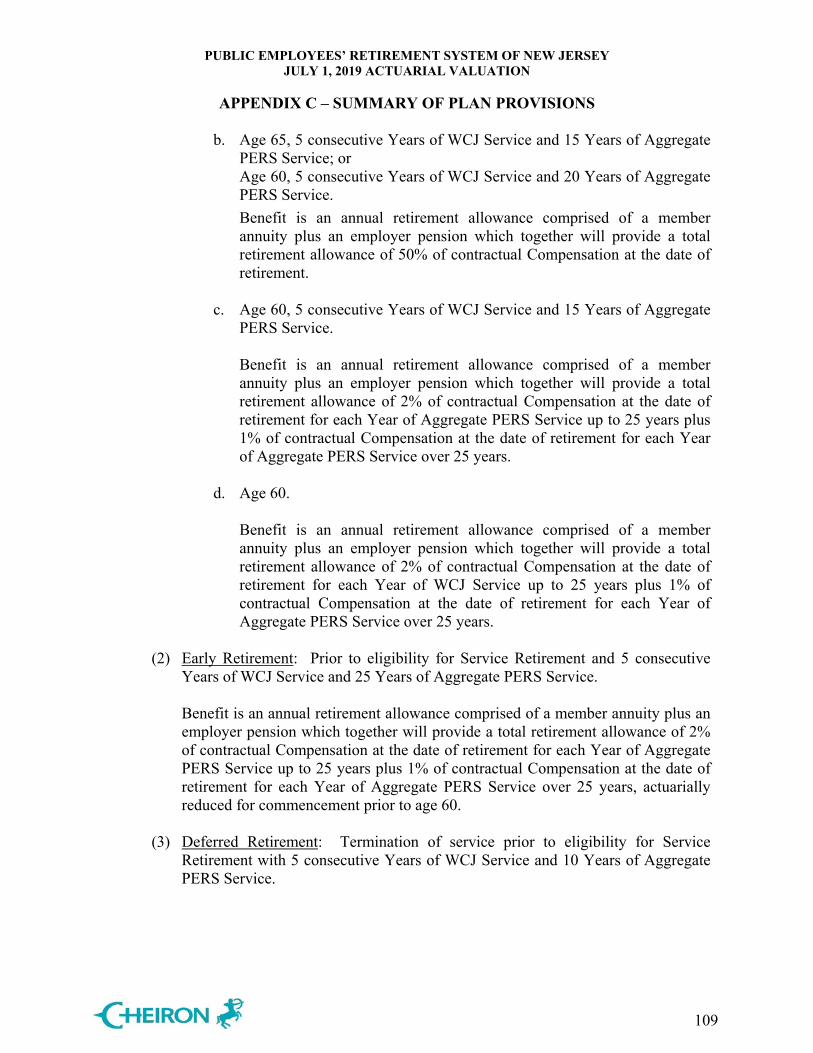
PUBLIC EMPLOYEES’ RETIREMENT SYSTEM OF NEW JERSEY JULY 1, 2019 ACTUARIAL VALUATION
APPENDIX C – SUMMARY OF PLAN PROVISIONS
109
b. Age 65, 5 consecutive Years of WCJ Service and 15 Years of Aggregate PERS Service; or
Age 60, 5 consecutive Years of WCJ Service and 20 Years of Aggregate PERS Service.
Benefit is an annual retirement allowance comprised of a member annuity plus an employer pension which together will provide a total retirement allowance of 50% of contractual Compensation at the date of retirement.
c. Age 60, 5 consecutive Years of WCJ Service and 15 Years of Aggregate
PERS Service. Benefit is an annual retirement allowance comprised of a member
annuity plus an employer pension which together will provide a total retirement allowance of 2% of contractual Compensation at the date of retirement for each Year of Aggregate PERS Service up to 25 years plus 1% of contractual Compensation at the date of retirement for each Year of Aggregate PERS Service over 25 years.
d. Age 60. Benefit is an annual retirement allowance comprised of a member
annuity plus an employer pension which together will provide a total retirement allowance of 2% of contractual Compensation at the date of retirement for each Year of WCJ Service up to 25 years plus 1% of contractual Compensation at the date of retirement for each Year of Aggregate PERS Service over 25 years.
(2) Early Retirement: Prior to eligibility for Service Retirement and 5 consecutive
Years of WCJ Service and 25 Years of Aggregate PERS Service. Benefit is an annual retirement allowance comprised of a member annuity plus an employer pension which together will provide a total retirement allowance of 2% of contractual Compensation at the date of retirement for each Year of Aggregate PERS Service up to 25 years plus 1% of contractual Compensation at the date of retirement for each Year of Aggregate PERS Service over 25 years, actuarially reduced for commencement prior to age 60.
(3) Deferred Retirement: Termination of service prior to eligibility for Service Retirement with 5 consecutive Years of WCJ Service and 10 Years of Aggregate PERS Service.
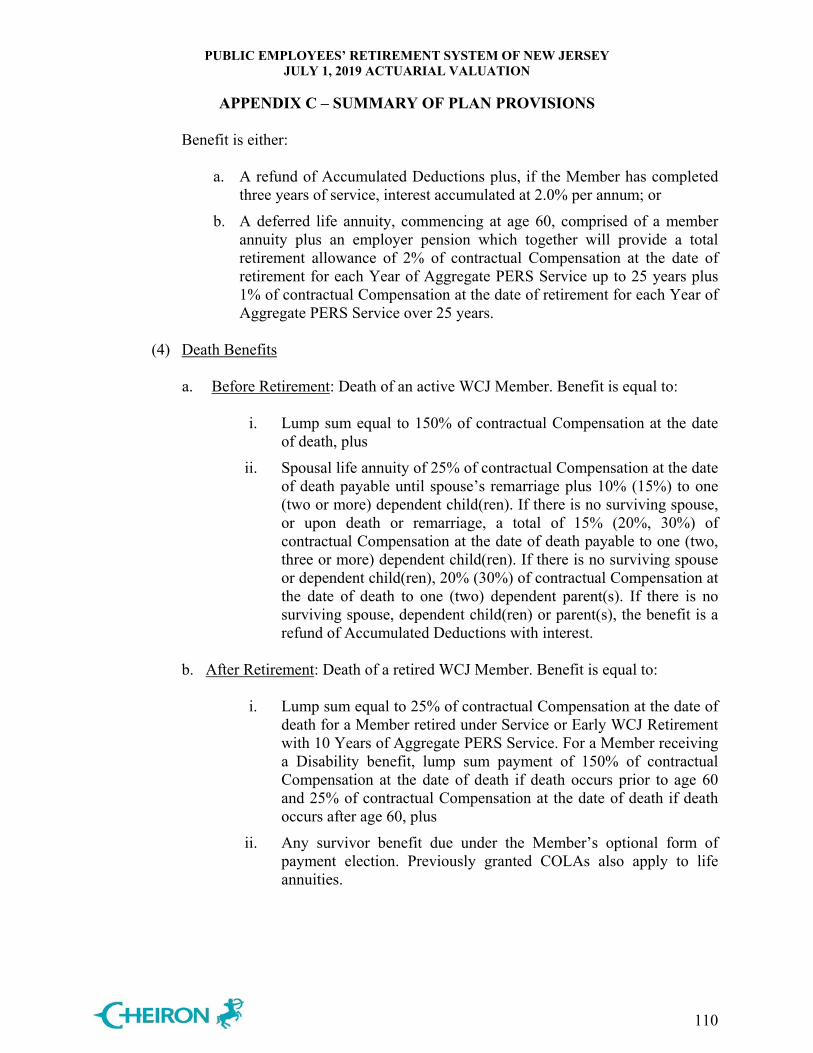
PUBLIC EMPLOYEES’ RETIREMENT SYSTEM OF NEW JERSEY JULY 1, 2019 ACTUARIAL VALUATION
APPENDIX C – SUMMARY OF PLAN PROVISIONS
110
Benefit is either:
a. A refund of Accumulated Deductions plus, if the Member has completed three years of service, interest accumulated at 2.0% per annum; or
b. A deferred life annuity, commencing at age 60, comprised of a member annuity plus an employer pension which together will provide a total retirement allowance of 2% of contractual Compensation at the date of retirement for each Year of Aggregate PERS Service up to 25 years plus 1% of contractual Compensation at the date of retirement for each Year of Aggregate PERS Service over 25 years.
(4) Death Benefits
a. Before Retirement: Death of an active WCJ Member. Benefit is equal to:
i. Lump sum equal to 150% of contractual Compensation at the date
of death, plus ii. Spousal life annuity of 25% of contractual Compensation at the date
of death payable until spouse’s remarriage plus 10% (15%) to one (two or more) dependent child(ren). If there is no surviving spouse, or upon death or remarriage, a total of 15% (20%, 30%) of contractual Compensation at the date of death payable to one (two, three or more) dependent child(ren). If there is no surviving spouse or dependent child(ren), 20% (30%) of contractual Compensation at the date of death to one (two) dependent parent(s). If there is no surviving spouse, dependent child(ren) or parent(s), the benefit is a refund of Accumulated Deductions with interest.
b. After Retirement: Death of a retired WCJ Member. Benefit is equal to:
i. Lump sum equal to 25% of contractual Compensation at the date of
death for a Member retired under Service or Early WCJ Retirement with 10 Years of Aggregate PERS Service. For a Member receiving a Disability benefit, lump sum payment of 150% of contractual Compensation at the date of death if death occurs prior to age 60 and 25% of contractual Compensation at the date of death if death occurs after age 60, plus
ii. Any survivor benefit due under the Member’s optional form of payment election. Previously granted COLAs also apply to life annuities.
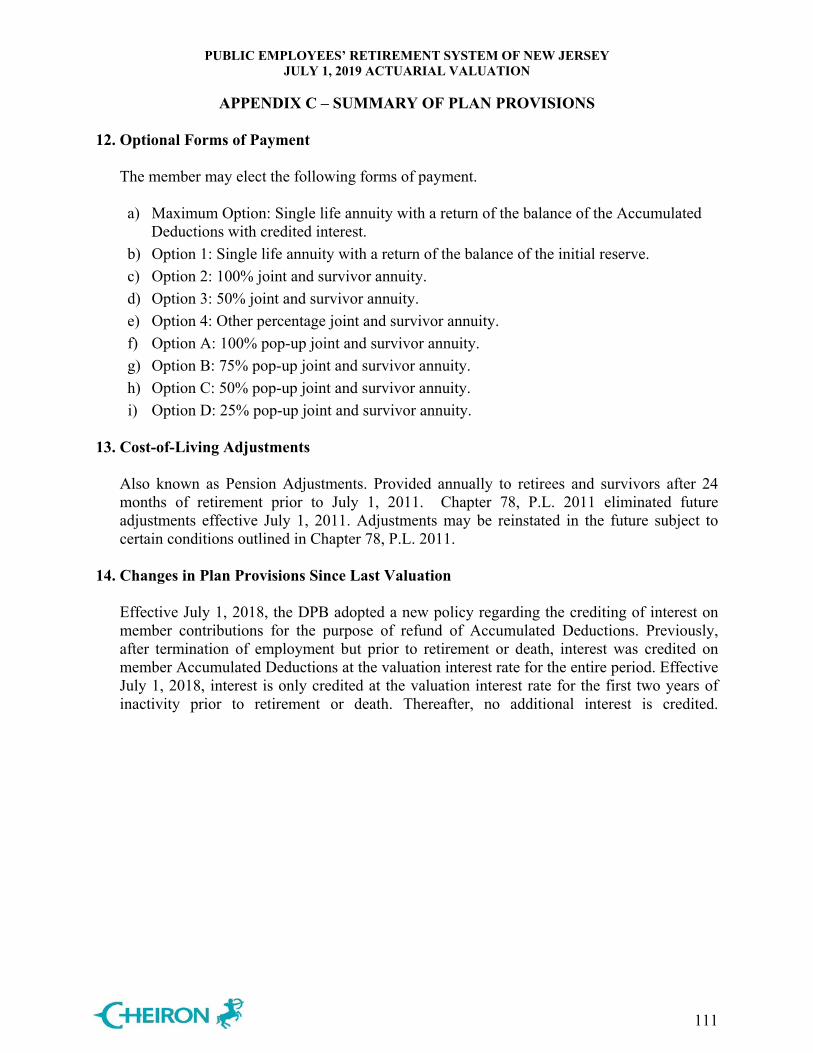
PUBLIC EMPLOYEES’ RETIREMENT SYSTEM OF NEW JERSEY JULY 1, 2019 ACTUARIAL VALUATION
APPENDIX C – SUMMARY OF PLAN PROVISIONS
111
12. Optional Forms of Payment
The member may elect the following forms of payment.
a) Maximum Option: Single life annuity with a return of the balance of the Accumulated Deductions with credited interest.
b) Option 1: Single life annuity with a return of the balance of the initial reserve. c) Option 2: 100% joint and survivor annuity. d) Option 3: 50% joint and survivor annuity. e) Option 4: Other percentage joint and survivor annuity. f) Option A: 100% pop-up joint and survivor annuity. g) Option B: 75% pop-up joint and survivor annuity. h) Option C: 50% pop-up joint and survivor annuity. i) Option D: 25% pop-up joint and survivor annuity.
13. Cost-of-Living Adjustments
Also known as Pension Adjustments. Provided annually to retirees and survivors after 24 months of retirement prior to July 1, 2011. Chapter 78, P.L. 2011 eliminated future adjustments effective July 1, 2011. Adjustments may be reinstated in the future subject to certain conditions outlined in Chapter 78, P.L. 2011.
14. Changes in Plan Provisions Since Last Valuation Effective July 1, 2018, the DPB adopted a new policy regarding the crediting of interest on member contributions for the purpose of refund of Accumulated Deductions. Previously, after termination of employment but prior to retirement or death, interest was credited on member Accumulated Deductions at the valuation interest rate for the entire period. Effective July 1, 2018, interest is only credited at the valuation interest rate for the first two years of inactivity prior to retirement or death. Thereafter, no additional interest is credited.

PUBLIC EMPLOYEES’ RETIREMENT SYSTEM OF NEW JERSEY JULY 1, 2019 ACTUARIAL VALUATION
APPENDIX D – HISTORICAL DATA AND REQUIRED CAFR EXHIBITS
112
The information on the following tables for State and Local employers is based on the final actuarial valuation reports for the given years. The amounts do not reflect differences between the discounted State appropriations receivable and the actual State contribution amounts that became known after the issuance of the reports.
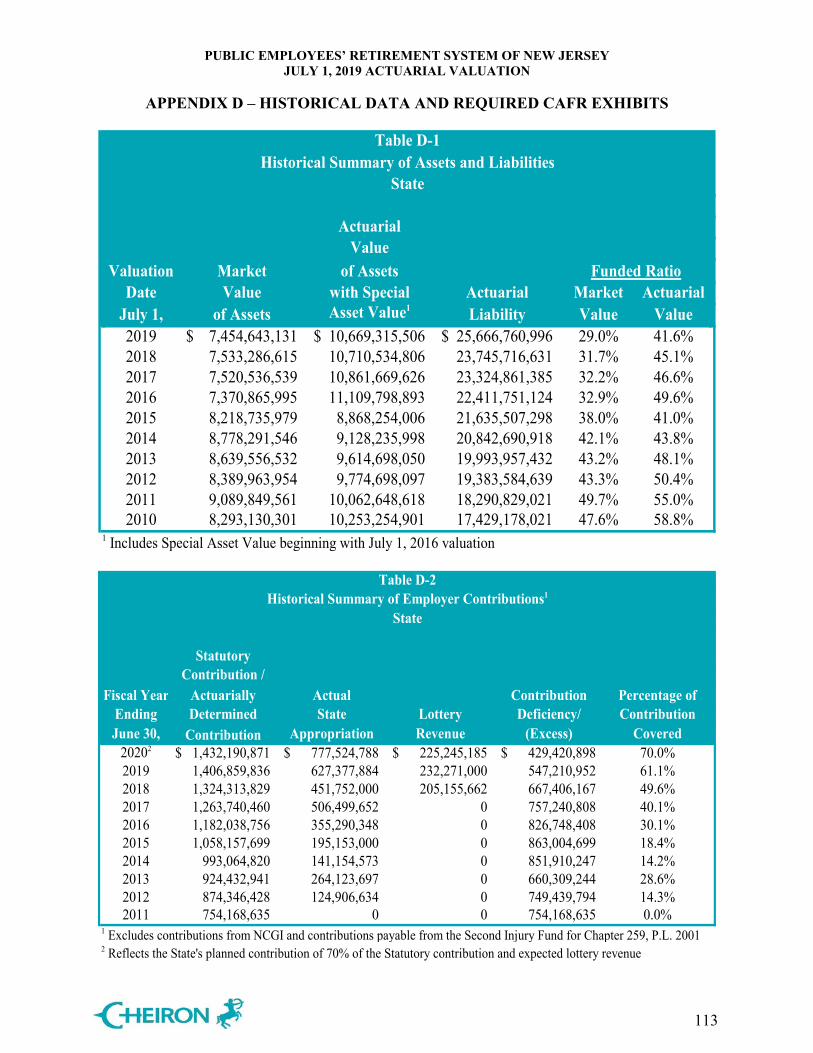
PUBLIC EMPLOYEES’ RETIREMENT SYSTEM OF NEW JERSEY JULY 1, 2019 ACTUARIAL VALUATION
APPENDIX D – HISTORICAL DATA AND REQUIRED CAFR EXHIBITS
113
Table D-1Historical Summary of Assets and Liabilities
State
ActuarialValue
Valuation Market of Assets Funded RatioDate Value with Special Actuarial Market Actuarial
July 1, of Assets Asset Value1 Liability Value Value2019 7,454,643,131$ 10,669,315,506$ 25,666,760,996$ 29.0% 41.6%2018 7,533,286,615 10,710,534,806 23,745,716,631 31.7% 45.1%2017 7,520,536,539 10,861,669,626 23,324,861,385 32.2% 46.6%2016 7,370,865,995 11,109,798,893 22,411,751,124 32.9% 49.6%2015 8,218,735,979 8,868,254,006 21,635,507,298 38.0% 41.0%2014 8,778,291,546 9,128,235,998 20,842,690,918 42.1% 43.8%2013 8,639,556,532 9,614,698,050 19,993,957,432 43.2% 48.1%2012 8,389,963,954 9,774,698,097 19,383,584,639 43.3% 50.4%2011 9,089,849,561 10,062,648,618 18,290,829,021 49.7% 55.0%2010 8,293,130,301 10,253,254,901 17,429,178,021 47.6% 58.8%
1 Includes Special Asset Value beginning with July 1, 2016 valuation
Statutory Contribution /
Fiscal Year Actuarially Actual Contribution Percentage ofEnding Determined State Lottery Deficiency/ ContributionJune 30, Contribution Appropriation Revenue (Excess) Covered
20202 1,432,190,871$ 777,524,788$ 225,245,185$ 429,420,898$ 70.0%2019 1,406,859,836 627,377,884 232,271,000 547,210,952 61.1%2018 1,324,313,829 451,752,000 205,155,662 667,406,167 49.6%2017 1,263,740,460 506,499,652 0 757,240,808 40.1%2016 1,182,038,756 355,290,348 0 826,748,408 30.1%2015 1,058,157,699 195,153,000 0 863,004,699 18.4%2014 993,064,820 141,154,573 0 851,910,247 14.2%2013 924,432,941 264,123,697 0 660,309,244 28.6%2012 874,346,428 124,906,634 0 749,439,794 14.3%2011 754,168,635 0 0 754,168,635 0.0%
1 Excludes contributions from NCGI and contributions payable from the Second Injury Fund for Chapter 259, P.L. 20012 Reflects the State's planned contribution of 70% of the Statutory contribution and expected lottery revenue
State
Table D-2Historical Summary of Employer Contributions1
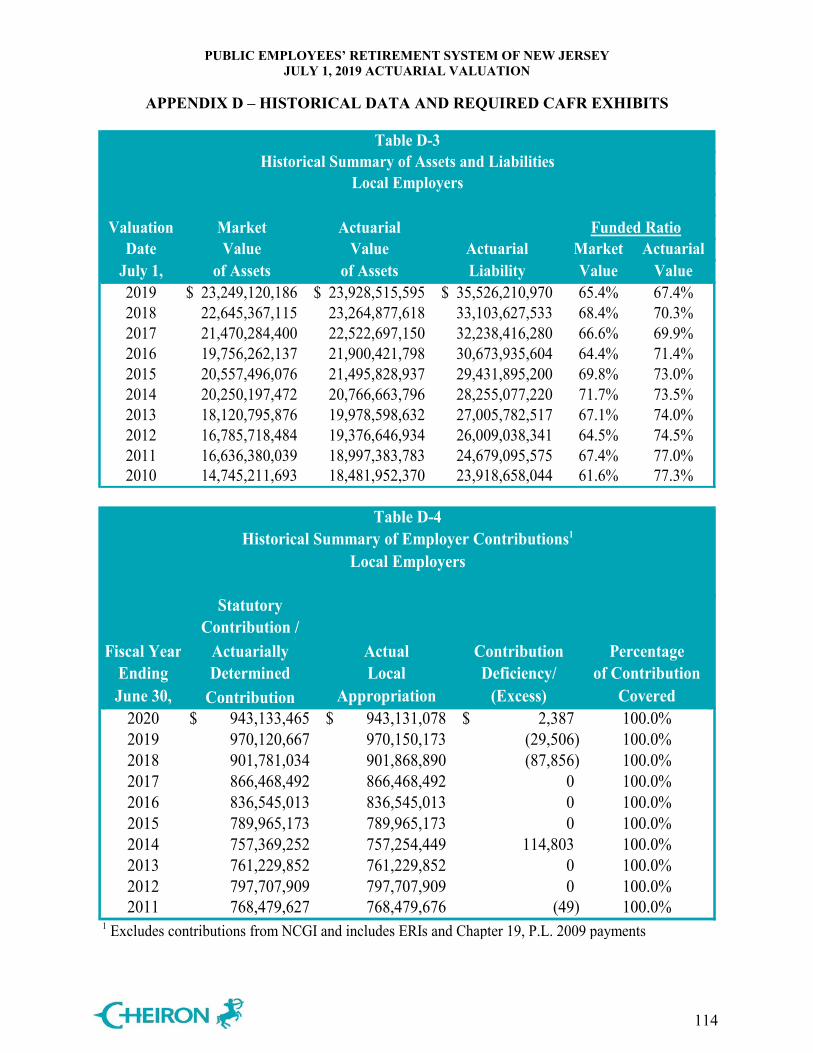
PUBLIC EMPLOYEES’ RETIREMENT SYSTEM OF NEW JERSEY JULY 1, 2019 ACTUARIAL VALUATION
APPENDIX D – HISTORICAL DATA AND REQUIRED CAFR EXHIBITS
114
Table D-3Historical Summary of Assets and Liabilities
Local Employers
Valuation Market Actuarial Funded RatioDate Value Value Actuarial Market Actuarial
July 1, of Assets of Assets Liability Value Value2019 23,249,120,186$ 23,928,515,595$ 35,526,210,970$ 65.4% 67.4%2018 22,645,367,115 23,264,877,618 33,103,627,533 68.4% 70.3%2017 21,470,284,400 22,522,697,150 32,238,416,280 66.6% 69.9%2016 19,756,262,137 21,900,421,798 30,673,935,604 64.4% 71.4%2015 20,557,496,076 21,495,828,937 29,431,895,200 69.8% 73.0%2014 20,250,197,472 20,766,663,796 28,255,077,220 71.7% 73.5%2013 18,120,795,876 19,978,598,632 27,005,782,517 67.1% 74.0%2012 16,785,718,484 19,376,646,934 26,009,038,341 64.5% 74.5%2011 16,636,380,039 18,997,383,783 24,679,095,575 67.4% 77.0%2010 14,745,211,693 18,481,952,370 23,918,658,044 61.6% 77.3%
StatutoryContribution /
Fiscal Year Actuarially Actual Contribution PercentageEnding Determined Local Deficiency/ of ContributionJune 30, Contribution Appropriation (Excess) Covered
2020 943,133,465$ 943,131,078$ 2,387$ 100.0%2019 970,120,667 970,150,173 (29,506) 100.0%2018 901,781,034 901,868,890 (87,856) 100.0%2017 866,468,492 866,468,492 0 100.0%2016 836,545,013 836,545,013 0 100.0%2015 789,965,173 789,965,173 0 100.0%2014 757,369,252 757,254,449 114,803 100.0%2013 761,229,852 761,229,852 0 100.0%2012 797,707,909 797,707,909 0 100.0%2011 768,479,627 768,479,676 (49) 100.0%
1 Excludes contributions from NCGI and includes ERIs and Chapter 19, P.L. 2009 payments
Local Employers
Table D-4Historical Summary of Employer Contributions1
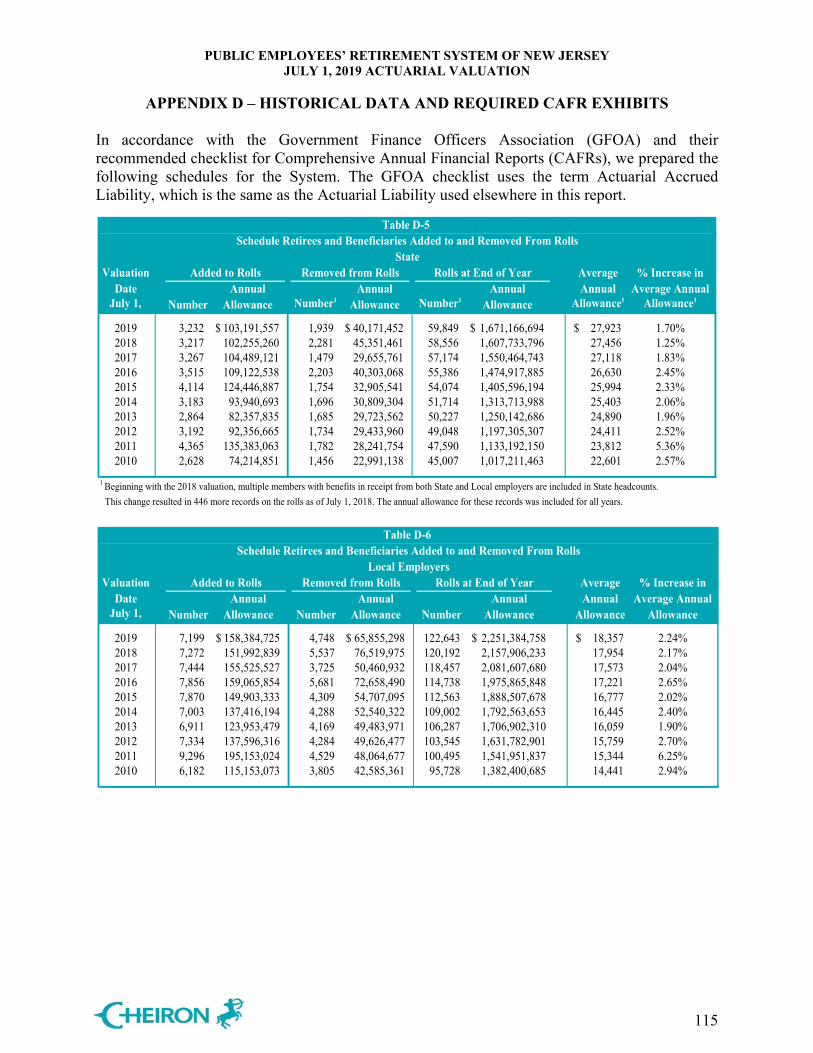
PUBLIC EMPLOYEES’ RETIREMENT SYSTEM OF NEW JERSEY JULY 1, 2019 ACTUARIAL VALUATION
APPENDIX D – HISTORICAL DATA AND REQUIRED CAFR EXHIBITS
115
In accordance with the Government Finance Officers Association (GFOA) and their recommended checklist for Comprehensive Annual Financial Reports (CAFRs), we prepared the following schedules for the System. The GFOA checklist uses the term Actuarial Accrued Liability, which is the same as the Actuarial Liability used elsewhere in this report.
Table D-5
Valuation Average % Increase inDate Annual Annual Annual Annual Average Annual
July 1, Number Allowance Number1 Allowance Number1 Allowance Allowance1 Allowance1
2019 3,232 103,191,557$ 1,939 40,171,452$ 59,849 1,671,166,694$ 27,923$ 1.70%2018 3,217 102,255,260 2,281 45,351,461 58,556 1,607,733,796 27,456 1.25%2017 3,267 104,489,121 1,479 29,655,761 57,174 1,550,464,743 27,118 1.83%2016 3,515 109,122,538 2,203 40,303,068 55,386 1,474,917,885 26,630 2.45%2015 4,114 124,446,887 1,754 32,905,541 54,074 1,405,596,194 25,994 2.33%2014 3,183 93,940,693 1,696 30,809,304 51,714 1,313,713,988 25,403 2.06%2013 2,864 82,357,835 1,685 29,723,562 50,227 1,250,142,686 24,890 1.96%2012 3,192 92,356,665 1,734 29,433,960 49,048 1,197,305,307 24,411 2.52%2011 4,365 135,383,063 1,782 28,241,754 47,590 1,133,192,150 23,812 5.36%2010 2,628 74,214,851 1,456 22,991,138 45,007 1,017,211,463 22,601 2.57%
1 Beginning with the 2018 valuation, multiple members with benefits in receipt from both State and Local employers are included in State headcounts. This change resulted in 446 more records on the rolls as of July 1, 2018. The annual allowance for these records was included for all years.
Schedule Retirees and Beneficiaries Added to and Removed From RollsState
Added to Rolls Removed from Rolls Rolls at End of Year
Table D-6
Valuation Average % Increase inDate Annual Annual Annual Annual Average Annual
July 1, Number Allowance Number Allowance Number Allowance Allowance Allowance
2019 7,199 158,384,725$ 4,748 65,855,298$ 122,643 2,251,384,758$ 18,357$ 2.24%2018 7,272 151,992,839 5,537 76,519,975 120,192 2,157,906,233 17,954 2.17%2017 7,444 155,525,527 3,725 50,460,932 118,457 2,081,607,680 17,573 2.04%2016 7,856 159,065,854 5,681 72,658,490 114,738 1,975,865,848 17,221 2.65%2015 7,870 149,903,333 4,309 54,707,095 112,563 1,888,507,678 16,777 2.02%2014 7,003 137,416,194 4,288 52,540,322 109,002 1,792,563,653 16,445 2.40%2013 6,911 123,953,479 4,169 49,483,971 106,287 1,706,902,310 16,059 1.90%2012 7,334 137,596,316 4,284 49,626,477 103,545 1,631,782,901 15,759 2.70%2011 9,296 195,153,024 4,529 48,064,677 100,495 1,541,951,837 15,344 6.25%2010 6,182 115,153,073 3,805 42,585,361 95,728 1,382,400,685 14,441 2.94%
Schedule Retirees and Beneficiaries Added to and Removed From RollsLocal Employers
Added to Rolls Removed from Rolls Rolls at End of Year
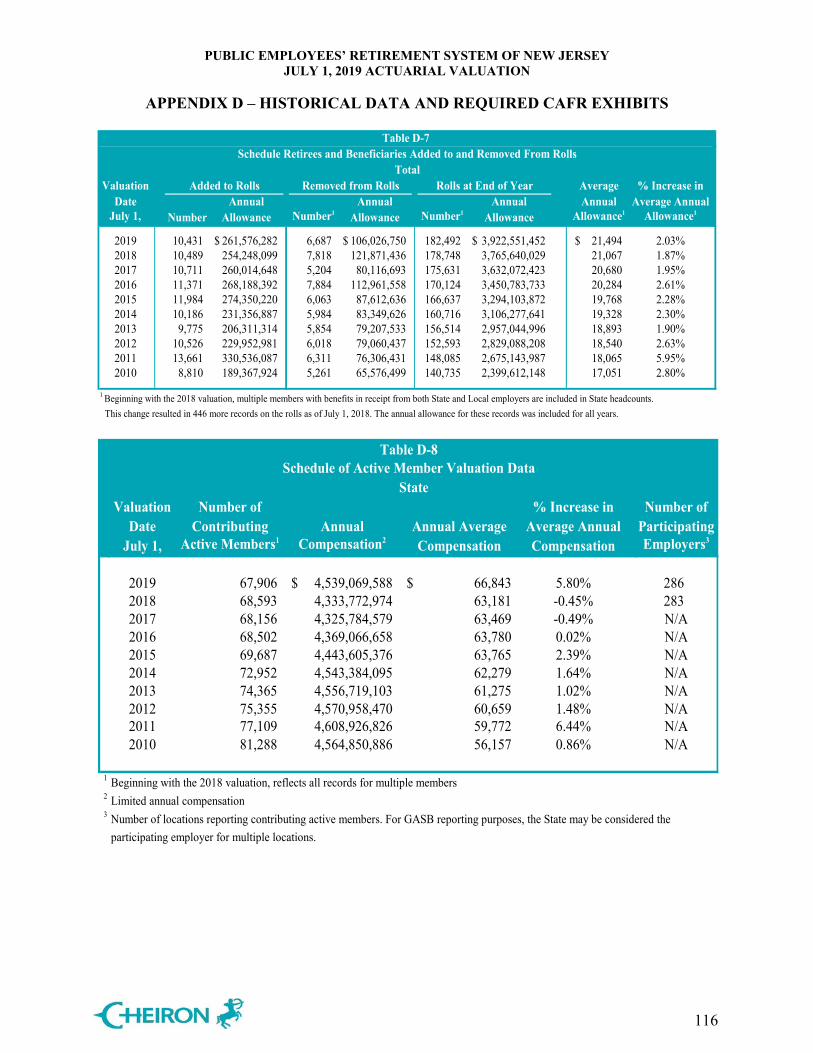
PUBLIC EMPLOYEES’ RETIREMENT SYSTEM OF NEW JERSEY JULY 1, 2019 ACTUARIAL VALUATION
APPENDIX D – HISTORICAL DATA AND REQUIRED CAFR EXHIBITS
116
Table D-7
Valuation Average % Increase inDate Annual Annual Annual Annual Average Annual
July 1, Number Allowance Number1 Allowance Number1 Allowance Allowance1 Allowance1
2019 10,431 261,576,282$ 6,687 106,026,750$ 182,492 3,922,551,452$ 21,494$ 2.03%2018 10,489 254,248,099 7,818 121,871,436 178,748 3,765,640,029 21,067 1.87%2017 10,711 260,014,648 5,204 80,116,693 175,631 3,632,072,423 20,680 1.95%2016 11,371 268,188,392 7,884 112,961,558 170,124 3,450,783,733 20,284 2.61%2015 11,984 274,350,220 6,063 87,612,636 166,637 3,294,103,872 19,768 2.28%2014 10,186 231,356,887 5,984 83,349,626 160,716 3,106,277,641 19,328 2.30%2013 9,775 206,311,314 5,854 79,207,533 156,514 2,957,044,996 18,893 1.90%2012 10,526 229,952,981 6,018 79,060,437 152,593 2,829,088,208 18,540 2.63%2011 13,661 330,536,087 6,311 76,306,431 148,085 2,675,143,987 18,065 5.95%2010 8,810 189,367,924 5,261 65,576,499 140,735 2,399,612,148 17,051 2.80%
1 Beginning with the 2018 valuation, multiple members with benefits in receipt from both State and Local employers are included in State headcounts. This change resulted in 446 more records on the rolls as of July 1, 2018. The annual allowance for these records was included for all years.
Schedule Retirees and Beneficiaries Added to and Removed From Rolls
Added to Rolls Removed from Rolls Rolls at End of YearTotal
Table D-8Schedule of Active Member Valuation Data
StateValuation Number of % Increase in Number of
Date Contributing Annual Annual Average Average Annual ParticipatingJuly 1, Active Members1 Compensation2 Compensation Compensation Employers3
2019 67,906 4,539,069,588$ 66,843$ 5.80% 2862018 68,593 4,333,772,974 63,181 -0.45% 2832017 68,156 4,325,784,579 63,469 -0.49% N/A2016 68,502 4,369,066,658 63,780 0.02% N/A2015 69,687 4,443,605,376 63,765 2.39% N/A2014 72,952 4,543,384,095 62,279 1.64% N/A2013 74,365 4,556,719,103 61,275 1.02% N/A2012 75,355 4,570,958,470 60,659 1.48% N/A2011 77,109 4,608,926,826 59,772 6.44% N/A2010 81,288 4,564,850,886 56,157 0.86% N/A
1 Beginning with the 2018 valuation, reflects all records for multiple members2 Limited annual compensation3 Number of locations reporting contributing active members. For GASB reporting purposes, the State may be considered the
participating employer for multiple locations.
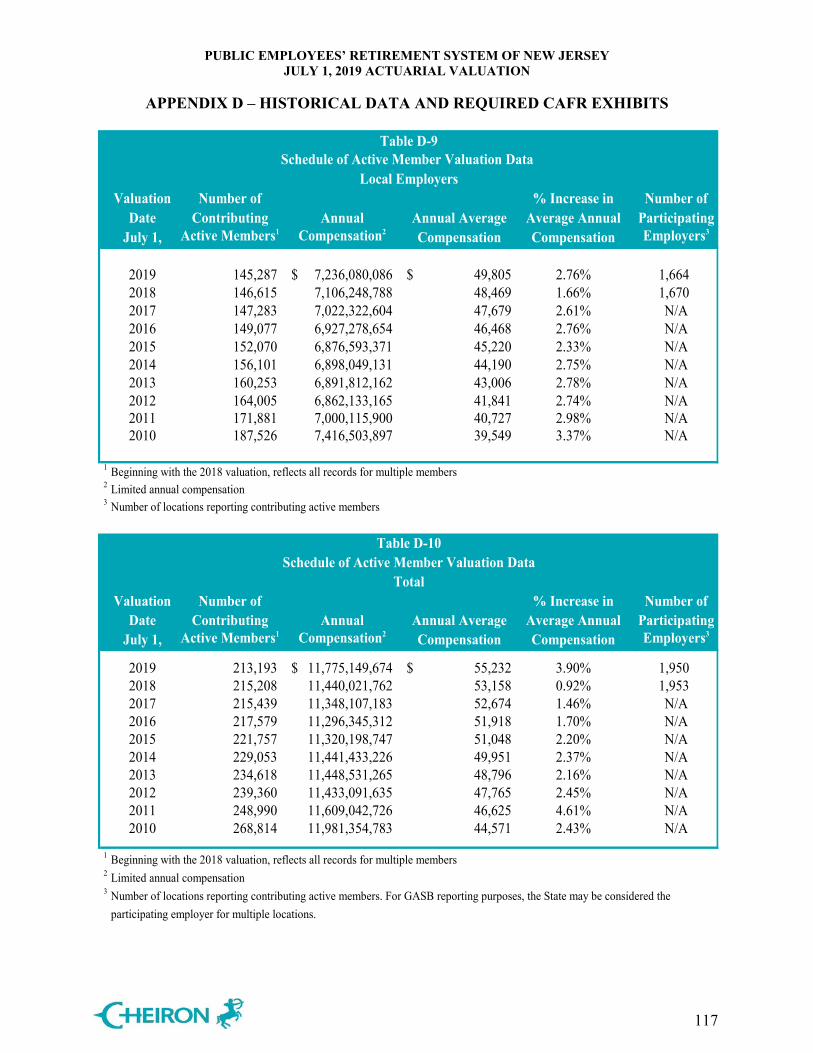
PUBLIC EMPLOYEES’ RETIREMENT SYSTEM OF NEW JERSEY JULY 1, 2019 ACTUARIAL VALUATION
APPENDIX D – HISTORICAL DATA AND REQUIRED CAFR EXHIBITS
117
Table D-9Schedule of Active Member Valuation Data
Local EmployersValuation Number of % Increase in Number of
Date Contributing Annual Annual Average Average Annual ParticipatingJuly 1, Active Members1 Compensation2 Compensation Compensation Employers3
2019 145,287 7,236,080,086$ 49,805$ 2.76% 1,6642018 146,615 7,106,248,788 48,469 1.66% 1,6702017 147,283 7,022,322,604 47,679 2.61% N/A2016 149,077 6,927,278,654 46,468 2.76% N/A2015 152,070 6,876,593,371 45,220 2.33% N/A2014 156,101 6,898,049,131 44,190 2.75% N/A2013 160,253 6,891,812,162 43,006 2.78% N/A2012 164,005 6,862,133,165 41,841 2.74% N/A2011 171,881 7,000,115,900 40,727 2.98% N/A2010 187,526 7,416,503,897 39,549 3.37% N/A
1 Beginning with the 2018 valuation, reflects all records for multiple members2 Limited annual compensation3 Number of locations reporting contributing active members
Table D-10
Schedule of Active Member Valuation DataTotal
Valuation Number of % Increase in Number ofDate Contributing Annual Annual Average Average Annual Participating
July 1, Active Members1 Compensation2 Compensation Compensation Employers3
2019 213,193 11,775,149,674$ 55,232$ 3.90% 1,9502018 215,208 11,440,021,762 53,158 0.92% 1,9532017 215,439 11,348,107,183 52,674 1.46% N/A2016 217,579 11,296,345,312 51,918 1.70% N/A2015 221,757 11,320,198,747 51,048 2.20% N/A2014 229,053 11,441,433,226 49,951 2.37% N/A2013 234,618 11,448,531,265 48,796 2.16% N/A2012 239,360 11,433,091,635 47,765 2.45% N/A2011 248,990 11,609,042,726 46,625 4.61% N/A2010 268,814 11,981,354,783 44,571 2.43% N/A
1 Beginning with the 2018 valuation, reflects all records for multiple members2 Limited annual compensation3 Number of locations reporting contributing active members. For GASB reporting purposes, the State may be considered the
participating employer for multiple locations.
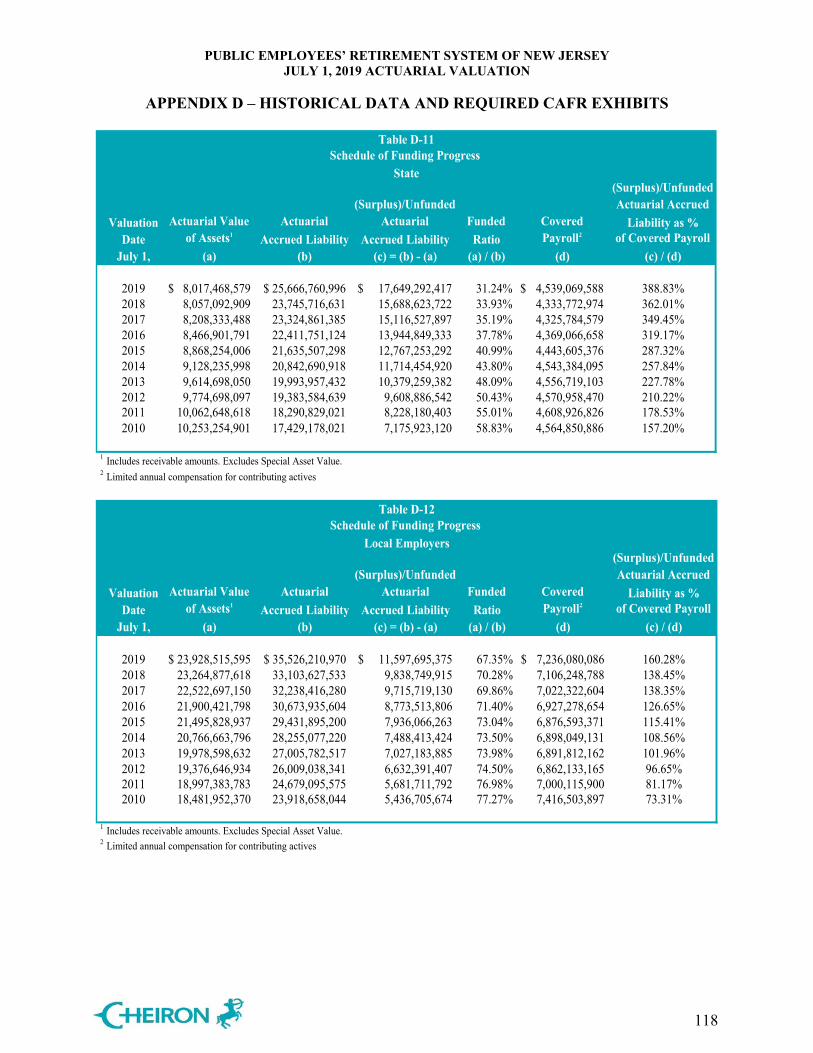
PUBLIC EMPLOYEES’ RETIREMENT SYSTEM OF NEW JERSEY JULY 1, 2019 ACTUARIAL VALUATION
APPENDIX D – HISTORICAL DATA AND REQUIRED CAFR EXHIBITS
118
Table D-11Schedule of Funding Progress
(Surplus)/Unfunded(Surplus)/Unfunded Actuarial Accrued
Valuation Actuarial Value Actuarial Actuarial Funded Covered Liability as %Date of Assets1 Accrued Liability Accrued Liability Ratio Payroll2 of Covered Payroll
July 1, (a) (b) (c) = (b) - (a) (a) / (b) (d) (c) / (d)
2019 8,017,468,579$ 25,666,760,996$ 17,649,292,417$ 31.24% 4,539,069,588$ 388.83%2018 8,057,092,909 23,745,716,631 15,688,623,722 33.93% 4,333,772,974 362.01%2017 8,208,333,488 23,324,861,385 15,116,527,897 35.19% 4,325,784,579 349.45%2016 8,466,901,791 22,411,751,124 13,944,849,333 37.78% 4,369,066,658 319.17%2015 8,868,254,006 21,635,507,298 12,767,253,292 40.99% 4,443,605,376 287.32%2014 9,128,235,998 20,842,690,918 11,714,454,920 43.80% 4,543,384,095 257.84%2013 9,614,698,050 19,993,957,432 10,379,259,382 48.09% 4,556,719,103 227.78%2012 9,774,698,097 19,383,584,639 9,608,886,542 50.43% 4,570,958,470 210.22%2011 10,062,648,618 18,290,829,021 8,228,180,403 55.01% 4,608,926,826 178.53%2010 10,253,254,901 17,429,178,021 7,175,923,120 58.83% 4,564,850,886 157.20%
1 Includes receivable amounts. Excludes Special Asset Value.2 Limited annual compensation for contributing actives
State
Table D-12Schedule of Funding Progress
(Surplus)/Unfunded(Surplus)/Unfunded Actuarial Accrued
Valuation Actuarial Value Actuarial Actuarial Funded Covered Liability as %Date of Assets1 Accrued Liability Accrued Liability Ratio Payroll2 of Covered Payroll
July 1, (a) (b) (c) = (b) - (a) (a) / (b) (d) (c) / (d)
2019 23,928,515,595$ 35,526,210,970$ 11,597,695,375$ 67.35% 7,236,080,086$ 160.28%2018 23,264,877,618 33,103,627,533 9,838,749,915 70.28% 7,106,248,788 138.45%2017 22,522,697,150 32,238,416,280 9,715,719,130 69.86% 7,022,322,604 138.35%2016 21,900,421,798 30,673,935,604 8,773,513,806 71.40% 6,927,278,654 126.65%2015 21,495,828,937 29,431,895,200 7,936,066,263 73.04% 6,876,593,371 115.41%2014 20,766,663,796 28,255,077,220 7,488,413,424 73.50% 6,898,049,131 108.56%2013 19,978,598,632 27,005,782,517 7,027,183,885 73.98% 6,891,812,162 101.96%2012 19,376,646,934 26,009,038,341 6,632,391,407 74.50% 6,862,133,165 96.65%2011 18,997,383,783 24,679,095,575 5,681,711,792 76.98% 7,000,115,900 81.17%2010 18,481,952,370 23,918,658,044 5,436,705,674 77.27% 7,416,503,897 73.31%
1 Includes receivable amounts. Excludes Special Asset Value.2 Limited annual compensation for contributing actives
Local Employers
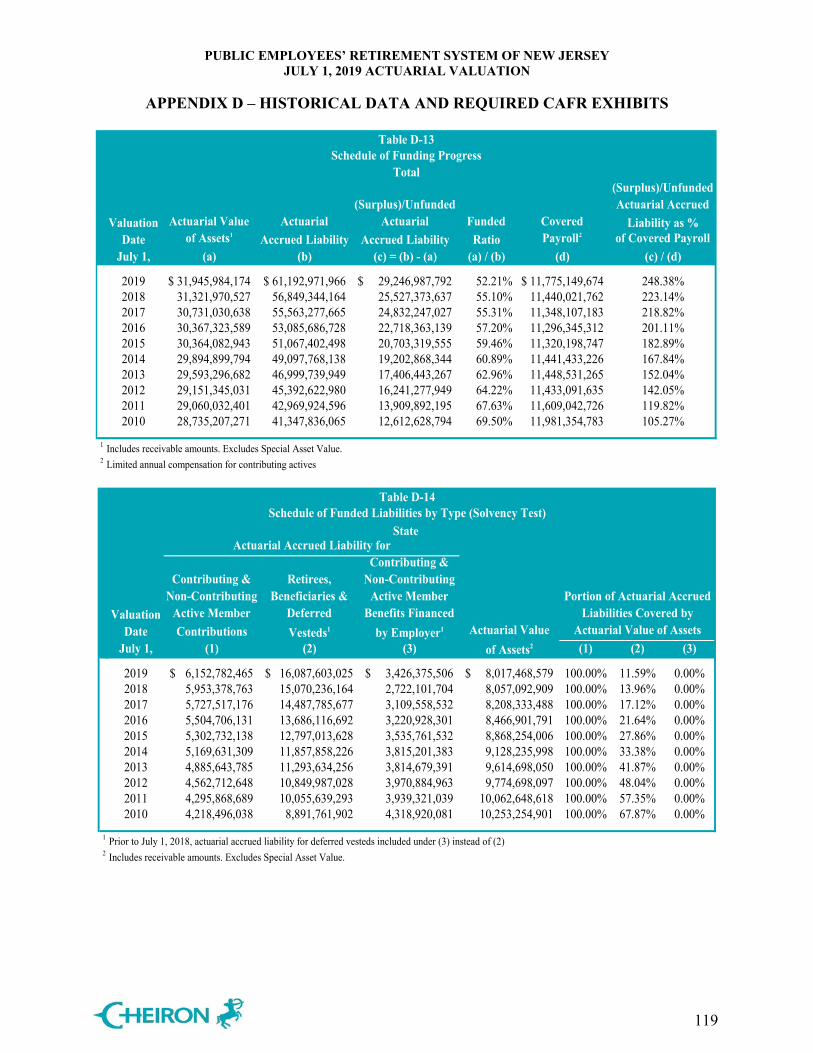
PUBLIC EMPLOYEES’ RETIREMENT SYSTEM OF NEW JERSEY JULY 1, 2019 ACTUARIAL VALUATION
APPENDIX D – HISTORICAL DATA AND REQUIRED CAFR EXHIBITS
119
Table D-13Schedule of Funding Progress
Total(Surplus)/Unfunded
(Surplus)/Unfunded Actuarial AccruedValuation Actuarial Value Actuarial Actuarial Funded Covered Liability as %
Date of Assets1 Accrued Liability Accrued Liability Ratio Payroll2 of Covered PayrollJuly 1, (a) (b) (c) = (b) - (a) (a) / (b) (d) (c) / (d)
2019 31,945,984,174$ 61,192,971,966$ 29,246,987,792$ 52.21% 11,775,149,674$ 248.38%2018 31,321,970,527 56,849,344,164 25,527,373,637 55.10% 11,440,021,762 223.14%2017 30,731,030,638 55,563,277,665 24,832,247,027 55.31% 11,348,107,183 218.82%2016 30,367,323,589 53,085,686,728 22,718,363,139 57.20% 11,296,345,312 201.11%2015 30,364,082,943 51,067,402,498 20,703,319,555 59.46% 11,320,198,747 182.89%2014 29,894,899,794 49,097,768,138 19,202,868,344 60.89% 11,441,433,226 167.84%2013 29,593,296,682 46,999,739,949 17,406,443,267 62.96% 11,448,531,265 152.04%2012 29,151,345,031 45,392,622,980 16,241,277,949 64.22% 11,433,091,635 142.05%2011 29,060,032,401 42,969,924,596 13,909,892,195 67.63% 11,609,042,726 119.82%2010 28,735,207,271 41,347,836,065 12,612,628,794 69.50% 11,981,354,783 105.27%
1 Includes receivable amounts. Excludes Special Asset Value.2 Limited annual compensation for contributing actives
Table D-14Schedule of Funded Liabilities by Type (Solvency Test)
Actuarial Accrued Liability for
Contributing & Contributing & Retirees, Non-Contributing
Non-Contributing Beneficiaries & Active Member Portion of Actuarial AccruedValuation Active Member Deferred Benefits Financed Liabilities Covered by
Date Contributions Vesteds1 by Employer1 Actuarial Value Actuarial Value of AssetsJuly 1, (1) (2) (3) of Assets2 (1) (2) (3)
2019 6,152,782,465$ 16,087,603,025$ 3,426,375,506$ 8,017,468,579$ 100.00% 11.59% 0.00%2018 5,953,378,763 15,070,236,164 2,722,101,704 8,057,092,909 100.00% 13.96% 0.00%2017 5,727,517,176 14,487,785,677 3,109,558,532 8,208,333,488 100.00% 17.12% 0.00%2016 5,504,706,131 13,686,116,692 3,220,928,301 8,466,901,791 100.00% 21.64% 0.00%2015 5,302,732,138 12,797,013,628 3,535,761,532 8,868,254,006 100.00% 27.86% 0.00%2014 5,169,631,309 11,857,858,226 3,815,201,383 9,128,235,998 100.00% 33.38% 0.00%2013 4,885,643,785 11,293,634,256 3,814,679,391 9,614,698,050 100.00% 41.87% 0.00%2012 4,562,712,648 10,849,987,028 3,970,884,963 9,774,698,097 100.00% 48.04% 0.00%2011 4,295,868,689 10,055,639,293 3,939,321,039 10,062,648,618 100.00% 57.35% 0.00%2010 4,218,496,038 8,891,761,902 4,318,920,081 10,253,254,901 100.00% 67.87% 0.00%
1 Prior to July 1, 2018, actuarial accrued liability for deferred vesteds included under (3) instead of (2)2 Includes receivable amounts. Excludes Special Asset Value.
State
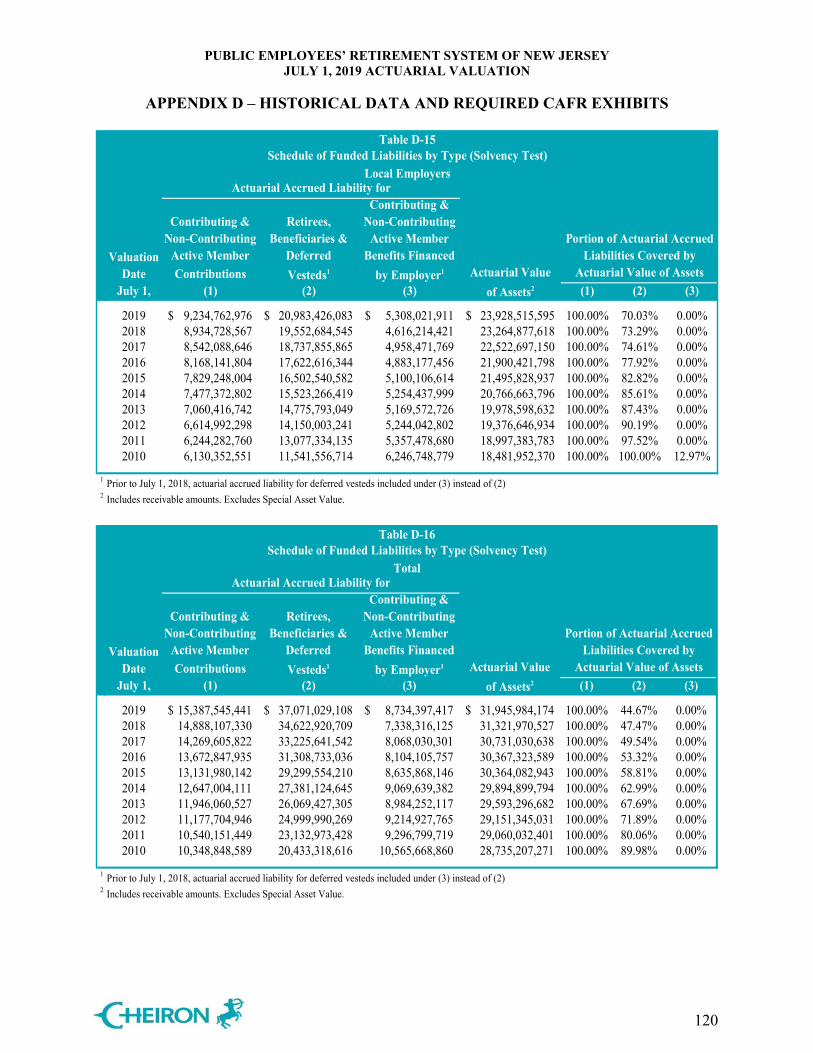
PUBLIC EMPLOYEES’ RETIREMENT SYSTEM OF NEW JERSEY JULY 1, 2019 ACTUARIAL VALUATION
APPENDIX D – HISTORICAL DATA AND REQUIRED CAFR EXHIBITS
120
Table D-15Schedule of Funded Liabilities by Type (Solvency Test)
Actuarial Accrued Liability for Contributing &
Contributing & Retirees, Non-ContributingNon-Contributing Beneficiaries & Active Member Portion of Actuarial Accrued
Valuation Active Member Deferred Benefits Financed Liabilities Covered byDate Contributions Vesteds1 by Employer1 Actuarial Value Actuarial Value of Assets
July 1, (1) (2) (3) of Assets2 (1) (2) (3)
2019 9,234,762,976$ 20,983,426,083$ 5,308,021,911$ 23,928,515,595$ 100.00% 70.03% 0.00%2018 8,934,728,567 19,552,684,545 4,616,214,421 23,264,877,618 100.00% 73.29% 0.00%2017 8,542,088,646 18,737,855,865 4,958,471,769 22,522,697,150 100.00% 74.61% 0.00%2016 8,168,141,804 17,622,616,344 4,883,177,456 21,900,421,798 100.00% 77.92% 0.00%2015 7,829,248,004 16,502,540,582 5,100,106,614 21,495,828,937 100.00% 82.82% 0.00%2014 7,477,372,802 15,523,266,419 5,254,437,999 20,766,663,796 100.00% 85.61% 0.00%2013 7,060,416,742 14,775,793,049 5,169,572,726 19,978,598,632 100.00% 87.43% 0.00%2012 6,614,992,298 14,150,003,241 5,244,042,802 19,376,646,934 100.00% 90.19% 0.00%2011 6,244,282,760 13,077,334,135 5,357,478,680 18,997,383,783 100.00% 97.52% 0.00%2010 6,130,352,551 11,541,556,714 6,246,748,779 18,481,952,370 100.00% 100.00% 12.97%
1 Prior to July 1, 2018, actuarial accrued liability for deferred vesteds included under (3) instead of (2)2 Includes receivable amounts. Excludes Special Asset Value.
Local Employers
Table D-16
Schedule of Funded Liabilities by Type (Solvency Test)Total
Actuarial Accrued Liability for Contributing &
Contributing & Retirees, Non-ContributingNon-Contributing Beneficiaries & Active Member Portion of Actuarial Accrued
Valuation Active Member Deferred Benefits Financed Liabilities Covered byDate Contributions Vesteds1 by Employer1 Actuarial Value Actuarial Value of Assets
July 1, (1) (2) (3) of Assets2 (1) (2) (3)
2019 15,387,545,441$ 37,071,029,108$ 8,734,397,417$ 31,945,984,174$ 100.00% 44.67% 0.00%2018 14,888,107,330 34,622,920,709 7,338,316,125 31,321,970,527 100.00% 47.47% 0.00%2017 14,269,605,822 33,225,641,542 8,068,030,301 30,731,030,638 100.00% 49.54% 0.00%2016 13,672,847,935 31,308,733,036 8,104,105,757 30,367,323,589 100.00% 53.32% 0.00%2015 13,131,980,142 29,299,554,210 8,635,868,146 30,364,082,943 100.00% 58.81% 0.00%2014 12,647,004,111 27,381,124,645 9,069,639,382 29,894,899,794 100.00% 62.99% 0.00%2013 11,946,060,527 26,069,427,305 8,984,252,117 29,593,296,682 100.00% 67.69% 0.00%2012 11,177,704,946 24,999,990,269 9,214,927,765 29,151,345,031 100.00% 71.89% 0.00%2011 10,540,151,449 23,132,973,428 9,296,799,719 29,060,032,401 100.00% 80.06% 0.00%2010 10,348,848,589 20,433,318,616 10,565,668,860 28,735,207,271 100.00% 89.98% 0.00%
1 Prior to July 1, 2018, actuarial accrued liability for deferred vesteds included under (3) instead of (2)2 Includes receivable amounts. Excludes Special Asset Value.
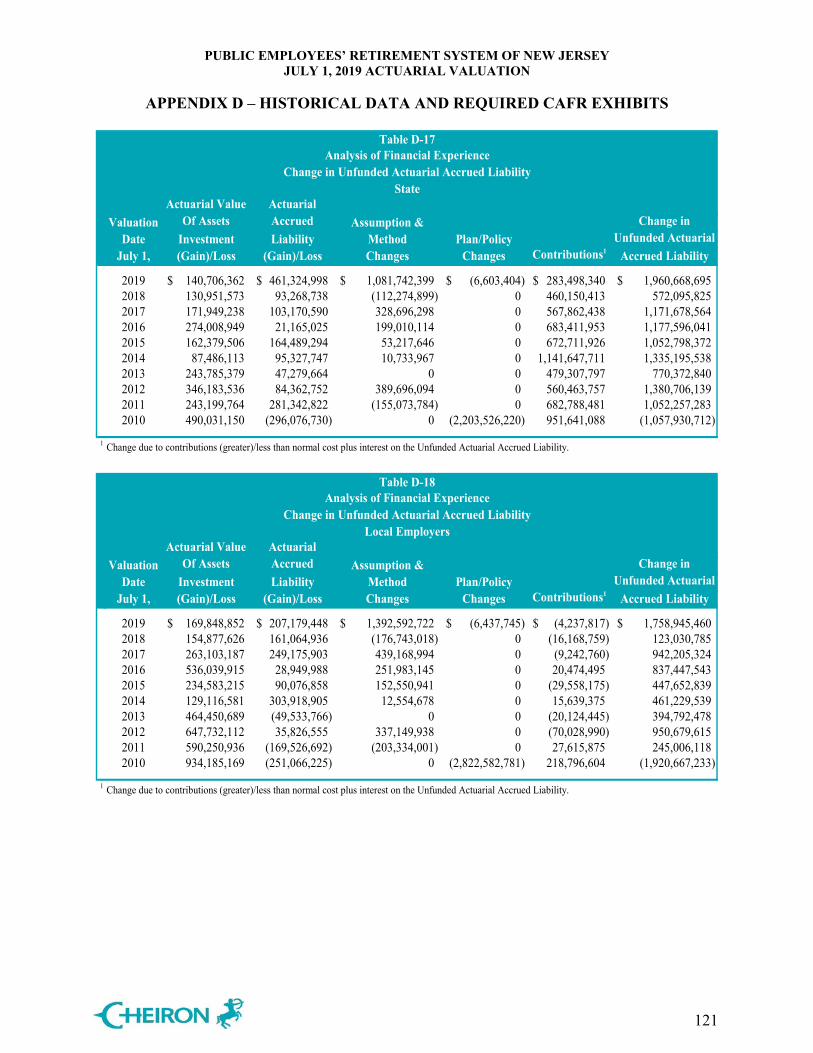
PUBLIC EMPLOYEES’ RETIREMENT SYSTEM OF NEW JERSEY JULY 1, 2019 ACTUARIAL VALUATION
APPENDIX D – HISTORICAL DATA AND REQUIRED CAFR EXHIBITS
121
Table D-17Analysis of Financial Experience
Change in Unfunded Actuarial Accrued Liability
Actuarial Value ActuarialValuation Of Assets Accrued Assumption & Change in
Date Investment Liability Method Plan/Policy Unfunded ActuarialJuly 1, (Gain)/Loss (Gain)/Loss Changes Changes Contributions1 Accrued Liability
2019 140,706,362$ 461,324,998$ 1,081,742,399$ (6,603,404)$ 283,498,340$ 1,960,668,695$ 2018 130,951,573 93,268,738 (112,274,899) 0 460,150,413 572,095,825 2017 171,949,238 103,170,590 328,696,298 0 567,862,438 1,171,678,564 2016 274,008,949 21,165,025 199,010,114 0 683,411,953 1,177,596,041 2015 162,379,506 164,489,294 53,217,646 0 672,711,926 1,052,798,372 2014 87,486,113 95,327,747 10,733,967 0 1,141,647,711 1,335,195,538 2013 243,785,379 47,279,664 0 0 479,307,797 770,372,840 2012 346,183,536 84,362,752 389,696,094 0 560,463,757 1,380,706,139 2011 243,199,764 281,342,822 (155,073,784) 0 682,788,481 1,052,257,283 2010 490,031,150 (296,076,730) 0 (2,203,526,220) 951,641,088 (1,057,930,712)
1 Change due to contributions (greater)/less than normal cost plus interest on the Unfunded Actuarial Accrued Liability.
State
Table D-18Analysis of Financial Experience
Change in Unfunded Actuarial Accrued Liability
Actuarial Value ActuarialValuation Of Assets Accrued Assumption & Change in
Date Investment Liability Method Plan/Policy Unfunded ActuarialJuly 1, (Gain)/Loss (Gain)/Loss Changes Changes Contributions1 Accrued Liability
2019 169,848,852$ 207,179,448$ 1,392,592,722$ (6,437,745)$ (4,237,817)$ 1,758,945,460$ 2018 154,877,626 161,064,936 (176,743,018) 0 (16,168,759) 123,030,785 2017 263,103,187 249,175,903 439,168,994 0 (9,242,760) 942,205,324 2016 536,039,915 28,949,988 251,983,145 0 20,474,495 837,447,543 2015 234,583,215 90,076,858 152,550,941 0 (29,558,175) 447,652,839 2014 129,116,581 303,918,905 12,554,678 0 15,639,375 461,229,539 2013 464,450,689 (49,533,766) 0 0 (20,124,445) 394,792,478 2012 647,732,112 35,826,555 337,149,938 0 (70,028,990) 950,679,615 2011 590,250,936 (169,526,692) (203,334,001) 0 27,615,875 245,006,118 2010 934,185,169 (251,066,225) 0 (2,822,582,781) 218,796,604 (1,920,667,233)
1 Change due to contributions (greater)/less than normal cost plus interest on the Unfunded Actuarial Accrued Liability.
Local Employers
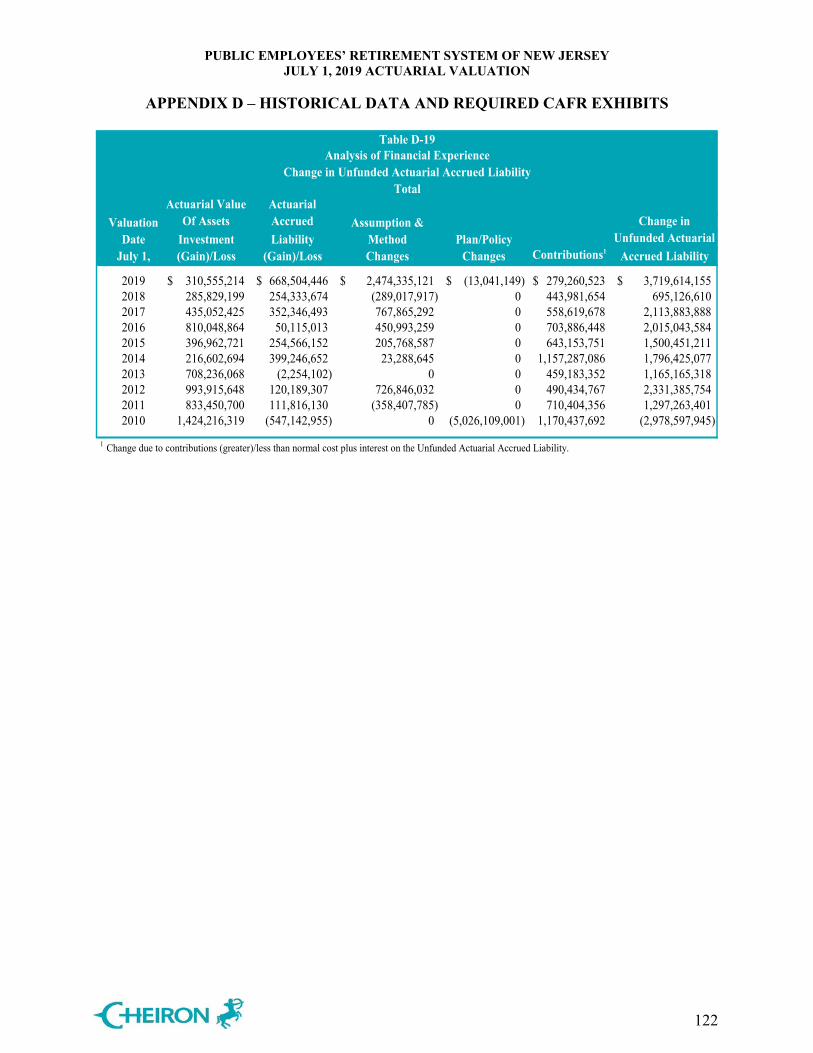
PUBLIC EMPLOYEES’ RETIREMENT SYSTEM OF NEW JERSEY JULY 1, 2019 ACTUARIAL VALUATION
APPENDIX D – HISTORICAL DATA AND REQUIRED CAFR EXHIBITS
122
Table D-19Analysis of Financial Experience
Change in Unfunded Actuarial Accrued Liability
Actuarial Value ActuarialValuation Of Assets Accrued Assumption & Change in
Date Investment Liability Method Plan/Policy Unfunded ActuarialJuly 1, (Gain)/Loss (Gain)/Loss Changes Changes Contributions1 Accrued Liability
2019 310,555,214$ 668,504,446$ 2,474,335,121$ (13,041,149)$ 279,260,523$ 3,719,614,155$ 2018 285,829,199 254,333,674 (289,017,917) 0 443,981,654 695,126,610 2017 435,052,425 352,346,493 767,865,292 0 558,619,678 2,113,883,888 2016 810,048,864 50,115,013 450,993,259 0 703,886,448 2,015,043,584 2015 396,962,721 254,566,152 205,768,587 0 643,153,751 1,500,451,211 2014 216,602,694 399,246,652 23,288,645 0 1,157,287,086 1,796,425,077 2013 708,236,068 (2,254,102) 0 0 459,183,352 1,165,165,318 2012 993,915,648 120,189,307 726,846,032 0 490,434,767 2,331,385,754 2011 833,450,700 111,816,130 (358,407,785) 0 710,404,356 1,297,263,401 2010 1,424,216,319 (547,142,955) 0 (5,026,109,001) 1,170,437,692 (2,978,597,945)
1 Change due to contributions (greater)/less than normal cost plus interest on the Unfunded Actuarial Accrued Liability.
Total
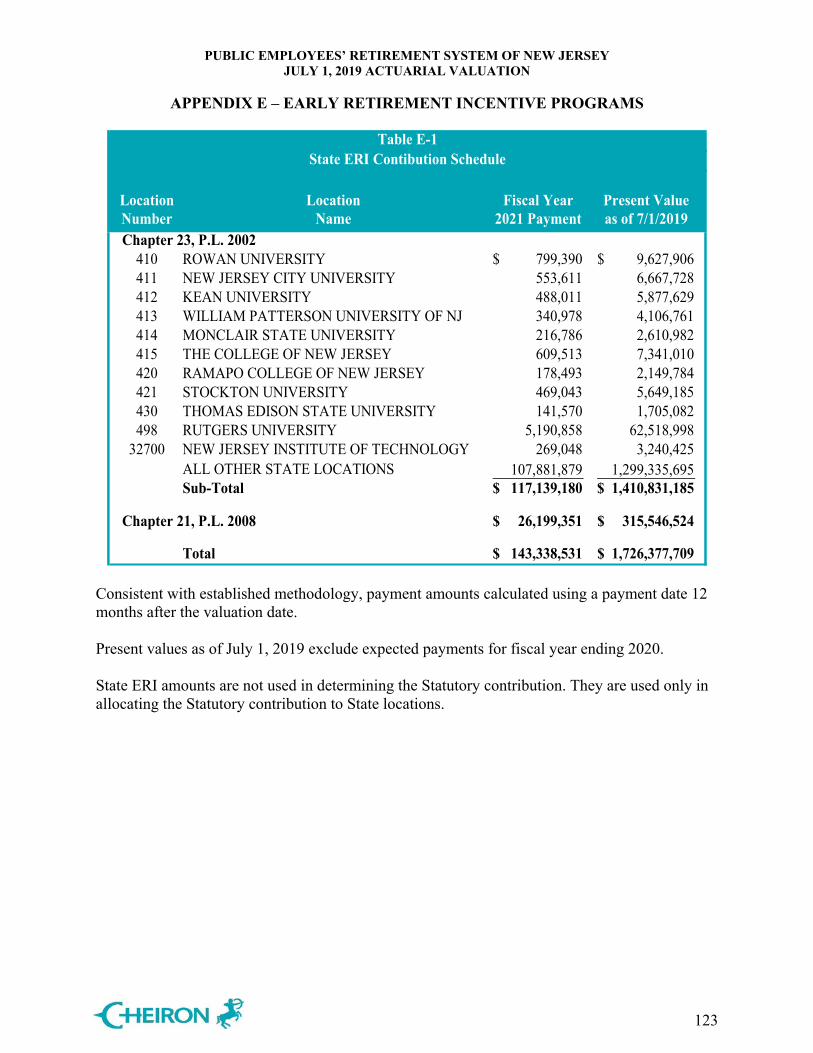
PUBLIC EMPLOYEES’ RETIREMENT SYSTEM OF NEW JERSEY JULY 1, 2019 ACTUARIAL VALUATION
APPENDIX E – EARLY RETIREMENT INCENTIVE PROGRAMS
123
Location Location Fiscal Year Present ValueNumber Name 2021 Payment as of 7/1/2019
Chapter 23, P.L. 2002410 ROWAN UNIVERSITY 799,390$ 9,627,906$ 411 NEW JERSEY CITY UNIVERSITY 553,611 6,667,728 412 KEAN UNIVERSITY 488,011 5,877,629 413 WILLIAM PATTERSON UNIVERSITY OF NJ 340,978 4,106,761 414 MONCLAIR STATE UNIVERSITY 216,786 2,610,982 415 THE COLLEGE OF NEW JERSEY 609,513 7,341,010 420 RAMAPO COLLEGE OF NEW JERSEY 178,493 2,149,784 421 STOCKTON UNIVERSITY 469,043 5,649,185 430 THOMAS EDISON STATE UNIVERSITY 141,570 1,705,082 498 RUTGERS UNIVERSITY 5,190,858 62,518,998
32700 NEW JERSEY INSTITUTE OF TECHNOLOGY 269,048 3,240,425 ALL OTHER STATE LOCATIONS 107,881,879 1,299,335,695 Sub-Total 117,139,180$ 1,410,831,185$
Chapter 21, P.L. 2008 26,199,351$ 315,546,524$
Total 143,338,531$ 1,726,377,709$
Table E-1State ERI Contibution Schedule
Consistent with established methodology, payment amounts calculated using a payment date 12 months after the valuation date.
Present values as of July 1, 2019 exclude expected payments for fiscal year ending 2020. State ERI amounts are not used in determining the Statutory contribution. They are used only in allocating the Statutory contribution to State locations.
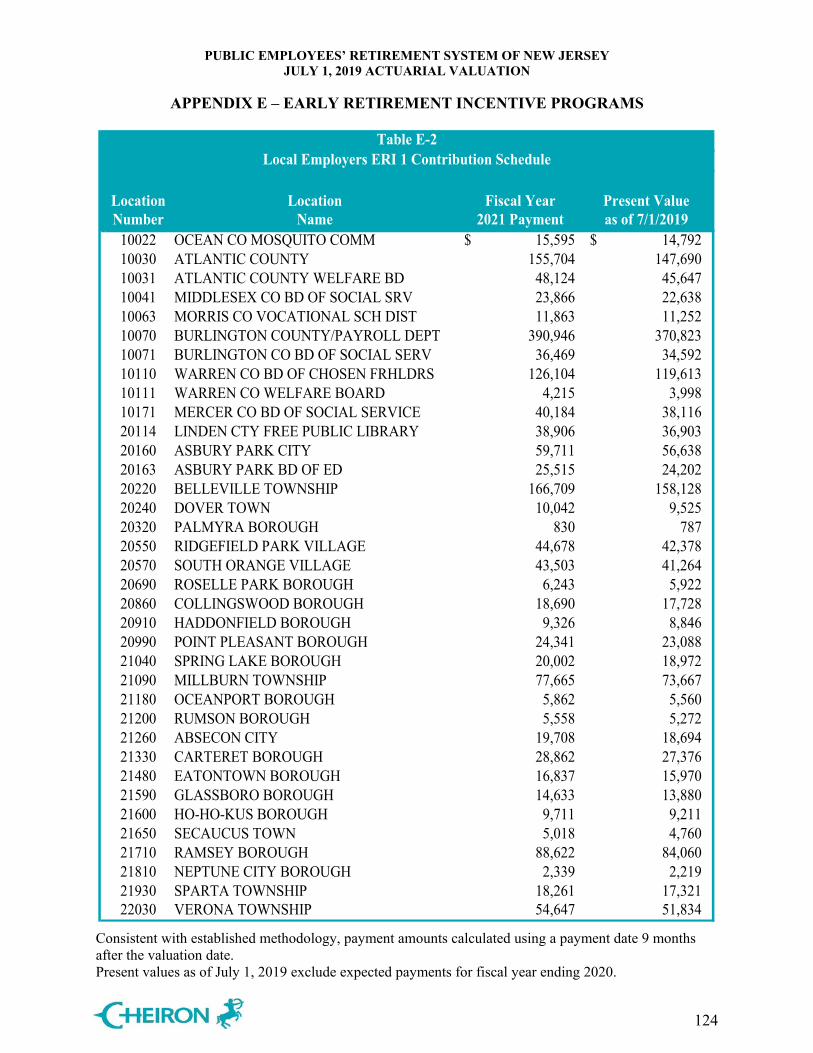
PUBLIC EMPLOYEES’ RETIREMENT SYSTEM OF NEW JERSEY JULY 1, 2019 ACTUARIAL VALUATION
APPENDIX E – EARLY RETIREMENT INCENTIVE PROGRAMS
124
Location Location Fiscal Year Present ValueNumber Name 2021 Payment as of 7/1/2019
10022 OCEAN CO MOSQUITO COMM 15,595$ 14,792$ 10030 ATLANTIC COUNTY 155,704 147,690 10031 ATLANTIC COUNTY WELFARE BD 48,124 45,647 10041 MIDDLESEX CO BD OF SOCIAL SRV 23,866 22,638 10063 MORRIS CO VOCATIONAL SCH DIST 11,863 11,252 10070 BURLINGTON COUNTY/PAYROLL DEPT 390,946 370,823 10071 BURLINGTON CO BD OF SOCIAL SERV 36,469 34,592 10110 WARREN CO BD OF CHOSEN FRHLDRS 126,104 119,613 10111 WARREN CO WELFARE BOARD 4,215 3,998 10171 MERCER CO BD OF SOCIAL SERVICE 40,184 38,116 20114 LINDEN CTY FREE PUBLIC LIBRARY 38,906 36,903 20160 ASBURY PARK CITY 59,711 56,638 20163 ASBURY PARK BD OF ED 25,515 24,202 20220 BELLEVILLE TOWNSHIP 166,709 158,128 20240 DOVER TOWN 10,042 9,525 20320 PALMYRA BOROUGH 830 787 20550 RIDGEFIELD PARK VILLAGE 44,678 42,378 20570 SOUTH ORANGE VILLAGE 43,503 41,264 20690 ROSELLE PARK BOROUGH 6,243 5,922 20860 COLLINGSWOOD BOROUGH 18,690 17,728 20910 HADDONFIELD BOROUGH 9,326 8,846 20990 POINT PLEASANT BOROUGH 24,341 23,088 21040 SPRING LAKE BOROUGH 20,002 18,972 21090 MILLBURN TOWNSHIP 77,665 73,667 21180 OCEANPORT BOROUGH 5,862 5,560 21200 RUMSON BOROUGH 5,558 5,272 21260 ABSECON CITY 19,708 18,694 21330 CARTERET BOROUGH 28,862 27,376 21480 EATONTOWN BOROUGH 16,837 15,970 21590 GLASSBORO BOROUGH 14,633 13,880 21600 HO-HO-KUS BOROUGH 9,711 9,211 21650 SECAUCUS TOWN 5,018 4,760 21710 RAMSEY BOROUGH 88,622 84,060 21810 NEPTUNE CITY BOROUGH 2,339 2,219 21930 SPARTA TOWNSHIP 18,261 17,321 22030 VERONA TOWNSHIP 54,647 51,834
Table E-2Local Employers ERI 1 Contribution Schedule
Consistent with established methodology, payment amounts calculated using a payment date 9 months after the valuation date. Present values as of July 1, 2019 exclude expected payments for fiscal year ending 2020.
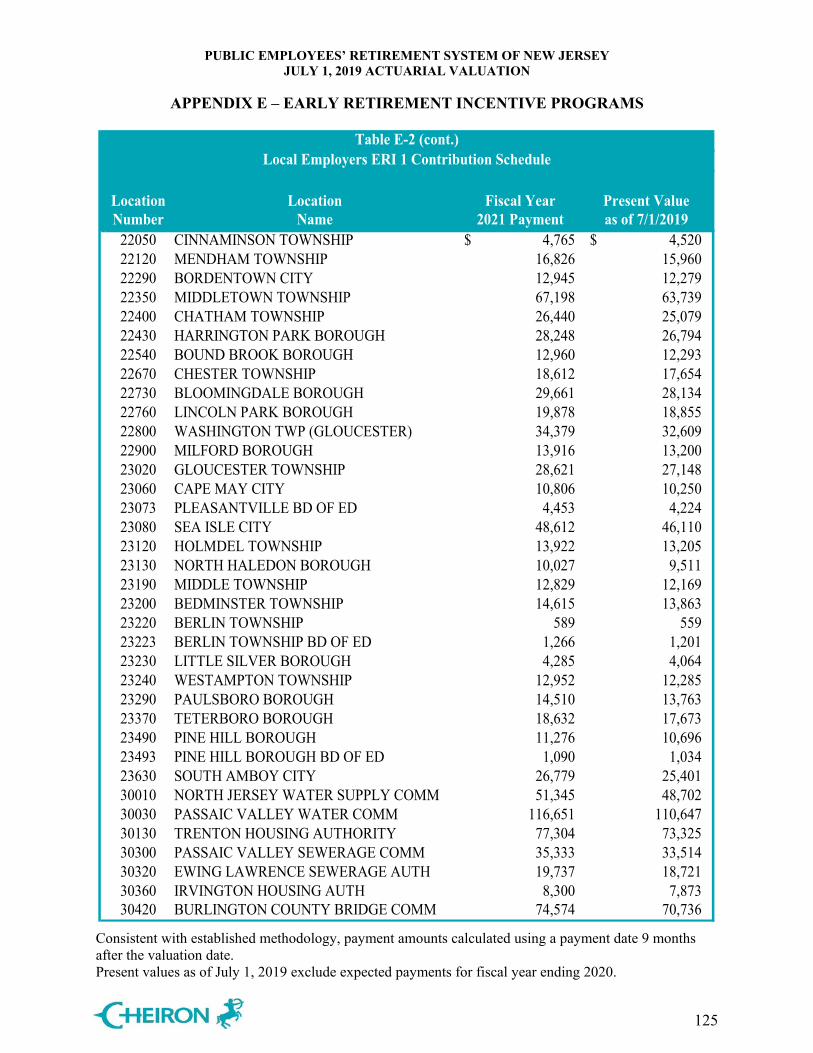
PUBLIC EMPLOYEES’ RETIREMENT SYSTEM OF NEW JERSEY JULY 1, 2019 ACTUARIAL VALUATION
APPENDIX E – EARLY RETIREMENT INCENTIVE PROGRAMS
125
Location Location Fiscal Year Present ValueNumber Name 2021 Payment as of 7/1/2019
22050 CINNAMINSON TOWNSHIP 4,765$ 4,520$ 22120 MENDHAM TOWNSHIP 16,826 15,960 22290 BORDENTOWN CITY 12,945 12,279 22350 MIDDLETOWN TOWNSHIP 67,198 63,739 22400 CHATHAM TOWNSHIP 26,440 25,079 22430 HARRINGTON PARK BOROUGH 28,248 26,794 22540 BOUND BROOK BOROUGH 12,960 12,293 22670 CHESTER TOWNSHIP 18,612 17,654 22730 BLOOMINGDALE BOROUGH 29,661 28,134 22760 LINCOLN PARK BOROUGH 19,878 18,855 22800 WASHINGTON TWP (GLOUCESTER) 34,379 32,609 22900 MILFORD BOROUGH 13,916 13,200 23020 GLOUCESTER TOWNSHIP 28,621 27,148 23060 CAPE MAY CITY 10,806 10,250 23073 PLEASANTVILLE BD OF ED 4,453 4,224 23080 SEA ISLE CITY 48,612 46,110 23120 HOLMDEL TOWNSHIP 13,922 13,205 23130 NORTH HALEDON BOROUGH 10,027 9,511 23190 MIDDLE TOWNSHIP 12,829 12,169 23200 BEDMINSTER TOWNSHIP 14,615 13,863 23220 BERLIN TOWNSHIP 589 559 23223 BERLIN TOWNSHIP BD OF ED 1,266 1,201 23230 LITTLE SILVER BOROUGH 4,285 4,064 23240 WESTAMPTON TOWNSHIP 12,952 12,285 23290 PAULSBORO BOROUGH 14,510 13,763 23370 TETERBORO BOROUGH 18,632 17,673 23490 PINE HILL BOROUGH 11,276 10,696 23493 PINE HILL BOROUGH BD OF ED 1,090 1,034 23630 SOUTH AMBOY CITY 26,779 25,401 30010 NORTH JERSEY WATER SUPPLY COMM 51,345 48,702 30030 PASSAIC VALLEY WATER COMM 116,651 110,647 30130 TRENTON HOUSING AUTHORITY 77,304 73,325 30300 PASSAIC VALLEY SEWERAGE COMM 35,333 33,514 30320 EWING LAWRENCE SEWERAGE AUTH 19,737 18,721 30360 IRVINGTON HOUSING AUTH 8,300 7,873 30420 BURLINGTON COUNTY BRIDGE COMM 74,574 70,736
Table E-2 (cont.)Local Employers ERI 1 Contribution Schedule
Consistent with established methodology, payment amounts calculated using a payment date 9 months after the valuation date. Present values as of July 1, 2019 exclude expected payments for fiscal year ending 2020.
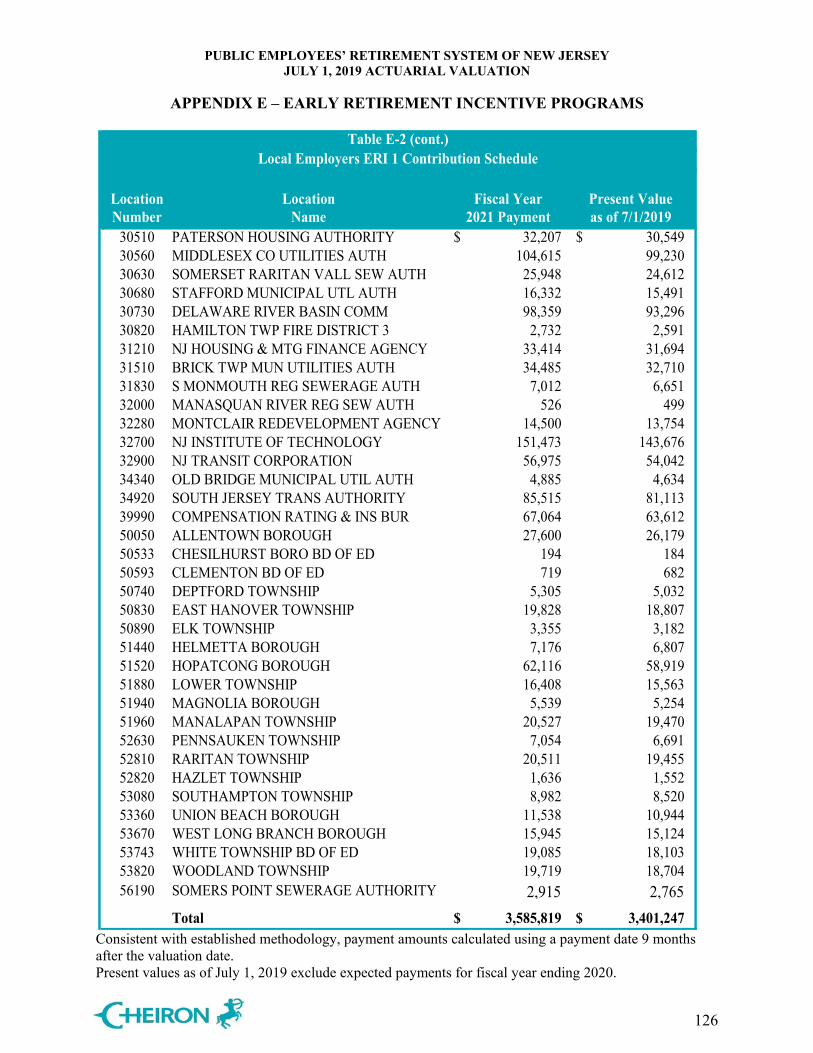
PUBLIC EMPLOYEES’ RETIREMENT SYSTEM OF NEW JERSEY JULY 1, 2019 ACTUARIAL VALUATION
APPENDIX E – EARLY RETIREMENT INCENTIVE PROGRAMS
126
Location Location Fiscal Year Present ValueNumber Name 2021 Payment as of 7/1/2019
30510 PATERSON HOUSING AUTHORITY 32,207$ 30,549$ 30560 MIDDLESEX CO UTILITIES AUTH 104,615 99,230 30630 SOMERSET RARITAN VALL SEW AUTH 25,948 24,612 30680 STAFFORD MUNICIPAL UTL AUTH 16,332 15,491 30730 DELAWARE RIVER BASIN COMM 98,359 93,296 30820 HAMILTON TWP FIRE DISTRICT 3 2,732 2,591 31210 NJ HOUSING & MTG FINANCE AGENCY 33,414 31,694 31510 BRICK TWP MUN UTILITIES AUTH 34,485 32,710 31830 S MONMOUTH REG SEWERAGE AUTH 7,012 6,651 32000 MANASQUAN RIVER REG SEW AUTH 526 499 32280 MONTCLAIR REDEVELOPMENT AGENCY 14,500 13,754 32700 NJ INSTITUTE OF TECHNOLOGY 151,473 143,676 32900 NJ TRANSIT CORPORATION 56,975 54,042 34340 OLD BRIDGE MUNICIPAL UTIL AUTH 4,885 4,634 34920 SOUTH JERSEY TRANS AUTHORITY 85,515 81,113 39990 COMPENSATION RATING & INS BUR 67,064 63,612 50050 ALLENTOWN BOROUGH 27,600 26,179 50533 CHESILHURST BORO BD OF ED 194 184 50593 CLEMENTON BD OF ED 719 682 50740 DEPTFORD TOWNSHIP 5,305 5,032 50830 EAST HANOVER TOWNSHIP 19,828 18,807 50890 ELK TOWNSHIP 3,355 3,182 51440 HELMETTA BOROUGH 7,176 6,807 51520 HOPATCONG BOROUGH 62,116 58,919 51880 LOWER TOWNSHIP 16,408 15,563 51940 MAGNOLIA BOROUGH 5,539 5,254 51960 MANALAPAN TOWNSHIP 20,527 19,470 52630 PENNSAUKEN TOWNSHIP 7,054 6,691 52810 RARITAN TOWNSHIP 20,511 19,455 52820 HAZLET TOWNSHIP 1,636 1,552 53080 SOUTHAMPTON TOWNSHIP 8,982 8,520 53360 UNION BEACH BOROUGH 11,538 10,944 53670 WEST LONG BRANCH BOROUGH 15,945 15,124 53743 WHITE TOWNSHIP BD OF ED 19,085 18,103 53820 WOODLAND TOWNSHIP 19,719 18,704 56190 SOMERS POINT SEWERAGE AUTHORITY 2,915 2,765
Total 3,585,819$ 3,401,247$
Table E-2 (cont.)Local Employers ERI 1 Contribution Schedule
Consistent with established methodology, payment amounts calculated using a payment date 9 months after the valuation date. Present values as of July 1, 2019 exclude expected payments for fiscal year ending 2020.
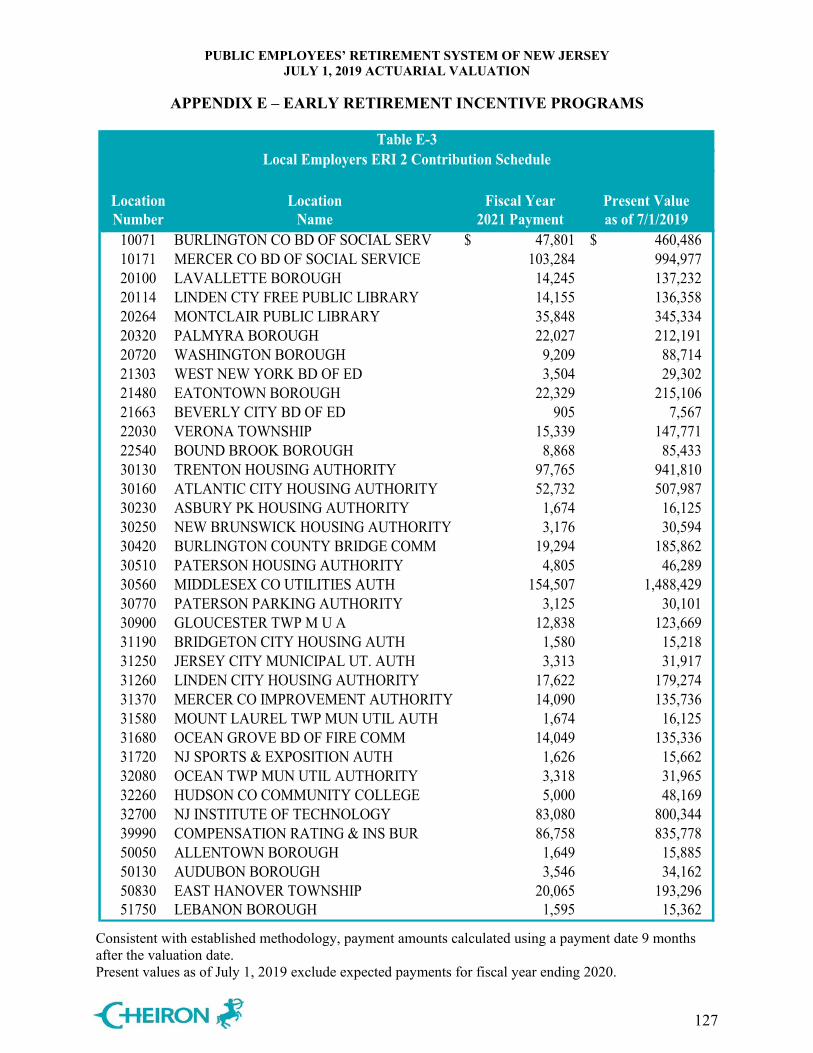
PUBLIC EMPLOYEES’ RETIREMENT SYSTEM OF NEW JERSEY JULY 1, 2019 ACTUARIAL VALUATION
APPENDIX E – EARLY RETIREMENT INCENTIVE PROGRAMS
127
Location Location Fiscal Year Present ValueNumber Name 2021 Payment as of 7/1/2019
10071 BURLINGTON CO BD OF SOCIAL SERV 47,801$ 460,486$ 10171 MERCER CO BD OF SOCIAL SERVICE 103,284 994,977 20100 LAVALLETTE BOROUGH 14,245 137,232 20114 LINDEN CTY FREE PUBLIC LIBRARY 14,155 136,358 20264 MONTCLAIR PUBLIC LIBRARY 35,848 345,334 20320 PALMYRA BOROUGH 22,027 212,191 20720 WASHINGTON BOROUGH 9,209 88,714 21303 WEST NEW YORK BD OF ED 3,504 29,302 21480 EATONTOWN BOROUGH 22,329 215,106 21663 BEVERLY CITY BD OF ED 905 7,567 22030 VERONA TOWNSHIP 15,339 147,771 22540 BOUND BROOK BOROUGH 8,868 85,433 30130 TRENTON HOUSING AUTHORITY 97,765 941,810 30160 ATLANTIC CITY HOUSING AUTHORITY 52,732 507,987 30230 ASBURY PK HOUSING AUTHORITY 1,674 16,125 30250 NEW BRUNSWICK HOUSING AUTHORITY 3,176 30,594 30420 BURLINGTON COUNTY BRIDGE COMM 19,294 185,862 30510 PATERSON HOUSING AUTHORITY 4,805 46,289 30560 MIDDLESEX CO UTILITIES AUTH 154,507 1,488,429 30770 PATERSON PARKING AUTHORITY 3,125 30,101 30900 GLOUCESTER TWP M U A 12,838 123,669 31190 BRIDGETON CITY HOUSING AUTH 1,580 15,218 31250 JERSEY CITY MUNICIPAL UT. AUTH 3,313 31,917 31260 LINDEN CITY HOUSING AUTHORITY 17,622 179,274 31370 MERCER CO IMPROVEMENT AUTHORITY 14,090 135,736 31580 MOUNT LAUREL TWP MUN UTIL AUTH 1,674 16,125 31680 OCEAN GROVE BD OF FIRE COMM 14,049 135,336 31720 NJ SPORTS & EXPOSITION AUTH 1,626 15,662 32080 OCEAN TWP MUN UTIL AUTHORITY 3,318 31,965 32260 HUDSON CO COMMUNITY COLLEGE 5,000 48,169 32700 NJ INSTITUTE OF TECHNOLOGY 83,080 800,344 39990 COMPENSATION RATING & INS BUR 86,758 835,778 50050 ALLENTOWN BOROUGH 1,649 15,885 50130 AUDUBON BOROUGH 3,546 34,162 50830 EAST HANOVER TOWNSHIP 20,065 193,296 51750 LEBANON BOROUGH 1,595 15,362
Table E-3Local Employers ERI 2 Contribution Schedule
Consistent with established methodology, payment amounts calculated using a payment date 9 months after the valuation date. Present values as of July 1, 2019 exclude expected payments for fiscal year ending 2020.
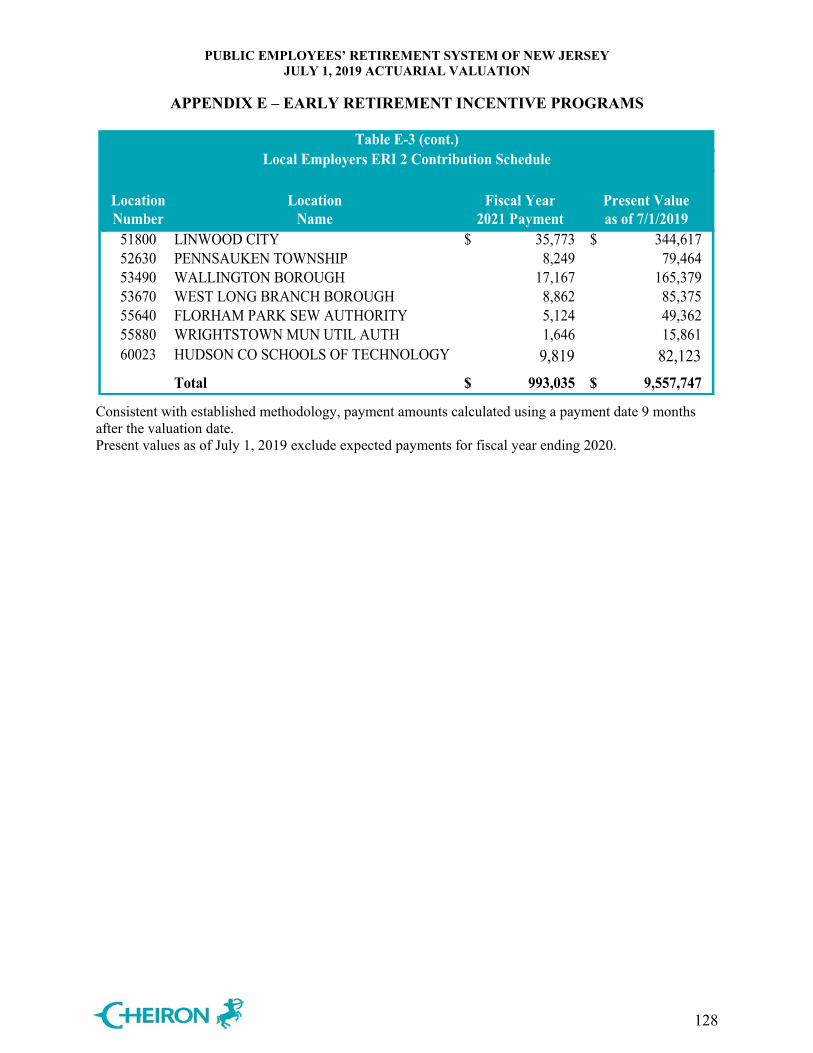
PUBLIC EMPLOYEES’ RETIREMENT SYSTEM OF NEW JERSEY JULY 1, 2019 ACTUARIAL VALUATION
APPENDIX E – EARLY RETIREMENT INCENTIVE PROGRAMS
128
Location Location Fiscal Year Present ValueNumber Name 2021 Payment as of 7/1/2019
51800 LINWOOD CITY 35,773$ 344,617$ 52630 PENNSAUKEN TOWNSHIP 8,249 79,464 53490 WALLINGTON BOROUGH 17,167 165,379 53670 WEST LONG BRANCH BOROUGH 8,862 85,375 55640 FLORHAM PARK SEW AUTHORITY 5,124 49,362 55880 WRIGHTSTOWN MUN UTIL AUTH 1,646 15,861 60023 HUDSON CO SCHOOLS OF TECHNOLOGY 9,819 82,123
Total 993,035$ 9,557,747$
Table E-3 (cont.)Local Employers ERI 2 Contribution Schedule
Consistent with established methodology, payment amounts calculated using a payment date 9 months after the valuation date. Present values as of July 1, 2019 exclude expected payments for fiscal year ending 2020.
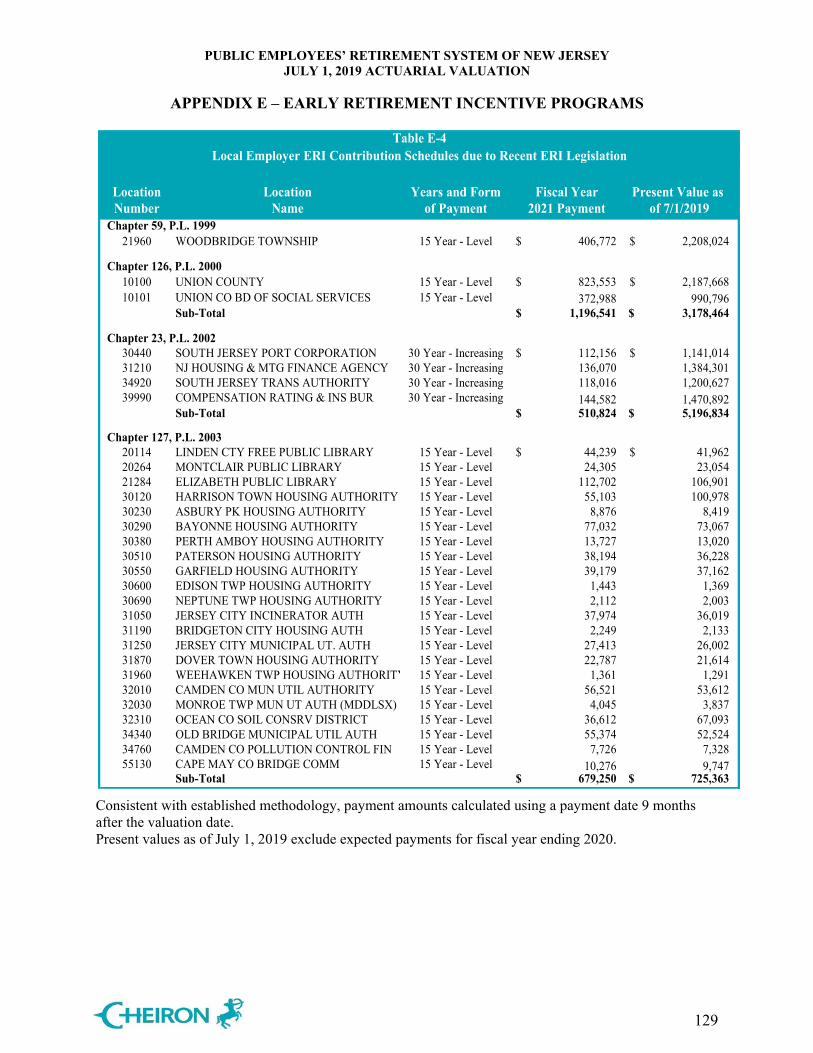
PUBLIC EMPLOYEES’ RETIREMENT SYSTEM OF NEW JERSEY JULY 1, 2019 ACTUARIAL VALUATION
APPENDIX E – EARLY RETIREMENT INCENTIVE PROGRAMS
129
Location Location Years and Form Fiscal Year Present Value as Number Name of Payment 2021 Payment of 7/1/2019
Chapter 59, P.L. 199921960 WOODBRIDGE TOWNSHIP 15 Year - Level 406,772$ 2,208,024$
Chapter 126, P.L. 200010100 UNION COUNTY 15 Year - Level 823,553$ 2,187,668$ 10101 UNION CO BD OF SOCIAL SERVICES 15 Year - Level 372,988 990,796
Sub-Total 1,196,541$ 3,178,464$
Chapter 23, P.L. 200230440 SOUTH JERSEY PORT CORPORATION 30 Year - Increasing 112,156$ 1,141,014$ 31210 NJ HOUSING & MTG FINANCE AGENCY 30 Year - Increasing 136,070 1,384,301 34920 SOUTH JERSEY TRANS AUTHORITY 30 Year - Increasing 118,016 1,200,627 39990 COMPENSATION RATING & INS BUR 30 Year - Increasing 144,582 1,470,892
Sub-Total 510,824$ 5,196,834$
Chapter 127, P.L. 200320114 LINDEN CTY FREE PUBLIC LIBRARY 15 Year - Level 44,239$ 41,962$ 20264 MONTCLAIR PUBLIC LIBRARY 15 Year - Level 24,305 23,054 21284 ELIZABETH PUBLIC LIBRARY 15 Year - Level 112,702 106,901 30120 HARRISON TOWN HOUSING AUTHORITY 15 Year - Level 55,103 100,978 30230 ASBURY PK HOUSING AUTHORITY 15 Year - Level 8,876 8,419 30290 BAYONNE HOUSING AUTHORITY 15 Year - Level 77,032 73,067 30380 PERTH AMBOY HOUSING AUTHORITY 15 Year - Level 13,727 13,020 30510 PATERSON HOUSING AUTHORITY 15 Year - Level 38,194 36,228 30550 GARFIELD HOUSING AUTHORITY 15 Year - Level 39,179 37,162 30600 EDISON TWP HOUSING AUTHORITY 15 Year - Level 1,443 1,369 30690 NEPTUNE TWP HOUSING AUTHORITY 15 Year - Level 2,112 2,003 31050 JERSEY CITY INCINERATOR AUTH 15 Year - Level 37,974 36,019 31190 BRIDGETON CITY HOUSING AUTH 15 Year - Level 2,249 2,133 31250 JERSEY CITY MUNICIPAL UT. AUTH 15 Year - Level 27,413 26,002 31870 DOVER TOWN HOUSING AUTHORITY 15 Year - Level 22,787 21,614 31960 WEEHAWKEN TWP HOUSING AUTHORITY 15 Year - Level 1,361 1,291 32010 CAMDEN CO MUN UTIL AUTHORITY 15 Year - Level 56,521 53,612 32030 MONROE TWP MUN UT AUTH (MDDLSX) 15 Year - Level 4,045 3,837 32310 OCEAN CO SOIL CONSRV DISTRICT 15 Year - Level 36,612 67,093 34340 OLD BRIDGE MUNICIPAL UTIL AUTH 15 Year - Level 55,374 52,524 34760 CAMDEN CO POLLUTION CONTROL FIN 15 Year - Level 7,726 7,328 55130 CAPE MAY CO BRIDGE COMM 15 Year - Level 10,276 9,747
Sub-Total 679,250$ 725,363$
Table E-4Local Employer ERI Contribution Schedules due to Recent ERI Legislation
Consistent with established methodology, payment amounts calculated using a payment date 9 months after the valuation date. Present values as of July 1, 2019 exclude expected payments for fiscal year ending 2020.
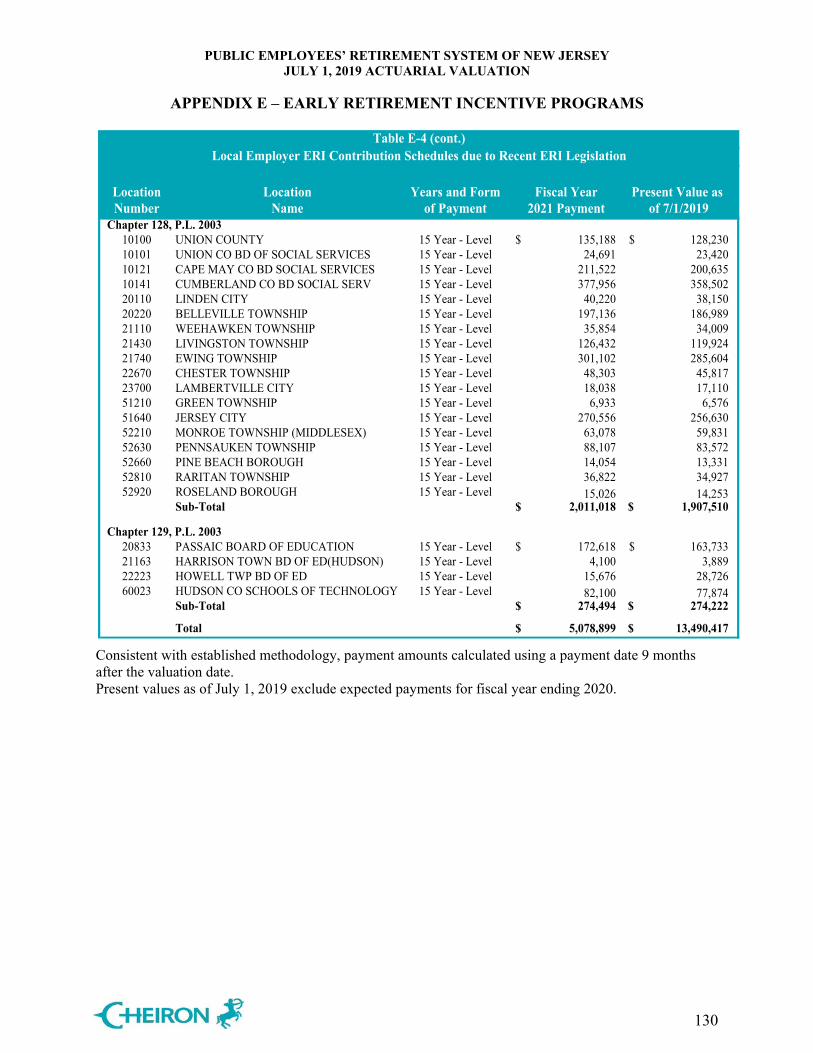
PUBLIC EMPLOYEES’ RETIREMENT SYSTEM OF NEW JERSEY JULY 1, 2019 ACTUARIAL VALUATION
APPENDIX E – EARLY RETIREMENT INCENTIVE PROGRAMS
130
Location Location Years and Form Fiscal Year Present Value as Number Name of Payment 2021 Payment of 7/1/2019
Chapter 128, P.L. 200310100 UNION COUNTY 15 Year - Level 135,188$ 128,230$ 10101 UNION CO BD OF SOCIAL SERVICES 15 Year - Level 24,691 23,420 10121 CAPE MAY CO BD SOCIAL SERVICES 15 Year - Level 211,522 200,635 10141 CUMBERLAND CO BD SOCIAL SERV 15 Year - Level 377,956 358,502 20110 LINDEN CITY 15 Year - Level 40,220 38,150 20220 BELLEVILLE TOWNSHIP 15 Year - Level 197,136 186,989 21110 WEEHAWKEN TOWNSHIP 15 Year - Level 35,854 34,009 21430 LIVINGSTON TOWNSHIP 15 Year - Level 126,432 119,924 21740 EWING TOWNSHIP 15 Year - Level 301,102 285,604 22670 CHESTER TOWNSHIP 15 Year - Level 48,303 45,817 23700 LAMBERTVILLE CITY 15 Year - Level 18,038 17,110 51210 GREEN TOWNSHIP 15 Year - Level 6,933 6,576 51640 JERSEY CITY 15 Year - Level 270,556 256,630 52210 MONROE TOWNSHIP (MIDDLESEX) 15 Year - Level 63,078 59,831 52630 PENNSAUKEN TOWNSHIP 15 Year - Level 88,107 83,572 52660 PINE BEACH BOROUGH 15 Year - Level 14,054 13,331 52810 RARITAN TOWNSHIP 15 Year - Level 36,822 34,927 52920 ROSELAND BOROUGH 15 Year - Level 15,026 14,253
Sub-Total 2,011,018$ 1,907,510$
Chapter 129, P.L. 200320833 PASSAIC BOARD OF EDUCATION 15 Year - Level 172,618$ 163,733$ 21163 HARRISON TOWN BD OF ED(HUDSON) 15 Year - Level 4,100 3,889 22223 HOWELL TWP BD OF ED 15 Year - Level 15,676 28,726 60023 HUDSON CO SCHOOLS OF TECHNOLOGY 15 Year - Level 82,100 77,874
Sub-Total 274,494$ 274,222$
Total 5,078,899$ 13,490,417$
Table E-4 (cont.)Local Employer ERI Contribution Schedules due to Recent ERI Legislation
Consistent with established methodology, payment amounts calculated using a payment date 9 months after the valuation date. Present values as of July 1, 2019 exclude expected payments for fiscal year ending 2020.
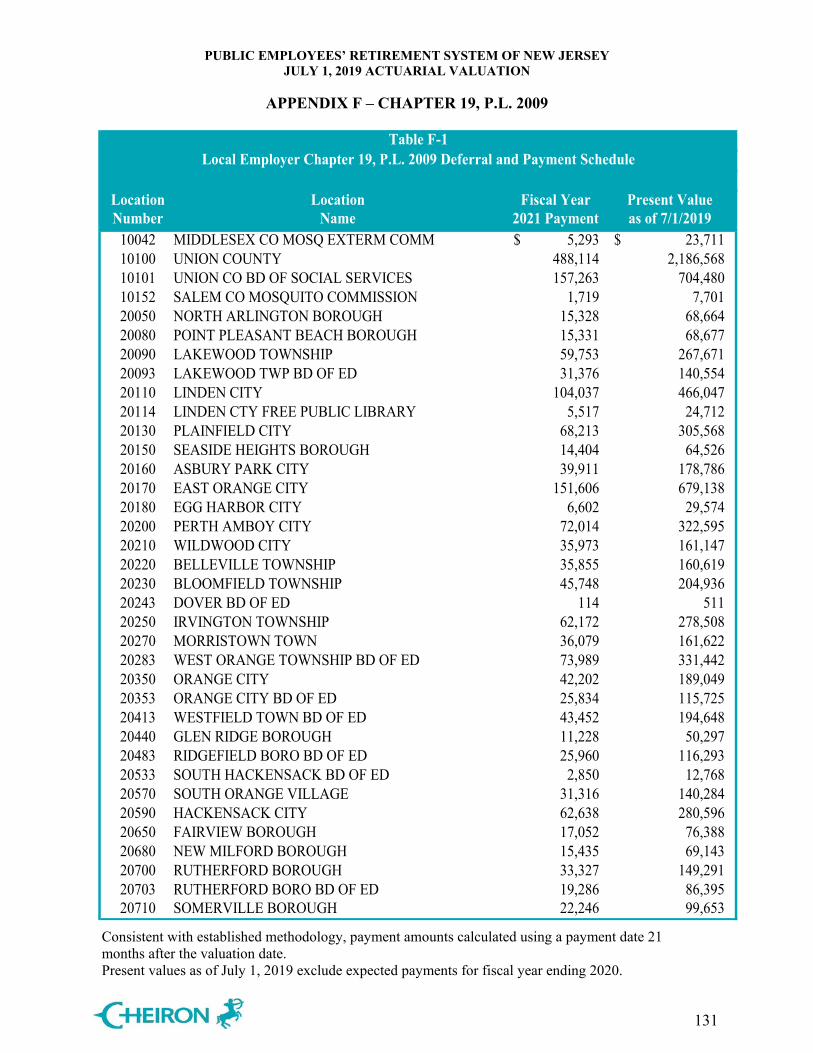
PUBLIC EMPLOYEES’ RETIREMENT SYSTEM OF NEW JERSEY JULY 1, 2019 ACTUARIAL VALUATION
APPENDIX F – CHAPTER 19, P.L. 2009
131
Location Location Fiscal Year Present ValueNumber Name 2021 Payment as of 7/1/2019
10042 MIDDLESEX CO MOSQ EXTERM COMM 5,293$ 23,711$ 10100 UNION COUNTY 488,114 2,186,568 10101 UNION CO BD OF SOCIAL SERVICES 157,263 704,480 10152 SALEM CO MOSQUITO COMMISSION 1,719 7,701 20050 NORTH ARLINGTON BOROUGH 15,328 68,664 20080 POINT PLEASANT BEACH BOROUGH 15,331 68,677 20090 LAKEWOOD TOWNSHIP 59,753 267,671 20093 LAKEWOOD TWP BD OF ED 31,376 140,554 20110 LINDEN CITY 104,037 466,047 20114 LINDEN CTY FREE PUBLIC LIBRARY 5,517 24,712 20130 PLAINFIELD CITY 68,213 305,568 20150 SEASIDE HEIGHTS BOROUGH 14,404 64,526 20160 ASBURY PARK CITY 39,911 178,786 20170 EAST ORANGE CITY 151,606 679,138 20180 EGG HARBOR CITY 6,602 29,574 20200 PERTH AMBOY CITY 72,014 322,595 20210 WILDWOOD CITY 35,973 161,147 20220 BELLEVILLE TOWNSHIP 35,855 160,619 20230 BLOOMFIELD TOWNSHIP 45,748 204,936 20243 DOVER BD OF ED 114 511 20250 IRVINGTON TOWNSHIP 62,172 278,508 20270 MORRISTOWN TOWN 36,079 161,622 20283 WEST ORANGE TOWNSHIP BD OF ED 73,989 331,442 20350 ORANGE CITY 42,202 189,049 20353 ORANGE CITY BD OF ED 25,834 115,725 20413 WESTFIELD TOWN BD OF ED 43,452 194,648 20440 GLEN RIDGE BOROUGH 11,228 50,297 20483 RIDGEFIELD BORO BD OF ED 25,960 116,293 20533 SOUTH HACKENSACK BD OF ED 2,850 12,768 20570 SOUTH ORANGE VILLAGE 31,316 140,284 20590 HACKENSACK CITY 62,638 280,596 20650 FAIRVIEW BOROUGH 17,052 76,388 20680 NEW MILFORD BOROUGH 15,435 69,143 20700 RUTHERFORD BOROUGH 33,327 149,291 20703 RUTHERFORD BORO BD OF ED 19,286 86,395 20710 SOMERVILLE BOROUGH 22,246 99,653
Table F-1Local Employer Chapter 19, P.L. 2009 Deferral and Payment Schedule
Consistent with established methodology, payment amounts calculated using a payment date 21 months after the valuation date. Present values as of July 1, 2019 exclude expected payments for fiscal year ending 2020.
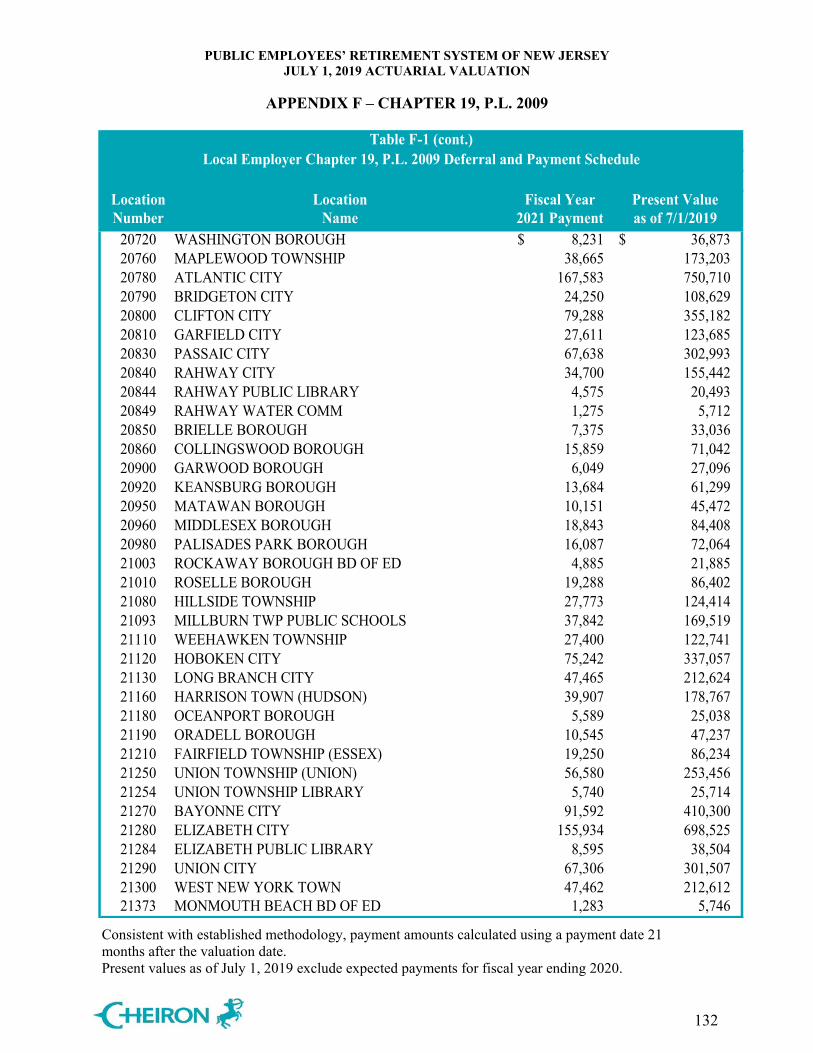
PUBLIC EMPLOYEES’ RETIREMENT SYSTEM OF NEW JERSEY JULY 1, 2019 ACTUARIAL VALUATION
APPENDIX F – CHAPTER 19, P.L. 2009
132
Location Location Fiscal Year Present ValueNumber Name 2021 Payment as of 7/1/2019
20720 WASHINGTON BOROUGH 8,231$ 36,873$ 20760 MAPLEWOOD TOWNSHIP 38,665 173,203 20780 ATLANTIC CITY 167,583 750,710 20790 BRIDGETON CITY 24,250 108,629 20800 CLIFTON CITY 79,288 355,182 20810 GARFIELD CITY 27,611 123,685 20830 PASSAIC CITY 67,638 302,993 20840 RAHWAY CITY 34,700 155,442 20844 RAHWAY PUBLIC LIBRARY 4,575 20,493 20849 RAHWAY WATER COMM 1,275 5,712 20850 BRIELLE BOROUGH 7,375 33,036 20860 COLLINGSWOOD BOROUGH 15,859 71,042 20900 GARWOOD BOROUGH 6,049 27,096 20920 KEANSBURG BOROUGH 13,684 61,299 20950 MATAWAN BOROUGH 10,151 45,472 20960 MIDDLESEX BOROUGH 18,843 84,408 20980 PALISADES PARK BOROUGH 16,087 72,064 21003 ROCKAWAY BOROUGH BD OF ED 4,885 21,885 21010 ROSELLE BOROUGH 19,288 86,402 21080 HILLSIDE TOWNSHIP 27,773 124,414 21093 MILLBURN TWP PUBLIC SCHOOLS 37,842 169,519 21110 WEEHAWKEN TOWNSHIP 27,400 122,741 21120 HOBOKEN CITY 75,242 337,057 21130 LONG BRANCH CITY 47,465 212,624 21160 HARRISON TOWN (HUDSON) 39,907 178,767 21180 OCEANPORT BOROUGH 5,589 25,038 21190 ORADELL BOROUGH 10,545 47,237 21210 FAIRFIELD TOWNSHIP (ESSEX) 19,250 86,234 21250 UNION TOWNSHIP (UNION) 56,580 253,456 21254 UNION TOWNSHIP LIBRARY 5,740 25,714 21270 BAYONNE CITY 91,592 410,300 21280 ELIZABETH CITY 155,934 698,525 21284 ELIZABETH PUBLIC LIBRARY 8,595 38,504 21290 UNION CITY 67,306 301,507 21300 WEST NEW YORK TOWN 47,462 212,612 21373 MONMOUTH BEACH BD OF ED 1,283 5,746
Table F-1 (cont.)Local Employer Chapter 19, P.L. 2009 Deferral and Payment Schedule
Consistent with established methodology, payment amounts calculated using a payment date 21 months after the valuation date. Present values as of July 1, 2019 exclude expected payments for fiscal year ending 2020.
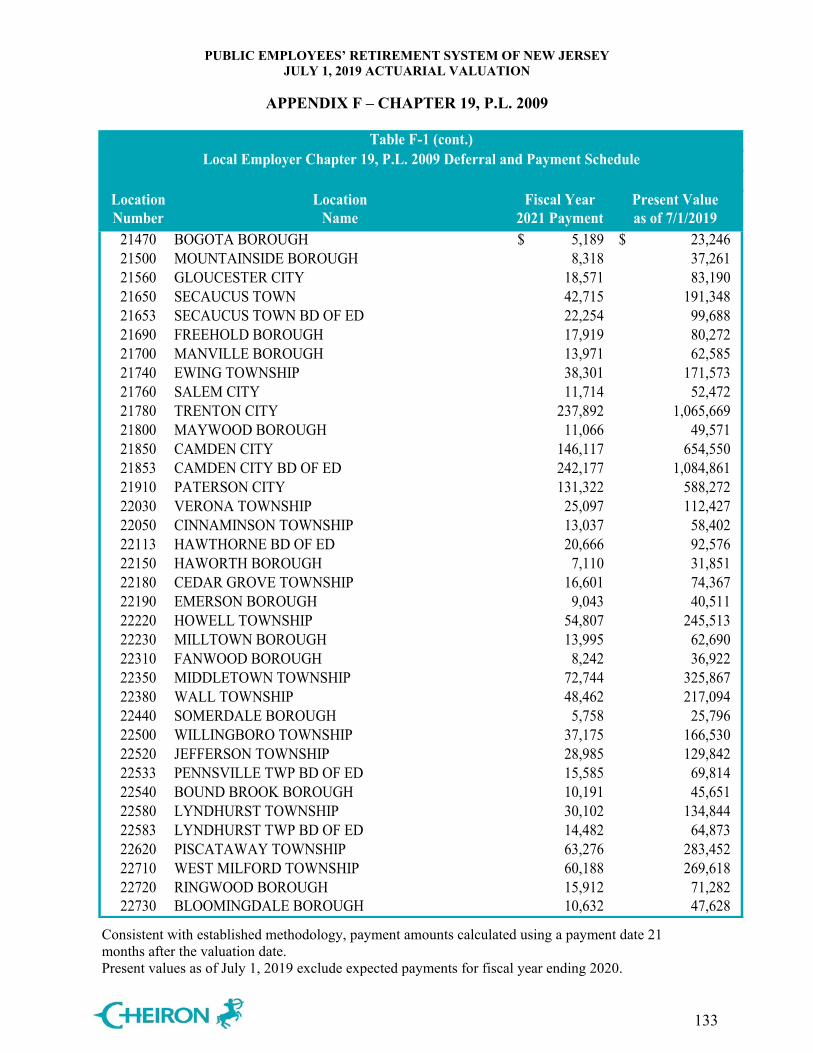
PUBLIC EMPLOYEES’ RETIREMENT SYSTEM OF NEW JERSEY JULY 1, 2019 ACTUARIAL VALUATION
APPENDIX F – CHAPTER 19, P.L. 2009
133
Location Location Fiscal Year Present ValueNumber Name 2021 Payment as of 7/1/2019
21470 BOGOTA BOROUGH 5,189$ 23,246$ 21500 MOUNTAINSIDE BOROUGH 8,318 37,261 21560 GLOUCESTER CITY 18,571 83,190 21650 SECAUCUS TOWN 42,715 191,348 21653 SECAUCUS TOWN BD OF ED 22,254 99,688 21690 FREEHOLD BOROUGH 17,919 80,272 21700 MANVILLE BOROUGH 13,971 62,585 21740 EWING TOWNSHIP 38,301 171,573 21760 SALEM CITY 11,714 52,472 21780 TRENTON CITY 237,892 1,065,669 21800 MAYWOOD BOROUGH 11,066 49,571 21850 CAMDEN CITY 146,117 654,550 21853 CAMDEN CITY BD OF ED 242,177 1,084,861 21910 PATERSON CITY 131,322 588,272 22030 VERONA TOWNSHIP 25,097 112,427 22050 CINNAMINSON TOWNSHIP 13,037 58,402 22113 HAWTHORNE BD OF ED 20,666 92,576 22150 HAWORTH BOROUGH 7,110 31,851 22180 CEDAR GROVE TOWNSHIP 16,601 74,367 22190 EMERSON BOROUGH 9,043 40,511 22220 HOWELL TOWNSHIP 54,807 245,513 22230 MILLTOWN BOROUGH 13,995 62,690 22310 FANWOOD BOROUGH 8,242 36,922 22350 MIDDLETOWN TOWNSHIP 72,744 325,867 22380 WALL TOWNSHIP 48,462 217,094 22440 SOMERDALE BOROUGH 5,758 25,796 22500 WILLINGBORO TOWNSHIP 37,175 166,530 22520 JEFFERSON TOWNSHIP 28,985 129,842 22533 PENNSVILLE TWP BD OF ED 15,585 69,814 22540 BOUND BROOK BOROUGH 10,191 45,651 22580 LYNDHURST TOWNSHIP 30,102 134,844 22583 LYNDHURST TWP BD OF ED 14,482 64,873 22620 PISCATAWAY TOWNSHIP 63,276 283,452 22710 WEST MILFORD TOWNSHIP 60,188 269,618 22720 RINGWOOD BOROUGH 15,912 71,282 22730 BLOOMINGDALE BOROUGH 10,632 47,628
Table F-1 (cont.)Local Employer Chapter 19, P.L. 2009 Deferral and Payment Schedule
Consistent with established methodology, payment amounts calculated using a payment date 21 months after the valuation date. Present values as of July 1, 2019 exclude expected payments for fiscal year ending 2020.
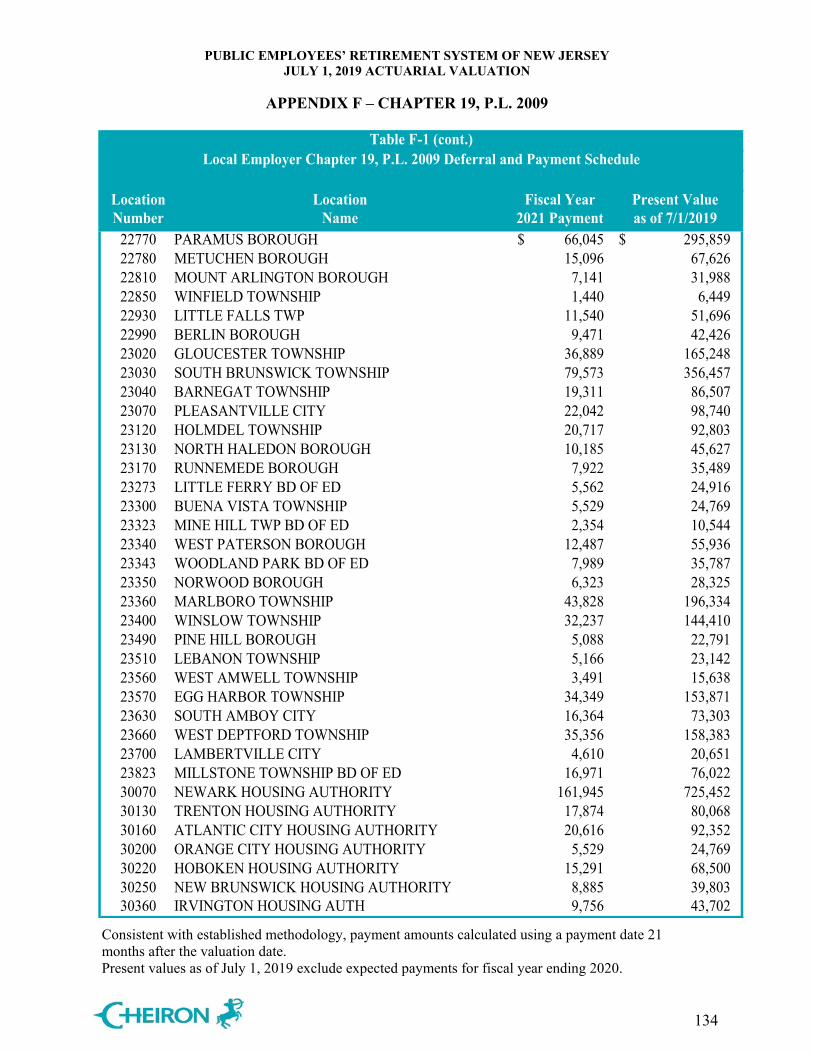
PUBLIC EMPLOYEES’ RETIREMENT SYSTEM OF NEW JERSEY JULY 1, 2019 ACTUARIAL VALUATION
APPENDIX F – CHAPTER 19, P.L. 2009
134
Location Location Fiscal Year Present ValueNumber Name 2021 Payment as of 7/1/2019
22770 PARAMUS BOROUGH 66,045$ 295,859$ 22780 METUCHEN BOROUGH 15,096 67,626 22810 MOUNT ARLINGTON BOROUGH 7,141 31,988 22850 WINFIELD TOWNSHIP 1,440 6,449 22930 LITTLE FALLS TWP 11,540 51,696 22990 BERLIN BOROUGH 9,471 42,426 23020 GLOUCESTER TOWNSHIP 36,889 165,248 23030 SOUTH BRUNSWICK TOWNSHIP 79,573 356,457 23040 BARNEGAT TOWNSHIP 19,311 86,507 23070 PLEASANTVILLE CITY 22,042 98,740 23120 HOLMDEL TOWNSHIP 20,717 92,803 23130 NORTH HALEDON BOROUGH 10,185 45,627 23170 RUNNEMEDE BOROUGH 7,922 35,489 23273 LITTLE FERRY BD OF ED 5,562 24,916 23300 BUENA VISTA TOWNSHIP 5,529 24,769 23323 MINE HILL TWP BD OF ED 2,354 10,544 23340 WEST PATERSON BOROUGH 12,487 55,936 23343 WOODLAND PARK BD OF ED 7,989 35,787 23350 NORWOOD BOROUGH 6,323 28,325 23360 MARLBORO TOWNSHIP 43,828 196,334 23400 WINSLOW TOWNSHIP 32,237 144,410 23490 PINE HILL BOROUGH 5,088 22,791 23510 LEBANON TOWNSHIP 5,166 23,142 23560 WEST AMWELL TOWNSHIP 3,491 15,638 23570 EGG HARBOR TOWNSHIP 34,349 153,871 23630 SOUTH AMBOY CITY 16,364 73,303 23660 WEST DEPTFORD TOWNSHIP 35,356 158,383 23700 LAMBERTVILLE CITY 4,610 20,651 23823 MILLSTONE TOWNSHIP BD OF ED 16,971 76,022 30070 NEWARK HOUSING AUTHORITY 161,945 725,452 30130 TRENTON HOUSING AUTHORITY 17,874 80,068 30160 ATLANTIC CITY HOUSING AUTHORITY 20,616 92,352 30200 ORANGE CITY HOUSING AUTHORITY 5,529 24,769 30220 HOBOKEN HOUSING AUTHORITY 15,291 68,500 30250 NEW BRUNSWICK HOUSING AUTHORITY 8,885 39,803 30360 IRVINGTON HOUSING AUTH 9,756 43,702
Table F-1 (cont.)Local Employer Chapter 19, P.L. 2009 Deferral and Payment Schedule
Consistent with established methodology, payment amounts calculated using a payment date 21 months after the valuation date. Present values as of July 1, 2019 exclude expected payments for fiscal year ending 2020.
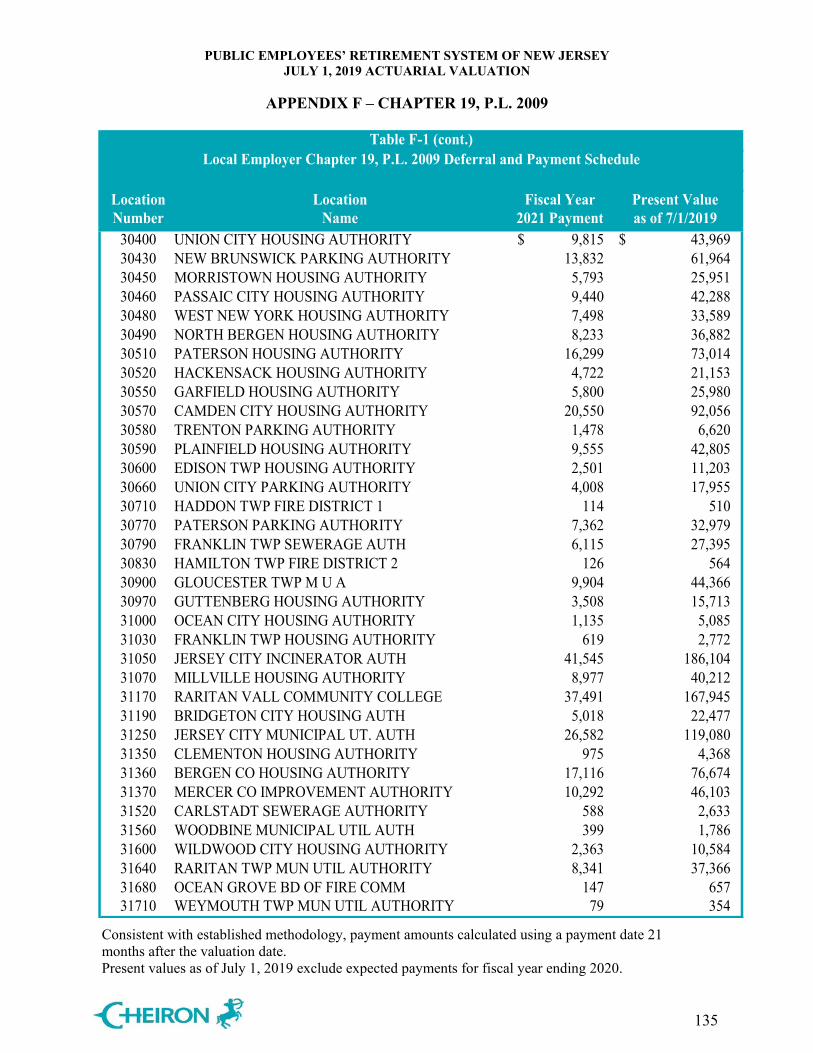
PUBLIC EMPLOYEES’ RETIREMENT SYSTEM OF NEW JERSEY JULY 1, 2019 ACTUARIAL VALUATION
APPENDIX F – CHAPTER 19, P.L. 2009
135
Location Location Fiscal Year Present ValueNumber Name 2021 Payment as of 7/1/2019
30400 UNION CITY HOUSING AUTHORITY 9,815$ 43,969$ 30430 NEW BRUNSWICK PARKING AUTHORITY 13,832 61,964 30450 MORRISTOWN HOUSING AUTHORITY 5,793 25,951 30460 PASSAIC CITY HOUSING AUTHORITY 9,440 42,288 30480 WEST NEW YORK HOUSING AUTHORITY 7,498 33,589 30490 NORTH BERGEN HOUSING AUTHORITY 8,233 36,882 30510 PATERSON HOUSING AUTHORITY 16,299 73,014 30520 HACKENSACK HOUSING AUTHORITY 4,722 21,153 30550 GARFIELD HOUSING AUTHORITY 5,800 25,980 30570 CAMDEN CITY HOUSING AUTHORITY 20,550 92,056 30580 TRENTON PARKING AUTHORITY 1,478 6,620 30590 PLAINFIELD HOUSING AUTHORITY 9,555 42,805 30600 EDISON TWP HOUSING AUTHORITY 2,501 11,203 30660 UNION CITY PARKING AUTHORITY 4,008 17,955 30710 HADDON TWP FIRE DISTRICT 1 114 510 30770 PATERSON PARKING AUTHORITY 7,362 32,979 30790 FRANKLIN TWP SEWERAGE AUTH 6,115 27,395 30830 HAMILTON TWP FIRE DISTRICT 2 126 564 30900 GLOUCESTER TWP M U A 9,904 44,366 30970 GUTTENBERG HOUSING AUTHORITY 3,508 15,713 31000 OCEAN CITY HOUSING AUTHORITY 1,135 5,085 31030 FRANKLIN TWP HOUSING AUTHORITY 619 2,772 31050 JERSEY CITY INCINERATOR AUTH 41,545 186,104 31070 MILLVILLE HOUSING AUTHORITY 8,977 40,212 31170 RARITAN VALL COMMUNITY COLLEGE 37,491 167,945 31190 BRIDGETON CITY HOUSING AUTH 5,018 22,477 31250 JERSEY CITY MUNICIPAL UT. AUTH 26,582 119,080 31350 CLEMENTON HOUSING AUTHORITY 975 4,368 31360 BERGEN CO HOUSING AUTHORITY 17,116 76,674 31370 MERCER CO IMPROVEMENT AUTHORITY 10,292 46,103 31520 CARLSTADT SEWERAGE AUTHORITY 588 2,633 31560 WOODBINE MUNICIPAL UTIL AUTH 399 1,786 31600 WILDWOOD CITY HOUSING AUTHORITY 2,363 10,584 31640 RARITAN TWP MUN UTIL AUTHORITY 8,341 37,366 31680 OCEAN GROVE BD OF FIRE COMM 147 657 31710 WEYMOUTH TWP MUN UTIL AUTHORITY 79 354
Table F-1 (cont.)Local Employer Chapter 19, P.L. 2009 Deferral and Payment Schedule
Consistent with established methodology, payment amounts calculated using a payment date 21 months after the valuation date. Present values as of July 1, 2019 exclude expected payments for fiscal year ending 2020.
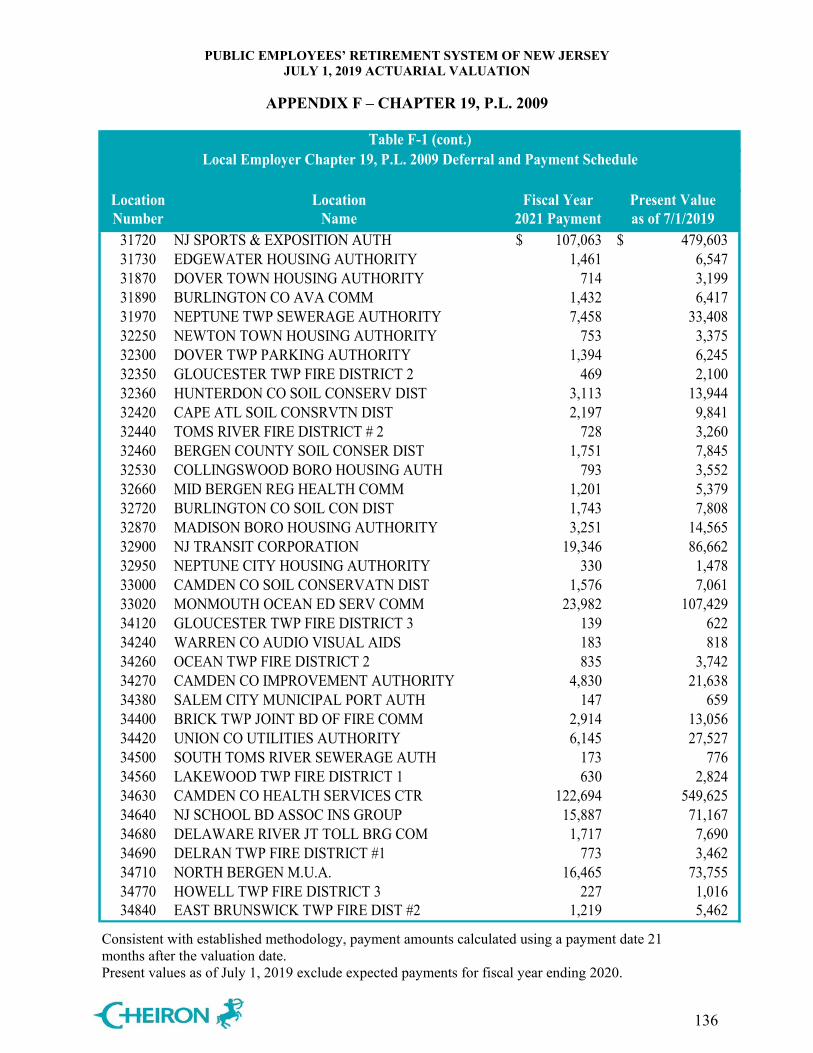
PUBLIC EMPLOYEES’ RETIREMENT SYSTEM OF NEW JERSEY JULY 1, 2019 ACTUARIAL VALUATION
APPENDIX F – CHAPTER 19, P.L. 2009
136
Location Location Fiscal Year Present ValueNumber Name 2021 Payment as of 7/1/2019
31720 NJ SPORTS & EXPOSITION AUTH 107,063$ 479,603$ 31730 EDGEWATER HOUSING AUTHORITY 1,461 6,547 31870 DOVER TOWN HOUSING AUTHORITY 714 3,199 31890 BURLINGTON CO AVA COMM 1,432 6,417 31970 NEPTUNE TWP SEWERAGE AUTHORITY 7,458 33,408 32250 NEWTON TOWN HOUSING AUTHORITY 753 3,375 32300 DOVER TWP PARKING AUTHORITY 1,394 6,245 32350 GLOUCESTER TWP FIRE DISTRICT 2 469 2,100 32360 HUNTERDON CO SOIL CONSERV DIST 3,113 13,944 32420 CAPE ATL SOIL CONSRVTN DIST 2,197 9,841 32440 TOMS RIVER FIRE DISTRICT # 2 728 3,260 32460 BERGEN COUNTY SOIL CONSER DIST 1,751 7,845 32530 COLLINGSWOOD BORO HOUSING AUTH 793 3,552 32660 MID BERGEN REG HEALTH COMM 1,201 5,379 32720 BURLINGTON CO SOIL CON DIST 1,743 7,808 32870 MADISON BORO HOUSING AUTHORITY 3,251 14,565 32900 NJ TRANSIT CORPORATION 19,346 86,662 32950 NEPTUNE CITY HOUSING AUTHORITY 330 1,478 33000 CAMDEN CO SOIL CONSERVATN DIST 1,576 7,061 33020 MONMOUTH OCEAN ED SERV COMM 23,982 107,429 34120 GLOUCESTER TWP FIRE DISTRICT 3 139 622 34240 WARREN CO AUDIO VISUAL AIDS 183 818 34260 OCEAN TWP FIRE DISTRICT 2 835 3,742 34270 CAMDEN CO IMPROVEMENT AUTHORITY 4,830 21,638 34380 SALEM CITY MUNICIPAL PORT AUTH 147 659 34400 BRICK TWP JOINT BD OF FIRE COMM 2,914 13,056 34420 UNION CO UTILITIES AUTHORITY 6,145 27,527 34500 SOUTH TOMS RIVER SEWERAGE AUTH 173 776 34560 LAKEWOOD TWP FIRE DISTRICT 1 630 2,824 34630 CAMDEN CO HEALTH SERVICES CTR 122,694 549,625 34640 NJ SCHOOL BD ASSOC INS GROUP 15,887 71,167 34680 DELAWARE RIVER JT TOLL BRG COM 1,717 7,690 34690 DELRAN TWP FIRE DISTRICT #1 773 3,462 34710 NORTH BERGEN M.U.A. 16,465 73,755 34770 HOWELL TWP FIRE DISTRICT 3 227 1,016 34840 EAST BRUNSWICK TWP FIRE DIST #2 1,219 5,462
Local Employer Chapter 19, P.L. 2009 Deferral and Payment ScheduleTable F-1 (cont.)
Consistent with established methodology, payment amounts calculated using a payment date 21 months after the valuation date. Present values as of July 1, 2019 exclude expected payments for fiscal year ending 2020.
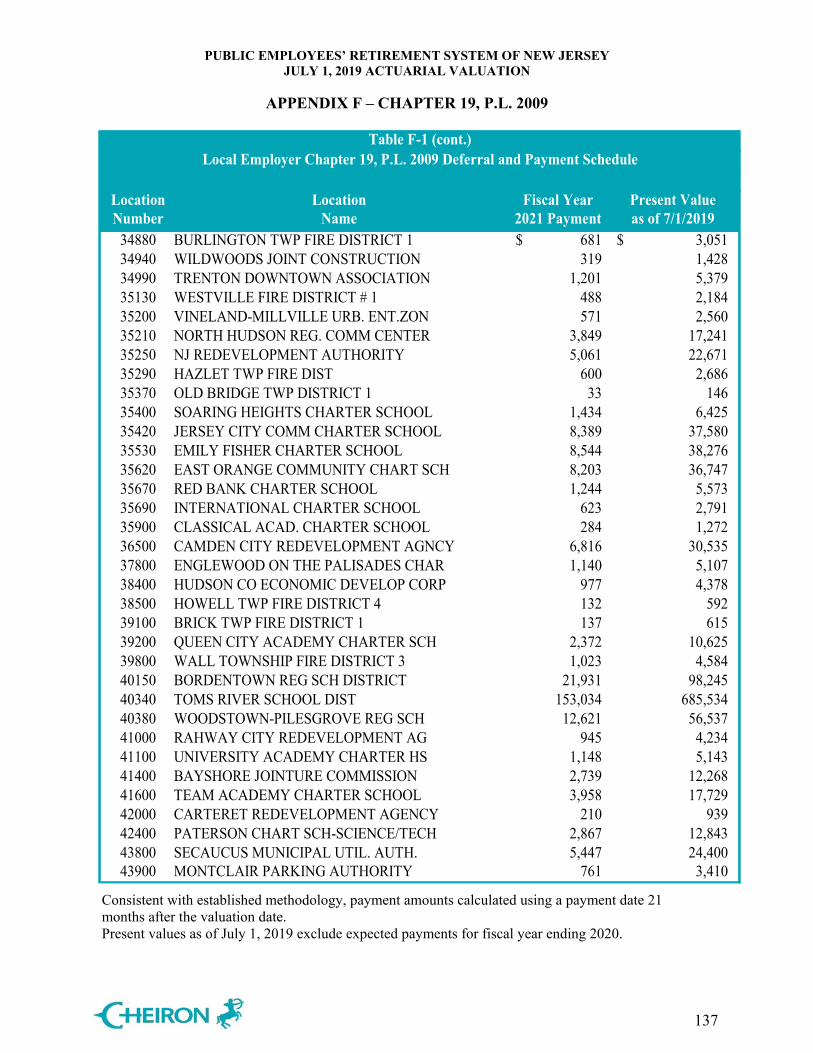
PUBLIC EMPLOYEES’ RETIREMENT SYSTEM OF NEW JERSEY JULY 1, 2019 ACTUARIAL VALUATION
APPENDIX F – CHAPTER 19, P.L. 2009
137
Location Location Fiscal Year Present ValueNumber Name 2021 Payment as of 7/1/2019
34880 BURLINGTON TWP FIRE DISTRICT 1 681$ 3,051$ 34940 WILDWOODS JOINT CONSTRUCTION 319 1,428 34990 TRENTON DOWNTOWN ASSOCIATION 1,201 5,379 35130 WESTVILLE FIRE DISTRICT # 1 488 2,184 35200 VINELAND-MILLVILLE URB. ENT.ZON 571 2,560 35210 NORTH HUDSON REG. COMM CENTER 3,849 17,241 35250 NJ REDEVELOPMENT AUTHORITY 5,061 22,671 35290 HAZLET TWP FIRE DIST 600 2,686 35370 OLD BRIDGE TWP DISTRICT 1 33 146 35400 SOARING HEIGHTS CHARTER SCHOOL 1,434 6,425 35420 JERSEY CITY COMM CHARTER SCHOOL 8,389 37,580 35530 EMILY FISHER CHARTER SCHOOL 8,544 38,276 35620 EAST ORANGE COMMUNITY CHART SCH 8,203 36,747 35670 RED BANK CHARTER SCHOOL 1,244 5,573 35690 INTERNATIONAL CHARTER SCHOOL 623 2,791 35900 CLASSICAL ACAD. CHARTER SCHOOL 284 1,272 36500 CAMDEN CITY REDEVELOPMENT AGNCY 6,816 30,535 37800 ENGLEWOOD ON THE PALISADES CHAR 1,140 5,107 38400 HUDSON CO ECONOMIC DEVELOP CORP 977 4,378 38500 HOWELL TWP FIRE DISTRICT 4 132 592 39100 BRICK TWP FIRE DISTRICT 1 137 615 39200 QUEEN CITY ACADEMY CHARTER SCH 2,372 10,625 39800 WALL TOWNSHIP FIRE DISTRICT 3 1,023 4,584 40150 BORDENTOWN REG SCH DISTRICT 21,931 98,245 40340 TOMS RIVER SCHOOL DIST 153,034 685,534 40380 WOODSTOWN-PILESGROVE REG SCH 12,621 56,537 41000 RAHWAY CITY REDEVELOPMENT AG 945 4,234 41100 UNIVERSITY ACADEMY CHARTER HS 1,148 5,143 41400 BAYSHORE JOINTURE COMMISSION 2,739 12,268 41600 TEAM ACADEMY CHARTER SCHOOL 3,958 17,729 42000 CARTERET REDEVELOPMENT AGENCY 210 939 42400 PATERSON CHART SCH-SCIENCE/TECH 2,867 12,843 43800 SECAUCUS MUNICIPAL UTIL. AUTH. 5,447 24,400 43900 MONTCLAIR PARKING AUTHORITY 761 3,410
Table F-1 (cont.)Local Employer Chapter 19, P.L. 2009 Deferral and Payment Schedule
Consistent with established methodology, payment amounts calculated using a payment date 21 months after the valuation date. Present values as of July 1, 2019 exclude expected payments for fiscal year ending 2020.
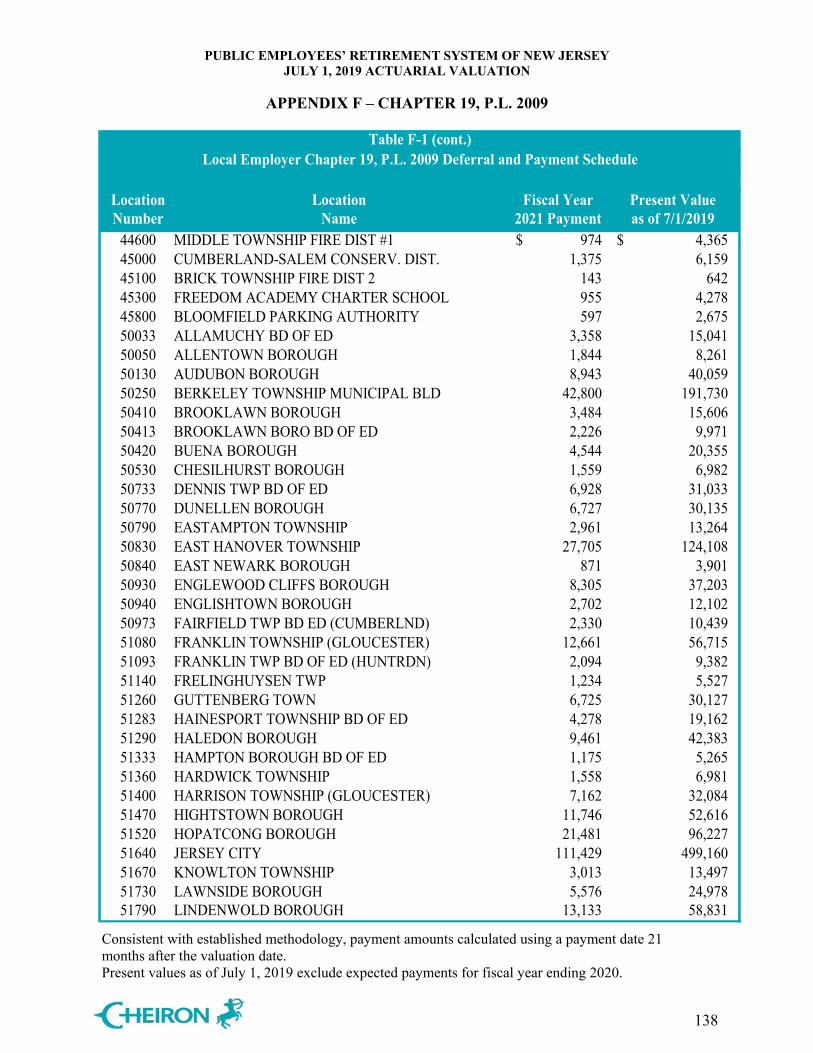
PUBLIC EMPLOYEES’ RETIREMENT SYSTEM OF NEW JERSEY JULY 1, 2019 ACTUARIAL VALUATION
APPENDIX F – CHAPTER 19, P.L. 2009
138
Location Location Fiscal Year Present ValueNumber Name 2021 Payment as of 7/1/2019
44600 MIDDLE TOWNSHIP FIRE DIST #1 974$ 4,365$ 45000 CUMBERLAND-SALEM CONSERV. DIST. 1,375 6,159 45100 BRICK TOWNSHIP FIRE DIST 2 143 642 45300 FREEDOM ACADEMY CHARTER SCHOOL 955 4,278 45800 BLOOMFIELD PARKING AUTHORITY 597 2,675 50033 ALLAMUCHY BD OF ED 3,358 15,041 50050 ALLENTOWN BOROUGH 1,844 8,261 50130 AUDUBON BOROUGH 8,943 40,059 50250 BERKELEY TOWNSHIP MUNICIPAL BLD 42,800 191,730 50410 BROOKLAWN BOROUGH 3,484 15,606 50413 BROOKLAWN BORO BD OF ED 2,226 9,971 50420 BUENA BOROUGH 4,544 20,355 50530 CHESILHURST BOROUGH 1,559 6,982 50733 DENNIS TWP BD OF ED 6,928 31,033 50770 DUNELLEN BOROUGH 6,727 30,135 50790 EASTAMPTON TOWNSHIP 2,961 13,264 50830 EAST HANOVER TOWNSHIP 27,705 124,108 50840 EAST NEWARK BOROUGH 871 3,901 50930 ENGLEWOOD CLIFFS BOROUGH 8,305 37,203 50940 ENGLISHTOWN BOROUGH 2,702 12,102 50973 FAIRFIELD TWP BD ED (CUMBERLND) 2,330 10,439 51080 FRANKLIN TOWNSHIP (GLOUCESTER) 12,661 56,715 51093 FRANKLIN TWP BD OF ED (HUNTRDN) 2,094 9,382 51140 FRELINGHUYSEN TWP 1,234 5,527 51260 GUTTENBERG TOWN 6,725 30,127 51283 HAINESPORT TOWNSHIP BD OF ED 4,278 19,162 51290 HALEDON BOROUGH 9,461 42,383 51333 HAMPTON BOROUGH BD OF ED 1,175 5,265 51360 HARDWICK TOWNSHIP 1,558 6,981 51400 HARRISON TOWNSHIP (GLOUCESTER) 7,162 32,084 51470 HIGHTSTOWN BOROUGH 11,746 52,616 51520 HOPATCONG BOROUGH 21,481 96,227 51640 JERSEY CITY 111,429 499,160 51670 KNOWLTON TOWNSHIP 3,013 13,497 51730 LAWNSIDE BOROUGH 5,576 24,978 51790 LINDENWOLD BOROUGH 13,133 58,831
Table F-1 (cont.)Local Employer Chapter 19, P.L. 2009 Deferral and Payment Schedule
Consistent with established methodology, payment amounts calculated using a payment date 21 months after the valuation date. Present values as of July 1, 2019 exclude expected payments for fiscal year ending 2020.
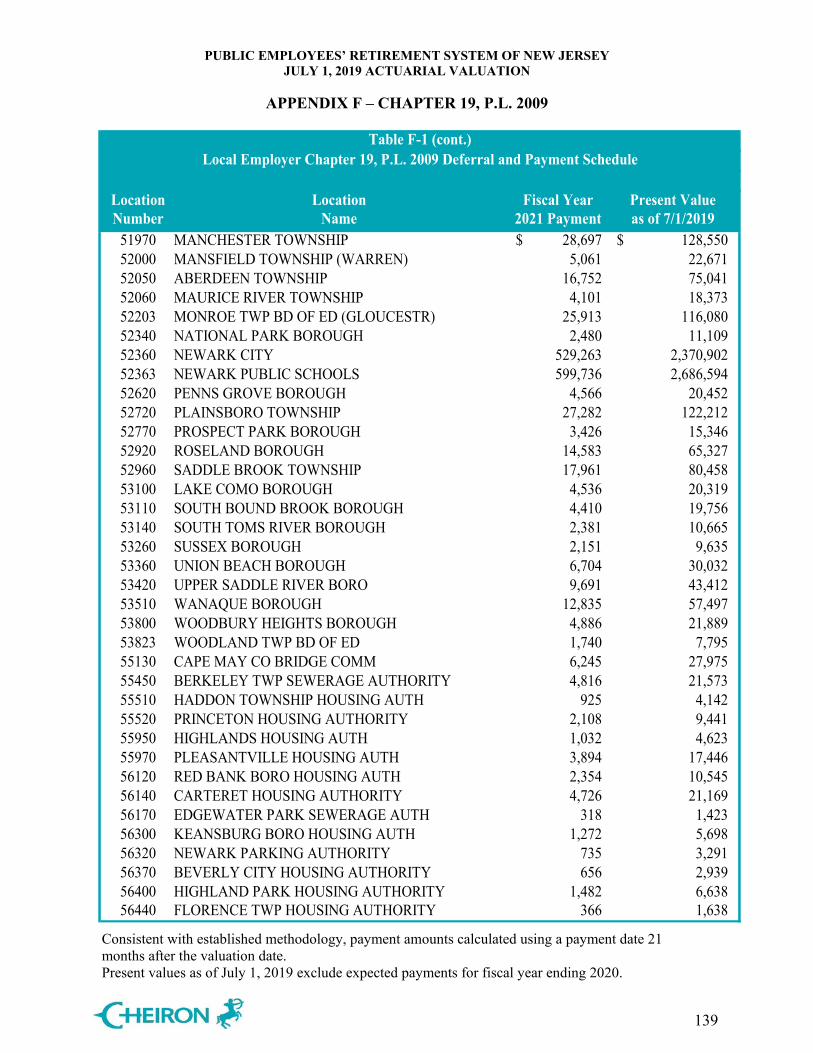
PUBLIC EMPLOYEES’ RETIREMENT SYSTEM OF NEW JERSEY JULY 1, 2019 ACTUARIAL VALUATION
APPENDIX F – CHAPTER 19, P.L. 2009
139
Location Location Fiscal Year Present ValueNumber Name 2021 Payment as of 7/1/2019
51970 MANCHESTER TOWNSHIP 28,697$ 128,550$ 52000 MANSFIELD TOWNSHIP (WARREN) 5,061 22,671 52050 ABERDEEN TOWNSHIP 16,752 75,041 52060 MAURICE RIVER TOWNSHIP 4,101 18,373 52203 MONROE TWP BD OF ED (GLOUCESTR) 25,913 116,080 52340 NATIONAL PARK BOROUGH 2,480 11,109 52360 NEWARK CITY 529,263 2,370,902 52363 NEWARK PUBLIC SCHOOLS 599,736 2,686,594 52620 PENNS GROVE BOROUGH 4,566 20,452 52720 PLAINSBORO TOWNSHIP 27,282 122,212 52770 PROSPECT PARK BOROUGH 3,426 15,346 52920 ROSELAND BOROUGH 14,583 65,327 52960 SADDLE BROOK TOWNSHIP 17,961 80,458 53100 LAKE COMO BOROUGH 4,536 20,319 53110 SOUTH BOUND BROOK BOROUGH 4,410 19,756 53140 SOUTH TOMS RIVER BOROUGH 2,381 10,665 53260 SUSSEX BOROUGH 2,151 9,635 53360 UNION BEACH BOROUGH 6,704 30,032 53420 UPPER SADDLE RIVER BORO 9,691 43,412 53510 WANAQUE BOROUGH 12,835 57,497 53800 WOODBURY HEIGHTS BOROUGH 4,886 21,889 53823 WOODLAND TWP BD OF ED 1,740 7,795 55130 CAPE MAY CO BRIDGE COMM 6,245 27,975 55450 BERKELEY TWP SEWERAGE AUTHORITY 4,816 21,573 55510 HADDON TOWNSHIP HOUSING AUTH 925 4,142 55520 PRINCETON HOUSING AUTHORITY 2,108 9,441 55950 HIGHLANDS HOUSING AUTH 1,032 4,623 55970 PLEASANTVILLE HOUSING AUTH 3,894 17,446 56120 RED BANK BORO HOUSING AUTH 2,354 10,545 56140 CARTERET HOUSING AUTHORITY 4,726 21,169 56170 EDGEWATER PARK SEWERAGE AUTH 318 1,423 56300 KEANSBURG BORO HOUSING AUTH 1,272 5,698 56320 NEWARK PARKING AUTHORITY 735 3,291 56370 BEVERLY CITY HOUSING AUTHORITY 656 2,939 56400 HIGHLAND PARK HOUSING AUTHORITY 1,482 6,638 56440 FLORENCE TWP HOUSING AUTHORITY 366 1,638
Table F-1 (cont.)Local Employer Chapter 19, P.L. 2009 Deferral and Payment Schedule
Consistent with established methodology, payment amounts calculated using a payment date 21 months after the valuation date. Present values as of July 1, 2019 exclude expected payments for fiscal year ending 2020.
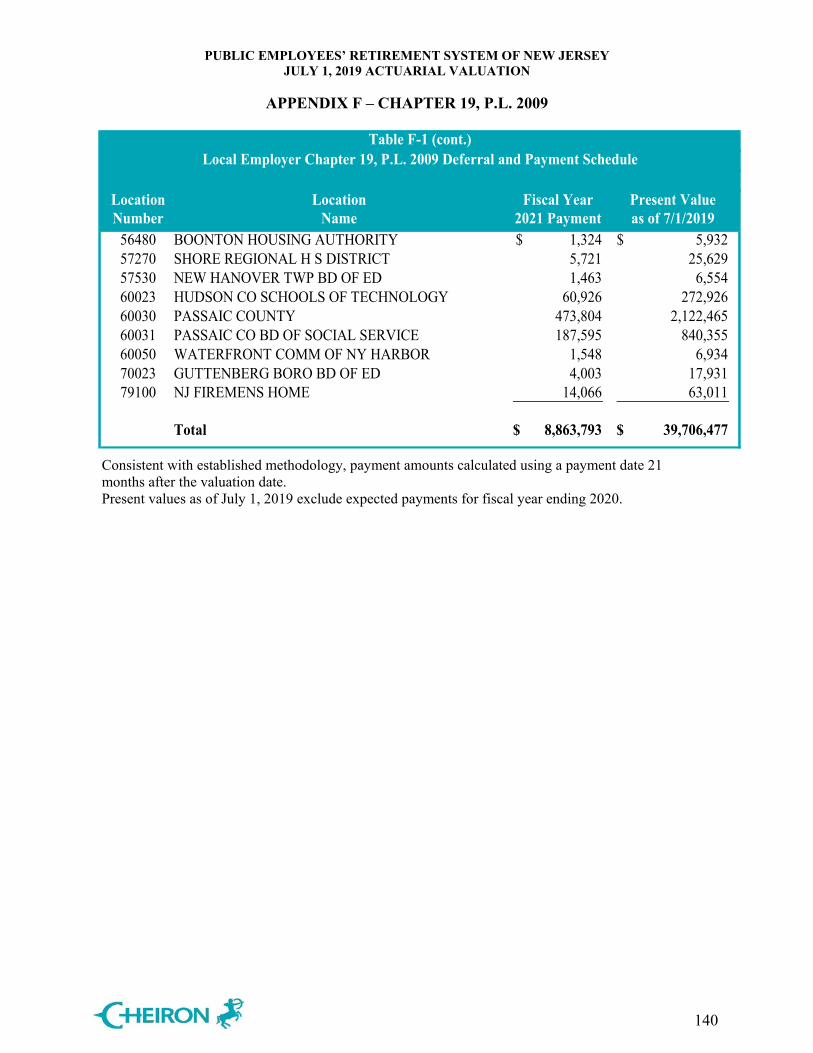
PUBLIC EMPLOYEES’ RETIREMENT SYSTEM OF NEW JERSEY JULY 1, 2019 ACTUARIAL VALUATION
APPENDIX F – CHAPTER 19, P.L. 2009
140
Location Location Fiscal Year Present ValueNumber Name 2021 Payment as of 7/1/2019
56480 BOONTON HOUSING AUTHORITY 1,324$ 5,932$ 57270 SHORE REGIONAL H S DISTRICT 5,721 25,629 57530 NEW HANOVER TWP BD OF ED 1,463 6,554 60023 HUDSON CO SCHOOLS OF TECHNOLOGY 60,926 272,926 60030 PASSAIC COUNTY 473,804 2,122,465 60031 PASSAIC CO BD OF SOCIAL SERVICE 187,595 840,355 60050 WATERFRONT COMM OF NY HARBOR 1,548 6,934 70023 GUTTENBERG BORO BD OF ED 4,003 17,931 79100 NJ FIREMENS HOME 14,066 63,011
Total 8,863,793$ 39,706,477$
Table F-1 (cont.)Local Employer Chapter 19, P.L. 2009 Deferral and Payment Schedule
Consistent with established methodology, payment amounts calculated using a payment date 21 months after the valuation date. Present values as of July 1, 2019 exclude expected payments for fiscal year ending 2020.
PUBLIC EMPLOYEES’ RETIREMENT SYSTEM OF NEW JERSEY JULY 1, 2019 ACTUARIAL VALUATION
APPENDIX G – GLOSSARY OF TERMS
141
1. Actuarial Assumptions Assumptions as to the occurrence of future events affecting pension costs, such as: mortality,
withdrawal, disability, and retirement; changes in compensation; inflation; rates of investment earnings, and asset appreciation or depreciation; and other relevant items.
2. Actuarial Cost Method A procedure for determining the Actuarial Present Value of pension plan benefits and
expenses and for developing an allocation of such value to each year of service, usually in the form of a Normal Cost and an Actuarial Liability.
3. Actuarial Gain/(Loss) A measure of the difference between actual experience and that expected based upon a set of
Actuarial Assumptions during the period between two Actuarial Valuation dates, as determined in accordance with a particular Actuarial Cost Method.
4. Actuarial Liability The portion of the Actuarial Present Value of Projected Benefits which will not be paid by
future Normal Costs. It represents the value of the past Normal Costs with interest to the valuation date.
5. Actuarial Present Value (Present Value) The value as of a given date of a future amount or series of payments. The Actuarial Present
Value discounts the payments to the given date at the assumed investment return and includes the probability of the payment being made. As a simple example: assume you owe $100 to a friend one year from now. Also, assume there is a 1% probability of your friend dying over the next year, in which case you won’t be obligated to pay him. If the assumed investment return is 10%, the actuarial present value is:
Amount Probability of Payment
1/(1+Investment Return)
$100 x (1 - .01) x 1/(1+.1) = $90 6. Actuarial Valuation The determination, as of a specified date, of the Normal Cost, Actuarial Liability, Actuarial
Value of Assets, and related Actuarial Present Values for a pension plan.
PUBLIC EMPLOYEES’ RETIREMENT SYSTEM OF NEW JERSEY JULY 1, 2019 ACTUARIAL VALUATION
APPENDIX G – GLOSSARY OF TERMS
142
7. Actuarial Value of Assets The value of cash, investments and other property belonging to a pension plan as used by the
actuary for the purpose of an Actuarial Valuation. The purpose of an Actuarial Value of Assets is to smooth out fluctuations in market values. This way long-term costs are not distorted by short-term fluctuations in the market.
8. Actuarially Equivalent Of equal Actuarial Present Value, determined as of a given date with each value based on the
same set of Actuarial Assumptions. 9. Amortization Payment
The portion of the pension plan contribution which is designed to pay interest and principal
on the Unfunded Actuarial Liability in order to pay for that liability in a given number of years.
10. Funded Ratio The ratio of the Actuarial Value of Assets to the Actuarial Liabilities. 11. Investment Return Assumption The assumed interest rate used for projecting dollar related values in the future. 12. Mortality Table A set of percentages which estimate the probability of death at a particular point in time.
Typically, the rates are annual and based on age and sex. 13. Normal Cost That portion of the Actuarial Present Value of pension plan benefits and expenses, which is
allocated to a valuation year by the Actuarial Cost Method. 14. Projected Benefits Those pension plan benefit amounts which are expected to be paid in the future under a
particular set of Actuarial Assumptions, taking into account such items as the effect of advancement in age and increases in future compensation and service credits.
PUBLIC EMPLOYEES’ RETIREMENT SYSTEM OF NEW JERSEY JULY 1, 2019 ACTUARIAL VALUATION
APPENDIX G – GLOSSARY OF TERMS
143
15. Projected Unit Credit Cost Method A method under which the Actuarial Liability is calculated as the Actuarial Present Value of the Projected Benefits allocated to periods prior to the valuation year.
16. Unfunded Actuarial Liability The excess of the Actuarial Liability over the Actuarial Value of Assets.