Embed Size (px)
Citation preview
30 June 2015 NLWA-00-SU-PP-0002 / Rev 0 Page 1
POSITION PAPER
30 June 2015
NorthLink WA – Hydrogeological PER Considerations – Groundwater Level Impact from Construction Dewatering and Groundwater Abstraction
NLWA-00-HY-PP-0002
Prepared by: A Lundorf
Reviewed by: D Stewart
1 INTRODUCTION
This position paper presents the results of a hydrogeological assessment undertaken to address review comments from the Office of the Environmental Protection Authority (OEPA) on the NorthLink WA draft Public Environment Review (PER) document (NLWA-00-EN-RP-0025).
The PER identified the need for temporary dewatering and abstraction of groundwater which could impact groundwater dependent ecosystems (i.e. wetlands).
The comments provided by OEPA in response to the PER discussion on groundwater are provided in italics below.
Dewatering activities and groundwater abstraction
The OEPA notes that a detailed investigation of dewatering requirements has not yet been undertaken. However it is unclear as to how the potential impacts from dewatering and groundwater abstraction have been addressed in the PER. Information on dewatering activities and groundwater abstraction during construction, including the location of where the dewatering activities are likely to occur and the location of the current abstraction bores and proposed bores (if required) in relation to the proximity to environmentally sensitive receptors should be included in the PER. The PER should also include an assessment of any potential impacts as a result of these activities to environmentally sensitive receptors.
To address the above comment separate assessments have been carried out for:
Construction dewatering requirements for structures; and
Groundwater Abstraction for construction water use.
2 GEOLOGY
The project alignment was initially divided into three geological domains based on the results of a geotechnical and hydrogeological desk study (NorthLink WA 2015a):
30 June 2015 NLWA-00-SU-PP-0002 / Rev 0 Page 2
Geological Domain 1 covers the southern portion of the alignment up to about CH119000. Prior to any intrusive site investigation, the subsurface conditions were expected to comprise mainly deposits of Bassendean Sand.
Geological Domain 2 extends between about CH119000 and CH131000. Prior to any intrusive site investigation, the subsurface conditions were expected to comprise variable thicknesses of Bassendean Sand overlying and interfingering with the Guildford Formation.
Geological Domain 3 extends north of CH131000. Prior to any intrusive site investigation, the subsurface conditions were expected to largely comprise clay and pebbly silt of the Guildford Formation with some zones of thin Bassendean Sand in isolated pockets.
A significant geotechnical and hydrogeological site investigation has now been completed as part of the NorthLink WA project. The study included drilling and installation of monitoring wells and single well hydraulic (slug) testing. The well installations were concentrated at the interchanges along the alignment. The investigation indicated:
Geological Domains 1 and 2 were found to have similar composition with Bassendean Sand overlying sandy Guildford Formation.
Geological Domain 3 was found, as expected, to consist mainly of clay and sand-dominated Guildford Formation underlying either a thin layer of Bassendean Sand or colluvial sand. The clay-dominated Guildford Formation was generally found to exist above the sand-dominated Guildford Formation.
The results of the geotechnical and hydrogeological study are presented in NorthLink WA (2015b to 2015h).
3 HYDROGEOLOGY
The Superficial Aquifer along the alignment consists of the Bassendean Sand and Guildford Formation. Based on the field investigation results and Davidson (1995) the thickness of the Superficial Aquifer in Geological Domains 1 & 2 ranges between 20 m and 50 with an average of approximately 35 m. The Superficial Aquifer in Geological Domain 3 ranges in thickness between 10 m and 30 m with an average of approximately 15 m.
The hydraulic conductivity was confirmed through hydraulic testing carried out in the field. This testing indicated that hydraulic conductivity of the Bassendean Sand ranges between 10 m/d and 50 m/d while the Guildford Formation ranges between 0.01 m/d (clay) and 10 m/d (sand) (NorthLink WA, 2015f and 2105g).
The Superficial Aquifer is unconfined in Geological Domains 1 & 2 and confined in Geological Domain 3, with the clayey Guildford Formation being the confining unit. According to literature, the specific yield for Bassendean Sand and sandy Guildford Formation is 0.25 and 0.1, respectively (DoW, 2009) while the storage coefficient for the confined aquifer is estimated to be 1 x 10⁻³.
4 CONSTRUCTION DEWATERING REQUIREMENTS
4.1 Dewatering Requirements
It has been identified that construction dewatering could be required during the construction of the bridge footings with dewatering estimated to be required to about 1.5 m below the top of the adjacent pavement at the location of the structures.

30 June 2015 NLWA-00-SU-PP-0002 / Rev 0 Page 3
Table 1 presents the estimated dewatering requirements at 22 locations where bridge footings are required to be constructed. The results shown in Table 1 indicate that only 8 of the 22 locations are likely to require limited dewatering during the wet season, with a required drawdown ranging between 0.1 m and 0.9 m, while no locations would require dewatering if footing construction was undertaken in the dry season.
Table 1: Estimated Dewatering Requirements at 22 Structures
Location Chainage
Required Dewatering
Level (m AHD)
Estimated Wet Season
Groundwater Level *
(m AHD)
Estimated Dry Season
Groundwater Level
(m AHD) ^
Required Groundwater
Level Drawdown (m)
Wet Season
Dry Season
Reid/Tonkin 100425 28.1 28.8 27.8 0.7
No
Dew
ate
rin
g re
qu
ired
Reid/Tonkin 100375 29.4 29.0 28.0 -
Reid/Tonkin 100275 28.8 28.5 27.5 -
Beechboro Road North 100650 27.2 27.3 26.3 0.1
Marshall Road 101325 30.0 29.9 28.9 -
Hepburn South 102825 32.6 31.3 30.3 -
Hepburn North 102950 32.7 31.4 30.4 -
Cullacabardee/PSP 105175 37.6 35.2 34.2 -
The Y Interchange 106675 41.9 38.8 37.8 -
Gnangara Road 108650 45.2 41.4 40.4 -
The Promenade South 111875 47.1 46.0 45.0 -
The Promenade North 112050 49.2 46.2 45.2 -
Stock Road South 121975 39.9 40.2 38.7 0.3
Stock Road North 122125 40.4 40.4 38.9 -
Neaves Road South 126675 47.5 46.9 45.9 -
Neaves Road North 126850 47.9 47.4 46.4 -
Muchea South Road 131900 43.9 44.2 43.2 0.3
Existing Brand Highway 135775 47.5 48.4 47.4 0.9
Ellen Brook 133475 40.1 40.5 39.5 0.4
New Brand Highway 137000 48.8 49.2 48.2 0.4
Muchea Interchange South 136800 46.9 47.0 46.0 0.1
Muchea Interchange North 137000 47.9 47.5 46.5 -
* Based on October 2014 groundwater levels ^ Based on subtracting observed seasonal variation from nearest monitoring well with the October 2014 groundwater levels
30 June 2015 NLWA-00-SU-PP-0002 / Rev 0 Page 4
4.2 Groundwater Level Drawdown Extent
The extent of the groundwater level drawdown (radius of influence) due to construction dewatering for the bridge footings was estimated using analytical equations (Charbenau, 2000) using the following assumptions:
Dewatering is required for up to 6 weeks for each footing;
The dimensions of each footing excavation requiring dewatering are 30 m by 10 m;
Excavations will be approximately 1.5 m deep;
Average Hydraulic conductivity of 25 m/d for Bassendean Sand and 5 m/d for Guildford Formation; and
Specific yield of 0.25 for Bassendean Sand and 0.1 for Guildford Formation.
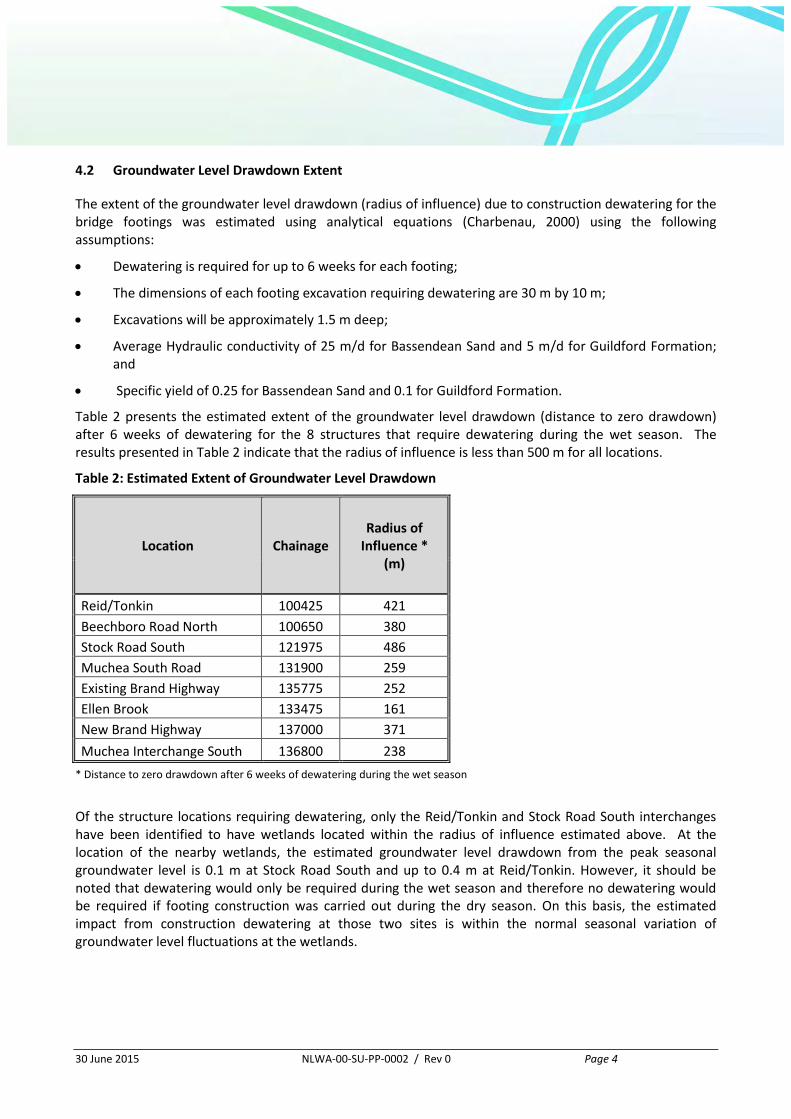
Table 2 presents the estimated extent of the groundwater level drawdown (distance to zero drawdown) after 6 weeks of dewatering for the 8 structures that require dewatering during the wet season. The results presented in Table 2 indicate that the radius of influence is less than 500 m for all locations.
Table 2: Estimated Extent of Groundwater Level Drawdown
Location Chainage Radius of
Influence * (m)
Reid/Tonkin 100425 421
Beechboro Road North 100650 380
Stock Road South 121975 486
Muchea South Road 131900 259
Existing Brand Highway 135775 252
Ellen Brook 133475 161
New Brand Highway 137000 371
Muchea Interchange South 136800 238
* Distance to zero drawdown after 6 weeks of dewatering during the wet season
Of the structure locations requiring dewatering, only the Reid/Tonkin and Stock Road South interchanges have been identified to have wetlands located within the radius of influence estimated above. At the location of the nearby wetlands, the estimated groundwater level drawdown from the peak seasonal groundwater level is 0.1 m at Stock Road South and up to 0.4 m at Reid/Tonkin. However, it should be noted that dewatering would only be required during the wet season and therefore no dewatering would be required if footing construction was carried out during the dry season. On this basis, the estimated impact from construction dewatering at those two sites is within the normal seasonal variation of groundwater level fluctuations at the wetlands.
30 June 2015 NLWA-00-SU-PP-0002 / Rev 0 Page 5
4.3 Conclusions Regarding Construction Dewatering
Based on the work described above, it is concluded that:
8 out of 22 structures have been found to require dewatering if footing construction is carried out during the wet season. The required groundwater level drawdown during the wet season ranges between 0.1 m and 0.9 m.
None of the 22 structures will require dewatering if footing construction is carried out during the dry season.
The estimated extent of groundwater level drawdown due to construction dewatering is less than 500 m for all structures.
Wetlands are located within the radius of influence of dewatering at two structures (Reid/Tonkin and Stock Road South interchanges).
Given that none of the structures require dewatering during the dry season, the estimated decrease in groundwater level caused by construction dewatering during the wet season is within the range of normal seasonal variation. This observation indicates that there will be no detrimental impact from the construction dewatering.
5 GROUNDWATER ABSTRACTION FOR CONSTRUCTION USE
Water will be required for earthworks and dust control purposes during construction of the road. Groundwater abstraction from pumping wells installed in the Superficial Aquifer is one potential source of construction water. As the locations of any groundwater abstraction wells are yet to be defined, a generalised hydrogeological profile was developed for each of the Geological Domains.
Based on the hydrogeological conditions the Superficial Aquifer in Geological Domains 1 & 2 is more transmissive than in Geological Domain 3 and it would therefore be possible to obtain higher pumping rates from wells installed within Geological Domains 1 & 2. The existing Water Corporation pumping wells are installed within Geological Domains 1 & 2 and have average pumping rates of approximately 30 L/s.
Similar to the above construction dewatering analysis, the extent of groundwater level drawdown was estimated using analytical equations. The groundwater level drawdown in the different geological domains was estimated at various distances from the pumping wells for different pumping rates.
5.1 Geological Domains 1 & 2
The extent of the groundwater level drawdown (radius of influence) from groundwater abstraction from a well within Geological Domains 1 & 2 was based on the following assumptions:
The aquifer is homogenous and isotropic.
The transmissivity of the Superficial Aquifer is 450 m2/d (corresponding to an average hydraulic conductivity of 15 m/d over a 30 m thick aquifer)
The aquifer is unconfined with a specific yield of 0.2.
Pumping will be undertaken continuously from the well for a period of 12 months. In reality this is unlikely to be the case as wells may only be operated during the day (particularly in Geological
30 June 2015 NLWA-00-SU-PP-0002 / Rev 0 Page 6
Domains 1 & 2 where higher pumping rates can be achieved) and 5 days per week. This assumption would therefore result in over estimation of the extent of groundwater level drawdown.
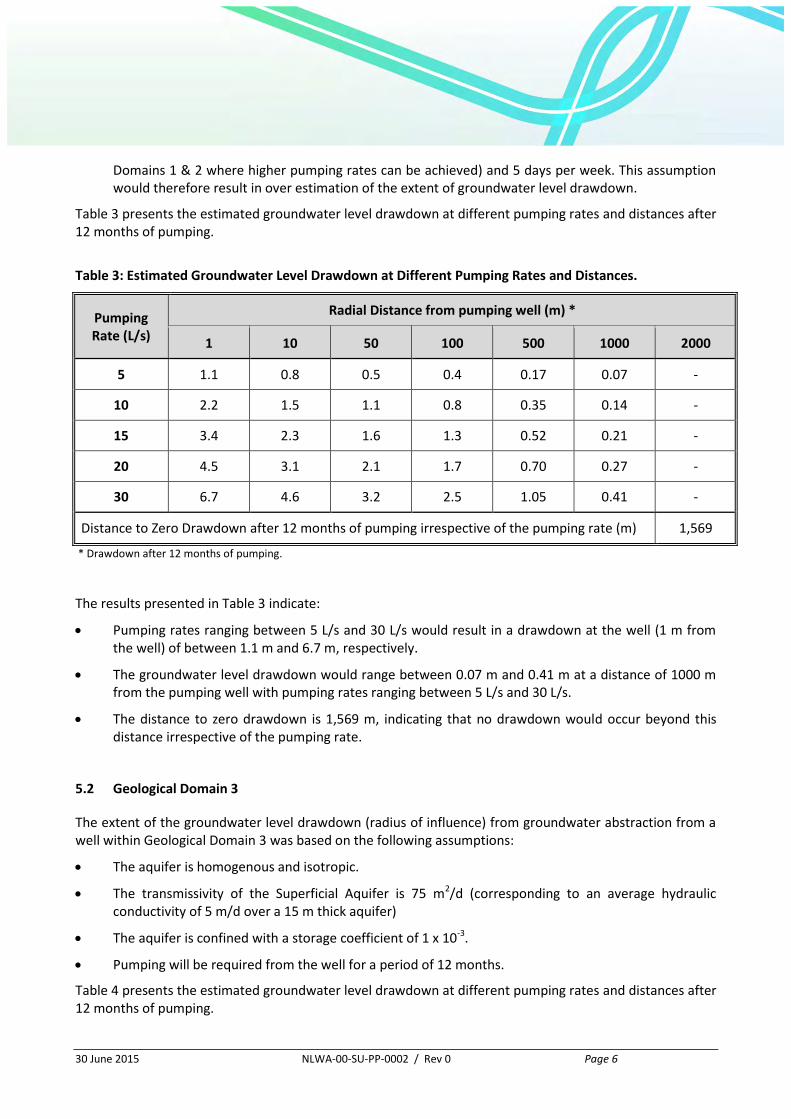
Table 3 presents the estimated groundwater level drawdown at different pumping rates and distances after 12 months of pumping.
Table 3: Estimated Groundwater Level Drawdown at Different Pumping Rates and Distances.
Pumping Rate (L/s)
Radial Distance from pumping well (m) *
1 10 50 100 500 1000 2000
5 1.1 0.8 0.5 0.4 0.17 0.07 -
10 2.2 1.5 1.1 0.8 0.35 0.14 -
15 3.4 2.3 1.6 1.3 0.52 0.21 -
20 4.5 3.1 2.1 1.7 0.70 0.27 -
30 6.7 4.6 3.2 2.5 1.05 0.41 -
Distance to Zero Drawdown after 12 months of pumping irrespective of the pumping rate (m) 1,569
* Drawdown after 12 months of pumping.
The results presented in Table 3 indicate:
Pumping rates ranging between 5 L/s and 30 L/s would result in a drawdown at the well (1 m from the well) of between 1.1 m and 6.7 m, respectively.
The groundwater level drawdown would range between 0.07 m and 0.41 m at a distance of 1000 m from the pumping well with pumping rates ranging between 5 L/s and 30 L/s.
The distance to zero drawdown is 1,569 m, indicating that no drawdown would occur beyond this distance irrespective of the pumping rate.
5.2 Geological Domain 3
The extent of the groundwater level drawdown (radius of influence) from groundwater abstraction from a well within Geological Domain 3 was based on the following assumptions:
The aquifer is homogenous and isotropic.
The transmissivity of the Superficial Aquifer is 75 m2/d (corresponding to an average hydraulic conductivity of 5 m/d over a 15 m thick aquifer)
The aquifer is confined with a storage coefficient of 1 x 10⁻³.
Pumping will be required from the well for a period of 12 months.
Table 4 presents the estimated groundwater level drawdown at different pumping rates and distances after 12 months of pumping.
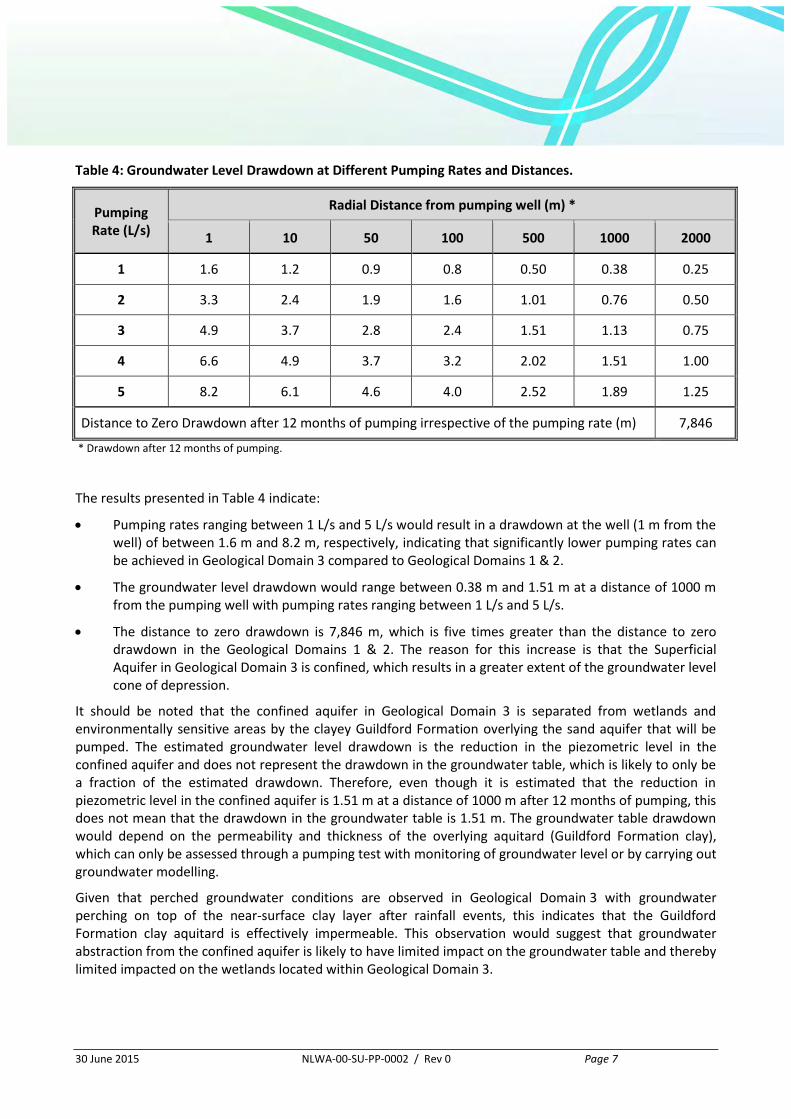
30 June 2015 NLWA-00-SU-PP-0002 / Rev 0 Page 7
Table 4: Groundwater Level Drawdown at Different Pumping Rates and Distances.
Pumping Rate (L/s)
Radial Distance from pumping well (m) *
1 10 50 100 500 1000 2000
1 1.6 1.2 0.9 0.8 0.50 0.38 0.25
2 3.3 2.4 1.9 1.6 1.01 0.76 0.50
3 4.9 3.7 2.8 2.4 1.51 1.13 0.75
4 6.6 4.9 3.7 3.2 2.02 1.51 1.00
5 8.2 6.1 4.6 4.0 2.52 1.89 1.25
Distance to Zero Drawdown after 12 months of pumping irrespective of the pumping rate (m) 7,846
* Drawdown after 12 months of pumping.
The results presented in Table 4 indicate:
Pumping rates ranging between 1 L/s and 5 L/s would result in a drawdown at the well (1 m from the well) of between 1.6 m and 8.2 m, respectively, indicating that significantly lower pumping rates can be achieved in Geological Domain 3 compared to Geological Domains 1 & 2.
The groundwater level drawdown would range between 0.38 m and 1.51 m at a distance of 1000 m from the pumping well with pumping rates ranging between 1 L/s and 5 L/s.
The distance to zero drawdown is 7,846 m, which is five times greater than the distance to zero drawdown in the Geological Domains 1 & 2. The reason for this increase is that the Superficial Aquifer in Geological Domain 3 is confined, which results in a greater extent of the groundwater level cone of depression.
It should be noted that the confined aquifer in Geological Domain 3 is separated from wetlands and environmentally sensitive areas by the clayey Guildford Formation overlying the sand aquifer that will be pumped. The estimated groundwater level drawdown is the reduction in the piezometric level in the confined aquifer and does not represent the drawdown in the groundwater table, which is likely to only be a fraction of the estimated drawdown. Therefore, even though it is estimated that the reduction in piezometric level in the confined aquifer is 1.51 m at a distance of 1000 m after 12 months of pumping, this does not mean that the drawdown in the groundwater table is 1.51 m. The groundwater table drawdown would depend on the permeability and thickness of the overlying aquitard (Guildford Formation clay), which can only be assessed through a pumping test with monitoring of groundwater level or by carrying out groundwater modelling.
Given that perched groundwater conditions are observed in Geological Domain 3 with groundwater perching on top of the near-surface clay layer after rainfall events, this indicates that the Guildford Formation clay aquitard is effectively impermeable. This observation would suggest that groundwater abstraction from the confined aquifer is likely to have limited impact on the groundwater table and thereby limited impacted on the wetlands located within Geological Domain 3.
30 June 2015 NLWA-00-SU-PP-0002 / Rev 0 Page 8
5.3 Conclusions Regarding Groundwater Abstraction for Construction Use
Based on the adopted hydrogeological properties, it is concluded that:
Wells installed within the superficial aquifer in Geological Domains 1 & 2 will provide a greater yield for construction water supply than in Geological Domain 3.
The distance to zero drawdown in the unconfined Superficial Aquifer in Geological Domains 1 & 2 after 12 months of continuous pumping is approximately 1,500 m. However, this is considered a conservative estimate given that pumping is unlikely to be continuous and therefore the distance would be smaller.
Groundwater level drawdown at a distance of 1000 m from a pumping well located in Geological Domains 1 & 2 would range between 0.07 m and 0.41 m depending on the pumping rate.
The distance to zero drawdown in the confined Superficial Aquifer in Geological Domain 3 after 12 months of continuous pumping is approximately 5 times greater than for Geological Domains 1 & 2. The reason for this difference is due to the confined aquifer conditions in Geological Domain 3.
Groundwater level drawdown in the confined aquifer at a distance of 1000 m from a pumping well located in Geological Domain 3 would range between 0.38 m and 1.51 m depending on the pumping rate. However, the confined aquifer and the wetlands are separated by the low permeability Guildford Formation clay and therefore the estimated drawdown in the confined aquifer does not represent the drawdown in the groundwater table, which is expected to be only a fraction of the estimated drawdown reported here.
30 June 2015 NLWA-00-SU-PP-0002 / Rev 0 Page 9
6 REFERENCES
Charbenau (2000) Groundwater Hydraulics and Pollutant Transport, Prentice-Hall 2000
Davidson, W.A. (1995). Hydrogeology and Groundwater Resources of the Perth Region, Western Australia, Western Australian Geological Survey, Bulletin 142.
Water Rivers Commission (1997). Perth Groundwater Atlas.
Department of Environment (2004) – Perth Groundwater Atlas
Department of Water (2008b). Perth Regional Aquifer Modeling System (PRAMS) Model Development: Hydrogeology and Groundwater Modelling. Hydrogeological Record Series Report no. HG20, September, Government of Western Australia.
Department of Water (2009b). Perth Regional Aquifer Modeling System (PRAMS) Scenario Modelling for the Gnangara Sustainability Strategy. Hydrogeological Record Series Report No. HG39, December, Government of Western Australia.
NorthLink WA (2015a). Geotechnical, Hydrogeological and Pavement Desk Study. Report No. NLWA-00-GT-RP-0002 Rev 1, dated 7 May 2015.
NorthLink WA (2015b). Geotechnical, Hydrogeological and Pavement Investigation - Tonkin Grade Separations Factual Report. Report No. NLWA-01-GT-RP-0001 Rev 0, dated 1 April 2015.
NorthLink WA (2015c). Geotechnical, Hydrogeological and Pavement Investigation - Central Section Factual Report. Report No. NLWA-00-GT-RP-0003 Rev 0, dated 1 May 2015.
NorthLink WA (2014). Geotechnical, Hydrogeological and Pavement Investigation Factual Report. Report No. NLWA-00-GT-RP-0003 Rev B Draft, dated 30 September 2014.
NorthLink WA (2015d). Tonkin Grade Separations – Geotechnical Interpretive Report. Report No. NLWA-01-GT-RP-0002 Rev 0, dated 11 May 2015.
NorthLink WA (2015e). Swan Valley Bypass – Geotechnical Interpretive Report, Stage 1. Report No. NLWA-00-GT-RP-0005 Rev B Draft, dated 19 February 2015.
NorthLink WA (2015f). Design Groundwater Level for Southern Section of NorthLink WA Road Alignment. Report No. NLWA-00-HY-RP-0001 Rev 0, dated 6 May 2015.
NorthLink WA (2015g). Design Groundwater Level for Central Section of NorthLink WA Road Alignment. Report No. NLWA-00-HY-RP-0001 Rev B Draft, dated 23 May 2015.
NorthLink WA (2015h). Design Groundwater Level for Northern Section of NorthLink WA Road Alignment. Report No. NLWA-00-HY-RP-0002 Rev B Draft, dated 7 April 2015.
Distribution
Copy Recipient
1
2
3
4
13 July 2015 NLWA-00-HY-PP-0001 / Rev 4 Page 1
POSITION PAPER
13 July 2015
Road Embankment Assessment (Groundwater)
NLWA-00-HY-PP-0001
Prepared by: Allan Lundorf, Shane Greene
Reviewed by: Doug Stewart
1 OBJECTIVES
This study was carried out for the NorthLink project, with reference to areas where groundwater is present at shallow depth along the project alignment. The two main objectives were to assess the potential for an in-situ compacted embankment foundation to:
Cause groundwater level to rise and pond at ground surface on the upstream side of the proposed road embankment.
Cause groundwater levels to decrease on the downstream side of the proposed road embankment.
The analysis was initially carried out prior to completion of geotechnical investigations along the project alignment and therefore was based on an assumed stratigraphy that would lead to the most adverse effect of road construction on groundwater flow. This position paper has been updated as preliminary geotechnical investigation data has been collected.
2 2D NUMERICAL GROUNDWATER MODEL
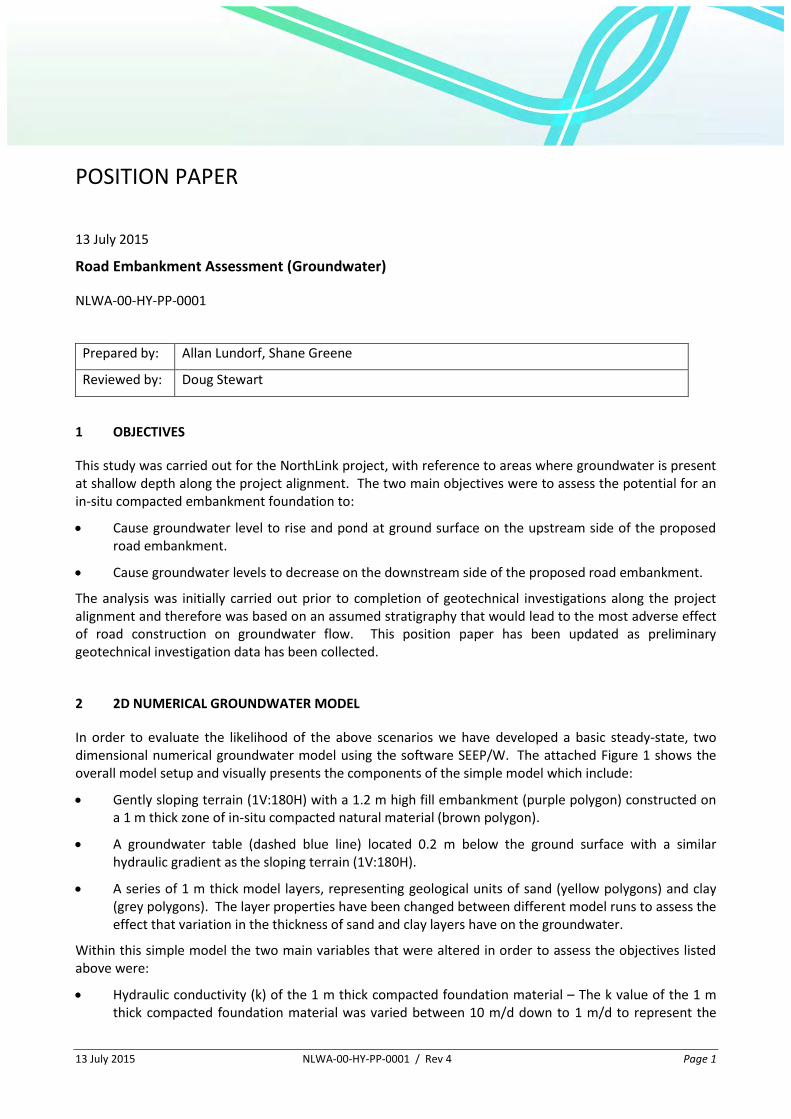
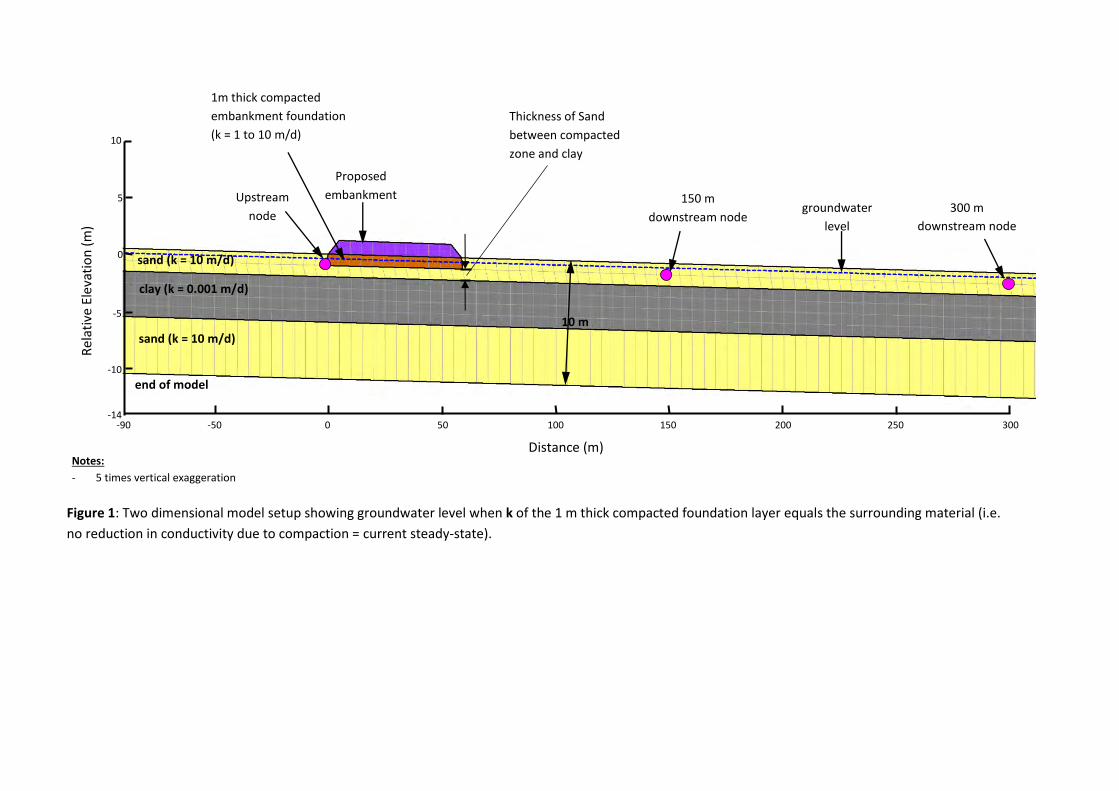
In order to evaluate the likelihood of the above scenarios we have developed a basic steady-state, two dimensional numerical groundwater model using the software SEEP/W. The attached Figure 1 shows the overall model setup and visually presents the components of the simple model which include:
Gently sloping terrain (1V:180H) with a 1.2 m high fill embankment (purple polygon) constructed on a 1 m thick zone of in-situ compacted natural material (brown polygon).
A groundwater table (dashed blue line) located 0.2 m below the ground surface with a similar hydraulic gradient as the sloping terrain (1V:180H).
A series of 1 m thick model layers, representing geological units of sand (yellow polygons) and clay (grey polygons). The layer properties have been changed between different model runs to assess the effect that variation in the thickness of sand and clay layers have on the groundwater.
Within this simple model the two main variables that were altered in order to assess the objectives listed above were:
Hydraulic conductivity (k) of the 1 m thick compacted foundation material – The k value of the 1 m thick compacted foundation material was varied between 10 m/d down to 1 m/d to represent the
13 July 2015 NLWA-00-HY-PP-0001 / Rev 4 Page 2
potential effect of vibratory compaction on hydraulic conductivity. It should be noted that a reduction of 3 to 10 times could normally be expected for a sand and silty sand material.
Thickness of the sand layer between the underside of the compacted foundation material and the top of the clay layer – This sand layer was varied from 0 m to 9 m thick.
3 MODEL RESULTS
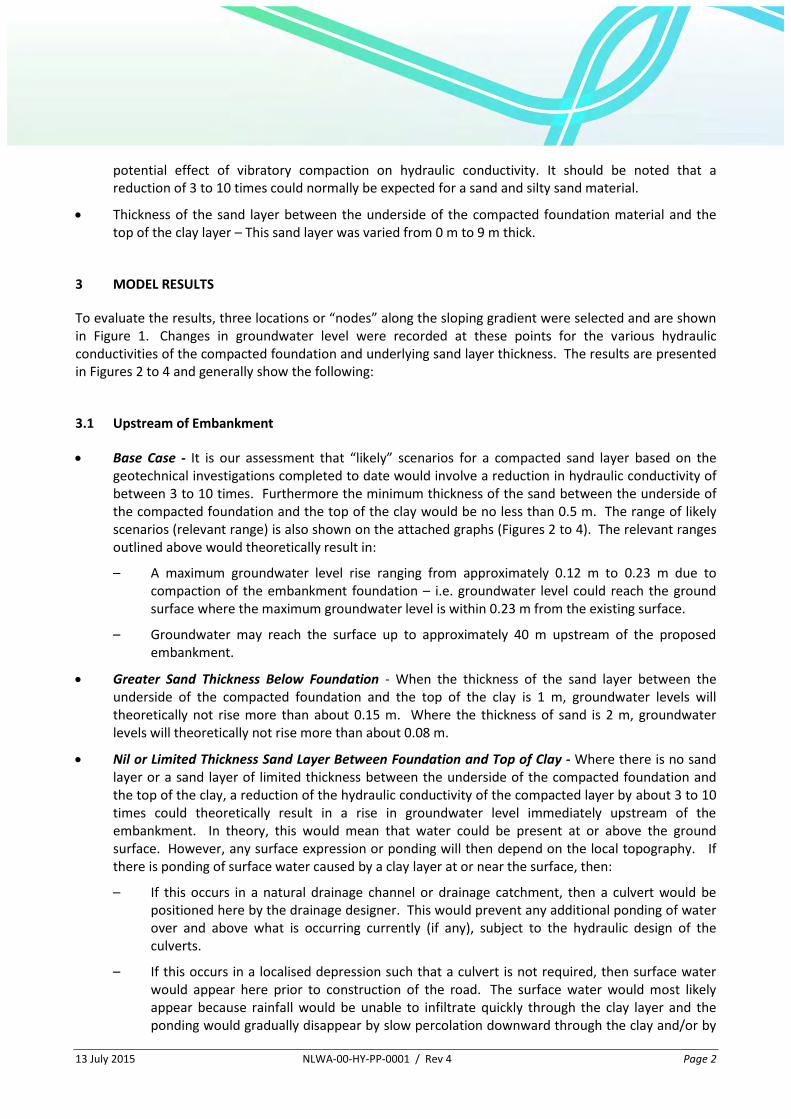
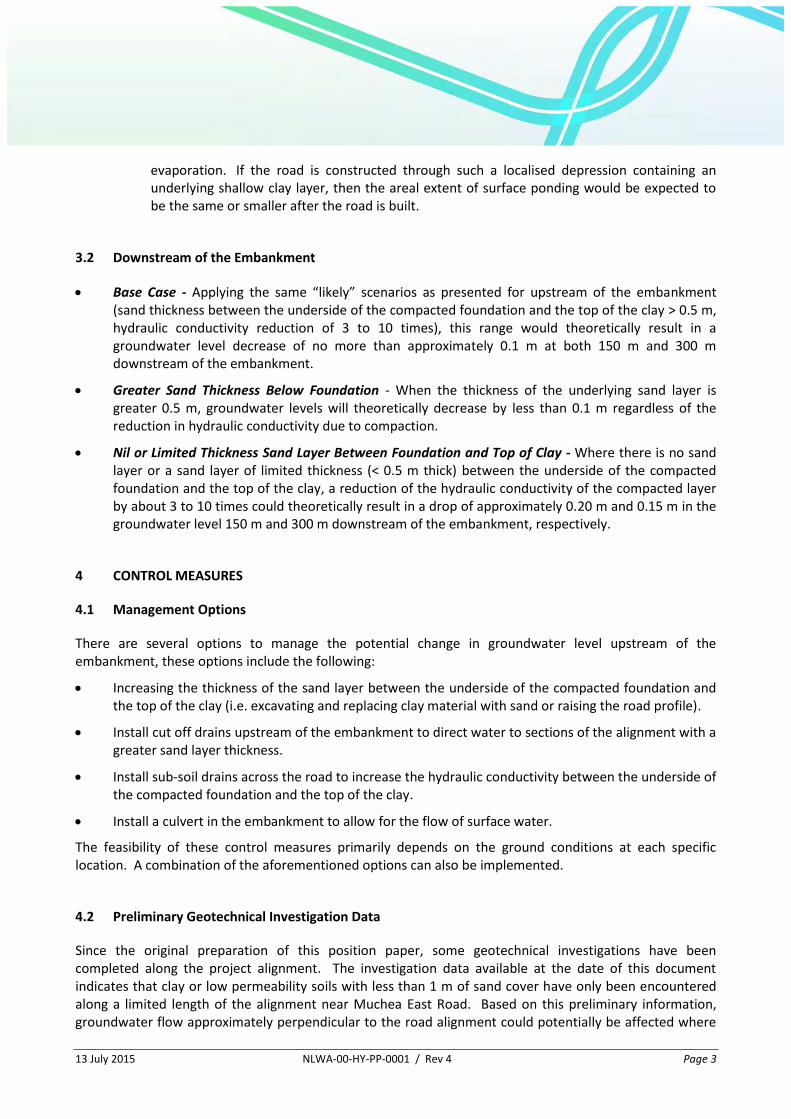
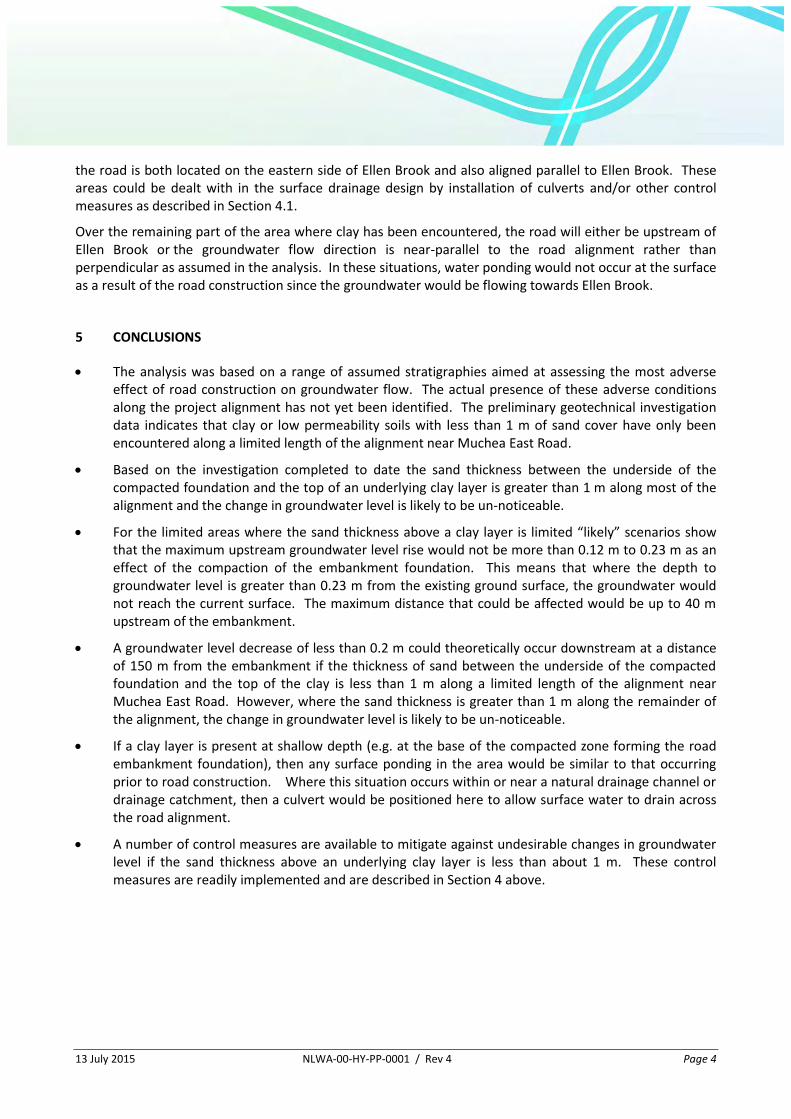
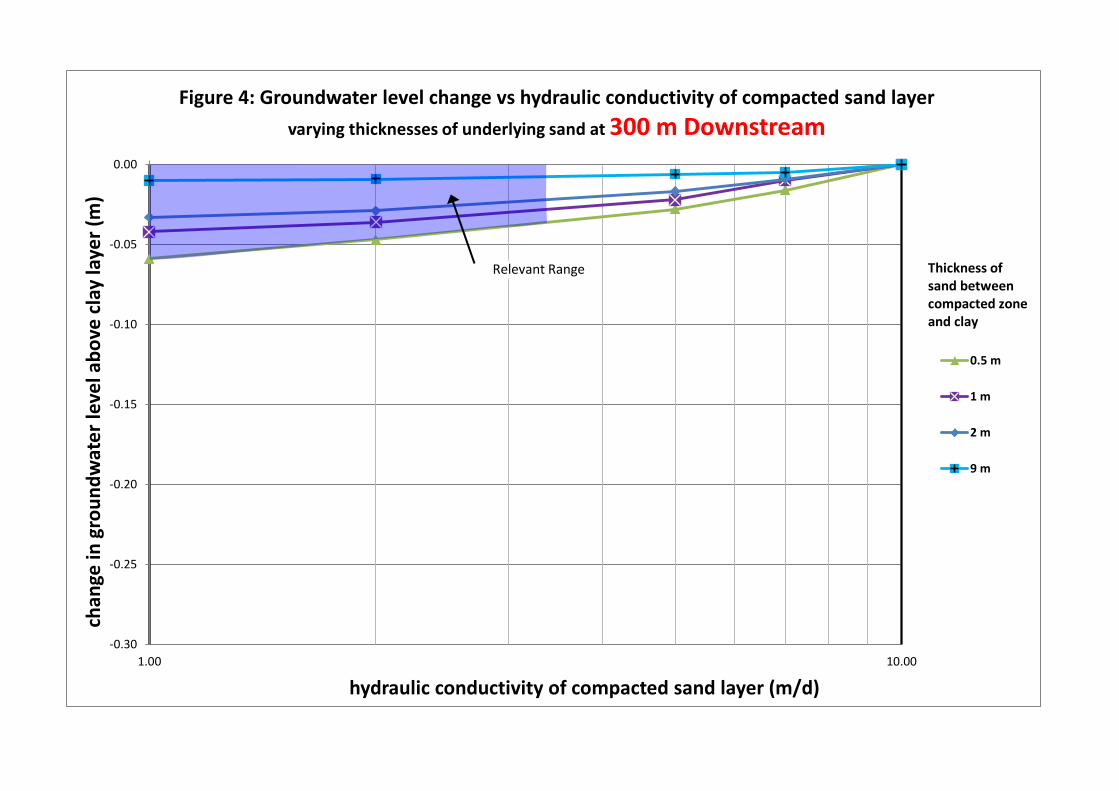
To evaluate the results, three locations or “nodes” along the sloping gradient were selected and are shown in Figure 1. Changes in groundwater level were recorded at these points for the various hydraulic conductivities of the compacted foundation and underlying sand layer thickness. The results are presented in Figures 2 to 4 and generally show the following:
3.1 Upstream of Embankment
Base Case - It is our assessment that “likely” scenarios for a compacted sand layer based on the geotechnical investigations completed to date would involve a reduction in hydraulic conductivity of between 3 to 10 times. Furthermore the minimum thickness of the sand between the underside of the compacted foundation and the top of the clay would be no less than 0.5 m. The range of likely scenarios (relevant range) is also shown on the attached graphs (Figures 2 to 4). The relevant ranges outlined above would theoretically result in:
– A maximum groundwater level rise ranging from approximately 0.12 m to 0.23 m due to compaction of the embankment foundation – i.e. groundwater level could reach the ground surface where the maximum groundwater level is within 0.23 m from the existing surface.
– Groundwater may reach the surface up to approximately 40 m upstream of the proposed embankment.
Greater Sand Thickness Below Foundation - When the thickness of the sand layer between the underside of the compacted foundation and the top of the clay is 1 m, groundwater levels will theoretically not rise more than about 0.15 m. Where the thickness of sand is 2 m, groundwater levels will theoretically not rise more than about 0.08 m.
Nil or Limited Thickness Sand Layer Between Foundation and Top of Clay - Where there is no sand layer or a sand layer of limited thickness between the underside of the compacted foundation and the top of the clay, a reduction of the hydraulic conductivity of the compacted layer by about 3 to 10 times could theoretically result in a rise in groundwater level immediately upstream of the embankment. In theory, this would mean that water could be present at or above the ground surface. However, any surface expression or ponding will then depend on the local topography. If there is ponding of surface water caused by a clay layer at or near the surface, then:
– If this occurs in a natural drainage channel or drainage catchment, then a culvert would be positioned here by the drainage designer. This would prevent any additional ponding of water over and above what is occurring currently (if any), subject to the hydraulic design of the culverts.
– If this occurs in a localised depression such that a culvert is not required, then surface water would appear here prior to construction of the road. The surface water would most likely appear because rainfall would be unable to infiltrate quickly through the clay layer and the ponding would gradually disappear by slow percolation downward through the clay and/or by
13 July 2015 NLWA-00-HY-PP-0001 / Rev 4 Page 3
evaporation. If the road is constructed through such a localised depression containing an underlying shallow clay layer, then the areal extent of surface ponding would be expected to be the same or smaller after the road is built.
3.2 Downstream of the Embankment
Base Case - Applying the same “likely” scenarios as presented for upstream of the embankment (sand thickness between the underside of the compacted foundation and the top of the clay > 0.5 m, hydraulic conductivity reduction of 3 to 10 times), this range would theoretically result in a groundwater level decrease of no more than approximately 0.1 m at both 150 m and 300 m downstream of the embankment.
Greater Sand Thickness Below Foundation - When the thickness of the underlying sand layer is greater 0.5 m, groundwater levels will theoretically decrease by less than 0.1 m regardless of the reduction in hydraulic conductivity due to compaction.
Nil or Limited Thickness Sand Layer Between Foundation and Top of Clay - Where there is no sand layer or a sand layer of limited thickness (< 0.5 m thick) between the underside of the compacted foundation and the top of the clay, a reduction of the hydraulic conductivity of the compacted layer by about 3 to 10 times could theoretically result in a drop of approximately 0.20 m and 0.15 m in the groundwater level 150 m and 300 m downstream of the embankment, respectively.
4 CONTROL MEASURES
4.1 Management Options
There are several options to manage the potential change in groundwater level upstream of the embankment, these options include the following:
Increasing the thickness of the sand layer between the underside of the compacted foundation and the top of the clay (i.e. excavating and replacing clay material with sand or raising the road profile).
Install cut off drains upstream of the embankment to direct water to sections of the alignment with a greater sand layer thickness.
Install sub-soil drains across the road to increase the hydraulic conductivity between the underside of the compacted foundation and the top of the clay.
Install a culvert in the embankment to allow for the flow of surface water.
The feasibility of these control measures primarily depends on the ground conditions at each specific location. A combination of the aforementioned options can also be implemented.
4.2 Preliminary Geotechnical Investigation Data
Since the original preparation of this position paper, some geotechnical investigations have been completed along the project alignment. The investigation data available at the date of this document indicates that clay or low permeability soils with less than 1 m of sand cover have only been encountered along a limited length of the alignment near Muchea East Road. Based on this preliminary information, groundwater flow approximately perpendicular to the road alignment could potentially be affected where
13 July 2015 NLWA-00-HY-PP-0001 / Rev 4 Page 4
the road is both located on the eastern side of Ellen Brook and also aligned parallel to Ellen Brook. These areas could be dealt with in the surface drainage design by installation of culverts and/or other control measures as described in Section 4.1.
Over the remaining part of the area where clay has been encountered, the road will either be upstream of Ellen Brook or the groundwater flow direction is near-parallel to the road alignment rather than perpendicular as assumed in the analysis. In these situations, water ponding would not occur at the surface as a result of the road construction since the groundwater would be flowing towards Ellen Brook.
5 CONCLUSIONS
The analysis was based on a range of assumed stratigraphies aimed at assessing the most adverse effect of road construction on groundwater flow. The actual presence of these adverse conditions along the project alignment has not yet been identified. The preliminary geotechnical investigation data indicates that clay or low permeability soils with less than 1 m of sand cover have only been encountered along a limited length of the alignment near Muchea East Road.
Based on the investigation completed to date the sand thickness between the underside of the compacted foundation and the top of an underlying clay layer is greater than 1 m along most of the alignment and the change in groundwater level is likely to be un-noticeable.
For the limited areas where the sand thickness above a clay layer is limited “likely” scenarios show that the maximum upstream groundwater level rise would not be more than 0.12 m to 0.23 m as an effect of the compaction of the embankment foundation. This means that where the depth to groundwater level is greater than 0.23 m from the existing ground surface, the groundwater would not reach the current surface. The maximum distance that could be affected would be up to 40 m upstream of the embankment.
A groundwater level decrease of less than 0.2 m could theoretically occur downstream at a distance of 150 m from the embankment if the thickness of sand between the underside of the compacted foundation and the top of the clay is less than 1 m along a limited length of the alignment near Muchea East Road. However, where the sand thickness is greater than 1 m along the remainder of the alignment, the change in groundwater level is likely to be un-noticeable.
If a clay layer is present at shallow depth (e.g. at the base of the compacted zone forming the road embankment foundation), then any surface ponding in the area would be similar to that occurring prior to road construction. Where this situation occurs within or near a natural drainage channel or drainage catchment, then a culvert would be positioned here to allow surface water to drain across the road alignment.
A number of control measures are available to mitigate against undesirable changes in groundwater level if the sand thickness above an underlying clay layer is less than about 1 m. These control measures are readily implemented and are described in Section 4 above.
13 July 2015 NLWA-00-HY-PP-0001 / Rev 4 Page 5
Distribution
Copy Recipient
1
2
3
4

APPENDIX A
Figures
Notes:
- 5 times vertical exaggeration
Figure 1: Two dimensional model setup showing groundwater level when k of the 1 m thick compacted foundation layer equals the surrounding material (i.e.
no reduction in conductivity due to compaction = current steady-state).
10 m
Proposed
embankment
sand (k = 10 m/d)
sand (k = 10 m/d)
clay (k = 0.001 m/d)
end of model
Upstream
node
150 m
downstream node groundwater
level
300 m
downstream node
1m thick compacted
embankment foundation
(k = 1 to 10 m/d)
-90 -50 0 50 100 150 200 250 300
Rel
ativ
e El
evat
ion
(m
)
0
10
5
-5
-10
-14
Distance (m)
Thickness of Sand
between compacted
zone and clay

0.00
0.05
0.10
0.15
0.20
0.25
0.30
1.00 10.00
chan
ge in
gro
undw
ater
leve
l abo
ve c
lay
laye
r (m
)
hydraulic conductivity of compacted sand layer (m/d)
Figure 2: Groundwater level change vs hydraulic conductivity of compacted sand layer varying thicknesses of underlying sand Upstream of Embankment
0.5 m
1 m
2 m
9 m
Thickness of sand between compacted zone and clay
Relevant Range

-0.30
-0.25
-0.20
-0.15
-0.10
-0.05
0.00
1.00 10.00
chan
ge in
gro
undw
ater
leve
l abo
ve c
lay
laye
r (m
)
hydraulic conductivity of compacted sand layer (m/d)
Figure 3: Groundwater level change vs hydraulic conductivity of compacted sand layer varying thicknesses of underlying sand at 150 m Downstream
0.5 m
1 m
2 m
9 m
Relevant Range Thickness of sand between compacted zone and clay
-0.30
-0.25
-0.20
-0.15
-0.10
-0.05
0.00
1.00 10.00
chan
ge in
gro
undw
ater
leve
l abo
ve c
lay
laye
r (m
)
hydraulic conductivity of compacted sand layer (m/d)
Figure 4: Groundwater level change vs hydraulic conductivity of compacted sand layer varying thicknesses of underlying sand at 300 m Downstream
0.5 m
1 m
2 m
9 m
Relevant Range Thickness of sand between compacted zone and clay
30 June 2015 NLWA-04-WM-PP-0002 / Rev 0 Page 1
POSITION PAPER
30 June 2015
Ellenbrook Nature Reserve
NLWA-04-WM-PP-0002
Prepared by: M. Wiezel
Reviewed by: Natassja Raymond
1 INTRODUCTION
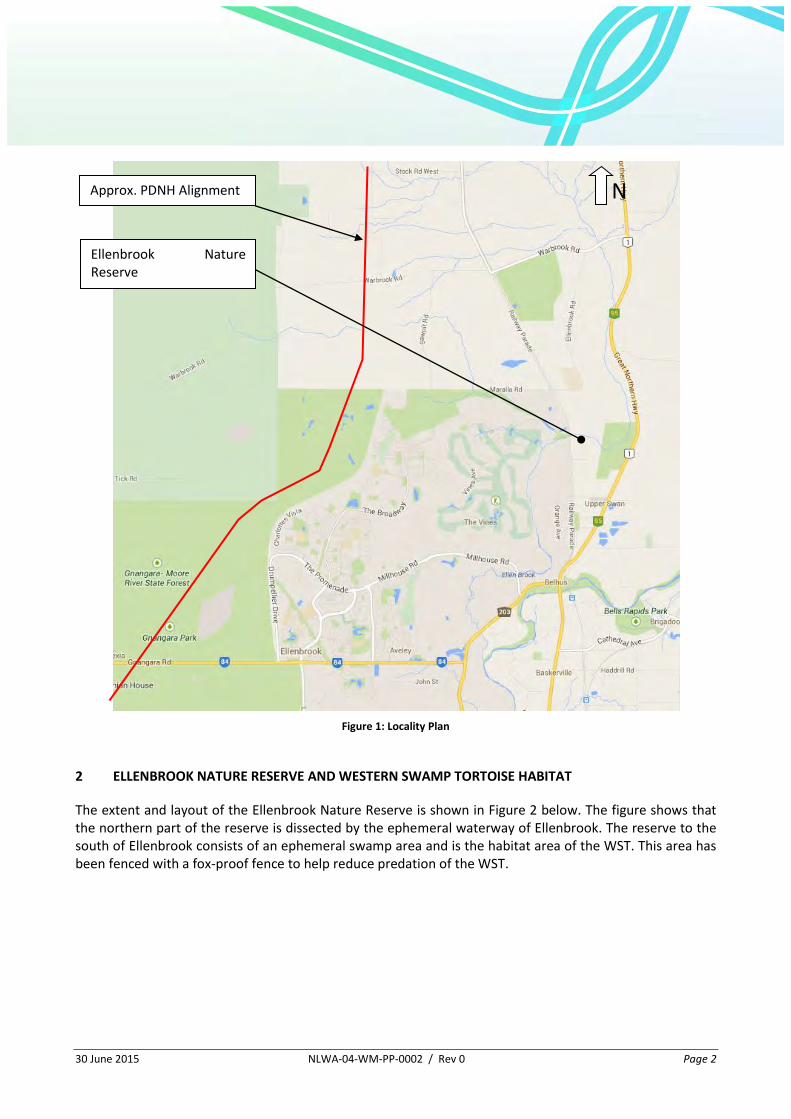
The Ellenbrook Nature Reserve is approximately 5km east of the Perth Darwin National Highway (PDNH) alignment. It is within the locality of Upper Swan and is on the western side of, and adjacent to, Great Northern Highway (GNH) (refer to Figure 1). It is home to the critically endangered Western Swamp Tortoise (WST) (the most endangered reptile in the World) and is managed by the Department of Parks and Wildlife.
The project is outside the Western Swamp Tortoise Policy Area (refer Appendix A), however, possible impacts on the Ellenbrook Nature Reserve were flagged by the Federal Government in Attachment 1 of the Environmental Scoping Document “EPA. 2014. Environmental Scoping Document. March. Perth, Western Australia”. This paper has been prepared to address these concerns.
30 June 2015 NLWA-04-WM-PP-0002 / Rev 0 Page 2
Figure 1: Locality Plan
2 ELLENBROOK NATURE RESERVE AND WESTERN SWAMP TORTOISE HABITAT
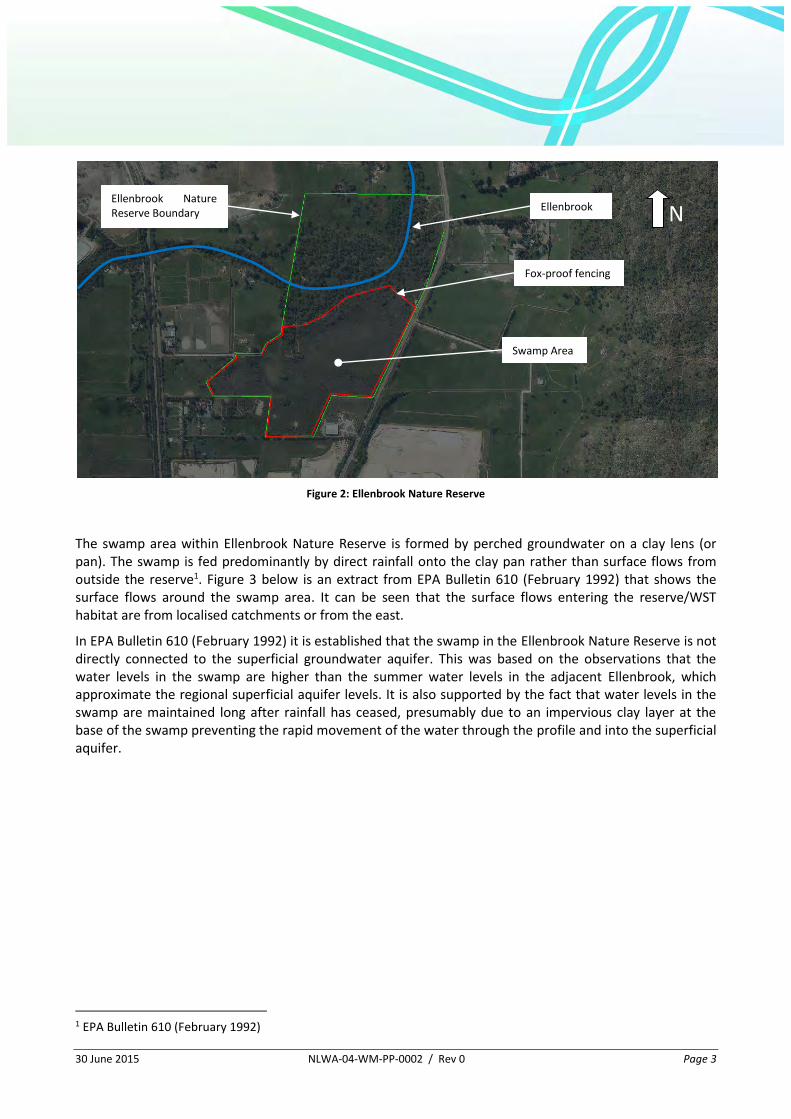
The extent and layout of the Ellenbrook Nature Reserve is shown in Figure 2 below. The figure shows that the northern part of the reserve is dissected by the ephemeral waterway of Ellenbrook. The reserve to the south of Ellenbrook consists of an ephemeral swamp area and is the habitat area of the WST. This area has been fenced with a fox-proof fence to help reduce predation of the WST.
Approx. PDNH Alignment
Ellenbrook Nature Reserve
N
30 June 2015 NLWA-04-WM-PP-0002 / Rev 0 Page 3
Figure 2: Ellenbrook Nature Reserve
The swamp area within Ellenbrook Nature Reserve is formed by perched groundwater on a clay lens (or pan). The swamp is fed predominantly by direct rainfall onto the clay pan rather than surface flows from outside the reserve1. Figure 3 below is an extract from EPA Bulletin 610 (February 1992) that shows the surface flows around the swamp area. It can be seen that the surface flows entering the reserve/WST habitat are from localised catchments or from the east.
In EPA Bulletin 610 (February 1992) it is established that the swamp in the Ellenbrook Nature Reserve is not directly connected to the superficial groundwater aquifer. This was based on the observations that the water levels in the swamp are higher than the summer water levels in the adjacent Ellenbrook, which approximate the regional superficial aquifer levels. It is also supported by the fact that water levels in the swamp are maintained long after rainfall has ceased, presumably due to an impervious clay layer at the base of the swamp preventing the rapid movement of the water through the profile and into the superficial aquifer.
1 EPA Bulletin 610 (February 1992)
Ellenbrook
Fox-proof fencing
Swamp Area
Ellenbrook Nature Reserve Boundary N

30 June 2015 NLWA-04-WM-PP-0002 / Rev 0 Page 4
Figure 3: Extract from EPA Bulletin 610 (February 1992)
30 June 2015 NLWA-04-WM-PP-0002 / Rev 0 Page 5
3 SURFACE HYDROLOGY
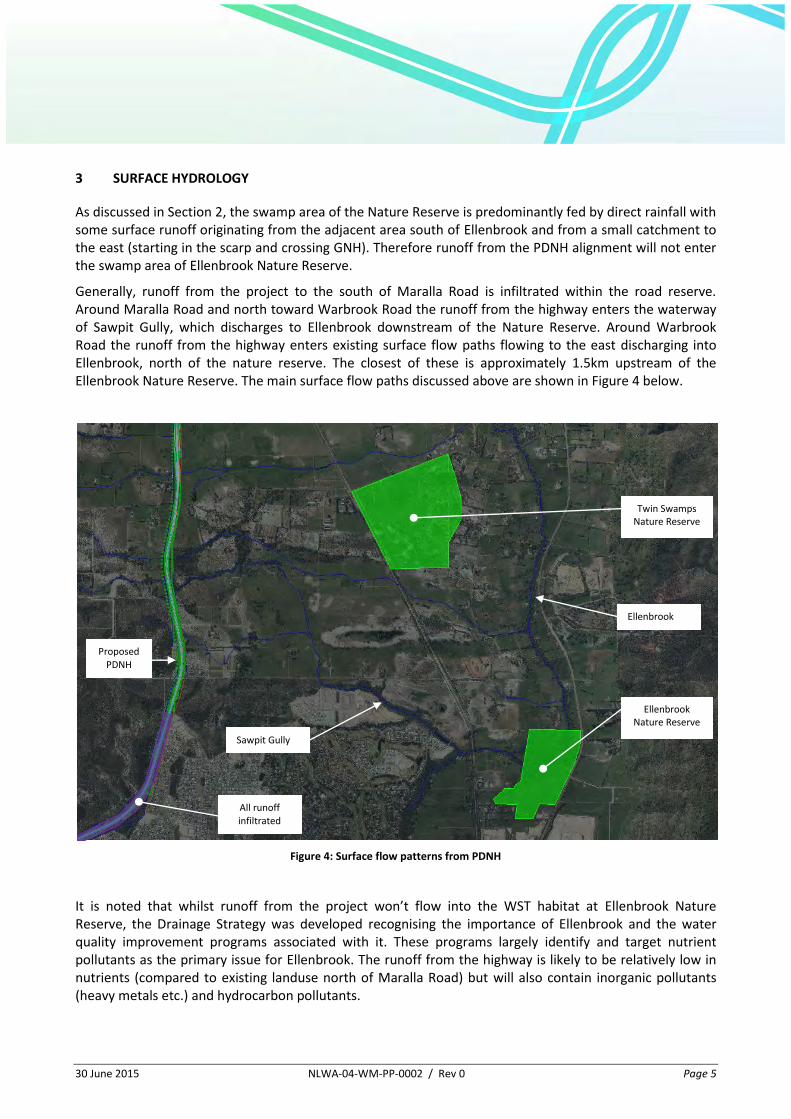
As discussed in Section 2, the swamp area of the Nature Reserve is predominantly fed by direct rainfall with some surface runoff originating from the adjacent area south of Ellenbrook and from a small catchment to the east (starting in the scarp and crossing GNH). Therefore runoff from the PDNH alignment will not enter the swamp area of Ellenbrook Nature Reserve.
Generally, runoff from the project to the south of Maralla Road is infiltrated within the road reserve. Around Maralla Road and north toward Warbrook Road the runoff from the highway enters the waterway of Sawpit Gully, which discharges to Ellenbrook downstream of the Nature Reserve. Around Warbrook Road the runoff from the highway enters existing surface flow paths flowing to the east discharging into Ellenbrook, north of the nature reserve. The closest of these is approximately 1.5km upstream of the Ellenbrook Nature Reserve. The main surface flow paths discussed above are shown in Figure 4 below.
Figure 4: Surface flow patterns from PDNH
It is noted that whilst runoff from the project won’t flow into the WST habitat at Ellenbrook Nature Reserve, the Drainage Strategy was developed recognising the importance of Ellenbrook and the water quality improvement programs associated with it. These programs largely identify and target nutrient pollutants as the primary issue for Ellenbrook. The runoff from the highway is likely to be relatively low in nutrients (compared to existing landuse north of Maralla Road) but will also contain inorganic pollutants (heavy metals etc.) and hydrocarbon pollutants.
Proposed PDNH
Twin Swamps Nature Reserve
Ellenbrook Nature Reserve
Ellenbrook
Sawpit Gully
All runoff infiltrated
30 June 2015 NLWA-04-WM-PP-0002 / Rev 0 Page 6
Insoluble inorganic pollutants are typically bound to sediments in the runoff from the highway. The drainage strategy targets these pollutants by encouraging the highway runoff to be kept as close to sheet flow as possible, allowing it to sheet off the highway and flow across/along the vegetated verge towards the existing surface flow paths. This flow through vegetation promotes deposition and filtration of sediments (and attached pollutants) within the runoff, thereby minimising the amount of pollutants entering Ellenbrook. Flow across vegetated surfaces can also be effective at removing hydrocarbon pollutants from runoff. It is proposed that the verge areas where surface flow is encouraged will be planted with grasses and trees to support the treatment of the runoff.
4 GROUNDWATER
As discussed in Section 2, the swamp area within Ellenbrook Nature Reserve is not directly connected to the superficial aquifer, but is instead water perched on a clay lens. The perched water may, however, be supported by pressure from the superficial aquifer underneath.
Further, groundwater flow in the area is generally from west-east for land to the west of Ellenbrook (flowing from the Gnangara Mound) and east-west for land to the east of Ellenbrook (flowing from the Darling Scarp). The proposed highway is to the west of Ellenbrook whilst the swamp area of the reserve is to the east of Ellenbrook and therefore any impacts on groundwater from the PDNH would be intercepted by Ellenbrook before they could impact on the swamp area in the reserve. It should be noted that the base of Ellenbrook, adjacent to the swamp area, is approximately 4m lower than the swamp area.
5 POSITION
The critical issue for the Ellenbrook Nature Reserve is the preservation of the WST habitat that occurs to the south/east of Ellenbrook.
As is discussed in the paper, the swamp area forming the WST habitat is separated from the project by Ellenbrook and therefore it is the position of NorthLink WA that the project will not impact the swamp area habitat of the WST in the Ellenbrook Nature Reserve.
APPENDIX A
Western Swamp Tortoise Policy Area
D ate:M XD :
Fi le N a m e :
DRUMPELLIER DR
THE PROMENADE
MARALLA RD
WARBROOK RD
THE BROADWAY
HALDEN RD
WESTERN SWAMP TORTOISEPOLICY AREA
8801
8802
8926
13387
8541
15732
8664
8798
8792
8800
8936
8812
8907
SAWPIT GULLY
40 0 ,0 0 0
40 0 ,0 0 0
40 1 ,0 0 0
40 1 ,0 0 0
40 2 ,0 0 0
40 2 ,0 0 0
40 3 ,0 0 0
40 3 ,0 0 0
40 4 ,0 0 0
40 4 ,0 0 0
40 5 ,0 0 0
40 5 ,0 0 0
6,483
,000
6,484
,000
6,484
,000
6,485
,000
6,485
,000
6,486
,000
6,486
,000
6,487
,000
6,487
,000
6,488
,000
6,488
,000
6,489
,000
6,489
,000
6,490
,000
6,490
,000
F ig u re N o :
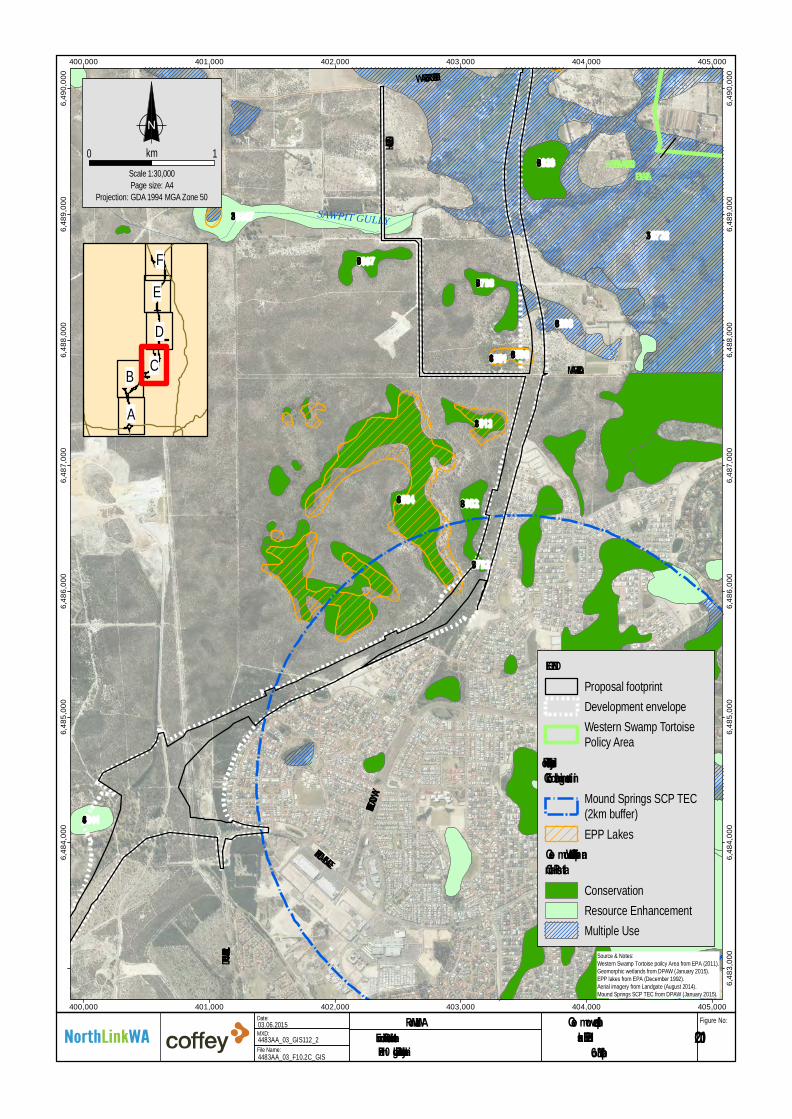
LEGENDPropo sa l foo tp rin tD eve lo pm en t en ve lopeW e stern S w am p Torto isePo licy A rea
Threatened and Prio rityEco lo gical Co mmunities
M oun d Sp ring s S C P T E C(2km buffe r)EP P La ke s
Geo mo rphic Wetlands Sw anCo astal Plain
C o nserva tionR e so urce E nh an ce m en tM ultip le U se
So urce & N o te s :W e s te rn Sw am p T o rto ise p oi lc y A re a fro m EP A (20 1 1 ).G eo m o rp hic w e tlan d s fro m D PAW ( Ja n ua ry 2 0 1 5).EPP lake s fro m E PA (D e ce m be r 1 9 92 ).Ae ria l im a g ery fro m L an d ga te (Au gu s t 20 1 4) .M ou n d Sp rin g s SC P T EC fro m D PAW ( Ja n ua ry 2 0 1 5).
10.2CGeo mo rphic w etlands and EPP lakesMap 3 o f 64 4 8 3 A A _ 0 3 _ F 1 0 .2 C _ G IS
4 4 8 3 A A _ 0 3 _ G I S 11 2 _ 20 3 . 0 6 . 2 0 1 5
Wannero o Ro ad
Reid Highw ayAB C
D
EF
Public Enviro nmental ReviewPerth–Darw in Natio nal Highw ay
Main Ro ads WA
N
Page s ize: A4
0 1k m
Projection : G D A 1994 M G A Z one 50
Scale 1:30,000
D ate:M XD :
Fi le N a m e :
WARBROOK RD
STOCK RD
RAILWAY PDE
HALDEN RD
CUNNINGHAM RD
WESTERN SWAMP TORTOISEPOLICY AREA
89198783
87848785
8926
8927
15732
89148916
ELLE
N BRO
OK
40 1 ,0 0 0
40 1 ,0 0 0
40 2 ,0 0 0
40 2 ,0 0 0
40 3 ,0 0 0
40 3 ,0 0 0
40 4 ,0 0 0
40 4 ,0 0 0
40 5 ,0 0 0
40 5 ,0 0 0
40 6 ,0 0 0
40 6 ,0 0 0
6,490
,000
6,490
,000
6,491
,000
6,491
,000
6,492
,000
6,492
,000
6,493
,000
6,493
,000
6,494
,000
6,494
,000
6,495
,000
6,495
,000
6,496
,000
6,496
,000
F ig u re N o :
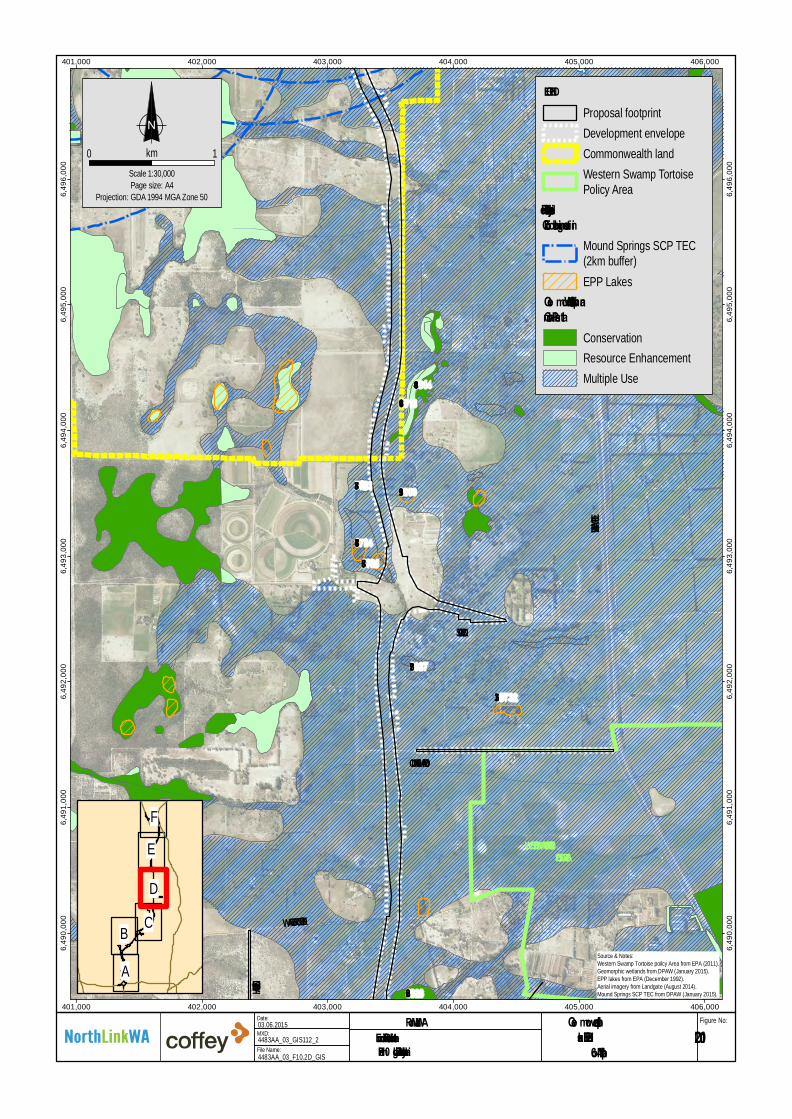
LEGENDPropo sa l foo tp rin tD eve lo pm en t en ve lopeC om m o nw ea lth lan dW e stern S w am p Torto isePo licy A rea
Threatened and Prio rityEco lo gical Co mmunities
M oun d Sp ring s S C P T E C(2km buffe r)EP P La ke s
Geo mo rphic Wetlands Sw anCo astal Plain
C o nserva tionR e so urce E nh an ce m en tM ultip le U se
So urce & N o te s :W e s te rn Sw am p T o rto ise p oi lc y A re a fro m EP A (20 1 1 ).G eo m o rp hic w e tlan d s fro m D PAW ( Ja n ua ry 2 0 1 5).EPP lake s fro m E PA (D e ce m be r 1 9 92 ).Ae ria l im a g ery fro m L an d ga te (Au gu s t 20 1 4) .M ou n d Sp rin g s SC P T EC fro m D PAW ( Ja n ua ry 2 0 1 5).
10.2DGeo mo rphic w etlands and EPP lakesMap 4 o f 64 4 8 3 A A _ 0 3 _ F 1 0 .2 D _ G IS
4 4 8 3 A A _ 0 3 _ G I S 11 2 _ 20 3 . 0 6 . 2 0 1 5
Wannero o Ro ad
Reid Highw ayAB C
D
EF
Public Enviro nmental ReviewPerth–Darw in Natio nal Highw ay
Main Ro ads WA
N
Page s ize: A4
0 1k m
Projection : G D A 1994 M G A Z one 50
Scale 1:30,000