Embed Size (px)
Citation preview

PUBLIC EXPENDITURE MANAGEMENT COUNTRY ASSESSMENT AND ACTION PLAN
(AAP)
GHANA
PREPARED BY THE STAFF OF THE WORLD BANK AND THE IMF IN COLLABORATION WITH THE GHANAIAN AUTHORITIES1
May 28, 2004
1 The HIPC AAP mission took place between February 16-25, 2004 and comprised Marcelo Andrade (head, World Bank), Carlos Cavalcanti, Daniel Boakye (Africa PREM, World Bank), Gert Van Der Linde (Africa Financial Management, World Bank), Mbuba Mbungu (Africa Procurement, World Bank), Theo Thomas (Fiscal Affairs Department, IMF), Allan Gustafsson (DFID funded consultant) and Salli Cudjoe (Team Assistant, AFC10).

- 2 -
LIST OF ABBREVIATIONS
ADMU Aid and Debt Management Unit AG Auditor General BPEMS Budget and Public Expenditure Management System CAGD Controller and Accountant General Department CCO Commitment Control Officer CCS Commitment Control System CF Consolidated Fund CFAA Country Financial Accountability Assessment CMIC Cash Management Implementation Committee, MoFEP CPAR Country Procurement Assessment Report DA District Assembly DACF District Assemblies Common Fund DFID UK Department for International Development EC European Commission FAA Financial Administration Act 2003 FAR Financial Administration Regulations GAS Ghana Audit Service GETF Ghana Education Trust Fund GFS01 Government Financial Statistics (IMF manual, 2001 edition) GIA Grants-in-aid GoG Government of Ghana GPRS Ghana Poverty Reduction Strategy HIPC Heavily Indebted Poor Countries IAD Internal Audit Department IGFs Internally Generated Funds IMF International Monetary Fund IPPD2 Integrated Personal and Payroll Database (2nd stage of DFID-funded project) MDA Ministry, Department, Agency MER Monthly Expenditure Return MLGRD Ministry of Local Government and Rural Development MoFEP Ministry of Finance and Economic Planning MTEF Medium Term Expenditure Framework NFE Non Financial Public Enterprise NTR Non-Tax Revenue NTRU Non-Tax Revenue Unit PEMU Public Expenditure Management Unit, MoFEP PER Public Expenditure Review PUFMARP Public Finance Management Reform Program PRP Poverty Reduction Programs PRSP Poverty Reduction Strategy Paper QFA Quasi-Fiscal Activities SSNIT Social Security and National Insurance Trust WB World Bank
- 3 -
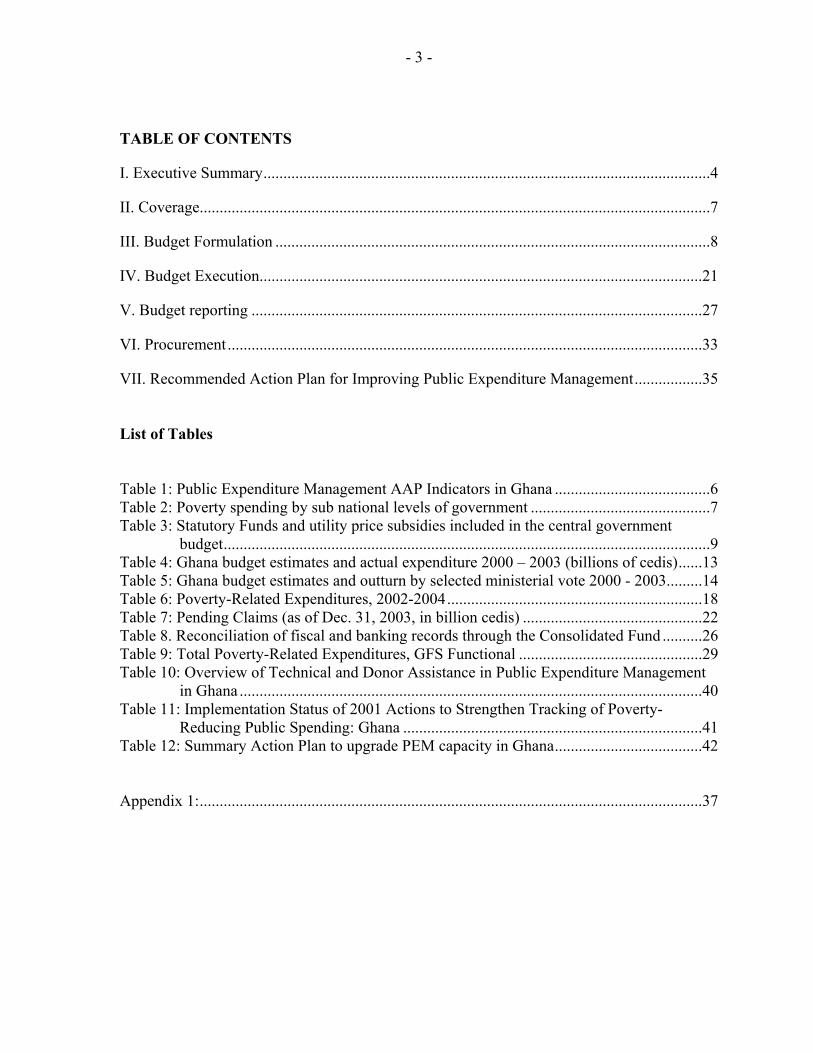
TABLE OF CONTENTS
I. Executive Summary................................................................................................................4
II. Coverage................................................................................................................................7
III. Budget Formulation .............................................................................................................8
IV. Budget Execution...............................................................................................................21
V. Budget reporting .................................................................................................................27
VI. Procurement.......................................................................................................................33
VII. Recommended Action Plan for Improving Public Expenditure Management.................35 List of Tables Table 1: Public Expenditure Management AAP Indicators in Ghana .......................................6 Table 2: Poverty spending by sub national levels of government .............................................7 Table 3: Statutory Funds and utility price subsidies included in the central government
budget..........................................................................................................................9 Table 4: Ghana budget estimates and actual expenditure 2000 � 2003 (billions of cedis)......13 Table 5: Ghana budget estimates and outturn by selected ministerial vote 2000 - 2003.........14 Table 6: Poverty-Related Expenditures, 2002-2004................................................................18 Table 7: Pending Claims (as of Dec. 31, 2003, in billion cedis) .............................................22 Table 8. Reconciliation of fiscal and banking records through the Consolidated Fund ..........26 Table 9: Total Poverty-Related Expenditures, GFS Functional ..............................................29 Table 10: Overview of Technical and Donor Assistance in Public Expenditure Management
in Ghana ....................................................................................................................40 Table 11: Implementation Status of 2001 Actions to Strengthen Tracking of Poverty-
Reducing Public Spending: Ghana ...........................................................................41 Table 12: Summary Action Plan to upgrade PEM capacity in Ghana.....................................42 Appendix 1:..............................................................................................................................37

- 4 -
I. EXECUTIVE SUMMARY
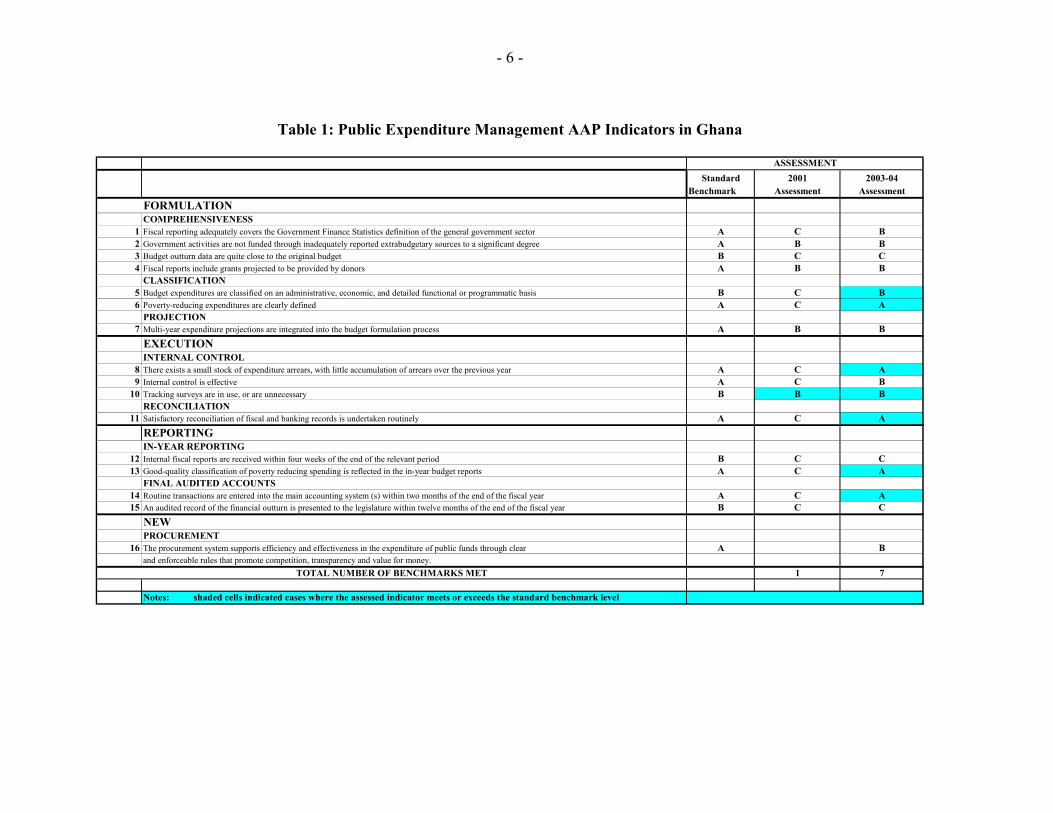
The capacity to track poverty-reducing public expenditure is critical to the government of Ghana�s (GoG) ability to successfully implement the Ghana Poverty Reduction Strategy (GPRS) and the commitments made under the Enhanced Heavily Indebted Poor Country (HIPC) initiative. The objective of the current exercise, the �HIPC Expenditure Tracking Assessment and Action Plan (AAP)�, carried out jointly by the World Bank and the IMF, is to assess the current status of Ghana�s public expenditure management (PEM) systems and recommend priority actions to address the key shortcomings. Existing and planned donor assistance, and any gaps that may remain, are also identified. This �HIPC AAP� follows the 2001 assessment and is being carried out in more than 20 countries that receive support under the Enhanced HIPC Initiative. The assessment shows that Ghana now achieves 7 out of the 16 PEM benchmarks, compared to 1 out of 15 in the assessment carried out in 2001. Moreover, Ghana has improved on 8 of the previous PEM indicators. This is a sign that improvements are occurring in line with commitments made by the Government to undertake significant PEM reforms and to deepen financial accountability, identified as major priorities in the country�s GPRS. Reported improvements are also consistent with progress detailed in the 2003 update paper submitted to the Boards of the IMF and the Bank, in which Ghana was ranked as a top performer in number of actions fully implemented in the context of the HIPC expenditure tracking assessment.2 Table 1 summarizes the overall assessment against the 16 benchmarks. Overall, Ghana�s PEM system still requires substantial upgrading in the areas of budget formulation, execution and reporting. The GoG has initiated a number of reforms that could, within the next few years, address many of the remaining deficiencies of the current system. However, it will take time before some of these major initiatives, such as the Budget and Public Expenditure Management System (BPEMS), can deliver their anticipated benefits. In the interim GoG should maintain and continue to improve existing systems and most critically to enforce compliance. The view of the staff is that a considerable, long term commitment is required to upgrade the PEM system to reasonably acceptable levels. With the coordinated assistance of the major donors active in PEM, adequate Technical Assistance (TA) should be available to support a comprehensive PEM Action Plan. An action plan for improving PEM is outlined in section VII, which draws in part from Ghana�s own �Twelve Months Action Plan for Public Financial Management� recently adopted by the authorities.
2 �Update on Implementation of Action Plans to Strengthen Capacity of HIPCs to Track Poverty-Reduction Spending. IDA and IMF, March 7, 2003, IDA/R2003-2004.

- 5 -
This second comprehensive assessment prepared by the IMF and World Bank, in collaboration with Ghana�s authorities, was reviewed at Bank and IMF headquarters. Prior to the February 16-25, 2004 mission, the authorities provided staff with a self-assessment of the progress made since 2001. To carry out the review, the mission met with the GoG and the main donors in the PEM area to achieve the following: (i) assess the capacity of the PEM system to track poverty-reducing expenditures; (ii) identify ongoing and planned initiatives and associated technical assistance (TA) for improving PEM; and (iii) prepare a summary action plan for improving PEM. This report incorporates additional information that has been made available after the February 2004 mission. The staff is grateful to the authorities for the excellent cooperation and assistance in preparing this assessment.
- 6 -
Table 1: Public Expenditure Management AAP Indicators in Ghana
Standard 2001 2003-04Benchmark Assessment Assessment
FORMULATIONCOMPREHENSIVENESS
1 Fiscal reporting adequately covers the Government Finance Statistics definition of the general government sector A C B2 Government activities are not funded through inadequately reported extrabudgetary sources to a significant degree A B B3 Budget outturn data are quite close to the original budget B C C4 Fiscal reports include grants projected to be provided by donors A B B
CLASSIFICATION5 Budget expenditures are classified on an administrative, economic, and detailed functional or programmatic basis B C B6 Poverty-reducing expenditures are clearly defined A C A
PROJECTION7 Multi-year expenditure projections are integrated into the budget formulation process A B B
EXECUTIONINTERNAL CONTROL
8 There exists a small stock of expenditure arrears, with little accumulation of arrears over the previous year A C A9 Internal control is effective A C B
10 Tracking surveys are in use, or are unnecessary B B BRECONCILIATION
11 Satisfactory reconciliation of fiscal and banking records is undertaken routinely A C AREPORTINGIN-YEAR REPORTING
12 Internal fiscal reports are received within four weeks of the end of the relevant period B C C13 Good-quality classification of poverty reducing spending is reflected in the in-year budget reports A C A
FINAL AUDITED ACCOUNTS14 Routine transactions are entered into the main accounting system (s) within two months of the end of the fiscal year A C A15 An audited record of the financial outturn is presented to the legislature within twelve months of the end of the fiscal year B C C
NEWPROCUREMENT
16 The procurement system supports efficiency and effectiveness in the expenditure of public funds through clear A Band enforceable rules that promote competition, transparency and value for money.
1 7
Notes: shaded cells indicated cases where the assessed indicator meets or exceeds the standard benchmark level
ASSESSMENT
TOTAL NUMBER OF BENCHMARKS MET
- 7 -
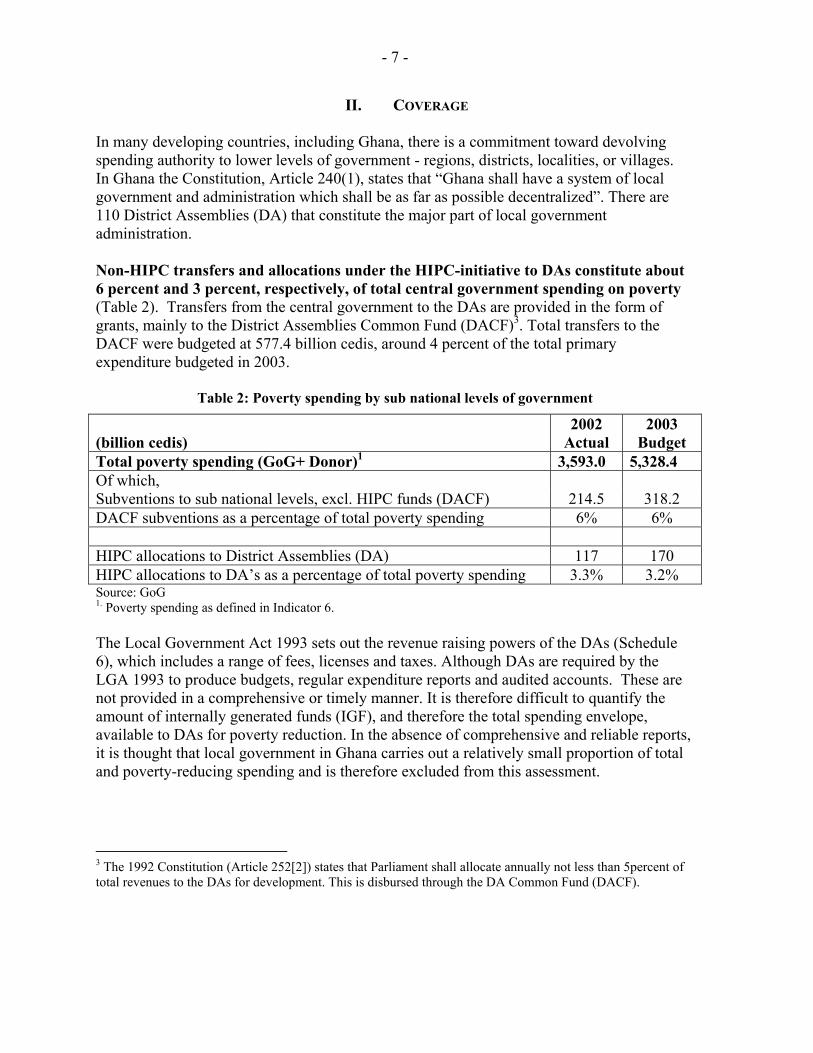
II. COVERAGE In many developing countries, including Ghana, there is a commitment toward devolving spending authority to lower levels of government - regions, districts, localities, or villages. In Ghana the Constitution, Article 240(1), states that �Ghana shall have a system of local government and administration which shall be as far as possible decentralized�. There are 110 District Assemblies (DA) that constitute the major part of local government administration. Non-HIPC transfers and allocations under the HIPC-initiative to DAs constitute about 6 percent and 3 percent, respectively, of total central government spending on poverty (Table 2). Transfers from the central government to the DAs are provided in the form of grants, mainly to the District Assemblies Common Fund (DACF)3. Total transfers to the DACF were budgeted at 577.4 billion cedis, around 4 percent of the total primary expenditure budgeted in 2003.
Table 2: Poverty spending by sub national levels of government
(billion cedis)
2002 Actual
2003 Budget
Total poverty spending (GoG+ Donor)1 3,593.0 5,328.4 Of which, Subventions to sub national levels, excl. HIPC funds (DACF) 214.5 318.2 DACF subventions as a percentage of total poverty spending 6% 6% HIPC allocations to District Assemblies (DA) 117 170 HIPC allocations to DA�s as a percentage of total poverty spending 3.3% 3.2% Source: GoG 1. Poverty spending as defined in Indicator 6. The Local Government Act 1993 sets out the revenue raising powers of the DAs (Schedule 6), which includes a range of fees, licenses and taxes. Although DAs are required by the LGA 1993 to produce budgets, regular expenditure reports and audited accounts. These are not provided in a comprehensive or timely manner. It is therefore difficult to quantify the amount of internally generated funds (IGF), and therefore the total spending envelope, available to DAs for poverty reduction. In the absence of comprehensive and reliable reports, it is thought that local government in Ghana carries out a relatively small proportion of total and poverty-reducing spending and is therefore excluded from this assessment.
3 The 1992 Constitution (Article 252[2]) states that Parliament shall allocate annually not less than 5percent of total revenues to the DAs for development. This is disbursed through the DA Common Fund (DACF).

- 8 -
III. BUDGET FORMULATION
Indicator 1 ~ Coverage of the budget or fiscal reporting entity
Question: How well does the coverage of fiscal information match the Government Finance Statistics (GFS) definition of the general government sector?
Benchmark: (A) - Very close fit. Fiscal reporting covers the GFS definition of the general government sector, i.e., including central, regional, and local governments, and all government operations, whether funded through the budget or not. Assessment: (B) - Quite close fit. This benchmark is not met. Ex-ante and ex-post fiscal reports that are produced in a timely manner capture fiscal information estimated to cover less than 95 percent (by value) of general government operations as defined by the GFS.
The paucity of comprehensive, reliable and timely fiscal data hampers the government�s ability to compile consolidated information on budgets and outturns. No consolidated finance statistics (or equivalent fiscal report) is available for general government. The coverage of budgets, as well as of the separate financial accounts, produced by or for the institutions making up general government sector is below the 95 percent benchmark established for the indicator. General government in Ghana is made up of 39 ministries, departments and subvented agencies (around 170), statutory funds4, and metropolitan, municipal and district assemblies (MMDAs). The annual budget presented to Parliament covers the general operations of the central government, including external loans and grants from donors, and grants to sub-national government. The sub-national government mainly comprises 110 District Assemblies (DA), although traditional leaders at the local level also receive transfers from central government. Although DAs are required by the Local Government Act 1993 to produce budgets, regular expenditure reports and audited accounts, these are not provided in a comprehensive or timely manner5. District Assemblies also raise internally generated funds 4 These funds are the District Assemblies Common Fund (DACF), the Road Fund, the Ghana Education Trust Fund (GETF) and the Petroleum Related Fund. A National Health Fund was also introduced in the 2004 Budget. 5 In accordance with the District Assemblies Common Fund (DACF) Act 1993, District Assemblies receive 5 percent of tax revenues through the DACF. According to the latest available report by the Administrator of the DACF (for 2000), �its very difficult to monitor the way the common fund is spent by the assemblies. This is due to lack of logistics and financial support.� The latest audited report from the DA refers to FY1996.

- 9 -
(IGFs), which increases the total spending envelope available to this tier of government (see indicator 2 for an estimate). The paucity of information from this tier of government pushes the coverage for this indicator close to below the 95% coverage level (Table 3).
The GoG has launched an initiative to produce a �composite budget� for DAs. The composite budgets would serve an informational purpose mostly as they would incorporate expenditure under different jurisdictions � central government and the district assemblies. A pilot exercise was completed in three DAs (Akwapim North, Dangme East and Dangme West) in April 2004 aggregating the budgets of the decentralized departments together with the central administration budget of the DAs into a composite budget. It is GoG�s intention that this exercise be rolled out nationally and eventually provide the basis for fiscal reports that include all tiers of government. However, this initiative is likely to take a number of years. In recent years the GoG has taken a number of other steps towards improving the comprehensiveness of the annual budget presented to Parliament, including a review of the �Nature of Government�6. Transfers for petroleum and utility subsidies are now reported in the budget as Grants-In-Aid (GIA)�these are undertaken in Ghana through entities that are outside the budget, including non financial public enterprises (NFEs). The budget also reflects payments to statutory funds, who prepare their own budgets (see table 3). Transfers to the Social Security and National Insurance Trust (SSNIT) are also recorded in the budget. Subvented agencies submit budgets to their Ministries which then present a consolidated budget for the Ministry to the MoFEP. Fiscal and quasi-fiscal activities carried out by state-owned enterprises on behalf of government are not included in the budget or in the reporting, with the exception of the utility price subsidies. Table 3: Statutory Funds and utility price subsidies included in the central government budget
2002 2002 2003 2003 2004 2004 Outturn Outturn Outturn Outturn Budget Budget
(cedis bn) (% total exp.)
(cedis bn) (% total exp.)
(cedis bn) (% total exp.)
DACF 258.2 2.4% 581.6 3.7% 787.2 4.2% Road Fund 312.1 2.9% 515.6 3.3% 607.7 3.2% Ghana Education Trust Fund (GETF) 164.6 1.5% 707.9 4.5% 810.5 4.3%
Petroleum Related Fund 128.1 1.2% 66.1 0.4% 74.6 0.4% Utility price subsidies 449.9 4.2% 272.5 1.7% 392.0 2.1% National Health Fund n.a. n.a. n.a. n.a. 420.4 2.2%
Source: GoG 2004 budget documents. Total primary government expenditure as defined by GFS. n.a. � not applicable.
- 10 -
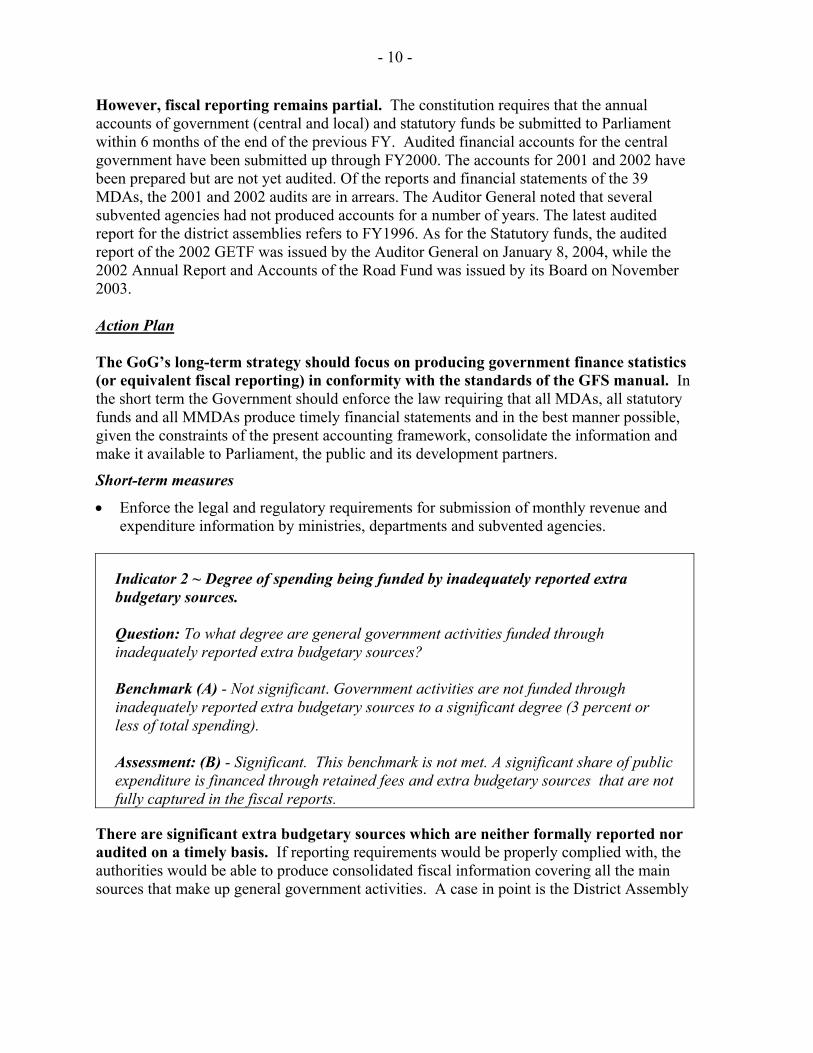
However, fiscal reporting remains partial. The constitution requires that the annual accounts of government (central and local) and statutory funds be submitted to Parliament within 6 months of the end of the previous FY. Audited financial accounts for the central government have been submitted up through FY2000. The accounts for 2001 and 2002 have been prepared but are not yet audited. Of the reports and financial statements of the 39 MDAs, the 2001 and 2002 audits are in arrears. The Auditor General noted that several subvented agencies had not produced accounts for a number of years. The latest audited report for the district assemblies refers to FY1996. As for the Statutory funds, the audited report of the 2002 GETF was issued by the Auditor General on January 8, 2004, while the 2002 Annual Report and Accounts of the Road Fund was issued by its Board on November 2003. Action Plan The GoG�s long-term strategy should focus on producing government finance statistics (or equivalent fiscal reporting) in conformity with the standards of the GFS manual. In the short term the Government should enforce the law requiring that all MDAs, all statutory funds and all MMDAs produce timely financial statements and in the best manner possible, given the constraints of the present accounting framework, consolidate the information and make it available to Parliament, the public and its development partners.
Short-term measures
• Enforce the legal and regulatory requirements for submission of monthly revenue and expenditure information by ministries, departments and subvented agencies.
Indicator 2 ~ Degree of spending being funded by inadequately reported extra budgetary sources. Question: To what degree are general government activities funded through inadequately reported extra budgetary sources? Benchmark (A) - Not significant. Government activities are not funded through inadequately reported extra budgetary sources to a significant degree (3 percent or less of total spending). Assessment: (B) - Significant. This benchmark is not met. A significant share of public expenditure is financed through retained fees and extra budgetary sources that are not fully captured in the fiscal reports.
There are significant extra budgetary sources which are neither formally reported nor audited on a timely basis. If reporting requirements would be properly complied with, the authorities would be able to produce consolidated fiscal information covering all the main sources that make up general government activities. A case in point is the District Assembly

- 11 -
Common Fund which, as noted above (Table 3), in 2003 represented 3.7 percent of total spending. The latest DACF Annual Report submitted Parliament was for FY2000.
Moreover, some of the main MDAs generate significant IGFs that are not included in their budgets nor reported to the CAGD on a timely basis. For example, the MoE and the MoH raise a significant amount of IGFs. In its September 2003 quarterly financial report (that is separate from the reports produced by CAGD on the Consolidated Fund [CF]) the Ministry of Health indicated IGFs of 190 billion cedis, accounting for about 15 percent of total expenditures on health. Similarly, the Ministry of Education reported IGF of 114 billion cedis in 2003, while the budget for 2003 only included an estimated 12 million cedis to be used for acquiring shoes, school uniforms, bags and stationary for 80 needy pupils. A significant amount of IGFs that are retained by other MDAs also do not pass through the CF nor are they adequately disclosed. Moreover, a report prepared in the context of the Ghana Fiscal Decentralization Project - Design Report (September 2002) - estimated that the IGFs of the DAs constituted around 1.5 percent of total government revenues. The 2004 budget statement noted that all MDAs �who have legislative approval to retain and use non-tax revenue will now be required to programme these resources as part of their budgetary allocations, and submit on a monthly basis, full disclosure of the amount collected and how they have been utilized, as required by section 6(3), of the Financial Administration Act�. Certain ministries and their agencies generate their own resources, a percentage of which (3-10%) they are permitted by law to retain (for the revenue collection agencies these are recorded appropriately in the CF).
The Government of Ghana is endeavoring to collect information in IGFs by establishing a Non-Tax Revenue Unit (NTRU) in the MoFEP to assess and report the extent of such revenues and to build a complete picture of poverty related spending. The NTRU was established in 2002. The functions of the NTRU include: (1) facilitating the collection, accounting and reporting of non-tax revenues; (2) working with all agencies that generate internal funds to increase their revenue generation potential; (3) ensuring compliance with the policy on State Assets Management; and (4) ensuring that those institutions capable of generating sufficient IGFs for their operations, are moved from subvention status. The level of NTR reported as an outturn in the budget documents is about cedis 363.3 billion in 2003 (currently only a small fraction of this is recorded in the CAGD financial statements�cedis 28 billion was reported up to November 2003).
Action Plan The strategy should focus on disclosing fiscal activities of all units that carry out public activities.
- 12 -
Short-term measures
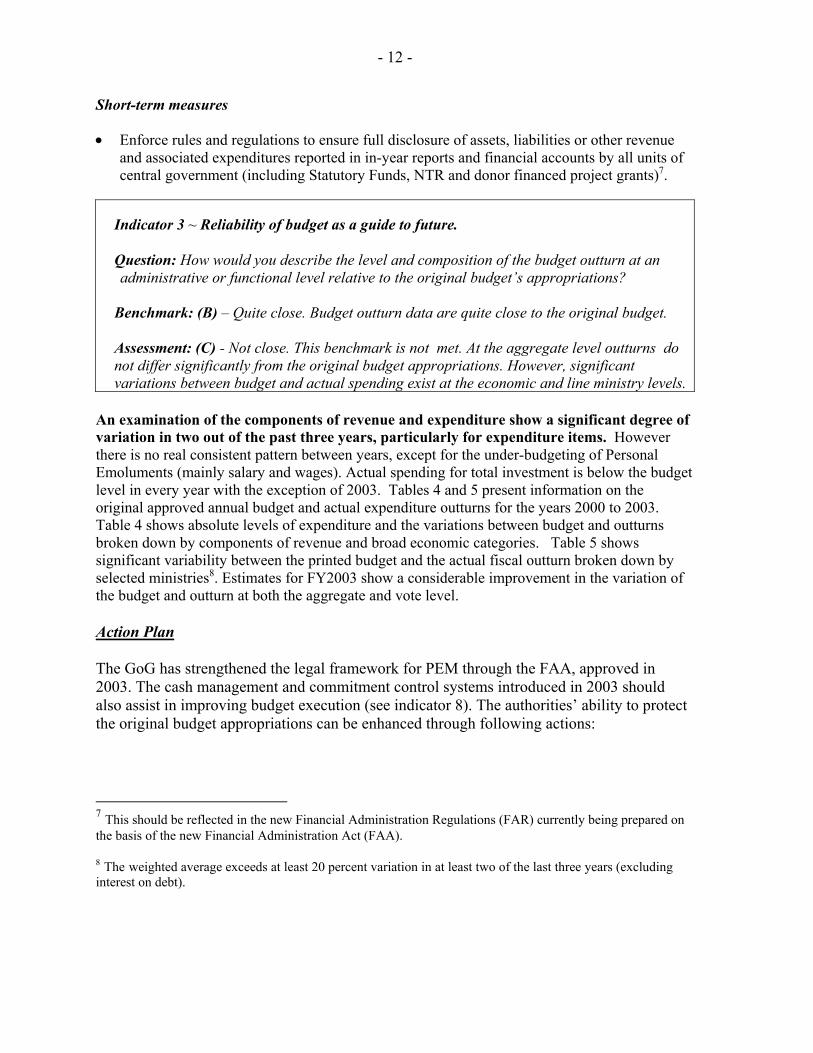
• Enforce rules and regulations to ensure full disclosure of assets, liabilities or other revenue and associated expenditures reported in in-year reports and financial accounts by all units of central government (including Statutory Funds, NTR and donor financed project grants)7.
Indicator 3 ~ Reliability of budget as a guide to future. Question: How would you describe the level and composition of the budget outturn at an administrative or functional level relative to the original budget�s appropriations?
Benchmark: (B) � Quite close. Budget outturn data are quite close to the original budget. Assessment: (C) - Not close. This benchmark is not met. At the aggregate level outturns do not differ significantly from the original budget appropriations. However, significant variations between budget and actual spending exist at the economic and line ministry levels.
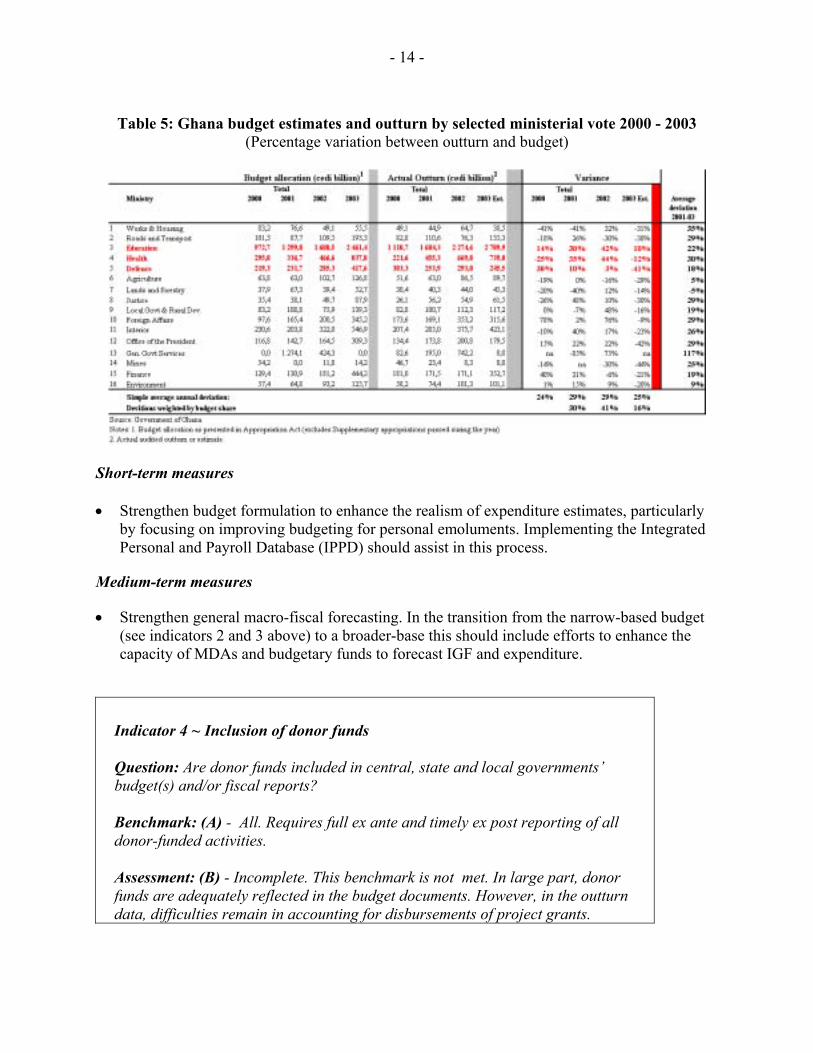
An examination of the components of revenue and expenditure show a significant degree of variation in two out of the past three years, particularly for expenditure items. However there is no real consistent pattern between years, except for the under-budgeting of Personal Emoluments (mainly salary and wages). Actual spending for total investment is below the budget level in every year with the exception of 2003. Tables 4 and 5 present information on the original approved annual budget and actual expenditure outturns for the years 2000 to 2003. Table 4 shows absolute levels of expenditure and the variations between budget and outturns broken down by components of revenue and broad economic categories. Table 5 shows significant variability between the printed budget and the actual fiscal outturn broken down by selected ministries8. Estimates for FY2003 show a considerable improvement in the variation of the budget and outturn at both the aggregate and vote level. Action Plan The GoG has strengthened the legal framework for PEM through the FAA, approved in 2003. The cash management and commitment control systems introduced in 2003 should also assist in improving budget execution (see indicator 8). The authorities� ability to protect the original budget appropriations can be enhanced through following actions:
7 This should be reflected in the new Financial Administration Regulations (FAR) currently being prepared on the basis of the new Financial Administration Act (FAA). 8 The weighted average exceeds at least 20 percent variation in at least two of the last three years (excluding interest on debt).

- 13 -
Table 4: Ghana budget estimates and actual expenditure 2000 � 2003 (billions of cedis)
- 14 -
Table 5: Ghana budget estimates and outturn by selected ministerial vote 2000 - 2003
(Percentage variation between outturn and budget)
Short-term measures • Strengthen budget formulation to enhance the realism of expenditure estimates, particularly
by focusing on improving budgeting for personal emoluments. Implementing the Integrated Personal and Payroll Database (IPPD) should assist in this process.
Medium-term measures
• Strengthen general macro-fiscal forecasting. In the transition from the narrow-based budget (see indicators 2 and 3 above) to a broader-base this should include efforts to enhance the capacity of MDAs and budgetary funds to forecast IGF and expenditure.
Indicator 4 ~ Inclusion of donor funds Question: Are donor funds included in central, state and local governments� budget(s) and/or fiscal reports? Benchmark: (A) - All. Requires full ex ante and timely ex post reporting of all donor-funded activities. Assessment: (B) - Incomplete. This benchmark is not met. In large part, donor funds are adequately reflected in the budget documents. However, in the outturn data, difficulties remain in accounting for disbursements of project grants.

- 15 -
External assistance in grants and loans is appropriately included ex-ante in the central government budget. However, ex post coverage of foreign aid in the budget and fiscal reports is limited. Estimates of donor inflows are included, detailed by MDAs, in the Annual Budget and the Medium-Term Expenditure Framework. As for the outturn data, budgetary support and HIPC assistance is appropriately accounted for in the monthly Consolidated Fund statements issued by CAGD. Loan disbursements are captured by the Aid and Debt Management Unit (ADMU) of MoFEP. In total, these inflows represent about 83 percent of foreign aid. As for project grant-financed expenditure, coverage has also been improving due to improved data from MDAs and information supplied directly by the donors. As a result, ADMU now has reports from ten major donors (Canada, Denmark, France, Germany, The Netherlands, United Kingdom, ADF, European Commission, IDA, and UNICEF). While not all partners have yet provided information, this represents significant progress. Reported progress reflects ADMU efforts, since October 2002, to establish a formal system for tracking donor flows, based on quarterly reporting by donors. However, ex-post consolidated estimates of foreign aid by MDAs, similar to those in the original budget presentation, are not included in the budget outturns and fiscal reports. The government has introduced a number of measures to improve the coverage of donor data in the budget. As detailed in its Annex 1, the �Guidelines for the preparation of the 2004 -2006 budget�, dated 8th October 2003, stipulated that MDAs should reflect in their budgets the matching funds for 2004. Indicative estimates of the donor inflows are also included in the MDA expenditure ceilings circulated with these guidelines. Separately, the government has circulated a format to all donors, and is now receiving data from many of them, on the likely donor inflows for the purpose of cross checking the data. At the local government level this data is yet to be captured, however donor assistance is mostly channeled through the central government. Action Plan GoG needs to improve ex-post integration of donor inflows in the financial reports of MDAs. While the authorities have established mechanisms that allow for the coverage of a significant share of donor inflows, budgetary support and loans, continued efforts are required to better capture and report project grants and improve access to and transparency of information on donor assistance to enhance accountability in the public sector. Short-term measures • Enforce new FAR to ensure project managers report to MoFEP timely and in a standardized
manner on grant funded activities.
• Integrate in financial reports of MDAs all resource inflows through grants and loans.
- 16 -
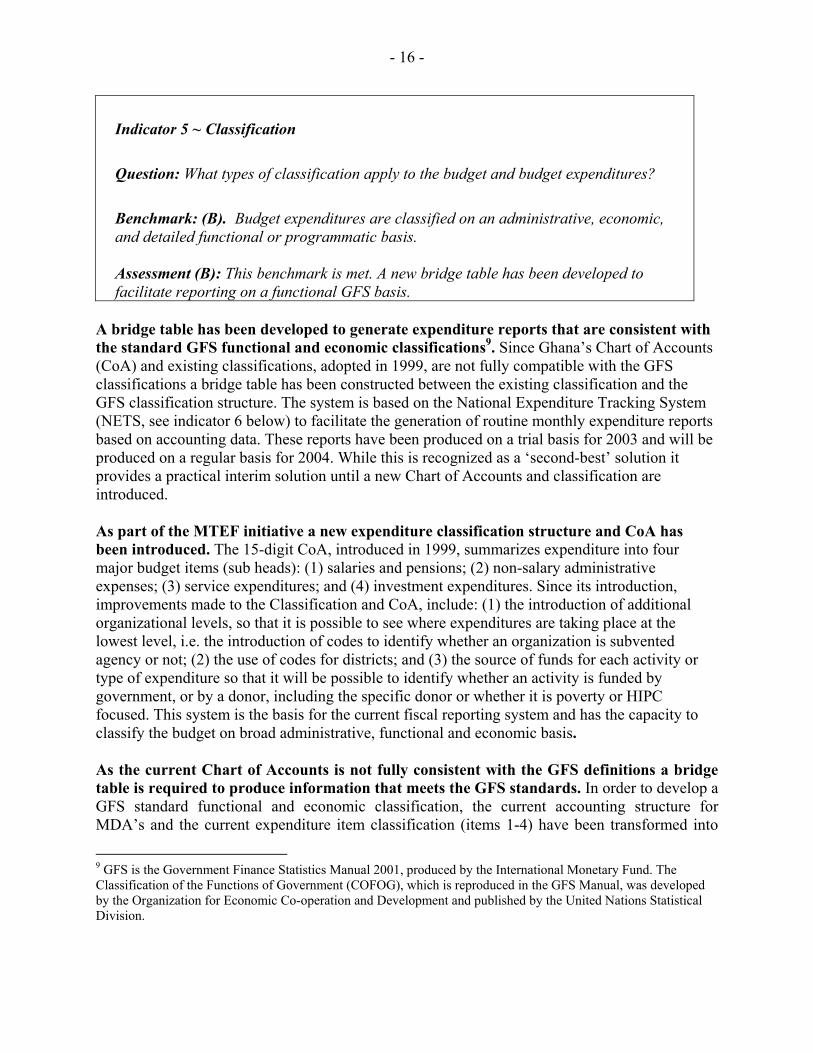
Indicator 5 ~ Classification
Question: What types of classification apply to the budget and budget expenditures?
Benchmark: (B). Budget expenditures are classified on an administrative, economic, and detailed functional or programmatic basis. Assessment (B): This benchmark is met. A new bridge table has been developed to facilitate reporting on a functional GFS basis.
A bridge table has been developed to generate expenditure reports that are consistent with the standard GFS functional and economic classifications9. Since Ghana�s Chart of Accounts (CoA) and existing classifications, adopted in 1999, are not fully compatible with the GFS classifications a bridge table has been constructed between the existing classification and the GFS classification structure. The system is based on the National Expenditure Tracking System (NETS, see indicator 6 below) to facilitate the generation of routine monthly expenditure reports based on accounting data. These reports have been produced on a trial basis for 2003 and will be produced on a regular basis for 2004. While this is recognized as a �second-best� solution it provides a practical interim solution until a new Chart of Accounts and classification are introduced. As part of the MTEF initiative a new expenditure classification structure and CoA has been introduced. The 15-digit CoA, introduced in 1999, summarizes expenditure into four major budget items (sub heads): (1) salaries and pensions; (2) non-salary administrative expenses; (3) service expenditures; and (4) investment expenditures. Since its introduction, improvements made to the Classification and CoA, include: (1) the introduction of additional organizational levels, so that it is possible to see where expenditures are taking place at the lowest level, i.e. the introduction of codes to identify whether an organization is subvented agency or not; (2) the use of codes for districts; and (3) the source of funds for each activity or type of expenditure so that it will be possible to identify whether an activity is funded by government, or by a donor, including the specific donor or whether it is poverty or HIPC focused. This system is the basis for the current fiscal reporting system and has the capacity to classify the budget on broad administrative, functional and economic basis. As the current Chart of Accounts is not fully consistent with the GFS definitions a bridge table is required to produce information that meets the GFS standards. In order to develop a GFS standard functional and economic classification, the current accounting structure for MDA�s and the current expenditure item classification (items 1-4) have been transformed into
9 GFS is the Government Finance Statistics Manual 2001, produced by the International Monetary Fund. The Classification of the Functions of Government (COFOG), which is reproduced in the GFS Manual, was developed by the Organization for Economic Co-operation and Development and published by the United Nations Statistical Division.

- 17 -
the GFS classification on the basis of each of the roughly 2,650 cost centers in Ghana. Each cost centre has been designated a 5 digit GFS code that details the main (division) code (3-digits), the sub category (Group) code (1-digit) and the sub sub category (Class) code (1-digit) (see Appendix 1 for a more detailed discussion of the bridge table). By disaggregating the level of data used to compile the bridge table, to cost centers, the reports should be sufficient to meet the Government�s requirements for fiscal management and internal reporting, as well as providing the basis for cross country comparison. As a �second best solution� to a new CoA and classification system, the bridge table has some drawbacks. For example, if a cost center belonging to the education ministry is carrying out some minor activities related to sanitation (or has a sanitation program in schools) the bridge table cannot classify them under Health. A review of these activities and a comparison between the current fiscal reports and those provided by the bridge table suggests that this problem is relatively minor. A further change to the classification system is in the process of being implemented as part of the development of BPEMS. The Budget and Public Expenditure Management System (BPEMS) is an information management system and provides for a significant increase in the number of segments and digits (47) in the CoA. The new CoA is being implemented in the MoFEP and CAGD on a trial basis, in parallel to the existing system. The functional base of the new budget classification has a three tier structure: Objectives, Outputs and Activities, though it is not yet possible to report on an Objective basis. Given that the BPEMS is still being developed, the staff could not determine whether the classification system, when fully introduced, will be fully compatible with the GFS Functional Classification. It is important that the Government ensure that the new system is fully consistency with the COFOG functional classification. This benchmark is assessed to have been met, because reasonably satisfactory reporting arrangements are in place to allow functional analysis of expenditure using the bridge table. Action Plan Short-term measures
• For 2004 onwards, produce regular fiscal reports on the basis of the GFS detailed functional and economic classification. In this respect it is important to review the BPEMS related CoA and classification system to ensure full consistency with the COFOG functional classification.

- 18 -
Indicator 6 ~ Identification of poverty-reducing spending
Question: What is the principal means for tracking poverty-reducing spending? Benchmark: (A). Poverty-reducing expenditures are clearly identified and tracking uses existing budgetary or treasury accounting classification system.
Assessment (A): This benchmark is met. Ex-ante and ex-post poverty related expenditures, are tagged within the existing classification and these are reflected in the Annual Budget documents and quarterly execution reports.
In February 2002, the Government identified poverty-related expenditures (see Table 6, HIPC Decision Point Document, Report No. P-7509-GH, February 4, 2002). Subsequently, a �Poverty and HIPC related Accounting Manual� was adopted in July 2002. A system called the National Expenditure Tracking System (NETS) has been put in place to track poverty as well as general GoG expenditures that pass through the CF (see Indicator 12 and Appendix 1).
Table 6: Poverty-Related Expenditures, 2002-2004
2002 2003 2004 (in % of GDP unless otherwise specified) Est. Est. Proj. Total Poverty Related Expenditure 1/ 4.8 6.5 6.9 as a % of Total Expenditure 21.7 27.3 28.5 Basic Education 2.8 3.6 3.3 Primary Health Care 0.6 1.0 1.5 Agriculture 0.2 0.2 0.2 Rural Water 0.1 0.1 0.2 Feeder Roads 0.3 0.5 0.4 Rural Electricity 0.1 0.1 0.2 Other Poverty Related Expenditure 0.7 1.2 1.1 Memorandum items: Total Expenditure 2/ 21.9 23.7 29.0 Total Expenditure 2/ (billions of cedis) 10,716 15,673 19,173 Nominal GDP (billions of cedis) 48,862 66,158 78,650 Source: Ghanaian authorities and staff estimates and projections 1/ Excluding externally financed expenditures 2/ Including externally financed expenditures and excluding interest

- 19 -
Poverty related spending tracking is integrated in the existing budget process, without developing new management systems. The budget and MTEF documents for 2003 and 2004 identify poverty related expenditures by MDA�s that are subsequently monitored throughout the year. Modifications were introduced within the consolidated line item budget in the form of a special poverty related coding. The NETS system is operated by CAGD to track domestically-financed budget execution of discretionary expenditures by MDAs (including funding from HIPC relief). On the basis of NETS reports and supplementary information of extra-budgetary poverty spending, financed by GETF, DACF and Road Fund, a unit in the MoFEP generates quarterly reports of actual poverty- related expenditures, about 8 weeks after the end of each quarter. This reasonably detailed information is reported quarterly to Ghana�s main development partners (Table 6), who have formed a Multi Donor Budget Support Group (MDBS).
Indicator 7 ~ Integration of medium-term forecasts. Question: How would you describe the application of the out-year estimates (medium term) for spending? Benchmark: (A). Multi-year expenditure projections are integrated into the budget formulation process.
Assessment (B): This benchmark is not met. Projections exist, but are not integrated into the budget formulation cycle.
Projections presented in the budget for the two out-years do not reflect a detailed costing of programs or sector priorities. The budget is a three-year rolling budget and comprises of the budget for the current year and indicative figures for the next two years. (Ref. 2003 budget statement appendix 5 & 6, pages 156 and 157). The projections for the out-year are displayed in the budget documents and presented to Parliament for approval. However, the figures for the latter two years appear to have been derived by applying uniform growth factors�GoG and donor-financed spending respectively�to the budgeted expenditure for the different functional areas and the different MDAs for the first year. The uniform growth factors implicit in the 2004 budget (Table 5) are10:
Growth factors applied to the 2004 MTEF 04 ⇒ 05 05 ⇒ 06 GoG-financed 14.2 % 14.0 % Donor-financed 3.9 % 7.3 %
Source: GoG budget documents.
10 In the detailed MDA budgets for 2003, on the other, hand a uniform growth factor of zero has been applied; i.e. spending in the out-years is presumed to be equal to that of the first year.
- 20 -
The factors applied are derived from the GoG�s growth scenario. However, this approach does not reflect a detailed costing exercise for ongoing and planned programs nor does it reflect any changes in sectoral prioritization based on the GPRS.
The budget process has been revamped with the objective of institutionalizing a reflection of policies, priorities and experiences so as to give a clearer guidance to decisions on the composition of the budget. The budget preparation process now incorporates: GPRS workshops for the MDAs; Policy Review Workshops for the MDAs; Intrasectoral Meetings for the MDAs (five broad sectors); and Strategic Planning and Costing Workshops for the MDAS. So far these new processes appear to have had a limited impact as regard the setting of expenditure ceilings in the two out-years of the MTEF.
The new budget process is designed to involve both top down processes to maintain fiscal discipline and allocate resources in line with priorities and a bottom up process in which MDA's prepare Strategic Plans and Activity based budgets. (Source: Medium Term Expenditure Framework Draft Handbook page 19). The activity budgets should constitute the link between policies spelt out in the GPRS and the MTEF budget. However, only Service Activity Expenses and Investment Activity Expenses (Items 3 and 4 in the budget) are allocated to activities. All Personal Emoluments and all Administration Expenses are treated as overhead.
The apparently mechanical exercise underlying the MTEF for the two out-years is a concern as these figures are presented as �discretionary expenditure ceilings�. If these ceilings were to be adhered to, they would lock spending into the pattern of 2004. This may be sub-optimal from the perspective of changing the policy priorities to reflect the GPRS. Action Plan Short-term measures • Complete the MTEF costing manual methodology with a view to incorporate items 1 and 2
in the costing of the activities. • Evaluate possible advantages of grouping activities into programs. Medium-term measures • Ensure that for the 2005 and future budgets, the multi-year forecasting, policy definition,
reviewing and prioritization process (i.e. the components of the adopted MTEF framework) are implemented as intended.
• Review the basis and level of detail of the appropriations with a view to make the budget
more outcome-focused and less constraining in the detail.

- 21 -
IV. BUDGET EXECUTION
Indicator 8 ~ Evidence of budget execution problems � Arrears Question: What do you estimate as the level of the stock of expenditure arrears at the end of the last financial year? Benchmark (A). Very few or none. Small stock of expenditure arrears, with little accumulation of arrears over the previous year.
Assessment: (A). This benchmark is met. Arrears have been reduced in 2003, but a small stock (including intra-government) remains to be regularized.
The GoG has cleared a significant portion of arrears during 2003 and introduced a new commitment control system in September. The new system has the following key features: (1) centralized commitment control by the CAGD over salaries, which included procedures to clean up the payroll data and establish baseline data for the 2004 budget. New guidelines have also been issued to ensure regular verification and audit of payroll data and expenditure; (2) centralized commitment of debt service payments by the MoFEP; and (3) the designation of Commitment Control Officers (�CCO�) in each MDA, together with detail guidelines and training to open and maintain a �Vote Book / Service Ledger�, which forms the basis of commitment control by each MDA for its other items of expenditure. The broad steps for commitment and payment control are now as follows: (1) the Cash Management Implementation Committee (�CMIC�) in the MoFEP provides guideline quarterly allocations based on the appropriated budget to MDA�s; (2) MDA�s in return plan their expenditure and provide detailed cash plans to the CMIC and the Public Expenditure Management Unit (�PEMU�) in MoFEP; (3) based on revised allocations, the Director of Budget in MoFEP authorizes cash releases by the CAGD into the bank account of each MDA; (4) using the prescribed �Vote Book / Service Ledger�, the CCO implements procedures in the MDA to ensure prior commitment approval for purchases in accordance with available cash. He / she also has the explicit responsibility to ensure that no unpaid bills are accumulated and a guideline of payment of 30 days after receipt of invoice is in effect, unless terms of purchases as agreed specify otherwise; (5) payment of invoices is executed by the CAGD Treasuries, which ensures that invoices had prior commitment approval and that available cash balances are not exceeded; and (6) monthly returns on commitments not yet discharged and invoices not yet paid are made by all MDA�s to the CMIC and PEMU. To facilitate implementation of the new system, the GoG has also carried out a systematic audit of arrears and initiated a process to clear a significant portion of these arrears. As a result the GoG reported accelerated payment of road arrears totaling 183.8 billion cedis, and non-road arrears totaling 210.1 billion cedis during 2003. Disputed claims totaling 206 billion cedis are pending and awaiting court judgments to support clearance or not. A schedule reflecting arrears of 18.5 billion cedis as of 30 December 2003, supported by commencement warrants, has been received from the GoG. These arrears represented 0.12 percent of total expenditure estimated at 15,673 billion cedis.
- 22 -
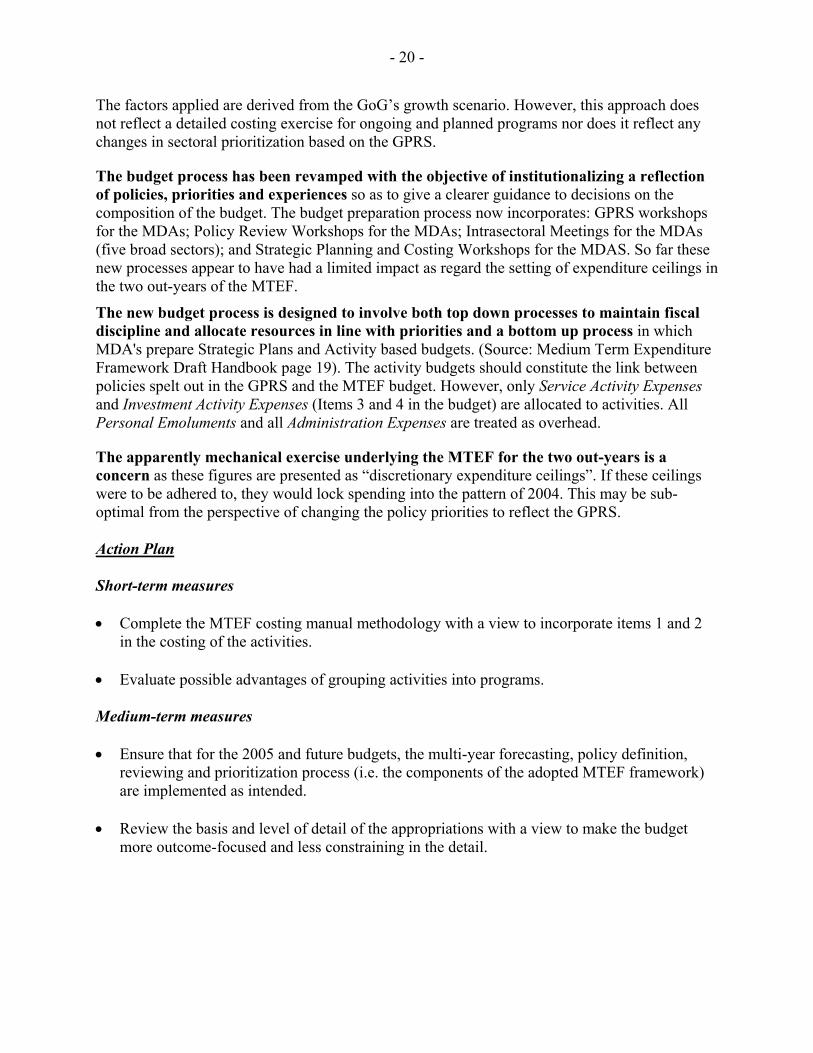
Table 7: Pending Claims (as of Dec. 31, 2003, in billion cedis)
Arrears Age Profile Total 30-60 days 60-90 days 90 days or more With commencement warrants
2.6 2.8 2.9 8.3
Without commencement warrants
0.5 2.4 7.3 10.2
Total arrears 3.1 5.2 10.2 18.5 A report from GAS on the verification of inter-indebtedness between the GoG, Volta River Authority, Electricity Company of Ghana, Ghana Water Company Limited and Tema Oil Refinery, indicated the following inter-indebtedness as of 30 June 2003: Inter-indebtedness Billion cedis GoG TOR GWCL VRA ECG Gross Debt Net Debt GoG 107,3 131,7 112,3 351,3 -640,5 TOR 214,6 214,6 107,3 GWCL 961,1 208,1 1169,2 1037,5 VRA 777,2 777,2 -1014,0 ECG 830,1 830,1 509,7 991,8 107,3 131,7 1791,2 320,4 0 The 214.6 billion cedis owed by TOR represents a preliminary finding by the Auditor General pending the determination of the actual TOR indebtedness to GoG. If it is included, net receivables of GoG vis-à-vis the five utilities is 640.5 billion cedis. If it is not, net receivables amount to 425.9 billion cedis. In case inter-indebtedness between GoG and public utilities (351,3 billion cedis) is added to the above mentioned stock of arrears (Table 7), the total represents slightly more than two percent of total expenditures.
This benchmark is assessed to have been met as the level of arrears appears to be less than 5 percent of total expenditures. While it is not possible to provide and exact figure on arrears in a cash based accounting system, such as Ghana�s, there is considerable evidence that recently audited arrears have been cleared. A new commitment control system is likely to have reduced the accumulation of new arrears and there is little secondary evidence of additional arrears, such as public claims from companies. Nonetheless, the GoG still needs to be vigilant and to ensure that the Commitment Control System is stringently enforced and any inter-government indebtedness is regularized.
Action Plan Short-term measures • Develop summarized information from the commitment control system to monitor the level
and age of invoices.

- 23 -
• Formalize the guideline to pay invoices within 30 days in financial regulations and develop sanctions for non-adherence.
Indicator 9 ~ Effectiveness of the internal control system Question: How would you describe the internal control system? Benchmark: (A). Internal control system is effective. Assessment (B): The internal control system is partially effective. The benchmark is not met.
The GoG has established a system of internal control for government as a whole, but compliance to relevant laws and financial regulations that govern it is weak. This is confirmed in a number of audit reports and also the PETS studies as discussed in Indicator 10 below. This system is largely static and not responsive to risk. The main focus is on compliance with laws and regulations. In general, line agencies do not actively follow through their internal control systems by way of implementing incentives and sanctions to influence staff behavior. Also missing is a sense that management should use its system of internal controls to achieve its objectives whilst managing its risks. Internal auditors, currently still under the supervision and direction of the CAGD, carry out four main types of audit: • Pre-examination of payment orders • Physical verification of goods received (equipment and stock) • Reviews of control systems • Ad hoc investigations
The first two account for most of the time spent by internal auditors, as the aim is to examine 100% of cases. The CAGD issues guidance to internal auditors in the form of circulars but no formal audit standards or internal audit guidelines exists. To improve the internal control system several initiatives have been launched, but await effective implementation: • A new Internal Audit Agency Act (IAA) has been passed (Act 658) in December 2003.
Under this act the IAA would co-ordinate, facilitate and provide quality assurance for internal audit activities and set standards for MDA�s and MMDA�s and ensure their good management. All MDA�s/MMDA�s would establish internal audit units (IAUs) and these would be staffed with competent auditors. Internal auditors would report to their relevant management with copies to IAA and the Auditor General. Members of the Internal Audit Agency Board were appointed by the President and their inauguration is planned for June 2004. The position of Director General of the IAA has already been advertised and selection to fill the position is expected by the end of July 2004.
- 24 -
• New financial regulations are being drafted to support the implementation of new processes envisaged under BPEMS. This provides an opportunity to strengthen the internal control systems in the GoG.
Action Plan
Short-term measures
• Inform all managers on their fiduciary responsibility to manage risk.
• Enforce effective sanctions to improve internal control systems in MDA�s.
Medium-term measures
• Develop and launch an appropriate and cost-effective strategy to implement the new IAA Act and improve the effectiveness of internal audit.
Indicator 10 ~ Tracking surveys are in use
Question: Is internal control supplemented by public expenditure tracking surveys (PETSs) that follow funds to the ultimate service provider or beneficiary?
Benchmark: (B). Tracking surveys are used, where necessary, to supplement internal control, but may not yet be a regular feature of the PEM system.
Assessment:(B). This benchmark is met. Poverty Expenditure Tracking Surveys (PETS) have been undertaken in some sectors and at the district level (2003) but are not yet a regular feature of the PEM system.
PETS have been undertaken but are not yet a regular feature of the PEM system. Tracking surveys seek to estimate the amount of public money that is actually channeled through the budget system to service delivery units, including decentralized spending entities. These surveys provide a double check on the quality of internal control systems and are more sharply focused than regular external audits. With the introduction of the NETS system, spending through the CF can be reliably tracked (but coverage is incomplete � see Indicators 1 and 2). Following the 2000 PETS in education and health, a number of studies in 2003 identified serious problems with the design and implementation of the exemption policy in the health sector suggesting that only a minor share of appropriated resources benefit the poor. Awareness is increasing of the importance to further participation in the management of public resources and monitoring and evaluation of public expenditure. In May 2002, a workshop was convened by the Ministries of Finance and Economic Planning and Regional Integration to: (i) share global and Ghanaian experiences related to participatory mechanisms for social and public accountability; (ii) identify critical issues and approaches for strengthening social and public accountability; and (iii) identify concrete actions and initiatives to be elaborated and undertaken in the next 12 months by civil society organizations.
- 25 -
A pilot tracking study focusing on four District Assemblies took place between April and July 2003, covering the period from January 1999 to December 2002. On behalf of a group of representatives of Civil Society Organizations (CSOs), the Integrated Social Development Centre (ISODEC), a non-government organization, conducted a study entitled �Tracking the Disbursement of the District Assemblies Common Fund (DACF)�. The pilot study took place between April and July 2003, and covered the period from January 1999 to December 2002 and focused on tracking of the DACF in four District Assemblies. Action Plan
Short-term measures • Launch PETS in 2-3 sectors. Medium-term measures • Establish a PETS multiyear program to institutionalize them as a regular tool to track the use
of public monies against their intended purposes according the voted budgets.
Indicator 11 ~ Quality of fiscal information
Question: Is there regular reconciliation of all government bank accounts (those held in the central bank and the commercial banks) with the government�s accounting records? Benchmark: (A). Satisfactory reconciliation of fiscal and banking records is undertaken routinely. Assessment (A): Bank reconciliations are undertaken on a monthly basis in a routine way. This benchmark is met.
A monthly reconciliation statement for each bank account is produced. Samples of these have been received and reviewed. It reflects the normal bank reconciliation methodology, contains adequate detail of cash book and bank account balances, clearly identifies the items not yet cleared through each and also indicates that most of the items are in fact cleared in the immediate following month. Authority to open bank accounts for the Government of Ghana is vested in the Controller and Accountant General. To support the operations of MDA�s budgeted and reported under the Consolidated Fund (narrow-based), the Controller and Accountant General has opened a bank account for each MDA for non-salary expenditures. Payments and receipts against these bank accounts are controlled and accounted for by 125 Treasuries, serving the accounting needs of MDA�s. Monthly cashbooks are produced (mostly

- 26 -
manual) and sent to Accra, where the Office of the Controller and Accountant General captures the transactions into a central computerized ledger and since mid-2002 performs a regular and routine bank reconciliation on each account. Items on the reconciliation that are the result of timing differences normally clear within 1 month. Items that require investigation of source documentation takes longer, since the Office of the Controller and Accountant General needs to go back to all 125 Treasuries in order to find the supporting documentation to classify and record the transaction appropriately. Clearing unreconciled transactions that originated in districts may take up to 5 months because of the manual procedures involved, but the volumes and values associated with this are considered not material and the clearance of these items is well tracked. Most of the big volume and big value transactions (more than 92 percent of the value of all transactions through the Consolidated Fund) are appropriately recorded and cleared within 2 months, as reflected in table 8.
Table 8. Reconciliation of fiscal and banking records through the Consolidated Fund
Item
Actual expenditure up to 30 November
2003 (cedi billion)
% of total expenditure
Clearance of reconciling items
Salary (Item 1 expenditure) 5,795 44% Within 1 to 2 months Non-salary (Item 2, 3 expenditure) 857 7% Within 1 to 5 months Non-salary (Item 4 expenditure) 150 1% Within 1 to 5 months Other 548 4% Within 1 to 2 months Interest 2,672 20% Within 1 to 2 months Transfers to funds 2,226 17% Within 1 to 2 months HIPC Expenditure 635 5% Within 1 to 2 months Contingency Expenditure 224 2% Within 1 to 2 months
Actual expenditure up to 30 November 2003 13,107 Source: GoG
In addition the Government of Ghana has now extended the NETS system to all regions by the end of January 2004, which will further facilitate even timelier bank reconciliation by allowing electronic capturing of transactions at the regional level. Consideration is also being given to add a Treasury code to checks in order to identify which Treasury needs to be contacted to find source documentation for unreconciled items.

- 27 -
V. BUDGET REPORTING
Indicator 12 ~ Regularity of timely internal fiscal reporting
Question: When are budget-tracking reports from line ministries, other spending units and the treasury received by the central financial authority? Benchmark: (B). Internal budget reports are received within four weeks of the end of the relevant period.
Assessment (C): Internal budget reports are received more than four weeks of the end of the relevant period. This benchmark is not met.
Since mid-2003, the CF monthly accounts are sent for publishing (the required regulation) in the gazette in about 8 weeks after the end of the month. The accounts for June 2003 were sent on 26 August 2003; the accounts for July 2003 were sent on 12 September 2003 and for August 2003 on 5 November 2003.
In essence there are three main sources of authentic accounting data: budget accounts maintained by MDA�s, treasury accounts maintained by CAGD and payments made by BoG on behalf of government.
The CAGD developed a relatively rapid reporting system based on the transcript data provided by Treasuries in Accra and the Districts. Monthly cash book data are submitted by 125 treasuries to the CAGD (Main Accounts Department) and entered into a general ledger accounting package (ACCPAC). Some treasuries have had ACCPAC installed on stand alone PCs and these can carry out data entry and send soft copies to the CAGD for entry into the consolidated system. Other CAGD centralized data processing sources (e.g. Personnel Emoluments, Public Debt, Tax Revenue, Special Funds etc) also records transactions in ACCPAC.
Based on the data captured ACCPAC/NETS facilitates the production of: • Monthly and cumulative detailed and summary budgetary performance statements for
government expenditure and revenue. These provide analysis by ministry and economic category and are also mapped to produce GFS reports.
• Information for the preparation of Annual Consolidated Fund Accounts. • HIPC tracking reports for monitoring poverty related expenditure. Currently these constitute the key fiscal reports available to MoFEP decision makers for overall analysis of government operations as well as providing information to other stakeholders (i.e. Parliament, development partners). It is this system that is used to generate specific-purpose reports such as those to be used for HIPC tracking.
- 28 -
Efforts are underway to improve the report generation to comply with the budgetary law requirements of six weeks at present. Action Plan
Short-term measures • Ensure full extension of the NETS to all regions.
• Introduce a Treasury code on checks to identify the location of source documents for unreconciled items.
Medium-term measures
Implement BPEMS to facilitate immediate recording of transactions, daily bank reconciliations and timely production of financial reports.
•
Indicator 13 ~ Regular fiscal reports track poverty reducing spending
Question: What in-year reports are published for tracking budget expenditure by function?
Benchmark: (A). Good-quality classification of poverty reducing spending is reflected in the in-year budget reports.
Assessment (A): This benchmark is met. Consolidated quarterly poverty spending reports are routinely produced with a lag of about eight weeks after the relevant quarter. The MoFEP consolidates the reports from CAGD, prepared on a broad activity, sub-sector and functional basis, and the regular supplementary information of extra-budgetary spending (see indicator 6) to produce in-year reports to track poverty reducing spending (this includes HIPC, GETF, DACF and Road Funds). The compilation process of in-year reports, which does not all come from the CAGD accounting system, is likely to suffer from accuracy and reliability problems. In addition, the paucity of the reporting of extra-budgetary spending for the DACF means that this source of information cannot be deemed reliable for in-year reporting. However, this is a relatively small portion of overall poverty spending (estimated at 7 percent of total poverty spending).

- 29 -
Table 9:
Total Poverty-Related Expenditures, GFS Functional Classification, Estimate 2003 (billions of cedis)
CF GETF DACF RF TOTAL General Public Service 0.2 0.0 0.0 0.0 0.2 Defense 5.8 0.0 0.0 0.0 5.8 Public Order and Safety 292.7 0.0 0.0 0.0 292.7 Economic Affairs 302.3 0.0 62.3 190.4 554.9 Environmental Protection 10.1 0.0 0.0 0.0 10.1 Housing and Community Amenities 327.4 0.0 47.6 0.0 375.0 Health 571.8 0.0 47.8 0.0 619.5 Recreation, Culture and Religion 8.2 0.0 0.0 0.0 8.2 Education 2,280.8 34.5 60.7 0.0 2,376.0 Social Protection 36.4 0.0 0.0 0.0 36.4 Total 3,835.5 34.5 218.3 190.4 4,278.8 Source: MoFEP
Regular monthly expenditure reports also identify HIPC financed spending and the majority of poverty related spending on a reasonably timely and reliable basis. The regular monthly reports from CAGD identify poverty reducing expenditures undertaken through the Consolidated Fund using the existing NETS system (see indicator 6). This includes all domestically-financed discretionary expenditures by MDAs including funding from HIPC debt relief. These reports are currently based on the broad GoG economic and functional classification structure and include poverty spending by MDA and by subhead (see indicator 5). While the existing classification of poverty reducing spending is not ideal, it is considered practical and has been ensuring timely (see indicator 12) and reasonable quality reporting for management purposes. With the addition of the bridge table (see below) to produce the information of a more standard functional basis, when required, this benchmark is met. Reports on poverty related spending using the GFS functional classification structure have recently been produced using a bridge table. As the budget and fiscal reports do not currently reflect the COFOG functional classification in the chart of accounts�as mentioned in Indicator 5�a bridge table provides the authorities with an interim means of reporting on a functional classification basis consistent with GFS (until the expanded Chart of Accounts developed under BPEMS can be fully implemented). The bridge table has recently been used to generate monthly reports on poverty related spending using the GFS functional classification structure (to the sub functional level).
Action Plan
Short-term measures
• From the first quarter of 2004, produce in-year (quarterly) reports that track poverty expenditures that include the use of the GFS bridge table for functional and economic classifications. These reports should be published on the Government�s website.
- 30 -
Indicator 14 ~ Transactions are recorded in the accounts in a timely fashion.
Question: What is the longest period between the end of the fiscal year and the routine booking of transactions ?
Benchmark: (A). Routine transactions are entered into the main accounting system(s) within two months after the end of the fiscal year.
Assessment: (A). Routine transactions are not processed after the end of the fiscal year and proper year-end closure procedures exist. This benchmark is met.
The CAGD is responsible for keeping and presenting annual financial statements for the Consolidated Fund (CF). Departmental financial statements are the responsibility of individual departmental heads as Accounting Officers. The CAGD has overall responsibility for maintaining professional accounting standards and ensuring that there are effective accounting systems in government departments. The CAGD must publish a monthly fiscal report and an annual financial statement for the Consolidated Fund after the year-end. The latter is to be sent to the Auditor-General and the Public Accounts Committee and is to be published within three months after the year-end.
To achieve the submission of the annual financial statements within 3 months after year-end, the CAGD substantially improved its control over bank accounts and bank reconciliations as discussed in Indicator 11 above. The introduction of regular monthly reporting as discussed in Indicator 12 above further assisted in the timely recording of accounting transactions. In addition, clear and concise written year-end closing instructions were issued by the CAGD, which effectively disallowed the processing of routine transactions for a fiscal year after its year-end and also required submission of reports by MDA�s to the CAGD in about two weeks after the year-end. Circular no. G9/2003, issued on December 1, 2003, established the instructions for the closure of the 2003 public accounts.
For 2002 the CAGD presented financial statements based on accounting data from Treasuries by the end of March 2003. This trend has continued for 2003, with the unaudited financial statements for the Consolidated Fund available at the end of March 2003.

- 31 -
Indicator 15 ~ Timeliness of audited financial information
Question: How soon after the end of the relevant year is the audit report on the annual accounts (either short form audit report accompanying the final accounts or as part of loi de reglement) presented to the public and/or the legislature? Benchmark: (B). An audited record of the financial outturn should be presented to the legislature within twelve months of the end of the fiscal year Assessment: (C). An audited record of the central government accounts has not been submitted within twelve months after the end of the fiscal year. Benchmark is not met.
There is an extensive backlog of audits. A summary of key audits in arrear is as follows: (i) Public Accounts for the Consolidated Fund: 2000; 2001; 2002; (ii) MDA Accounts: 2001; 2002; (iii) Special reports on the HIPC and GET funds; (iv) District Assemblies: 1997 onwards; (v) Report on Public Boards, Corporations and other Public Institutions: 2001; 2002; (vi) Foreign Exchange Receipts: 2001; 2002. A plan has been drafted to deal with the audit backlogs within 12 months and is currently being considered by the MoFEP for funding. In this regard it has been noted that entities that have not submitted annual financial statements will be supported financially to outsource the preparation of such statements for each year, each of which will then be audited and subjected to group review in a workshop.
The Auditor-General function originates from the Constitution, which provides for an Auditor-General (AG) with operational independence. Ghana�s President, acting in consultation with the Council of State, appoints the AG. Conditions for his/her removal are also stipulated. Furthermore, the AG is not "subject to the direction or control of any other person or authority in the performance of his functions under the constitution or any other law" (Clause 187 of the Constitution). The AG is to examine and certify public accounts and the accounts of all public offices (including the courts, central and local government, universities, public institutions, public corporations, traditional councils, etc.). The audit mandate is therefore very extensive. Auditors are given access to all books, records, returns and other documents relating or relevant to the audit of the accounts. The AG must submit an audit report to Parliament within 6 months of the end of the financial year, which Parliament must debate. Parliament has established a Public Accounts Committee to assist it in considering the AG's report. Sanctions are not always effective, but the AG has the power of surcharge (i.e. to impose financial penalties on government staff). This is supplemented by powers to withhold emoluments and allowances of a person who fails to respond to audit findings within thirty days. The Constitution provides for the Audit Service and for an Audit Services Board, which determines terms and conditions of service of audit service staff, in consultation with the Public Service Commission.
- 32 -
Ghana Audit Service (GAS) is regulated by the Audit Service Act (2000). It has a staff of over 1300, including about 700 auditors. It has branches throughout the country (e.g. 10 regional offices, 35 district offices, 16 offices in Accra, 3 commercial offices and one special audit office). Given the constitutional position and privileges of the AG, the GAS can be regarded as independent, especially now that the Audit Service Board has been established. GAS carries out audits under the direction of the AG. Regional and district auditors are stationed in the ten regions and in 64 of the 110 districts. Furthermore, two auditors, cleared by the military authorities for security purposes, are appointed to audit defense spending. Amongst GAS professional staff, only a few persons have a formal professional qualification. GAS is a member of the International Organization of Supreme Audit Institutions (INTOSAI) and applies audit standards based on internationally recognized standards. Lack of audit staff and delays in some cases in finalizing annual financial statements, especially that of SOE�s and other public institutions are responsible for late audits and late audit reports. Currently there are delays of 2-3 years and longer for some audit reports. To address this some of the audit work are contracted to audit firms, but associated costs are sometimes prohibitive. On an exceptional basis, the AG should consider that each entity in default prepares one financial statement covering the outstanding reporting periods, in order to minimize the procedures to close books for each year, draw up and publish accounts for each year and reduce the number of GAS workshops needed to review these accounts.
Action Plan
Short-term measures
• Implement a cost-effective action plan to clear the audit backlogs, with the AG focusing its available resources on the audit of 2003 with immediate effect.
• Develop effective sanctions for all MDA�s and public entities that fail to produce their annual financial statements timely.
• Develop a system to allocate blocks of audits to the private sector audit forms in order for them to become more price sensitive.
Medium-term measures
• Develop a risk-responsive audit approach, which will influence and rely on work performed by internal auditors.

- 33 -
VI. PROCUREMENT
Indicator 16 ~ Efficiency and effectiveness of the public procurement system Question: To what degree does the public procurement system provide for efficient and effective use of public funds? Benchmark: (A) . The procurement system promotes efficiency and effectiveness in the expenditure of public funds through clear and enforceable rules that promote competition, transparency and value for money. Assessment: (B). This benchmark is not met. The procurement system suffers from a weak legal framework and inadequate enforcement of rules, enabling inefficient use of public funds and contributing to a lack of transparency and accountability.
The 2003 Country Procurement Assessment Report (CPAR) concluded that the principle of �value for money� is only partially achieved. The CPAR provides a detailed analysis of the public procurement system and identifies problems such as weak legal framework, inadequate enforcement of existing regulations, poor planning and record keeping, weak contract management, and use of untrained staff. This is true for both government and donor financed procurement for the purchase of goods, works and services. Estimates of potential savings from improved procurement vary and have not yet been analyzed precisely in quantitative terms. Many among those who are involved in procurement activities, and on the basis of the outcomes of the �Value for Money Assessment Project�, believe that at least 25 percent in cost savings could be achieved by better procurement of goods and services.
Nevertheless, a considerable portion of public procurement is carried out using sound practices. Following the 1996 CPAR, important investments have been made in the areas of capacity building and production of Procurement Procedures Manuals, which have engendered improved procurement practices in key sector ministries. These actions have enabled improvements in transparency, economy and efficiency, in addition to encouraging preparation of more accurate procurement plans and their implementation.
A comprehensive Public Procurement Act was passed in December 2003 to further strengthen public procurement management. This act establishes a credible legal framework for public procurement. The position of the Chief Executive of the Secretariat of the Board was advertised in April 2004 and selection to fill the position is expected by the end of July 2004. MOEFP has already instructed public procurement bodies to form Entity Tender Committees. Members of the Public Procurement Board were appointed by the President and their inauguration is planned for June 2004. Compliance with the provisions of the law by public entities will contribute to ensuring an efficient public procurement system that will assist government realize value for money at all levels of public sector.
- 34 -
Action Plan
Short-term measures • Establish and make operational institutions created by the Public Procurement Act, embark
on a capacity building program to support the new public procurement system, and instruct all public procuring entities to start using the provisions of the Public Procurement Act in their procurement transactions.
Medium-term measures • The Public Procurement Board to carry out assessments of a significant share of public
contracts to certify that the provisions of the Public Procurement Act is complied with in a satisfactory manner.
- 35 -
VII. RECOMMENDED ACTION PLAN FOR IMPROVING PUBLIC EXPENDITURE
MANAGEMENT This section proposes a time bound, prioritized action plan for improving Ghana�s PEM system. This Action Plan has been discussed and broadly agreed with government and other development partners and draws in part from Ghana�s recently adopted �Twelve Months Action Plan for Public Financial Management�. The suggested timings in the action plan are based on both the staff�s assessment of the urgency of any given action and its best judgment on when particular reforms can realistically be implemented, given existing capacity, and the availability of TA to undertake the work. Following the completion of the GPRS, the GoG has successfully negotiated with several donors (including the Bank) implementation of a new approach to external funding based on increased reliance on direct budgetary support. This is known as the Multi-Donor Budget Support (MDBS) initiative. The objectives of MDBS are to:
• harmonize donor policies and procedures as far as possible in order to minimize transaction costs for GoG & donors;
• reduce competing donor demands on GoG; • reduce the level of tied aid; • promote GoG ownership, transparency and accountability for service delivery; • facilitate of broad-based discussion and GoG/Donor agreement on reform agenda; • improve donor co-ordination; • increase the predictability of donor flows.
The MDBS assumes that GPRS sets out the GoG�s poverty reduction strategy and that the Medium Term Expenditure Framework (MTEF) adequately allocates resources in line with priorities set out in the GPRS. The approach involves:
• agreeing common benchmarks against which performance is assessed; • improving arrangements for dialogue between GoG and donors; • basing funding commitments and disbursements on the achievement of agreed
targets. As with HIPC, triggers for performance-based disbursement exist including a requirement for an improved Budgeting, Financial Management and Expenditure Reporting regime. Accordingly, the authorities can fund the main activities detailed in the �Twelve Months Action Plan for Public Financial Management�, adopted in late-2003, through the MDBS mechanism. Other initiatives to improve PEM have also been identified separately with Ghana�s main development partners in the PEM area and these are summarized in Table 9, along with some of the recently completed activities. These initiatives have supported Ghana�s implementation of the PEM action plan developed 2001, see Table 10, which has been largely successfully implemented.
- 36 -
The versatility of the new MDBS arrangement, in conjunction with the existing ongoing initiatives identified in table 9, should provide adequate resources and assistance for Ghana to supports its PEM reforms. The MDBS partners are also discussing the means of monitoring and evaluating the performance of the authorities PEM reform program, and may consider using the assessment component of the HIPC AAP for this purpose. Table 11 summarizes some of the priority actions for improving PEM in Ghana, identified in the text, separated into short- and medium-term actions. The action plan has drawn from the findings of the HIPC AAP assessment in addition to the authorities own, more detailed, action plan. If the majority of these actions to reform PEM are successfully completed, and the current level of progress is maintained, Ghana should be able to achieve benchmark status in a number of additional indicators within 12-18 months. However, in order to meet the benchmark status in other areas, particularly those for internal and external audit, procurement and comprehensive reporting, will require a prolonged commitment to build capacity and improve compliance with existing and new regulations and procedures. In addition, it may take considerable time before the benefits of new systems, such as the BPEMS, are fully realized.

- 37 -
Appendix 1:
GHANA�S GFS BRIDGE TABLE AND ACCOUNTS
The GFS system aims to �provide a comprehensive conceptual and accounting framework suitable for analyzing and evaluating fiscal policy, especially the performance of the general government sector and the broader public sector of any country.�11 Using the GFS system, information on the overall performance and financial position of the general government or public sector can be presented in an internationally accepted format, which can be harmonized with other statistical systems. In an effort to improve transparency and move towards more modern accounting, management and reporting systems the Government of Ghana decided to introduce budget reporting on the standardized GFS classification basis. However, since Ghana�s Chart of Accounts (CoA), adopted in 1999, is not fully compatible with the GFS system a bridge table was constructed between the existing classification and the GFS classification structure. This is recognized as a �second-best� solution but provides a practical interim measure until a new Chart of Accounts and classification is introduced. The system for implementing the bridge table was developed in 2003, along with a manual for describing the procedures for compiling the information on a GFS basis. The 15-digit CoA, introduced in 1999, and classification system summarizes expenditure into four major budget items (sub heads): (1) salaries and pensions; (2) non-salary administrative expenses; (3) service expenditures; and (4) investment expenditures. The Ministries, Departments and Sub-vented Agencies, MDAs (the budget Head codes), and the current expenditure item classification (items 1-4) are mapped onto the GFS classification on the basis of each cost centers. There are roughly 2,650 identifiable cost centers, which provide a significant degree of disaggregation for the coding process. Each cost centre is allocated a main (division ) code (e.g. 704 for Economic Affairs), a Sub category (Group) code (e.g. 7042 for Agriculture, Forestry, Fishing & Hunting) and a Sub sub category (Class) code (e.g. 70421 for Agriculture). All cost centers are similarly classified so that a bridge table can be constructed between the existing Government of Ghana functional classification (mainly vote based) and the GFS functional classification. As a �second best solution� to a new CoA and classification system, the bridge table has some drawbacks. For example, if a cost center belonging to the education ministry is carrying out some minor activities related to sanitation (or has a sanitation program in schools) the bridge table cannot classify this activity under Health. A review of these activities and a comparison
11 Government Finance Statistics Manual 2001, International Monetary Fund (updated 2003 edition). http://www.imf.org/external/pubs/cat/longres.cfm?sk=15203.0

- 38 -
between the current fiscal reports and those provided by the bridge table suggests that this problem is relatively minor. A similar process of mapping is undertaken for the economic classification where the classification is done on the basis of the GFS economic classification of expenses. Each item of the existing Government of Ghana economic classification (currently all items under the sub-sub items of expenditure) are mapped onto the GFS economic classification to generate the bridge table for economic classification of expenditures. Once a full bridge table, including each cost center and each economic classification code of Government of Ghana is developed it is then entered into a system called the National Expenditure Tracking System (NETS), which has been established to track poverty as well as general GoG expenditures that pass through the Consolidated Fund (ie those recorded by the CAGD accounting system). The NETS then uses this bridge table, and the existing accounting data already available to it, to produce reports on a GFS functional and economic classification basis. The �Government of Ghana functional classification (on GFS basis)� report consequently gathers all accounting data within the purvey of the CAGD (narrow based budget) on a monthly basis. Data is presented on the following categories:
1. General Public Services 2. Defence 3. Public Order & safety 4. Economic Affairs 5. Environmental Protection 6. Housing and Community amenities 7. Health 8. Recreation, Culture & Religion 9. Education 10. Social Protection
Similarly the �Government of Ghana economic classification (on GFS basis)� report compiles all CAGD accounting data in a GFS economic classification format on a monthly basis. This data is presented on the following broad categories:
1. Compensation to Employees 2. Use of Goods & Services 3. Interest 4. Subsidies 5. Grants 6. Social Benefits 7. Misc. & other expenses
- 39 -
In addition, the NETS produces a table on the cross classification of data between the economic and functional classification of expenses. This table uses the same data base and enables an analysis of the various functional expenses on an economic basis.

- 40 -
Table 10: Overview of Technical and Donor Assistance in Public Expenditure Management in Ghana
Dates Dates
WORLD BANK to March 2004
1991 to 1999
IMFAugust 2001 to July 2004
EU1999 to June 2004
Under consideration for 2005 to 2006
DFID Dec. 2004 -
* Within the last 12 months
DescriptionBudget Planning and Expenditure Management System (BPEMS) pilot phase
PETS as part of the national Agric. Extension services project
Resident PEM advisor to improve:
Fiscal reporting (inc. the identification of poverty related exp. and GFS reporting); expenditure tracking; cash management; and comitment controls
Strengthen Auditor General�s department to perform audits according to recognized standards and ensure efficient utilization of own-resources
DescriptionDonor/ Provider**RECENT*/ONGOING assistance by major project PLANNED assistance by major project
Strengthen Auditor General�s department to perform effective & efficient audits. Modernization of the Auditor General�s department to ensure technical sustainability
Integrated Personnel and Payroll Database (IPPD) deployment project II

- 41 -
Table 11: Implementation Status of 2001 Actions to Strengthen Tracking of Poverty-Reducing Public Spending: Ghana
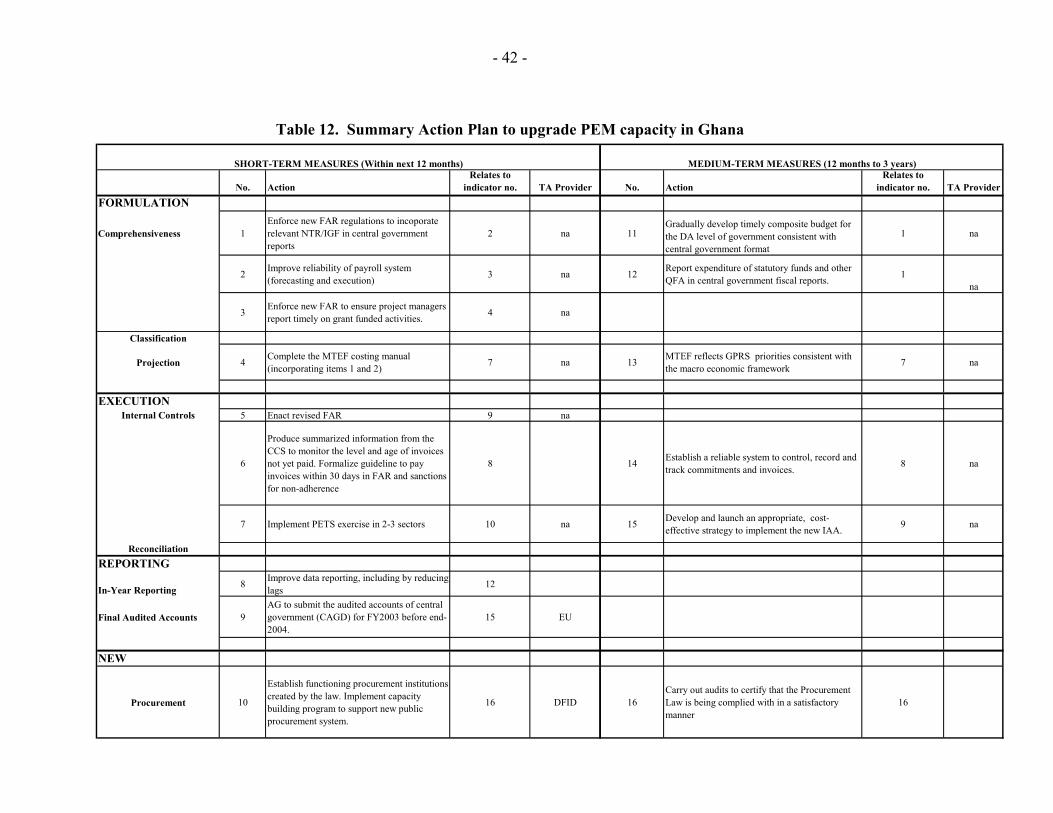
- 42 -
Table 12. Summary Action Plan to upgrade PEM capacity in Ghana
No. Action Relates to
indicator no. TA Provider No. ActionRelates to
indicator no. TA ProviderFORMULATION
Comprehensiveness 1Enforce new FAR regulations to incoporate relevant NTR/IGF in central government reports
2 na 11Gradually develop timely composite budget for the DA level of government consistent with central government format
1 na
2 Improve reliability of payroll system (forecasting and execution) 3 na 12 Report expenditure of statutory funds and other
QFA in central government fiscal reports. 1na
3 Enforce new FAR to ensure project managers report timely on grant funded activities. 4 na
Classification
Projection 4 Complete the MTEF costing manual (incorporating items 1 and 2) 7 na 13 MTEF reflects GPRS priorities consistent with
the macro economic framework 7 na
EXECUTIONInternal Controls 5 Enact revised FAR 9 na
6
Produce summarized information from the CCS to monitor the level and age of invoices not yet paid. Formalize guideline to pay invoices within 30 days in FAR and sanctions for non-adherence
8 14 Establish a reliable system to control, record and track commitments and invoices. 8 na
7 Implement PETS exercise in 2-3 sectors 10 na 15 Develop and launch an appropriate, cost-effective strategy to implement the new IAA. 9 na
ReconciliationREPORTING
In-Year Reporting 8 Improve data reporting, including by reducing lags 12
Final Audited Accounts 9AG to submit the audited accounts of central government (CAGD) for FY2003 before end-2004.
15 EU
NEW
Procurement 10
Establish functioning procurement institutions created by the law. Implement capacity building program to support new public procurement system.
16 DFID 16Carry out audits to certify that the Procurement Law is being complied with in a satisfactory manner
16
SHORT-TERM MEASURES (Within next 12 months) MEDIUM-TERM MEASURES (12 months to 3 years)

- 43 -

- 44 -