Embed Size (px)
Citation preview

Public health in long-range regional transportation plans:Guidance statements & performance measures
Patrick A. Singleton & Kelly J. CliftonPortland State University – Portland, Oregon
Oregon ITE Winter Workshop26 February 2015 – Portland, Oregon

Transportation Health
2Introduction – Method – Results – Discussion
Tra
nsp
orta
tion
Pu
blic H
ealth

Transportation Health
3Introduction – Method – Results – Discussion
Traffic safetyTraffic collisions cause injuries and fatalities. Air qualityMotor vehicle emissions lead to respiratory illnesses. Physical activityWalking/bicycling help to mitigate obesity. AccessibilityTransport affords access to education, employment, food, health care, social services, and recreation.

Long-range planning
4Introduction – Method – Results – Discussion
Vision, goals, objectives
Evaluation metrics
Long-range transportation plan
(RTP/LRTP)
Performance measures
http://www.planning.dot.gov/documents/briefingbook/bbook.htm
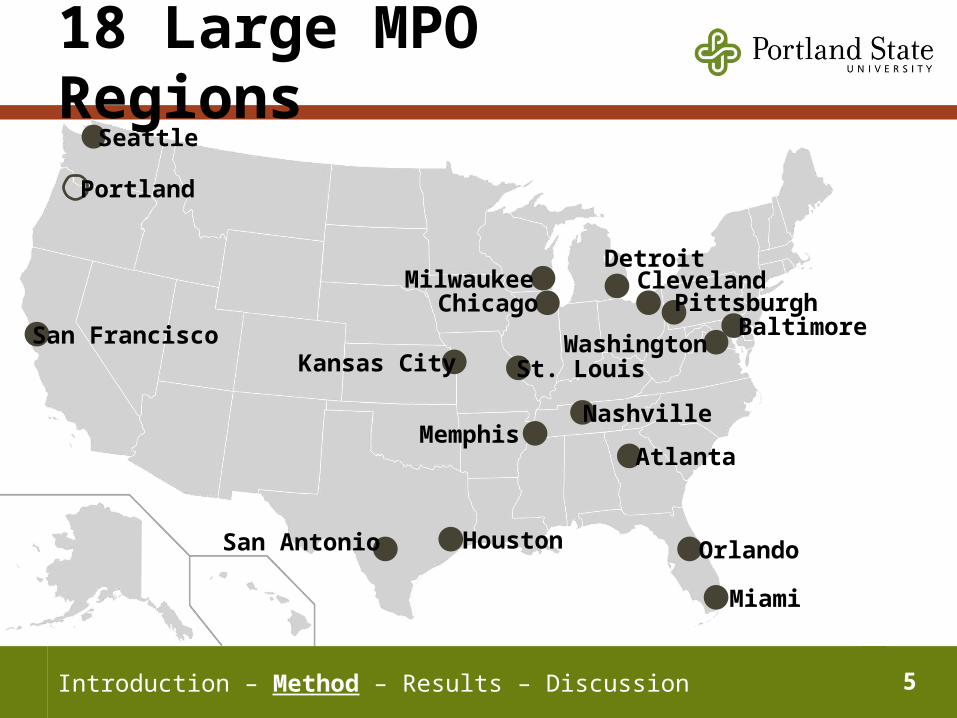
18 Large MPO Regions
5Introduction – Method – Results – Discussion
Seattle
San FranciscoKansas City
ChicagoMilwaukee
St. LouisWashington
Baltimore
Detroit
PittsburghCleveland
San Antonio
MemphisNashville
Atlanta
Orlando
Miami
Houston
Portland

Method
• Long-range transportation plans– Plan years 2009–2014; horizon years
2035/2040
• Guidance statements– Vision, goals, objectives, policies,
etc.
• Performance measures–Measures, indicators, targets, etc.
6Introduction – Method – Results – Discussion

Yes, 10
Yes, 18
Yes, 11
Yes, 7
Yes, 18
No, 8
No, 7
No, 11
0 2 4 6 8 10 12 14 16 18Number of MPO LRTPs
Guidance Statements
Results
7Introduction – Method – Results – Discussion
Safety
Air
ActivityAccess
Public health
Examples: • [S]afe, comfortable and convenient options that
support...physical activity, and minimize transportation-related pollution. (Portland)
• [M]ultimodal transportation infrastructure and services that support active living and physical activity. (Baltimore)

Results
8Introduction – Method – Results – Discussion
Yes, 3
Yes, 9
Yes, 9
Yes, 4
Yes, 9
No, 8
No, 2
No, 2
No, 7
No, 2
No PMs, 7
No PMs, 7
No PMs, 7
No PMs, 7
No PMs, 7
0 2 4 6 8 10 12 14 16 18Number of MPO LRTPs
Performance Measures
Safety
Air
ActivityAccess
Public health
Examples: • Obesity rate. (Atlanta) Average body mass index.
(Seattle)• Annual traffic injury and fatality totals and rates. (Kansas
City)• Daily minutes of walking/bicycling for transportation. (San
Francisco)• % population/employment within ¼ mile of transit service.
(Orlando)

Summary of findings• Incomplete views of transportation health
• Most plans guided by safety and accessibility
• Air quality concerns may be under-represented
• Regional plan policy foci guided by national policy
• Performance measures ~ related to policy guidance
9Introduction – Method – Results – Discussion

Potential strategies• Adopt health-related guidance statements
• Adopt health-related performance measures
• Advance travel modeling and health impact assessment methods
• Improve public participation and environmental justice efforts
10Introduction – Method – Results – Discussion

Acknowledgements
11Introduction – Method – Results – Discussion
Patrick A. [email protected]
Kelly J. Clifton, PhD [email protected]
https://wiki.cecs.pdx.edu/pub/ItsWeb/TrbConferences/15-2169_Singleton-Clifton_Incorporating-public-health_revised.pdf

Summary of MPO LRTPs
Region Metropolitan planning organization (MPO)2010 pop.
(million)Plan year
Horizon year
Walk/bike modelsa
Atlanta, GA Atlanta Regional Commission (ARC) 4.8 2014 2040 IIIBaltimore, MD Baltimore Regional Transportation Board (BRTB) 2.7 2011 2035 IIChicago, IL Chicago Metropolitan Agency for Planning (CMAP) 8.4 2010 2040 IICleveland, OH Northeast Ohio Areawide Coordinating Agency (NOACA) 2.1 2013 2035 IIIDetroit, MI Southeast Michigan Council of Governments (SEMCOG) 4.7 2013 2040 IHouston, TX Houston-Galveston Area Council (H-GAC) 5.9 2010 2035 IKansas City, MO Mid-America Regional Council (MARC) 1.9 2010 2040 IMemphis, TN Memphis Urban Area Metropolitan Planning Organization 1.1 2012 2040 IIMiami, FL Miami-Dade Metropolitan Planning Organization 2.5 2009 2035 IIMilwaukee, WI Southeastern Wisconsin Regional Planning Commission (SEWRPC) 2.0 2010 2035 IINashville, TN Nashville Area Metropolitan Planning Organization 1.4 2010 2035 IOrlando, FL MetroPlan Orlando (METROPLAN) 1.8 2010 2030 IPittsburgh, PA Southwestern Pennsylvania Commission (SPC) 2.6 2011 2040 ISan Antonio, TX San Antonio–Bexar County Metropolitan Planning Organization 1.8 2009 2035 IIISan Francisco, CA Metropolitan Transportation Commission (MTC) 7.2 2013 2040 IIISeattle, WA Puget Sound Regional Council (PSRC) 3.7 2014 2040 IIISt. Louis, MO East-West Gateway Council of Governments (EWGCOG) 2.6 2011 2040 IIIWashington, DC National Capital Region Transportation Planning Board (TPB) 5.0 2012 2040 IIPortland, ORb Metro 1.5 2014 2040 IIIa Tier I models do not include walking or bicycling. Tier II models group walking and bicycling into a single non-motorized mode. Tier III models include both walking and bicycling in the mode choice stage. b Portland, OR was used to develop the screening and search terms.
12Introduction – Method – Results – Discussion

Summary of Results
13Introduction – Method – Results – Discussion
MPO region
Guidance statements Performance measuresPublic health
Health components Public health
Health componentsSafety Air Activity Access Safety Air Activity Access
Atlanta, GA Baltimore, MD Chicago, IL Cleveland, OH – – – – –Detroit, MI Houston, TX Kansas City, MO Memphis, TN Miami, FL Milwaukee, WI – – – – –Nashville, TN – – – – –Orlando, FL Pittsburgh, PA – – – – –San Antonio, TX – – – – –San Francisco, CA Seattle, WA St. Louis, MO – – – – –Washington, DC – – – – –Portland, ORa Totals 10 18 11 7 18 3 9 9 4 9– Performance measures not included in plan. a Portland, OR was used to develop the screening and search terms; results are not included in totals.