Embed Size (px)
Citation preview
Public Libraries and Collective Efficacy: An Exploratory Study of Blending Data from
the Public Libraries Survey and the American Housing Survey
Lisa M. Frehill, Senior Statistician, Institute of Museum and Library Services
Melissa Cidade, Survey Methodologist, U.S. Census Bureau
Webinar on Blended Data: Federal Committee on Statistical Methods, Computational Methods in the
Production of Official Statistics Interest Group 1 May 2020
1
Disclaimer
The views expressed in this presentation are those of the authors and do not necessarily represent the views of the U.S. Census Bureau, the Institute of Museum and Library Services, or the government of the United States.
Cleared for Public Release 2
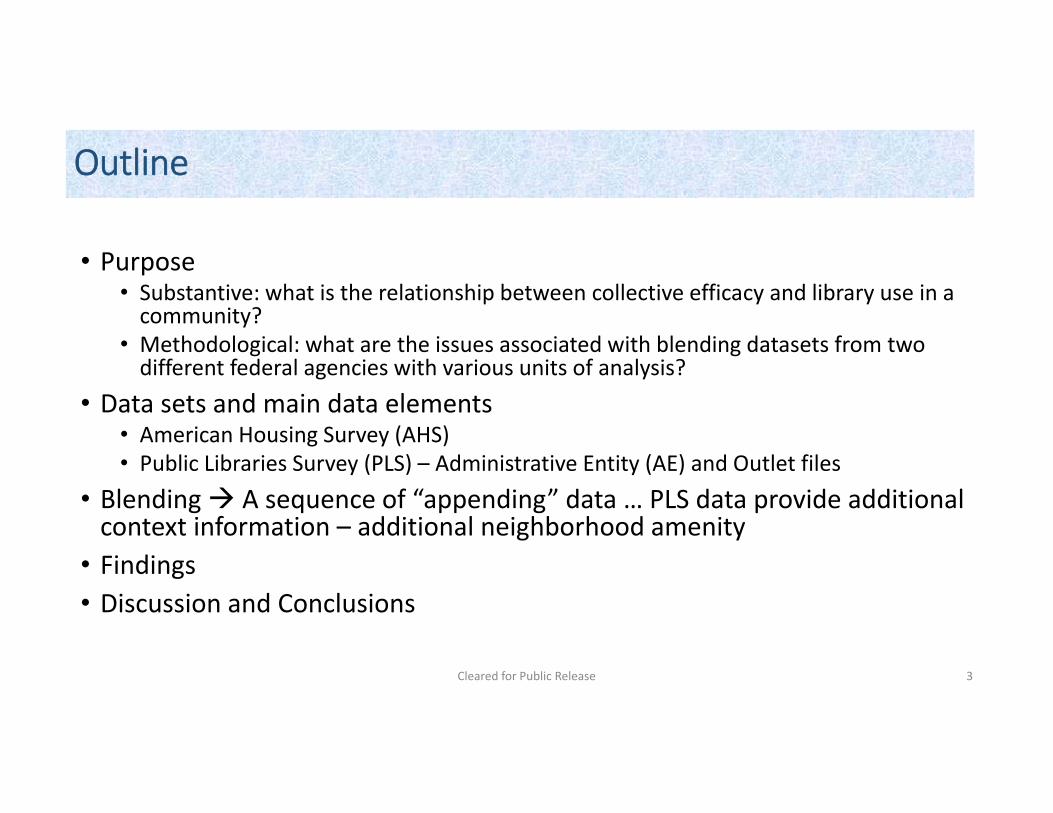
Outline
• Purpose • Substantive: what is the relationship between collective efficacy and library use in a community?
• Methodological: what are the issues associated with blending datasets from two different federal agencies with various units of analysis?
• Data sets and main data elements • American Housing Survey (AHS) • Public Libraries Survey (PLS) – Administrative Entity (AE) and Outlet files
• Blending A sequence of “appending” data … PLS data provide additional context information – additional neighborhood amenity
• Findings • Discussion and Conclusions
Cleared for Public Release 3
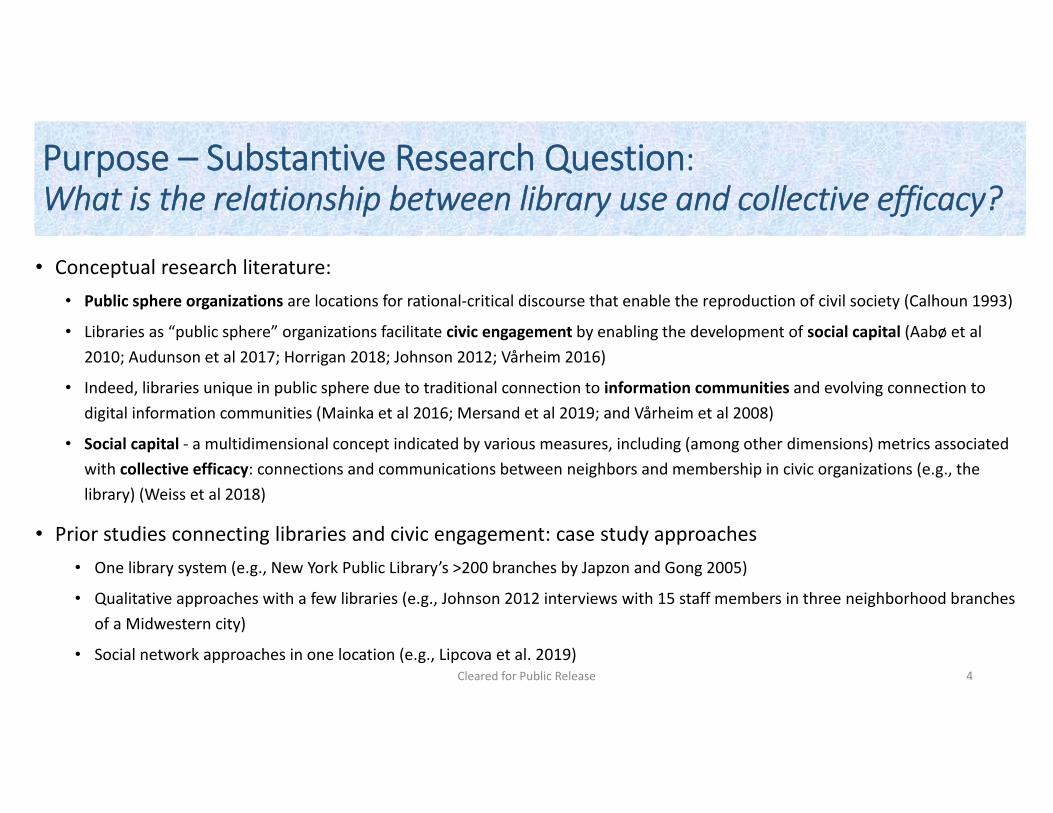
Purpose – Substantive Research Question: What is the relationship between library use and collective efficacy?
• Conceptual research literature: • Public sphere organizations are locations for rational‐critical discourse that enable the reproduction of civil society (Calhoun 1993)
• Libraries as “public sphere” organizations facilitate civic engagement by enabling the development of social capital (Aabø et al 2010; Audunson et al 2017; Horrigan 2018; Johnson 2012; Vårheim 2016)
• Indeed, libraries unique in public sphere due to traditional connection to information communities and evolving connection to
digital information communities (Mainka et al 2016; Mersand et al 2019; and Vårheim et al 2008)
• Social capital ‐ a multidimensional concept indicated by various measures, including (among other dimensions) metrics associated with collective efficacy: connections and communications between neighbors and membership in civic organizations (e.g., the library) (Weiss et al 2018)
• Prior studies connecting libraries and civic engagement: case study approaches • One library system (e.g., New York Public Library’s >200 branches by Japzon and Gong 2005)
• Qualitative approaches with a few libraries (e.g., Johnson 2012 interviews with 15 staff members in three neighborhood branches of a Midwestern city)
• Social network approaches in one location (e.g., Lipcova et al. 2019) Cleared for Public Release 4
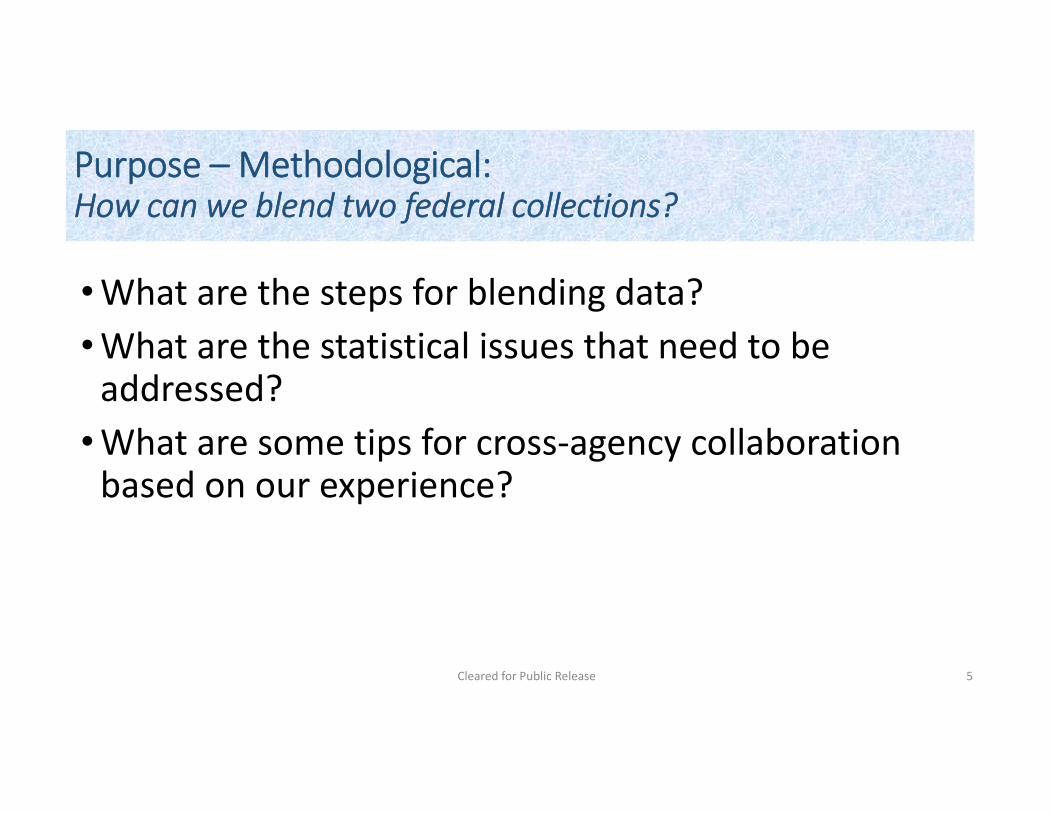
Purpose – Methodological: How can we blend two federal collections?
• What are the steps for blending data? • What are the statistical issues that need to be addressed? • What are some tips for cross‐agency collaboration based on our experience?
Cleared for Public Release 5
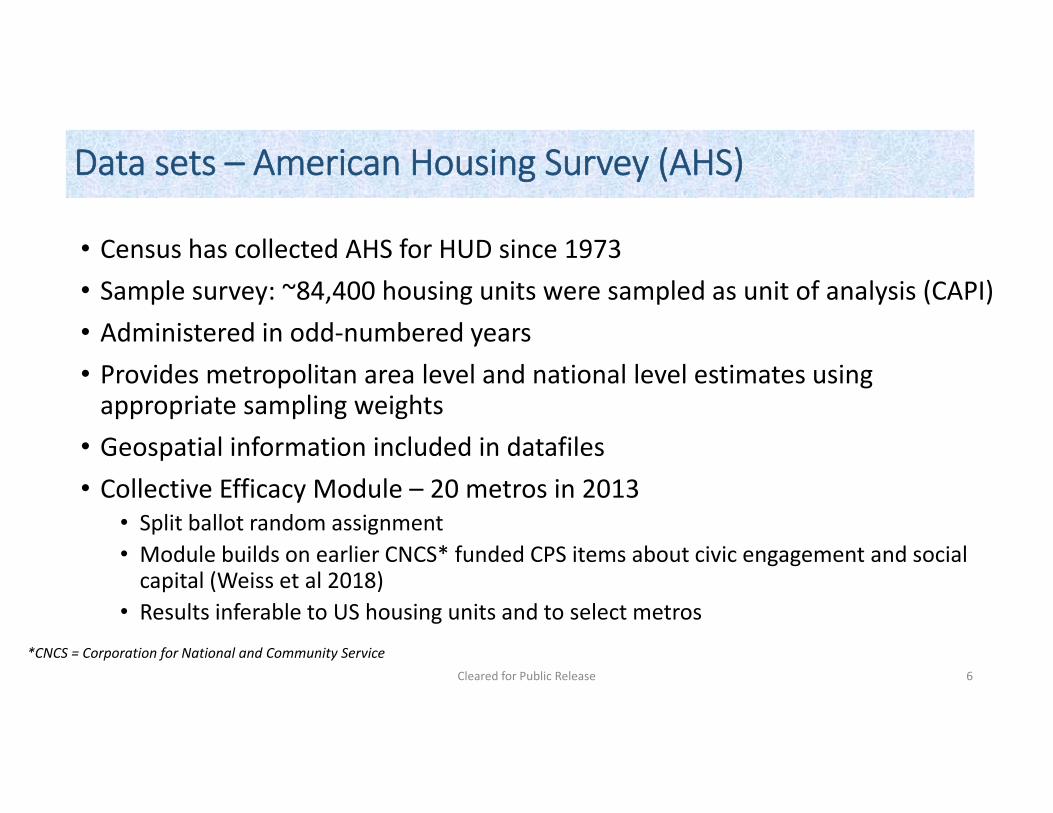
Data sets – American Housing Survey (AHS)
• Census has collected AHS for HUD since 1973 • Sample survey: ~84,400 housing units were sampled as unit of analysis (CAPI) • Administered in odd‐numbered years • Provides metropolitan area level and national level estimates using appropriate sampling weights
• Geospatial information included in datafiles • Collective Efficacy Module – 20 metros in 2013
• Split ballot random assignment • Module builds on earlier CNCS* funded CPS items about civic engagement and social capital (Weiss et al 2018)
• Results inferable to US housing units and to select metros
*CNCS = Corporation for National and Community Service
Cleared for Public Release 6
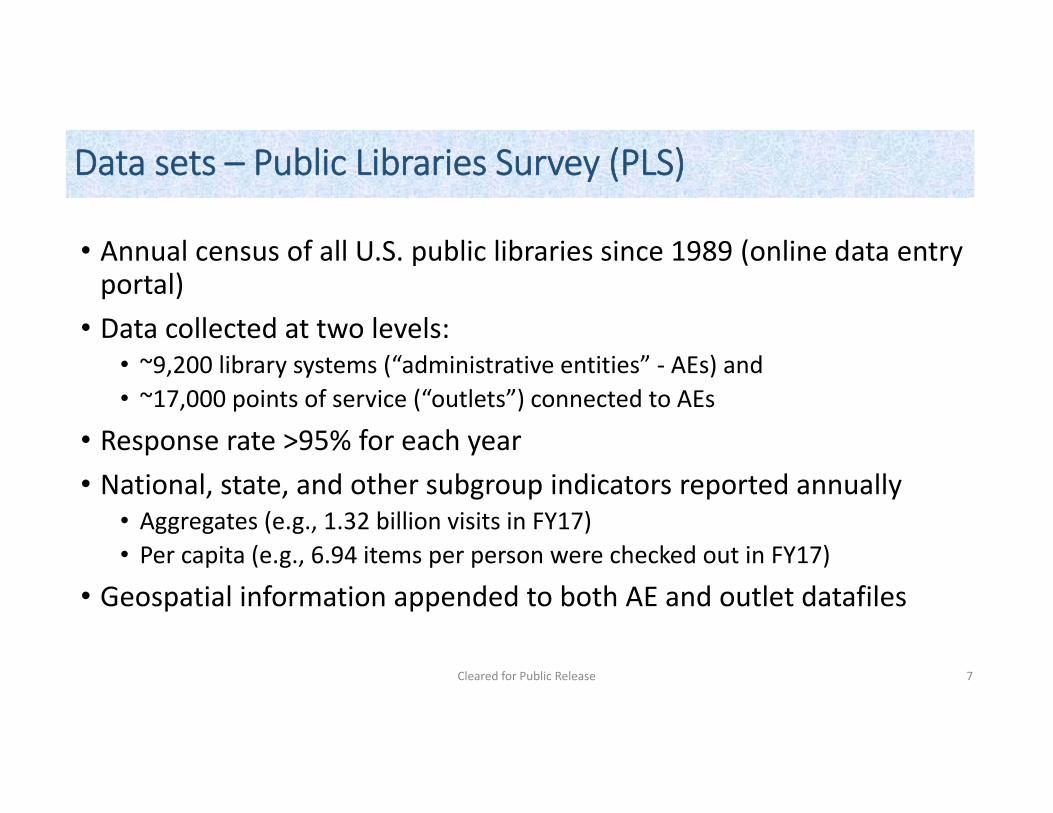
Data sets – Public Libraries Survey (PLS)
• Annual census of all U.S. public libraries since 1989 (online data entryportal)
• Data collected at two levels: • ~9,200 library systems (“administrative entities” ‐ AEs) and • ~17,000 points of service (“outlets”) connected to AEs
• Response rate >95% for each year • National, state, and other subgroup indicators reported annually
• Aggregates (e.g., 1.32 billion visits in FY17) • Per capita (e.g., 6.94 items per person were checked out in FY17)
• Geospatial information appended to both AE and outlet datafiles
Cleared for Public Release 7
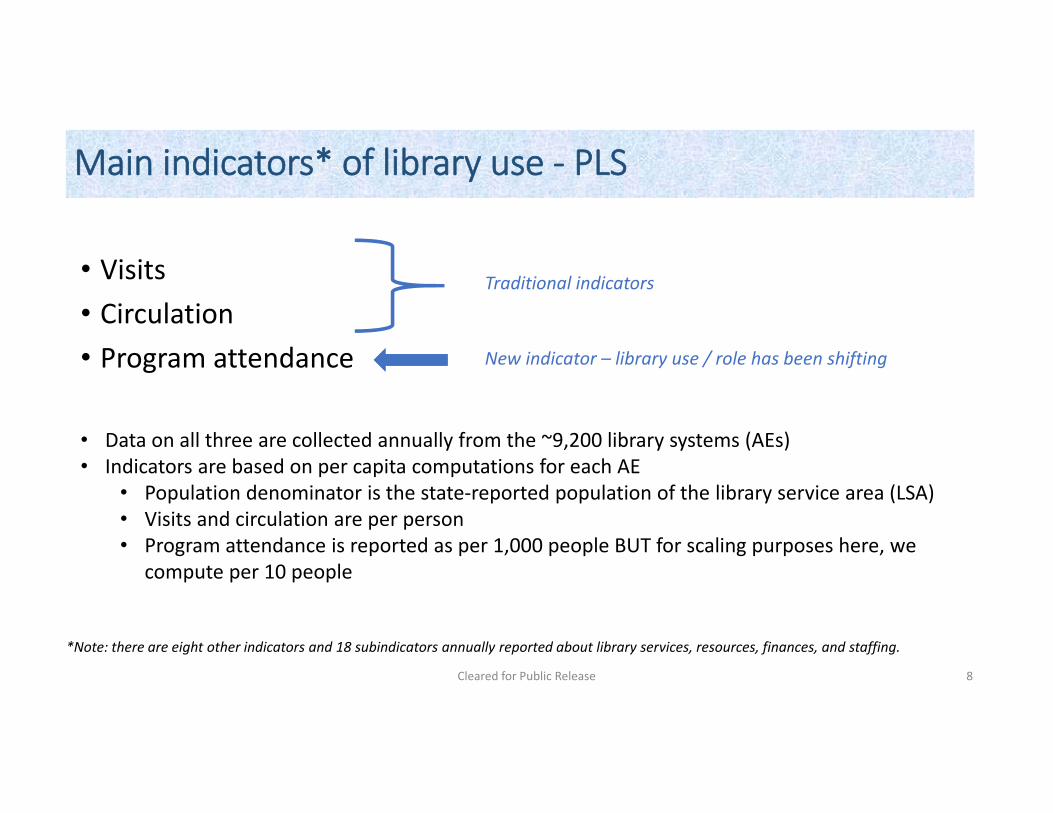
Main indicators* of library use ‐ PLS
• Visits Traditional indicators
• Circulation • Program attendance New indicator – library use / role has been shifting
• Data on all three are collected annually from the ~9,200 library systems (AEs) • Indicators are based on per capita computations for each AE
• Population denominator is the state‐reported population of the library service area (LSA) • Visits and circulation are per person • Program attendance is reported as per 1,000 people BUT for scaling purposes here, we
compute per 10 people
*Note: there are eight other indicators and 18 subindicators annually reported about library services, resources, finances, and staffing.
Cleared for Public Release 8
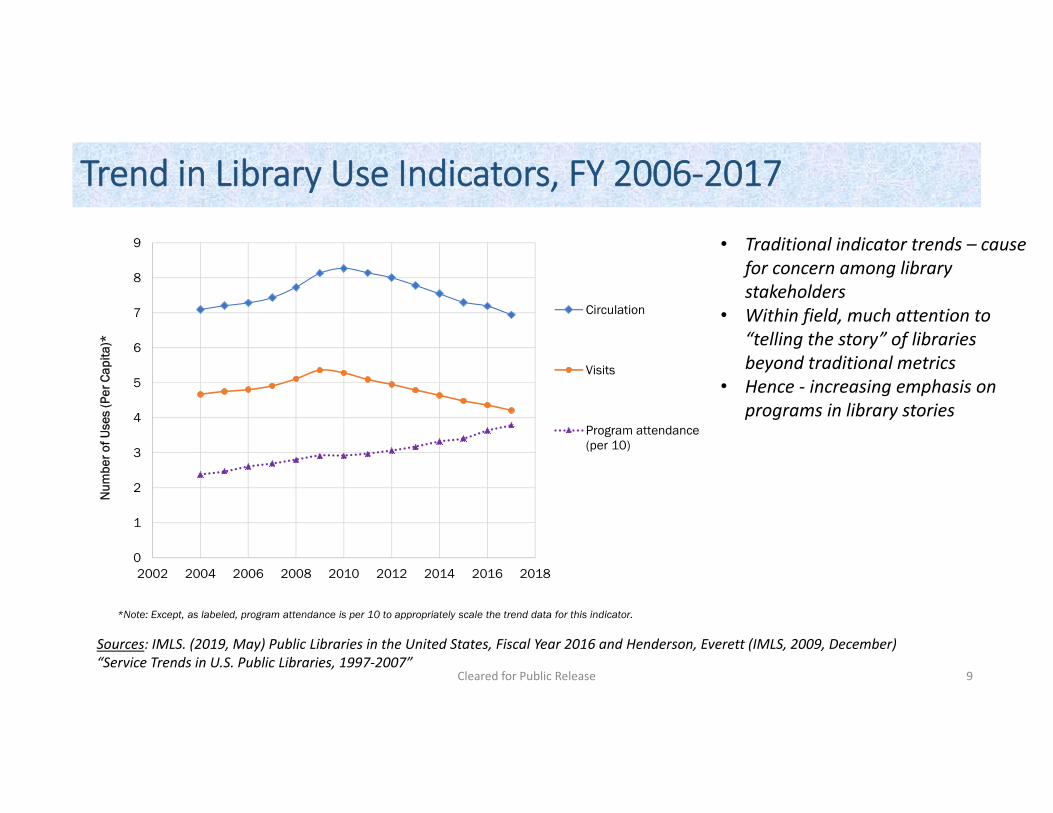
Trend in Library Use Indicators, FY 2006‐2017
Num
ber o
f Use
s (P
er C
apita
)*
9
8
Circulation 7
6
Visits 5
4 Program attendance (per 10) 3
2
1
0
*Note: Except, as labeled, program attendance is per 10 to appropriately scale the trend data for this indicator.
2002 2004 2006 2008 2010 2012 2014 2016 2018
• Traditional indicator trends – cause for concern among library stakeholders
• Within field, much attention to “telling the story” of libraries beyond traditional metrics
• Hence ‐ increasing emphasis on programs in library stories
Sources: IMLS. (2019, May) Public Libraries in the United States, Fiscal Year 2016 and Henderson, Everett (IMLS, 2009, December) “Service Trends in U.S. Public Libraries, 1997‐2007”
Cleared for Public Release 9
Trend in Library Use Indicators, FY 2006‐2017
Num
ber o
f Use
s (P
er C
apita
)*
9
8
7 Circulation
6
5
4 Visits
3
2
Program attendance 1 (per 10)
0
*Note: Except, as labeled, program attendance is per 10 to appropriately scale the trend data for this indicator.
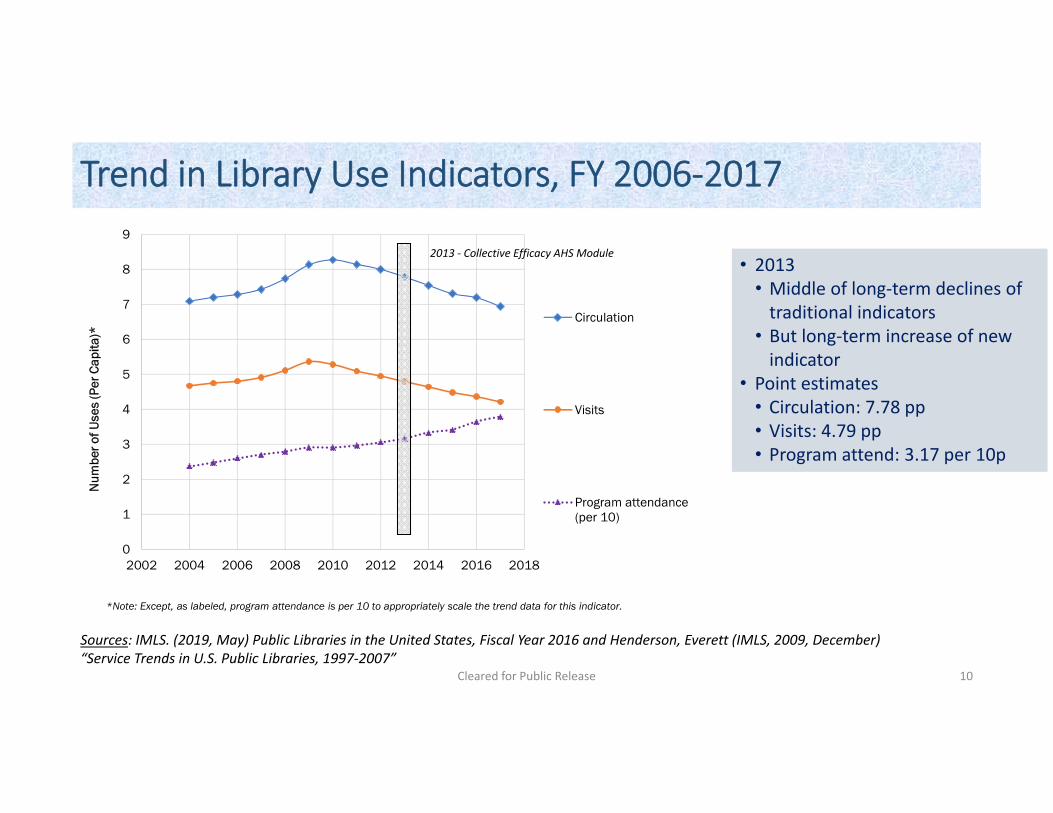
2013 ‐ Collective Efficacy AHS Module
2002 2004 2006 2008 2010 2012 2014 2016 2018
• 2013 • Middle of long‐term declines of traditional indicators
• But long‐term increase of new indicator
• Point estimates • Circulation: 7.78 pp • Visits: 4.79 pp • Program attend: 3.17 per 10p
Sources: IMLS. (2019, May) Public Libraries in the United States, Fiscal Year 2016 and Henderson, Everett (IMLS, 2009, December) “Service Trends in U.S. Public Libraries, 1997‐2007”
Cleared for Public Release 10
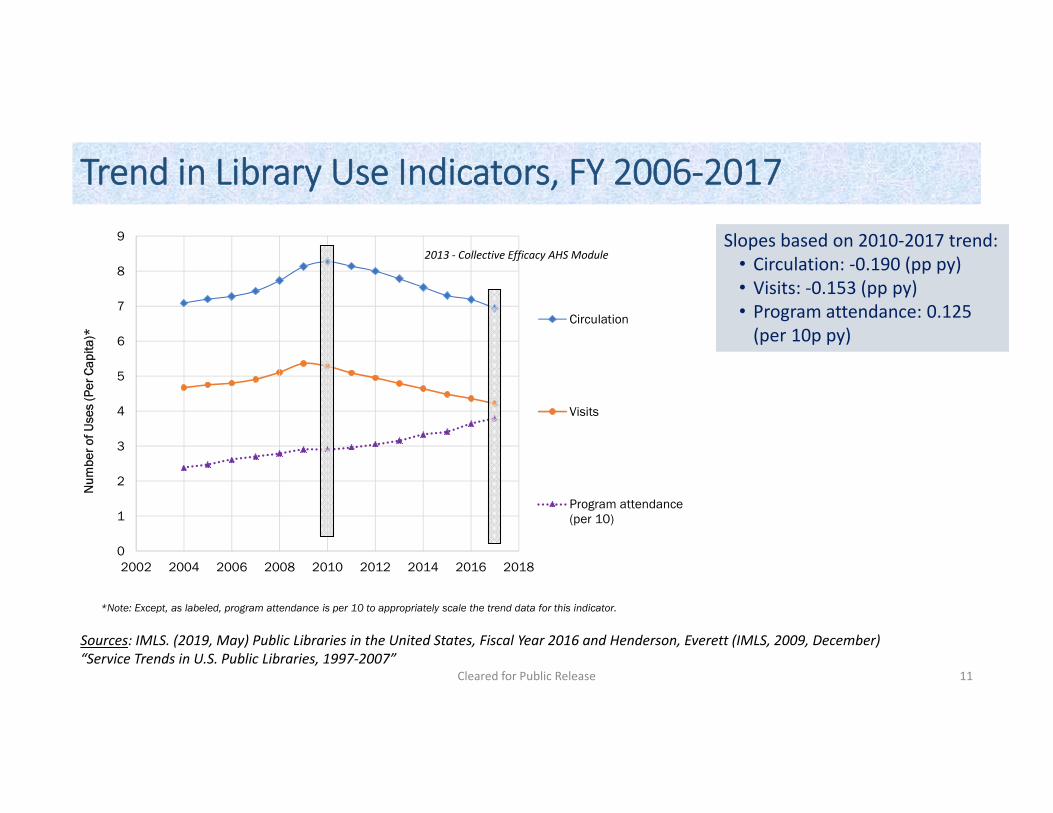
Trend in Library Use Indicators, FY 2006‐2017
Slopes based on 2010‐2017 trend: • Circulation: ‐0.190 (pp py) • Visits: ‐0.153 (pp py)
Circulation • Program attendance: 0.125
(per 10p py)
Visits
Program attendance (per 10)
2002 2004 2006 2008 2010 2012 2014 2016 2018
*Note: Except, as labeled, program attendance is per 10 to appropriately scale the trend data for this indicator.
Sources: IMLS. (2019, May) Public Libraries in the United States, Fiscal Year 2016 and Henderson, Everett (IMLS, 2009, December) “Service Trends in U.S. Public Libraries, 1997‐2007”
Cleared for Public Release
0
1
2
3
4
5
6
7
8
9
Num
ber o
f Use
s (P
er C
apita
)*
2013 ‐ Collective Efficacy AHS Module
11
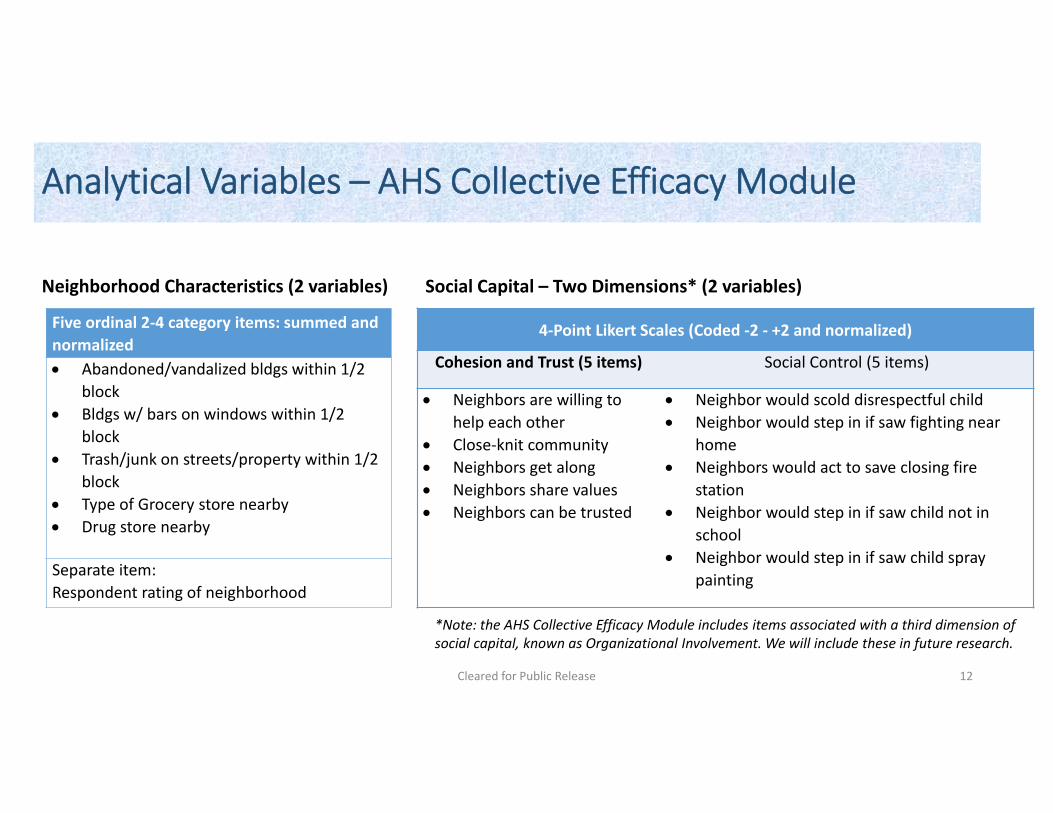
Analytical Variables – AHS Collective Efficacy Module
Neighborhood Characteristics (2 variables) Social Capital – Two Dimensions* (2 variables)
Five ordinal 2‐4 category items: summed and normalized Abandoned/vandalized bldgs within 1/2
block Bldgs w/ bars on windows within 1/2
block Trash/junk on streets/property within 1/2
block Type of Grocery store nearby Drug store nearby
Separate item: Respondent rating of neighborhood
4‐Point Likert Scales (Coded ‐2 ‐ +2 and normalized)
Cohesion and Trust (5 items) Social Control (5 items)
Neighbors are willing to Neighbor would scold disrespectful child help each other Neighbor would step in if saw fighting near Close‐knit community home Neighbors get along Neighbors would act to save closing fire Neighbors share values station Neighbors can be trusted Neighbor would step in if saw child not in
school Neighbor would step in if saw child spray
painting
*Note: the AHS Collective Efficacy Module includes items associated with a third dimension of social capital, known as Organizational Involvement. We will include these in future research.
Cleared for Public Release 12
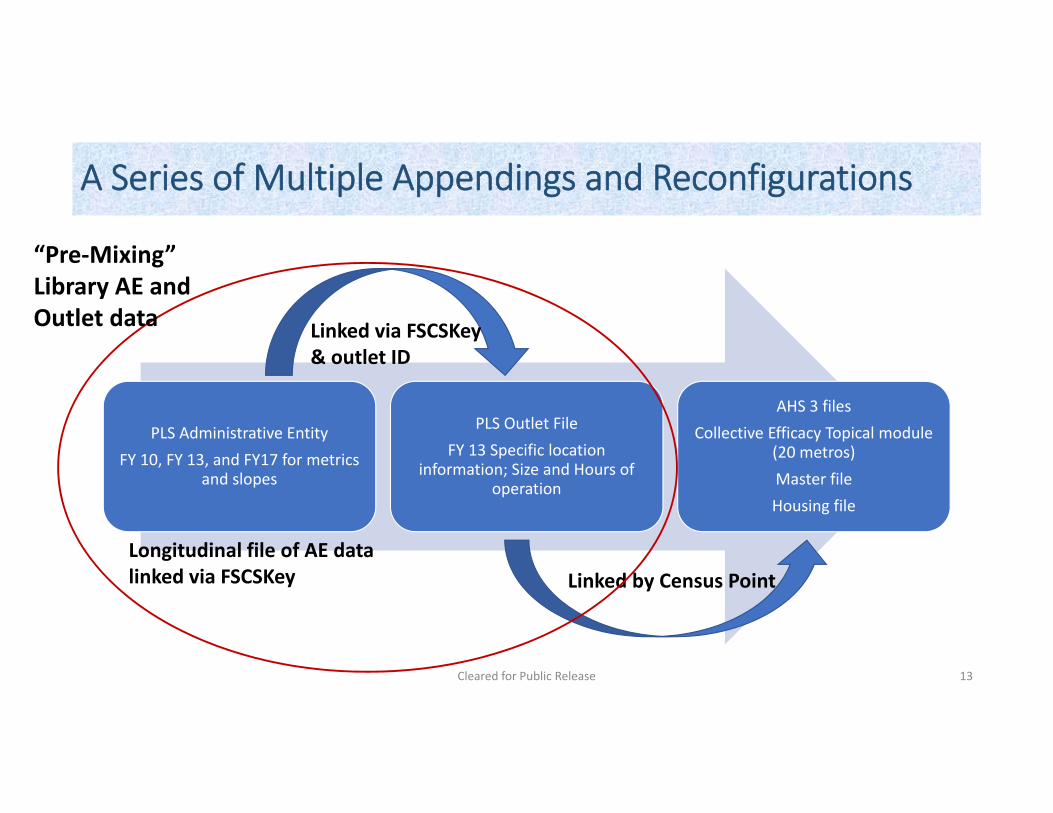
A Series of Multiple Appendings and Reconfigurations
“Pre‐Mixing”
Cleared for Public Release
PLS Administrative Entity
FY 10, FY 13, and FY17 for metrics and slopes
PLS Outlet File
FY 13 Specific location information; Size and Hours of
operation
AHS 3 files Collective Efficacy Topical module
(20 metros) Master file
Housing file
Linked via FSCSKey & outlet ID
Linked by Census Point Longitudinal file of AE data linked via FSCSKey
Library AE and Outlet data
13
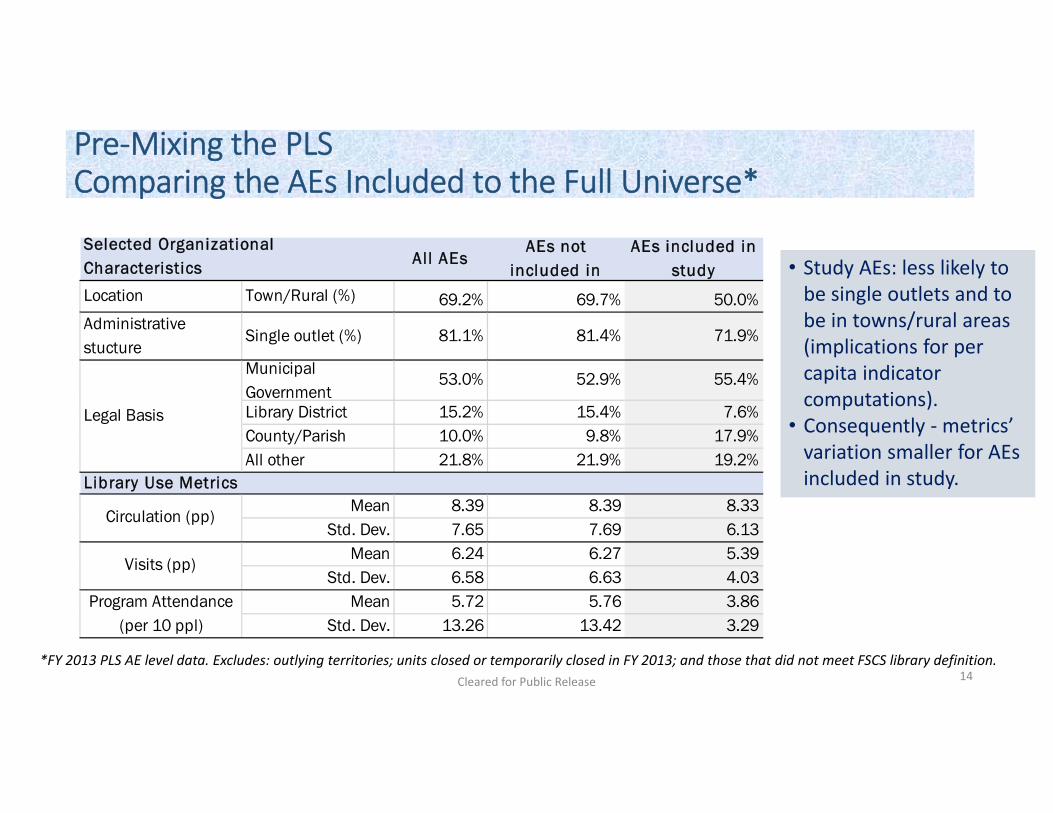
Pre‐Mixing the PLS Comparing the AEs Included to the Full Universe*
Selected OrganizatiCharacteristics
onal All AEs
AEs not included in
AEs included in study
Location Town/Rural (%) 69.2% 69.7% 50.0% Administrative stucture
Single outlet (%) 81.1% 81.4% 71.9%
Legal Basis
Municipal Government
53.0% 52.9% 55.4%
Library District 15.2% 15.4% 7.6% County/Parish 10.0% 9.8% 17.9% All other 21.8% 21.9% 19.2%
Library Use Metrics
Circulation (pp) Mean 8.39 8.39 8.33
Std. Dev. 7.65 7.69 6.13
Visits (pp) Mean 6.24 6.27 5.39
Std. Dev. 6.58 6.63 4.03 Program Attendance
(per 10 ppl) Mean 5.72 5.76 3.86
Std. Dev. 13.26 13.42 3.29
• Study AEs: less likely to be single outlets and to be in towns/rural areas (implications for per capita indicator computations).
• Consequently ‐ metrics’ variation smaller for AEs included in study.
*FY 2013 PLS AE level data. Excludes: outlying territories; units closed or temporarily closed in FY 2013; and those that did not meet FSCS library definition. Cleared for Public Release 14
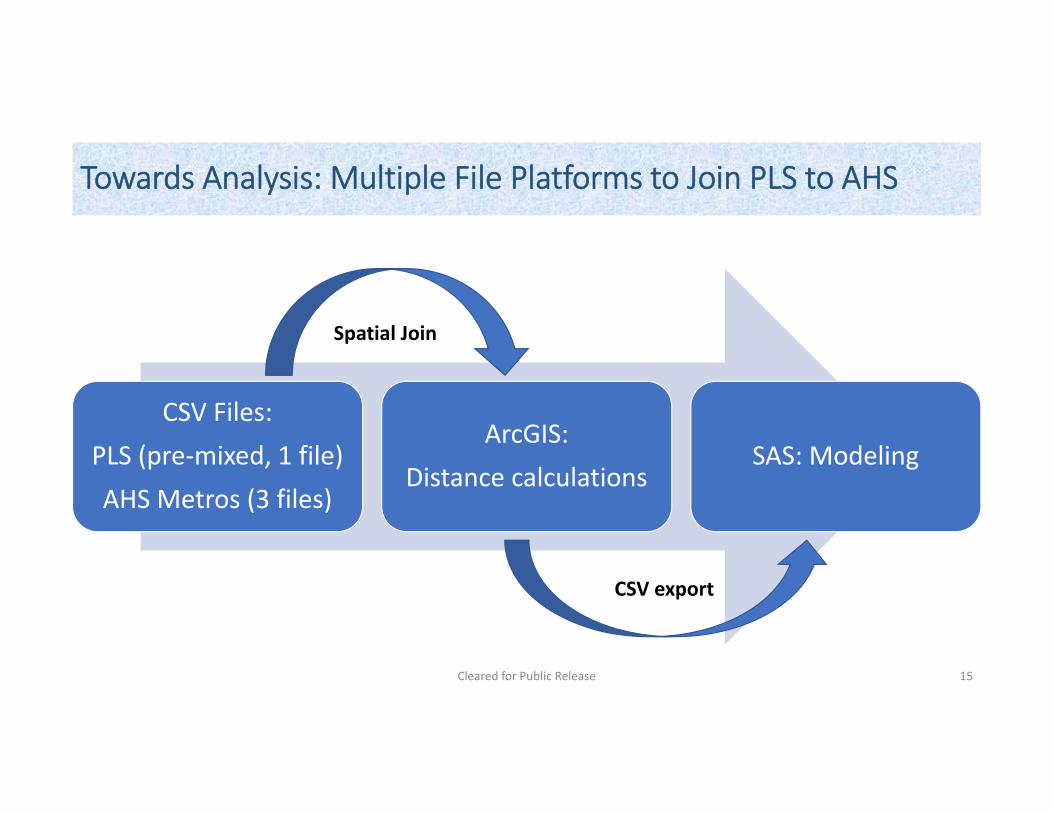
Towards Analysis: Multiple File Platforms to Join PLS to AHS
CSV Files: PLS (pre‐mixed, 1 file) AHS Metros (3 files)
ArcGIS: Distance calculations
SAS: Modeling
Spatial Join
CSV export
Cleared for Public Release 15
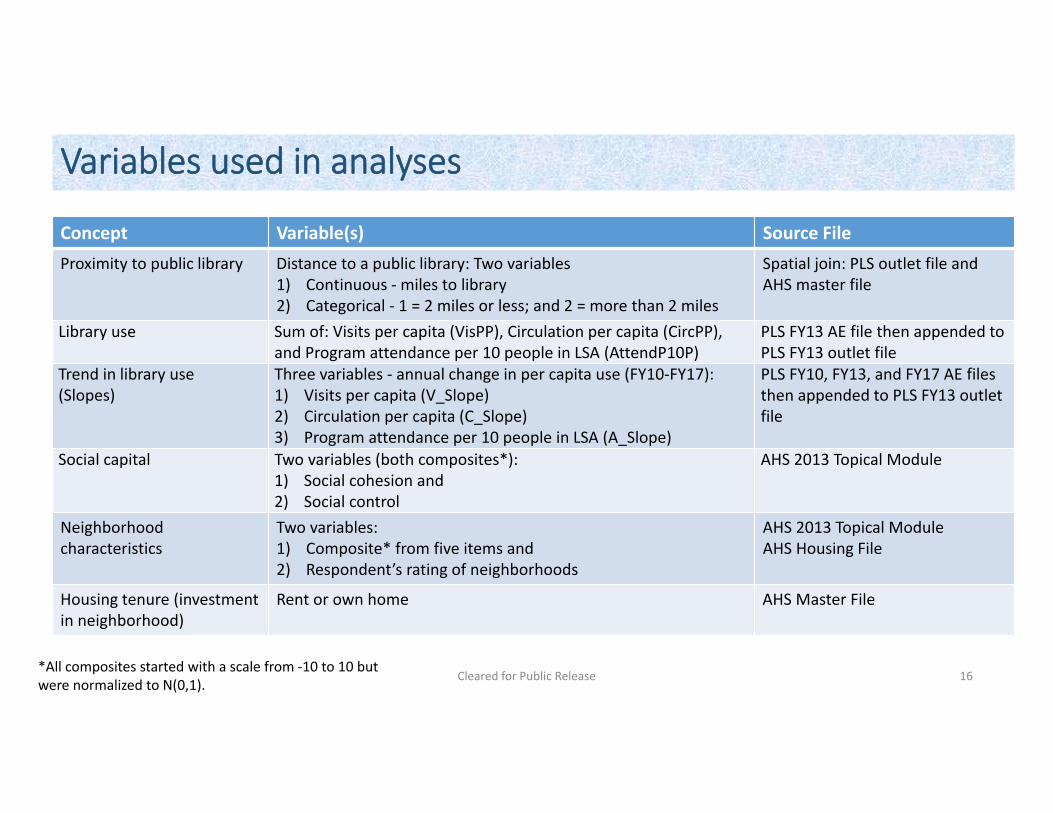
Variables used in analyses
Concept Variable(s) Source File
Proximity to public library Distance to a public library: Two variables Spatial join: PLS outlet file and 1) Continuous ‐ miles to library AHS master file 2) Categorical ‐ 1 = 2 miles or less; and 2 = more than 2 miles
Library use Sum of: Visits per capita (VisPP), Circulation per capita (CircPP), PLS FY13 AE file then appended to and Program attendance per 10 people in LSA (AttendP10P) PLS FY13 outlet file
Trend in library use Three variables ‐ annual change in per capita use (FY10‐FY17): PLS FY10, FY13, and FY17 AE files (Slopes) 1) Visits per capita (V_Slope) then appended to PLS FY13 outlet
2) Circulation per capita (C_Slope) file 3) Program attendance per 10 people in LSA (A_Slope)
Social capital Two variables (both composites*): AHS 2013 Topical Module 1) Social cohesion and 2) Social control
Neighborhood Two variables: AHS 2013 Topical Module characteristics 1) Composite* from five items and AHS Housing File
2) Respondent’s rating of neighborhoods
Housing tenure (investment Rent or own home AHS Master File in neighborhood)
*All composites started with a scale from ‐10 to 10 but Cleared for Public Release
were normalized to N(0,1). 16
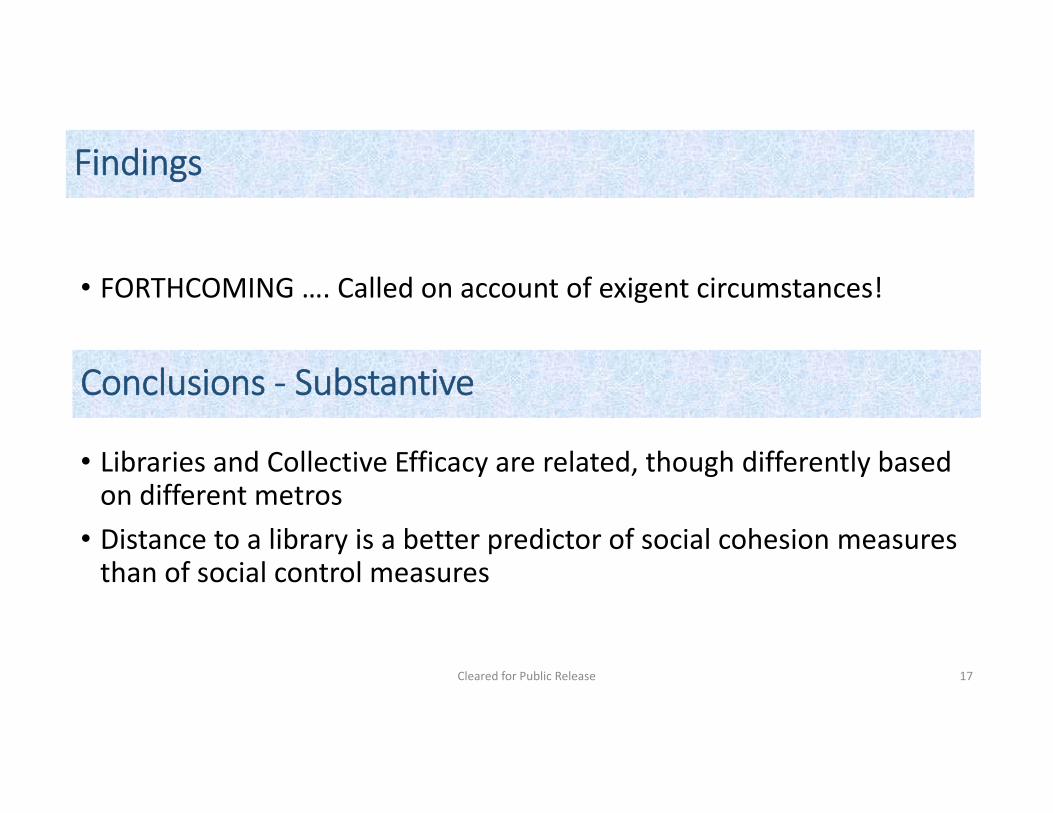
Findings
• FORTHCOMING …. Called on account of exigent circumstances!
Conclusions ‐ Substantive
• Libraries and Collective Efficacy are related, though differently based on different metros
• Distance to a library is a better predictor of social cohesion measures than of social control measures
Cleared for Public Release 17
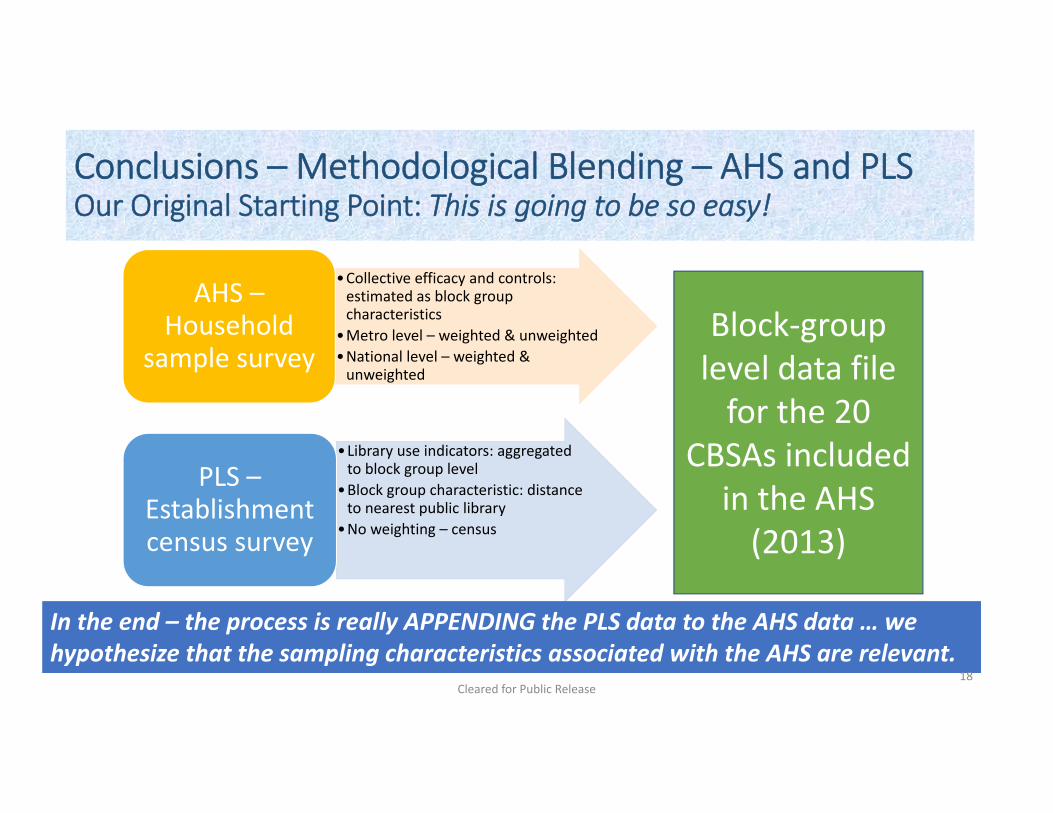
Conclusions – Methodological Blending – AHS and PLS Our Original Starting Point: This is going to be so easy!
•Collective efficacy and controls: estimated as block group characteristics
•Metro level – weighted & unweighted •National level – weighted & unweighted
AHS – Household
sample survey
PLS – Establishment census survey
•Library use indicators: aggregated to block group level
•Block group characteristic: distance to nearest public library
•No weighting – census
Block‐group level data file for the 20
CBSAs included in the AHS (2013)
In the end – the process is really APPENDING the PLS data to the AHS data … we hypothesize that the sampling characteristics associated with the AHS are relevant.
Cleared for Public Release 18
Conclusions – Methodological / Data
• Units of analysis – are we trying to say something about libraries or about people? • If libraries (or communities) – merging with a sample survey means there aresystematic biases based on the underrepresentation of rural and small communities in the AHS data – presentation of findings needs to be nuanced
• If households – appending PLS data is akin to appending any other “neighborhood amenity” information
• Availability of data in the topical module for locations – quality and disclosure issues
Cleared for Public Release 19
Conclusions – Methodological / Collaboration
• Good news (keep doing these things!): • Learning about data and identifying collaborators … agency research conferences and FCSM networks are useful
• Initial series of phone meetings and initial timeline worked well and (fortunately) we stayed to the timeline despite some speedbumps along the way
• The need to pass data to a “new” person Lisa kept reminding herself to SIMPLIFY and focus
• Complementary skillsets
• Lessons learned: • One person per agency … MORE people per agency would have been better • Sample weights: hypothesize that the AHS weights “apply” – include a sampling statistician on the team
• Data access and use rules • Relied on Melissa (already had access to AHS restricted‐use data) to shoulder the analysis burden • Be aware of exigent circumstances that can impact access to data
Cleared for Public Release 20
Conclusions – Methodological / Future Work
• Units of analysis and attribution • Large urban (and sometimes suburban) library systems have many outlets –applying system‐level (AE) data problematic for the types of analyses of interestto library stakeholders • Possible solution: many large systems collect and post relevant data on their websites: could supplement the IMLS data with public data pulled separately from these systems
• Weights – AHS and the collective efficacy module are designed to provide metro‐level estimates…implications of appending PLS data?
• Geographically sensitive modeling • Could use adaptive bandwidth geographically weighted regressions (GWR) to see where the models ‘work’ and where they ‘don’t’ with more specificity
• Could blend additional neighborhood and regional characteristics, like race, income, education levels, and others, pulled from AHS and from other Census Bureau data collections
Cleared for Public Release 21
THANK YOU! Lisa M. Frehill [email protected]
Melissa Cidade [email protected]
Cleared for Public Release 22