Embed Size (px)
Citation preview
1
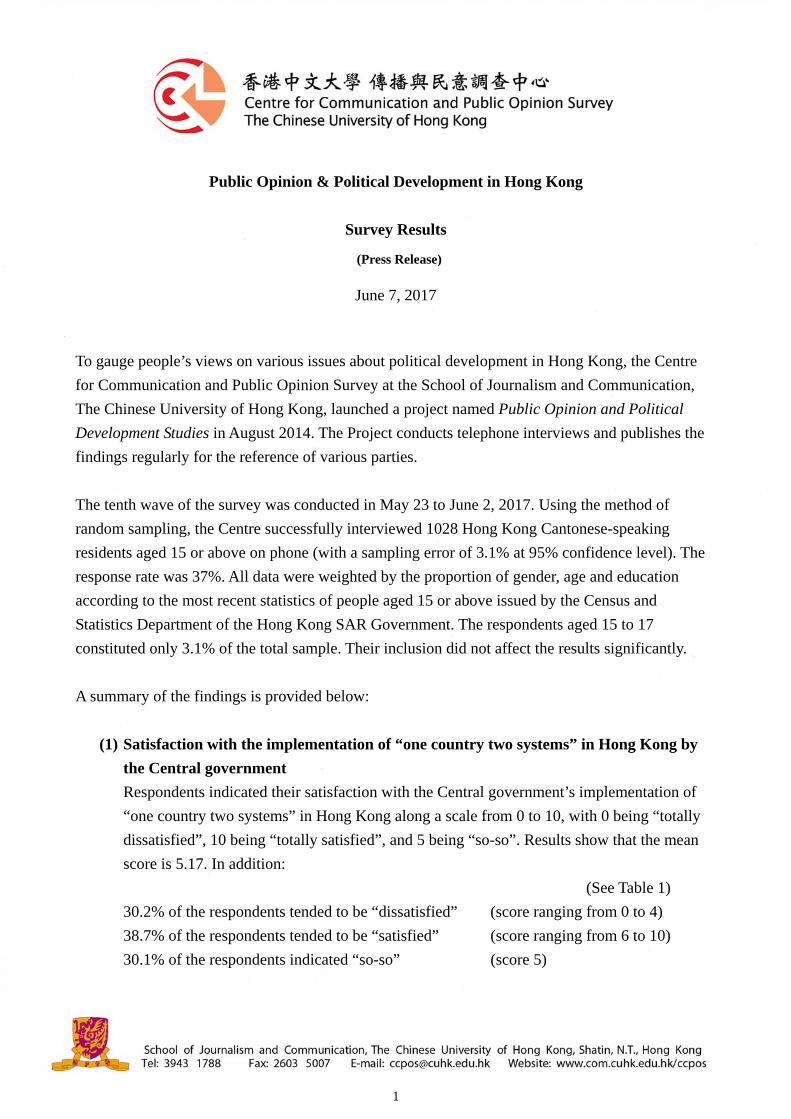
Public Opinion & Political Development in Hong Kong
Survey Results
(Press Release)
June 7, 2017
To gauge people’s views on various issues about political development in Hong Kong, the Centre
for Communication and Public Opinion Survey at the School of Journalism and Communication,
The Chinese University of Hong Kong, launched a project named Public Opinion and Political
Development Studies in August 2014. The Project conducts telephone interviews and publishes the
findings regularly for the reference of various parties.
The tenth wave of the survey was conducted in May 23 to June 2, 2017. Using the method of
random sampling, the Centre successfully interviewed 1028 Hong Kong Cantonese-speaking
residents aged 15 or above on phone (with a sampling error of 3.1% at 95% confidence level). The
response rate was 37%. All data were weighted by the proportion of gender, age and education
according to the most recent statistics of people aged 15 or above issued by the Census and
Statistics Department of the Hong Kong SAR Government. The respondents aged 15 to 17
constituted only 3.1% of the total sample. Their inclusion did not affect the results significantly.
A summary of the findings is provided below:
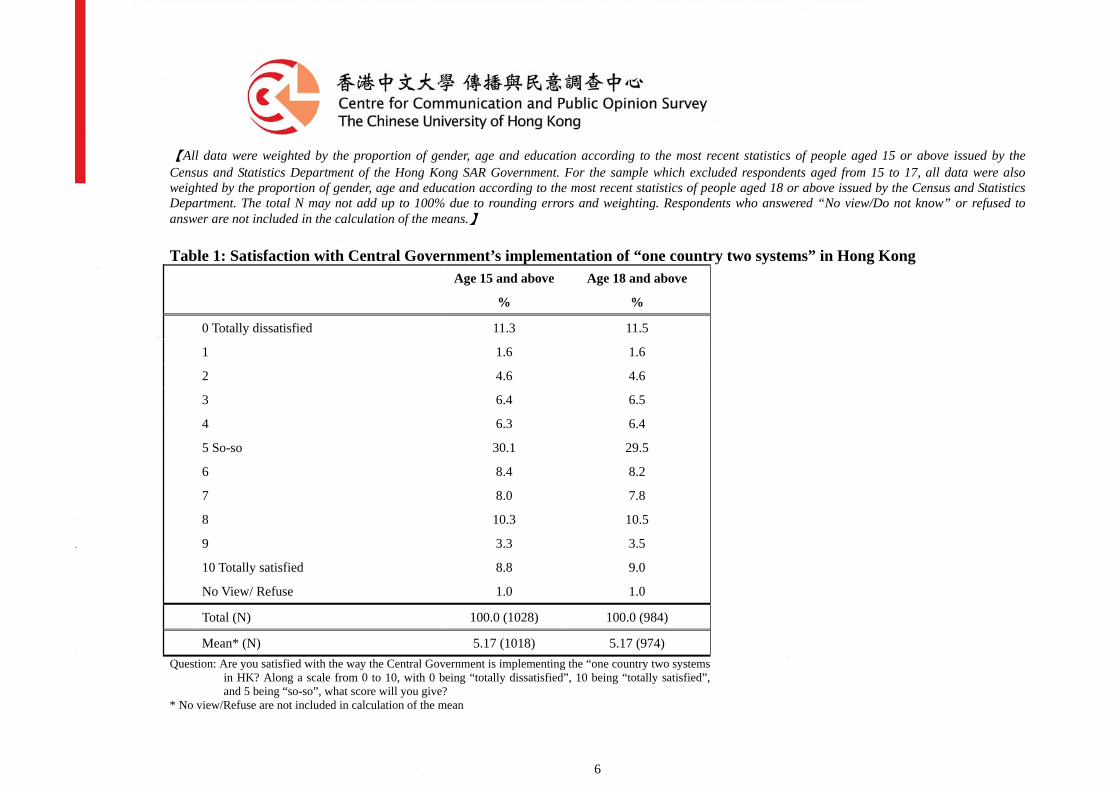
(1) Satisfaction with the implementation of “one country two systems” in Hong Kong by
the Central government
Respondents indicated their satisfaction with the Central government’s implementation of
“one country two systems” in Hong Kong along a scale from 0 to 10, with 0 being “totally
dissatisfied”, 10 being “totally satisfied”, and 5 being “so-so”. Results show that the mean
score is 5.17. In addition:
(See Table 1)
30.2% of the respondents tended to be “dissatisfied” (score ranging from 0 to 4)
38.7% of the respondents tended to be “satisfied” (score ranging from 6 to 10)
30.1% of the respondents indicated “so-so” (score 5)
2
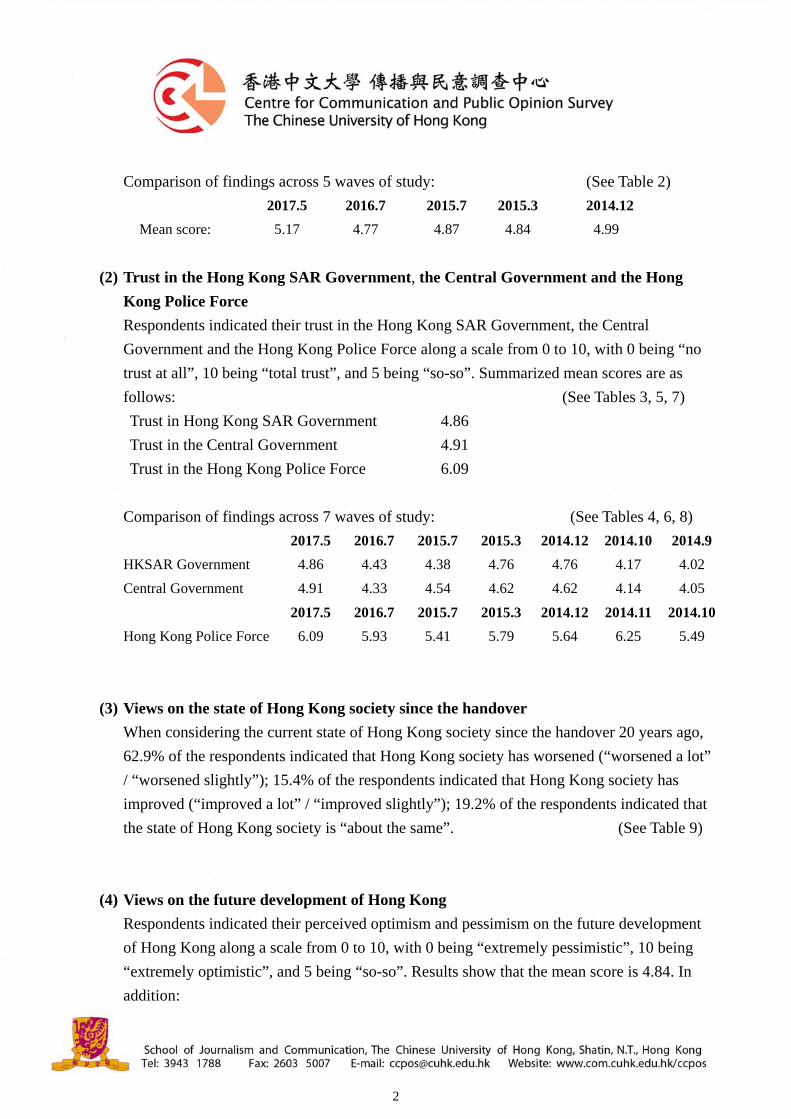
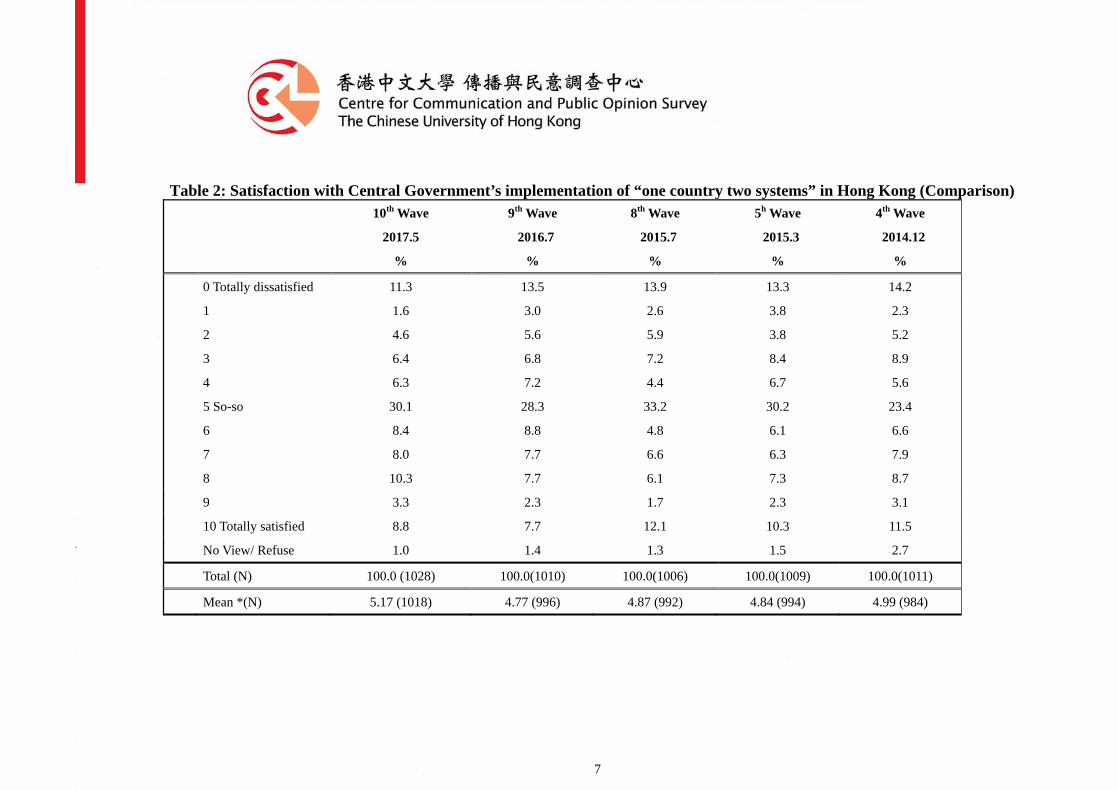
Comparison of findings across 5 waves of study: (See Table 2)
2017.5 2016.7 2015.7 2015.3 2014.12
Mean score: 5.17 4.77 4.87 4.84 4.99
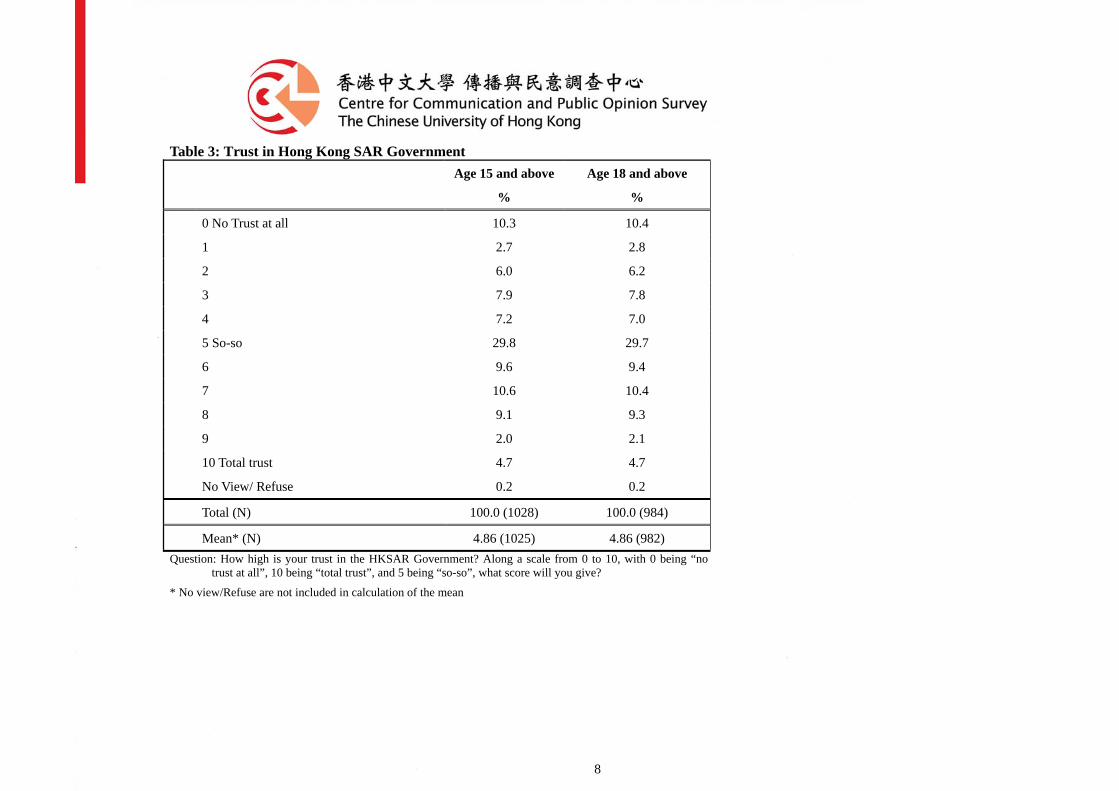
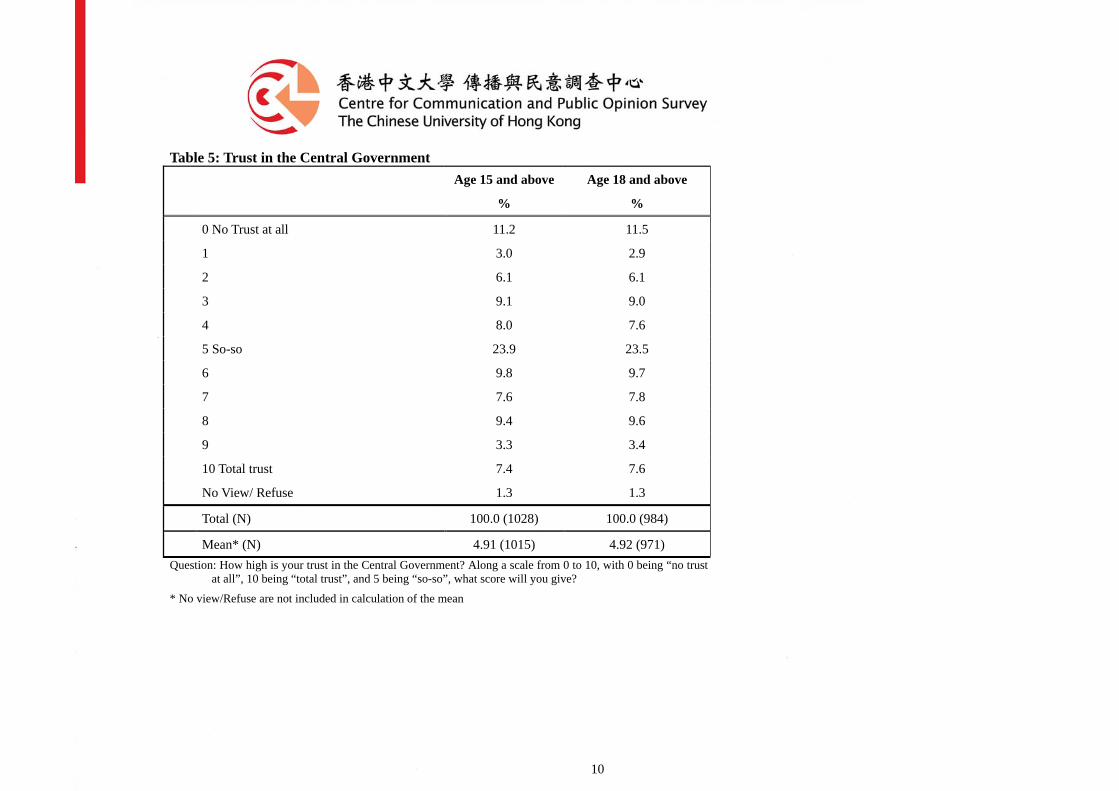
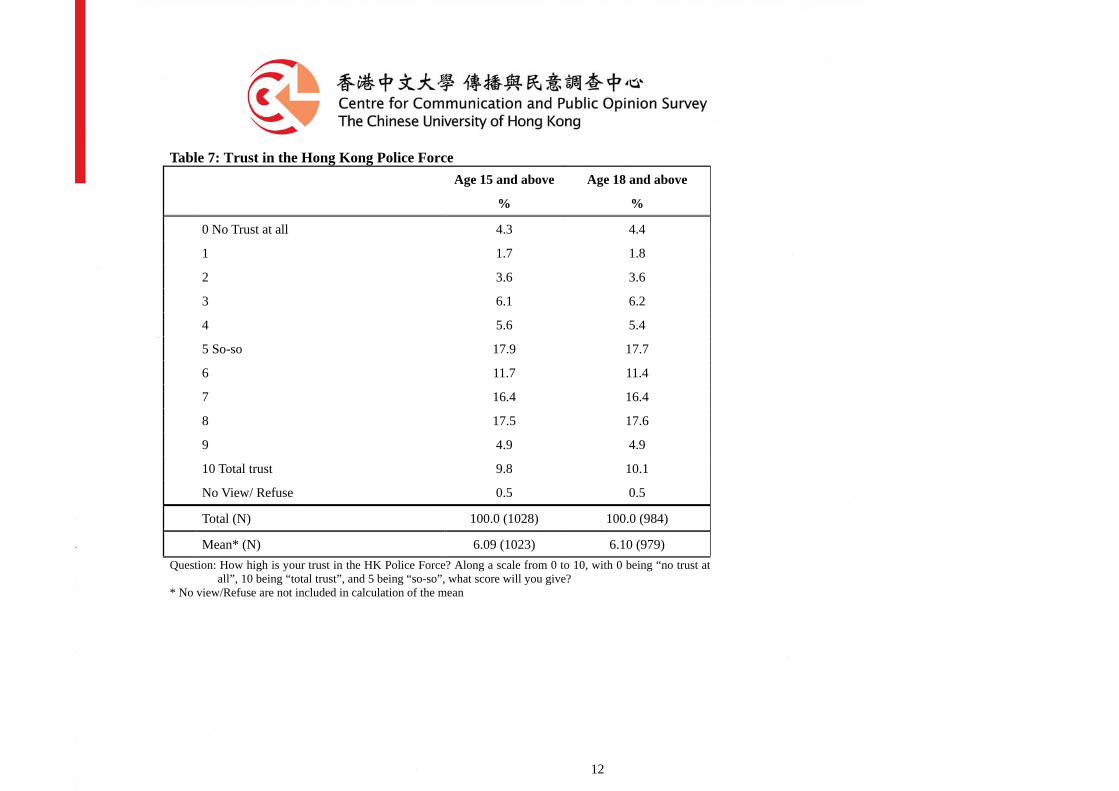
(2) Trust in the Hong Kong SAR Government, the Central Government and the Hong
Kong Police Force
Respondents indicated their trust in the Hong Kong SAR Government, the Central
Government and the Hong Kong Police Force along a scale from 0 to 10, with 0 being “no
trust at all”, 10 being “total trust”, and 5 being “so-so”. Summarized mean scores are as
follows: (See Tables 3, 5, 7)
Trust in Hong Kong SAR Government 4.86
Trust in the Central Government 4.91
Trust in the Hong Kong Police Force 6.09
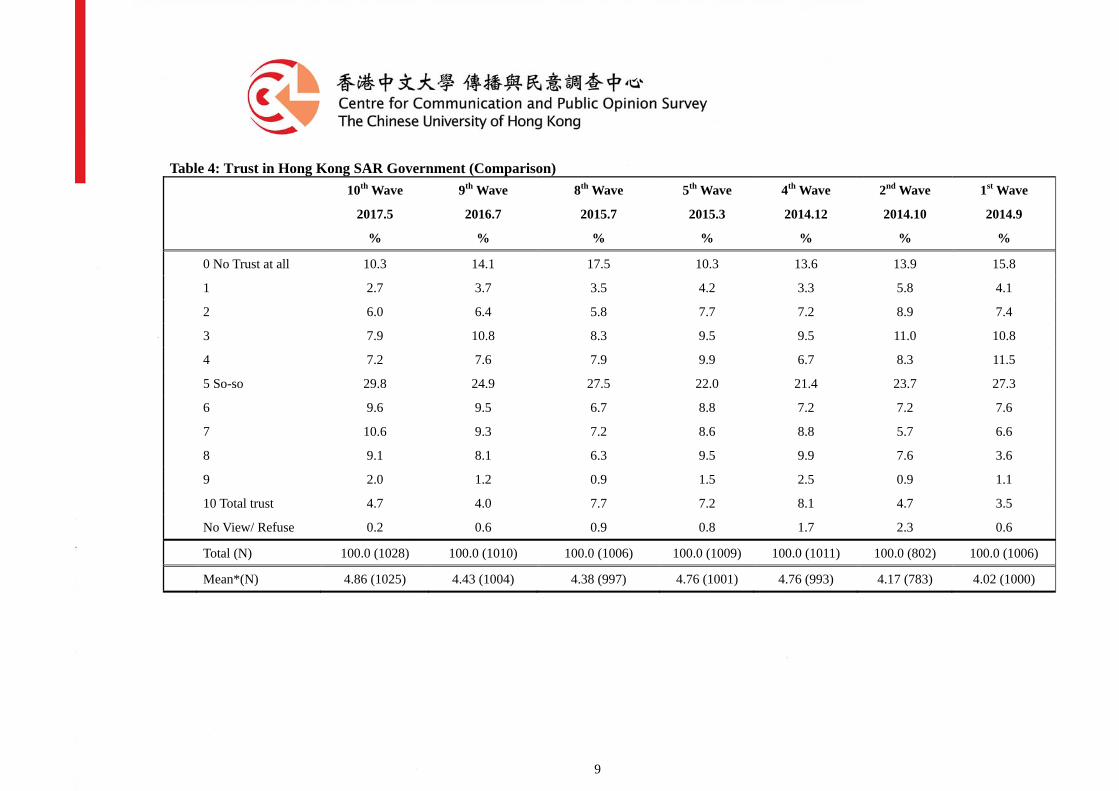
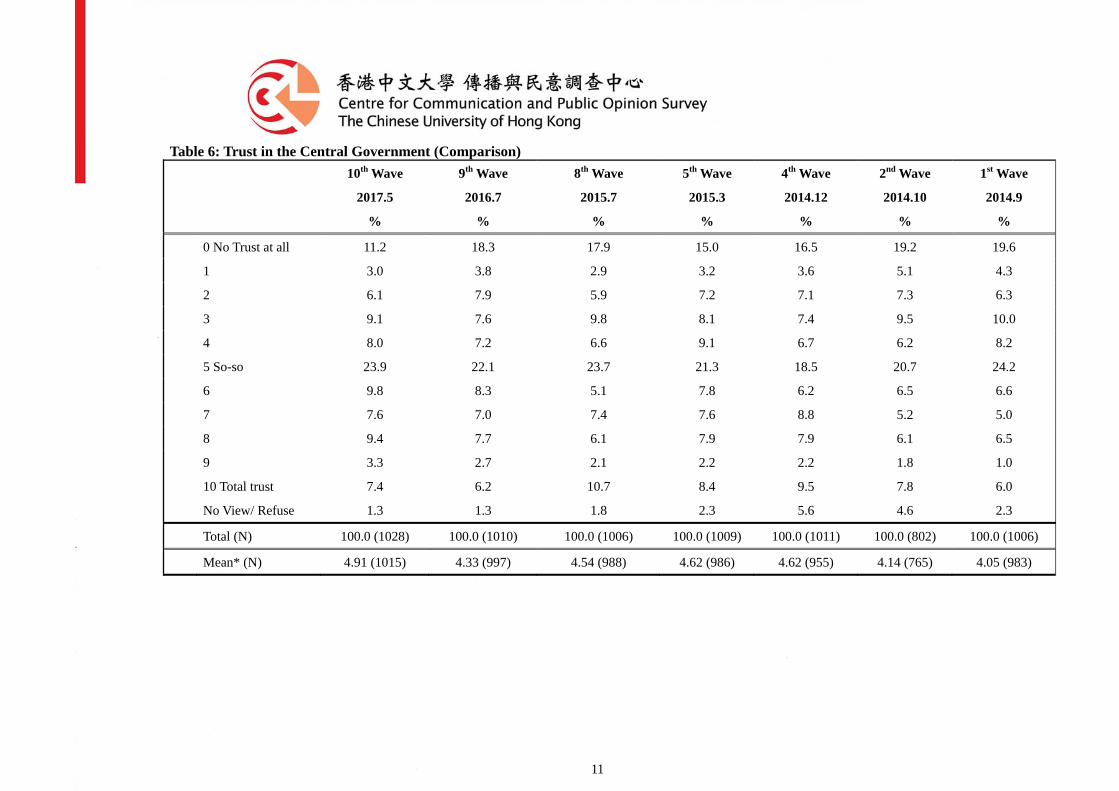
Comparison of findings across 7 waves of study: (See Tables 4, 6, 8)
2017.5 2016.7 2015.7 2015.3 2014.12 2014.10 2014.9
HKSAR Government 4.86 4.43 4.38 4.76 4.76 4.17 4.02
Central Government 4.91 4.33 4.54 4.62 4.62 4.14 4.05
2017.5 2016.7 2015.7 2015.3 2014.12 2014.11 2014.10
Hong Kong Police Force 6.09 5.93 5.41 5.79 5.64 6.25 5.49
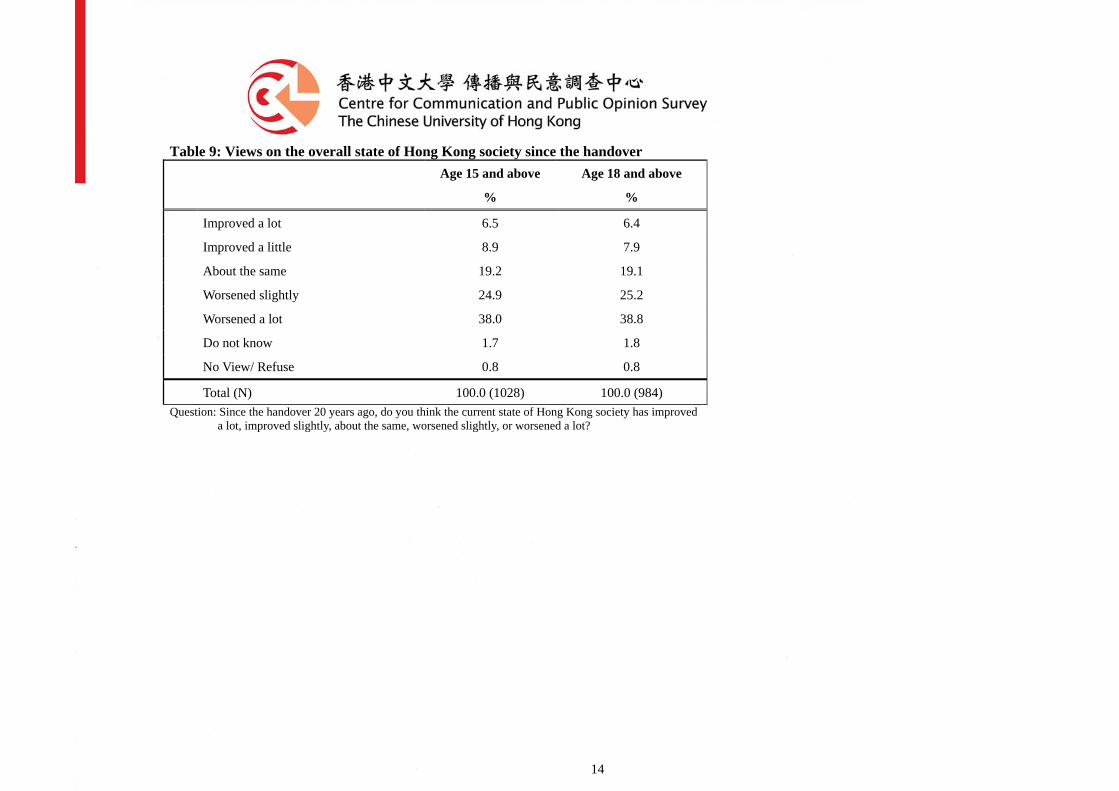
(3) Views on the state of Hong Kong society since the handover
When considering the current state of Hong Kong society since the handover 20 years ago,
62.9% of the respondents indicated that Hong Kong society has worsened (“worsened a lot”
/ “worsened slightly”); 15.4% of the respondents indicated that Hong Kong society has
improved (“improved a lot” / “improved slightly”); 19.2% of the respondents indicated that
the state of Hong Kong society is “about the same”. (See Table 9)
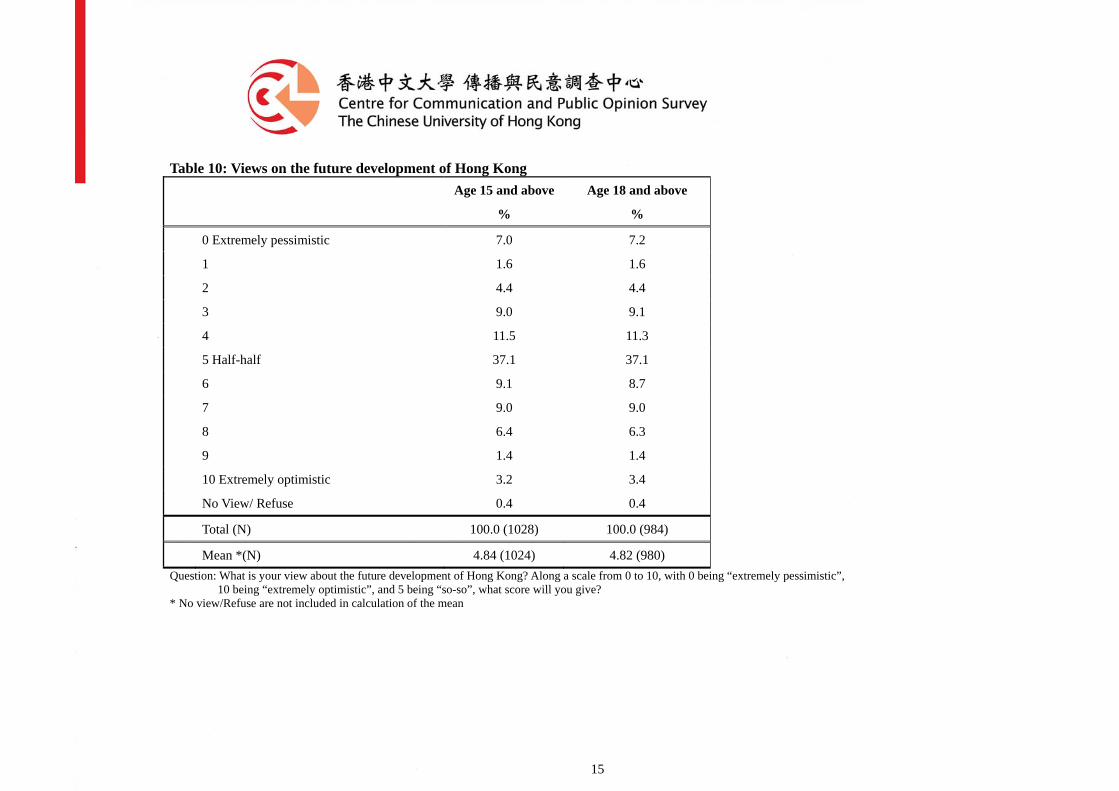
(4) Views on the future development of Hong Kong
Respondents indicated their perceived optimism and pessimism on the future development
of Hong Kong along a scale from 0 to 10, with 0 being “extremely pessimistic”, 10 being
“extremely optimistic”, and 5 being “so-so”. Results show that the mean score is 4.84. In
addition:
3
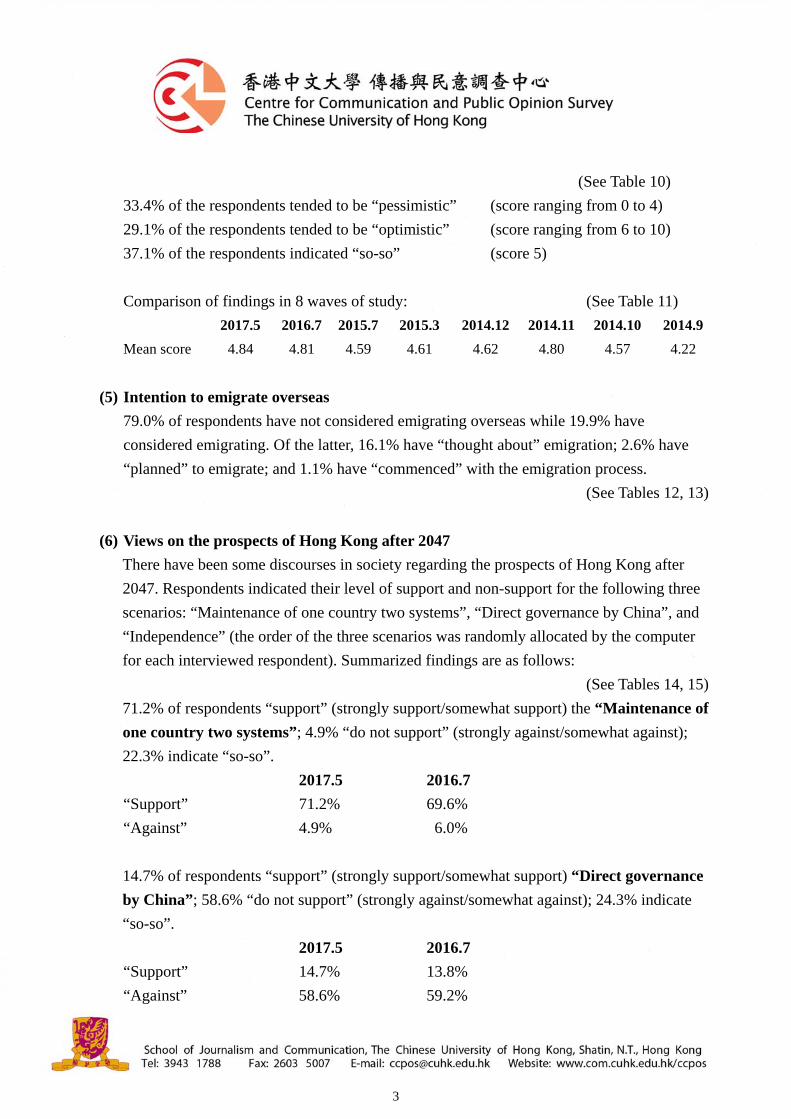
(See Table 10)
33.4% of the respondents tended to be “pessimistic” (score ranging from 0 to 4)
29.1% of the respondents tended to be “optimistic” (score ranging from 6 to 10)
37.1% of the respondents indicated “so-so” (score 5)
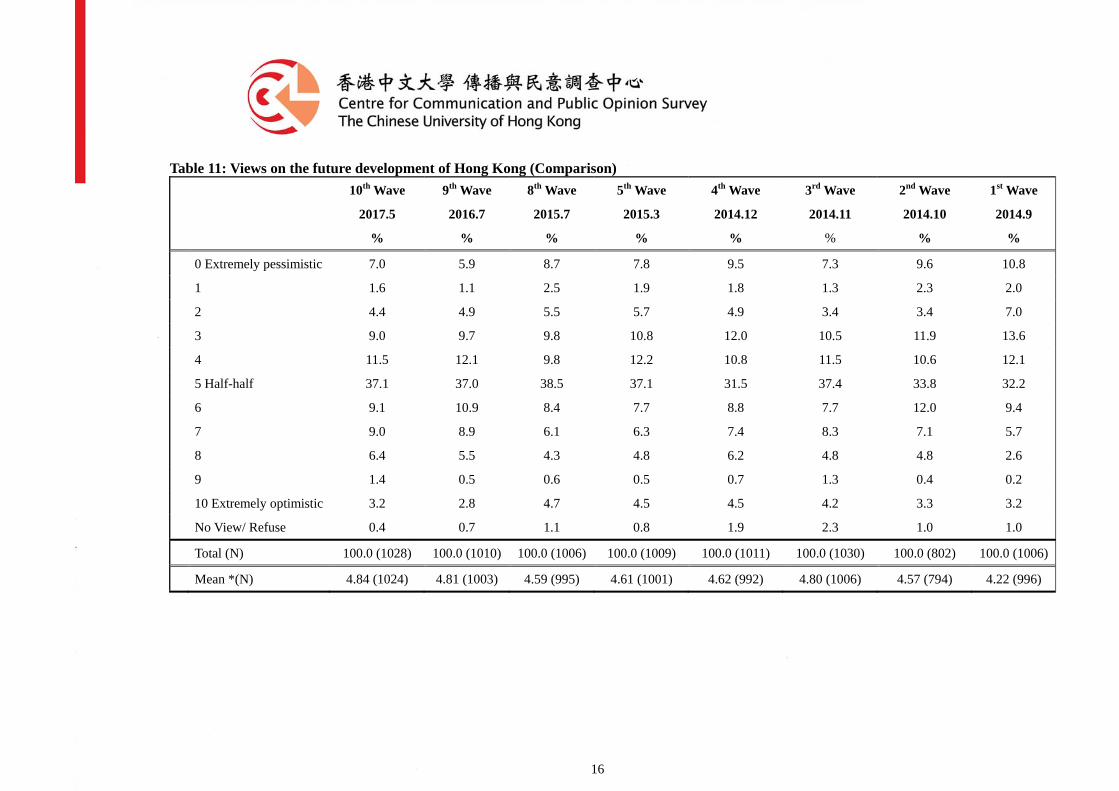
Comparison of findings in 8 waves of study: (See Table 11)
2017.5 2016.7 2015.7 2015.3 2014.12 2014.11 2014.10 2014.9
Mean score 4.84 4.81 4.59 4.61 4.62 4.80 4.57 4.22
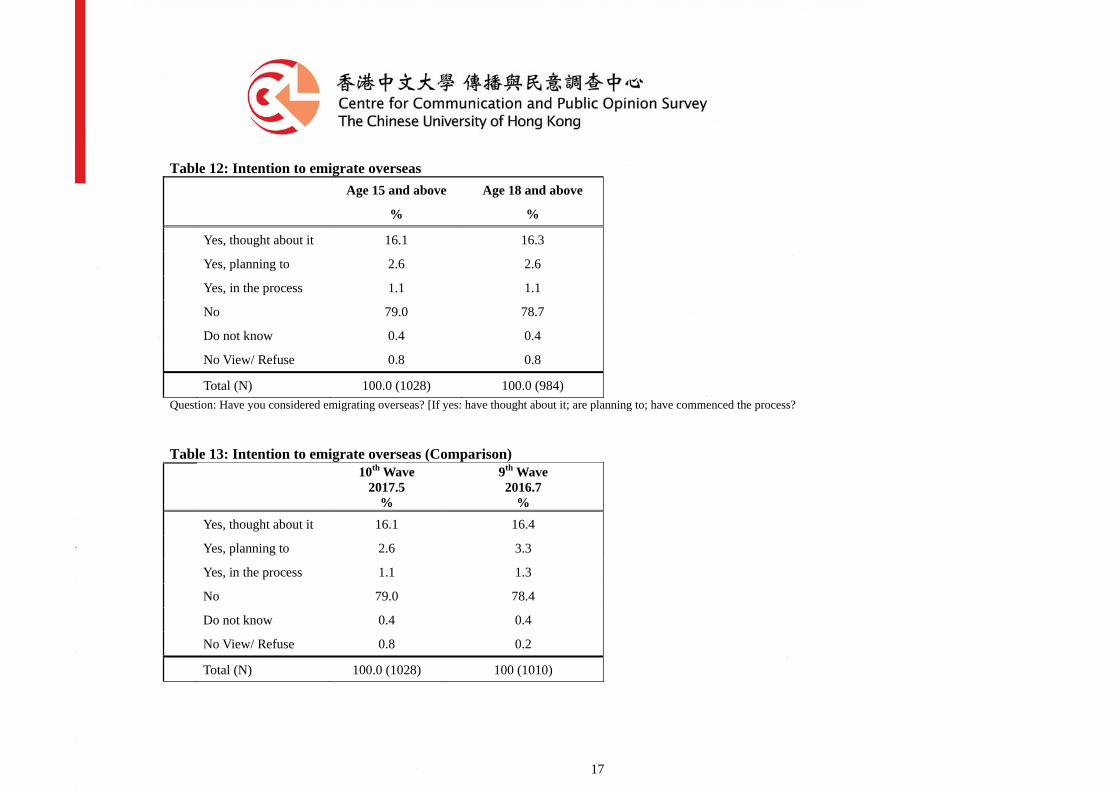
(5) Intention to emigrate overseas
79.0% of respondents have not considered emigrating overseas while 19.9% have
considered emigrating. Of the latter, 16.1% have “thought about” emigration; 2.6% have
“planned” to emigrate; and 1.1% have “commenced” with the emigration process.
(See Tables 12, 13)
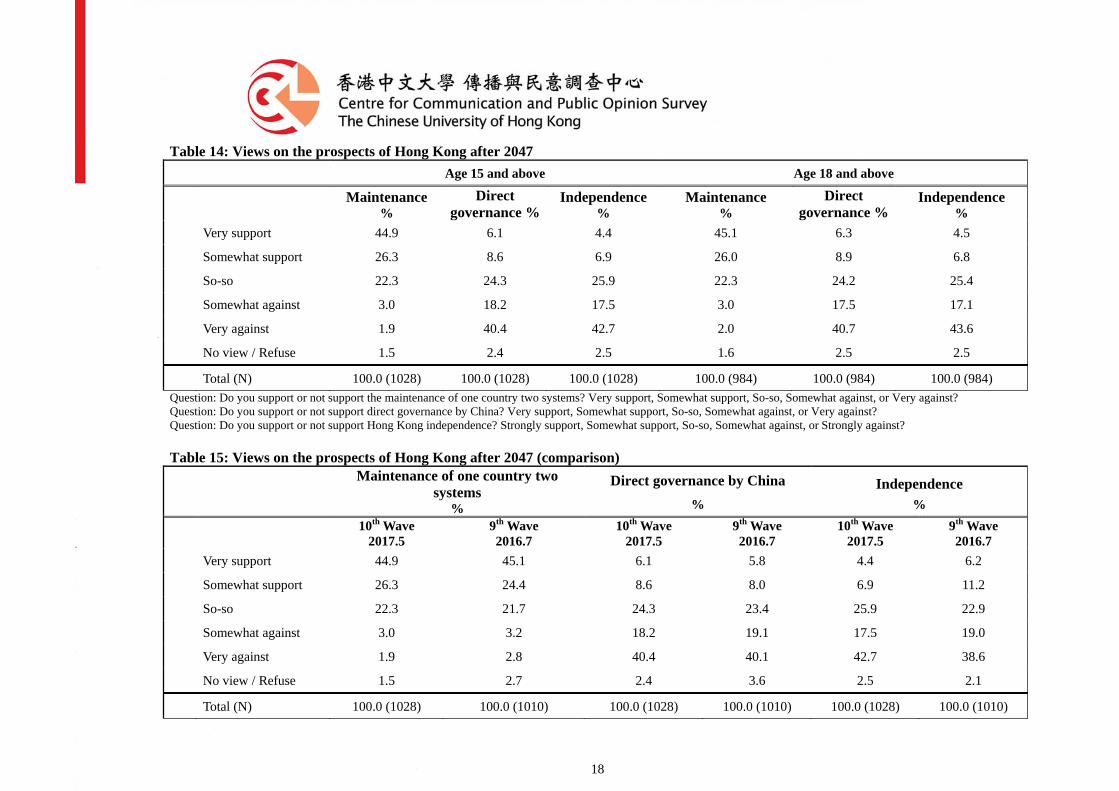
(6) Views on the prospects of Hong Kong after 2047
There have been some discourses in society regarding the prospects of Hong Kong after
2047. Respondents indicated their level of support and non-support for the following three
scenarios: “Maintenance of one country two systems”, “Direct governance by China”, and
“Independence” (the order of the three scenarios was randomly allocated by the computer
for each interviewed respondent). Summarized findings are as follows:
(See Tables 14, 15)
71.2% of respondents “support” (strongly support/somewhat support) the “Maintenance of
one country two systems”; 4.9% “do not support” (strongly against/somewhat against);
22.3% indicate “so-so”.
2017.5 2016.7
“Support” 71.2% 69.6%
“Against” 4.9% 6.0%
14.7% of respondents “support” (strongly support/somewhat support) “Direct governance
by China”; 58.6% “do not support” (strongly against/somewhat against); 24.3% indicate
“so-so”.
2017.5 2016.7
“Support” 14.7% 13.8%
“Against” 58.6% 59.2%
4
11.4% of respondents “support” (strongly support/somewhat support) Hong Kong
“Independence”; 60.2% “do not support” (strongly against/somewhat against); 25.9%
indicate “so-so”.
2017.5 2016.7
“Support” 11.4% 17.4%
“Against” 60.2% 57.6%
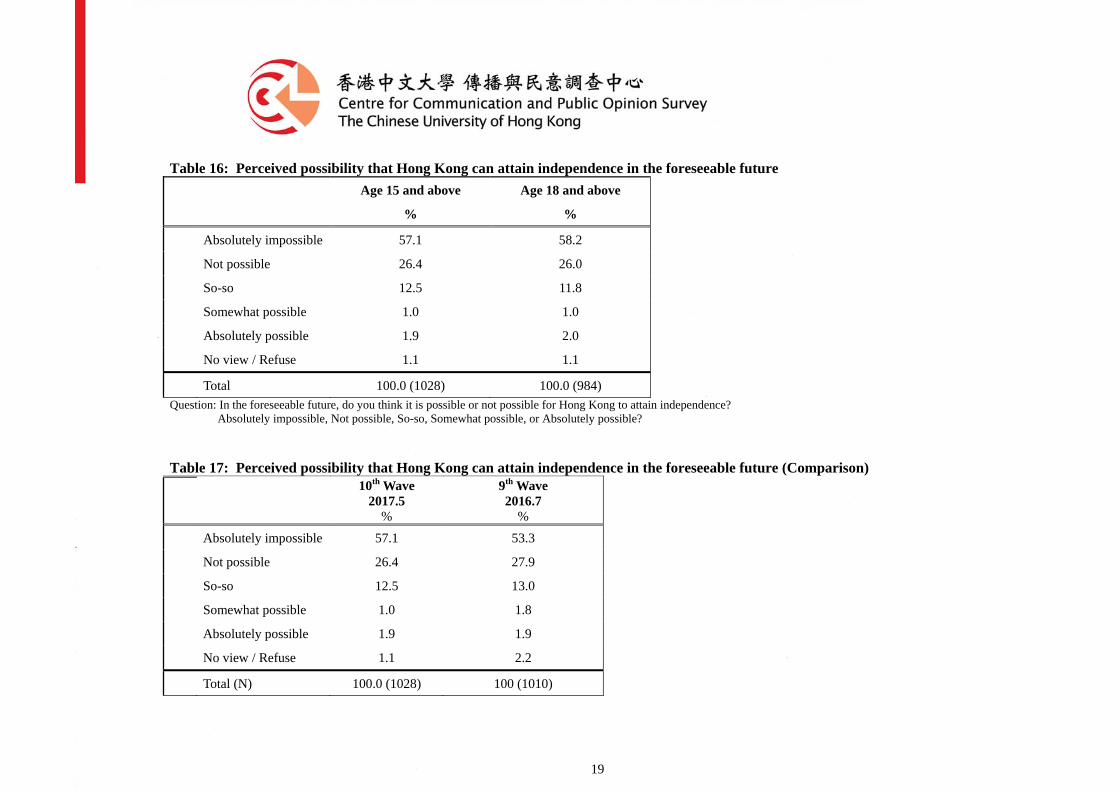
(7) Perceived possibility that Hong Kong can attain independence in the future
83.5% of respondents indicated “not possible” (absolutely not possible/not possible);
2.9% of respondents indicated it is “possible” (absolutely possible/somewhat possible);
12.5% indicated “so-so”
2017.5 2016.7 (See Tables 16, 17)
“Not possible” 83.5% 81.2%
“Possible” 2.9% 3.6%
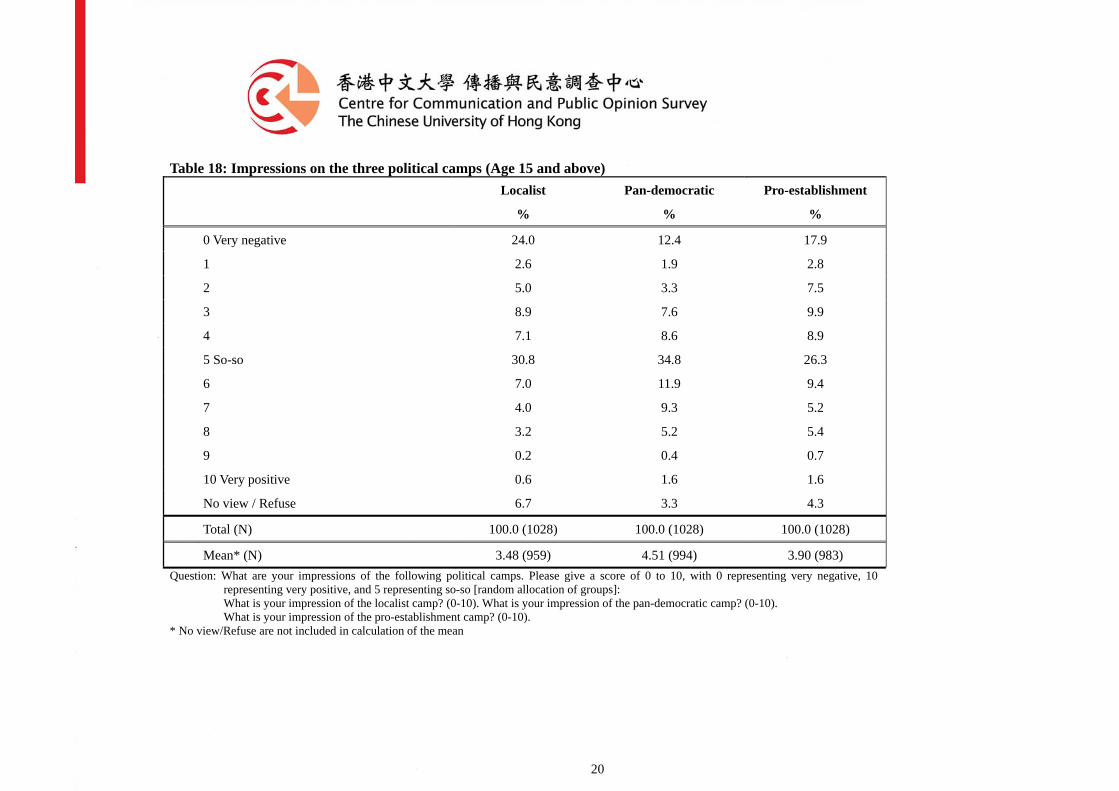
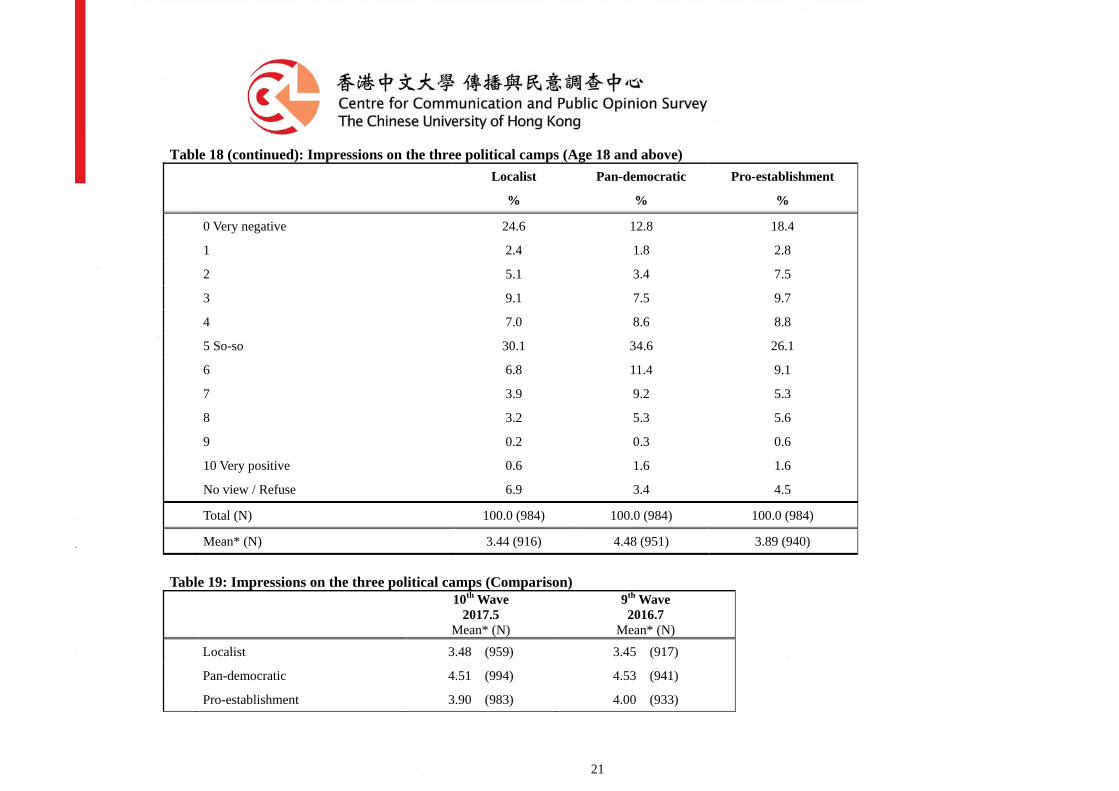
(8) Impressions on the three political camps
Respondents indicated their general impression along a scale from 0 to 10, with 0 being
“very negative”, 10 being “very positive”, and 5 being “so-so”, on the following three
political camps: “Localist”, “pan-democratic”, and “pro-establishment” (the order of the
groups was randomly allocated by the computer for each interviewed respondent).
Summarized mean scores are as follows:
Comparison of findings in 2 waves of study: (See Tables 18, 19)
2017.5 2016.7
“Localist” 3.48 3.45
“Pan-democratic” 4.51 4.53
“Pro-establishment” 3.90 4.00
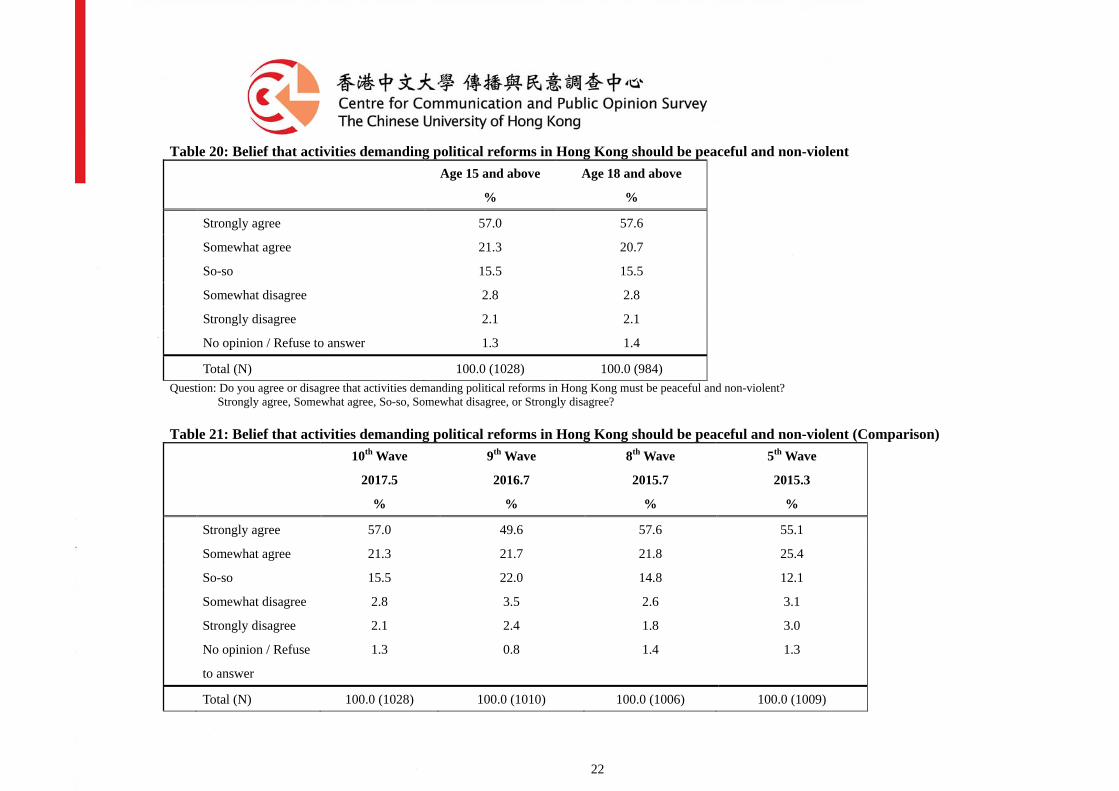
(9) Belief that activities demanding political reforms in Hong Kong should be peaceful and
non-violent
78.4% of respondents “agree” (exceedingly agree/somewhat agree) that activities
demanding political reforms should be peaceful and non-violent; 4.8% of respondents
indicate “disagree” (exceedingly disagree/somewhat disagree); 15.5% of respondents
indicate “so-so” (See Table 20)
5
Comparison of findings in 4 waves of study: (See Table 21)
2017.5 2016.7 2015.7 2015.3
“Agree”: 78.4% 71.3% 79.4% 80.5%
“Disagree”: 4.8% 5.9% 4.4% 6.1%
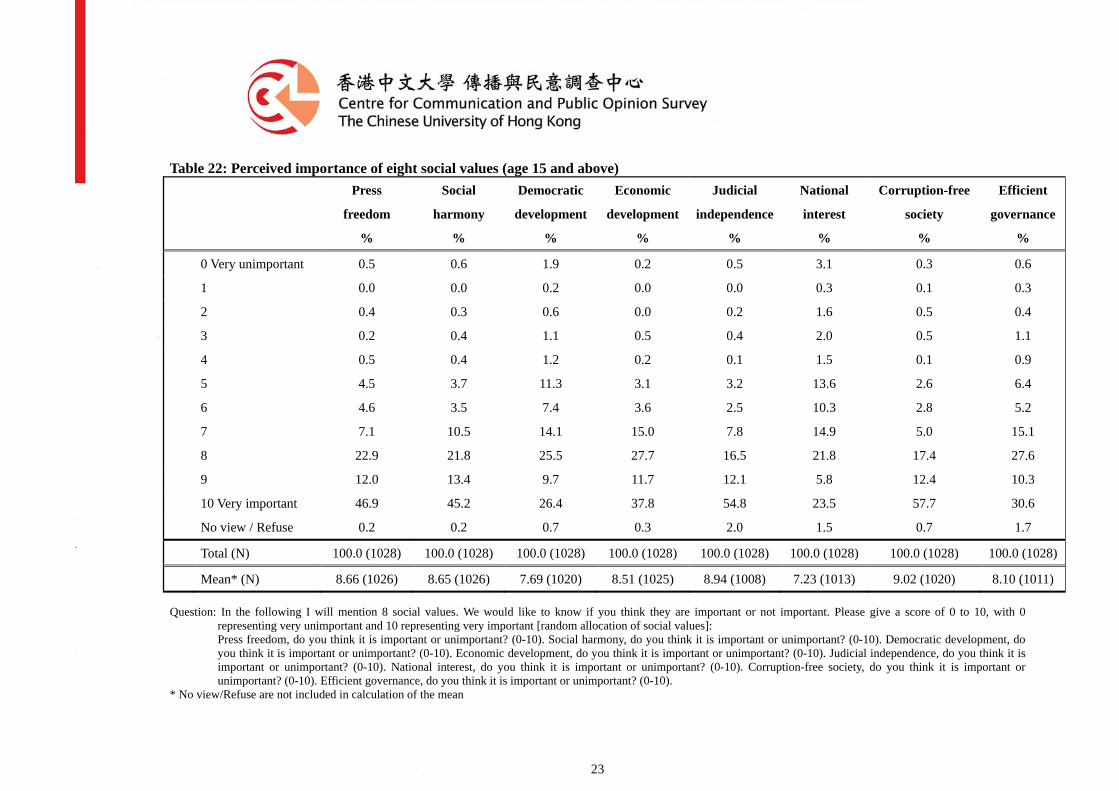
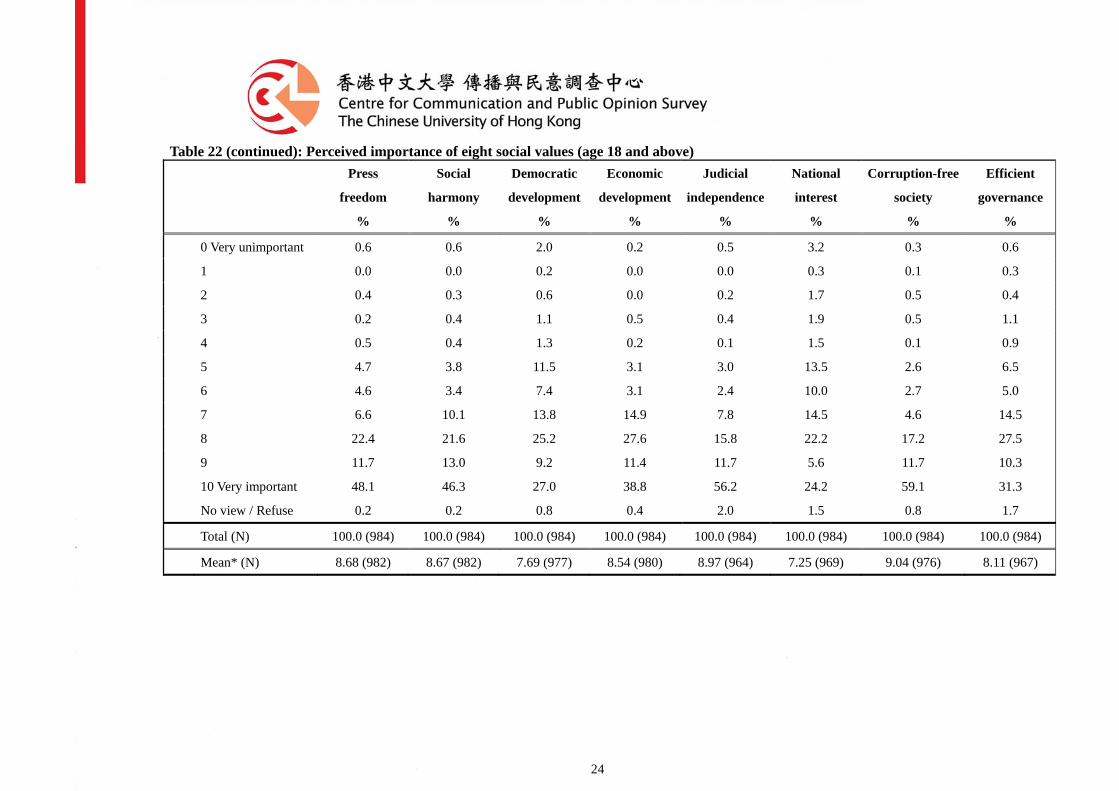
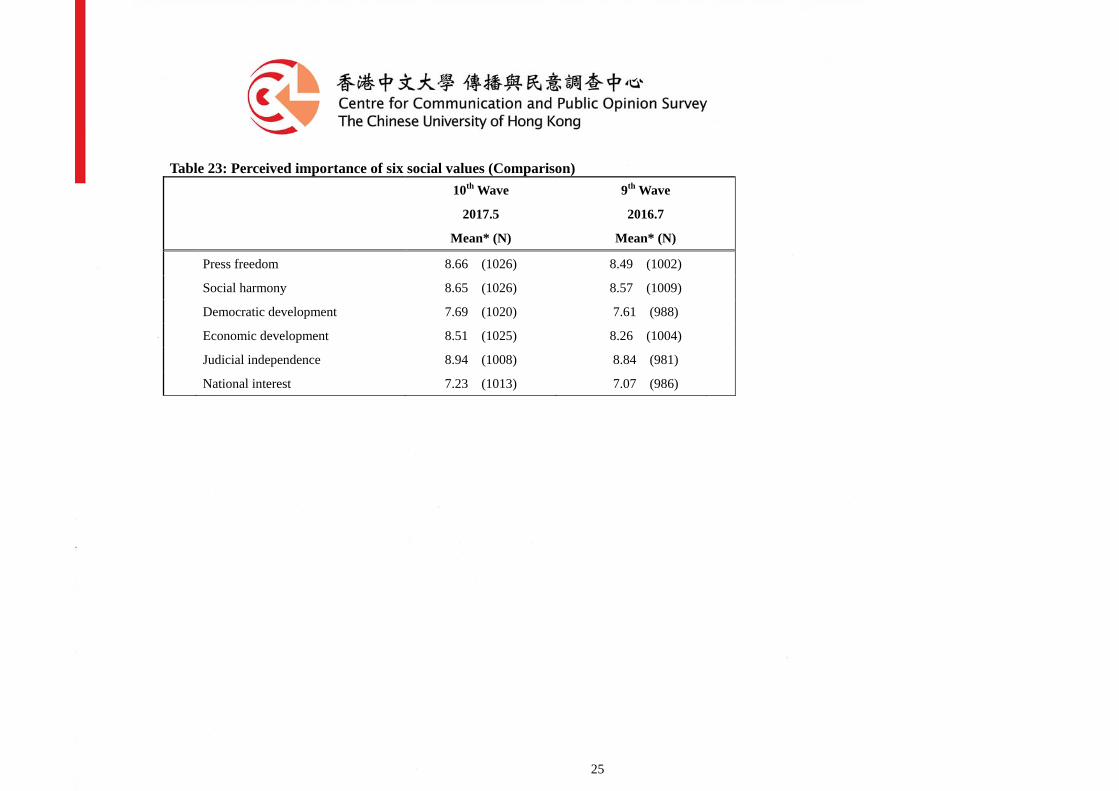
(10) Perceived importance of eight social values
Respondents indicated their view along a scale from 0 to 10, with 0 being “very
unimportant”, 10 being “very important”, on the following social values: “press freedom”,
“social harmony”, “democratic development”, “economic development”, “judicial
independence”, “national interest”, “Corruption-free society” and “Efficient governance”
(the order of the social values was randomly allocated by the computer for each interviewed
respondent). The mean score for each value is as follows along with the comparison of
findings in 2 waves of study: (See Tables 22, 23)
2017.5 2016.7
“Corruption-free society” 9.02 (1st) --
“Judicial independence” 8.94 (2nd) 8.84 (1st)
“Press freedom” 8.66 (3rd) 8.49 (3rd)
“Social harmony” 8.65 (4th) 8.57 (2nd)
“Economic development” 8.51 (5th) 8.26 (4th)
“Efficient governance” 8.10 (6th) --
“Democratic development” 7.69 (7h) 7.61 (5th)
“National interest” 7.23 (8th) 7.07 (6th)
6
【All data were weighted by the proportion of gender, age and education according to the most recent statistics of people aged 15 or above issued by the Census and Statistics Department of the Hong Kong SAR Government. For the sample which excluded respondents aged from 15 to 17, all data were also weighted by the proportion of gender, age and education according to the most recent statistics of people aged 18 or above issued by the Census and Statistics Department. The total N may not add up to 100% due to rounding errors and weighting. Respondents who answered “No view/Do not know” or refused to answer are not included in the calculation of the means.】 Table 1: Satisfaction with Central Government’s implementation of “one country two systems” in Hong Kong
Age 15 and above
%
Age 18 and above
%
0 Totally dissatisfied 11.3 11.5
1 1.6 1.6
2 4.6 4.6
3 6.4 6.5
4 6.3 6.4
5 So-so 30.1 29.5
6 8.4 8.2
7 8.0 7.8
8 10.3 10.5
9 3.3 3.5
10 Totally satisfied 8.8 9.0
No View/ Refuse 1.0 1.0
Total (N) 100.0 (1028) 100.0 (984)
Mean* (N) 5.17 (1018) 5.17 (974)
Question: Are you satisfied with the way the Central Government is implementing the “one country two systems in HK? Along a scale from 0 to 10, with 0 being “totally dissatisfied”, 10 being “totally satisfied”, and 5 being “so-so”, what score will you give?
* No view/Refuse are not included in calculation of the mean
7
Table 2: Satisfaction with Central Government’s implementation of “one country two systems” in Hong Kong (Comparison)
10th Wave
2017.5
%
9th Wave
2016.7
%
8th Wave
2015.7
%
5h Wave
2015.3
%
4th Wave
2014.12
%
0 Totally dissatisfied 11.3 13.5 13.9 13.3 14.2
1 1.6 3.0 2.6 3.8 2.3
2 4.6 5.6 5.9 3.8 5.2
3 6.4 6.8 7.2 8.4 8.9
4 6.3 7.2 4.4 6.7 5.6
5 So-so 30.1 28.3 33.2 30.2 23.4
6 8.4 8.8 4.8 6.1 6.6
7 8.0 7.7 6.6 6.3 7.9
8 10.3 7.7 6.1 7.3 8.7
9 3.3 2.3 1.7 2.3 3.1
10 Totally satisfied 8.8 7.7 12.1 10.3 11.5
No View/ Refuse 1.0 1.4 1.3 1.5 2.7
Total (N) 100.0 (1028) 100.0(1010) 100.0(1006) 100.0(1009) 100.0(1011)
Mean *(N) 5.17 (1018) 4.77 (996) 4.87 (992) 4.84 (994) 4.99 (984)
8
Table 3: Trust in Hong Kong SAR Government
Age 15 and above
%
Age 18 and above
%
0 No Trust at all 10.3 10.4
1 2.7 2.8
2 6.0 6.2
3 7.9 7.8
4 7.2 7.0
5 So-so 29.8 29.7
6 9.6 9.4
7 10.6 10.4
8 9.1 9.3
9 2.0 2.1
10 Total trust 4.7 4.7
No View/ Refuse 0.2 0.2
Total (N) 100.0 (1028) 100.0 (984)
Mean* (N) 4.86 (1025) 4.86 (982)
Question: How high is your trust in the HKSAR Government? Along a scale from 0 to 10, with 0 being “no trust at all”, 10 being “total trust”, and 5 being “so-so”, what score will you give?
* No view/Refuse are not included in calculation of the mean
9
Table 4: Trust in Hong Kong SAR Government (Comparison)
10th Wave
2017.5
%
9th Wave
2016.7
%
8th Wave
2015.7
%
5th Wave
2015.3
%
4th Wave
2014.12
%
2nd Wave
2014.10
%
1st Wave
2014.9
%
0 No Trust at all 10.3 14.1 17.5 10.3 13.6 13.9 15.8
1 2.7 3.7 3.5 4.2 3.3 5.8 4.1
2 6.0 6.4 5.8 7.7 7.2 8.9 7.4
3 7.9 10.8 8.3 9.5 9.5 11.0 10.8
4 7.2 7.6 7.9 9.9 6.7 8.3 11.5
5 So-so 29.8 24.9 27.5 22.0 21.4 23.7 27.3
6 9.6 9.5 6.7 8.8 7.2 7.2 7.6
7 10.6 9.3 7.2 8.6 8.8 5.7 6.6
8 9.1 8.1 6.3 9.5 9.9 7.6 3.6
9 2.0 1.2 0.9 1.5 2.5 0.9 1.1
10 Total trust 4.7 4.0 7.7 7.2 8.1 4.7 3.5
No View/ Refuse 0.2 0.6 0.9 0.8 1.7 2.3 0.6
Total (N) 100.0 (1028) 100.0 (1010) 100.0 (1006) 100.0 (1009) 100.0 (1011) 100.0 (802) 100.0 (1006)
Mean*(N) 4.86 (1025) 4.43 (1004) 4.38 (997) 4.76 (1001) 4.76 (993) 4.17 (783) 4.02 (1000)
10
Table 5: Trust in the Central Government
Age 15 and above
%
Age 18 and above
%
0 No Trust at all 11.2 11.5
1 3.0 2.9
2 6.1 6.1
3 9.1 9.0
4 8.0 7.6
5 So-so 23.9 23.5
6 9.8 9.7
7 7.6 7.8
8 9.4 9.6
9 3.3 3.4
10 Total trust 7.4 7.6
No View/ Refuse 1.3 1.3
Total (N) 100.0 (1028) 100.0 (984)
Mean* (N) 4.91 (1015) 4.92 (971)
Question: How high is your trust in the Central Government? Along a scale from 0 to 10, with 0 being “no trust at all”, 10 being “total trust”, and 5 being “so-so”, what score will you give?
* No view/Refuse are not included in calculation of the mean
11
Table 6: Trust in the Central Government (Comparison)
10th Wave
2017.5
%
9th Wave
2016.7
%
8th Wave
2015.7
%
5th Wave
2015.3
%
4th Wave
2014.12
%
2nd Wave
2014.10
%
1st Wave
2014.9
%
0 No Trust at all 11.2 18.3 17.9 15.0 16.5 19.2 19.6
1 3.0 3.8 2.9 3.2 3.6 5.1 4.3
2 6.1 7.9 5.9 7.2 7.1 7.3 6.3
3 9.1 7.6 9.8 8.1 7.4 9.5 10.0
4 8.0 7.2 6.6 9.1 6.7 6.2 8.2
5 So-so 23.9 22.1 23.7 21.3 18.5 20.7 24.2
6 9.8 8.3 5.1 7.8 6.2 6.5 6.6
7 7.6 7.0 7.4 7.6 8.8 5.2 5.0
8 9.4 7.7 6.1 7.9 7.9 6.1 6.5
9 3.3 2.7 2.1 2.2 2.2 1.8 1.0
10 Total trust 7.4 6.2 10.7 8.4 9.5 7.8 6.0
No View/ Refuse 1.3 1.3 1.8 2.3 5.6 4.6 2.3
Total (N) 100.0 (1028) 100.0 (1010) 100.0 (1006) 100.0 (1009) 100.0 (1011) 100.0 (802) 100.0 (1006)
Mean* (N) 4.91 (1015) 4.33 (997) 4.54 (988) 4.62 (986) 4.62 (955) 4.14 (765) 4.05 (983)
12
Table 7: Trust in the Hong Kong Police Force
Age 15 and above
%
Age 18 and above
%
0 No Trust at all 4.3 4.4
1 1.7 1.8
2 3.6 3.6
3 6.1 6.2
4 5.6 5.4
5 So-so 17.9 17.7
6 11.7 11.4
7 16.4 16.4
8 17.5 17.6
9 4.9 4.9
10 Total trust 9.8 10.1
No View/ Refuse 0.5 0.5
Total (N) 100.0 (1028) 100.0 (984)
Mean* (N) 6.09 (1023) 6.10 (979)
Question: How high is your trust in the HK Police Force? Along a scale from 0 to 10, with 0 being “no trust at all”, 10 being “total trust”, and 5 being “so-so”, what score will you give?
* No view/Refuse are not included in calculation of the mean

13
Table 8: Trust in the Hong Kong Police Force (Comparison)
10th Wave
2017.5
%
9th Wave
2016.7
%
8th Wave
2015.7
%
5th Wave
2015.3
%
4th Wave
2014.12
%
3rd Wave
2014.11
%
2nd Wave
2014.10
%
0 No Trust at all 4.3 5.1 11.0 5.3 9.1 3.8 9.3
1 1.7 2.6 2.4 2.9 2.6 1.9 1.8
2 3.6 3.1 6.3 4.8 5.1 3.1 3.9
3 6.1 6.0 6.1 7.0 7.7 5.9 5.7
4 5.6 6.0 5.7 5.4 4.9 5.3 7.9
5 So-so 17.9 20.4 21.6 26.5 21.2 22.8 25.3
6 11.7 11.2 7.3 6.6 7.6 8.5 8.4
7 16.4 13.8 10.0 9.4 9.4 11.3 10.1
8 17.5 16.3 12.0 11.9 12.3 14.7 11.4
9 4.9 5.1 3.7 5.2 4.6 4.4 1.8
10 Total trust 9.8 9.4 12.8 13.7 14.7 16.7 12.5
No View/ Refuse 0.5 0.9 1.0 1.3 1.0 1.6 2.0
Total (N) 100.0 (1028) 100.0 (1010) 100.0 (1006) 100.0 (1009) 100.0 (1011) 100.0 (1030) 100.0 (802)
Mean* (N) 6.09 (1023) 5.93 (1001) 5.41 (996) 5.79 (996) 5.64 (1001) 6.25 (1014) 5.49 (786)
14
Table 9: Views on the overall state of Hong Kong society since the handover
Age 15 and above
%
Age 18 and above
%
Improved a lot 6.5 6.4
Improved a little 8.9 7.9
About the same 19.2 19.1
Worsened slightly 24.9 25.2
Worsened a lot 38.0 38.8
Do not know 1.7 1.8
No View/ Refuse 0.8 0.8
Total (N) 100.0 (1028) 100.0 (984)
Question: Since the handover 20 years ago, do you think the current state of Hong Kong society has improved a lot, improved slightly, about the same, worsened slightly, or worsened a lot?
15
Table 10: Views on the future development of Hong Kong
Age 15 and above
%
Age 18 and above
%
0 Extremely pessimistic 7.0 7.2
1 1.6 1.6
2 4.4 4.4
3 9.0 9.1
4 11.5 11.3
5 Half-half 37.1 37.1
6 9.1 8.7
7 9.0 9.0
8 6.4 6.3
9 1.4 1.4
10 Extremely optimistic 3.2 3.4
No View/ Refuse 0.4 0.4
Total (N) 100.0 (1028) 100.0 (984)
Mean *(N) 4.84 (1024) 4.82 (980)
Question: What is your view about the future development of Hong Kong? Along a scale from 0 to 10, with 0 being “extremely pessimistic”, 10 being “extremely optimistic”, and 5 being “so-so”, what score will you give?
* No view/Refuse are not included in calculation of the mean
16
Table 11: Views on the future development of Hong Kong (Comparison)
10th Wave
2017.5
%
9th Wave
2016.7
%
8th Wave
2015.7
%
5th Wave
2015.3
%
4th Wave
2014.12
%
3rd Wave
2014.11
%
2nd Wave
2014.10
%
1st Wave
2014.9
%
0 Extremely pessimistic 7.0 5.9 8.7 7.8 9.5 7.3 9.6 10.8
1 1.6 1.1 2.5 1.9 1.8 1.3 2.3 2.0
2 4.4 4.9 5.5 5.7 4.9 3.4 3.4 7.0
3 9.0 9.7 9.8 10.8 12.0 10.5 11.9 13.6
4 11.5 12.1 9.8 12.2 10.8 11.5 10.6 12.1
5 Half-half 37.1 37.0 38.5 37.1 31.5 37.4 33.8 32.2
6 9.1 10.9 8.4 7.7 8.8 7.7 12.0 9.4
7 9.0 8.9 6.1 6.3 7.4 8.3 7.1 5.7
8 6.4 5.5 4.3 4.8 6.2 4.8 4.8 2.6
9 1.4 0.5 0.6 0.5 0.7 1.3 0.4 0.2
10 Extremely optimistic 3.2 2.8 4.7 4.5 4.5 4.2 3.3 3.2
No View/ Refuse 0.4 0.7 1.1 0.8 1.9 2.3 1.0 1.0
Total (N) 100.0 (1028) 100.0 (1010) 100.0 (1006) 100.0 (1009) 100.0 (1011) 100.0 (1030) 100.0 (802) 100.0 (1006)
Mean *(N) 4.84 (1024) 4.81 (1003) 4.59 (995) 4.61 (1001) 4.62 (992) 4.80 (1006) 4.57 (794) 4.22 (996)
17
Table 12: Intention to emigrate overseas
Age 15 and above
%
Age 18 and above
%
Yes, thought about it 16.1 16.3
Yes, planning to 2.6 2.6
Yes, in the process 1.1 1.1
No 79.0 78.7
Do not know 0.4 0.4
No View/ Refuse 0.8 0.8
Total (N) 100.0 (1028) 100.0 (984)
Question: Have you considered emigrating overseas? [If yes: have thought about it; are planning to; have commenced the process? Table 13: Intention to emigrate overseas (Comparison)
10th Wave 2017.5
%
9th Wave 2016.7
%
Yes, thought about it 16.1 16.4
Yes, planning to 2.6 3.3
Yes, in the process 1.1 1.3
No 79.0 78.4
Do not know 0.4 0.4
No View/ Refuse 0.8 0.2
Total (N) 100.0 (1028) 100 (1010)
18
Table 14: Views on the prospects of Hong Kong after 2047
Age 15 and above Age 18 and above
Maintenance %
Direct governance %
Independence %
Maintenance %
Direct governance %
Independence %
Very support 44.9 6.1 4.4 45.1 6.3 4.5
Somewhat support 26.3 8.6 6.9 26.0 8.9 6.8
So-so 22.3 24.3 25.9 22.3 24.2 25.4
Somewhat against 3.0 18.2 17.5 3.0 17.5 17.1
Very against 1.9 40.4 42.7 2.0 40.7 43.6
No view / Refuse 1.5 2.4 2.5 1.6 2.5 2.5
Total (N) 100.0 (1028) 100.0 (1028) 100.0 (1028) 100.0 (984) 100.0 (984) 100.0 (984)
Question: Do you support or not support the maintenance of one country two systems? Very support, Somewhat support, So-so, Somewhat against, or Very against? Question: Do you support or not support direct governance by China? Very support, Somewhat support, So-so, Somewhat against, or Very against? Question: Do you support or not support Hong Kong independence? Strongly support, Somewhat support, So-so, Somewhat against, or Strongly against? Table 15: Views on the prospects of Hong Kong after 2047 (comparison)
Maintenance of one country two systems
%
Direct governance by China
%
Independence
%
10th Wave 2017.5
9th Wave 2016.7
10th Wave 2017.5
9th Wave 2016.7
10th Wave 2017.5
9th Wave 2016.7
Very support 44.9 45.1 6.1 5.8 4.4 6.2
Somewhat support 26.3 24.4 8.6 8.0 6.9 11.2
So-so 22.3 21.7 24.3 23.4 25.9 22.9
Somewhat against 3.0 3.2 18.2 19.1 17.5 19.0
Very against 1.9 2.8 40.4 40.1 42.7 38.6
No view / Refuse 1.5 2.7 2.4 3.6 2.5 2.1
Total (N) 100.0 (1028) 100.0 (1010) 100.0 (1028) 100.0 (1010) 100.0 (1028) 100.0 (1010)
19
Table 16: Perceived possibility that Hong Kong can attain independence in the foreseeable future
Age 15 and above
%
Age 18 and above
%
Absolutely impossible 57.1 58.2
Not possible 26.4 26.0
So-so 12.5 11.8
Somewhat possible 1.0 1.0
Absolutely possible 1.9 2.0
No view / Refuse 1.1 1.1
Total 100.0 (1028) 100.0 (984)
Question: In the foreseeable future, do you think it is possible or not possible for Hong Kong to attain independence? Absolutely impossible, Not possible, So-so, Somewhat possible, or Absolutely possible?
Table 17: Perceived possibility that Hong Kong can attain independence in the foreseeable future (Comparison)
10th Wave 2017.5
%
9th Wave 2016.7
%
Absolutely impossible 57.1 53.3
Not possible 26.4 27.9
So-so 12.5 13.0
Somewhat possible 1.0 1.8
Absolutely possible 1.9 1.9
No view / Refuse 1.1 2.2
Total (N) 100.0 (1028) 100 (1010)
20
Table 18: Impressions on the three political camps (Age 15 and above)
Localist
%
Pan-democratic
%
Pro-establishment
%
0 Very negative 24.0 12.4 17.9
1 2.6 1.9 2.8
2 5.0 3.3 7.5
3 8.9 7.6 9.9
4 7.1 8.6 8.9
5 So-so 30.8 34.8 26.3
6 7.0 11.9 9.4
7 4.0 9.3 5.2
8 3.2 5.2 5.4
9 0.2 0.4 0.7
10 Very positive 0.6 1.6 1.6
No view / Refuse 6.7 3.3 4.3
Total (N) 100.0 (1028) 100.0 (1028) 100.0 (1028)
Mean* (N) 3.48 (959) 4.51 (994) 3.90 (983)
Question: What are your impressions of the following political camps. Please give a score of 0 to 10, with 0 representing very negative, 10 representing very positive, and 5 representing so-so [random allocation of groups]: What is your impression of the localist camp? (0-10). What is your impression of the pan-democratic camp? (0-10). What is your impression of the pro-establishment camp? (0-10).
* No view/Refuse are not included in calculation of the mean
21
Table 18 (continued): Impressions on the three political camps (Age 18 and above)
Localist
%
Pan-democratic
%
Pro-establishment
%
0 Very negative 24.6 12.8 18.4
1 2.4 1.8 2.8
2 5.1 3.4 7.5
3 9.1 7.5 9.7
4 7.0 8.6 8.8
5 So-so 30.1 34.6 26.1
6 6.8 11.4 9.1
7 3.9 9.2 5.3
8 3.2 5.3 5.6
9 0.2 0.3 0.6
10 Very positive 0.6 1.6 1.6
No view / Refuse 6.9 3.4 4.5
Total (N) 100.0 (984) 100.0 (984) 100.0 (984)
Mean* (N) 3.44 (916) 4.48 (951) 3.89 (940)
Table 19: Impressions on the three political camps (Comparison)
10th Wave 2017.5
Mean* (N)
9th Wave 2016.7
Mean* (N)
Localist 3.48 (959) 3.45 (917)
Pan-democratic 4.51 (994) 4.53 (941)
Pro-establishment 3.90 (983) 4.00 (933)
22
Table 20: Belief that activities demanding political reforms in Hong Kong should be peaceful and non-violent
Age 15 and above
%
Age 18 and above
%
Strongly agree 57.0 57.6
Somewhat agree 21.3 20.7
So-so 15.5 15.5
Somewhat disagree 2.8 2.8
Strongly disagree 2.1 2.1
No opinion / Refuse to answer 1.3 1.4
Total (N) 100.0 (1028) 100.0 (984)
Question: Do you agree or disagree that activities demanding political reforms in Hong Kong must be peaceful and non-violent? Strongly agree, Somewhat agree, So-so, Somewhat disagree, or Strongly disagree?
Table 21: Belief that activities demanding political reforms in Hong Kong should be peaceful and non-violent (Comparison)
10th Wave
2017.5
%
9th Wave
2016.7
%
8th Wave
2015.7
%
5th Wave
2015.3
%
Strongly agree 57.0 49.6 57.6 55.1
Somewhat agree 21.3 21.7 21.8 25.4
So-so 15.5 22.0 14.8 12.1
Somewhat disagree 2.8 3.5 2.6 3.1
Strongly disagree 2.1 2.4 1.8 3.0
No opinion / Refuse
to answer
1.3 0.8 1.4 1.3
Total (N) 100.0 (1028) 100.0 (1010) 100.0 (1006) 100.0 (1009)
23
Table 22: Perceived importance of eight social values (age 15 and above)
Press
freedom
%
Social
harmony
%
Democratic
development
%
Economic
development
%
Judicial
independence
%
National
interest
%
Corruption-free
society
%
Efficient
governance
%
0 Very unimportant 0.5 0.6 1.9 0.2 0.5 3.1 0.3 0.6
1 0.0 0.0 0.2 0.0 0.0 0.3 0.1 0.3
2 0.4 0.3 0.6 0.0 0.2 1.6 0.5 0.4
3 0.2 0.4 1.1 0.5 0.4 2.0 0.5 1.1
4 0.5 0.4 1.2 0.2 0.1 1.5 0.1 0.9
5 4.5 3.7 11.3 3.1 3.2 13.6 2.6 6.4
6 4.6 3.5 7.4 3.6 2.5 10.3 2.8 5.2
7 7.1 10.5 14.1 15.0 7.8 14.9 5.0 15.1
8 22.9 21.8 25.5 27.7 16.5 21.8 17.4 27.6
9 12.0 13.4 9.7 11.7 12.1 5.8 12.4 10.3
10 Very important 46.9 45.2 26.4 37.8 54.8 23.5 57.7 30.6
No view / Refuse 0.2 0.2 0.7 0.3 2.0 1.5 0.7 1.7
Total (N) 100.0 (1028) 100.0 (1028) 100.0 (1028) 100.0 (1028) 100.0 (1028) 100.0 (1028) 100.0 (1028) 100.0 (1028)
Mean* (N) 8.66 (1026) 8.65 (1026) 7.69 (1020) 8.51 (1025) 8.94 (1008) 7.23 (1013) 9.02 (1020) 8.10 (1011)
Question: In the following I will mention 8 social values. We would like to know if you think they are important or not important. Please give a score of 0 to 10, with 0
representing very unimportant and 10 representing very important [random allocation of social values]: Press freedom, do you think it is important or unimportant? (0-10). Social harmony, do you think it is important or unimportant? (0-10). Democratic development, do you think it is important or unimportant? (0-10). Economic development, do you think it is important or unimportant? (0-10). Judicial independence, do you think it is important or unimportant? (0-10). National interest, do you think it is important or unimportant? (0-10). Corruption-free society, do you think it is important or unimportant? (0-10). Efficient governance, do you think it is important or unimportant? (0-10).
* No view/Refuse are not included in calculation of the mean
24
Table 22 (continued): Perceived importance of eight social values (age 18 and above)
Press
freedom
%
Social
harmony
%
Democratic
development
%
Economic
development
%
Judicial
independence
%
National
interest
%
Corruption-free
society
%
Efficient
governance
%
0 Very unimportant 0.6 0.6 2.0 0.2 0.5 3.2 0.3 0.6
1 0.0 0.0 0.2 0.0 0.0 0.3 0.1 0.3
2 0.4 0.3 0.6 0.0 0.2 1.7 0.5 0.4
3 0.2 0.4 1.1 0.5 0.4 1.9 0.5 1.1
4 0.5 0.4 1.3 0.2 0.1 1.5 0.1 0.9
5 4.7 3.8 11.5 3.1 3.0 13.5 2.6 6.5
6 4.6 3.4 7.4 3.1 2.4 10.0 2.7 5.0
7 6.6 10.1 13.8 14.9 7.8 14.5 4.6 14.5
8 22.4 21.6 25.2 27.6 15.8 22.2 17.2 27.5
9 11.7 13.0 9.2 11.4 11.7 5.6 11.7 10.3
10 Very important 48.1 46.3 27.0 38.8 56.2 24.2 59.1 31.3
No view / Refuse 0.2 0.2 0.8 0.4 2.0 1.5 0.8 1.7
Total (N) 100.0 (984) 100.0 (984) 100.0 (984) 100.0 (984) 100.0 (984) 100.0 (984) 100.0 (984) 100.0 (984)
Mean* (N) 8.68 (982) 8.67 (982) 7.69 (977) 8.54 (980) 8.97 (964) 7.25 (969) 9.04 (976) 8.11 (967)
25
Table 23: Perceived importance of six social values (Comparison)
10th Wave
2017.5
Mean* (N)
9th Wave
2016.7
Mean* (N)
Press freedom 8.66 (1026) 8.49 (1002)
Social harmony 8.65 (1026) 8.57 (1009)
Democratic development 7.69 (1020) 7.61 (988)
Economic development 8.51 (1025) 8.26 (1004)
Judicial independence 8.94 (1008) 8.84 (981)
National interest 7.23 (1013) 7.07 (986)
26
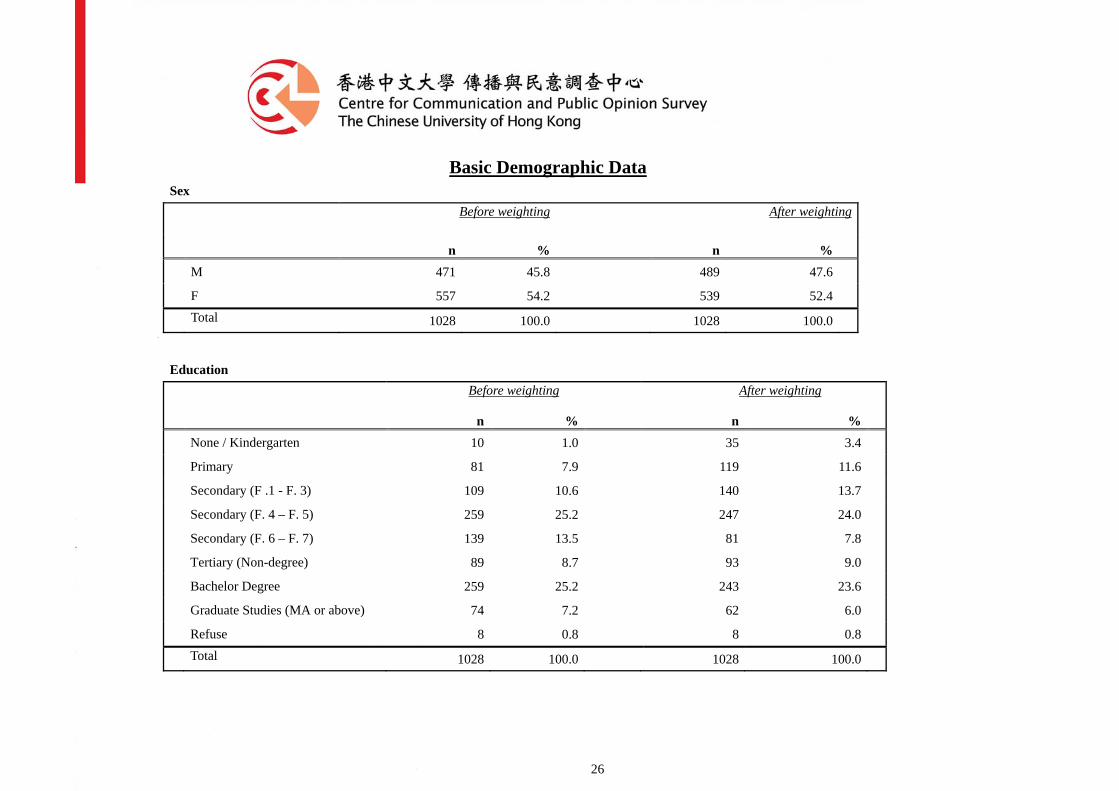
Basic Demographic Data
Sex
Before weighting After weighting
n % n % M 471 45.8 489 47.6
F 557 54.2 539 52.4
Total 1028 100.0 1028 100.0
Education
Before weighting
After weighting
n % n % None / Kindergarten 10 1.0 35 3.4
Primary 81 7.9 119 11.6
Secondary (F .1 - F. 3) 109 10.6 140 13.7
Secondary (F. 4 – F. 5) 259 25.2 247 24.0
Secondary (F. 6 – F. 7) 139 13.5 81 7.8
Tertiary (Non-degree) 89 8.7 93 9.0
Bachelor Degree 259 25.2 243 23.6
Graduate Studies (MA or above) 74 7.2 62 6.0
Refuse 8 0.8 8 0.8
Total 1028 100.0 1028 100.0
27
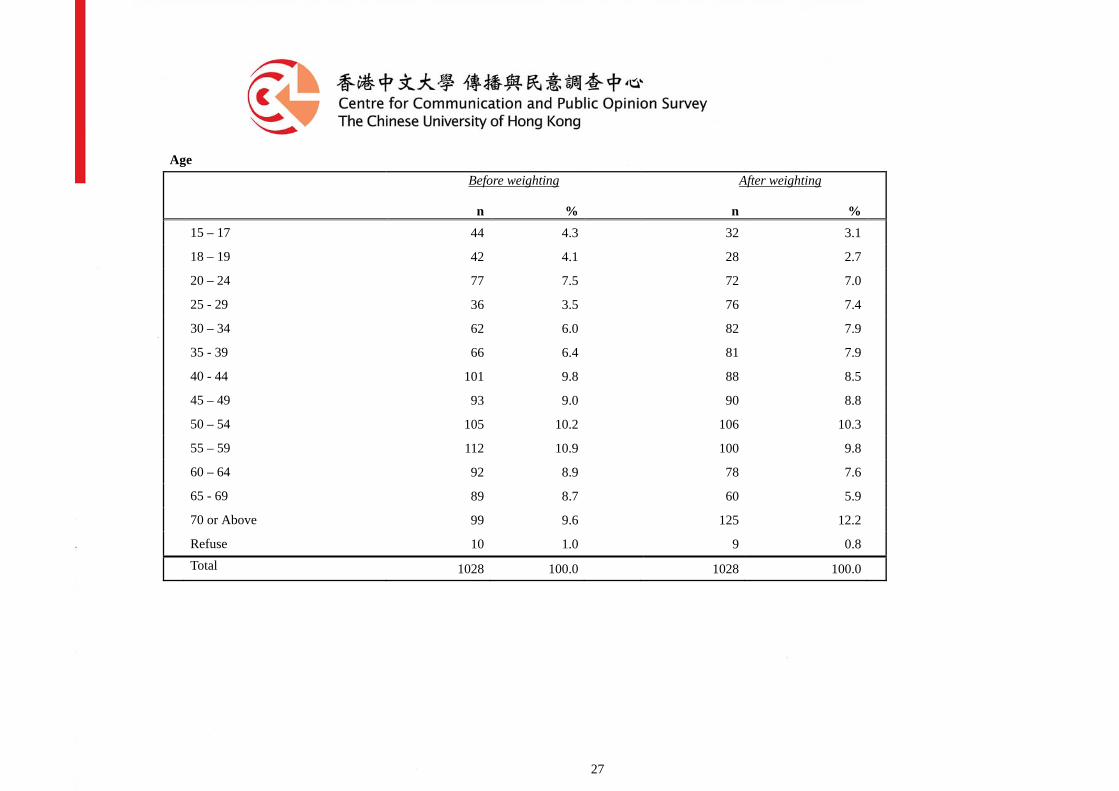
Age
Before weighting
After weighting
n % n % 15 – 17 44 4.3 32 3.1
18 – 19 42 4.1 28 2.7
20 – 24 77 7.5 72 7.0
25 - 29 36 3.5 76 7.4
30 – 34 62 6.0 82 7.9
35 - 39 66 6.4 81 7.9
40 - 44 101 9.8 88 8.5
45 – 49 93 9.0 90 8.8
50 – 54 105 10.2 106 10.3
55 – 59 112 10.9 100 9.8
60 – 64 92 8.9 78 7.6
65 - 69 89 8.7 60 5.9
70 or Above 99 9.6 125 12.2
Refuse 10 1.0 9 0.8
Total 1028 100.0 1028 100.0
28
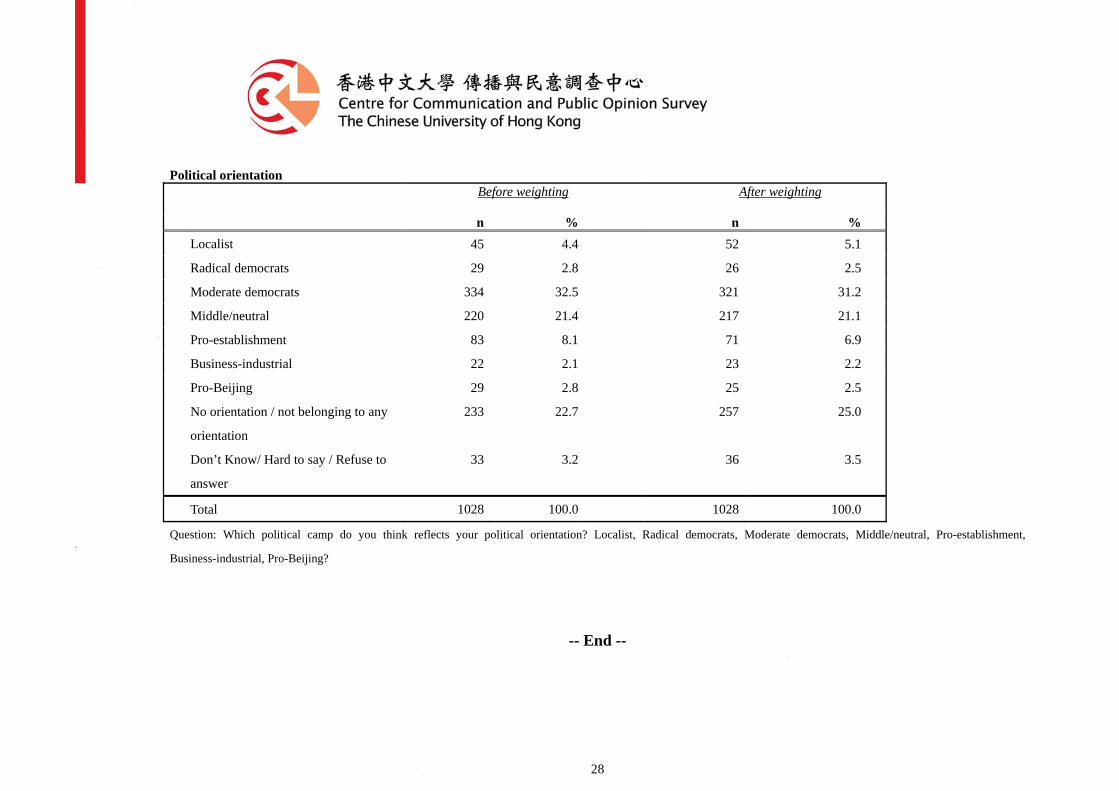
Political orientation
Before weighting
After weighting
n % n % Localist 45 4.4 52 5.1
Radical democrats 29 2.8 26 2.5
Moderate democrats 334 32.5 321 31.2
Middle/neutral 220 21.4 217 21.1
Pro-establishment 83 8.1 71 6.9
Business-industrial 22 2.1 23 2.2
Pro-Beijing 29 2.8 25 2.5
No orientation / not belonging to any
orientation
233 22.7
257 25.0
Don’t Know/ Hard to say / Refuse to
answer
33 3.2
36 3.5
Total 1028 100.0 1028 100.0
Question: Which political camp do you think reflects your political orientation? Localist, Radical democrats, Moderate democrats, Middle/neutral, Pro-establishment,
Business-industrial, Pro-Beijing?
-- End --