Embed Size (px)
Citation preview
Comorbidity of cardiovascular disease, diabetes and
chronic kidney disease in Australia

The Australian Institute of Health and Welfare is Australia’s national health and welfare statistics and information agency. The Institute’s mission is better information and statistics for better health and wellbeing.
Please note that as with all statistical reports there is the potential for minor revisions of data in this report over its life. Please refer to the online version at <www.aihw.gov.au>.
CARDIOVASCULAR DISEASE SERIES 28
Australian Institute of Health and Welfare Canberra
AIHW cat. no. CVD 37
Comorbidity of cardiovascular disease, diabetes and
chronic kidney disease in Australia
Bin Tong Chris Stevenson
August 2007
© Australian Institute of Health and Welfare 2007 This work is copyright. Apart from any use as permitted under the Copyright Act 1968, no part may be reproduced without prior written permission from the Australian Institute of Health and Welfare. Requests and enquiries concerning reproduction and rights should be directed to the Head, Business Promotion and Media Unit, Australian Institute of Health and Welfare, GPO Box 570, Canberra ACT 2601. This publication is part of the Australian Institute of Health and Welfare’s Cardiovascular Disease Series. A complete list of the Institute’s publications is available from the Institute’s website <www.aihw.gov.au>. ISSN1323-9236 ISBN 978 1 74024 705 4
Suggested citation
AIHW: Tong B & Stevenson C 2007. Comorbidity of cardiovascular disease, diabetes and chronic kidney disease in Australia. Cardiovascular Disease Series no. 28. Cat. no. CVD 37.Canberra: AIHW.
Australian Institute of Health and Welfare
Board Chair Hon. Peter Collins, AM, QC Director Penny Allbon Any enquiries about or comments on this publication should be directed to: Cardiovascular Disease and Diabetes Unit Australian Institute of Health and Welfare GPO Box 570 Canberra ACT 2601 Phone: (02) 6244 1000 Email: [email protected] Published by the Australian Institute of Health and Welfare
v
Contents
Acknowledgments.............................................................................................................................vii Abbreviations................................................................................................................................... viii Summary .............................................................................................................................................. ix
About this report .......................................................................................................................... ix Key findings .................................................................................................................................. ix Messages........................................................................................................................................ ix
1 Introduction....................................................................................................................................1 What are cardiovascular disease, diabetes and chronic kidney disease?...............................1 What is comorbidity and how does it happen? .........................................................................2 Consequences of comorbidity ......................................................................................................4 Implications for disease prevention, management and health policy....................................5 Purpose, scope and structure of this report................................................................................5
2 Prevalence.......................................................................................................................................6 Comorbidity of CVD and diabetes in the non-institutionalised population ........................7 Comorbidity of CVD and diabetes in the institutionalised population ...............................13
3 Hospitalisations...........................................................................................................................19 Hospitalisations with comorbidity of CVD, diabetes and CKD (excluding regular dialysis)..........................................................................................................................................20 Hospitalisations for regular dialysis..........................................................................................29
4 Deaths............................................................................................................................................30 Deaths with comorbidity of CVD, diabetes and CKD ............................................................31
5 Discussion ....................................................................................................................................40 Extent of comorbidity ..................................................................................................................40 Comorbidity in different age groups, and its impact on health services and health policy..................................................................................................................................41 Differences between sexes...........................................................................................................42 Comorbidity in the context of each individual disease ..........................................................42 Comparison of comorbidity estimates from various data sources .......................................43 Data issues.....................................................................................................................................44 Conclusion.....................................................................................................................................45
Appendix 1: Statistical methods ......................................................................................................46 Age standardisation.....................................................................................................................46 Prevalence .....................................................................................................................................46 Odds ratio and logistic regression .............................................................................................46 Expected rate, observed rate and ratio......................................................................................47

vi
Appendix 2: Classification of CVD, diabetes and CKD .............................................................49 Cause of death and diagnosis of hospitalisation .....................................................................49 Long-term conditions in the 2004–05 NHS and the 2003 SDAC ...........................................49
Appendix 3: Codes used in this report ...........................................................................................50 Appendix 4: Detailed statistical tables...........................................................................................54 References............................................................................................................................................64 List of tables ........................................................................................................................................67 List of figures ......................................................................................................................................69
vii
Acknowledgments
This report was prepared and written by Bin Tong and Chris Stevenson. Susana Senes, Anne-Marie Waters and Sharon Leigh made a significant contribution to the report. Other members of the National Centre for Monitoring Cardiovascular Disease and the National Centre for Monitoring Diabetes also provided valuable advice and comments. These include: Lynelle Moon, Elizabeth Penm, Therese Bourke, Tiffany Lamb, Louise Catanzariti and Sandra Ofei. The authors particularly wish to thank the National Heart, Stroke and Vascular Health Data Working Group and the National Diabetes Data Working Group for advice and assistance, which were critical to the completion of this report. Advice and comments from the following people are greatly appreciated: Alan Cass The George Institute for International Health Andrew Boyden National Heart Foundation of Australia Annette Dobson University of Queensland Jeff Flack Diabetes Centre, Bankstown–Lidcombe Hospital Mark Harris University of New South Wales Mike Langan Australian Bureau of Statistics Timothy Mathew Kidney Health Australia Ian Ring University of Wollongong Mandy Thrift Baker Heart Research Institute Valuable comments were also received from staff of the Australian Government Department of Health and Ageing. Our appreciation extends to other colleagues at AIHW for their valuable input and helpful comments. These include: George Bodilsen, Ilona Brockway, Paul Magnus, Robert Van der Hoek and Xingyan Wen. Funding from the Australian Government Department of Health and Ageing contributed to the production of this report.
viii
Abbreviations
ABS Australian Bureau of Statistics ANZDATA Australian and New Zealand Dialysis and Transplant Registry CHD Coronary heart disease CKD Chronic kidney disease CVD Cardiovascular disease GP General Practitioner ICD International Classification of Diseases ICD-10 International Classification of Diseases, 10th Revision ICD-10 AM International Classification of Diseases, 10th Revision Australian
Modification NCDS National Chronic Disease Strategy NHS National Health Survey SDAC Survey of Disability, Ageing and Carers TIA Transient cerebral ischaemic attack
ix
Summary
About this report This is the first report of a projected series regarding the comorbidity of cardiovascular disease (CVD), diabetes and chronic kidney disease (CKD) in Australia. Comorbidity refers to any two or more of these diseases that occur in one person at the same time. The questions to be answered in this report include: 1. How many Australians have comorbidity of CVD, diabetes and CKD? 2. What is the proportion of hospitalisations with these comorbidities? 3. How much do these comorbidities contribute to deaths? 4. What is the magnitude of comorbidity in the context of each individual disease? 5. Are there differences in the distribution of these comorbidities among age groups and
sexes?
Key findings 1. In 2004–05, 417,563 (2.9%) adults not living in institutions had comorbidity of CVD and
diabetes. In 2003, 14,722 (8.1%) people in institutions, such as nursing homes and aged care hostels, had this comorbidity.
2. Comorbidities of CVD, diabetes and CKD were found in 365,245 (6.6%) non-dialysis hospital separations for adults in 2004–05.
3. Comorbidities of CVD, diabetes and CKD were recorded as causes of death for 17,239 (13.2%) people who died in 2004.
4. The observed rates of these comorbidities exceeded the rates expected if conditions only occurred together by chance.
5. CVD was very common among people with diabetes and CKD. In turn, both diabetes and CKD contribute to many cases of CVD.
6. Older people were more likely to have these comorbidities than younger people. Males were more likely to have these comorbidities than females.
Messages 1. Comorbidity of CVD, diabetes and CKD is mainly caused by complex interrelationships
between these conditions and shared risk factors. There is potential to reduce the associated burden by controlling common risk factors and improving disease management.
2. These comorbidities mainly affect older people. With a rapidly ageing population, comorbidity will rise. Australian health systems need to be prepared to meet an increasing demand on health services from people with comorbidities.

1
1 Introduction
Cardiovascular disease (CVD), diabetes and chronic kidney disease (CKD) are serious illnesses that contribute significantly to deaths and levels of ill health in the Australian population. CVD, diabetes and CKD share many risk factors, such as obesity and old age. There are also complex causal relationships between these diseases, and each of them may be caused by, or be a complication of, one or both of the other diseases. As a result, they are more likely to occur together—this is known as comorbidity. The presence of comorbidity is often regarded as an indicator of severity and poorer prognosis of these diseases. The clinical management for people with comorbidity is much more complex and time consuming than for those with single diseases. Because of the ageing Australian population and the high prevalence of CVD, diabetes and CKD, comorbidity of these diseases is expected to rise. Although comorbidity of these diseases is receiving increased attention, most studies focus on one disease at a time and there are relatively few studies that include investigations of the relationship of multiple chronic diseases (Walker 2005). The extent of comorbidity in Australia and its impact on people’s health and on the health system are not clear. The National Centre for Monitoring Cardiovascular Disease and the National Centre for Monitoring Diabetes have therefore collaborated to investigate the association of these diseases and their impact on the Australian population.
What are cardiovascular disease, diabetes and chronic kidney disease?
Cardiovascular disease CVD is any disease of the heart (cardio) or blood vessels (vascular). Some forms of CVD are very common in Australia, including hypertension (high blood pressure), coronary heart disease (CHD), heart failure and cerebrovascular disease. CVD is one of the leading causes of disability and death in Australia. Combining both the burden from premature deaths and extent of associated disability, cardiovascular disease was estimated to account for 17% of the overall disease burden in Australia in 2003 (AIHW 2006a). CVD is the most expensive disease group in terms of direct health care expenditure, at over $5.5 billion, which represents 11% of Australia’s total allocated health system expenditure in 2000–01 (AIHW 2004a).
Diabetes Diabetes mellitus (in this report referred to as diabetes) is a chronic condition in which blood glucose levels become too high as a result of the body producing insufficient insulin, or being unable to use insulin properly. Diabetes can lead to a range of complications, including coronary heart disease and stroke, as well as kidney disease and retinopathy (loss of vision). Self-reported data in the 2004–05 National Health Survey (NHS) showed that about 699,600 Australians (3.5% of the population) had been diagnosed with diabetes
2
(AIHW 2006a). Diabetes accounted for 5.8% of the overall disease burden in Australia in 2003 (AIHW 2006a). In 2004, 11,735 deaths in Australia were associated with diabetes (AIHW 2006a).
Chronic kidney disease CKD is the occurrence of kidney damage and/or reduced kidney function, lasting for at least three months. It is classified into five stages from stage 1 (least severe) to stage 5 (most severe) where patients may need to undergo kidney replacement therapy (dialysis or transplant), as kidney function is not sufficient to sustain life (AIHW 2005). How many Australians are affected by CKD is unknown. Some investigators have suggested that about 7.5% to 11.2% of Australian adults have signs of kidney damage or reduced kidney function (Chadban et al. 2003, The Australasian Creatinine Consensus Working Group 2005). CKD imposes a substantial burden of disease in Australia. In 2004, CKD was recorded as the underlying cause of death in 2,361 cases (2% of all deaths). CKD was an associated cause of death in 9,609 cases—43% of these were recorded with cardiovascular disease as the underlying cause of death and 9% with diabetes (AIHW 2006a). For an explanation of underlying and associated causes of death see page 30.
What is comorbidity and how does it happen?
What is comorbidity? Comorbidity refers to any two or more diseases that occur in one person at the same time. In this report comorbidity refers to the presence of CVD, diabetes or CKD in combination with one or both of the other diseases.
Causes of comorbidity Co-occurrence of diseases can happen by chance. Some diseases can coexist in one person by coincidence, and there is no pathological association between them. However, more often than not, diseases occur together because there are some associations between them. These associations can be summarised into two main groups: direct and indirect causal relationships between the diseases and shared risk factors. The direct and indirect causal relationships between CVD, diabetes and CKD have been demonstrated by substantial evidence from pathological and epidemiological studies. Diabetes is a well known risk factor for CVD. The reasons why diabetes increases the risk of CVD are only partially understood. One established explanation is that diabetes increases atherosclerosis (thickening of the wall of a blood vessel with deposits of plaque), which is the underlying cause of most CVD in Australia. It is also established that people with diabetes tend to have higher levels of blood pressure and abnormal cholesterol level, both of which are factors that increase the risk of atherosclerosis and CVDs (AIHW 2002a). Diabetes can also lead to kidney damage—a complication known as diabetic nephropathy. Diabetic nephropathy results from high blood glucose levels damaging the blood-filtering capillaries in the kidneys. Moreover, diabetes also increases the risk of kidney damage and

3
accelerates the reduction of kidney function by increasing the risk of hypertension (AIHW 2005). CKD has been found to independently increase the risk of hypertension and other cardiovascular diseases, including heart attack, angina, coronary artery disease, stroke and heart failure. The risks of a cardiovascular event, such as heart attack or stroke, are greater in those with poorer kidney function (Go et al. 2004). The reasons for excess risk of CVD among people with CKD are not clearly understood. However, some established risk factors of CVD, such as obesity, abnormal lipid levels and diabetes, are also common among people with CKD. In addition, CKD complications, such as anemia and disturbed mineral metabolism, also contribute to increased risk of CVD (Levin et al. 2002). CVD, especially hypertension, is one of the major causes of CKD. Untreated high blood pressure can damage the blood vessels in the kidneys. The walls of these blood vessels become thick and the internal diameter narrowed, leading to reduced blood supply and decreased kidney function. Among people with CKD, the presence of CVD is associated with a faster decline of kidney function and the need for dialysis (Levin et al. 2001). Furthermore, shared risk factors of these diseases also promote co-occurrence of these diseases and strengthen the association between them. These risk factors do not just affect the onset of CVD, diabetes and CKD, but also affect their progression and increase the risk of complications. These risk factors include ageing, gender, overweight or obesity, lifestyle and socioeconomic conditions (Table 1.1). Other factors, such as genetic background and environmental factors, also play some role in the co-occurrence of these diseases. Because of these complex interactions, the risk of developing these diseases and their comorbidities is even greater among those with multiple risk factors. This is especially true for people with metabolic syndrome. Metabolic syndrome is a cluster of risk factors comprising excess abdominal weight, insulin resistance, hypertension (high blood pressure) and/or lipid abnormalities. The risk of having CVD, diabetes and CKD among people with metabolic syndrome is three times as high as for those without (Dekker et al. 2005; Stern et al. 2004). People with Type 2 diabetes who also have this syndrome are more likely to develop CVD complications and have kidney problems (Isomaa et al. 2001).
Table 1.1: Known risk factors for cardiovascular disease, diabetes and chronic kidney disease
Diseases Non-modifiable risk factors Modifiable risk factors
Diabetes Age, genetic factors, pregnancy, low birth weight
Overweight and obesity, poor nutrition, impaired glucose tolerance, physical inactivity.
Cardiovascular disease Age, genetic factors, male sex, family history
Overweight and obesity, poor nutrition, impaired glucose tolerance, physical inactivity, smoking, high blood pressure, diabetes, chronic kidney disease, atrial fibrillation, heavy alcohol consumption.
Chronic kidney disease Age, genetic factors, family history, ethnicity
Overweight and obesity, poor nutrition, impaired glucose tolerance, physical inactivity, smoking, high blood pressure, diabetes, urinary tract infections, kidney and urinary stones, glomerulonephritis, streptococcal infections, drug toxicity.
Sources: AIHW 2002a, 2004b, 2005.
Ageing is another factor that has a particularly strong association with many forms of comorbidity, including comorbidity of CVD, diabetes and CKD. Although such an association is widely accepted as ‘common wisdom’, the causes of the association have not been well studied. However, there are several possible explanations. Firstly, there is
4
concordance between the natural course of these diseases and people’s age. All of these diseases are more likely to first arise among middle aged to old people. Complications of these diseases may develop over a considerable period (about 10–20 years) after the onset of the original disease. By the time comorbidity presents, most of these people are at an old or very old age. The period between onset of the disease and its comorbidity is extremely important for the prevention and management of comorbidity, as early detection and better management of the original disease can effectively reduce the risk of comorbidity and/or delay its occurrence. Secondly, increased life expectancy in recent years in Australia is largely attributed to a reduction in death rates among older Australians, especially from diseases such as coronary heart disease and stroke (AIHW 2002b). Longer survival with chronic conditions allows the complications of these conditions to develop. Thirdly, the functions of organs gradually decline with age after middle age. Thus, older people are usually more vulnerable to the onset of diseases and their complications than younger people.
Consequences of comorbidity The presence of these comorbidities in patients with CVD, diabetes and CKD often indicates more severe disease and poorer prognosis. These comorbidities have strong negative effects on health status and health services. Although the exact extent of the negative effects has not been well studied, it is widely recognised that such effects may go beyond the bare sum of the effects of each single disease. An excess risk of being hospitalised or dying has been documented in people with some combinations of these diseases, compared with people with only one of these diseases. It was found that CVD mortality among people without a previous heart attack was 7.5 times higher among those with Type 2 diabetes than in those without diabetes (Haffner et al. 1998). People with comorbidity of CVD and CKD were 35% more likely to have recurrent cardiovascular events or die than people with CVD alone (Weiner et al. 2004). People with comorbidity also have an increased risk of impaired functional status or quality of life (Gijsen et al. 2001). Apart from the individual human suffering, comorbidity also increases the burden on health care services. Comorbidity is associated with greater health care utilisation, including more hospital admissions, longer stays in hospital (Gijsen et al. 2001), and greater frequency of visits to GPs and specialists (Starfield et al. 2003, Struijs et al. 2006). Furthermore, clinical treatment for people with comorbidity is much more complex and time consuming than for those with a single condition. Health care for people with comorbidity needs to focus on a number of conditions at the same time. Multiple medications and therapies are required in almost all cases. The risk of dangerous interactions of multiple drugs is increased. People with comorbidity are also more likely to have complications after receiving common procedures, including some lifesaving procedures. Because of this, doctors may be reluctant to arrange such procedures for them (Levin et al. 2002). Higher health care usage and complex treatments have led to higher health care costs. A study conducted in Canada estimated that about 26.4% of health expenditure for diabetes was attributed to CVD-related services and 7.5% was attributed to kidney-related services. It also found that as the number of major complications increased, expenditure grew significantly (Simpson et al. 2003).
5
Implications for disease prevention, management and health policy Although comorbidity increases the health burden for individuals and society, there is substantial evidence that a large improvement in health can be achieved by prevention, early recognition and adequate treatment of comorbid diseases (Gijsen et al. 2001, Nilsson & Berglund 2000). Better understanding and regular monitoring of comorbidity of these diseases are critical to recognising the health burden of these diseases, developing strategies and formulating health care policy, and evaluating progress in disease prevention and management.
Purpose, scope and structure of this report This report is designed to examine the current extent of comorbidity of these diseases among Australian adults from three perspectives: prevalence, hospitalisation and mortality. It focuses on analysing the distribution of comorbidity by age and sex. The actual occurrence of comorbidity is compared with the statistically expected occurrence to determine if these diseases coexist by chance. The distribution of comorbidity is also presented separately in the context of each individual disease. Further and more detailed investigations of other characteristics of these comorbidities, such as the differences between the Indigenous and non-Indigenous populations, are planned for future reports in this series. Although CVD, diabetes and CKD can occur among people at any age, they are mainly prevalent among the adult population, especially older people. Comorbidities from these diseases are rarely seen before the age of 18 years. Therefore, the analyses presented in this report focus on Australians aged 18 years or over. Besides this introduction, the main body of the report consists of the following chapters:
• Chapter 2 focuses on the prevalence of comorbidity of CVD and diabetes in the Australian population. It includes analysis of data from the ABS 2004–2005 National Health Survey (NHS) and 2003 Survey of Disability, Ageing and Carers (SDAC).
• Chapter 3 investigates the proportion of hospitalisations with comorbidity of CVD, diabetes and CKD in 2004–05.
• Chapter 4 presents analysis of deaths associated with comorbidity of CVD, diabetes and CKD based on data from the AIHW National Mortality Database for 2004.
• The main findings and implications are discussed in Chapter 5. The appendixes contain details of the methods, disease classifications, and data sources used in this report.
6
2 Prevalence
To examine the extent of the problem of comorbidity in the population, the most critical questions to be answered are:
• how many people have two conditions?
• what is their distribution among age groups and sexes? This chapter focuses on these questions. The results shown in this chapter were drawn from the 2004–05 NHS and the 2003 SDAC. Both surveys were conducted by the Australian Bureau of Statistics (ABS). The NHS was designed to obtain national information on the health status of Australians, their use of health services and facilities, and health-related aspects of their lifestyle. The most recent NHS was conducted in 2004–05, and it included 25,906 people of all ages across urban and rural areas of Australia. Questions regarding long-term health conditions, including cardiovascular conditions and diabetes, were asked of the respondents at interview. Because it focussed on the non-institutionalised population, non-private dwellings (such as hospitals, nursing homes, hotels and boarding houses) were excluded (ABS 2006b). In the SDAC, national information was collected on the disability levels of Australians, their current and future care needs and the role of carers. The most recent SDAC was conducted in 2003, with 41,233 Australians participating. The survey included people in both private and non-private dwellings, such as hotels, motels, boarding houses, retirement villages, hospitals and nursing homes (ABS 2005). All survey participants were asked questions regarding their long-term health conditions. However, because the survey was designed to obtain information related to disability, participants were more likely to report long-term conditions related to their disability, rather than all long-term conditions. Nevertheless, it is a unique source of health information regarding long-term conditions among the institutionalised population. Because both were self-reported surveys, the results were influenced by the questionnaires used, and knowledge and awareness of specific conditions in the population. There is evidence that self-reported surveys are likely to underestimate the prevalence of diabetes, as some people were not aware that they had diabetes (Dunstan et al. 2001), and therefore would not report the condition. The prevalence of CKD is not available from either survey. Thus the analysis here is limited to comorbidity of CVD and diabetes. Due to constraints of the data sources, the analysis was restricted to people aged 20 years and older. The sub-categories of CVD were not consistent between the non-institutionalised and institutionalised populations for the same reason (Table A2 and A3).
7
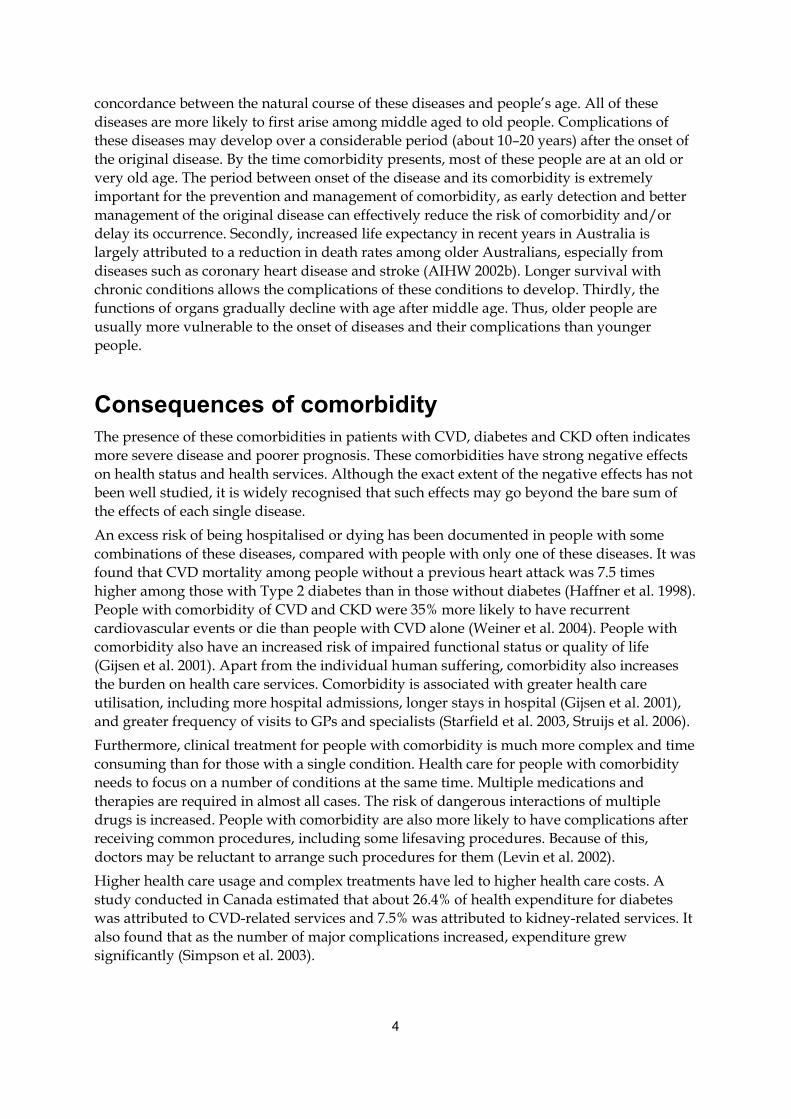
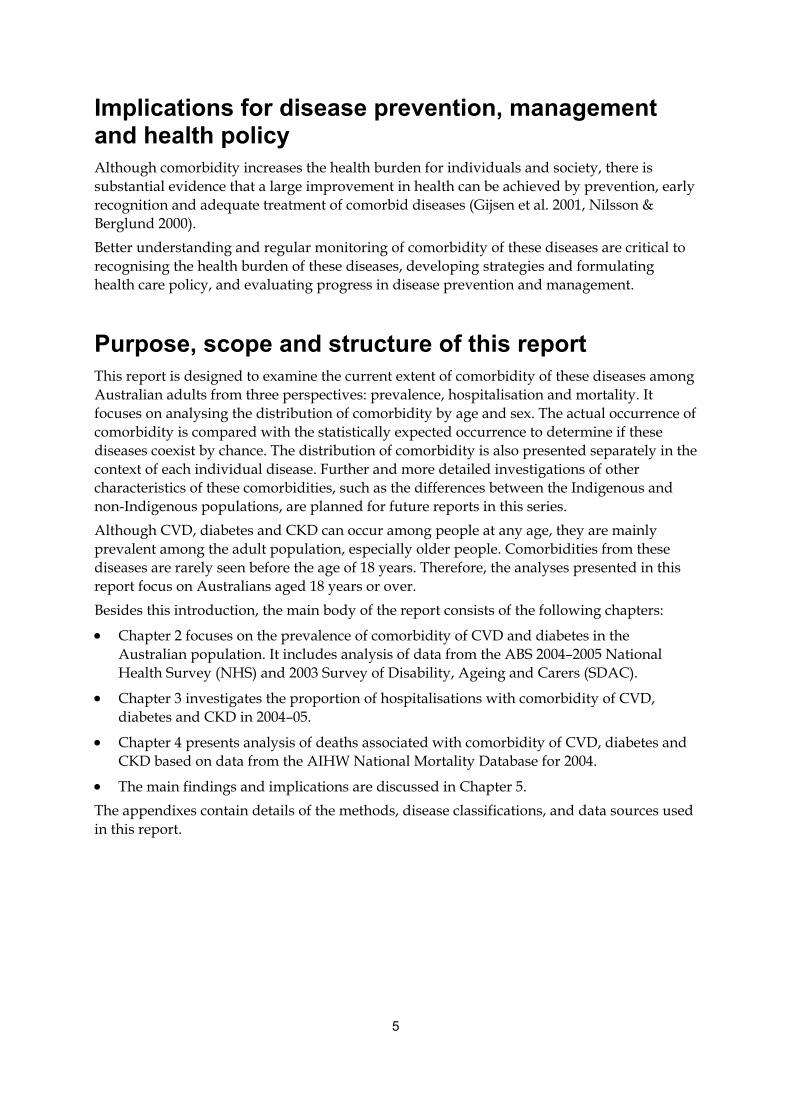
Comorbidity of CVD and diabetes in thenon-institutionalised populationBased on the 2004–05 NHS, it was estimated that 3,452,510 (23.9%) of the non-institutionalised population aged 20 years and over had CVD, 689,051 (4.8%) had diabetes, and 417,563 (2.9%) had both CVD and diabetes (Figure 2.1). In total, 25.8% of this population had at least one of these conditions.
Note: People aged 20 years and over only are included. Source: AIHW analysis of 2004–05 ABS National Health Survey Confidentialised Unit Record File.
Figure 2.1: Prevalence of CVD and diabetes and their comorbidity in the non-institutionalised adult population, 2004–05
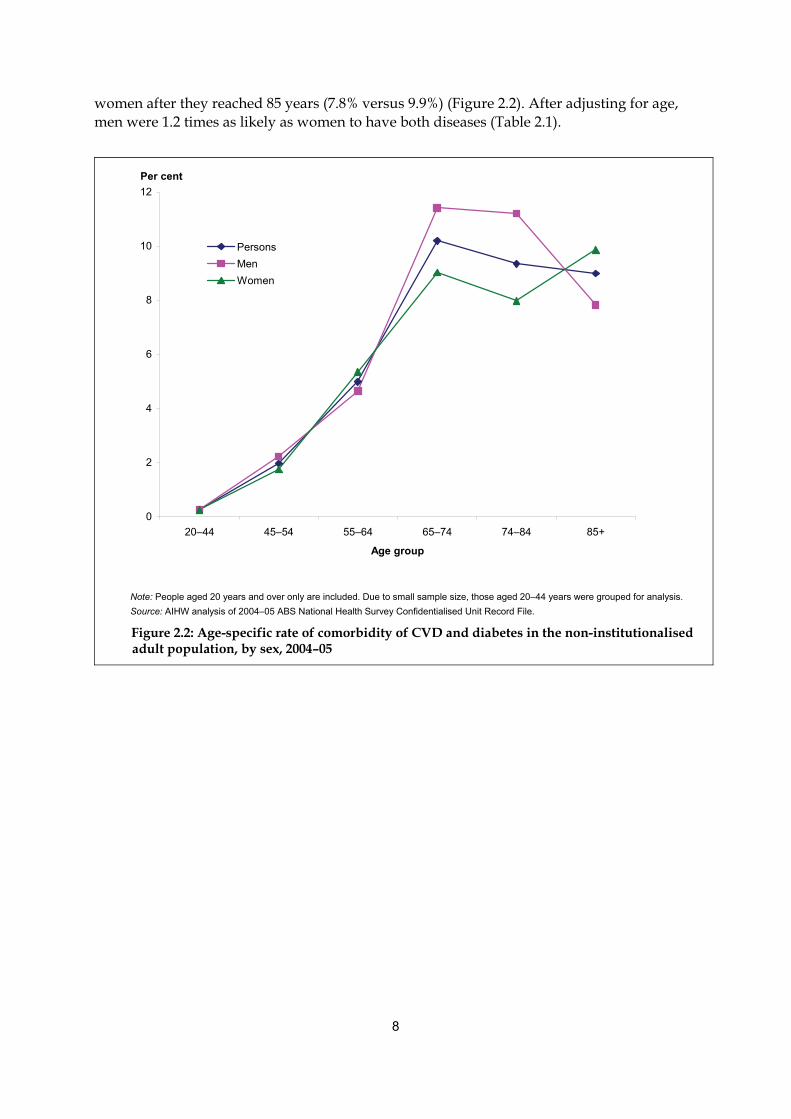
AgeThere was a strong association between age and the presence of comorbidity of CVD and diabetes. The age-specific prevalence rate increased sharply with age from less than 1% in the 20–44 years age group to 10.2% in the 65–74 years age group, and then decreased slightly to about 9.0% in those aged 85 years and over (Figure 2.2—detailed data can be found in Table A4). After adjusting for sex, older people (aged 65 years and over) were 7.2 times as likely as younger people (under 65 years) to have both diseases (Table 2.1).
SexIt was estimated that 213,150 (3.0%) men and 204,414 (2.8%) women had both CVD and diabetes in 2004–05. While the prevalence rate was nearly the same for men and women before the age of 65 years, it was much higher among men than women aged 65–84 years (11.4% versus 8.0%, respectively). However, the rates were reversed between men and
Diabetes: 689,0
51
CVD: 3,4
52,510
Comorbidity of CVD and diabetes417,563
8
women after they reached 85 years (7.8% versus 9.9%) (Figure 2.2). After adjusting for age, men were 1.2 times as likely as women to have both diseases (Table 2.1).
0
2
4
6
8
10
12
20–44 45–54 55–64 65–74 74–84 85+
Age group
Per cent
PersonsMenWomen
Note: People aged 20 years and over only are included. Due to small sample size, those aged 20–44 years were grouped for analysis. Source: AIHW analysis of 2004–05 ABS National Health Survey Confidentialised Unit Record File.
Figure 2.2: Age-specific rate of comorbidity of CVD and diabetes in the non-institutionalised adult population, by sex, 2004–05
9
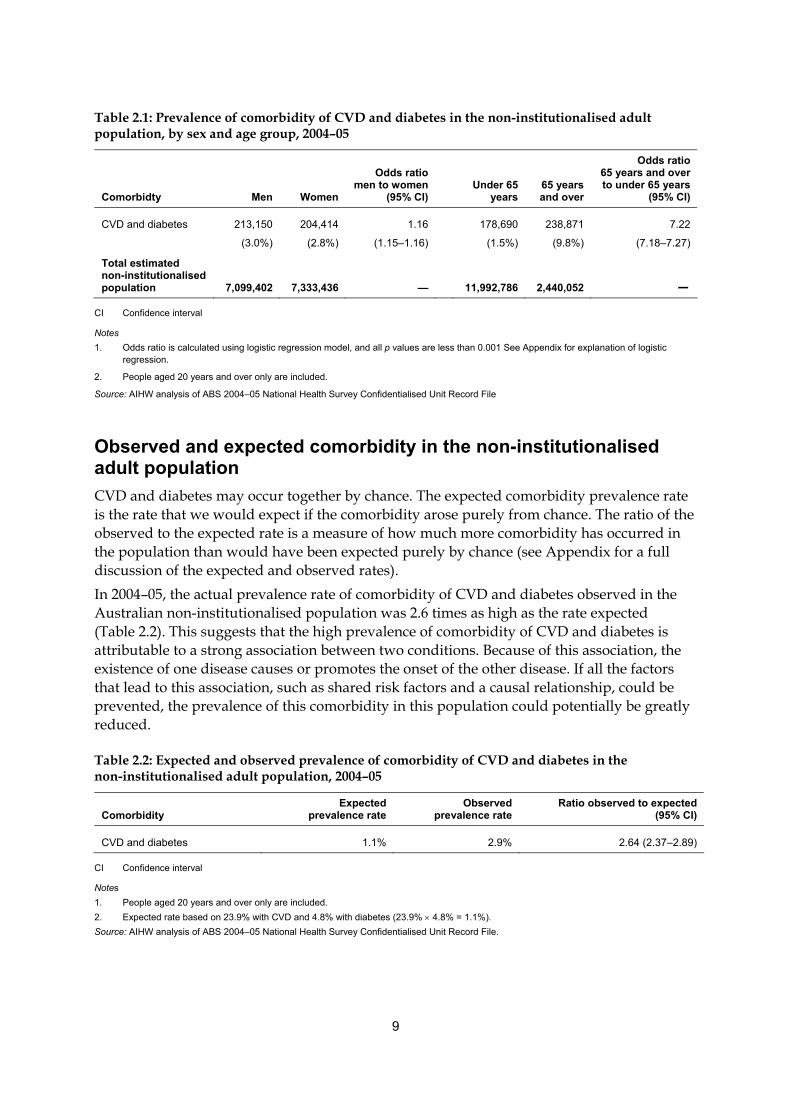
Table 2.1: Prevalence of comorbidity of CVD and diabetes in the non-institutionalised adult population, by sex and age group, 2004–05
Comorbidty Men Women
Odds ratio men to women
(95% CI) Under 65
years 65 years and over
Odds ratio65 years and over to under 65 years
(95% CI)
CVD and diabetes 213,150
(3.0%)
204,414
(2.8%)
1.16
(1.15–1.16)
178,690
(1.5%)
238,871
(9.8%)
7.22
(7.18–7.27)
Total estimated non-institutionalised population 7,099,402 7,333,436 — 11,992,786 2,440,052 —
CI Confidence interval
Notes 1. Odds ratio is calculated using logistic regression model, and all p values are less than 0.001 See Appendix for explanation of logistic
regression.
2. People aged 20 years and over only are included.
Source: AIHW analysis of ABS 2004–05 National Health Survey Confidentialised Unit Record File
Observed and expected comorbidity in the non-institutionalised adult population CVD and diabetes may occur together by chance. The expected comorbidity prevalence rate is the rate that we would expect if the comorbidity arose purely from chance. The ratio of the observed to the expected rate is a measure of how much more comorbidity has occurred in the population than would have been expected purely by chance (see Appendix for a full discussion of the expected and observed rates). In 2004–05, the actual prevalence rate of comorbidity of CVD and diabetes observed in the Australian non-institutionalised population was 2.6 times as high as the rate expected (Table 2.2). This suggests that the high prevalence of comorbidity of CVD and diabetes is attributable to a strong association between two conditions. Because of this association, the existence of one disease causes or promotes the onset of the other disease. If all the factors that lead to this association, such as shared risk factors and a causal relationship, could be prevented, the prevalence of this comorbidity in this population could potentially be greatly reduced.
Table 2.2: Expected and observed prevalence of comorbidity of CVD and diabetes in the non-institutionalised adult population, 2004–05
Comorbidity Expected
prevalence rate Observed
prevalence rate Ratio observed to expected
(95% CI)
CVD and diabetes 1.1% 2.9% 2.64 (2.37–2.89)
CI Confidence interval
Notes 1. People aged 20 years and over only are included. 2. Expected rate based on 23.9% with CVD and 4.8% with diabetes (23.9% × 4.8% = 1.1%). Source: AIHW analysis of ABS 2004–05 National Health Survey Confidentialised Unit Record File.
10
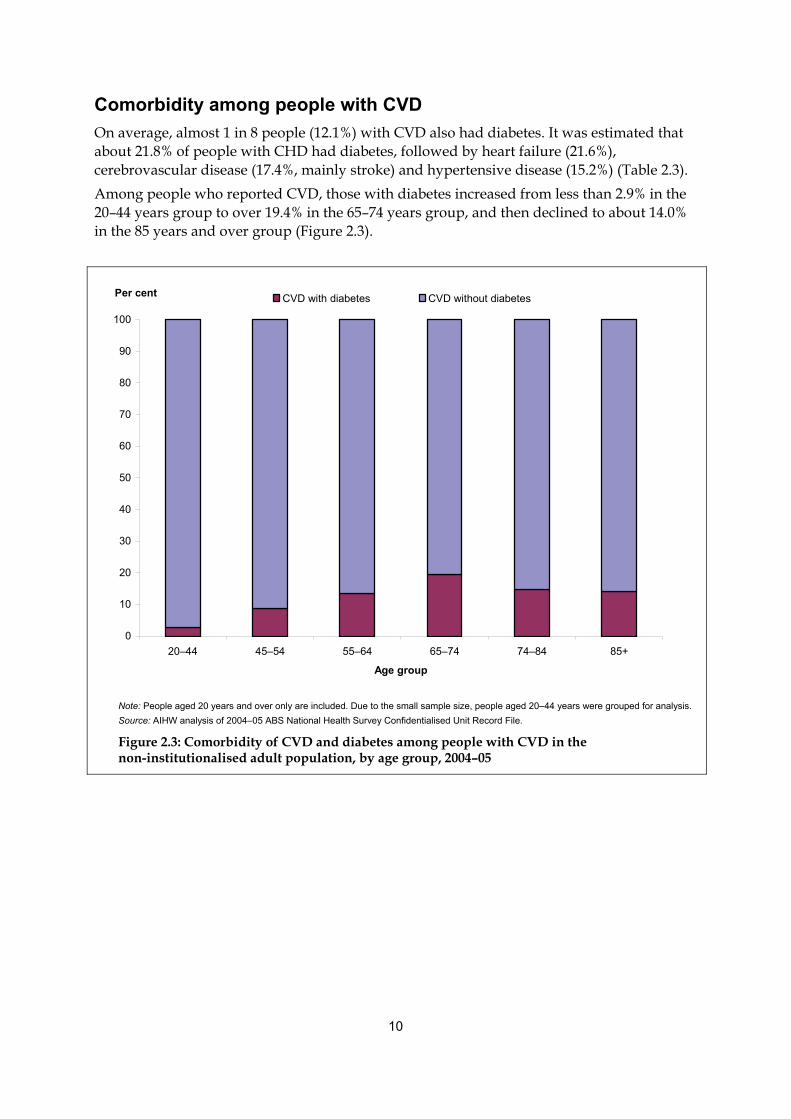
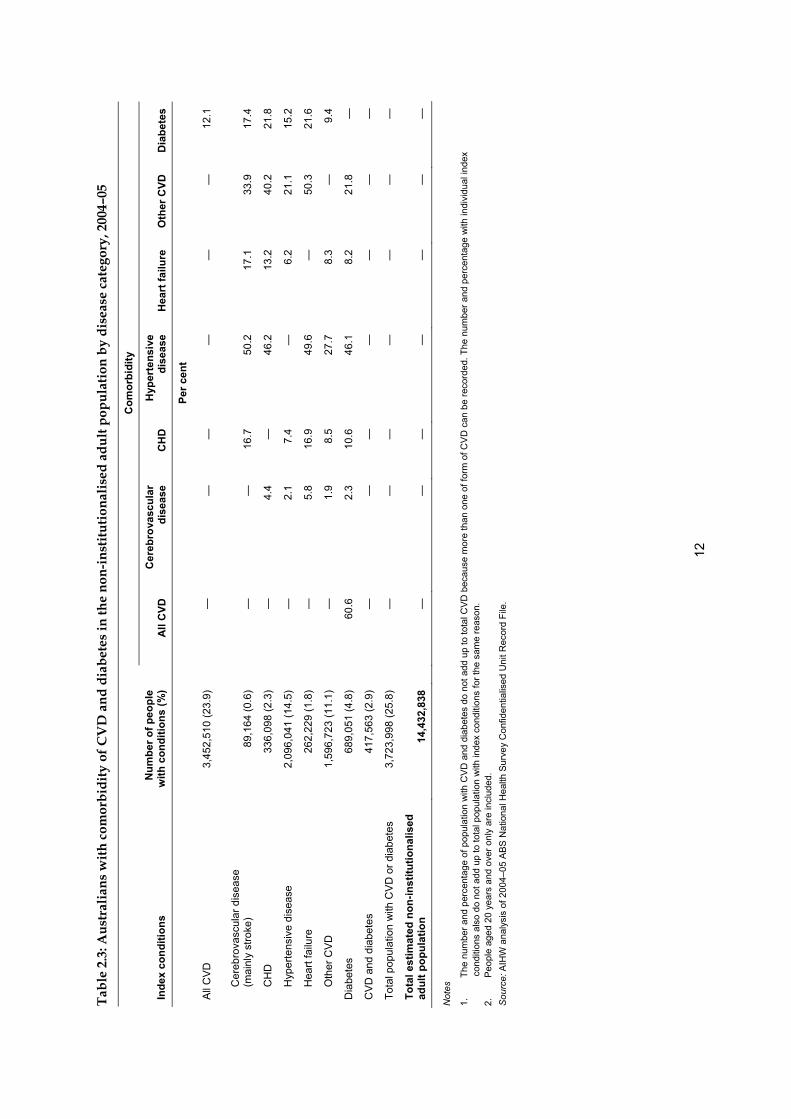
Comorbidity among people with CVD On average, almost 1 in 8 people (12.1%) with CVD also had diabetes. It was estimated that about 21.8% of people with CHD had diabetes, followed by heart failure (21.6%), cerebrovascular disease (17.4%, mainly stroke) and hypertensive disease (15.2%) (Table 2.3). Among people who reported CVD, those with diabetes increased from less than 2.9% in the 20–44 years group to over 19.4% in the 65–74 years group, and then declined to about 14.0% in the 85 years and over group (Figure 2.3).
0
10
20
30
40
50
60
70
80
90
100
20–44 45–54 55–64 65–74 74–84 85+
Age group
Per cent CVD with diabetes CVD without diabetes
Note: People aged 20 years and over only are included. Due to the small sample size, people aged 20–44 years were grouped for analysis. Source: AIHW analysis of 2004–05 ABS National Health Survey Confidentialised Unit Record File.
Figure 2.3: Comorbidity of CVD and diabetes among people with CVD in the non-institutionalised adult population, by age group, 2004–05
11
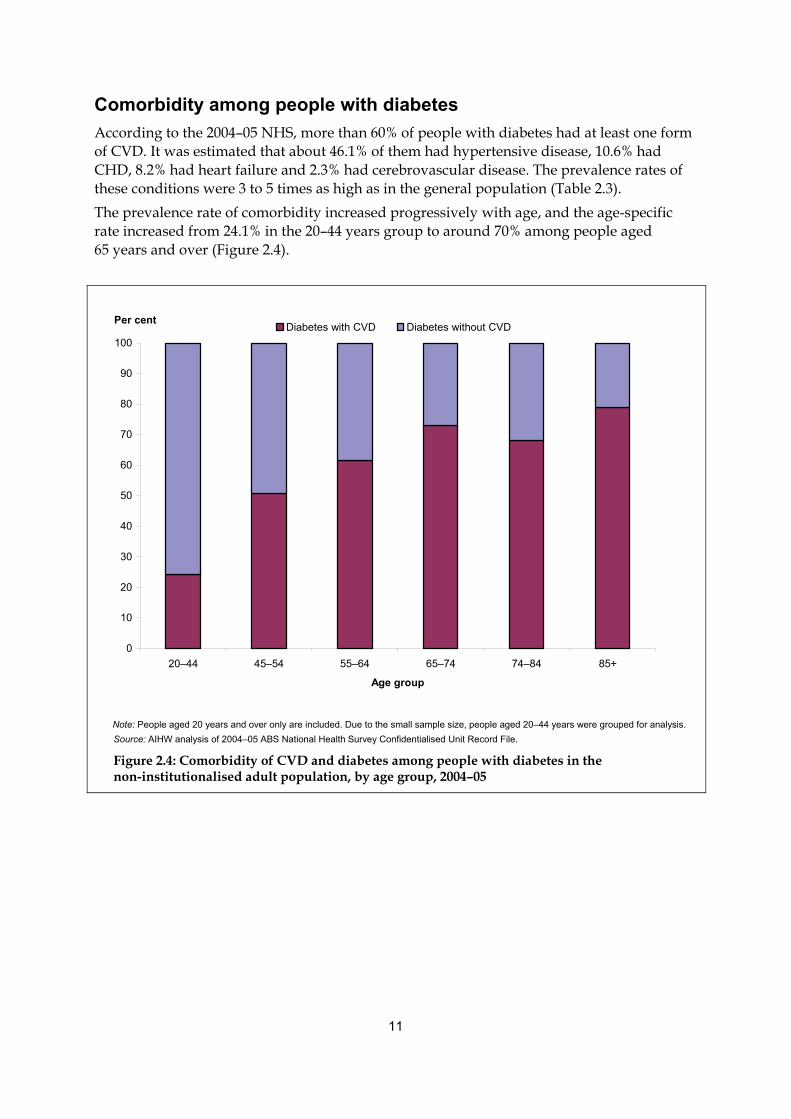
Comorbidity among people with diabetes According to the 2004–05 NHS, more than 60% of people with diabetes had at least one form of CVD. It was estimated that about 46.1% of them had hypertensive disease, 10.6% had CHD, 8.2% had heart failure and 2.3% had cerebrovascular disease. The prevalence rates of these conditions were 3 to 5 times as high as in the general population (Table 2.3). The prevalence rate of comorbidity increased progressively with age, and the age-specific rate increased from 24.1% in the 20–44 years group to around 70% among people aged 65 years and over (Figure 2.4).
0
10
20
30
40
50
60
70
80
90
100
20–44 45–54 55–64 65–74 74–84 85+
Age group
Per centDiabetes with CVD Diabetes without CVD
Note: People aged 20 years and over only are included. Due to the small sample size, people aged 20–44 years were grouped for analysis. Source: AIHW analysis of 2004–05 ABS National Health Survey Confidentialised Unit Record File.
Figure 2.4: Comorbidity of CVD and diabetes among people with diabetes in the non-institutionalised adult population, by age group, 2004–05
12
Tabl
e 2.
3: A
ustr
alia
ns w
ith c
omor
bidi
ty o
f CV
D a
nd d
iabe
tes
in th
e no
n-in
stitu
tiona
lised
adu
lt po
pula
tion
by d
isea
se c
ateg
ory,
200
4–05
Com
orbi
dity
Inde
x co
nditi
ons
Num
ber o
f peo
ple
with
con
ditio
ns (%
)
All
CVD
C
ereb
rova
scul
ar
dise
ase
CH
D
Hyp
erte
nsiv
e di
seas
e H
eart
failu
re
Oth
er C
VD
Dia
bete
s
Pe
r cen
t
All
CV
D
3,45
2,51
0 (2
3.9)
—
—
—
—
—
—
.3)
4.
4 46
.2
13.2
40
.2
21.8
60
.6
2.3
46.1
8.
2 21
.8
—
—
—
12.1
Cer
ebro
vasc
ular
dis
ease
(m
ainl
y st
roke
) 89
,164
(0.6
)
—
—
16.7
50
.2
17.1
33
.9
17.4
CH
D
336,
098
(2—
—
Hyp
erte
nsiv
e di
seas
e 2,
096,
041
(14.
5)
—
2.
1 7.
4 —
6.
2 21
.1
15.2
Hea
rt fa
ilure
26
2,22
9 (1
.8)
—
5.
8 16
.9
49.6
—
50
.3
21.6
Oth
er C
VD
1,
596,
723
(11.
1)
—
1.
9 8.
5 27
.7
8.3
—
9.4
Dia
bete
s 68
9,05
1 (4
.8)
10.6
CV
D a
nd d
iabe
tes
417,
563
(2.9
)
—
—
—
—
—
—
—
Tota
l pop
ulat
ion
with
CV
D o
r dia
bete
s 3,
723,
998
(25.
8)
—
—
—
—
—
—
—
Tota
l est
imat
ed n
on-in
stitu
tiona
lised
ad
ult p
opul
atio
n 14
,432
,838
—
—
—
—
—
Not
es
1.
The
num
ber a
nd p
erce
ntag
e of
pop
ulat
ion
with
CV
D a
nd d
iabe
tes
do n
ot a
dd u
p to
tota
l CV
D b
ecau
se m
ore
than
one
of f
orm
of C
VD
can
be
reco
rded
. The
num
ber a
nd p
erce
ntag
e w
ith in
divi
dual
inde
x
cond
ition
s al
so d
o no
t add
up
to to
tal p
opul
atio
n w
ith in
dex
cond
ition
s fo
r the
sam
e re
ason
. 2.
P
eopl
e ag
ed 2
0 ye
ars
and
over
onl
y ar
e in
clud
ed.
Sou
rce:
AIH
W a
naly
sis
of 2
004–
05 A
BS N
atio
nal H
ealth
Sur
vey
Con
fiden
tialis
ed U
nit R
ecor
d Fi
le.
13
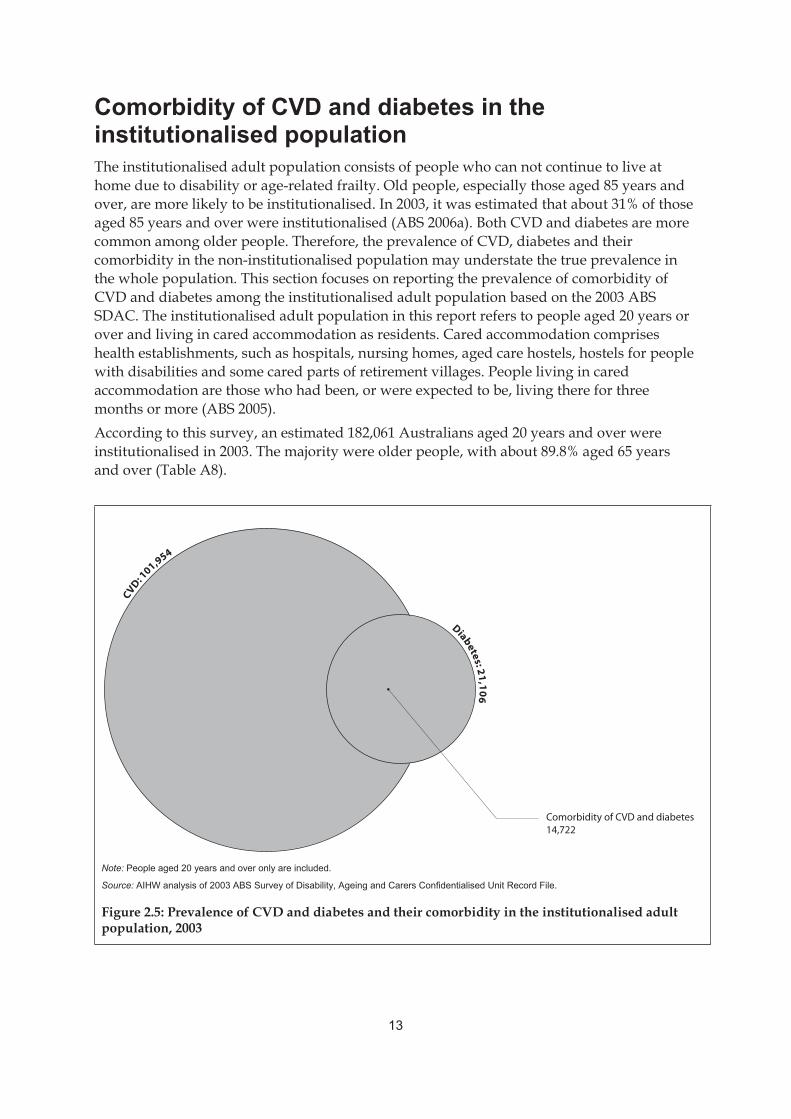
Comorbidity of CVD and diabetes in the institutionalised populationThe institutionalised adult population consists of people who can not continue to live at home due to disability or age-related frailty. Old people, especially those aged 85 years and over, are more likely to be institutionalised. In 2003, it was estimated that about 31% of those aged 85 years and over were institutionalised (ABS 2006a). Both CVD and diabetes are more common among older people. Therefore, the prevalence of CVD, diabetes and their comorbidity in the non-institutionalised population may understate the true prevalence in the whole population. This section focuses on reporting the prevalence of comorbidity of CVD and diabetes among the institutionalised adult population based on the 2003 ABS SDAC. The institutionalised adult population in this report refers to people aged 20 years or over and living in cared accommodation as residents. Cared accommodation comprises health establishments, such as hospitals, nursing homes, aged care hostels, hostels for people with disabilities and some cared parts of retirement villages. People living in cared accommodation are those who had been, or were expected to be, living there for three months or more (ABS 2005). According to this survey, an estimated 182,061 Australians aged 20 years and over were institutionalised in 2003. The majority were older people, with about 89.8% aged 65 years and over (Table A8).
Note: People aged 20 years and over only are included.
Source: AIHW analysis of 2003 ABS Survey of Disability, Ageing and Carers Confidentialised Unit Record File.
Figure 2.5: Prevalence of CVD and diabetes and their comorbidity in the institutionalised adult population, 2003
Diabetes: 21
,10
6
CVD: 1
01,954
Comorbidity of CVD and diabetes14,722
14
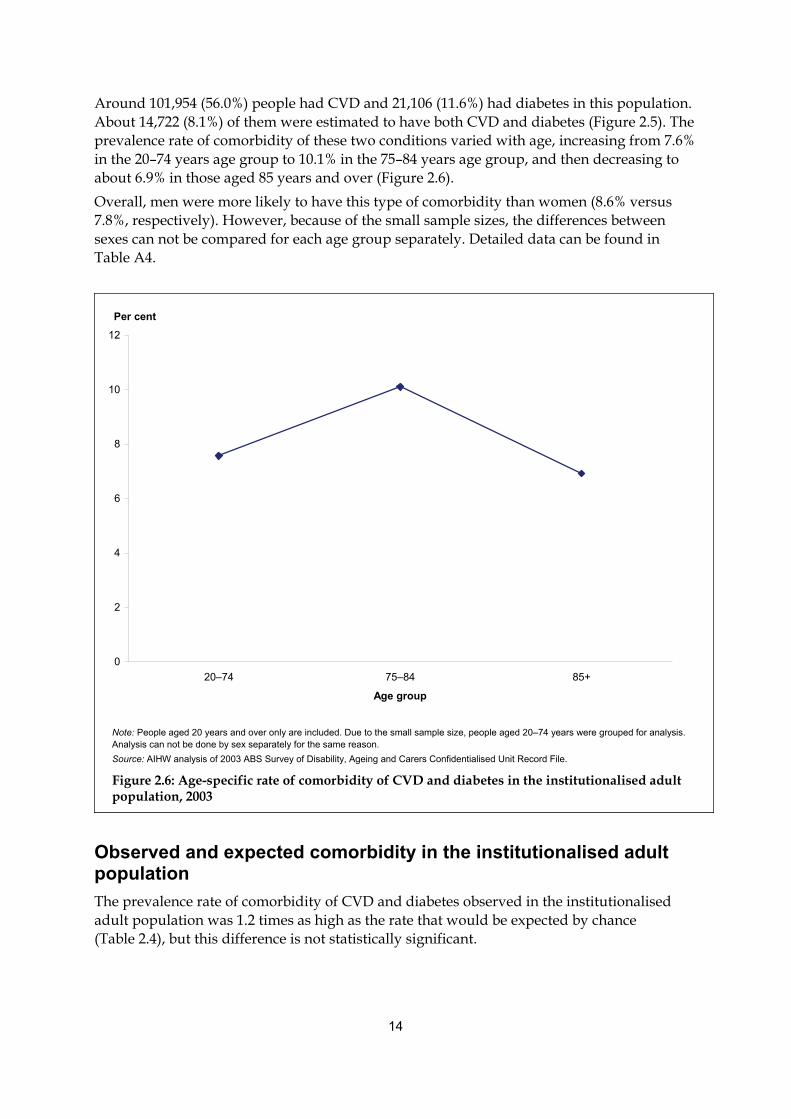
Around 101,954 (56.0%) people had CVD and 21,106 (11.6%) had diabetes in this population. About 14,722 (8.1%) of them were estimated to have both CVD and diabetes (Figure 2.5). The prevalence rate of comorbidity of these two conditions varied with age, increasing from 7.6% in the 20–74 years age group to 10.1% in the 75–84 years age group, and then decreasing to about 6.9% in those aged 85 years and over (Figure 2.6). Overall, men were more likely to have this type of comorbidity than women (8.6% versus 7.8%, respectively). However, because of the small sample sizes, the differences between sexes can not be compared for each age group separately. Detailed data can be found in Table A4.
0
2
4
6
8
10
12
20–74 75–84 85+
Age group
Per cent
Note: People aged 20 years and over only are included. Due to the small sample size, people aged 20–74 years were grouped for analysis. Analysis can not be done by sex separately for the same reason. Source: AIHW analysis of 2003 ABS Survey of Disability, Ageing and Carers Confidentialised Unit Record File.
Figure 2.6: Age-specific rate of comorbidity of CVD and diabetes in the institutionalised adult population, 2003
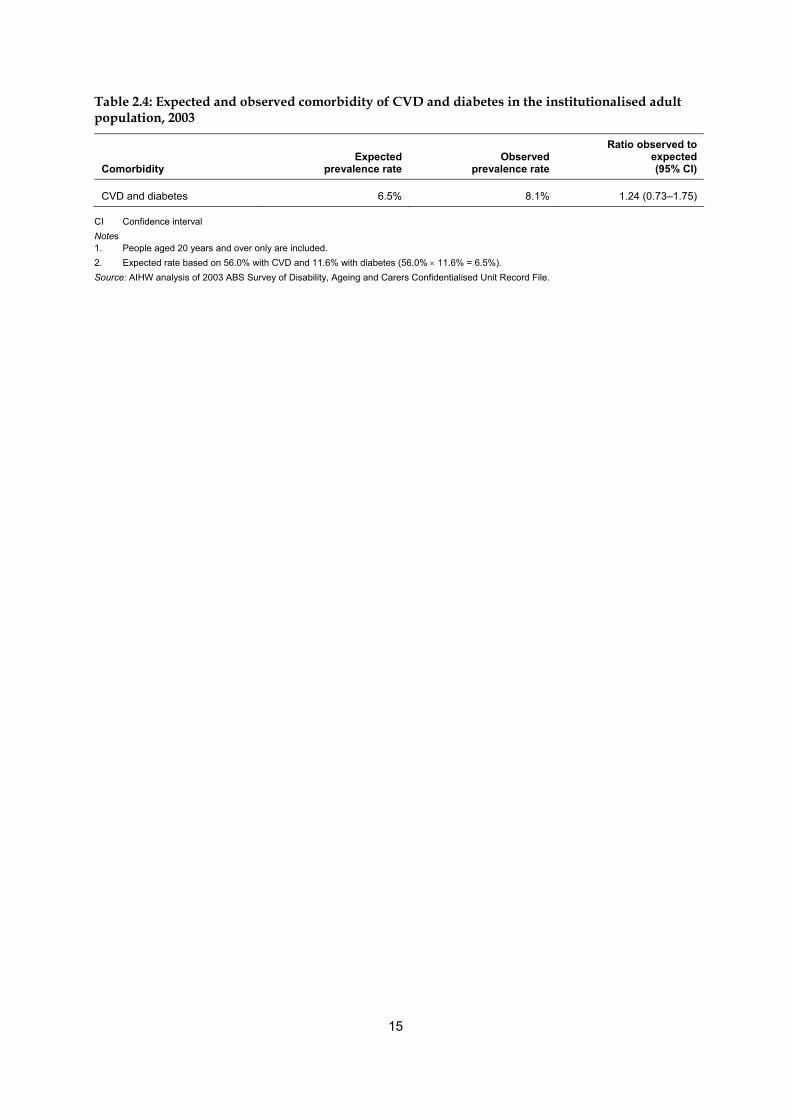
Observed and expected comorbidity in the institutionalised adult population The prevalence rate of comorbidity of CVD and diabetes observed in the institutionalised adult population was 1.2 times as high as the rate that would be expected by chance (Table 2.4), but this difference is not statistically significant.
15
Table 2.4: Expected and observed comorbidity of CVD and diabetes in the institutionalised adult population, 2003
Comorbidity Expected
prevalence rate Observed
prevalence rate
Ratio observed to expected(95% CI)
CVD and diabetes 6.5% 8.1% 1.24 (0.73–1.75)
CI Confidence interval Notes 1. People aged 20 years and over only are included. 2. Expected rate based on 56.0% with CVD and 11.6% with diabetes (56.0% × 11.6% = 6.5%). Source: AIHW analysis of 2003 ABS Survey of Disability, Ageing and Carers Confidentialised Unit Record File.
16
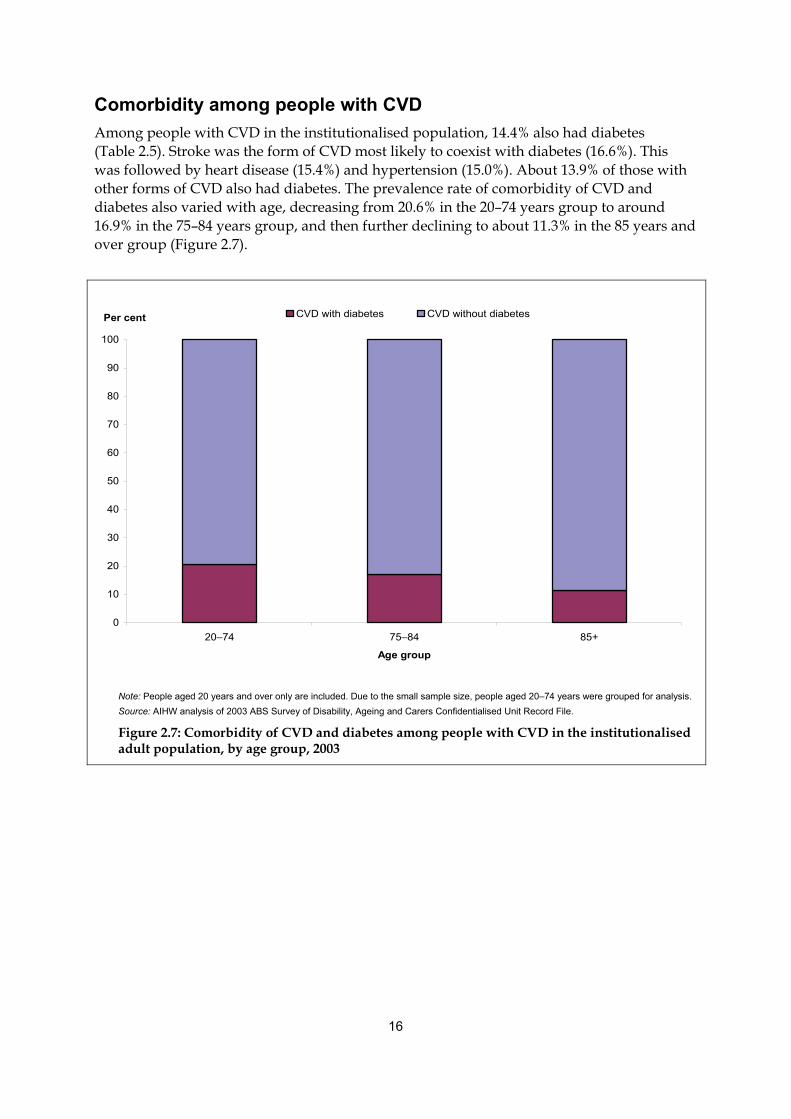
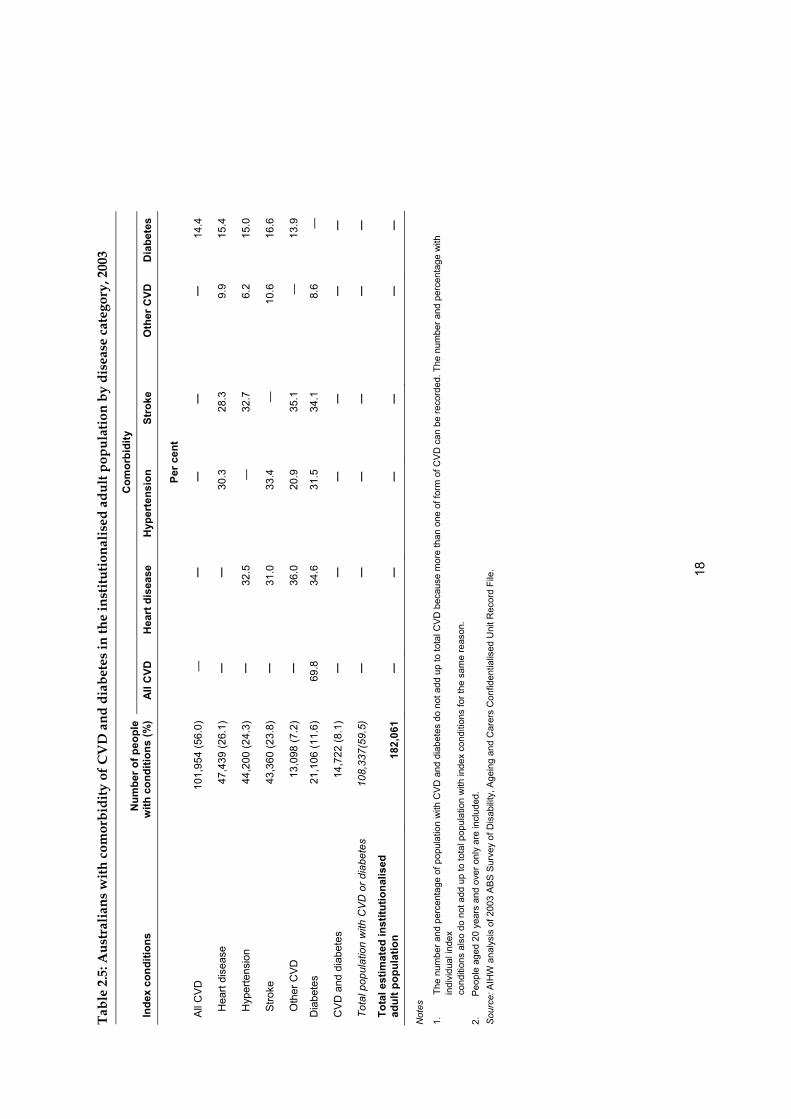
Comorbidity among people with CVD Among people with CVD in the institutionalised population, 14.4% also had diabetes (Table 2.5). Stroke was the form of CVD most likely to coexist with diabetes (16.6%). This was followed by heart disease (15.4%) and hypertension (15.0%). About 13.9% of those with other forms of CVD also had diabetes. The prevalence rate of comorbidity of CVD and diabetes also varied with age, decreasing from 20.6% in the 20–74 years group to around 16.9% in the 75–84 years group, and then further declining to about 11.3% in the 85 years and over group (Figure 2.7).
0
10
20
30
40
50
60
70
80
90
100
20–74 75–84 85+
Age group
Per cent CVD with diabetes CVD without diabetes
Note: People aged 20 years and over only are included. Due to the small sample size, people aged 20–74 years were grouped for analysis. Source: AIHW analysis of 2003 ABS Survey of Disability, Ageing and Carers Confidentialised Unit Record File.
Figure 2.7: Comorbidity of CVD and diabetes among people with CVD in the institutionalised adult population, by age group, 2003
17
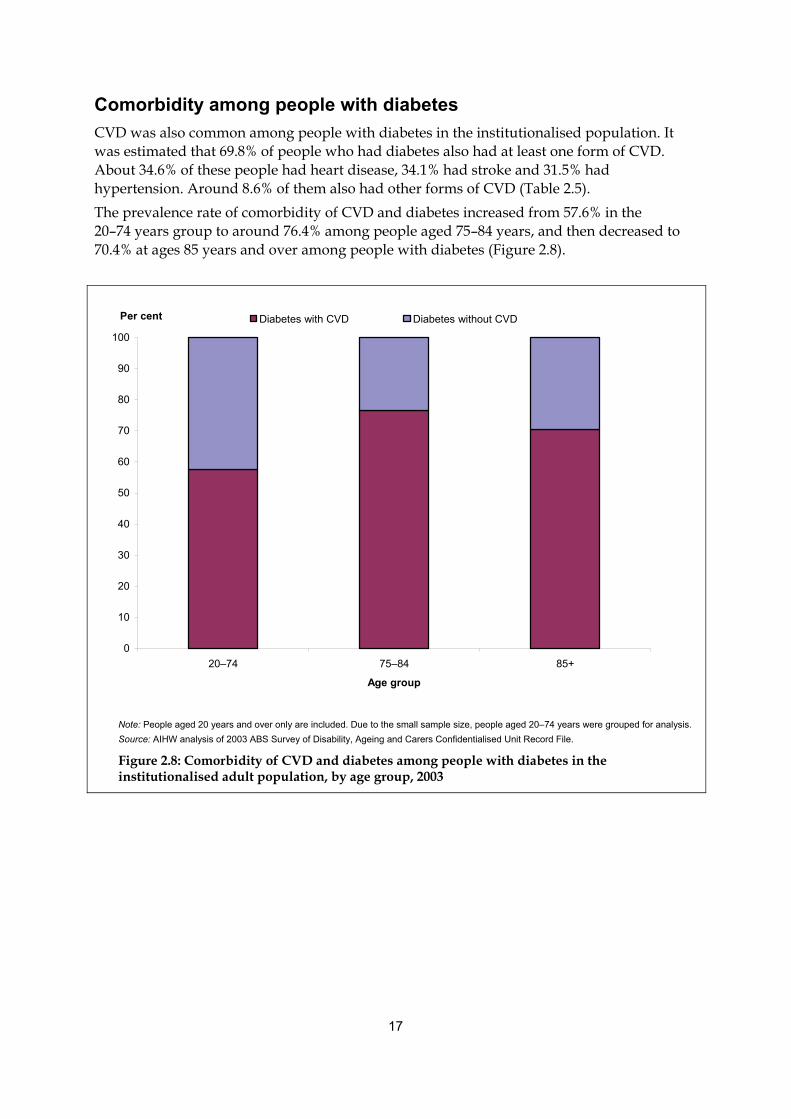
Comorbidity among people with diabetes CVD was also common among people with diabetes in the institutionalised population. It was estimated that 69.8% of people who had diabetes also had at least one form of CVD. About 34.6% of these people had heart disease, 34.1% had stroke and 31.5% had hypertension. Around 8.6% of them also had other forms of CVD (Table 2.5). The prevalence rate of comorbidity of CVD and diabetes increased from 57.6% in the 20–74 years group to around 76.4% among people aged 75–84 years, and then decreased to 70.4% at ages 85 years and over among people with diabetes (Figure 2.8).
0
10
20
30
40
50
60
70
80
90
100
20–74 75–84 85+
Age group
Per cent Diabetes with CVD Diabetes without CVD
Note: People aged 20 years and over only are included. Due to the small sample size, people aged 20–74 years were grouped for analysis. Source: AIHW analysis of 2003 ABS Survey of Disability, Ageing and Carers Confidentialised Unit Record File.
Figure 2.8: Comorbidity of CVD and diabetes among people with diabetes in the institutionalised adult population, by age group, 2003
Ta
ble
2.5:
Aus
tral
ians
with
com
orbi
dity
of C
VD
and
dia
bete
s in
the
inst
itutio
nalis
ed a
dult
popu
latio
n by
dis
ease
cat
egor
y, 2
003
Com
orbi
dity
Inde
x co
nditi
ons
Num
ber o
f peo
ple
with
con
ditio
ns (%
) A
ll C
VD
Hea
rt d
isea
se
Hyp
erte
nsio
n
Stro
ke
Oth
er C
VD
Dia
bete
s
Per c
ent
All
CV
D
101,
954
(56.
0)
—
—
—
—
—
14.4
Hea
rt di
seas
e 47
,439
(26.
1)
—
—
30.3
28
.3
9.9
15.4
Hyp
erte
nsio
n 44
,200
(24.
3)
—
32.5
—
32
.7
6.2
15.0
Stro
ke
43,3
60 (2
3.8)
—
31
.0
33.4
—
10
.6
16.6
Oth
er C
VD
13
,098
(7.2
) —
36
.0
20.9
35
.1
—
13.9
Dia
bete
s 21
,106
(11.
6)
69.8
34
.6
31.5
34
.1
8.6
—
CV
D a
nd d
iabe
tes
14,7
22 (8
.1)
—
—
—
—
—
—
Tota
l pop
ulat
ion
with
CV
D o
r dia
bete
s 10
8,33
7(59
.5)
—
—
—
—
—
—
Tota
l est
imat
ed in
stitu
tiona
lised
ad
ult p
opul
atio
n 18
2,06
1 —
—
—
—
—
—
Not
es
1.
The
num
ber a
nd p
erce
ntag
e of
pop
ulat
ion
with
CV
D a
nd d
iabe
tes
do n
ot a
dd u
p to
tota
l CV
D b
ecau
se m
ore
than
one
of f
orm
of C
VD
can
be
reco
rded
. The
num
ber a
nd p
erce
ntag
e w
ith
indi
vidu
al in
dex
co
nditi
ons
also
do
not a
dd u
p to
tota
l pop
ulat
ion
with
inde
x co
nditi
ons
for t
he s
ame
reas
on.
2.
Peo
ple
aged
20
year
s an
d ov
er o
nly
are
incl
uded
. S
ourc
e: A
IHW
ana
lysi
s of
200
3 A
BS S
urve
y of
Dis
abilit
y, A
gein
g an
d C
arer
s C
onfid
entia
lised
Uni
t Rec
ord
File
.
18
19
3 Hospitalisations
People with comorbidity have been found to use considerably more health resources, such as hospital services, GP visits and specialist consultations, than those without comorbidity (Westert et al. 2001). In this chapter, we examine the extent of comorbidity of CVD, diabetes and CKD in hospitalisations in 2004–05. We focus on presenting the number of hospital separations with any diagnosis (principal diagnosis and/or additional diagnoses) of two or three of the index conditions (CVD, diabetes and CKD), and the distribution of these hospital separations by age group and sex. Analysis was limited to separations for people aged 18 years and over. The data presented in this chapter are drawn from the AIHW National Hospital Morbidity Database. This database includes data on virtually all hospital admissions in Australia, in both public and private hospitals. Data are collected for each episode of hospital care (called hospital separation), which starts when a patient is admitted to hospital and ends when the hospital stay ends, or there is a change in the type of care (for example, from acute care to rehabilitation hospital care). Most diseases or conditions (including CVD and CKD) are recorded as a diagnosis following these criteria: ● diseases are recorded as principal diagnosis when they are considered to be the primary
reason for the patient being hospitalised ● diseases that coexist with the principal diagnosis, or arise during the episode of care, are
recorded as additional diagnoses when they affect the management of patients in terms of requiring therapeutic treatment, diagnostic procedures, or increased nursing care and/or monitoring (NCCH 2002).
In other words, a disease is not recorded as a diagnosis in hospital separations if it does not meet these criteria, even if patients had this disease when they were admitted to hospital. However, diabetes, along with a few other conditions, is treated as an exception—it is recorded as a diagnosis if people have this disease when they are hospitalised, regardless of the above criteria. As a consequence, the results of this analysis may underestimate the number of hospital separations with comorbidity of CVD, CKD or both. In addition, there may be some variations in coding practice between states and territories, particularly in the way comorbidity is recorded, which may also affect the results of the analyses in this report. It is also important to note that because hospital records are based on hospital separations, rather than individual patients, it is impossible to track patients between admissions. Therefore, the analyses presented here cannot identify whether different hospital separations relate to different patients or to a single patient with more than one episode of hospital care. In 2004–05, around 83% of adult hospitalisations with a diagnosis of CKD were attributed to regular dialysis in which ’Care involving dialysis’ was recorded as the principal diagnosis. Because the characteristics of these hospital separations are very different from others, and because of the large number of them, they have been analysed separately in this chapter.
20
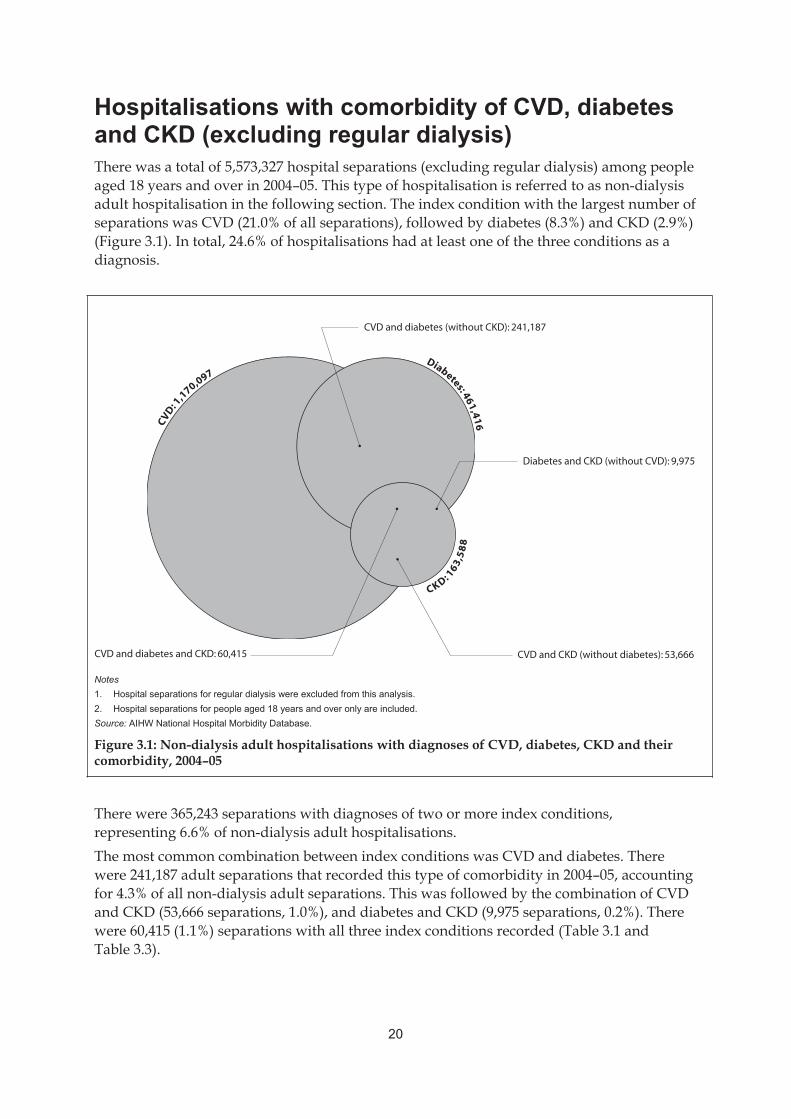
Hospitalisations with comorbidity of CVD, diabetes and CKD (excluding regular dialysis) There was a total of 5,573,327 hospital separations (excluding regular dialysis) among people aged 18 years and over in 2004–05. This type of hospitalisation is referred to as non-dialysis adult hospitalisation in the following section. The index condition with the largest number of separations was CVD (21.0% of all separations), followed by diabetes (8.3%) and CKD (2.9%) (Figure 3.1). In total, 24.6% of hospitalisations had at least one of the three conditions as a diagnosis.
Notes 1. Hospital separations for regular dialysis were excluded from this analysis. 2. Hospital separations for people aged 18 years and over only are included. Source: AIHW National Hospital Morbidity Database.
Figure 3.1: Non-dialysis adult hospitalisations with diagnoses of CVD, diabetes, CKD and their comorbidity, 2004–05
There were 365,243 separations with diagnoses of two or more index conditions, representing 6.6% of non-dialysis adult hospitalisations. The most common combination between index conditions was CVD and diabetes. There were 241,187 adult separations that recorded this type of comorbidity in 2004–05, accounting for 4.3% of all non-dialysis adult separations. This was followed by the combination of CVD and CKD (53,666 separations, 1.0%), and diabetes and CKD (9,975 separations, 0.2%). There were 60,415 (1.1%) separations with all three index conditions recorded (Table 3.1 and Table 3.3).
CVD: 1
,1
70,097Diabetes: 461,416
CKD: 163,5
88
CVD and diabetes (without CKD): 241,187
CVD and diabetes and CKD: 60,415
Diabetes and CKD (without CVD): 9,975
CVD and CKD (without diabetes): 53,666
21
Table 3.1: Non-dialysis adult hospitalisations with comorbidity of CVD, diabetes and CKD, by sex and age group, 2004–05
Comorbidity Men Women
Odds ratio men to women
(95% CI) Under
65 years 65 years and over
Odds ratio65 years and over to under 65 years
(95% CIl)
CVD and diabetes
(without CKD)
128,315
(5.2%)
112,872
(3.6%)
1.32
(1.31–1.33)
76,377
(2.2%)
164,810
(8.0%)
3.79
(3.76–3.82)
CVD and CKD
(without diabetes)
30,349
(1.2%)
23,317
(0.8%)
1.43
(1.41–1.46)
10,760
(0.3%)
42,906
(2.1%)
6.66
(6.52–6.80)
Diabetes and CKD
(without CVD)
5,509
(0.2%)
4,466
(0.1%)
1.46
(1.40–1.52)
4,218
(0.1%)
5,757
(0.3%)
2.24
(2.15–2.33)
CVD and diabetes
and CKD
35,146
(1.4%)
25,269
(0.8%)
1.59
(1.56–1.61)
17,791
(0.5%)
42,624
(2.1%)
3.96
(3.89–4.03)
All hospital separations 2,460,242 3,113,085 — 3,501,157 2,072,170 —
CI Confidence interval Notes 1. Hospital separations for regular dialysis were excluded from this analysis. 2. Hospital separations for people aged 18 years and over only are included.
Source: AIHW National Hospital Morbidity Database.
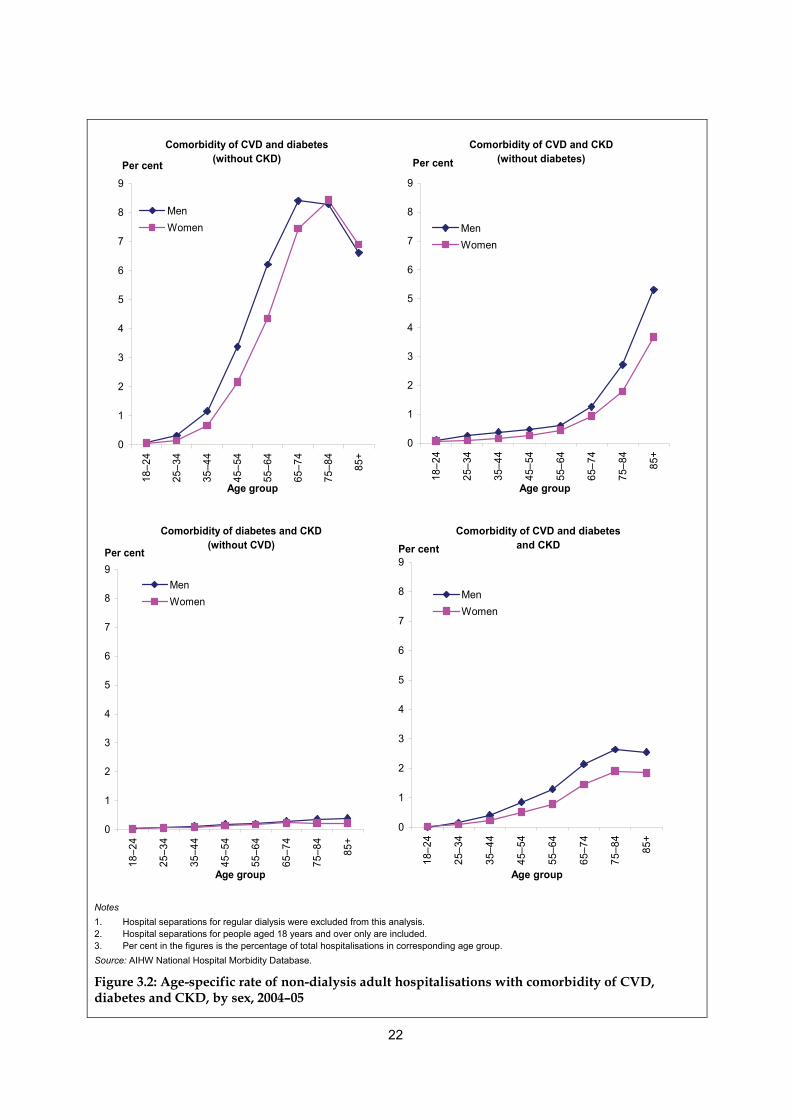
Age and sex The overall proportion of hospital separations with comorbidities increased with age. After adjusting for sex, separations for older people (aged 65 years and over) were around 2 to 7 times as likely to have two index conditions recorded and around 4 times as likely to have all three conditions recorded as separations for younger people (aged under 65 years) (Table 3.1). After adjusting for age, separations for men were more likely to have these comorbidities recorded than those for women—men were 32–46% more likely to have two of the conditions recorded and 59% more likely to have all three conditions recorded (Table 3.1). Figure 3.2 illustrates the distribution of non-dialysis adult hospitalisations with each combination of comorbidity by age and sex. Detailed data can be found in Table A5.
22
Comorbidity of CVD and diabetes (without CKD)
0
1
2
3
4
5
6
7
8
9
18–2
4
25–3
4
35–4
4
45–5
4
55–6
4
65–7
4
75–8
4
85+
Age group
Per cent
MenWomen
Comorbidity of CVD and CKD (without diabetes)
0
1
2
3
4
5
6
7
8
9
18–2
4
25–3
4
35–4
4
45–5
4
55–6
4
65–7
4
75–8
4
85+
Age group
Per cent
MenWomen
Comorbidity of diabetes and CKD(without CVD)
0
1
2
3
4
5
6
7
8
9
18–2
4
25–3
4
35–4
4
45–5
4
55–6
4
65–7
4
75–8
4
85+
Age group
Per cent
MenWomen
Comorbidity of CVD and diabetes and CKD
0
1
2
3
4
5
6
7
8
9
18–2
4
25–3
4
35–4
4
45–5
4
55–6
4
65–7
4
75–8
4
85+
Age group
Per cent
MenWomen
Notes 1. Hospital separations for regular dialysis were excluded from this analysis. 2. Hospital separations for people aged 18 years and over only are included. 3. Per cent in the figures is the percentage of total hospitalisations in corresponding age group. Source: AIHW National Hospital Morbidity Database.
Figure 3.2: Age-specific rate of non-dialysis adult hospitalisations with comorbidity of CVD, diabetes and CKD, by sex, 2004–05
23
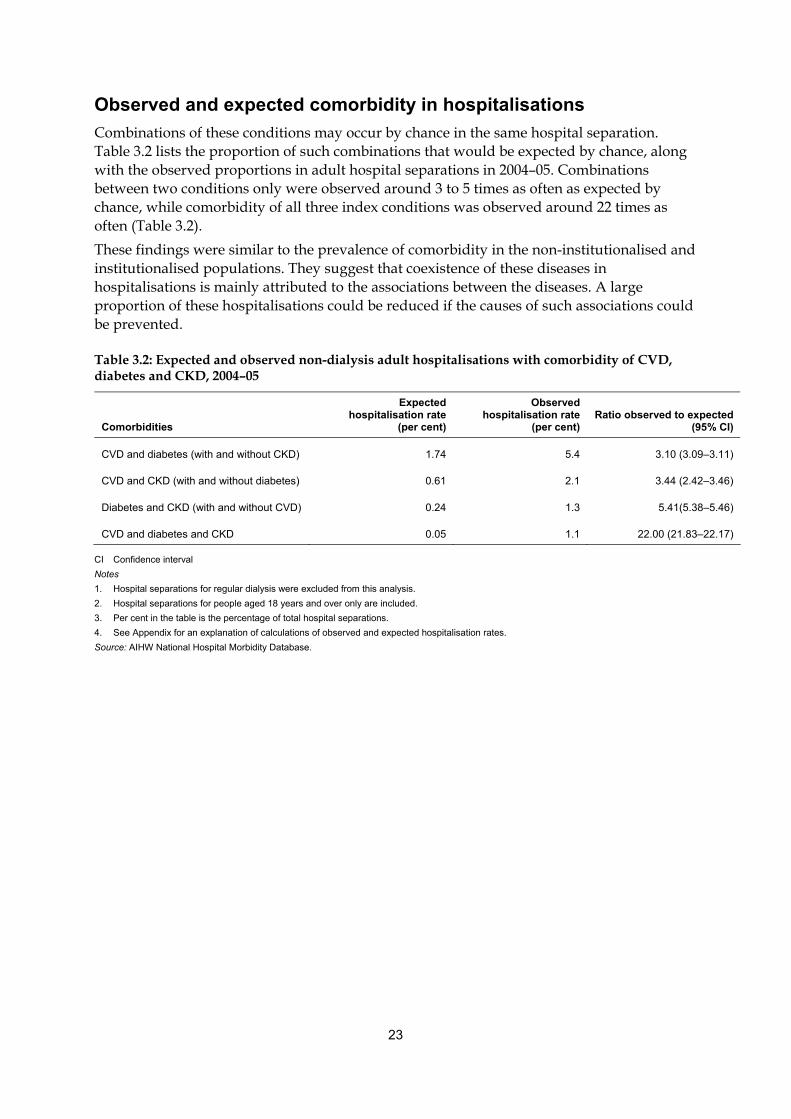
Observed and expected comorbidity in hospitalisations Combinations of these conditions may occur by chance in the same hospital separation. Table 3.2 lists the proportion of such combinations that would be expected by chance, along with the observed proportions in adult hospital separations in 2004–05. Combinations between two conditions only were observed around 3 to 5 times as often as expected by chance, while comorbidity of all three index conditions was observed around 22 times as often (Table 3.2). These findings were similar to the prevalence of comorbidity in the non-institutionalised and institutionalised populations. They suggest that coexistence of these diseases in hospitalisations is mainly attributed to the associations between the diseases. A large proportion of these hospitalisations could be reduced if the causes of such associations could be prevented.
Table 3.2: Expected and observed non-dialysis adult hospitalisations with comorbidity of CVD, diabetes and CKD, 2004–05
Comorbidities
Expectedhospitalisation rate
(per cent)
Observed hospitalisation rate
(per cent) Ratio observed to expected
(95% CI)
CVD and diabetes (with and without CKD) 1.74 5.4 3.10 (3.09–3.11)
CVD and CKD (with and without diabetes) 0.61 2.1 3.44 (2.42–3.46)
Diabetes and CKD (with and without CVD) 0.24 1.3 5.41(5.38–5.46)
CVD and diabetes and CKD 0.05 1.1 22.00 (21.83–22.17)
CI Confidence interval Notes 1. Hospital separations for regular dialysis were excluded from this analysis. 2. Hospital separations for people aged 18 years and over only are included. 3. Per cent in the table is the percentage of total hospital separations. 4. See Appendix for an explanation of calculations of observed and expected hospitalisation rates. Source: AIHW National Hospital Morbidity Database.
24
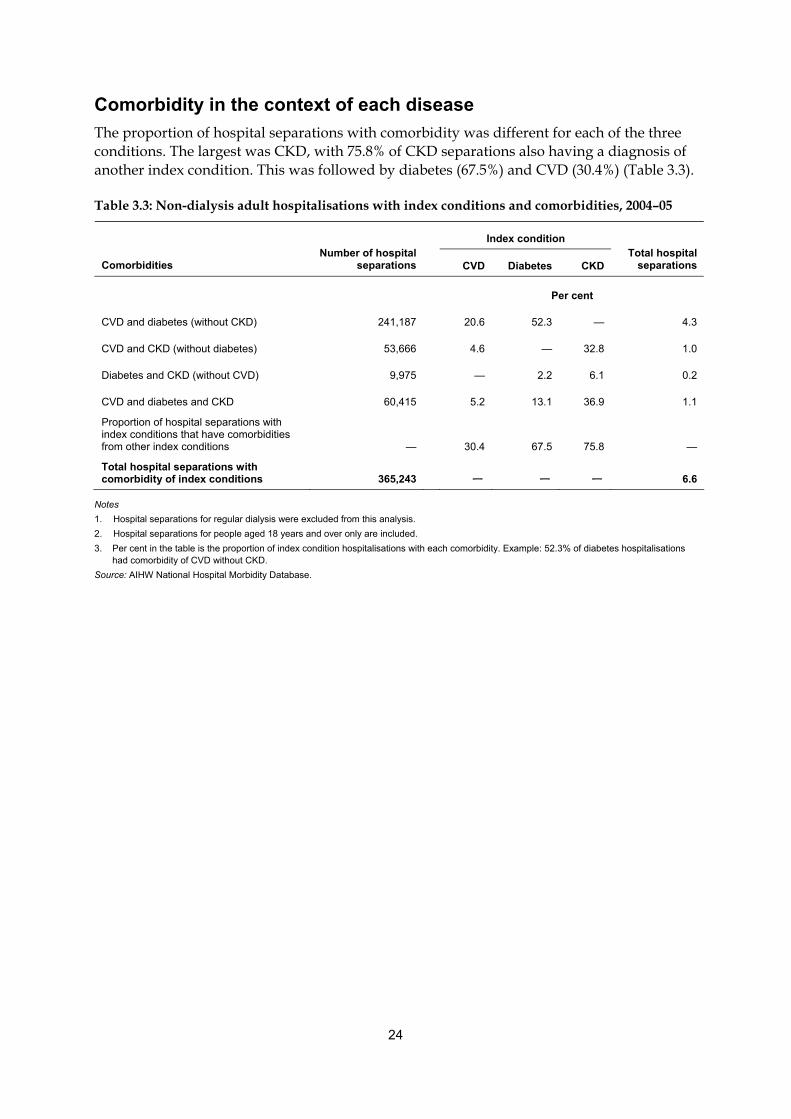
Comorbidity in the context of each disease The proportion of hospital separations with comorbidity was different for each of the three conditions. The largest was CKD, with 75.8% of CKD separations also having a diagnosis of another index condition. This was followed by diabetes (67.5%) and CVD (30.4%) (Table 3.3).
Table 3.3: Non-dialysis adult hospitalisations with index conditions and comorbidities, 2004–05
Index condition
Comorbidities Number of hospital
separations CVD Diabetes CKD Total hospital
separations
Per cent
CVD and diabetes (without CKD) 241,187 20.6 52.3 — 4.3
CVD and CKD (without diabetes) 53,666 4.6 — 32.8 1.0
Diabetes and CKD (without CVD) 9,975 — 2.2 6.1 0.2
CVD and diabetes and CKD 60,415 5.2 13.1 36.9 1.1
Proportion of hospital separations with index conditions that have comorbidities from other index conditions — 30.4 67.5 75.8 —
Total hospital separations with comorbidity of index conditions 365,243 — — — 6.6
Notes 1. Hospital separations for regular dialysis were excluded from this analysis. 2. Hospital separations for people aged 18 years and over only are included. 3. Per cent in the table is the proportion of index condition hospitalisations with each comorbidity. Example: 52.3% of diabetes hospitalisations
had comorbidity of CVD without CKD. Source: AIHW National Hospital Morbidity Database.

25
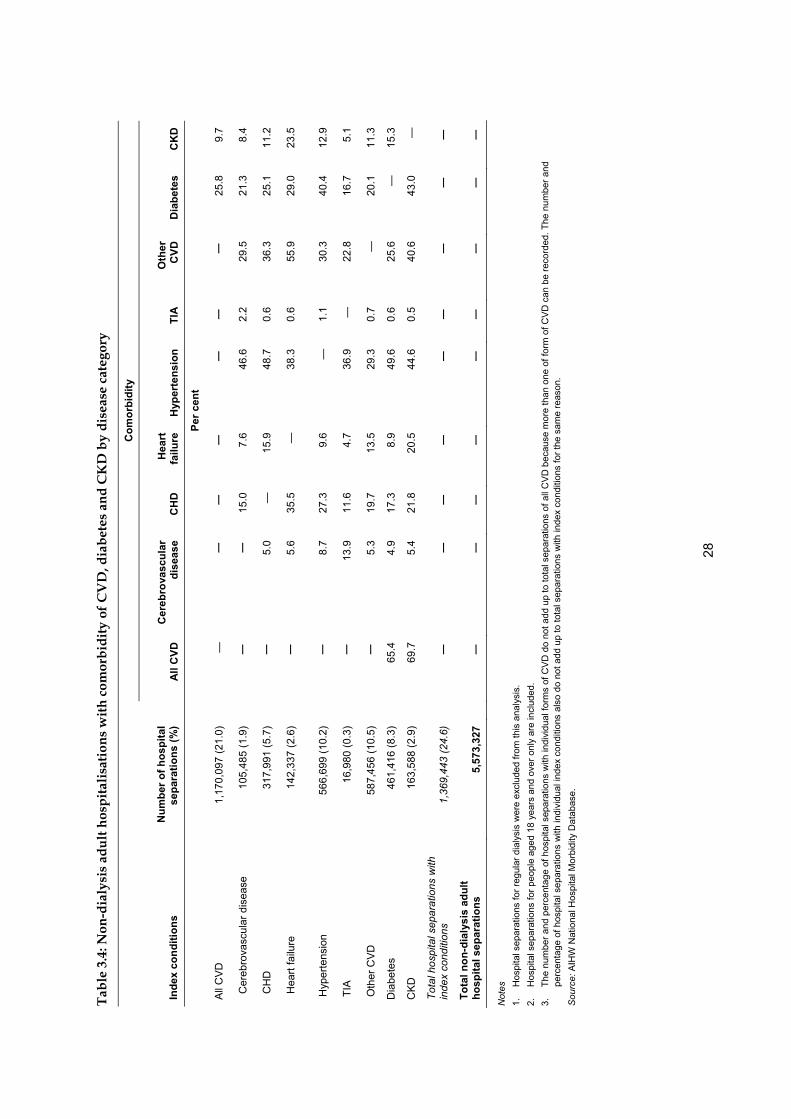
Comorbidity in hospitalisations with a diagnosis of CVD Of the hospital separations with a diagnosis of any form of CVD, more than 1 in 4 (25.8%) also had a diagnosis of diabetes. For some forms of CVD, the proportion of separations with diabetes was even higher than this average—hypertension (40.4%), heart failure (29.0%), CHD (25.1%), cerebrovascular disease (21.3%) and transient ischaemic attack (TIA) (16.7%). About 20.1% of hospital separations with other forms of CVD also recorded diabetes (Table 3.4). CKD was recorded as comorbidity in 9.7% of separations with CVD (Table 3.4). Heart failure occurred most frequently with CKD (23.5%), followed by hypertension (12.9%), CHD (11.2%), cerebrovascular disease (8.4%) and TIA (5.1%). About 11.3% of hospital separations with other forms of CVD also recorded CKD (Table 3.4). Hospitalisations with a diagnosis of CVD along with diabetes and/or CKD gradually increased from about 8% in the age group 18–24 to about 36% in the age group 65–74, before decreasing slightly in the older age groups (Figure 3.3).
0
10
20
30
40
50
60
70
80
90
100
18–24 25–34 35–44 45–54 55–64 65–74 75–84 85+Age group
Per cent
CVD and Diabetes and CKD CVD and Diabetes (without CKD)
CVD and CKD (without Diabetes) CVD (without diabetes or CKD)
Notes 1. Hospital separations for regular dialysis were excluded from this analysis. 2. Hospital separations for people aged 18 years and over only are included. Source: AIHW National Hospital Morbidity Database.
Figure 3.3: Comorbidity in non-dialysis adult hospitalisations with a diagnosis of CVD, by age group, 2004–05
26
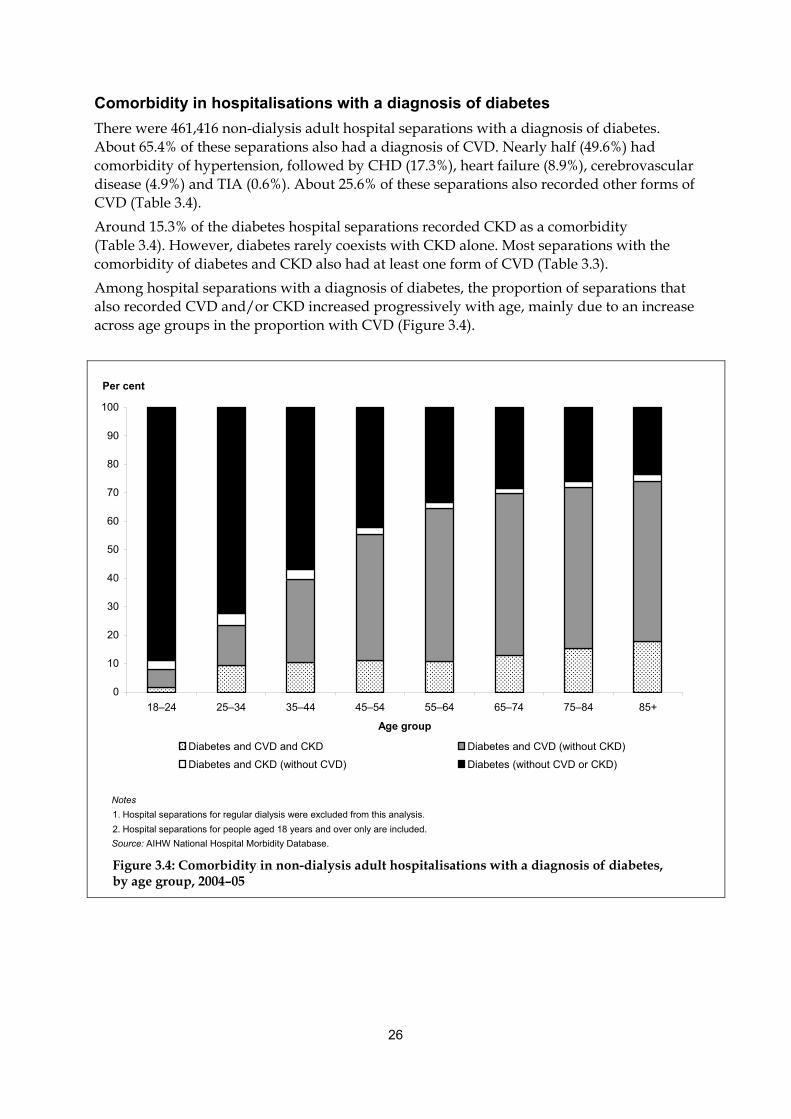
Comorbidity in hospitalisations with a diagnosis of diabetes There were 461,416 non-dialysis adult hospital separations with a diagnosis of diabetes. About 65.4% of these separations also had a diagnosis of CVD. Nearly half (49.6%) had comorbidity of hypertension, followed by CHD (17.3%), heart failure (8.9%), cerebrovascular disease (4.9%) and TIA (0.6%). About 25.6% of these separations also recorded other forms of CVD (Table 3.4). Around 15.3% of the diabetes hospital separations recorded CKD as a comorbidity (Table 3.4). However, diabetes rarely coexists with CKD alone. Most separations with the comorbidity of diabetes and CKD also had at least one form of CVD (Table 3.3). Among hospital separations with a diagnosis of diabetes, the proportion of separations that also recorded CVD and/or CKD increased progressively with age, mainly due to an increase across age groups in the proportion with CVD (Figure 3.4).
0
10
20
30
40
50
60
70
80
90
100
18–24 25–34 35–44 45–54 55–64 65–74 75–84 85+
Age group
Per cent
Diabetes and CVD and CKD Diabetes and CVD (without CKD)
Diabetes and CKD (without CVD) Diabetes (without CVD or CKD)
Notes 1. Hospital separations for regular dialysis were excluded from this analysis. 2. Hospital separations for people aged 18 years and over only are included. Source: AIHW National Hospital Morbidity Database.
Figure 3.4: Comorbidity in non-dialysis adult hospitalisations with a diagnosis of diabetes, by age group, 2004–05

27
Comorbidity in hospitalisations with a diagnosis of CKD Excluding hospital separations for regular dialysis, there were 163,588 hospital separations with a diagnosis of CKD in 2004–05. Nearly 70% of these separations also involved CVD, with hypertension (44.6%), CHD (21.8%) and heart failure (20.5%) commonly recorded. About 40.6% of these separations also recorded other forms of CVD (Table 3.4). Diabetes was recorded in around 43% of hospital separations with CKD, and most of them also had at least one diagnosis of CVD (Table 3.3 and 3.4). Among hospital separations with a diagnosis of CKD, the proportion of comorbidity with CVD and/or diabetes also increased progressively with age, mainly due to an increase across age groups in the proportion with CVD (Figure 3.5). Although CKD (excluding dialysis) accounted for a small proportion of hospital separations compared with CVD and diabetes, it had the greatest proportion of comorbidity across all age groups, and it also had the greatest proportion of comorbidity with both other index conditions (Figure 3.5).
0
10
20
30
40
50
60
70
80
90
100
18–24 25–34 35–44 45–54
Ag
Per cent
55–64 65–74 75–84 85+
e group
CKD and CVD and Diabetes CKD and CVD (without Diabetes)
CKD and Diabetes (without CVD) CKD (without CVD or Diabetes)
Notes 1. Hospital separations for regular dialysis were excluded from this analysis. 2. Hospital separations for people aged 18 years and over only are included. Source: AIHW National Hospital Morbidity Database.
Figure 3.5: Comorbidity in non-dialysis adult hospitalisations with a diagnosis of CKD, by age group, 2004–05
28
Tabl
e 3.
4: N
on-d
ialy
sis
adul
t hos
pita
lisat
ions
with
com
orbi
dity
of C
VD
, dia
bete
s an
d C
KD
by
dise
ase
cate
gory
Com
orbi
dity
Inde
x co
nditi
ons
Num
ber o
f hos
pita
l se
para
tions
(%)
A
ll C
VD
C
ereb
rova
scul
ar
dise
ase
C
HD
H
eart
fa
ilure
H
yper
tens
ion
TI
AO
ther
C
VD
Dia
bete
s C
KD
Pe
r cen
t
All
CV
D
1,17
0,09
7 (2
1.0)
—
—
—
—
—
—
—
25.8
9.
7
Cer
ebro
vasc
ular
dis
ease
10
5,48
5 (1
.9)
—
—
15
.0
7.6
46.6
2.
2 29
.5
21.3
8.
4
CH
D
317,
991
(5.7
)
—
5.0
—
15.9
48
.7
0.6
36.3
25
.1
11.2
Hea
rt fa
ilure
14
2,33
7 (2
.6)
—
5.
6 35
.5
—
38.3
0.
6 55
.9
29.0
23
.5
Hyp
erte
nsio
n 56
6,69
9 (1
0.2)
—
8.7
27.3
9.
6 —
1.
1 30
.3
40.4
12
.9
TIA
16
,980
(0.3
)
—
13.9
11
.6
4.7
36.9
—
22
.8
16.7
5.
1
Oth
er C
VD
58
7,45
6 (1
0.5)
—
5.3
19.7
13
.5
29.3
0.
7 —
4.9
17.3
8.
9 49
.6
—
15.3
CK
D
5.4
21.8
20
.5
44.6
0.
5 40
.6
43.0
—
20.1
11
.3
Dia
bete
s 46
1,41
6 (8
.3)
65
.4
0.6
25.6
163,
588
(2.9
)
69.7
Tota
l hos
pita
l sep
arat
ions
with
in
dex
cond
ition
s 1,
369,
443
(24.
6)
—
—
—
—
—
—
—
—
—
To
tal n
on-d
ialy
sis
adul
t ho
spita
l sep
arat
ions
5,
573,
327
—
—
—
—
—
—
—
—
—
Not
es
1.
Hos
pita
l sep
arat
ions
for r
egul
ar d
ialy
sis
wer
e ex
clud
ed fr
om th
is a
naly
sis.
2.
H
ospi
tal s
epar
atio
ns fo
r peo
ple
aged
18
year
s an
d ov
er o
nly
are
incl
uded
. 3.
Th
e nu
mbe
r and
per
cent
age
of h
ospi
tal s
epar
atio
ns w
ith in
divi
dual
form
s of
CV
D d
o no
t add
up
to to
tal s
epar
atio
ns o
f all
CV
D b
ecau
se m
ore
than
one
of f
orm
of C
VD
can
be
reco
rded
. The
num
ber a
nd
perc
enta
ge o
f hos
pita
l sep
arat
ions
with
indi
vidu
al in
dex
cond
ition
s al
so d
o no
t add
up
to to
tal s
epar
atio
ns w
ith in
dex
cond
ition
s fo
r the
sam
e re
ason
. S
ourc
e: A
IHW
Nat
iona
l Hos
pita
l Mor
bidi
ty D
atab
ase.

29
Hospitalisations for regular dialysis There were 808,917 adult hospital separations in which ’Care involving dialysis’ was recorded as the principal diagnosis in 2004–05, representing 83.2% of adult hospital separations with a diagnosis of CKD and 12.7% of all adult hospital separations. As people with end-stage kidney disease go to hospital for day-stay admissions for regular dialysis 3 times per week, these hospital separations represent a large number of hospital re-admissions for a relatively small population. Among these separations, 64,328 (8.0%) had an additional diagnosis of diabetes and 41,543 (5.1%) had an additional diagnosis of CVD. The two forms of CVD most often recorded as an additional diagnosis were hypertension (4.4%) and CHD (0.1%). Around 1.4% of these separations also recorded other forms of CVD. Furthermore, 18,590 (2.3%) dialysis separations had both diabetes and CVD among their additional diagnoses (Table 3.5). There are differences between the proportion of comorbidities recorded in the AIHW National Hospital Morbidity Database and in other data sources. For example, about 5.1% of dialysis separations recorded CVD as an additional diagnosis, but the Australia and New Zealand Dialysis and Transplant Registry (ANZDATA) reported that about 28% of new patients had coronary artery disease in 2004 (McDonald et al. 2005). There are two possible reasons that may lead to this disparity. First, although a considerable proportion of people who were receiving dialysis had CVD, CVD might not affect regular dialysis, and therefore it is not recorded. Second, as the same patients attend the same dialysis unit or clinic a number of times, their medical records may be automatically repeated at each separation, rather than being re-recorded to reflect the comorbidities that they had, or were treated for, during each episode of hospital care.
Table 3.5: Adult hospitalisations for regular dialysis, 2004–05
Diagnosis Number Per cent
Diabetes 64,328 8.0
CVD 41,543 5.1
Cerebrovascular disease 543 0.1
CHD 927 0.1
Heart failure 623 0.1
Hypertension 35,279 4.4
TIA 1 0.0
Other CVD 11,663 1.4
Comorbidity of CVD and diabetes 18,590 2.3
Total adult hospitalisations for regular dialysis 808,917 100
Note: Hospital separations for people aged 18 years and over only are included. Source: AIHW National Hospital Morbidity Database.
30
4 Deaths In this chapter, we examine the extent of comorbidity of CVD, diabetes and CKD in deaths registered in Australia in 2004. The data presented here are drawn from the AIHW National Mortality Database. These data are collected by the Registrars of Births, Deaths and Marriages in each state and territory and compiled nationally by the ABS, which codes the causes of death according to the International Classification of Diseases (ICD). Deaths registered in Australia may have more than one cause of death recorded on the death certificate. The disease or injury that initiated the train of events leading directly to death is defined as the ‘underlying cause of death’. In addition, any other condition or event that is not the underlying cause of death but is considered to have contributed to the death is known as an associated cause. This chapter focuses on those deaths where two or more of the index conditions were recorded among the underlying and associated causes listed on the death certificate. However, it is important to note that a condition is recorded as a cause of death only if it is judged to have contributed to the death. A disease will not be recorded in the death certificate if it does not meet this criterion even if people have this disease when they die. Therefore, results in this chapter represent the extent of comorbidity of the index condition as a cause of death (described here as ‘death with index conditions or comorbidity’), rather than the prevalence of these comorbidities among people who died. As with previous chapters, analysis here was limited to mortality records for people aged 18 years and over.
31
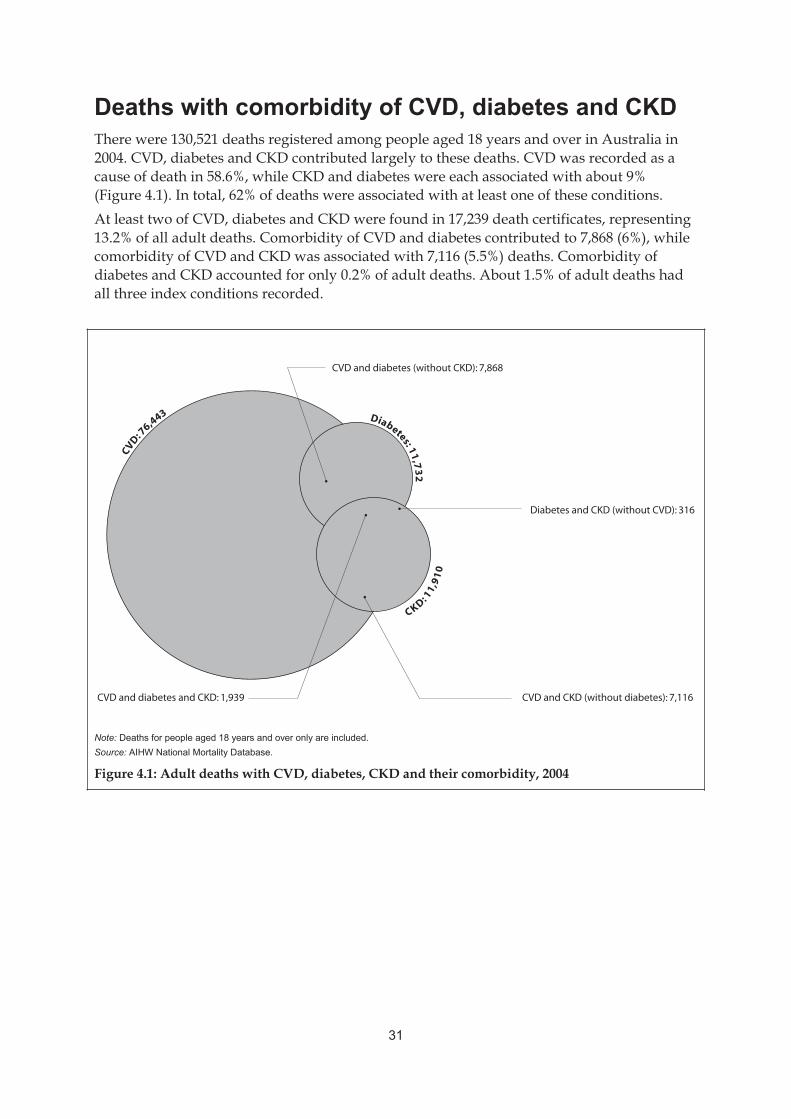
Deaths with comorbidity of CVD, diabetes and CKD There were 130,521 deaths registered among people aged 18 years and over in Australia in 2004. CVD, diabetes and CKD contributed largely to these deaths. CVD was recorded as a cause of death in 58.6%, while CKD and diabetes were each associated with about 9% (Figure 4.1). In total, 62% of deaths were associated with at least one of these conditions. At least two of CVD, diabetes and CKD were found in 17,239 death certificates, representing 13.2% of all adult deaths. Comorbidity of CVD and diabetes contributed to 7,868 (6%), while comorbidity of CVD and CKD was associated with 7,116 (5.5%) deaths. Comorbidity of diabetes and CKD accounted for only 0.2% of adult deaths. About 1.5% of adult deaths had all three index conditions recorded.
Note: Deaths for people aged 18 years and over only are included.Source: AIHW National Mortality Database.
Figure 4.1: Adult deaths with CVD, diabetes, CKD and their comorbidity, 2004
CVD: 7
6,443 Diabetes: 11,73
2
CKD: 11,
91
0
CVD and diabetes (without CKD): 7,868
CVD and diabetes and CKD: 1,939
Diabetes and CKD (without CVD): 316
CVD and CKD (without diabetes): 7,116
32
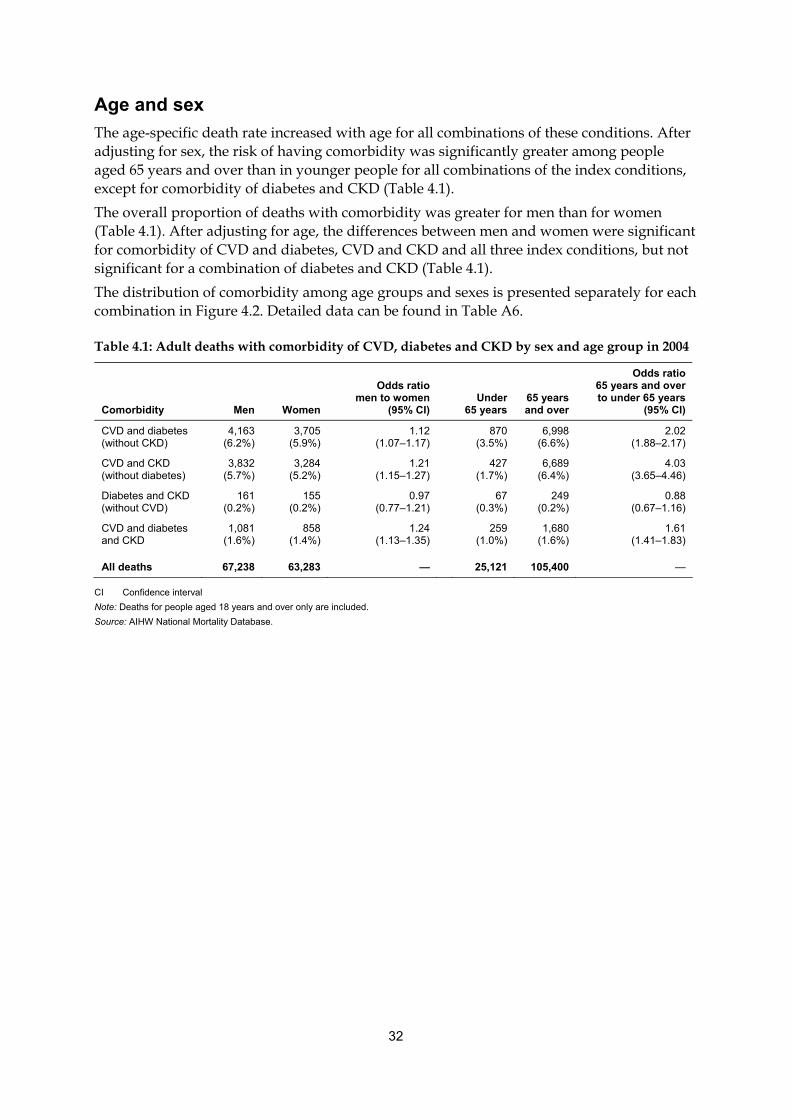
Age and sex The age-specific death rate increased with age for all combinations of these conditions. After adjusting for sex, the risk of having comorbidity was significantly greater among people aged 65 years and over than in younger people for all combinations of the index conditions, except for comorbidity of diabetes and CKD (Table 4.1). The overall proportion of deaths with comorbidity was greater for men than for women (Table 4.1). After adjusting for age, the differences between men and women were significant for comorbidity of CVD and diabetes, CVD and CKD and all three index conditions, but not significant for a combination of diabetes and CKD (Table 4.1). The distribution of comorbidity among age groups and sexes is presented separately for each combination in Figure 4.2. Detailed data can be found in Table A6.
Table 4.1: Adult deaths with comorbidity of CVD, diabetes and CKD by sex and age group in 2004
Comorbidity Men Women
Odds ratio men to women
(95% CI) Under
65 years 65 years and over
Odds ratio65 years and over to under 65 years
(95% CI)
CVD and diabetes (without CKD)
4,163 (6.2%)
3,705 (5.9%)
1.12(1.07–1.17)
870(3.5%)
6,998 (6.6%)
2.02(1.88–2.17)
CVD and CKD (without diabetes)
3,832 (5.7%)
3,284 (5.2%)
1.21(1.15–1.27)
427(1.7%)
6,689 (6.4%)
4.03(3.65–4.46)
Diabetes and CKD (without CVD)
161 (0.2%)
155 (0.2%)
0.97(0.77–1.21)
67(0.3%)
249 (0.2%)
0.88(0.67–1.16)
CVD and diabetes and CKD
1,081 (1.6%)
858 (1.4%)
1.24(1.13–1.35)
259(1.0%)
1,680 (1.6%)
1.61(1.41–1.83)
All deaths 67,238 63,283 — 25,121 105,400 —
CI Confidence interval Note: Deaths for people aged 18 years and over only are included. Source: AIHW National Mortality Database.
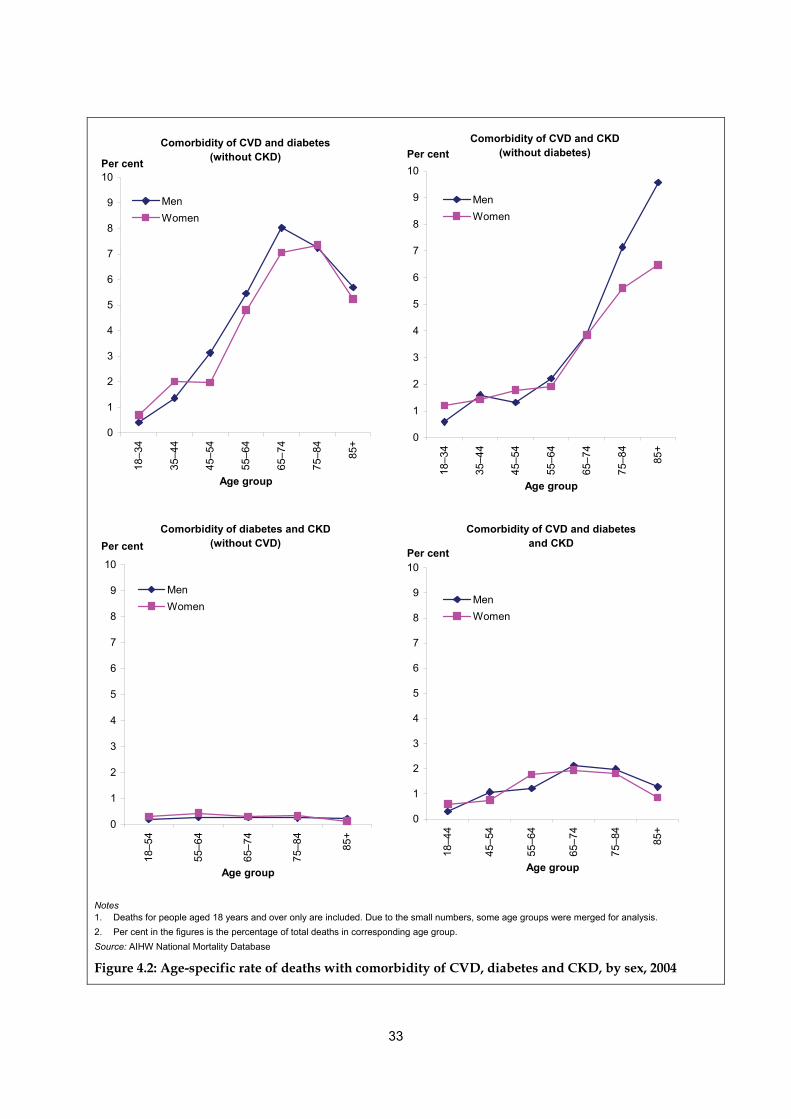
33
Comorbidity of CVD and diabetes (without CKD)
0
1
2
3
4
5
6
7
8
9
10
18–3
4
35–4
4
45–5
4
55–6
4
65–7
4
75–8
4
85+
Age group
Per cent
MenWomen
Comorbidity of CVD and CKD(without diabetes)
0
1
2
3
4
5
6
7
8
9
10
18–3
4
35–4
4
45–5
4
55–6
4
65–7
4
75–8
4
85+
Age group
Per cent
MenWomen
Comorbidity of diabetes and CKD(without CVD)
0
1
2
3
4
5
6
7
8
9
10
18–5
4
55–6
4
65–7
4
75–8
4
85+
Age group
Per cent
MenWomen
Comorbidity of CVD and diabetes and CKD
0
1
2
3
4
5
6
7
8
9
10
18–4
4
45–5
4
55–6
4
65–7
4
75–8
4
85+
Age group
Per cent
MenWomen
Notes 1. Deaths for people aged 18 years and over only are included. Due to the small numbers, some age groups were merged for analysis. 2. Per cent in the figures is the percentage of total deaths in corresponding age group. Source: AIHW National Mortality Database
Figure 4.2: Age-specific rate of deaths with comorbidity of CVD, diabetes and CKD, by sex, 2004
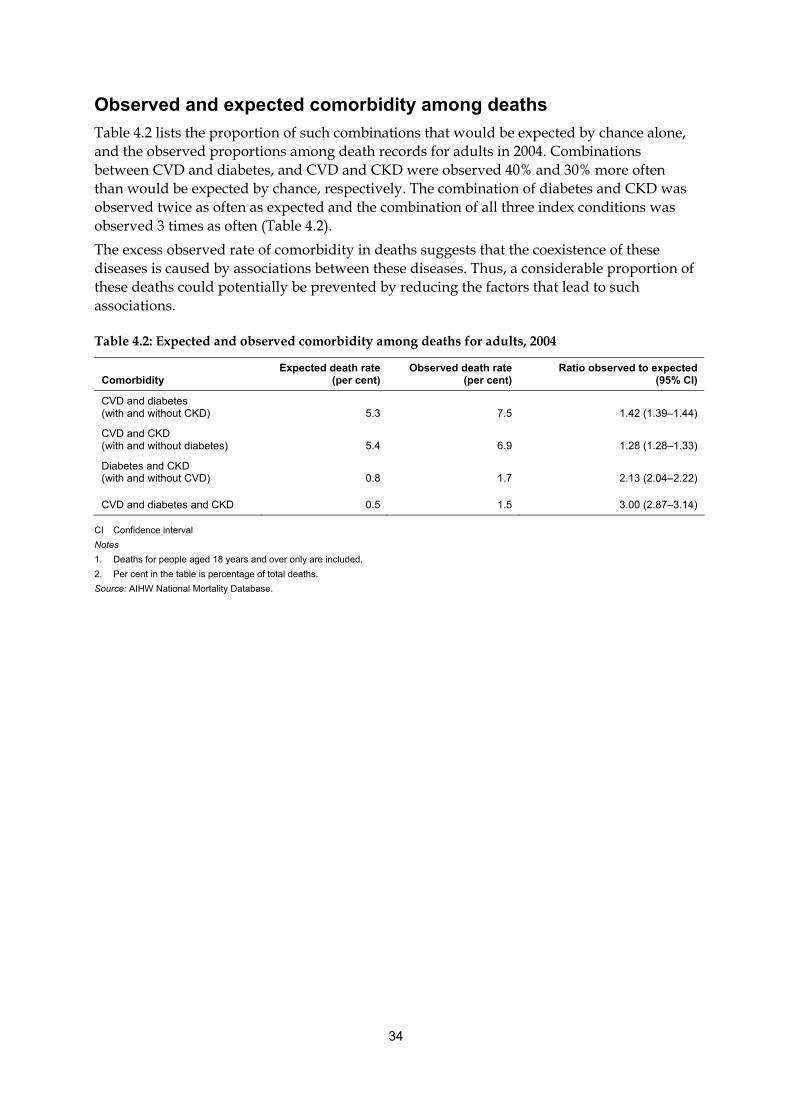
34
Observed and expected comorbidity among deaths Table 4.2 lists the proportion of such combinations that would be expected by chance alone, and the observed proportions among death records for adults in 2004. Combinations between CVD and diabetes, and CVD and CKD were observed 40% and 30% more often than would be expected by chance, respectively. The combination of diabetes and CKD was observed twice as often as expected and the combination of all three index conditions was observed 3 times as often (Table 4.2). The excess observed rate of comorbidity in deaths suggests that the coexistence of these diseases is caused by associations between these diseases. Thus, a considerable proportion of these deaths could potentially be prevented by reducing the factors that lead to such associations.
Table 4.2: Expected and observed comorbidity among deaths for adults, 2004
Comorbidity Expected death rate
(per cent) Observed death rate
(per cent) Ratio observed to expected
(95% CI)
CVD and diabetes (with and without CKD) 5.3 7.5 1.42 (1.39–1.44)
CVD and CKD (with and without diabetes) 5.4 6.9 1.28 (1.28–1.33)
Diabetes and CKD (with and without CVD) 0.8 1.7 2.13 (2.04–2.22)
CVD and diabetes and CKD 0.5 1.5 3.00 (2.87–3.14)
CI Confidence interval Notes 1. Deaths for people aged 18 years and over only are included. 2. Per cent in the table is percentage of total deaths. Source: AIHW National Mortality Database.
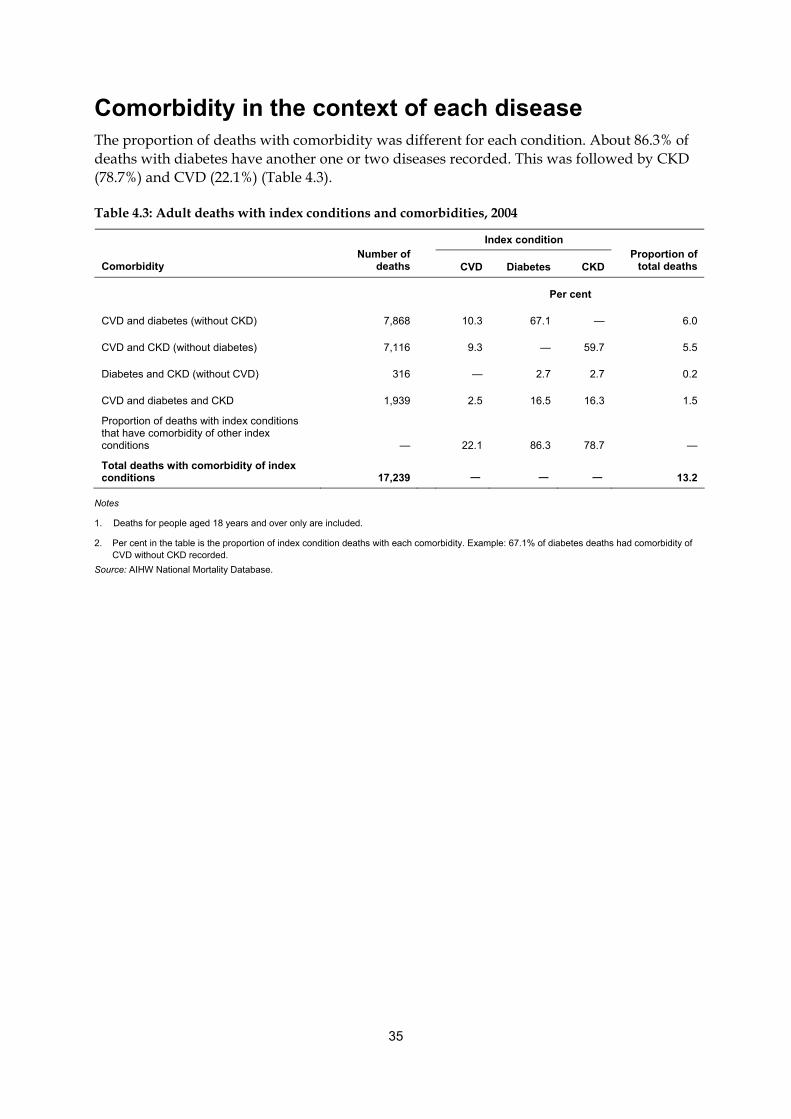
35
Comorbidity in the context of each disease The proportion of deaths with comorbidity was different for each condition. About 86.3% of deaths with diabetes have another one or two diseases recorded. This was followed by CKD (78.7%) and CVD (22.1%) (Table 4.3).
Table 4.3: Adult deaths with index conditions and comorbidities, 2004
Index condition
Comorbidity Number of
deaths CVD Diabetes CKD Proportion of
total deaths
Per cent
CVD and diabetes (without CKD) 7,868 10.3 67.1 — 6.0
CVD and CKD (without diabetes) 7,116 9.3 — 59.7 5.5
Diabetes and CKD (without CVD) 316 — 2.7 2.7 0.2
CVD and diabetes and CKD 1,939 2.5 16.5 16.3 1.5
Proportion of deaths with index conditions that have comorbidity of other index conditions — 22.1 86.3 78.7 —
Total deaths with comorbidity of index conditions 17,239 — — — 13.2
Notes
1. Deaths for people aged 18 years and over only are included.
2. Per cent in the table is the proportion of index condition deaths with each comorbidity. Example: 67.1% of diabetes deaths had comorbidity of CVD without CKD recorded.
Source: AIHW National Mortality Database.
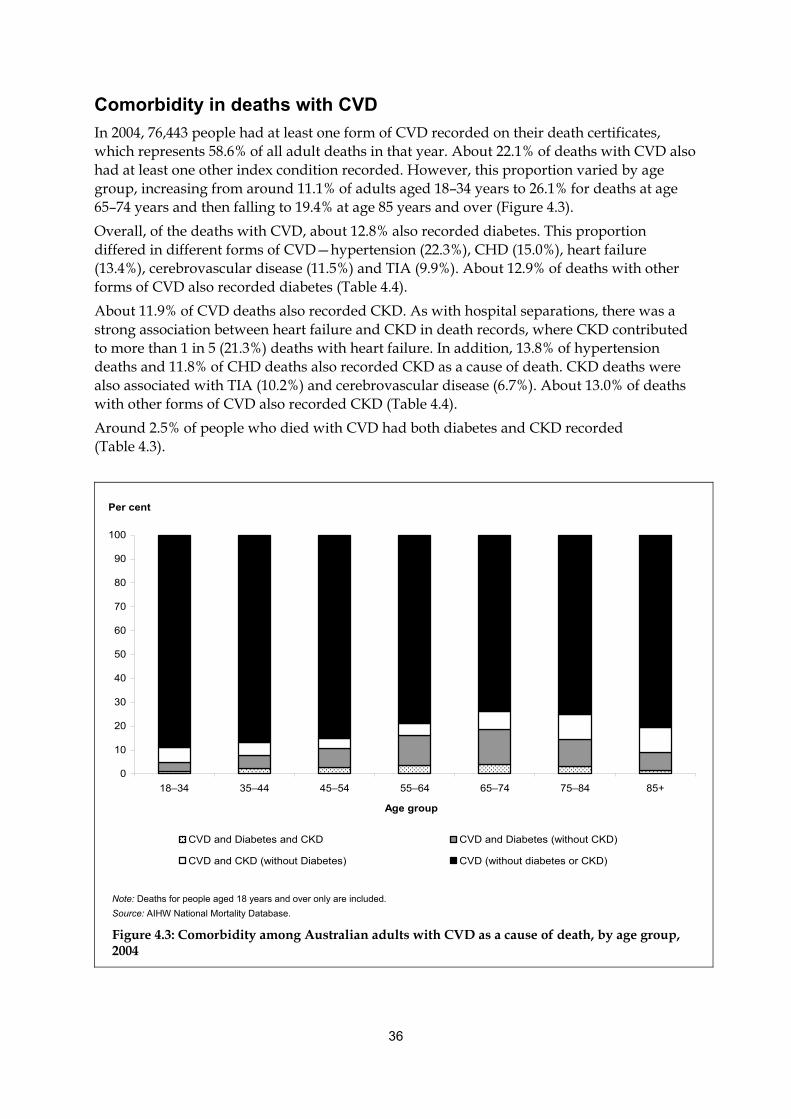
36
Comorbidity in deaths with CVD In 2004, 76,443 people had at least one form of CVD recorded on their death certificates, which represents 58.6% of all adult deaths in that year. About 22.1% of deaths with CVD also had at least one other index condition recorded. However, this proportion varied by age group, increasing from around 11.1% of adults aged 18–34 years to 26.1% for deaths at age 65–74 years and then falling to 19.4% at age 85 years and over (Figure 4.3). Overall, of the deaths with CVD, about 12.8% also recorded diabetes. This proportion differed in different forms of CVD—hypertension (22.3%), CHD (15.0%), heart failure (13.4%), cerebrovascular disease (11.5%) and TIA (9.9%). About 12.9% of deaths with other forms of CVD also recorded diabetes (Table 4.4). About 11.9% of CVD deaths also recorded CKD. As with hospital separations, there was a strong association between heart failure and CKD in death records, where CKD contributed to more than 1 in 5 (21.3%) deaths with heart failure. In addition, 13.8% of hypertension deaths and 11.8% of CHD deaths also recorded CKD as a cause of death. CKD deaths were also associated with TIA (10.2%) and cerebrovascular disease (6.7%). About 13.0% of deaths with other forms of CVD also recorded CKD (Table 4.4). Around 2.5% of people who died with CVD had both diabetes and CKD recorded (Table 4.3).
0
10
20
30
40
50
60
70
80
90
100
18–34 35–44 45–54 55–64 65–74 75–84 85+
Age group
Per cent
CVD and Diabetes and CKD CVD and Diabetes (without CKD)
CVD and CKD (without Diabetes) CVD (without diabetes or CKD)
Note: Deaths for people aged 18 years and over only are included. Source: AIHW National Mortality Database.
Figure 4.3: Comorbidity among Australian adults with CVD as a cause of death, by age group, 2004
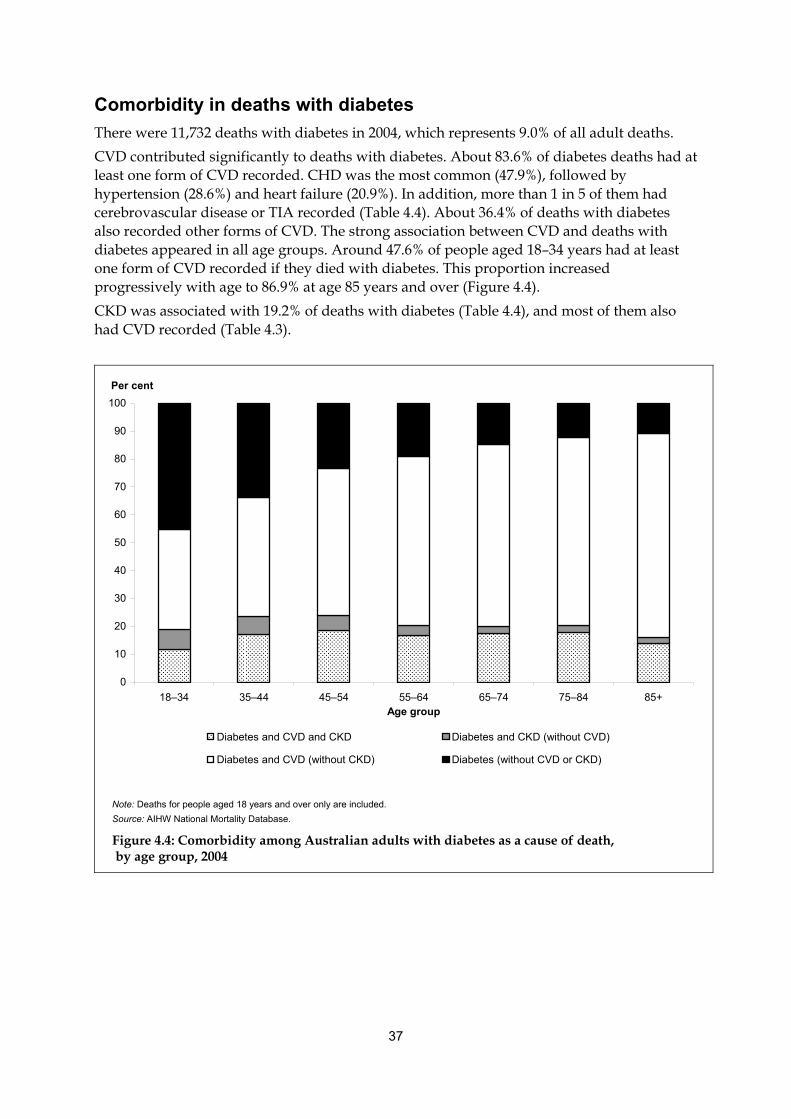
37
Comorbidity in deaths with diabetes There were 11,732 deaths with diabetes in 2004, which represents 9.0% of all adult deaths. CVD contributed significantly to deaths with diabetes. About 83.6% of diabetes deaths had at least one form of CVD recorded. CHD was the most common (47.9%), followed by hypertension (28.6%) and heart failure (20.9%). In addition, more than 1 in 5 of them had cerebrovascular disease or TIA recorded (Table 4.4). About 36.4% of deaths with diabetes also recorded other forms of CVD. The strong association between CVD and deaths with diabetes appeared in all age groups. Around 47.6% of people aged 18–34 years had at least one form of CVD recorded if they died with diabetes. This proportion increased progressively with age to 86.9% at age 85 years and over (Figure 4.4). CKD was associated with 19.2% of deaths with diabetes (Table 4.4), and most of them also had CVD recorded (Table 4.3).
0
10
20
30
40
50
60
70
80
90
100
18–34 35–44 45–54 55–64 65–74 75–84 85+Age group
Per cent
Diabetes and CVD and CKD Diabetes and CKD (without CVD)
Diabetes and CVD (without CKD) Diabetes (without CVD or CKD)
Note: Deaths for people aged 18 years and over only are included. Source: AIHW National Mortality Database.
Figure 4.4: Comorbidity among Australian adults with diabetes as a cause of death, by age group, 2004
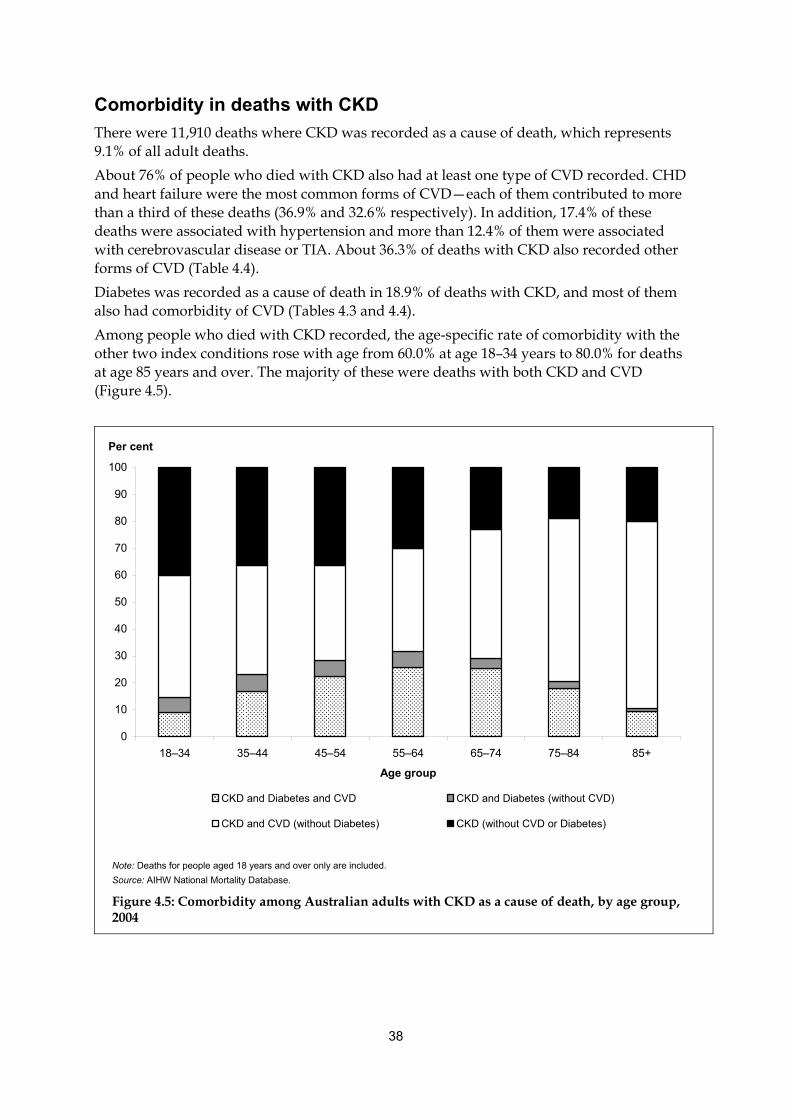
38
Comorbidity in deaths with CKD There were 11,910 deaths where CKD was recorded as a cause of death, which represents 9.1% of all adult deaths. About 76% of people who died with CKD also had at least one type of CVD recorded. CHD and heart failure were the most common forms of CVD—each of them contributed to more than a third of these deaths (36.9% and 32.6% respectively). In addition, 17.4% of these deaths were associated with hypertension and more than 12.4% of them were associated with cerebrovascular disease or TIA. About 36.3% of deaths with CKD also recorded other forms of CVD (Table 4.4). Diabetes was recorded as a cause of death in 18.9% of deaths with CKD, and most of them also had comorbidity of CVD (Tables 4.3 and 4.4). Among people who died with CKD recorded, the age-specific rate of comorbidity with the other two index conditions rose with age from 60.0% at age 18–34 years to 80.0% for deaths at age 85 years and over. The majority of these were deaths with both CKD and CVD (Figure 4.5).
0
10
20
30
40
50
60
70
80
90
100
18–34 35–44 45–54 55–64
Age gr
Per cent
65–74 75–84 85+
oup
CKD and Diabetes and CVD CKD and Diabetes (without CVD)
CKD and CVD (without Diabetes) CKD (without CVD or Diabetes)
Note: Deaths for people aged 18 years and over only are included. Source: AIHW National Mortality Database.
Figure 4.5: Comorbidity among Australian adults with CKD as a cause of death, by age group, 2004
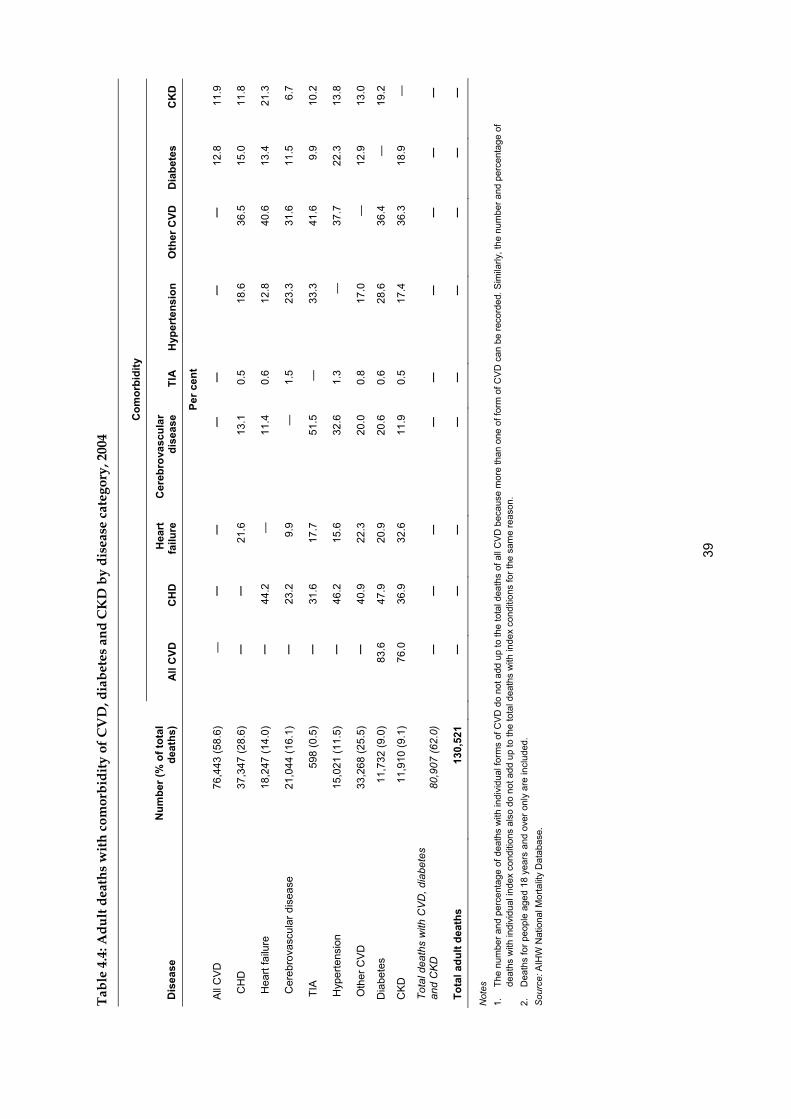
39
Tabl
e 4.
4: A
dult
deat
hs w
ith c
omor
bidi
ty o
f CV
D, d
iabe
tes
and
CK
D b
y di
seas
e ca
tego
ry, 2
004
Com
orbi
dity
Dis
ease
N
umbe
r (%
of t
otal
de
aths
)
on
es
A
ll C
VD
CH
D
Hea
rt
failu
re
Cer
ebro
vasc
ular
di
seas
e TI
AH
yper
tens
iO
ther
CVD
D
iabe
tC
KD
Pe
r cen
t
All
CV
D
76,4
43 (5
8.6)
—
—
—
—
—
—
—
12.8
11
.9
CH
D
37,3
47 (2
8.6)
—
—
21.6
13
.1
0.5
18.6
36
.5
15.0
11
.8
Hea
rt fa
ilure
18
,247
(14.
0)
—
44
.2
—
11.4
0.
6 12
.8
40.6
13
.4
21.3
Cer
ebro
vasc
ular
dis
ease
21
,044
(16.
1)
—
23
.2
9.9
—
1.5
23.3
31
.6
11.5
6.
7
TIA
59
8 (0
.5)
—
31
.6
17.7
51
.5
—
33.3
41
.6
9.9
10.2
Hyp
erte
nsio
n 15
,021
(11.
5)
—
46
.2
15.6
32
.6
1.3
—
37.7
22
.3
13.8
Oth
er C
VD
33
,268
(25.
5)
—
40
.9
22.3
20
.0
0.8
17.0
—
12
.9
13.0
Dia
bete
s 11
,732
83.6
47
.9
20.9
20
.6
36.4
—
19
.2
)
76.0
36
.9
11.9
17
.4
36.3
18
.9
—
(9.0
) 0.
6 28
.6
CK
D
11,9
10 (9
.132
.6
0.5
Tota
l dea
ths
with
CV
D, d
iabe
tes
and
CK
D
80,9
07 (6
2.0)
—
—
—
—
—
—
—
—
—
Tota
l adu
lt de
aths
13
0,52
1
—
—
—
—
—
—
—
—
—
Not
es
1.
The
num
ber a
nd p
erce
ntag
e of
dea
ths
with
indi
vidu
al fo
rms
of C
VD
do
not a
dd u
p to
the
tota
l dea
ths
of a
ll C
VD
bec
ause
mor
e th
an o
ne o
f for
m o
f CV
D c
an b
e re
cord
ed. S
imila
rly, t
he n
umbe
r and
per
cent
age
of
deat
hs w
ith in
divi
dual
inde
x co
nditi
ons
also
do
not a
dd u
p to
the
tota
l dea
ths
with
inde
x co
nditi
ons
for t
he s
ame
reas
on.
2.
Dea
ths
for p
eopl
e ag
ed 1
8 ye
ars
and
over
onl
y ar
e in
clud
ed.
Sou
rce:
AIH
W N
atio
nal M
orta
lity
Dat
abas
e.
40
5 Discussion
The purpose of this report is to assess the extent of comorbidity of CVD, diabetes and CKD in Australia, and to provide background information for further investigations. We have investigated the extent of these comorbidities in the general population, in hospital separations and in death records. We have also examined differences in the distribution of these comorbidities among age groups, sexes and in the context of each individual disease.
Extent of comorbidity • Overall, 417,563 (2.9%) Australian adults not living in institutions had both CVD and
diabetes in 2004–05. • In 2003, 14,722 (8.1%) adults in institutions, such as nursing homes and aged care
hostels, had both CVD and diabetes. • Comorbidities of two or more index conditions (CVD, diabetes and CKD) were found in
365,245 (6.6%) non-dialysis hospital separations for adults in 2004–05. • Comorbidity of two or more index conditions (CVD, diabetes and CKD) were recorded
as causes of death for 17,239 (13.2%) people who died in 2004. As discussed in the introduction to this report, there are a number of causes that can lead to this association. One of the major causes is shared common risk factors, such as poor nutrition, overweight and obesity, physical inactivity, smoking and high blood cholesterol. These risk factors do not just affect the onset of CVD, diabetes and CKD, but also accelerate their progression and increase the risk of complications. All these risk factors are common in the Australian population. Based on self-reported data, nearly 97% of adults had at least one of these risk factors in 2004–05: 54% were overweight or obese, 46% did not eat enough fruit, 34% had very low levels of physical activity, 21% were daily smokers, and 9% had high blood cholesterol (AIHW 2006b). About 44% of Australian adults had multiple risk factors (AIHW 2006b). Moreover, it has been estimated that 19% of Australians aged 25 years and over have metabolic syndrome, and are at high risk of developing CVD, diabetes, CKD and their complications (Zimmet et al. 2005). For people with a single disease, adequate treatment and disease management are essential to prevent or delay the onset of its complications. This is especially important for preventing comorbidity of CVD, diabetes and CKD. However, there is substantial evidence that many people with these conditions do not achieve recommended treatment targets. Results from the 1999–2000 Australian Diabetes, Obesity and Lifestyle (AusDiab) study suggested that only half the participants met the individual blood sugar, lipid and blood pressure targets recommended at the time of the survey, and only about 1 in 7 met all three targets (Kemp et al. 2005). This survey also showed that over 53% of people with hypertension were untreated and only 19% had their blood pressure controlled (Briganti et al. 2003). The National Evaluation of the Frequency of Renal Impairment Co-existing with Non-insulin dependent diabetes mellitus (NEFRON) study showed that for more than 75% of patients with Type 2 diabetes, their GP did not routinely monitor their kidney function (Thomas et al. 2006). In this report, we also found that the observed rate of these comorbidities greatly exceeded the expected rates if they happened by chance alone. The excess observed rate of
41
comorbidity occurred in the general population, as well as in hospitalisations and deaths. These results suggest that the coexistence of these diseases did not occur by chance and is mainly attributed to a strong association between the individual diseases. The causes of this association could be prevented by controlling common risk factors and by improving disease treatment and management. This could potentially reduce a great proportion of these comorbidities in the Australian population and a large number of hospitalisations and deaths associated with these comorbidities. In 2006, Australian governments agreed on the first National Chronic Disease Strategy (NCDS) to provide national policy directions for improving chronic disease prevention and care across Australia for the next 5 to 10 years. The NCDS indicates that health promotion and risk reduction interventions are not just for healthy people, but are also relevant across the disease continuum and benefit people who are at risk of chronic disease, or living with these diseases. The NCDS also emphasises that it is essential to provide integration and continuity of prevention and care to ensure that people receive all the services they need in a timely manner, thus maximising their health outcomes (NHPAC 2006). The findings in this report again highlight the importance of disease prevention and management that are identified by the NCDS. It is important to note that the extent of these comorbidities may vary between different population groups, such as those with disabilities, Indigenous people and people in different socio-economic groups. Examining these differences is very important to identify high-risk groups and to formulate effective and targeted health policies to reduce the disease burden. This is an area for future work.
Comorbidity in different age groups, and its impact on health services and health policy The prevalence rate of comorbidity increased progressively with age before age 65 years, and then rose sharply in the 65 to 74 years age group. This rate remained high after age 75 years, although there was a slight decline. The decrease in prevalence rates in this age group is possibly due to the effect of ‘better survival’—most people with severe diseases are likely to die earlier, and therefore, people who survive to over 75 years (especially over 85 years) tend to be healthier. The overall pattern of distribution of comorbidity by age was consistent in the non-institutionalised population, the institutionalised population, hospitalisations and deaths. A continuing high prevalence rate of comorbidity among people aged 65 years and over would have a substantial impact on the Australian health system. The Australian population is ageing rapidly. According to the ABS, there were an estimated 2.4 million Australians aged 65 years and over at 30 June 2001 (ABS 2002). The ABS projected that the size of this group will increase to more than 4.2 million people by 2021 (ABS 2000). As the prevalence of CVD, diabetes and CKD, as well as many other chronic conditions, increases with age, this demographic trend leads to an increase in the size of the population with these diseases and at risk of comorbidity. Therefore, the number of people with comorbidity in the Australian population, as well as among those seeking health services, would increase quickly even if the prevalence rate of comorbidity does not rise above the current level in the future.
42
This increase will become a challenge to health services, health expenditure and policies. Studies have found that comorbidity is associated with greater use of health services, including more visits to GPs and specialists, longer consultation times, more hospital admissions and longer stay in hospital. In addition, people with comorbidities also have special health care needs. Unlike people with a single disease, disease management for people with multiple conditions needs to focus on several conditions at the same time. The interactions between multiple medications and therapies required for different diseases complicate treatment and may increase the risk of side effects. To meet such complex health care needs, health services not only need to increase in number, but require better coordination between health care professionals. Although the age-specific rates of comorbidity were much lower among younger people, the young made a big contribution to the burden of these comorbidities in terms of the absolute number of cases because people in younger groups comprise a large proportion of the population. About 43% of people with comorbidities in the non-institutionalised population, and 30–40% of those hospitalised, were aged less than 65 years. To reduce the burden of comorbidity effectively, disease prevention and detection interventions and policies need to start from a young age and take a whole-of-life approach.
Differences between sexes Overall, the proportion of people with these comorbidities was greater among men than among women. In the younger age group, the prevalence of comorbidity was similar for both sexes, or only slightly higher for men. In the older age groups, prevalence rates among men were higher for all combinations of comorbidity studied. The higher proportion of comorbidity among men is in line with the greater prevalence of each individual disease in men. However, it is not clear if this is the full explanation.
Comorbidity in the context of each individual disease Studies have demonstrated that CVD is a major cause of morbidity and mortality for people with diabetes and CKD (Garcia et al. 1974, AIHW 2005). The results in this report are consistent with this finding. We found that the prevalence of CVD among people with diabetes was 2.5 times as high as in the general population (60.6% versus 23.9%). The risk of having comorbidity with some forms of CVD was even greater—people with diabetes were 3 to 5 times as likely to have hypertension, CHD, heart failure and cerebrovascular disease as the general population. We also found that over 65% of hospital separations with diabetes or CKD also involved CVD. CVD was recorded as a cause of death for over 75% of people who died with diabetes or CKD. These results suggest that CVD was very common among people with diabetes, and contributed largely to morbidity and mortality among people with diabetes and CKD. Diabetes and CKD lack specific symptoms in their early stages. For example, people with CKD may lose up to 85% of kidney function without manifestation. For this reason, the diagnosis of these diseases is often missed or delayed. In practice, some people with diabetes or CKD develop complications soon after these diseases are diagnosed. In some cases, they
43
already have complications when the diagnosis is made. Early detection is the key to preventing or delaying the development of CVD and other complications for these diseases. In addition, besides helping patients to achieve their recommended targets for individual diseases, health professionals should be vigilant for comorbidities from the early stage of these diseases, particularly in older patients. There is strong evidence that the risk of CVD can be reduced by appropriate management. For example, a large international study showed a 51% reduction in major cardiovascular events among people with diabetes when their blood pressure was controlled under 80 mmHg (Hansson et al. 1998). Compared with people with diabetes or CKD, the rate of comorbidities is relatively small among people with CVD. However, because a large number of people have CVD, comorbidity with diabetes and/or CKD account for many CVD cases. As both diabetes and CKD are major risk factors for CVD, there is the potential to prevent the occurrence of a number of CVD cases by reducing the number of cases of diabetes and CKD and their complications.
Comparison of comorbidity estimates from various data sources The presence of comorbidity generally indicates more advanced disease and worse health. Thus, we would expect more people with these comorbidities among those in institutions such as hospitals and nursing homes, and among those who died, compared with the general community. This hypothesis is supported by comparisons of the crude rates of comorbidity between the data sources used in this report (Table 5.1). These showed that comorbidity was more common in the institutionalised population compared with the non-institutionalised population. Similarly, comorbidity was greater in the hospital data compared with the non-institutionalised population and greater again in the mortality data. However, these differences were greatly reduced after the effect of differences in age structure was removed by age-standardising. The age-standardised rates indicate that the differences arising from the various data sources are related to differences in the age structure of the population represented in each data source. However, even with age-standardisation, there remains a pattern of greater comorbidity rates in hospitalisations compared with the non-institutionalised population and greater comorbidity rates in the deaths data compared with hospitalisations. Although such comparisons provide some indication of comorbidity in the various settings, with implications for our understanding of these diseases, the comparisons should be treated with caution for several reasons. Firstly, the data in these sources were collected in different ways—the prevalence of comorbidity in the non-institutionalised and institutionalised populations was drawn from self-reported survey data, while hospital and mortality data were drawn from administrative data. Secondly, there is a slight difference in time frame of the data sources: SDAC—2003, NHS—2004–05, AIHW National Hospital Morbidity Database—2004–05 and AIHW National Mortality Database—2004. In addition, there are overlaps between the populations that were recorded in these data sources, especially between the hospitalised population and both the institutionalised and non-institutionalised populations.
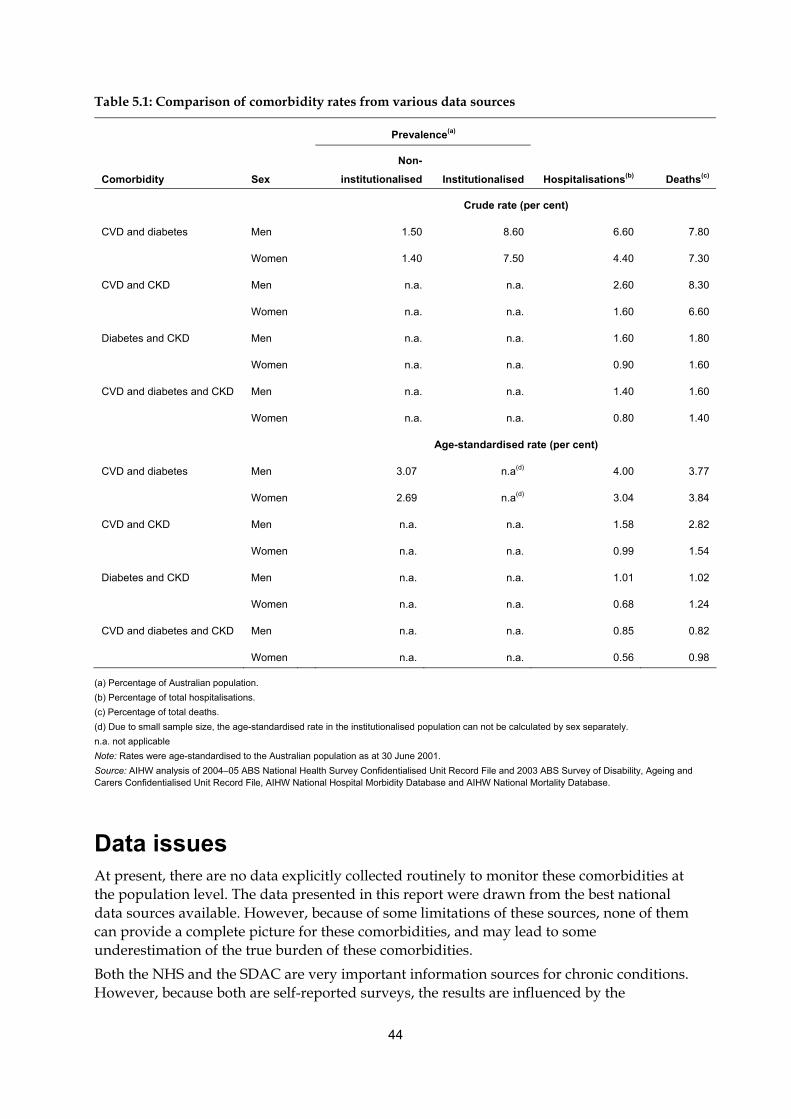
44
Table 5.1: Comparison of comorbidity rates from various data sources
Prevalence(a)
Comorbidity Sex
Non-
institutionalised Institutionalised Hospitalisations(b) Deaths(c)
Crude rate (per cent)
CVD and diabetes Men 1.50 8.60 6.60 7.80
Women 1.40 7.50 4.40 7.30
CVD and CKD Men n.a. n.a. 2.60 8.30
Women n.a. n.a. 1.60 6.60
Diabetes and CKD Men n.a. n.a. 1.60 1.80
Women n.a. n.a. 0.90 1.60
CVD and diabetes and CKD Men n.a. n.a. 1.40 1.60
Women n.a. n.a. 0.80 1.40
Age-standardised rate (per cent)
CVD and diabetes Men 3.07 n.a(d) 4.00 3.77
Women 2.69 n.a(d) 3.04 3.84
CVD and CKD Men n.a. n.a. 1.58 2.82
Women n.a. n.a. 0.99 1.54
Diabetes and CKD Men n.a. n.a. 1.01 1.02
Women n.a. n.a. 0.68 1.24
CVD and diabetes and CKD Men n.a. n.a. 0.85 0.82
Women n.a. n.a. 0.56 0.98
(a) Percentage of Australian population. (b) Percentage of total hospitalisations. (c) Percentage of total deaths. (d) Due to small sample size, the age-standardised rate in the institutionalised population can not be calculated by sex separately. n.a. not applicable Note: Rates were age-standardised to the Australian population as at 30 June 2001. Source: AIHW analysis of 2004–05 ABS National Health Survey Confidentialised Unit Record File and 2003 ABS Survey of Disability, Ageing and Carers Confidentialised Unit Record File, AIHW National Hospital Morbidity Database and AIHW National Mortality Database.
Data issues At present, there are no data explicitly collected routinely to monitor these comorbidities at the population level. The data presented in this report were drawn from the best national data sources available. However, because of some limitations of these sources, none of them can provide a complete picture for these comorbidities, and may lead to some underestimation of the true burden of these comorbidities. Both the NHS and the SDAC are very important information sources for chronic conditions. However, because both are self-reported surveys, the results are influenced by the
45
questionnaires used, and the knowledge and the awareness of specific conditions in the population. Self-reported data may underestimate the prevalence of diabetes especially, as some people with diabetes do not know they have the condition and therefore would not report it. Moreover, the prevalence of CKD is not available from either survey. The AIHW National Hospital Morbidity Database provides essential information regarding morbidity and hospital services in Australia. However, because records are based on hospitalisations (episodes of care) rather than individual patients, the database cannot identify whether records relate to different patients or to a single patient with more than one episode of care. In addition, CVD and CKD may not be recorded in hospital records if they are not thought to affect that episode of hospital care. As a consequence, the results of the analysis may underestimate hospitalisations with comorbidity involving these two diseases. There may also be a lack of consistency in coding practices between jurisdictions and over time, making the monitoring of these comorbidities more difficult. The AIHW National Mortality Database includes information on virtually all deaths. However, the data only represents the proportion of comorbidity as a cause of death, rather than the magnitude of comorbidity among people who have died. In addition, studies have shown that some diseases, such as CKD, were under-recorded in death certificates (Li et al. 2003). There is no integrated health database that can track patients across different health services and over time. It is impossible to know for how long the comorbidity has developed from the onset of a single disease, how patients with comorbidity are managed, and what are the outcomes of disease management. All these questions are critical to the monitoring and surveillance of comorbidity. As the burden of these comorbidities is expected to rise, the monitoring of these comorbidities is very important in terms of providing evidence for health policies and the appropriate level and combination of services to meet population needs. The gaps and limitations of the existing data sources suggest a need to improve information systems.
Conclusion We found that CVD, diabetes and CKD coexisted in a considerable proportion of the Australian population. Comorbidity of these conditions especially affected older people, and men were at higher risk of these comorbidities than women. CVD was very common among people with diabetes, and contributed greatly to morbidity and mortality among people with diabetes and CKD. These comorbidities are largely attributed to shared risk factors and complex causal relationships between these diseases. There is a large potential to reduce the burden of these comorbidities by improving disease prevention and management. With our rapidly ageing population, Australian health systems need to be prepared to meet an increasing demand on health services from people with comorbidities, and to promote high quality and coordinated health care for these people.
46
Appendix 1: Statistical methods
Age standardisation This is a method for removing the influence of age when comparing populations with different age structures. Age-standardised rates in this report were calculated using direct age-standardisation. The directly age-standardised rate is the weighted sum of age-specific (5-year age groups) rates, where the weighting factor is the corresponding age-specific standard population. For this report, the Australian estimated residential population as at 30 June 2004 was used as the standard population. The same population was used for men and women to allow valid comparison of age-standardised rates between the sexes.
Direct age standardisation Direct age standardisation is the most common method of age standardisation, and is used in this report for prevalence, hospitalisations and deaths data. This method of age-standardisation is generally used when the population under study is large and the age-specific rates can be reliably estimated. The calculation of direct age-standardised rates comprises three steps: Step 1: Calculate the age-specific rate for each age group. Step 2: Calculate the expected number of cases in each age group by multiplying the age-
specific rate by the corresponding standard population for each age group. Step 3: Sum the expected number of cases in each age group and divide this sum by the total
of the standard population to give the age-standardised rate.
Prevalence Prevalence refers to the number (of cases, instances, and so on) present in a population at a given time.
Odds ratio and logistic regression Odds ratios in this report are calculated using logistic regression models. They are used in this report to estimate the difference in the distribution of comorbidities between age groups and between sexes after adjusting for interactions between sex and age. For example: the odds ratio of comorbidity of CVD and diabetes from men to women was 1.32, meaning that men were 1.32 times as likely as women to have comorbidity of CVD and diabetes if the male and female populations had the same age structure.
47
Expected rate, observed rate and ratio Any two diseases may occur in the same person by chance. The expected comorbidity rate is the rate that we would expect to see if the two diseases occurred together purely by chance. The observed comorbidity rate is the actual rate calculated from the number of cases of comorbidity that occurred in the population. The ratio of observed rate to expected rate is a measure of how much the observed rate differs from the expected rate. If the ratio is greater than one, then there are more cases of comorbidity than would be expected by chance (van den Akker M et al. 2001). In this report, the ratio of observed rate to expected rate is assessed using a 95% confidence interval. If the lower limit of the 95% confidence interval is greater than one, then the ratio is statistically significantly greater than one and we can conclude that the number of cases of comorbidity is greater than could be explained purely by chance. Expected rate: When two diseases occur together by chance, their expected comorbidity rate is the product of their individual rates. For example: Expected hospitalisation rate for comorbidity of CVD and diabetes (with and without CKD) = hospitalisation rate of CVD (21.0%) × hospitalisation rate of diabetes (8.3%) × 100 = 1.74% Observed rate: This rate is calculated based on the actual number of cases of comorbidity that occurred in the population. For example: Observed number of hospitalisations with comorbidity of CVD and diabetes (with CKD) = 60,415 Observed number of hospitalisations with comorbidity of CVD and diabetes (without CKD) = 241,187 Observed number of hospitalisations with comorbidity of CVD and diabetes = 60,415 + 241,187 = 301,602 Total hospitalisations = 5,473,337 Observed hospitalisation rate with comorbidity of CVD and diabetes = 301,602/5,573,337 = 5.41% Ratio of observed rate to expected rate = observed rate (5.41%) / expected rate (1.74%) = 3.10 95% confidence interval of the ratio of observed rate to expected rate for hospitalisation and mortality: If D is the observed number of events and E is the expected number of events, then
( ) ( ) ( )
3
2/1
3
2/1 1396.1
19111
396.1
911 ⎟⎟
⎠
⎞⎜⎜⎝
⎛
++
+−+=⎟
⎠⎞
⎜⎝⎛ −−=
DDDand
DDD UL μμ
are the upper and lower limits of the 95% confidence interval around the observed number of events (Breslow & Day 1987). If N is the total population, then the ratio of the observed to the expected rate is
ED
NEND
=//
48
The expected rate is assumed to be constant, so the 95% confidence interval of the ratio of observed rate to expected rate will be
⎥⎦⎤
⎢⎣⎡
EEUL μμ ,
95% confidence interval of the ratio of observed rate to expected rate for 2004–05 NHS and 2003 SDAC: The above formula is not applicable to estimates arising from a sample survey because it does not take account of the variability arising from the sampling process and the survey design. Instead the confidence interval is based on the survey standard errors as published by ABS (ABS 2006c). The ABS publishes a table of standard errors for selected values of estimates from the survey. The standard error of the estimated observed number (SE(a)) in the formula below is calculated by interpolating between adjacent values in the published standard error table. If D is the estimated observed number of events, DL and DU are adjacent numbers in the ABS standard error table, and lower SE(b) and upper SE(b) are their associated published standard errors, then
SE(a) = lower SE(b) + ((DLDUDLD−− ) x (upper SE(b) – lower SE(b)))
and
SE(a)96.1SE(a)96.1 xDandxD UL +=−= μμ
are the upper and lower limits of the 95% confidence interval around the observed number of events. If N is the total population and E is the estimated expected number of events, then the ratio of the observed to the expected rate is
ED
NEND
=//
The expected rate is assumed to be constant, so the 95% confidence interval of the ratio of observed rate to expected rate will be
⎥⎦⎤
⎢⎣⎡
EEUL μμ ,
49
Appendix 2: Classification of CVD, diabetes and CKD
Cause of death and diagnosis of hospitalisation Australia uses the International Statistical Classification of Diseases and Related Health Problems, Tenth Revision (ICD-10) to code causes of death. The diagnoses associated with hospitalisations are coded according to the 10th revision of the International Classification of Diseases, Australian Modification (ICD-10-AM). For this report we used extended ICD–10 and ICD–10 AM codes to identify people with CVD, diabetes and CKD. Although some of these codes are not currently classified as diseases of the circulatory system, diabetes or diseases of the urinary system in ICD–10 or ICD–10 AM, the codes are recommended as appropriate and helpful to improve accuracy of identification of people with comorbidity by experts in the field. These codes are listed in Table A1. Comorbidity is identified if two or more index conditions were recorded as diagnoses in one hospital separation or as the cause of death in one death certificate. Conditions can be recorded as separate diagnoses or causes of death, or they can be recorded in one diagnosis or cause of death that contains two diseases, such as ‘diabetic renal complications’.
Long-term conditions in the 2004–05 NHS and the 2003 SDAC A long-term condition in the 2004-05 NHS is defined as ‘one reported by respondents as being a condition which they currently had and which had lasted or they expected to last for six months or more’. Some reported conditions were assumed to be long-term, including diabetes, rheumatic heart disease, heart attack and stroke. Long-term conditions in the 2004–05 NHS were classified based on ICD-10 and were coded using the 2004–05 NHS confidentialised unit record file (CURF) codes (ABS 2006b). The CURF codes used to identify people with diabetes and CVD in the non-institutionalised population based on 2004–05 NHS are listed in the Table A2. In the 2003 SDAC, a long-term condition is defined as ‘a disease or disorder which has lasted or is likely to last for at least six months; or a disease, disorder or event (such as stroke, poisoning, accident, and so on), which produces an impairment or restriction which has lasted or is likely to last for at least six months’. The long-term conditions in the 2003 SDAC were classified based on ICD-10 and were coded using the 2003 SDAC CURF codes (ABS 2005). The CURF codes used to identify people with diabetes and CVD in the institutionalised population based on 2003 SDAC are listed in Table A3. Comorbidity is identified if a respondent reported they had both CVD and diabetes as long-term conditions.
50
Appendix 3: Codes used in this report
Table A1: Codes for deaths and hospital separations used in this report
Disease ICD–10/ ICD–10 AM code Description
CVD
CHD I20–I25 Ischaemic heart disease
Heart failure I50 Heart failure
I110 Hypertensive heart disease with (congestive) heart failure
I130 Hypertensive heart and renal disease with (congestive) heart
I132 Hypertensive heart and renal disease with (congestive) heart
I25.5 Ischaemic cardiomyopathy
I42.0 Dilated cardiomyopathy
I42.6 Alcoholic cardiomyopathy
Cerebrovascular
disease I60–I69 Cerebrovascular disease
TIA G45 Transient cerebral ischaemic attacks and related syndromes
Hypertensive
diseases I10 Essential (primary) hypertension
I119 Hypertensive heart disease without (congestive) heart failure
I12 Hypertensive renal disease
I131 Hypertensive heart and renal disease with renal failure
I139 Hypertensive heart and renal disease, unspecified
Other CVD I00–I02 Acute rheumatic fever
I05–I09 Chronic rheumatic heart diseases
I26 –I28 Pulmonary heart disease and diseases of pulmonary
I30–I52 Other forms of heart disease
I70– I79 Diseases of arteries, arterioles and capillaries
I80–I89
Diseases of veins, lymphatic vessels and lymph nodes, not
elsewhere classified
I95–I99 Other and unspecified disorders of the circulatory system
E10.5, E11.5, E13.5, E14.5 Diabetes with peripheral circulatory complications
E10.71, E11.71, E13.71, E14.71 Diabetes with multiple microvascular complications
(continued)
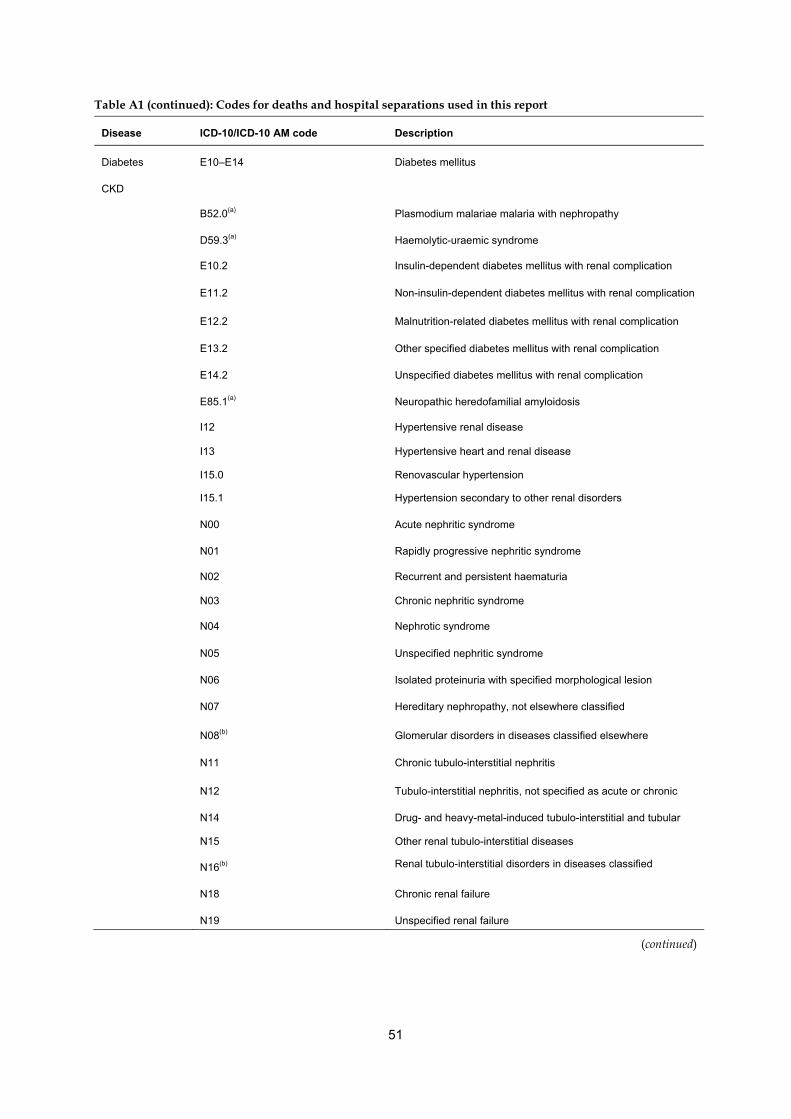
51
Table A1 (continued): Codes for deaths and hospital separations used in this report
Disease ICD-10/ICD-10 AM code Description
Diabetes E10–E14 Diabetes mellitus
CKD
B52.0(a) Plasmodium malariae malaria with nephropathy
D59.3(a) Haemolytic-uraemic syndrome
E10.2 Insulin-dependent diabetes mellitus with renal complication
E11.2 Non-insulin-dependent diabetes mellitus with renal complication
E12.2 Malnutrition-related diabetes mellitus with renal complication
E13.2 Other specified diabetes mellitus with renal complication
E14.2 Unspecified diabetes mellitus with renal complication
E85.1(a) Neuropathic heredofamilial amyloidosis
I12 Hypertensive renal disease
I13 Hypertensive heart and renal disease
I15.0 Renovascular hypertension
I15.1 Hypertension secondary to other renal disorders
N00 Acute nephritic syndrome
N01 Rapidly progressive nephritic syndrome
N02 Recurrent and persistent haematuria
N03 Chronic nephritic syndrome
N04 Nephrotic syndrome
N05 Unspecified nephritic syndrome
N06 Isolated proteinuria with specified morphological lesion
N07 Hereditary nephropathy, not elsewhere classified
N08(b) Glomerular disorders in diseases classified elsewhere
N11 Chronic tubulo-interstitial nephritis
N12 Tubulo-interstitial nephritis, not specified as acute or chronic
N14 Drug- and heavy-metal-induced tubulo-interstitial and tubular
N15 Other renal tubulo-interstitial diseases
N16(b) Renal tubulo-interstitial disorders in diseases classified
N18 Chronic renal failure
N19 Unspecified renal failure
(continued)
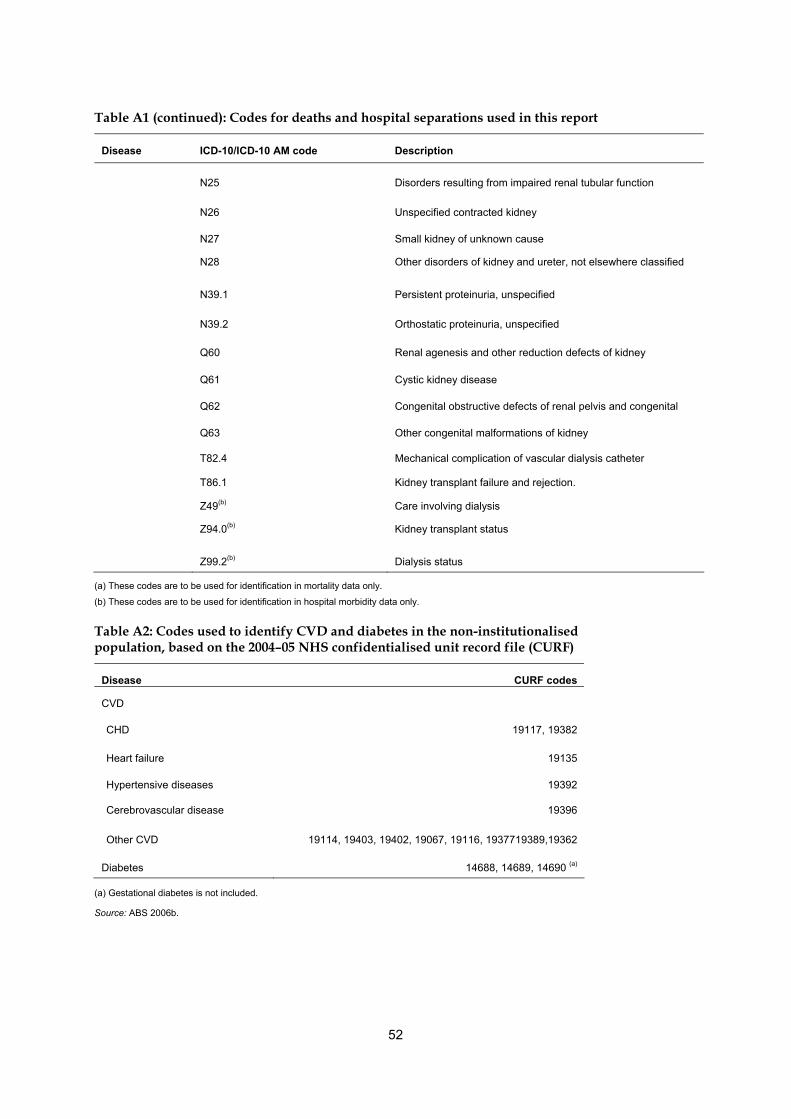
52
Table A1 (continued): Codes for deaths and hospital separations used in this report
Disease ICD-10/ICD-10 AM code Description
N25 Disorders resulting from impaired renal tubular function
N26 Unspecified contracted kidney
N27 Small kidney of unknown cause
N28 Other disorders of kidney and ureter, not elsewhere classified
N39.1 Persistent proteinuria, unspecified
N39.2 Orthostatic proteinuria, unspecified
Q60 Renal agenesis and other reduction defects of kidney
Q61 Cystic kidney disease
Q62 Congenital obstructive defects of renal pelvis and congenital
Q63 Other congenital malformations of kidney
T82.4 Mechanical complication of vascular dialysis catheter
T86.1 Kidney transplant failure and rejection.
Z49(b) Care involving dialysis
Z94.0(b) Kidney transplant status
Z99.2(b) Dialysis status
(a) These codes are to be used for identification in mortality data only.
(b) These codes are to be used for identification in hospital morbidity data only.
Table A2: Codes used to identify CVD and diabetes in the non-institutionalised population, based on the 2004–05 NHS confidentialised unit record file (CURF)
Disease CURF codes
CVD
CHD 19117, 19382
Heart failure 19135
Hypertensive diseases 19392
Cerebrovascular disease 19396
Other CVD 19114, 19403, 19402, 19067, 19116, 1937719389,19362
Diabetes 14688, 14689, 14690 (a)
(a) Gestational diabetes is not included.
Source: ABS 2006b.
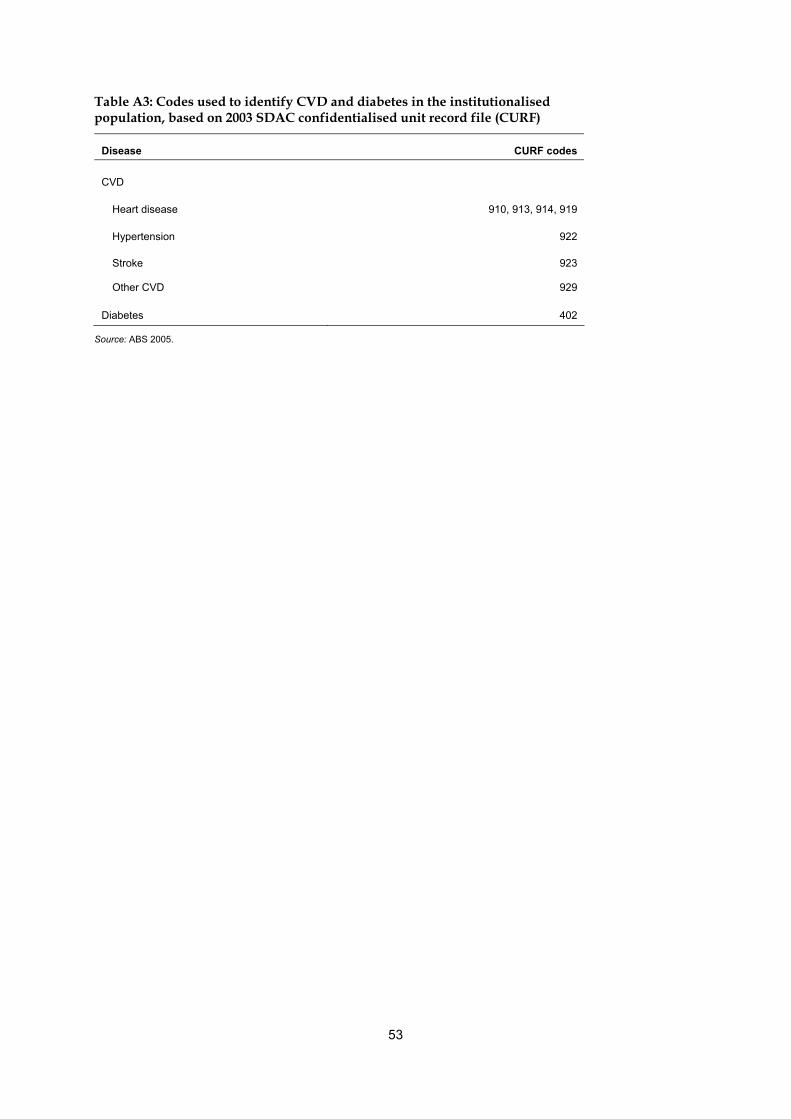
53
Table A3: Codes used to identify CVD and diabetes in the institutionalised population, based on 2003 SDAC confidentialised unit record file (CURF)
Disease CURF codes
CVD
Heart disease 910, 913, 914, 919
Hypertension 922
Stroke 923
Other CVD 929
Diabetes 402
Source: ABS 2005.
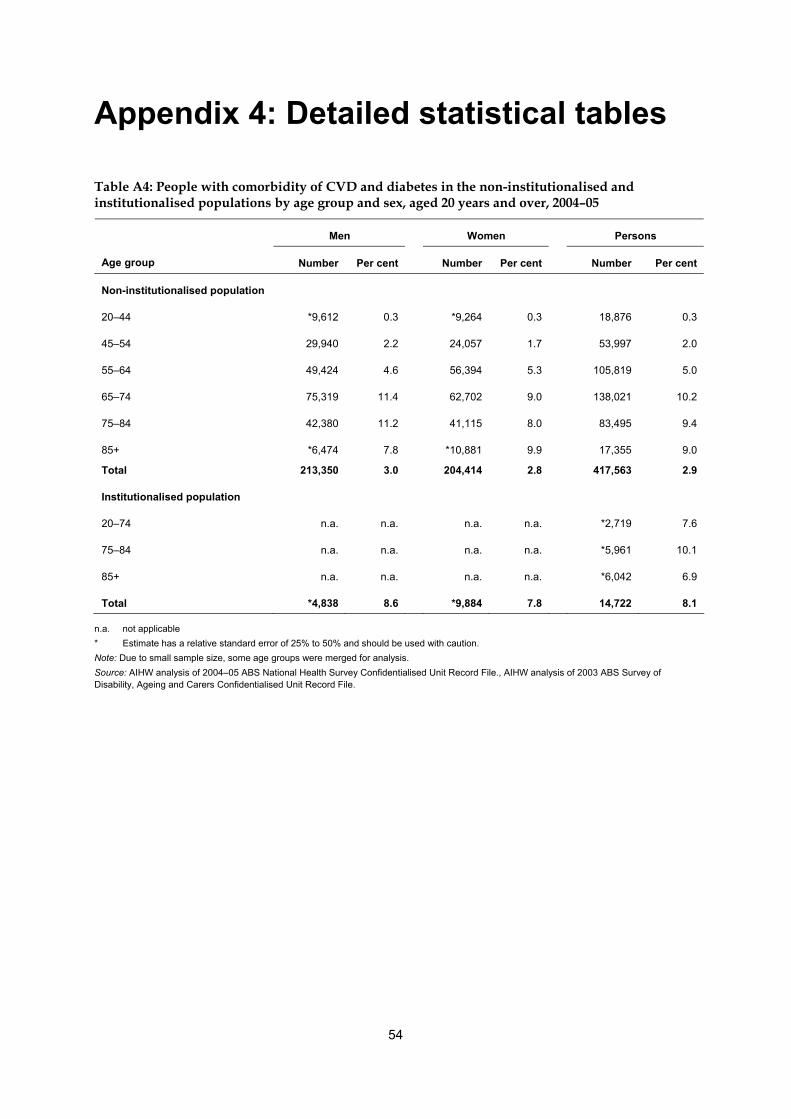
54
Appendix 4: Detailed statistical tables
Table A4: People with comorbidity of CVD and diabetes in the non-institutionalised and institutionalised populations by age group and sex, aged 20 years and over, 2004–05
Men Women Persons
Age group Number Per cent Number Per cent Number Per cent
Non-institutionalised population
20–44 *9,612 0.3 *9,264 0.3 18,876 0.3
45–54 29,940 2.2 24,057 1.7 53,997 2.0
55–64 49,424 4.6 56,394 5.3 105,819 5.0
65–74 75,319 11.4 62,702 9.0 138,021 10.2
75–84 42,380 11.2 41,115 8.0 83,495 9.4
85+ *6,474 7.8 *10,881 9.9 17,355 9.0
Total 213,350 3.0 204,414 2.8 417,563 2.9
Institutionalised population
20–74 n.a. n.a. n.a. n.a. *2,719 7.6
75–84 n.a. n.a. n.a. n.a. *5,961 10.1
85+ n.a. n.a. n.a. n.a. *6,042 6.9
Total *4,838 8.6 *9,884 7.8 14,722 8.1
n.a. not applicable * Estimate has a relative standard error of 25% to 50% and should be used with caution. Note: Due to small sample size, some age groups were merged for analysis. Source: AIHW analysis of 2004–05 ABS National Health Survey Confidentialised Unit Record File., AIHW analysis of 2003 ABS Survey of Disability, Ageing and Carers Confidentialised Unit Record File.
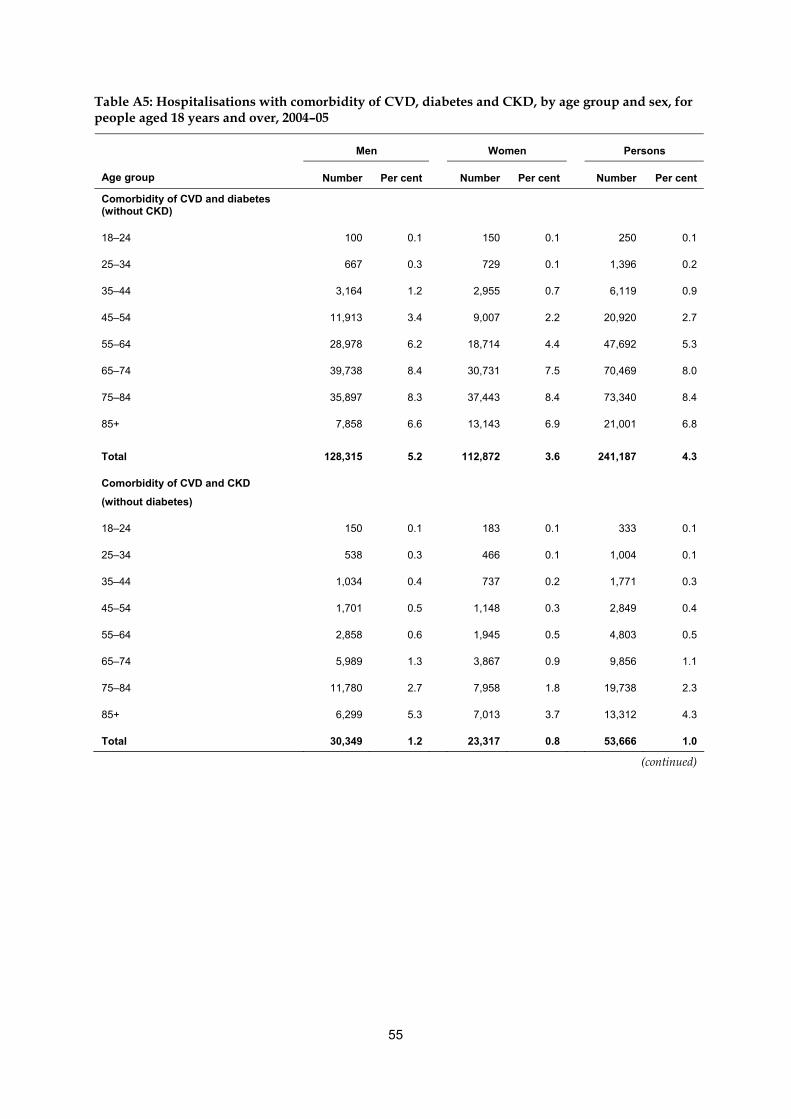
55
Table A5: Hospitalisations with comorbidity of CVD, diabetes and CKD, by age group and sex, for people aged 18 years and over, 2004–05
Men Women Persons
Age group Number Per cent Number Per cent Number Per cent
Comorbidity of CVD and diabetes (without CKD)
18–24 100 0.1 150 0.1 250 0.1
25–34 667 0.3 729 0.1 1,396 0.2
35–44 3,164 1.2 2,955 0.7 6,119 0.9
45–54 11,913 3.4 9,007 2.2 20,920 2.7
55–64 28,978 6.2 18,714 4.4 47,692 5.3
65–74 39,738 8.4 30,731 7.5 70,469 8.0
75–84 35,897 8.3 37,443 8.4 73,340 8.4
85+ 7,858 6.6 13,143 6.9 21,001 6.8
Total 128,315 5.2 112,872 3.6 241,187 4.3
Comorbidity of CVD and CKD
(without diabetes)
18–24 150 0.1 183 0.1 333 0.1
25–34 538 0.3 466 0.1 1,004 0.1
35–44 1,034 0.4 737 0.2 1,771 0.3
45–54 1,701 0.5 1,148 0.3 2,849 0.4
55–64 2,858 0.6 1,945 0.5 4,803 0.5
65–74 5,989 1.3 3,867 0.9 9,856 1.1
75–84 11,780 2.7 7,958 1.8 19,738 2.3
85+ 6,299 5.3 7,013 3.7 13,312 4.3
Total 30,349 1.2 23,317 0.8 53,666 1.0
(continued)
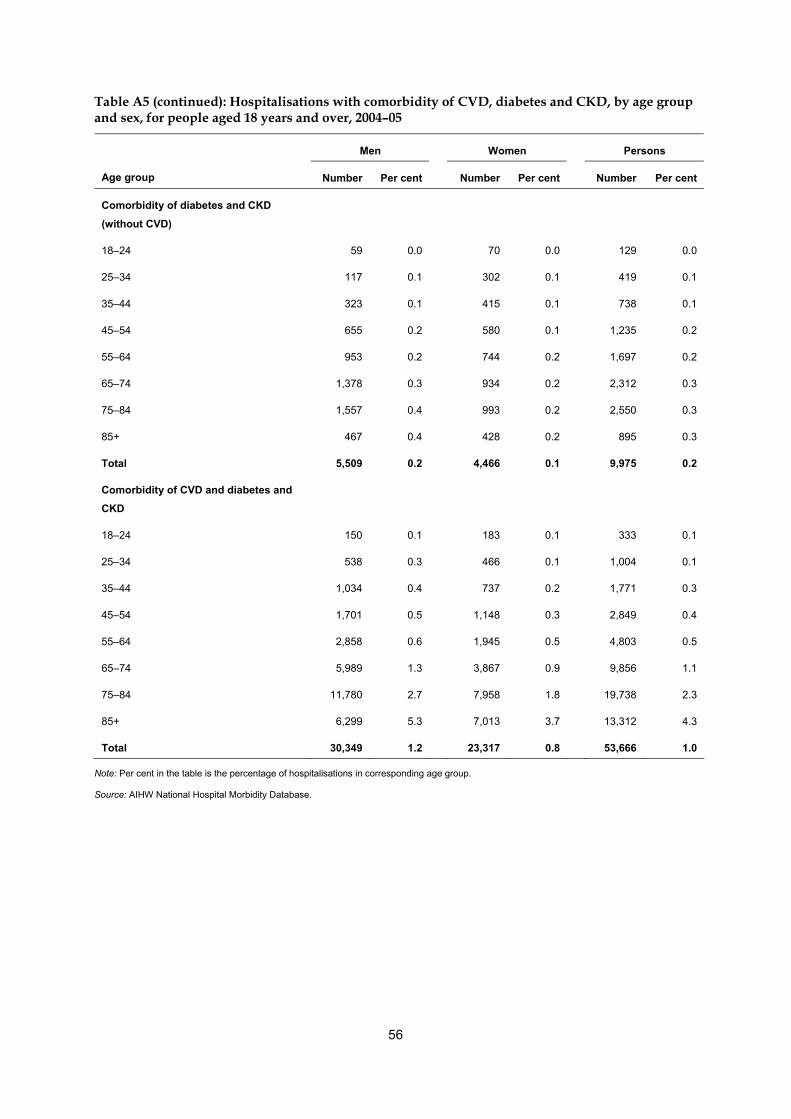
56
Table A5 (continued): Hospitalisations with comorbidity of CVD, diabetes and CKD, by age group and sex, for people aged 18 years and over, 2004–05
Men Women Persons
Age group Number Per cent Number Per cent Number Per cent
Comorbidity of diabetes and CKD
(without CVD)
18–24 59 0.0 70 0.0 129 0.0
25–34 117 0.1 302 0.1 419 0.1
35–44 323 0.1 415 0.1 738 0.1
45–54 655 0.2 580 0.1 1,235 0.2
55–64 953 0.2 744 0.2 1,697 0.2
65–74 1,378 0.3 934 0.2 2,312 0.3
75–84 1,557 0.4 993 0.2 2,550 0.3
85+ 467 0.4 428 0.2 895 0.3
Total 5,509 0.2 4,466 0.1 9,975 0.2
Comorbidity of CVD and diabetes and
CKD
18–24 150 0.1 183 0.1 333 0.1
25–34 538 0.3 466 0.1 1,004 0.1
35–44 1,034 0.4 737 0.2 1,771 0.3
45–54 1,701 0.5 1,148 0.3 2,849 0.4
55–64 2,858 0.6 1,945 0.5 4,803 0.5
65–74 5,989 1.3 3,867 0.9 9,856 1.1
75–84 11,780 2.7 7,958 1.8 19,738 2.3
85+ 6,299 5.3 7,013 3.7 13,312 4.3
Total 30,349 1.2 23,317 0.8 53,666 1.0
Note: Per cent in the table is the percentage of hospitalisations in corresponding age group.
Source: AIHW National Hospital Morbidity Database.
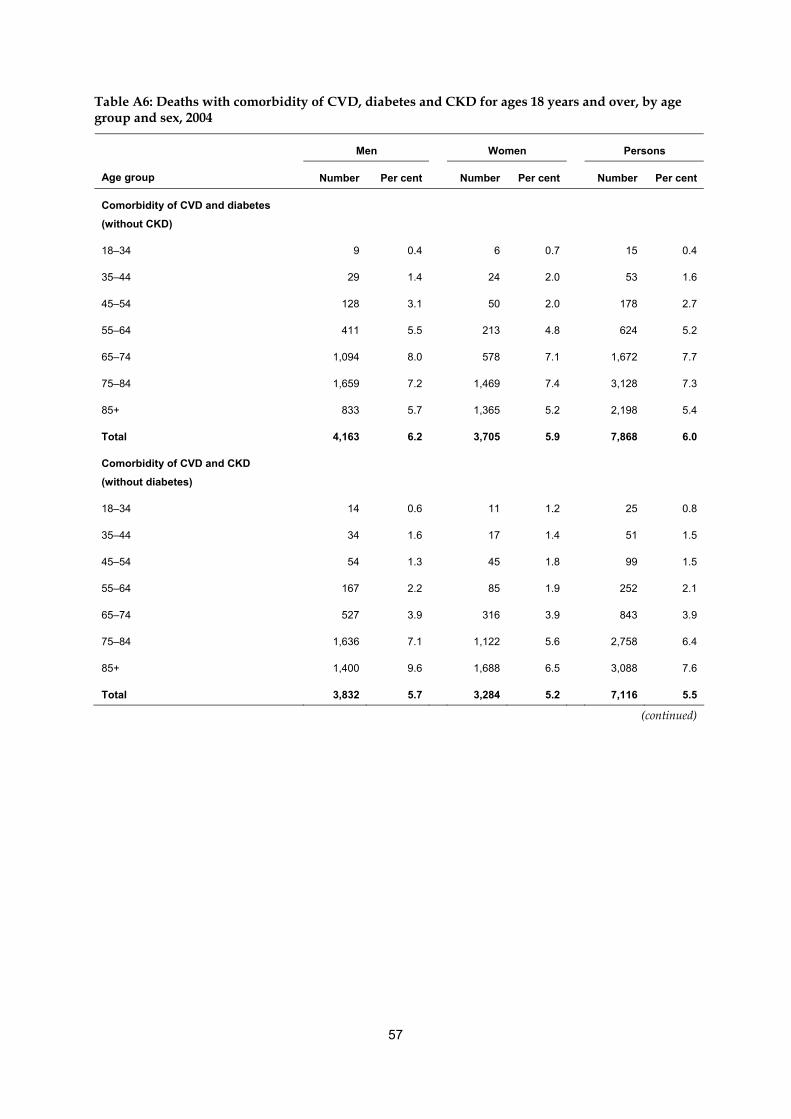
57
Table A6: Deaths with comorbidity of CVD, diabetes and CKD for ages 18 years and over, by age group and sex, 2004
Men Women Persons
Age group Number Per cent Number Per cent Number Per cent
Comorbidity of CVD and diabetes
(without CKD)
18–34 9 0.4 6 0.7 15 0.4
35–44 29 1.4 24 2.0 53 1.6
45–54 128 3.1 50 2.0 178 2.7
55–64 411 5.5 213 4.8 624 5.2
65–74 1,094 8.0 578 7.1 1,672 7.7
75–84 1,659 7.2 1,469 7.4 3,128 7.3
85+ 833 5.7 1,365 5.2 2,198 5.4
Total 4,163 6.2 3,705 5.9 7,868 6.0
Comorbidity of CVD and CKD
(without diabetes)
18–34 14 0.6 11 1.2 25 0.8
35–44 34 1.6 17 1.4 51 1.5
45–54 54 1.3 45 1.8 99 1.5
55–64 167 2.2 85 1.9 252 2.1
65–74 527 3.9 316 3.9 843 3.9
75–84 1,636 7.1 1,122 5.6 2,758 6.4
85+ 1,400 9.6 1,688 6.5 3,088 7.6
Total 3,832 5.7 3,284 5.2 7,116 5.5
(continued)
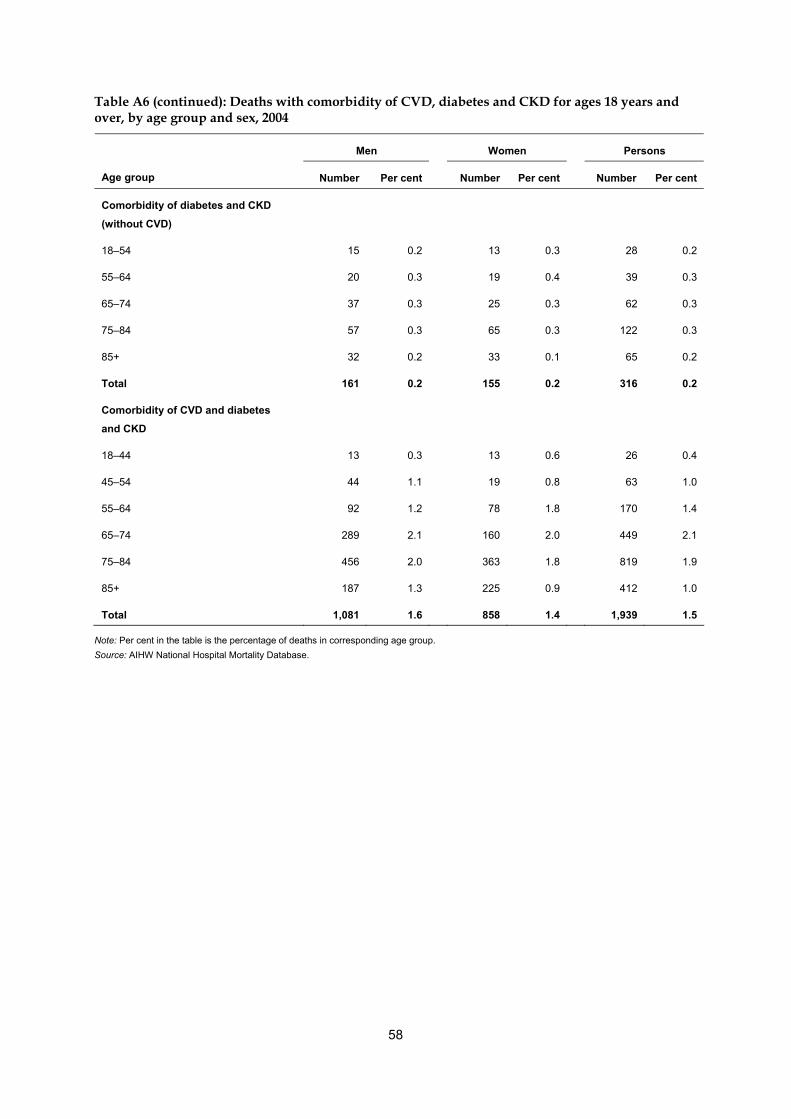
58
Table A6 (continued): Deaths with comorbidity of CVD, diabetes and CKD for ages 18 years and over, by age group and sex, 2004
Men Women Persons
Age group Number Per cent Number Per cent Number Per cent
Comorbidity of diabetes and CKD
(without CVD)
18–54 15 0.2 13 0.3 28 0.2
55–64 20 0.3 19 0.4 39 0.3
65–74 37 0.3 25 0.3 62 0.3
75–84 57 0.3 65 0.3 122 0.3
85+ 32 0.2 33 0.1 65 0.2
Total 161 0.2 155 0.2 316 0.2
Comorbidity of CVD and diabetes
and CKD
18–44 13 0.3 13 0.6 26 0.4
45–54 44 1.1 19 0.8 63 1.0
55–64 92 1.2 78 1.8 170 1.4
65–74 289 2.1 160 2.0 449 2.1
75–84 456 2.0 363 1.8 819 1.9
85+ 187 1.3 225 0.9 412 1.0
Total 1,081 1.6 858 1.4 1,939 1.5
Note: Per cent in the table is the percentage of deaths in corresponding age group. Source: AIHW National Hospital Mortality Database.
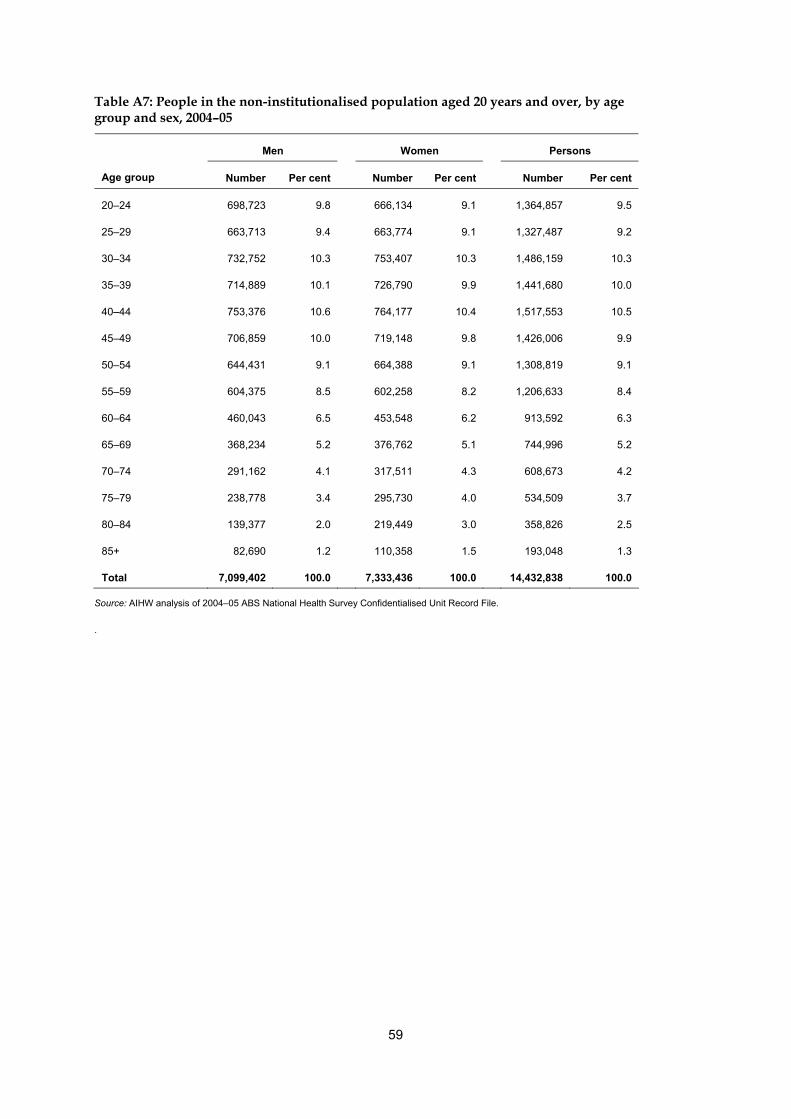
59
Table A7: People in the non-institutionalised population aged 20 years and over, by age group and sex, 2004–05
Men Women Persons
Age group Number Per cent Number Per cent Number Per cent
20–24 698,723 9.8 666,134 9.1 1,364,857 9.5
25–29 663,713 9.4 663,774 9.1 1,327,487 9.2
30–34 732,752 10.3 753,407 10.3 1,486,159 10.3
35–39 714,889 10.1 726,790 9.9 1,441,680 10.0
40–44 753,376 10.6 764,177 10.4 1,517,553 10.5
45–49 706,859 10.0 719,148 9.8 1,426,006 9.9
50–54 644,431 9.1 664,388 9.1 1,308,819 9.1
55–59 604,375 8.5 602,258 8.2 1,206,633 8.4
60–64 460,043 6.5 453,548 6.2 913,592 6.3
65–69 368,234 5.2 376,762 5.1 744,996 5.2
70–74 291,162 4.1 317,511 4.3 608,673 4.2
75–79 238,778 3.4 295,730 4.0 534,509 3.7
80–84 139,377 2.0 219,449 3.0 358,826 2.5
85+ 82,690 1.2 110,358 1.5 193,048 1.3
Total 7,099,402 100.0 7,333,436 100.0 14,432,838 100.0
Source: AIHW analysis of 2004–05 ABS National Health Survey Confidentialised Unit Record File.
.
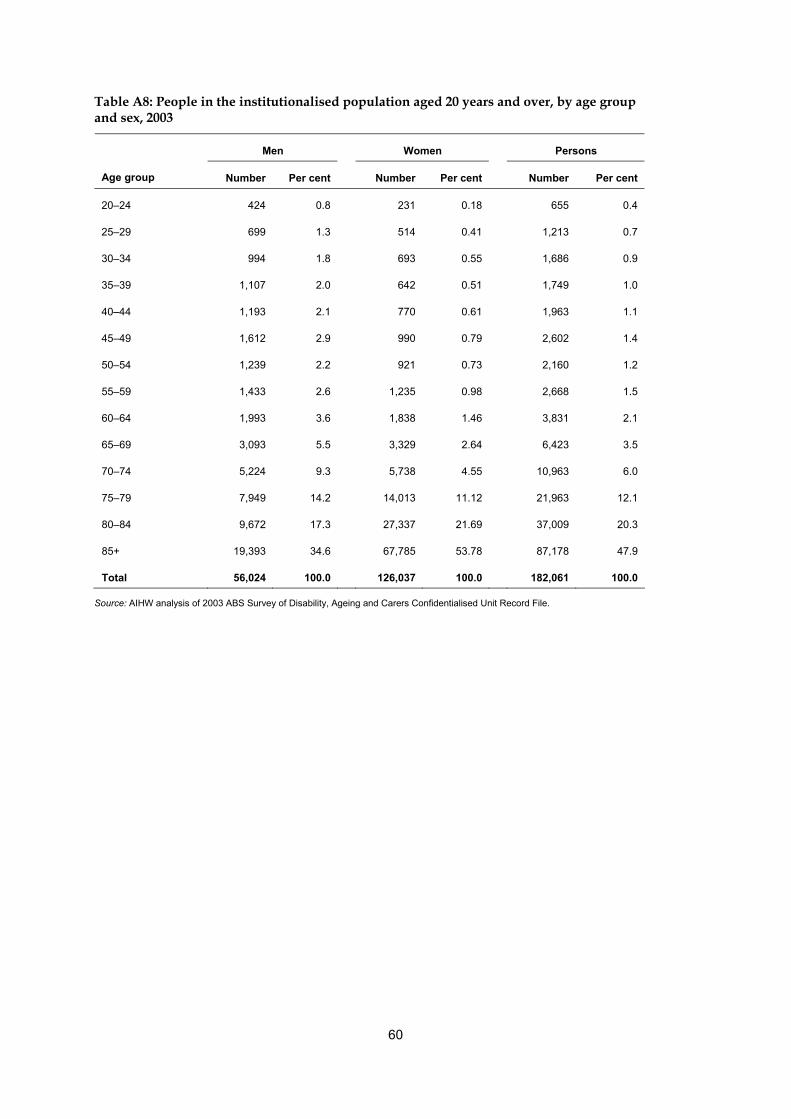
60
Table A8: People in the institutionalised population aged 20 years and over, by age group and sex, 2003
Men Women Persons
Age group Number Per cent Number Per cent Number Per cent
20–24 424 0.8 231 0.18 655 0.4
25–29 699 1.3 514 0.41 1,213 0.7
30–34 994 1.8 693 0.55 1,686 0.9
35–39 1,107 2.0 642 0.51 1,749 1.0
40–44 1,193 2.1 770 0.61 1,963 1.1
45–49 1,612 2.9 990 0.79 2,602 1.4
50–54 1,239 2.2 921 0.73 2,160 1.2
55–59 1,433 2.6 1,235 0.98 2,668 1.5
60–64 1,993 3.6 1,838 1.46 3,831 2.1
65–69 3,093 5.5 3,329 2.64 6,423 3.5
70–74 5,224 9.3 5,738 4.55 10,963 6.0
75–79 7,949 14.2 14,013 11.12 21,963 12.1
80–84 9,672 17.3 27,337 21.69 37,009 20.3
85+ 19,393 34.6 67,785 53.78 87,178 47.9
Total 56,024 100.0 126,037 100.0 182,061 100.0
Source: AIHW analysis of 2003 ABS Survey of Disability, Ageing and Carers Confidentialised Unit Record File.
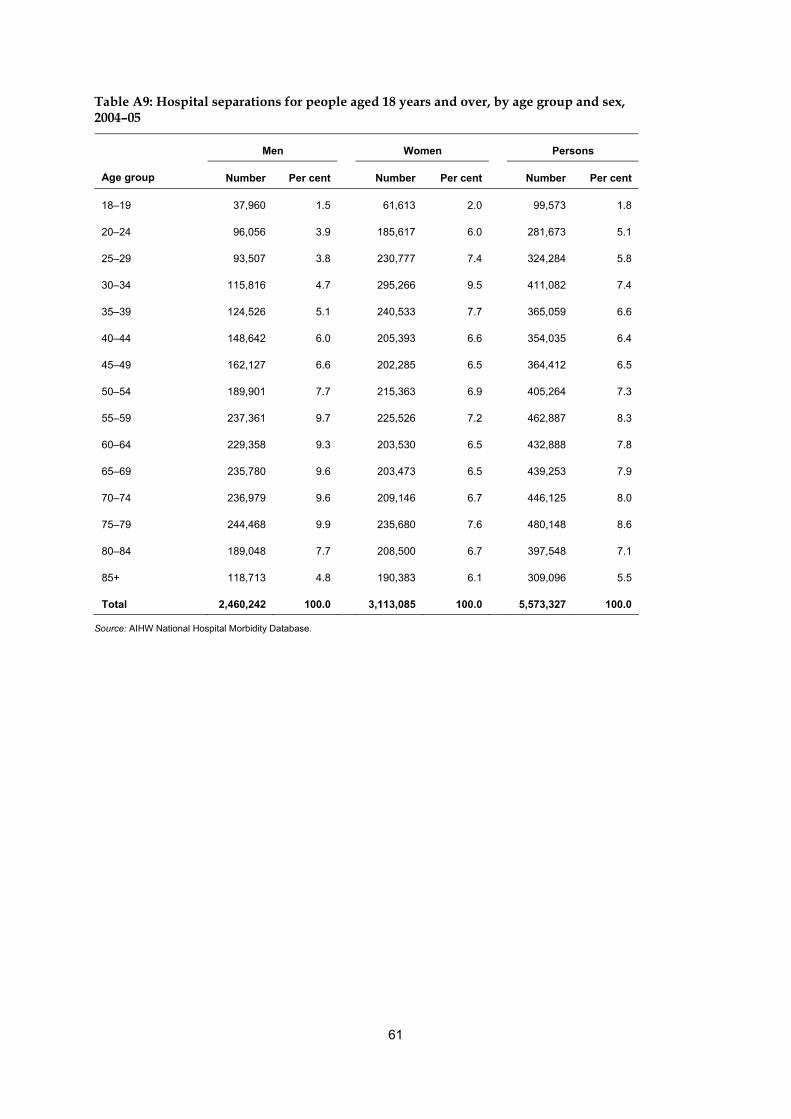
61
Table A9: Hospital separations for people aged 18 years and over, by age group and sex, 2004–05
Men Women Persons
Age group Number Per cent Number Per cent Number Per cent
18–19 37,960 1.5 61,613 2.0 99,573 1.8
20–24 96,056 3.9 185,617 6.0 281,673 5.1
25–29 93,507 3.8 230,777 7.4 324,284 5.8
30–34 115,816 4.7 295,266 9.5 411,082 7.4
35–39 124,526 5.1 240,533 7.7 365,059 6.6
40–44 148,642 6.0 205,393 6.6 354,035 6.4
45–49 162,127 6.6 202,285 6.5 364,412 6.5
50–54 189,901 7.7 215,363 6.9 405,264 7.3
55–59 237,361 9.7 225,526 7.2 462,887 8.3
60–64 229,358 9.3 203,530 6.5 432,888 7.8
65–69 235,780 9.6 203,473 6.5 439,253 7.9
70–74 236,979 9.6 209,146 6.7 446,125 8.0
75–79 244,468 9.9 235,680 7.6 480,148 8.6
80–84 189,048 7.7 208,500 6.7 397,548 7.1
85+ 118,713 4.8 190,383 6.1 309,096 5.5
Total 2,460,242 100.0 3,113,085 100.0 5,573,327 100.0
Source: AIHW National Hospital Morbidity Database.
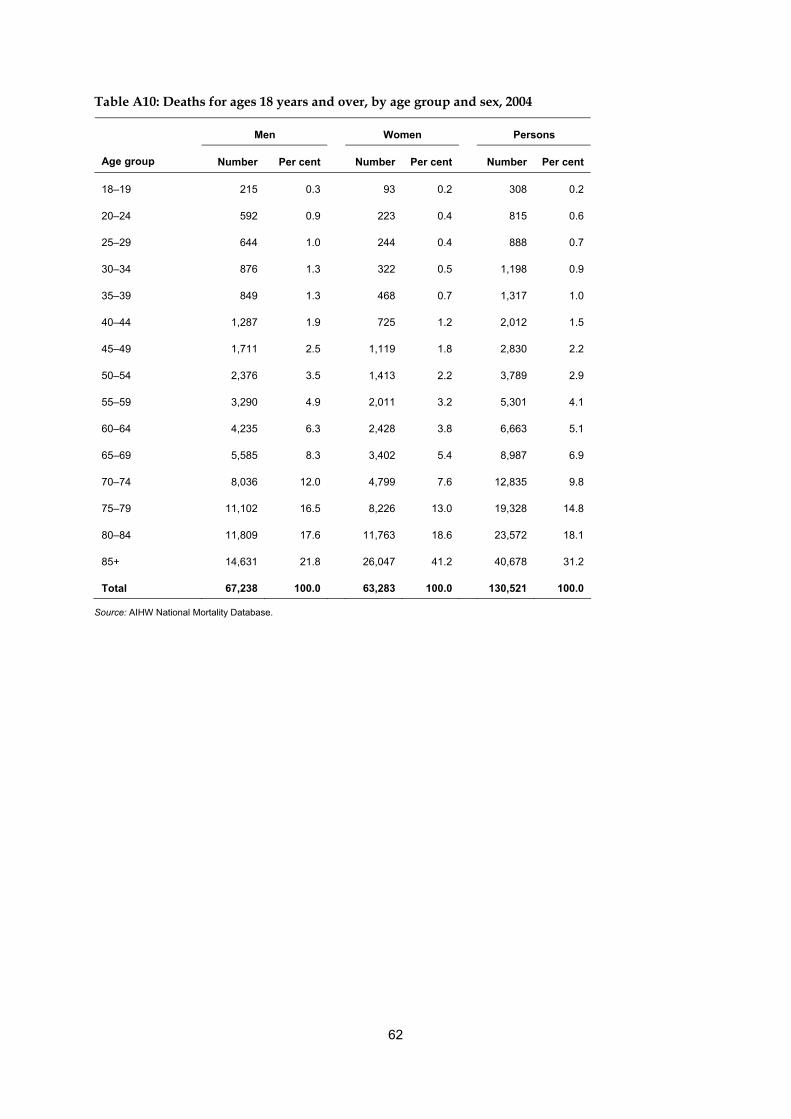
62
Table A10: Deaths for ages 18 years and over, by age group and sex, 2004
Men Women Persons
Age group Number Per cent Number Per cent Number Per cent
18–19 215 0.3 93 0.2 308 0.2
20–24 592 0.9 223 0.4 815 0.6
25–29 644 1.0 244 0.4 888 0.7
30–34 876 1.3 322 0.5 1,198 0.9
35–39 849 1.3 468 0.7 1,317 1.0
40–44 1,287 1.9 725 1.2 2,012 1.5
45–49 1,711 2.5 1,119 1.8 2,830 2.2
50–54 2,376 3.5 1,413 2.2 3,789 2.9
55–59 3,290 4.9 2,011 3.2 5,301 4.1
60–64 4,235 6.3 2,428 3.8 6,663 5.1
65–69 5,585 8.3 3,402 5.4 8,987 6.9
70–74 8,036 12.0 4,799 7.6 12,835 9.8
75–79 11,102 16.5 8,226 13.0 19,328 14.8
80–84 11,809 17.6 11,763 18.6 23,572 18.1
85+ 14,631 21.8 26,047 41.2 40,678 31.2
Total 67,238 100.0 63,283 100.0 130,521 100.0
Source: AIHW National Mortality Database.
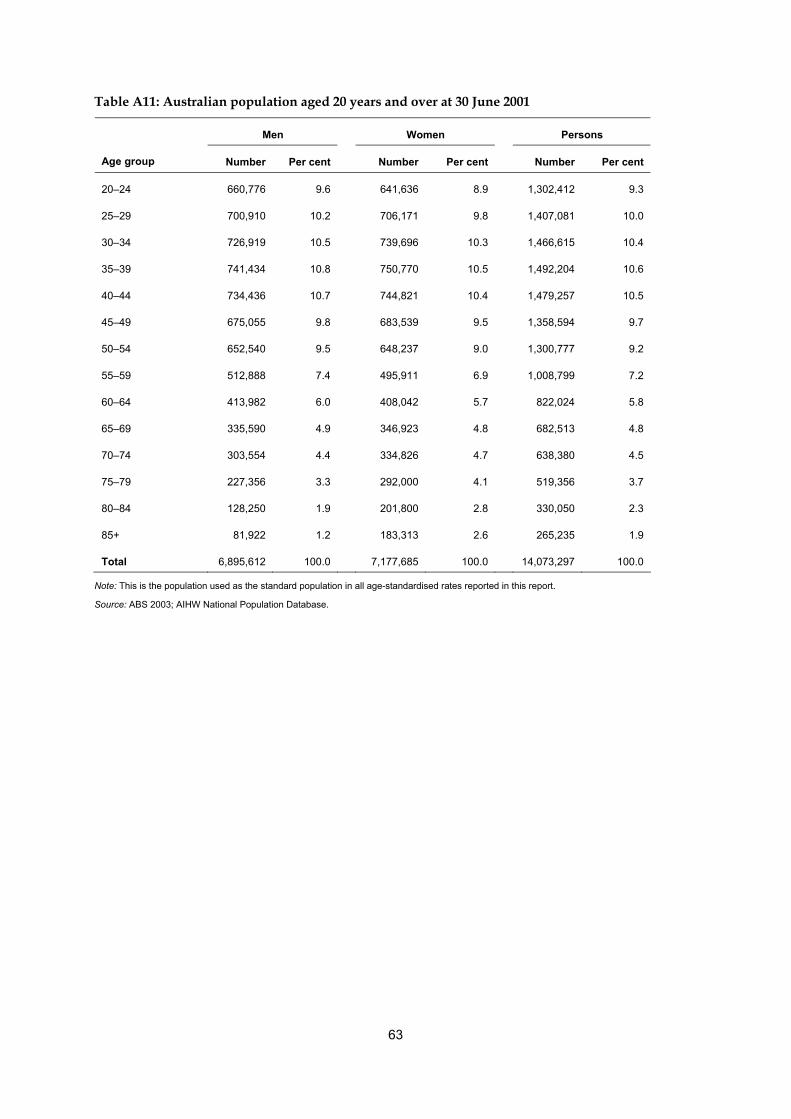
63
Table A11: Australian population aged 20 years and over at 30 June 2001
Men Women Persons
Age group Number Per cent Number Per cent Number Per cent
20–24 660,776 9.6 641,636 8.9 1,302,412 9.3
25–29 700,910 10.2 706,171 9.8 1,407,081 10.0
30–34 726,919 10.5 739,696 10.3 1,466,615 10.4
35–39 741,434 10.8 750,770 10.5 1,492,204 10.6
40–44 734,436 10.7 744,821 10.4 1,479,257 10.5
45–49 675,055 9.8 683,539 9.5 1,358,594 9.7
50–54 652,540 9.5 648,237 9.0 1,300,777 9.2
55–59 512,888 7.4 495,911 6.9 1,008,799 7.2
60–64 413,982 6.0 408,042 5.7 822,024 5.8
65–69 335,590 4.9 346,923 4.8 682,513 4.8
70–74 303,554 4.4 334,826 4.7 638,380 4.5
75–79 227,356 3.3 292,000 4.1 519,356 3.7
80–84 128,250 1.9 201,800 2.8 330,050 2.3
85+ 81,922 1.2 183,313 2.6 265,235 1.9
Total 6,895,612 100.0 7,177,685 100.0 14,073,297 100.0
Note: This is the population used as the standard population in all age-standardised rates reported in this report.
Source: ABS 2003; AIHW National Population Database.
64
References
ABS (Australian Bureau of Statistics) 2000. Population projections Australia 1999–2101. ABS cat. no. 3222.0. Canberra: ABS. ABS 2002. Australian demographics statistics. ABS cat. no. 3101.0. Canberra: ABS. ABS 2003. Population by Age and Sex, Australian States and Territories. ABS cat. no. 3201.0. Canberra: ABS. ABS 2005. Basic Confidentialised Unit Record Files: Survey of disability, ageing and carers, 2003 (Reissue). ABS cat. no. 4430.0.00.001. Canberra: ABS. ABS 2006a. Australian social trends, 2006. ABS cat. no. 4102.0. Canberra: ABS. ABS 2006b. Information paper: National Health Survey-Confidentialised Unit Record Files, Australia, 2004–05. ABS cat. no. 4324.0. Canberra: ABS. ABS 2006c. National Health Survey: Summary of results, Australia, 2004-05. ABS cat. no. 4364.0 AIHW(Australian Institute of Health and Welfare) 2002a. Diabetes: Australian facts 2002. Diabetes Series No. 3 cat. no. CVD 20. Canberra: AIHW. AIHW 2002b. Older Australia at a glance 2002 3rd ed. cat. no. AGE 25. Canberra: AIHW & DoHA. AIHW 2004a. Health system expenditure on disease and injury in Australia, 2000–01. Health and Welfare Expenditure Series No. 19 cat. no. HWE 26. Canberra: AIHW. AIHW 2005. Chronic kidney disease in Australia, 2005. Cat. no. PHE 68. Canberra: AIHW. AIHW 2006a. Australia’s health 2006. Cat. no. AUS 73. Canberra: AIHW. AIHW 2006b. Chronic diseases and associated risk factors in Australia, 2006. Cat. no. PHE 81. Canberra: AIHW. Breslow N.E. & Day N.E. 1987. Statistical methods in cancer research. Vol.II. France; International agency for research on cancer (p69). Briganti EM, Shaw JE, Chadban SJ et al. 2003. Untreated hypertension among Australian adults: the 1999–2000 Australian Diabetes, Obesity and Lifestyle Study (AusDiab). Medical Journal of Australia 179:135-139. Chadban SJ, Briganti EM, Kerr PG et al. 2003. Prevalence of kidney damage in Australian adults: the AusDiab kidney study. Journal of the American Society of Nephrology 14:S131–8. Dekker JM, Girman C, Rhodes T et al. 2005. Metabolic syndrome and 10-year cardiovascular disease risk in the Hoorn study. Circulation 112:666–73. Dunstan D, Zimmet P, Welborn T et al. 2001. Diabesity and associated disorders in Australia – 2000: the accelerating epidemic. The Australian Diabetes, Obesity and Lifestyle Study (AusDiab). Melbourne: International Diabetes Institute. Garcia MJ, McNamara PM, Gordon T et al. 1974. Morbidity and mortality in diabetes in the Framingham population: sixteen-year follow-up study. Diabetes (23):105–111. Gijsen R, Hoeymans N, Schellevis FG et al. 2001. Cause and consequences of comorbidity: A review. Journal of Clinical Epidemiology 54(2001):661–674.
65
Go AS, Chertow GM, Fan D et al. 2004. Chronic kidney disease and the risks of death, cardiovascular events, and hospitalization. New England Journal of Medicine 351:13. Haffner SM, Lehto S, Ronnemaa T et al. 1998. Mortality from coronary heart disease in subjects with type 2 diabetes and in nondiabetic subjects with and without prior myocardial infarction. The New England Journal of Medicine 339(4):229–34. Hansson L, Zanchetti A, Carruthers SE et al. 1998. Effects of intensive blood-pressure lowering and low-dose aspirin in patients with hypertension: principal results of the Hypertension Optimal Treatment (HOT) randomized trial. The Lancet 351(13):1755–1762. Isomaa B, Henricsson M, Almgren P et al. 2001. The metabolic syndrome influences the risk of chronic complications in patients with type II diabetes. Diabetologia 44:1148–54. Kemp TM, Barr ELM, Zimmet PZ et al. 2005. Glucose, lipid, and blood pressure control in Australian adults with Type 2 diabetes. Diabetes Care 28(6):1490–1492. Levin A, Djurdiev O, Barrett B et al. 2001. Cardiovascular disease in patients with chronic kidney disease: getting to the heart of the matter. American Journal of Kidney Diseases 38(6):1398–1407. Levin A, Stevens L & McCullough PA 2002. Cardiovascular disease and the kidney: tracking a killer in chronic kidney disease. Postgraduate Medicine online 111(4). Viewed 12 November 2006, <http://www.postgradmed.com/issues>. Li SQ, Cass A & Cunningham J 2003. Cause of death in patients with end-stage renal disease: assessing concordance of death certificates with registry reports. Australian and New Zealand Journal of Public Health 27(4):419–424. McDonald SP, Excell L & Shtangey V 2005. New patients commencing treatment. In: McDonald SP & Excell L (eds). ANZDATA Registry report 2005. Adelaide: Australia and New Zealand Dialysis and Transplant Registry, 34–43. NCCH (National Centre for Classification in Health) 2002. ICD-10-AM third edition browser v1. New South Wales: Commonwealth of Australia. NHPAC (National Health Priority Action Council) 2006. National chronic disease strategy. Canberra: DoHA. Nillsson P & Berglund G 2000. Prevention of cardiovascular disease and diabetes: lessons from the Malmo Preventive Project. Journal of Internal Medicine 248:455–462. Simpson SH, Corabian P, Jacobs P et al. 2003. The cost of major comorbidity in people with diabetes mellitus. Canadian Medical Association Journal 168(13):1661–1667. Starfield B, Lemke KW, Bernbardt T et al. 2003. Comorbidity: implications for the importance of primary care in ‘case’ management. Annals of Family Medicine 1(1):8–14. Stern MP, Williams K, Gonzalez-Villalpando C et al. 2004. Does the metabolic syndrome improve identification of individuals at risk of Type 2 diabetes and/or cardiovascular disease? Diabetes Care 27:2676–81. Struijs JN, Baan CA, Schellevis FG et al. 2006. Comorbidity in patients with diabetes mellitus: impact on medical health care utilization. BMC Health Services Research 6:84. The Australasian Creatinine Consensus Working Group 2005. Chronic kidney disease and automatic reporting of estimated glomerular filtration rate: a position statement. Medical Journal of Australia 183(3):138–141.
66
Thomas MC, Weekes AJ, Broadley OJ et al. 2006. The assessment of kidney function by general practitioners in Australian patients with Type 2 diabetes (NEFRON-2). The Medical Journal of Australia 185(5):259–262. Walker A 2005. Multiple chronic conditions: patient characteristics and impacts on quality of life and health expenditure. Health Services and Policy Research Conference, Canberra. Weiner DE, Tighiouart H, Stark PC et al. 2004. Kidney diseases as a risk factors for recurrent cardiovascular disease and mortality. American Journal of Kidney Disease 44(2):198–206. Westert GP, Satariano WA, Schellevis FG et al. 2001. Patterns of comorbidity and the use of health services in the Dutch population. European Journal of Public Health 11(4):365–72. Van den Akker M, Bunntinx F, Roos S et al. 2001. Problems in determining occurrence rates of multimorbidity. Journal of Clinical Epidemiology 54:675–679. Zimmet PZ, Alberti KGMM & Shaw JE 2005. Mainstreaming the metabolic syndrome: a definitive definition. Medical Journal of Australia 183:175–6.
67
List of tables
Table 1.1: Known risk factors for cardiovascular disease, diabetes and chronic kidney disease....................................................................................................... 3
Table 2.1: Prevalence of comorbidity of CVD and diabetes in the non-institutionalised adult population, by sex and age group, 2004–05 ......................................................... 9
Table 2.2: Expected and observed prevalence of comorbidity of CVD and diabetes in the non-institutionalised adult population, 2004–05 ................................................ 9
Table 2.3: Australians with comorbidity of CVD and diabetes in the non-institutionalised adult population by disease category, 2004–05............................................................ 12
Table 2.4: Expected and observed comorbidity of CVD and diabetes in the institutionalised adult population, 2003........................................................................ 15
Table 2.5: Australians with comorbidity of CVD and diabetes in the institutionalised adult population by disease category, 2003.................................................................. 18
Table 3.1: Non-dialysis adult hospitalisations with comorbidity of CVD, diabetes and CKD, by sex and age group, 2004–05..................................................................... 21
Table 3.2: Expected and observed non-dialysis adult hospitalisations with comorbidity of CVD, diabetes and CKD, 2004–05....................................................... 23
Table 3.3: Non-dialysis adult hospitalisations with index conditions and comorbidities, 2004–05..................................................................................................... 24
Table 3.4: Non-dialysis adult hospitalisations with comorbidity of CVD, diabetes and CKD by disease category ......................................................................................... 28
Table 3.5: Adult hospitalisations for regular dialysis, 2004–05.................................................... 29 Table 4.1: Adult deaths with comorbidity of CVD, diabetes and CKD
by sex and age group in 2004.......................................................................................... 32 Table 4.2: Expected and observed comorbidity among in deaths for adults, 2004 ................... 34 Table 4.3: Adult deaths with index conditions and comorbidities, 2004.................................... 35 Table 4.4: Adult deaths with comorbidity of CVD, diabetes and CKD
by disease category, 2004................................................................................................. 39 Table 5.1: Comparison of comorbidity rates from various data sources.................................... 44 Table A1: Codes for deaths and hospital separations used in this report .................................. 50 Table A2: Codes used to identify CVD and diabetes in the non-institutionalised
population, based on the 2004–05 NHS confidentialised unit record file (CURF) .................................................................................................... 52
Table A3: Codes used to identify CVD and diabetes in the institutionalised population, based on 2003 SDAC confidentialised unit record file (CURF) ................................. 53
Table A4: People with comorbidity of CVD and diabetes in the non-institutionalised and institutionalised populations by age group and sex, aged 20 years and over, 2004–05 ............................................................................................................. 54
Table A5: Hospitalisations with comorbidity of CVD, diabetes and CKD, by age group and sex, for people aged 18 years and over, 2004–05.......................... 55
68
Table A6: Deaths with comorbidity of CVD, diabetes and CKD for ages 18 years and over, by age group and sex, 2004............................................................................ 57
Table A7: People in the non-institutionalised population aged 20 years and over, by age group and sex, 2004–05 ....................................................................................... 59
Table A8: People in the institutionalised population aged 20 years and over, by age group and sex, 2003 ............................................................................................. 60
Table A9:Hospital separations for people aged 18 years and over, by age group and sex, 2004–05 ....................................................................................... 61
Table A10: Deaths for ages 18 years and over, by age group and sex, 2004 .............................. 62 Table A11: Australian population aged 20 years and over at 30 June 2001 ............................... 63
69
List of figures
Figure 2.1: Prevalence of CVD and diabetes and their comorbidity in the non-institutionalised adult population, 2004–05.......................................................... 7
Figure 2.2: Age-specific rate of comorbidity of CVD and diabetes in the non-institutionalised adult population, by sex, 2004–05............................................. 8
Figure 2.3: Comorbidity of CVD and diabetes among people with CVD in the non-institutionalised adult population, by age group, 2004–05 .............................. 10
Figure 2.4: Comorbidity of CVD and diabetes among people with diabetes in the non-institutionalised adult population, by age group, 2004–05 .............................. 11
Figure 2.5: Prevalence of CVD and diabetes and their comorbidity in the institutionalised adult population, 2003...................................................................... 13
Figure 2.6: Age-specific rate of comorbidity of CVD and diabetes in the institutionalised adult population, 2003...................................................................... 14
Figure 2.7: Comorbidity of CVD and diabetes among people with CVD in the institutionalised adult population, by age group, 2003............................................. 16
Figure 2.8: Comorbidity of CVD and diabetes among people with diabetes in the institutionalised population, by age group, 2003....................................................... 17
Figure 3.1: Non-dialysis adult hospitalisations with diagnoses of CVD, diabetes, CKD and their comorbidity, 2004–05........................................................................... 20
Figure 3.2: Age-specific rate of non-dialysis adult hospitalisations with comorbidity of CVD, diabetes and CKD, by sex, 2004–05............................................................... 22
Figure 3.3: Comorbidity in non-dialysis adult hospitalisations with a diagnosis of CVD, by age group, 2004–05..................................................................................... 25
Figure 3.4: Comorbidity in non-dialysis adult hospitalisations with a diagnosis of diabetes, by age group, 2004–05............................................................................... 26
Figure 3.5: Comorbidity in non-dialysis adult hospitalisations with a diagnosis of CKD, by age group, 2004–05..................................................................................... 27
Figure 4.1: Adult deaths with CVD, diabetes, CKD and their comorbidity, 2004 .................... 31 Figure 4.2: Age-specific rate of deaths with comorbidity of CVD, diabetes and CKD,
by sex, 2004 ...................................................................................................................... 33 Figure 4.3: Comorbidity among Australian adults with CVD as a cause of death,
by age group, 2004 .......................................................................................................... 36 Figure 4.4: Comorbidity among Australian adults with diabetes as a cause of death,
by age group, 2004 .......................................................................................................... 37 Figure 4.5: Comorbidity among Australian adults with CKD as a cause of death,
by age group, 2004 .......................................................................................................... 38


![Cardiovascular disease [autosaved]](https://img.pdfslide.net/doc/110x75/554b2ab7b4c905d3088b4ab0/cardiovascular-disease-autosaved.jpg)