Embed Size (px)
Citation preview
BMR PUBLICATIONS COMP (LENDING SECTION)
3 1 AUG 1992
B1vfR Record 1992/57
Mawson Geophysical Observatory
Annual Report, 1991
by Maria de Deuge
Geomagnetism Section Geophysical Observatories and Mapping Division
1/1 11111 ~ Illn BUREAU OF MINERAL RESOURCES. GEOLOGY AND GEOPHYSICS. AUSTRALIA
* R 9 205 7 0 1 *
Commonwealth of Australia, 1992.
This work is copyright. Apart from any fair dealing for the purposes of study, research, criticism or review, as permitted under the Copyright Act, no part may be reproduced by any process without written permission. Inquiries should be directed to the Principal Information Officer, Bureau of Mineral Resources, Geology and Geophysics, GPO Box 378, Canberra, ACT, 2601.
ISSN ISBN
0811-062 X o 642 18329 5
BUREAU OF MIN"ERAL RESOURCES, GEOLOGY AND GEOPHYSICS, AUSTRALIA
TABLE OF CONTENTS
SUMMARy ........................................................................................................................................ 1
CHAPTER 1. IN1RODUCTION ....................................................................................................... 2
CHAP1ER2. MAWSON GEOMAGNETIC OBSERVATORY ......................................................... 3 2.1 Absolute Observations and Reductions .................................................................................... 3 2.2 Absolute Instruments ............................................................................................................... 3 2.3 Standard Instrument Comparisons and Corrections .................................................................. 5 2.4 Variometer and Recording Equipment ..................................................................................... 7
Sensor Description .................................................................................................... , ............ 7 Recording System ...................................................................................... '" ......................... 7
2.5 Variometer Calibrations and Parameters .................................................................................. 8 Baseline Calibrations ............................................................................................................. 8 DIM Baseline Calibrations ........................................................................ '" ......................... 11 Scale Value Calibrations ....................................................................................................... 11 Orientation Calibrations ........................................................................................................ 12 Data Continuity ..................................................................................................................... 13 Data Loss .............................................................................................................................. 13
2.6 Preliminary Data ...................................................................................................................... 13 K Indices ............................................................................................................................... 13 Monthly mean field values .................................................................................................... 14
2.7 Digital Communications ........... ......................................... ...................................................... 17 2.8 Micropu1sations Magnet Calibrations ....................................................................................... 17
CHAP1ER 3. MAWSON SEISMOLOGICAL OBSERVATORy ....................................................... 18 3.1 Analogue System ..................................................................................................................... 18
Calibration ............................................................................................................................ 19 SPZ Seismometer Calibrations .............................................................................................. 20 LPZ Seismometer Calibrations .............................................................................................. 22
3.2 Guralp System ............................................................................................. '" ......................... 23 3.3 Time Keeping .......................................................................................................................... 24
CHAPTER 4. CON1ROL EQUIPMENT ............................................................................................ 25 4.1 Power Supplies ........................................................................................................................ 25
Science Building ................................................................................................................... 25 Variometer Building .............................................................................................................. 25 Cosray Building ..................................................................................................................... 25
4.2 Timing ..................................................................................................................................... 25
CHAP1ER 5. BUILDINGS AND MAIN1ENANCE ........................................................................... 26
CHAP1ER 6. DAVIS AND CASEY GEOMAGNETIC INSTALLATIONS ....................................... 27 6.1 Absolute Instruments ............................................................................................................... 27 6.2 Absolute Observations and Data Reduction .............................................................................. 29 6.3 Variometer Equipment. ............................................................................................................ 30 6.4 Monthly Quiet Day Averages ................................................................................................... 35 6.5 Site Contamination .................................................................................................................. 36
CHAPTER 7. 011IER. DUTIES .......................................................................................................... 37
ACKNOWLEDGEMENTS ................................................................................................................. 37
REFERENCES ................................................................................................................................... 38
BUREAU OF MINERAL RESOURCES. GEOLOGY AND GEOPHYSICS, AUSTRALIA
APPENDICES
APPENDIX A. HISTORY OF MAWSON INSTRUMENT A nON .................................................... .40 APPENDIX B. SUMMARY OF GEOPHYSICAL LOG ..................................................................... .42 APPENDIX C. MAWSON MEAN HOURLY VALUES (Dec 90 to Dec 91) ....................................... 44 APPENDIX D. DETERMINATION OF QUIET DAY AVERAGES FOR DAVIS AND CASEY ........ 47
LIST OF TABLES
Table 1. Station Data for Mawson, 1991 .............................................................................................. 2 Table 2. Absolute Instrument Constants and Thermometer Corrections, 1991 .................................... .4 Table 3. Mawson Absolute Instrument Parameters 1991 ..................................................................... .4 Table 4. Secondary Instrument Corrections ......................................................................................... .4 Table 5. Mawson Absolute Instrument Comparisons ............................................................................ 5 Table 6. Instrument Comparisons of travelling standards at the CMO .................................................. 6 Table 7. Comparison of data during changeover period ....................................................................... 13 Table 8. Mawson Monthly average K index and K index distribution for Dec 90 to Dec 91 ................. 14 Table 9. Mawson mean monthly values for Dec 90 to Dec 91 for all days and international quiet days 15 Table 10. Mawson Seismic System Parameters ................................................................................... 18 Table 11. Mawson Seismic System Data Loss ..................................................................................... 19 Table 12. Frequency response of the SPZ seismometer ........................................................................ 21 Table 13. Frequency response of the LPZ seismometer. ....................................................................... 22 Table 14. SPZ and LPZ Seismometer parameters 1984 -1991 .............................................................. 23 Table 15. Absolute instrument parameters and preliminary corrections for Davis and Casey, 1991.. .... 29 Table 16. Variometerparameters for Davis and Casey for 1991.. ......................................................... 31 Table 17. Monthly baselines for Davis from Jan 1991 to March 1992 .................................................. 32 Table 18. Monthly baseline values for Casey from Dec 1990 to Dec 1991.. ......................................... 33 Table 19. Monthly quiet day averages for Davis and Casey for Dec 1990 to Dec 1991 ........................ 35
LIST OF FIGURES
Figure 1. X, Y and Z baseline value residuals determined using the 1991 variometer parameters ......... 10 Figure 2. Mawson K index distribution for Dec 90 to Dec 91.. ............................................................. 14 Figure 3. Mawson mean monthly values of H,D and Z for Dec 90 to Dec91 ........................................ 16 Figure 4. Frequency response of the SPZ seismometer.. ....................................................................... 21 Figure 5. Frequency response of the LPZ seismometer ........................................................................ 23 Figure 6. Monthly baselines for Davis from Jan 1991 to Mar 1992 ...................................................... 32 Figure 7. Monthly baselines for Casey from Dec 1990 to Dec 1991 ..................................................... 34
BUREAU OF MI?>.'ERAL RESOURCES, GEOLOGY AND GEOPHYSICS, AUSTRALIA
SUMMARY
This report describes the operation of the Mawson geophysical observatory from December 1990 to December 1991. It includes a summary of Mawson geomagnetic data from 1 December 1990 to 12 December 1991. It also describes work carried out in compiling variometer data and absolute observations from Davis and Casey, provided by the Auroral and Space Physics section (ASP) of the Antarctic Division (formerly Upper Atmosphere Physics, UAP) to produce mean monthly averages of the quiet field in the manner of the Mawson reports. Geomagnetic field observations performed in the Prince Charles Mountains (PCMs) and on Heard Island during January and February 1992 are presented in a separate report (de Deuge, 1992).
Geomagnetic activity was continuously monitored at the Mawson observatory using a three component PhotoElectronic Magnetometer (pEM) to measure the geographic north, east and vertical components of the field, and an Elsec E820 proton precession magnetometer (PPM) to measure the total field strength. The data were recorded digitally on an ffiM-AT-compatible personal computer, and also as analogue traces on a chart recorder. The digital data were stored on disk, but could also be accessed from the RMR office in Canberra via satellite telemetry. The variometer data were calibrated through regular (3-4 times/week) magnetic absolute observations. Preliminary geomagnetic data (K indices and mean quiet field values) were forwarded monthly to the Geomagnetism Section of the BMR for publication in monthly observatory reports.
Both the variometer system and the absolute instruments performed well during the year. There were no major digital data losses, minor losses occured mainly because of increasing noise in the PPM E820 data.
Seismic activity was monitored by two independent systems. One consisted of three Guralp wide band seismometers aligned geographic north, east and vertical. Digital data from this system were telemetered to the Nuclear Monitoring Section of the Australian Seismological Centre (ASC) in Canberra and recorded on a Sun/Unix computer network. The second system consisted of a short period vertical Benioff seismometer and a long period vertical Press-Ewing seismometer; the data were recorded locally on hot-pen helicorders. These charts were scaled and reported approximately weekly to the BMR and the National Earthquake Information Service (Boulder, Colorado) via telex.
1
BUREAU OF MINERAL RESOURCES, GEOLOGY AND GEOPHYSICS, AUSTRALIA
CHAPTER 1. INTRODUCTION
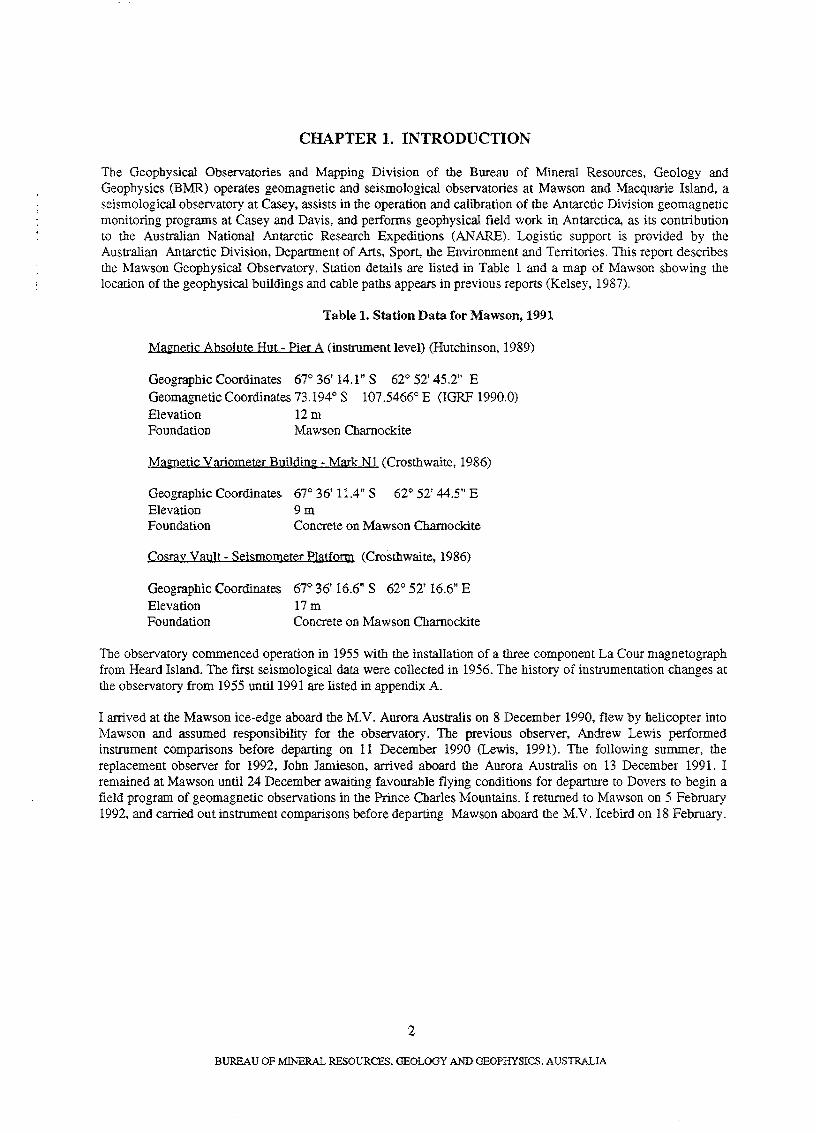
The Geophysical Observatories and Mapping Division of the Bureau of Mineral Resources, Geology and Geophysics (BMR) operates geomagnetic and seismological observatories at Mawson and Macquarie Island, a seismological observatory at Casey, assists in the operation and calibration of the Antarctic Division geomagnetic monitoring programs at Casey and Davis, and performs geophysical field work in Antarctica, as its contribution to the Australian National Antarctic Research Expeditions (ANARE). Logistic support is provided by the Australian Antarctic Division, Department of Arts, Sport. the Environment and Territories. This report describes the Mawson Geophysical Observatory. Station details are listed in Table 1 and a map of Mawson showing the location of the geophysical buildings and cable paths appears in previous reports (Kelsey, 1987).
Table 1. Station Data for Mawson, 1991
Magnetic Absolute Hut - Pier A (instrument level) (Hutchinson, 1989)
Geographic Coordinates 67° 36' 14.1" S 62° 52' 45.2" E Geomagnetic Coordinates 73.194° S 107.54660' E (IGRF 1990.0) Elevation 12 m Foundation Mawson Charnockite
Magnetic Variometer Building - Mark NI (Crosthwaite, 1986)
Geographic Coordinates 67° 36' 11.4" S 62° 52' 44.5" E Elevation 9 m Foundation Concrete on Mawson Cbamockite
Cosray Vault - Seismometer Platfonn (Crosthwaite, 1986)
Geographic Coordinates 67° 36' 16.6" S 62° 52' 16.6" E Elevation 17 m Foundation Concrete on Mawson Charnockite
The observatory commenced operation in 1955 with the installation of a three component La Cour magnetograph from Heard Island. The first seismological data were collected in 1956. The history of instrumentation changes at the observatory from 1955 until 1991 are listed in appendix A.
I arrived at the Mawson ice-edge aboard the M.V. Aurora Australis on 8 December 1990, flew by helicopter into Mawson and assumed responsibility for the observatory. The previous observer, Andrew Lewis performed instrument comparisons before departing on 11 December 1990 (Lewis, 1991). The following summer, the replacement observer for 1992, John Jamieson, arrived aboard the Aurora Australis on 13 December 1991. I remained at Mawson until 24 December awaiting favourable flying conditions for departure to Dovers to begin a field program of geomagnetic observations in the Prince Charles Mountains. I returned to Mawson on 5 February 1992. and carried out instrument comparisons before departing Mawson aboard the M.V. Icebird on 18 February.
2
BUREAU OF MINERAL RESOURCES, GEOLOGY AND GEOPHYSICS, AUSTRALIA
CHAPTER 2. MAWSON GEOMAGNETIC OBSERVATORY
2.1 Absolute Observations and Reductions
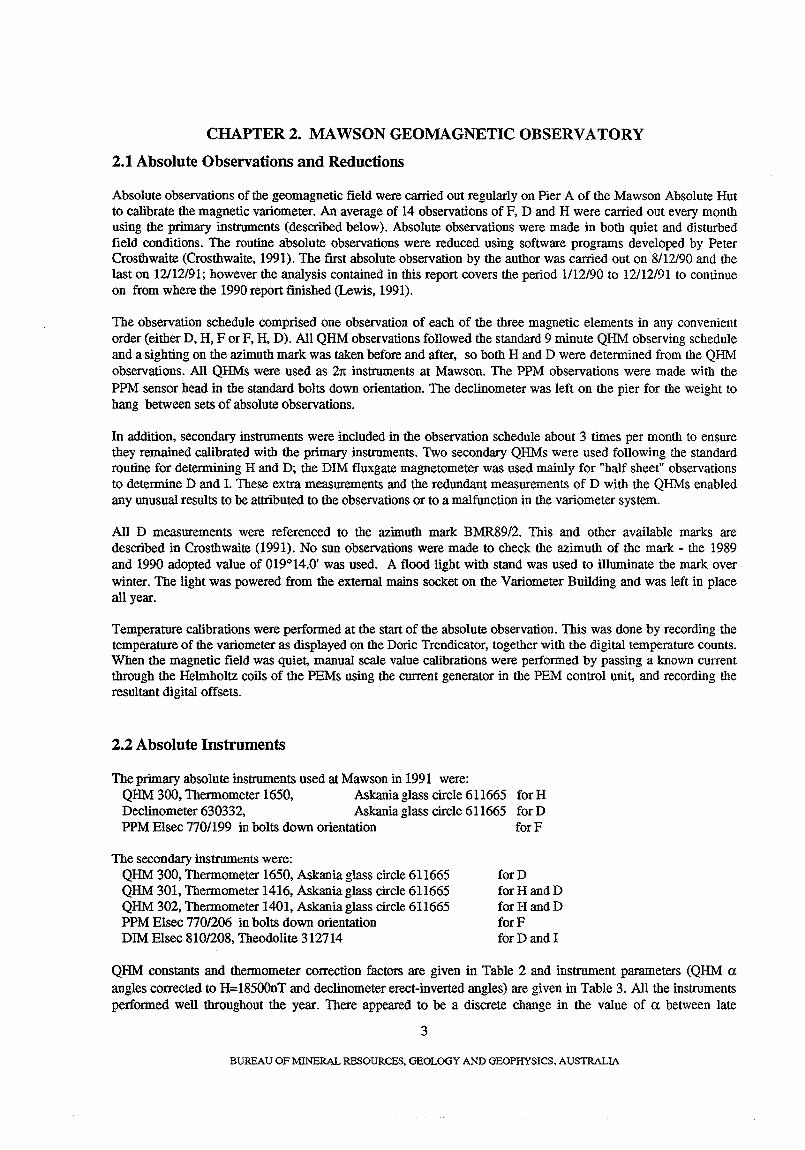
Absolute observations of the geomagnetic field were carried out regularly on Pier A of the Mawson Absolute Hut to calibrate the magnetic variometer. An average of 14 observations of F, D and H were carried out every month using the primary instruments (described below). Absolute observations were made in both quiet and disturbed field conditions. The routine absolute observations were reduced using software programs developed by Peter Crosthwaite (Crosthwaite, 1991). The first absolute observation by the author was carried out on 8/12/90 and the last on 12112/91; however the analysis contained in this report covers the period 1112/90 to 12/12/91 to continue on from where the 1990 report finished (Lewis, 1991).
The observation schedule comprised one observation of each of the three magnetic elements in any convenient order (either D, H, For F, H, D). All QHM observations followed the standard 9 minute QHM observing schedule and a sighting on the azimuth mark was taken before and after, so both H and D were determined from the QHM observations. All QHMs were used as 21t instruments at Mawson. The PPM observations were made with the PPM sensor head in the standard bolts down orientation. The declinometer was left on the pier for the weight to hang between sets of absolute observations.
In addition, secondary instruments were included in the observation schedule about 3 times per month to ensure they remained calibrated with the primary instruments. Two secondary QHMs were used following the standard routine for determining H and D; the DIM fluxgate magnetometer was used mainly for "half sheet" observations to determine D and I. These extra measurements and the redundant measurements of D with the QHMs enabled any unusual results to be attributed to the observations or to a malfunction in the variometer system.
All D measurements were referenced to the azimuth mark BMR89/2. This and other available marks are described in Crosthwaite (1991). No sun observations were made to check the azimuth of the mark - the 1989 and 1990 adopted value of 019°14.0' was used. A flood light with stand was used to illuminate the mark over winter. The light was powered from the external mains socket on the Variometer Building and was left in place all year.
Temperature calibrations were performed at the start of the absolute observation. This was done by recording the temperature of the variometer as displayed on the Doric Trendicator, together with the digital temperature counts. Wben the magnetic field was quiet, manual scale value calibrations were performed by passing a known current through the Helmholtz coils of the PEMs using the current generator in the PEM control unit, and recording the resultant digital offsets.
2.2 Absolute Instruments
The primary absolute instruments used at Mawson in 1991 were: QHM 300, Thermometer 1650, Askania glass circle 611665 for H Declinometer 630332, Askania glass circle 611665 for D PPM Elsec 770/199 in bolts down orientation for F
The secondary instruments were: QHM 300, Thermometer 1650, Askania glass circle 611665 QHM 301, Thermometer 1416, Askania glass circle 611665 QHM 302, Thermometer 1401, Askania glass circle 611665 PPM Elsec 770/206 in bolts down orientation DIM Elsec 810/208, Theodolite 312714
forD forHandD forHandD forF forD and I
QHM constants and thermometer correction factors are given in Table 2 and instrument parameters (QHM ex angles corrected to H=18500nT and declinometer erect-inverted angles) are given in Table 3. All the instruments performed well throughout the year. There appeared to be a discrete change in the value of ex between late
3
BUREAU OF MINERAL RESOURCES. GEOLOGY AND GEOPHYSICS. AUSTRALIA
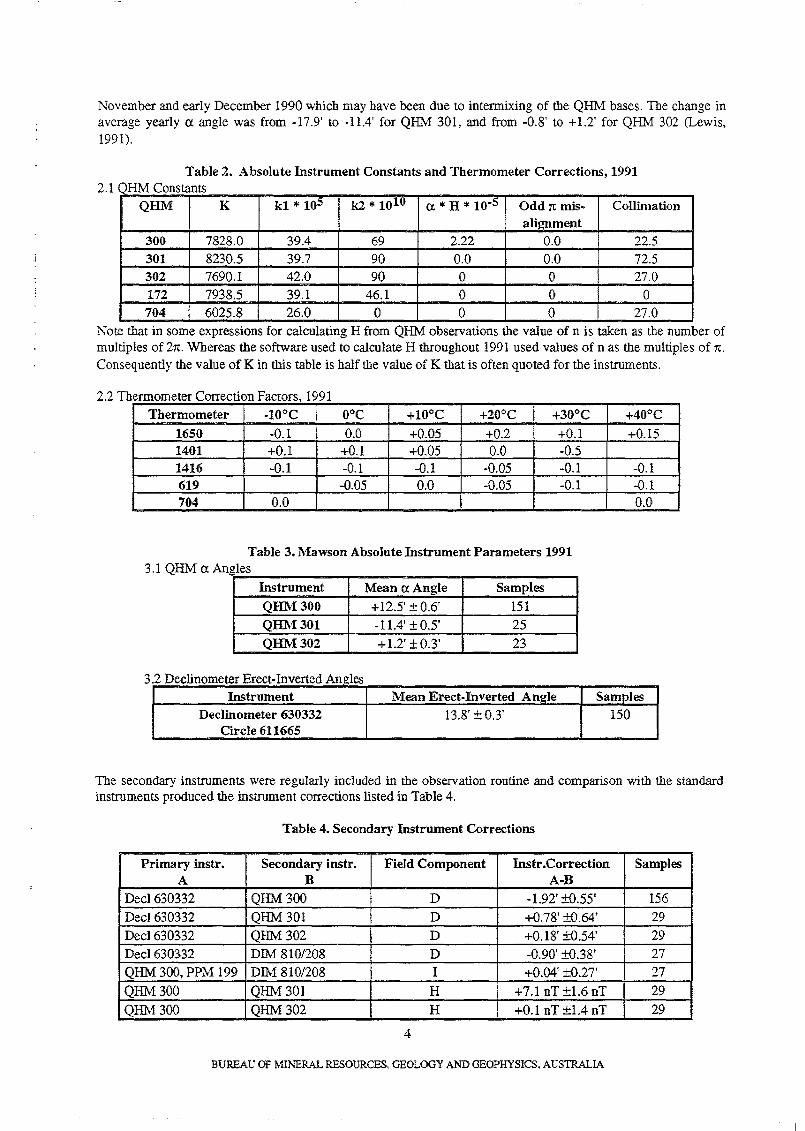
November and early December 1990 which may have been due to intermixing of the QHM bases. The change in average yearly CI. angle was from -17.9' to -11.4' for QHM: 301, and from -0.8' to +1.2' for QHM 302 (Lewis, 1991).
Table 2. Absolute Instrument Constants and Thermometer Corrections, 1991 2.1 QHM Constants
I QHM K k1 * 10!:) k2 * 101Q CI. * H * 10.5 Odd 1t mis- Collimation alignment
300 7828.0 39.4 69 2.22 0.0 22.5 301 8230.5 39.7 90 0.0 0.0 72.5 302 7690.1 42.0 90 0 0 27.0 172 7938.5 39.1 46.1 0 0 0 704 6025.8 26.0 0 0 0 27.0
Note that in some expressions for calculating H from QHM: observations the value of n is taken as the number of multiples of 21t. Whereas the software used to calculate H throughout 1991 used values of n as the multiples of 1t. Consequently the value of K in this table is half the value of K that is often quoted for the instruments.
2.2 Thermometer Correction Factors 1991 ,
Thermometer ·IOoC O°C +10°C +20oC +30°C
1650 -0.1 0.0 +0.05 +0.2 +0.1 1401 +0.1 +0.1 +0.05 0.0 -0.5 1416 -0.1 -0.1 -0.1 -0.05 -0.1 619 -0.05 0.0 -0.05 -0.1 704 0.0
Table 3. Mawson Absolute Instrument Parameters 1991 3.1 QHM CI. Angles
Instrument Mean (X Angle Samples
QHM300 +12.5' ± 0.6' 151 QHM301 -11.4' ± 0.5' 25
QHM302 +1.2' ±0.3' 23
32 D Ii ec nometer lli I ect- nverte dAn 1 t~Jes
+40°C
+0.15
-0.1 -0.1 0.0
Instrument Mean Erect·Inverted Angle Samples Declinometer 630332 13.8' ± 0.3' 150
Circle 611665
The secondary instruments were regularly included in the observation routine and comparison with the standard instruments produced the instrument corrections listed in Table 4.
Table 4. Secondary Instrument Corrections
Primary instr. Secondary instr. Field Component Instr.Correction Samples A B A-B
Decl630332 QHM300 D -1.92' ±O.55' 156
Decl630332 QHM301 D +0.78' ±O.64' 29
Decl630332 QHM302 D +0.18' ±O.54' 29
Decl630332 DIM 810/208 D -0.90' ±O.38' 27
QHM 300, PPM 199 DIM 810/208 I +0.04' ±O.27' 27
QHM300 QHM 301 H +7.1 nT±1.6nT 29
QHM300 QHM302 H +0.1 nT ±1.4 nT 29
4
BUREAU OF MINERAL RESOURCES, GEOLOGY AND GEOPHYSICS, AUSTRALIA
The DIM was used all year without problems; the magnetic and optical alignment remained within 5' and was not adjusted. The DIM was taken into the field for the summer PCM field work,· where it perfOImed well at the first 4 sites where the temperature did not drop below -lO°e. The DIM failed at the next site and the cause was later found to be broken solder connections to the sensor head. This was due to the cable becoming very stiff and brittle in the colder temperatures (-15°C or less) and putting more stress on the joint. The DIM was returned to Mawson and repaired, but the same problem recurred as soon as it was brought back and used at -20°e. The DIM could be made more suitable for cold climate field work by improving the solder joints and using low temperature cable with thicker gauge wire.
Other instruments available were the Balance Magnetique Zero (BMZ) magnetometer 62 with BMZ telescope 211, compensating magnet 62, adjustable compensating magnet 62, supplementary magnets 62/4 and 62/5 and a BMZ tripod, QHM circle 45 and telescope 146. These instruments were not used during the year. The QHM circle and telescope were used with QHM 302 for part of the PCM field work after the DIM broke down. The optical system on the QHM circles is abysmal and was a major problem experienced with the QHM in the field. Getting enough light in to see the mirror reflection was a continual struggle, whereas with a metal circle the QHM observations would have been relatively easy.
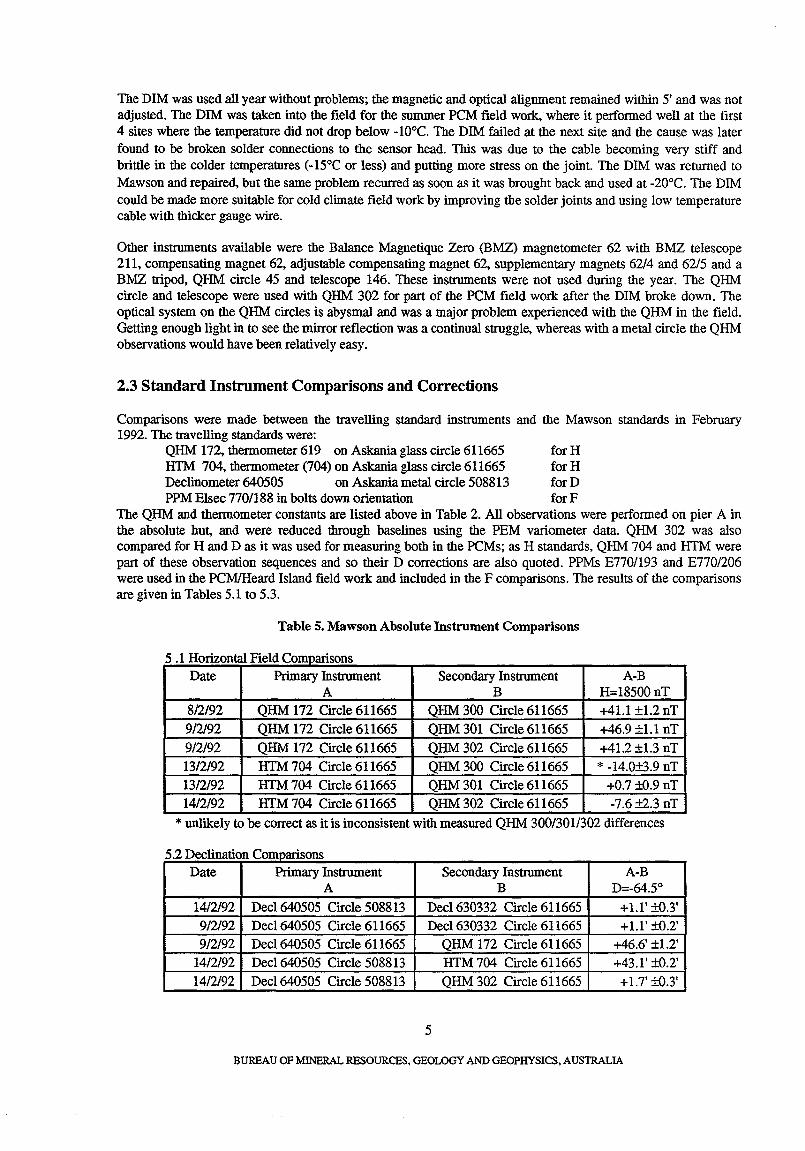
2.3 Standard Instrument Comparisons and Corrections
Comparisons were made between the travelling standard instruments and the Mawson standards in February 1992. The travelling standards were:
QHM 172, thermometer 619 on Askania glass circle 611665 for H HIM 704, thermometer (704) on Askania glass circle 611665 for H Declinometer 640505 on Askania metal circle 508813 for D PPM Elsec 7701188 in bolts down orientation for F
The QHM and thermometer constants are listed above in Table 2. All observations were performed on pier A in the absolute hut, and were reduced through baselines using the PEM variometer data. QHM 302 was also compared for H and D as it was used for measuring both in the PCMs; as H standards, QHM 704 and HTM were part of these observation sequences and so their D corrections are also quoted. PPMs E7701193 and E770/206 were used in the PCMlHeard Island field work and included in the F comparisons. The results of the comparisons are given in Tables 5.1 to 5.3.
Table S. Mawson Absolute Instrument Comparisons
5 1 H' tal E ld C onzon Ie ompartsons Date Primary Instrument Secondary Instrument A-B
A B H=18500nT 8/2/92 QHM 172 Circle 611665 QHM 300 Circle 611665 +41.1 ±1.2 nT
9/2/92 QHM 172 Circle 611665 QHM 301 Circle 611665 +46.9 ±1.1 nT
9/2/92 QHM 172 Circle 611665 QHM 302 Circle 611665 +41.2 ±1.3 nT
13/2/92 HTM 704 Circle 611665 QHM 300 Circle 611665 * -14.0±3.9 nT
13/2/92 HTM 704 Circle 611665 QHM 301 Circle 611665 +0.7 ±O.9 nT
14/2/92 HIM 704 Circle 611665 QHM 302 Circle 611665 -7.6 ±2.3 nT
* unlikely to be correct as it is inconsistent with measured QHM 300/3011302 differences
52D r C ec mation ompartsons Date Primary Instrument Secondary Instrument A-B
A B D=-64.5°
14/2/92 Decl 640505 Circle 508813 Decl630332 Circle 611665 +1.1'±O.3'
9/2/92 Decl640505 Circle 611665 Dec1630332 Circle 611665 +1.1' ±O.2'
9/2/92 Decl640505 Circle 611665 QHM 172 Circle 611665 +46.6' ±1.2'
14/2/92 Decl640505 Circle 508813 HIM 704 Circle 611665 +43.1' ±O.2'
14/2/92 Decl640505 Circle 508813 QHM 302 Circle 611665 +1.7' ±O.3'
5
BUREAU OF MINERAL RESOURCES. GEOLOGY AND GEOPHYSICS. AUSTRALIA
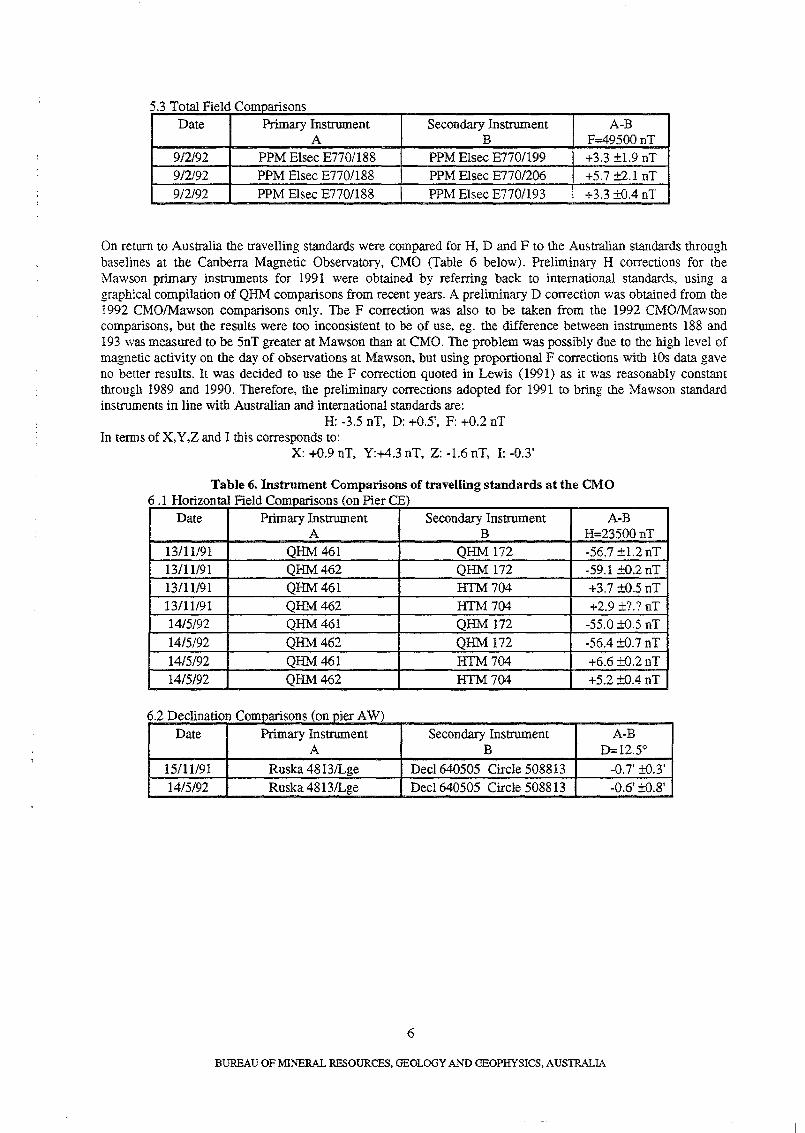
53 T F IdC ota! Ie ompansons Date Primary Instrument Secondarylns~ent A-B
A B F=49500 nT 9/2/92 PPM Eisec E7701188 PPM Elsec E770/199 +3.3 ±1.9 nT 9/2/92 PPM Elsec E770/188 PPM Elsec E770/206 +5.7 ±2.1 nT 912/92 PPM Elsec E770/188 PPM Elsec E770/193 +3.3 ±O.4 nT
On return to Australia the travelling standards were compared for H, D and F to the Australian standards through baselines at the Canberra Magnetic Observatory, CMO (Table 6 below). Preliminary H corrections for the Mawson primary ins~ents for 1991 were obtained by referring back to international standards, using a graphical compilation of QHM comparisons from recent years. A preliminary D correction was obtained from the 1992 CMOIMawson comparisons only. The F correction was also to be taken from the 1992 CMOlMawson comparisons, but the results were too inconsistent to be of use, ego the difference between instruments 188 and 193 was measured to be 5nT greater at Mawson than at CMO. The problem was possibly due to the high level of magnetic activity on the day of observations at Mawson, but using proportional F corrections with lOs data gave no better results. It was decided to use the F correction quoted in Lewis (1991) as it was reasonably constant through 1989 and 1990. Therefore, the preliminary corrections adopted for 1991 to bring the Mawson standard instruments in line with Australian and international standards are:
H: -3.5 nT, D: +0.5', F: +0.2 nT In terms ofX,Y,Z and I this corresponds to:
X: +0.9 nT, Y:+43 nT, Z: -1.6 nT, I: -0.3'
Table 6. Instrument Comparisons of travelling standards at the CMO 6.1 Horizontal Field Comparisons (on PierCE)
Date Primary Instrument Secondary Instrument A-B A B H=23500nT
13/11/91 QHM461 QHMl72 -56.7 ±1.2 nT 13/11/91 QHM462 QHM172 -59.1 ±O.2 nT 13/11/91 QHM461 HTM704 +3.7 ±O.5 nT 13/11/91 QHM462 HTM704 +2.9 ±??nT 14/5/92 QHM461 QHM 172 -55.0 ±O.S nT 14/5192 QHM462 QHMl72 -56.4 ±O.7 nT 14/5/92 QHM461 HTM704 +6.6 ±O.2nT 14/5192 QHM462 HTM704 +5.2 ±O.4 nT
6.2 Declination Comparisons (onpier AW) Date Primary Instrument Secondary Instrument A-B
A B D=12.5'~
15/11191 Ruska 4813JLge Decl640505 Circle 508813 -0.7' ±O.3' 14/5/92 Ruska 4813JLge Decl 640505 Circle 508813 _0.6' ±O.8'
6
BUREAU OF MINERAL RESOURCES, GEOLOGY AND GEOPHYSICS, AUSTRALIA
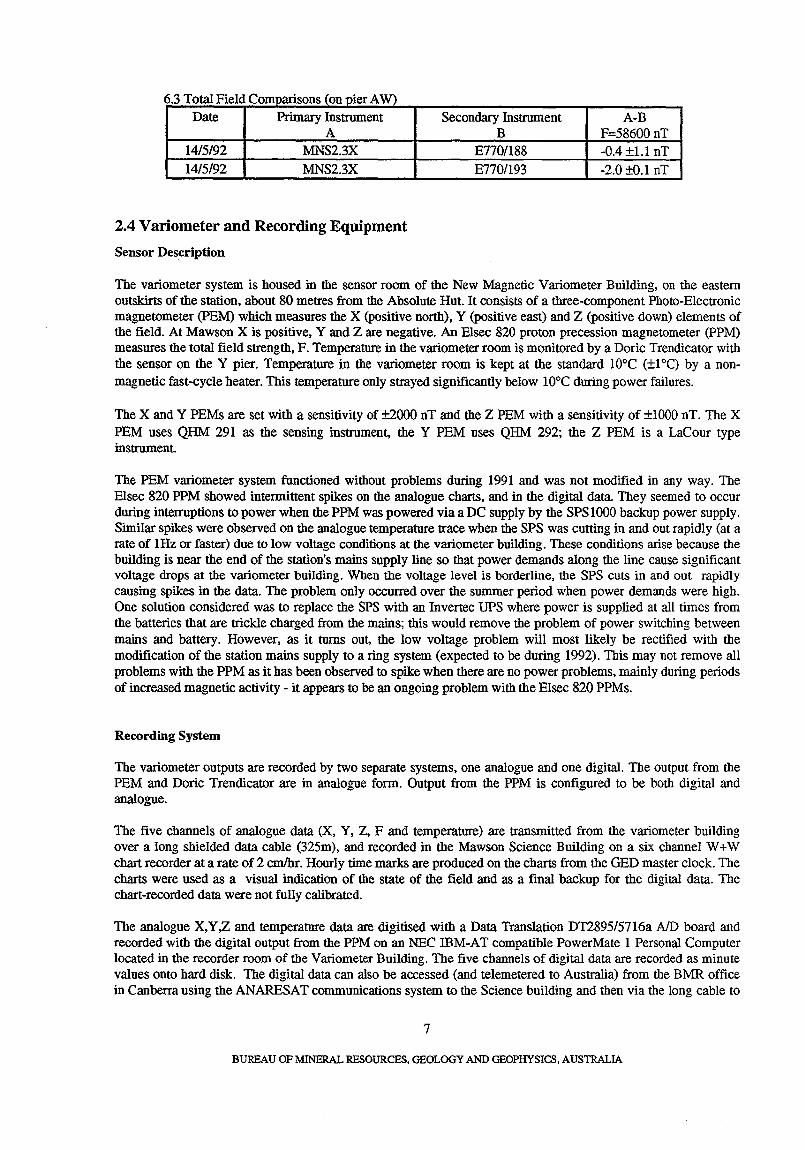
6.3 Total Field Comparisons (on pier A W)
Date ~Instttunent Secondary Instrument A-B A B F=58600nT
1415192 MNS2.3X E7701188 -0.4 ±l.l nT 1415192 MNS2.3X E7701193 -2.0 ±O.1 nT
2.4 Variometer and Recording Equipment
Sensor Description
The variometer system is housed in the sensor room of the New Magnetic Variometer Building, on the eastern outskirts of the station, about 80 metres from the Absolute Hut. It consists of a three-component Photo-Electronic magnetometer (pEM) which measures the X (positive north), Y (positive east) and Z (positive down) elements of the field. At Mawson X is positive, Y and Z are negative. An Elsec 820 proton precession magnetometer (PPM) measures the total field strength, F. Temperature in the variometer room is monitored by a Doric Trendicator with the sensor on the Y pier. Temperature in the variometer room is kept at the standard lOoC (±lOC) by a nonmagnetic fast-cycle heater. This temperature only strayed significantly below lOoC during power failures.
The X and Y PEMs are set with a sensitivity of ±2000 nT and the Z PEM with a sensitivity of ±1000 nT. The X PEM uses QHM 291 as the sensing instrument, the Y PEM uses QHM 292; the Z PEM is a LaCour type instrument.
The PEM variometer system functioned without problems during 1991 and was not modified in any way. The Elsec 820 PPM showed intermittent spikes on the analogue charts, and in the digital data. They seemed to occur during interruptions to power when the PPM was powered via a DC supply by the SPS 1000 backup power supply. Similar spikes were observed on the analogue temperature trace when the SPS was cutting in and out rapidly (at a rate of 1Hz or faster) due to low voltage conditions at the variometer building. These conditions arise because the building is near the end of the station's mains supply line so that power demands along the line cause significant voltage drops at the variometer building. When the voltage level is borderline, the SPS cuts in and out rapidly causing spikes in the data. The problem only occurred over the summer period when power demands were high. One solution considered was to replace the SPS with an Invertec UPS where power is supplied at all times from the batteries that are trickle charged from the mains; this would remove the problem of power switching between mains and battery. However, as it turns out, the low voltage problem will most likely be rectified with the modification of the station mains supply to a ring system (expected to be during 1992). This may not remove all problems with the PPM as it has been observed to spike when there are no power problems, mainly during periods of increased magnetic activity - it appears to be an ongoing problem with the Elsec 820 PPMs.
Recording System
The variometer outputs are recorded by two separate systems, one analogue and one digital. The output from the PEM and Doric Trendicator are in analogue form. Output from the PPM is configured to be botb digital and analogue.
The five channels of analogue data (X, Y, Z, F and temperature) are transmitted from tbe variometer building over a long shielded data cable (325m), and recorded in the Mawson Science Building on a six channel W+W chart recorder at a rate of 2 cmIhr. Hourly time marks are produced on the charts from the GED master clock. The charts were used as a visual indication of the state of the field and as a final backup for the digital data. The chart-recorded data were not fully calibrated.
The analogue X,Y,Z and temperature data are digitised with a Data Translation DT289515716a NO board and recorded with the digital output from the PPM on an NEC ffiM-AT compatible PowerMate 1 Personal Computer located in the recorder room of the Variometer Building. The five channels of digital data are recorded as minute values onto hard disk. The digital data can also be accessed (and telemetered to Australia) from the BMR office in Canberra using the ANARESAT communications system to the SCience building and then via the long cable to
7
BUREAU OF MINERAL RESOURCES. GEOLOGY AND GEOPHYSICS. AUSTRALIA
the variometer building. The recording system can be interrogated from the Science Building with a Teletype TTY 43 printer terminal to check timing and correct operation.
The timing for the digital recording system is taken from the computer DOS clock, which is synchronised to the GED clock in the Science Building using minute pulses. The GED drifted by only 2-3ms per day during 1991 and was maintained to well within 50ms of UTe. The real time CMOS clock in the acquisition PC bas a drift rate of approximately 1 second per day and was frequently synchronised to the DOS clock.
Further details of the variometer instruments and recording system are described by Kelsey (1987), and Crosthwaite (1991).
The recording system functioned without problems in 1991. A minor modification was made to allow ASP to record the variometer outputs using their LSI111L0git system (so that they had compatible magnetometer data from Davis, Casey and Mawson). A cable had been laid from the ASP laboratory to the variometer building the previous summer and was connected on 8/1/91. A ASP-built interface box was inserted into the analogue line to the Science building, to split the data off to Aeronomy as well, wbere it was digitised and logged by ASP. The installation caused no noticeable changes to the data.
2.5 Variometer Calibrations and Parameters
Baseline Calibrations
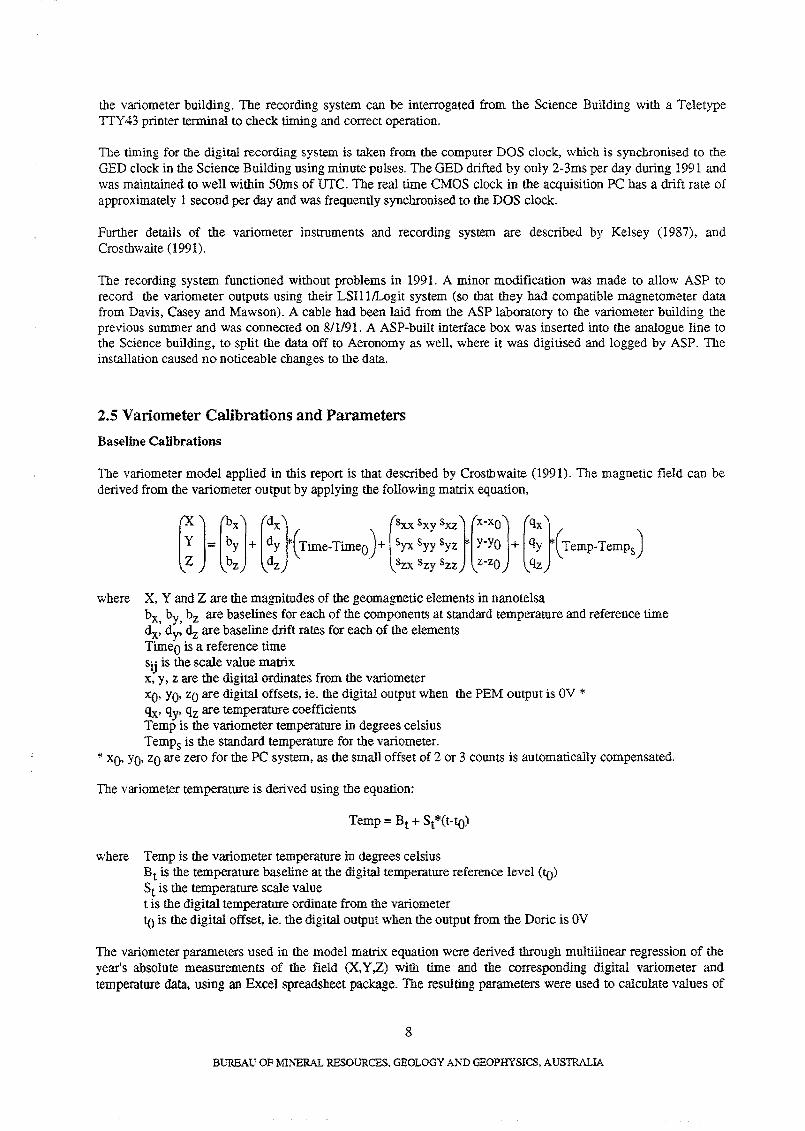
The variometer model applied in this report is that described by Crosthwaite (1991). The magnetic field can be derived from the variometer output by applying the follOwing matrix equation,
wbere X, Y and Z are the magnitudes of the geomagnetic elements in nanotelsa bx, by, bz are baselines for each of the components at standard temperature and reference time dx' dy' dz are baseline drift rates for each of the elements TimeO is a reference time Sij is the scale value matrix x, y, z are the digital ordinates from the variometer XO' YO' zO are digital offsets, ie. the digital output when the PEM output is OV * qx' qy' qz are temperature coefficients Temp is the variometer temperature in degrees celsius Temps is the standard temperature for the variometer.
* xo' Yo, zo are zero for the PC system, as the small offset of 2 or 3 counts is automatically compensated.
The variometer temperature is derived using the equation:
where Temp is the variometer temperature in degrees celsius Bt is the temperature baseline at the digital temperature reference level <to) St is the temperature scale value t is the digital temperature ordinate from the variometer to is the digital offset, ie. the digital output when the output from the Doric is OV
The variometer parameters used in the model matrix equation were derived through multilinear regression of the year's absolute measurements of the field (X,Y,z) with time and the corresponding digital variometer and temperature data, using an Excel spreadsheet package. The resulting parameters were used to calculate values of
8
BUREAU OF MINERAL RESOURCES. GEOLOGY Al\'D GEOPHYSICS, AUSTRALIA
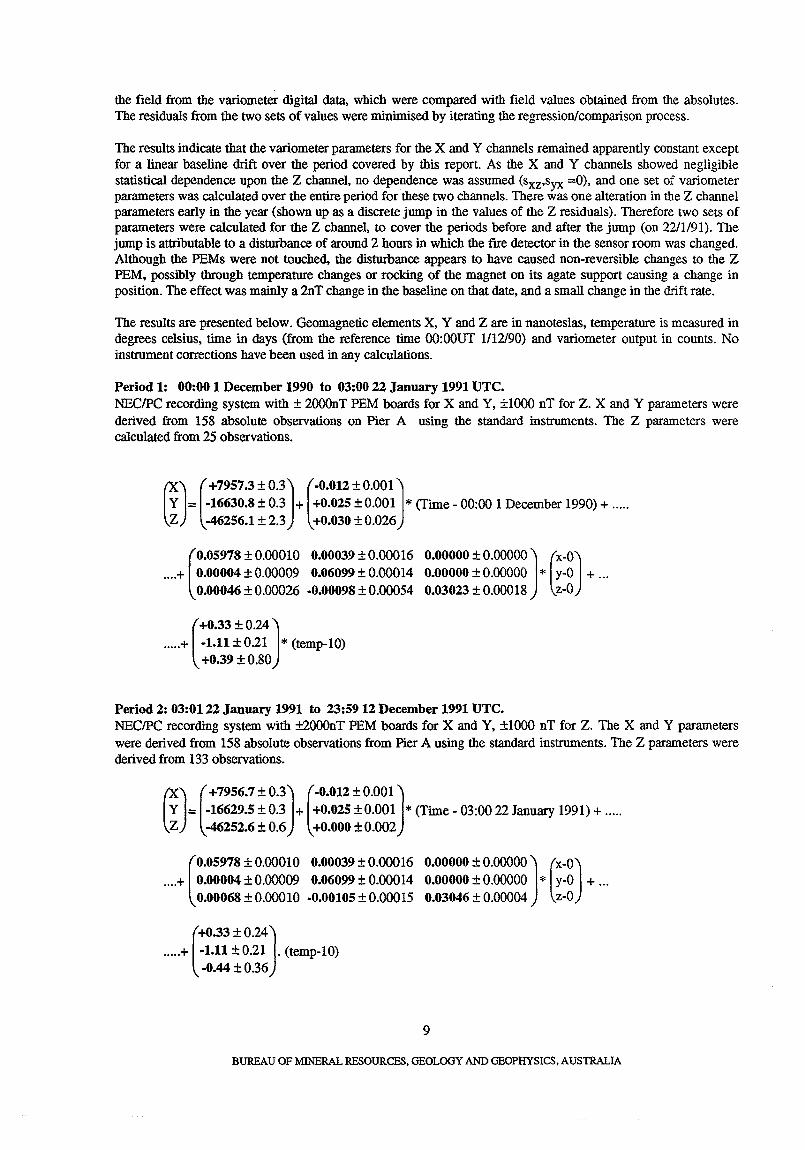
the field from the variometer digital data, which were compared with field values obtained from the absolutes. The residuals from the two sets of values were minimised by iterating the regression/comparison process.
The results indicate that the variometer parameters for the X and Y channels remained apparently constant except for a linear baseline drift over the period covered by this report. As the X and Y channels showed negligible statistical dependence upon the Z channel, no dependence was assumed (sxz,Syx =0), and one set of variometer parameters was calculated over the entire period for these two channels. There was one alteration in the Z channel parameters early in the year (shown up as a discrete jump in the values of the Z residuals). Therefore two sets of parameters were calculated for the Z channel, to cover the periods before and after the jump (on 22/l/91). The jump is attributable to a disturbance of around 2 hours in which the fire detector in the sensor room was changed. Although the PEMs were not touched. the disturbance appears to have caused non-reversible changes to the Z PEM, possibly through temperature changes or rocking of the magnet on its agate support causing a change in position. The effect was mainly a 2nT change in the baseline on that date, and a small change in the drift rate.
The results are presented below. Geomagnetic elements X, Y and Z are in nanoteslas, temperature is measured in degrees celsius, time in days (from the reference time OO:OOUT 1112/90) and variometer output in counts. No instrument corrections have been used in any calculations.
Period 1: 00:00 1 December 1990 to 03:00 22 January 1991 UTC. NECIPC recording system with ± 2000nT PEM boards for X and Y, ±1000 nT for Z. X and Y parameters were derived from 158 absolute observations on Pier A using the standard instruments. The Z parameters were calculated from 25 observations.
liJ (
+7957.3±0.3) (-0.012±0.001) Y = -16630.8 ± 0.3 + +0.025 ± 0.001 * (Time - 00:00 1 December 1990) + ..... Z -46256.1 ± 2.3 +0.030 ± 0.026
(
0.05978 ± 0.00010 0.00039 ± 0.00016 .... + 0.00004 ± 0.00009 0.06099 ± 0.00014
0.00046 ± 0.00026 -0.00098 ± 0.00054
(
+0.33±0.24J ..... + -1.11 ±0.21 * (temp-lO)
+O.39±0.80
0.00000 ± 0.00000 J (X-OJ 0.00000 ± 0.00000 * y-O + ... 0.03023 ± 0.00018 z-O
Period 2: 03:01 22 January 1991 to 23:59 12 December 1991 UTC. NECIPC recording system with ±2000nT PEM boards for X and Y, ±1000 nT for Z. The X and Y parameters were derived from 158 absolute observations from Pier A using the standard instruments. The Z parameters were derived from 133 observations.
liJ (
+7956.7 ± O.3J (-0.012 ± 0.001 J Y = -16629.5 ± 0.3 + +0.025 ± 0.001 * (Time - 03:0022 January 1991) + ..... Z -46252.6 ± 0.6 +0.000 ± 0.002
(
0.05978 ± 0.00010 0.00039 ± 0.00016 .... + 0.00004 ± 0.00009 0.06099 ± 0.00014
0.00068 ± 0.00010 -0.00105 ± 0.00015
(
+0.33 ± 0.24J ..... + -1.11 ± 0.21 . (temp-l0)
-0.44 ±0.36
0.00000 ± 0.00000 J (X-OJ 0.00000 ± 0.00000 * y-O + ... 0.03046 ± 0.00004 z-O
9
BUREAU OF MINERAL RESOURCES. GEOLOGY AND GEOPHYSICS. AUSTRALIA
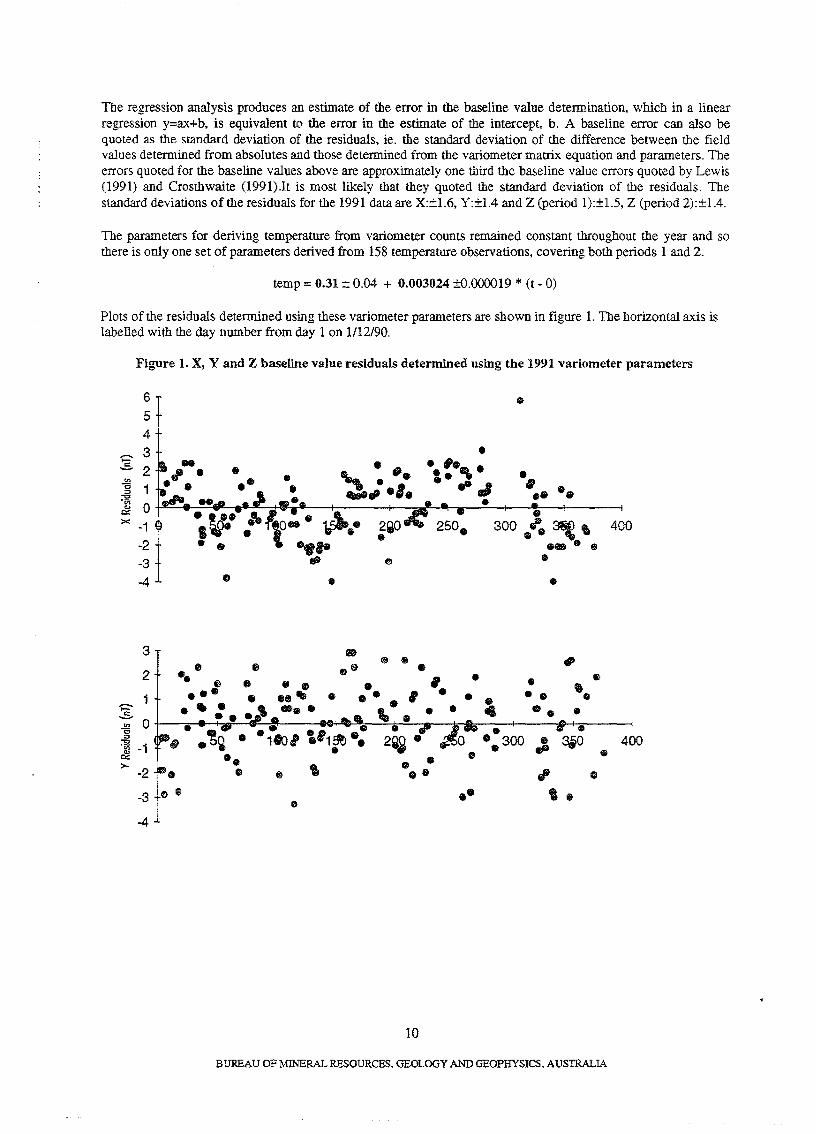
The regression analysis produces an estimate of the error in the baseline value determination, which in a linear regression y=ax+b, is equivalent to the error in the estimate of the intercept, b. A baseline error can also be quoted as the standard deviation of the residuals, ie. the standard deviation of the difference between the field values determined from absolutes and those determined from the variometer matrix equation and parameters. The errors quoted for the baseline values above are approximately one third the baseline value errors quoted by Lewis (1991) and Crosthwaite (1991).lt is most likely that they quoted the standard deviation of the residuals. The standard deviations of the residuals for the 1991 data are X:±1.6, Y:±1.4 and Z (period 1):±1.5, Z (period 2):±1.4.
The parameters for deriving temperature from variometer counts remained constant throughout the year and so there is only one set of parameters derived from 158 temperature observations, covering both periods 1 and 2.
temp = 0.31 ± 0.04 + 0.003024 ±O.OOOO19 * (t - 0)
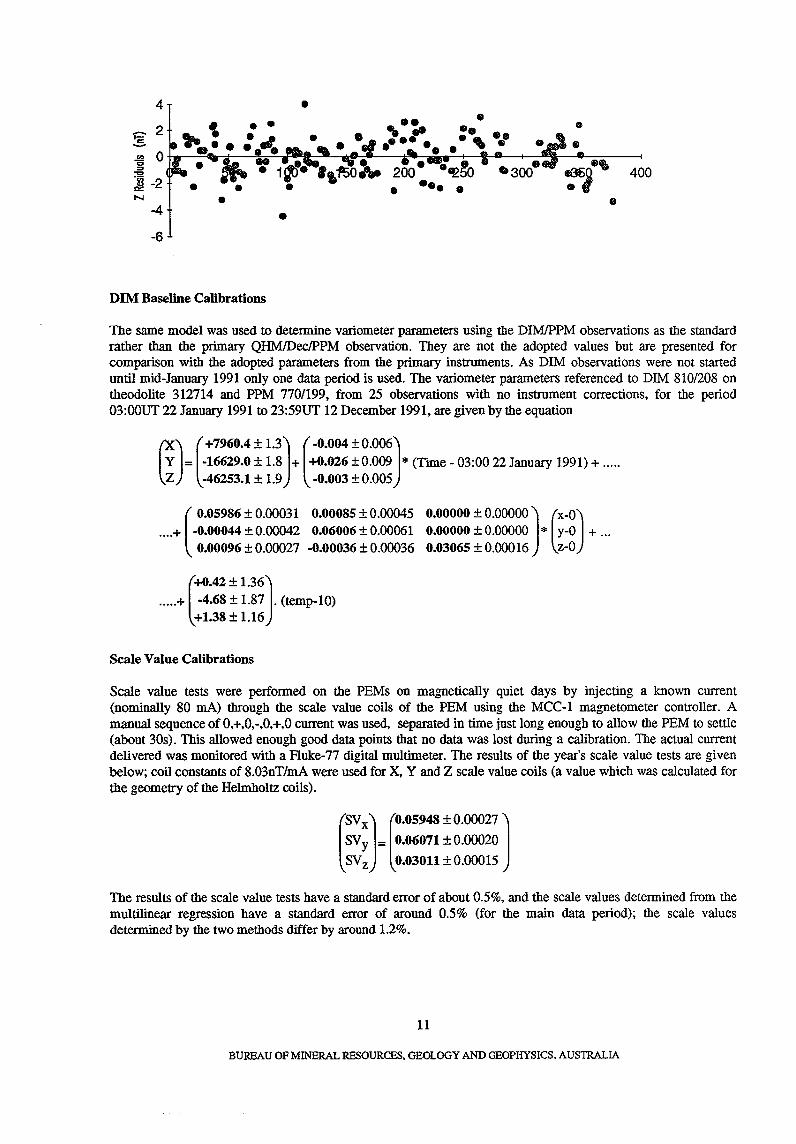
Plots of the residuals determined using these variometer parameters are shown in figure 1. The horizontal axis is labelled with the day number from day Ion 1112190.
~ '" "6 :::>
:E ..., 0>
0::;
x
~ .!!!
'" :::>
~ ~ >-
Figure 1. X, Y and Z baseline value residuals determined using the 1991 variometer parameters
6 5 4
3 2 1 0
-1 -2 -3
-4
3
2 eo • 1
0
-1
-2
-3 • III
-4
• .. •
.. • • • • • • CD
eote • -.. 41)
, •
10
• - 'e. _ .. -. . .. '" •
-. .0 eo
• 300 .'- ~,
••• II
• •
tP
'. e • • eo • • • • • 4. e. •
• GIl
• 300 18 ~O • riP .. • , II
.0 " 1&
BUREAU OF MINERAL RESOURCES. GEOLOGY AND GEOPHYSICS, AUSTRALIA
400
400
4 • 2 • p
...s. CD .5!! 0 co :::0 400 :E J;l -2 • N • • -4 •
-6
DIM Baseline Calibrations
The same model was used to deteIIDine variometer parameters using the DIMIPPM observations as the standard rather than the primary QHMlDeclPPM observation. They are not the adopted values but are presented for comparison with the adopted parameters from the primary instruments. As DIM observations were not started until mid-January 1991 only one data period is used. The variometer parameters referenced to DIM 810/208 on theodolite 312714 and PPM 7701199, from 25 observations with no instrument corrections, for the period 03:00UT 22 January 1991 to 23:59UT 12 December 1991, are given by the equation
u) (+7960.4 ± 1.3J (-0.004 ±O.006J Y = -16629.0 ± 1.8 + +0.026 ± 0.009 * (Time - 03:00 22 January 1991) + ..... Z -46253.1 ± 1.9 -0.003 ± 0.005
(
0.05986 ± 0.00031 0.00085 ± 0.00045 .... + -0.00044 ± 0.00042 0.06006 ± 0.00061
0.00096 ± 0.00027 -0.00036 ± 0.00036
(
+0.42 ± 1.36J ..... + -4.68 ± 1.87 . (temp-l0)
+1.38 ± 1.16
Scale Value Calibrations
0.00000 ± 0.00000 J (X-O) 0.00000 ± 0.00000 * y-O + ... 0.03065 ± 0.00016 z-O
Scale value tests were perfoIIDed on the PEMs on magnetically quiet days by injecting a known current (nominally 80 rnA) through the scale value coils of the PEM using the MCC-l magnetometer controller. A manual sequence of 0,+,0,-,0,+,0 current was used, separated in time just long enough to allow the PEM to settle (about 30s). This allowed enough good data points that no data was lost during a calibration. The actual current delivered was monitored with a Fluke-77 digital multimeter. The results of the year's scale value tests are given below; coil constants of 8.03nT/mA were used for X, Y and Z scale value coils (a value which was calculated for the geometry of the Helmholtz coils).
(
SV XJ (0.05948 ± 0.00027 J SV y = 0.06071 ± 0.00020
SV z 0.03011 ± 0.00015
The results of the scale value tests have a standard error of about 0.5%, and the scale values deteIIDined from the multilinear regression have a standard error of around 0.5% (for the main data period); the scale values determined by the two methods differ by around 1.2%.
11
BUREAU OF MINERAL RESOURCES, GEOLOGY AND GEOPHYSICS. AUSTRALIA
Orientation Calibrations
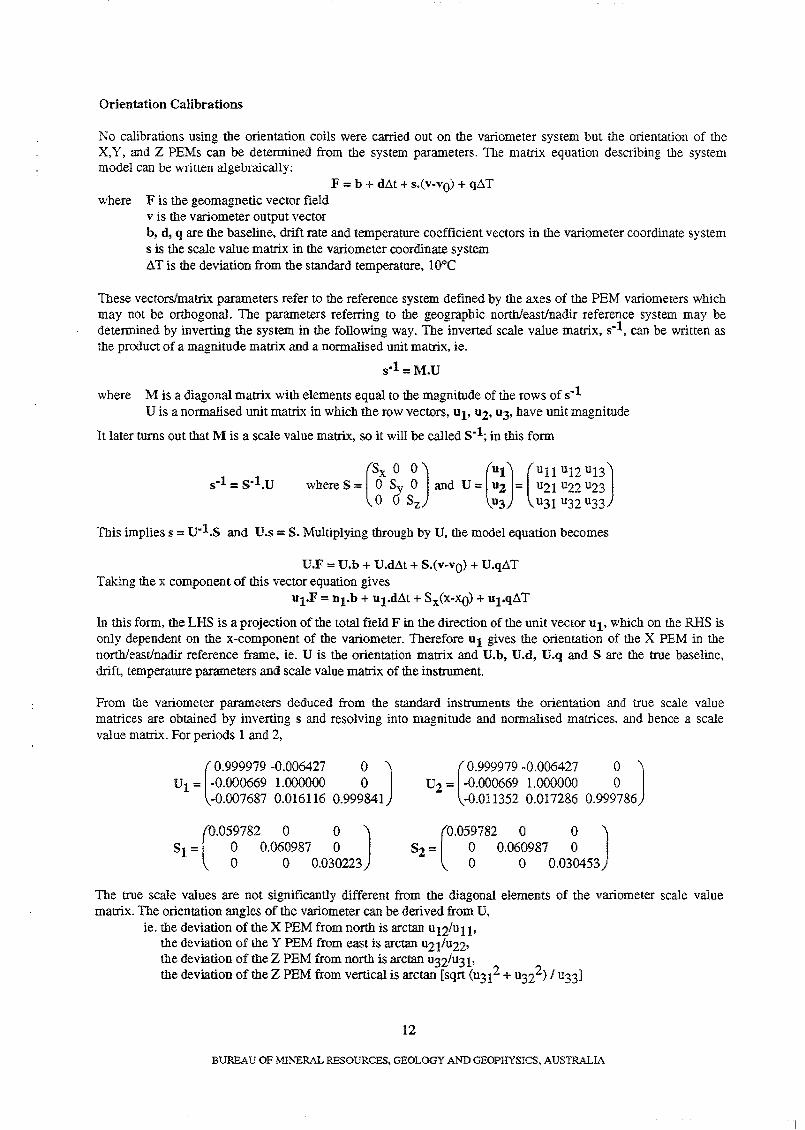
No calibrations using the orientation coils were carried out on the variometer system but the orientation of the X,Y, and Z PEMs can be determined from the system parameters. The matrix equation describing the system model can be written algebraically:
F = b + dD.t + s.(v-vo) + q.6. T where F is the geomagnetic vector field
v is the variometer output vector b, d, q are the baseline, drift rate and temperature coefficient vectors in the variometer coordinate system s is the scale value matrix in the variometer coordinate system .6. T is the deviation from the standard temperature, 10°C
These vectors/matrix parameters refer to the reference system defined by the axes of the PEM variometers which may not be orthogonal. The parameters referring to the geographic north/east/nadir reference system may be determined by inverting the system in the following way. The inverted scale value matrix, s·l, can be written as the product of a magnitude matrix and a normalised unit matrix, ie.
s·l =M.V
where M is a diagonal matrix with elements equal to the magnitude of the rows of s·l V is a normalised unit matrix in which the row vectors, u1' u2, u3, have unit magnitude
It later turns out that M is a scale value matrix, so it will be called S·l; in this form
where S = (~x ~ ~) and V:: (:~J = (~;~ ~g ~~;) o 0 Sz u3 u31 u32 u33
s·l = S·I.V
This implies s = U-1.S and U.s = S. Multiplying through by U, the model equation becomes
V.F = U.b + U.d.6.t + S.(v-vo) + V.q.6.T Taking the x component of tlIis vector equation gives
ul·F = nl.b + u1.d.1t + Sx(x-xO) + ul.q.1T
In this form, the LHS is a projection of the total field F in the direction of the unit vector ul, which on the RHS is only dependent on the x-component of the variometer. Therefore ul gives the orientation of the X PEM in the north/east/nadir reference frame, ie. V is the orientation matrix and V.b, V.d, U.q and S are the true baseline, drift, temperature parameters and scale value matrix of the instrument.
From the variometer parameters deduced from the standard instruments the orientation and true scale value matrices are obtained by inverting s and resolving into magnitude and normalised matrices, and hence a scale value matrix. For periods 1 and 2,
(
0.999979 -0.006427 0) VI = -0.000669 1.000000 0
-0.007687 0.016116 0.999841 (
0.999979 -0.006427 0) V2 = -0.000669 1.000000 0
-0.011352 0.017286 0.999786
(
0.059782 0 0) Sl = 0 0.060987 0
o 0 0.030223 (
0.059782 0 0) 82 = 0 0.060987 0
o 0 0.030453
The true scale values are not significantly different from the diagonal elements of the variometer scale value matrix. The orientation angles of the variometer can be derived from V,
ie. the deviation of the X PEM from north is arctan u12/u11, the deviation of me Y PEM from east is arctan u21/u22' the deviation of the Z PEM from north is arctan u32/u31. the deviation of the Z PEM from vertical is arctan [sqrt (U312 + U322) I u33]
12
BUREAU OF MIl\'ERAL RESOURCES, GEOLOGY AND GEOPHYSICS, AUSTRALIA
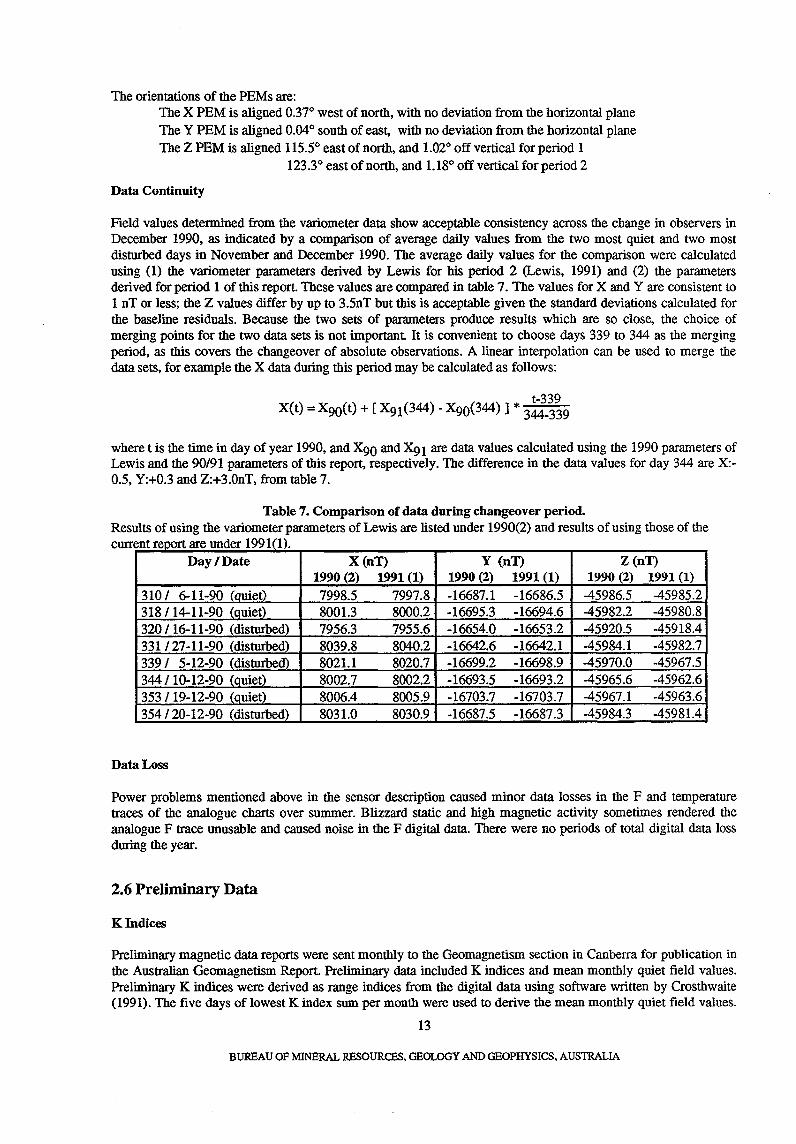
The orientations of the PEMs are: The X PEM is aligned 0.370 west of north, with no deviation from the horizontal plane The Y PEM is aligned 0.040 south of east, with no deviation from the horizontal plane The Z PEM is aligned 115.50 east of north, and 1.020 off vertical for period I
123.30 east of north, and 1.180 off vertical for period 2
Data Continuity
Field values determined from the variometer data show acceptable consistency across the change in observers in December 1990, as indicated by a comparison of average daily values from the two most quiet and two most disturbed days in November and December 1990. The average daily values for the comparison were calculated using (1) the variometer parameters derived by Lewis for his period 2 (Lewis, 1991) and (2) the parameters derived for period 1 of this report. These values are compared in table 7. The values for X and Y are consistent to 1 nT or less; the Z values differ by up to 3.5nT but this is acceptable given the standard deviations calculated for the baseline residuals. Because the two sets of parameters produce results which are so close, the choice of merging points for the two data sets is not important It is convenient to choose days 339 to 344 as the merging period, as this covers the changeover of absolute observations. A linear interpolation can be used to merge the data sets, for example the X data during this period may be calculated as follows:
t-339 X(t) = X90(t) + [X91 (344) - X90(344) ] * 344-339
where t is the time in day of year 1990, and X90 and X91 are data values calculated using the 1990 parameters of Lewis and the 90/91 parameters of this report, respectively. The difference in the data values for day 344 are X:-0.5, Y:+0.3 and Z:+3.OnT, from table 7.
Table 7. Comparison of data during changeover period. Results of using the variometer parameters of Lewis are listed under 1990(2) and results of using those of the
ent report are under 1991(1). curr Day/Date X(nT) Y (nT) Z(nT)
1990 (2) 1991 (1) 1990 (2) 1991 (1) 1990 (2) 1991 (1)
3101 6-11-90 (auiet) 7998.5 7997.8 -16687.1 -16686.5 -45986.5 -45985.2 318/14-11-90 (auiet) 8001.3 8000.2 -16695.3 -16694.6 -45982.2 -45980.8 320/16-11-90 (disturbed) 7956.3 7955.6 -16654.0 -16653.2 -45920.5 -45918.4 331/27-11-90 (disturbed) 8039.8 8040.2 -16642.6 -16642.1 -45984.1 -45982.7 3391 5-12-90 (disturbed) 8021.1 8020.7 -16699.2 -16698.9 -45970.0 -45967.5 34411 0-12-90 (quiett 8002.7 8002.2 -16693.5 -16693.2 -45965.6 -45962.6 353/19-12-90 (quiet) 8006.4 8005.9 -16703.7 -16703.7 -45967.1 -45963.6 354/20-12-90 (disturbed) 8031.0 8030.9 -16687.5 -16687.3 -45984.3 -45981.4
Data Loss
Power problems mentioned above in the sensor description caused minor data losses in the F and temperature traces of the analogue charts over summer. Blizzard static and high magnetic activity sometimes rendered the analogue F trace unusable and caused noise in the F digital data. There were no periods of total digital data loss during the year.
2.6 Preliminary Data
KIndices
Preliminary magnetic data reports were sent monthly to the Geomagnetism section in Canberra for publication in the Australian Geomagnetism Report. Preliminary data included K indices and mean monthly quiet field values. Preliminary K indices were derived as range indices from the digital data using software written by Crosthwaite (1991). The five days of lowest K index sum per month were used to derive the mean monthly quiet field values.
13
BUREAU OF MINERAL RESOURCES. GEOLOGY AND GEOPHYSICS. AUSTRALIA
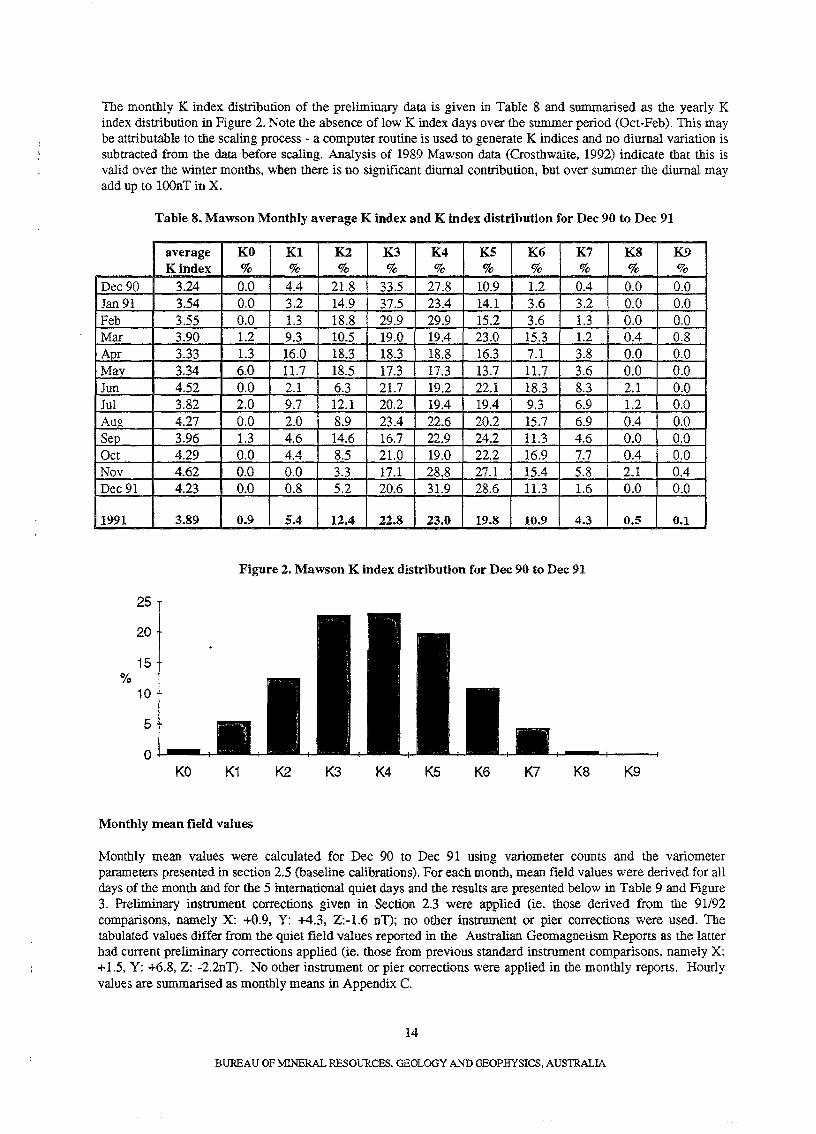
The monthly K index distribution of the preliminary data is given in Table 8 and summarised as the yearly K index distribution in Figure 2. Note the absence of low K index days over the summer period COct-Feb). This may be attributable to the scaling process - a computer routine is used to generate K indices and no diurnal variation is subtracted from the data before scaling. Analysis of 1989 Mawson data (Crosthwaite, 1992) indicate that this is valid over the winter months, when there is no significant diurnal contribution, but over summer the diurnal may add up to lOOnT in X.
Table 8. Mawson Monthly average K index and K index distribution for Dec 90 to Dec 91
average KO Kl K2 K3 K4 K5 K6 K7 KS K9 Kindex % % % % % % % % % %
Dec 90 3.24 0.0 4.4 21.8 33.5 27.8 10.9 1.2 0.4 0.0 0.0 Jan 91 3.54 0.0 3.2 14.9 37.5 23.4 14.1 3.6 3.2 0.0 0.0 Feb 3.55 0.0 1.3 18.8 29.9 29.9 15.2 3.6 1.3 0.0 0.0 Mar 3.90 1.2 9.3 10.5 19.0 19.4 23.0 15.3 1.2 0.4 0.8 Ap~ 3.33 1.3 16.0 18.3 18.3 18.8 16.3 7.1 3.8 0.0 0.0 May 3.34 6.0 11.7 18.5 17.3 17.3 13.7 11.7 3.6 0.0 0.0 Jun 4.52 0.0 2.1 6.3 21.7 19.2 22.1 18.3 8.3 2.1 0.0 Jul 3.82 2.0 9.7 12.1 20.2 19.4 19.4 9.3 6.9 1.2 0.0 Aug 4.27 0.0 2.0 8.9 23.4 22.6 20.2 15.7 6.9 0.4 0.0 Sep 3.96 1.3 4.6 14.6 16.7 22.9 24.2 11.3 4.6 0.0 0.0 Oct 4.29 0.0 4.4 8.5 21.0 19.0 22.2 16.9 7.7 0.4 0.0 Nov 4.62 0.0 0.0 3.3 17.1 28.8 27.1 15.4 5.8 2.1 0.4 Dec 91 4.23 0.0 0.8 5.2 20.6 31.9 28.6 11.3 1.6 0.0 0.0
1991 3.S9 0.9 5.4 12.4 22.8 23.0 19.8 10.9 4.3 0.5 0.1
Figure 2. Mawson K index distribution for Dec 90 to Dec 91
25
20
15 %
10
5
0 KO K1 K2 K3 K4 K5 K6 K7 K8 Kg
Monthly mean field values
Monthly mean values were calculated fOf Dec 90 to Dec 91 using variometer counts and the variometer parameters presented in section 2.5 (baseline calibrations). For each month, mean field values were derived for all days of the month and for the 5 international quiet days and the results are presented below in Table 9 and Figure 3. Preliminary instrument corrections given in Section 2.3 were applied (ie. those derived from the 91/92 comparisons, namely X: +0.9, Y: +4.3, Z:-1.6 nn; no other instrument or pier corrections were used. The tabulated values differ from the quiet field values reported in the Australian Geomagnetism Reports as the latter had current preliminary corrections applied (ie. those from previous standard instrument comparisons, namely X: +1.5, Y: +6.8, Z: -2.2nn. No other instrument or pier corrections were applied in the monthly reports. Hourly values are summarised as monthly means in Appendix C.
14
BUREAU OF MINERAL RESOURCES. GEOLOGY AND GEOPHYSICS. AUSTRALIA
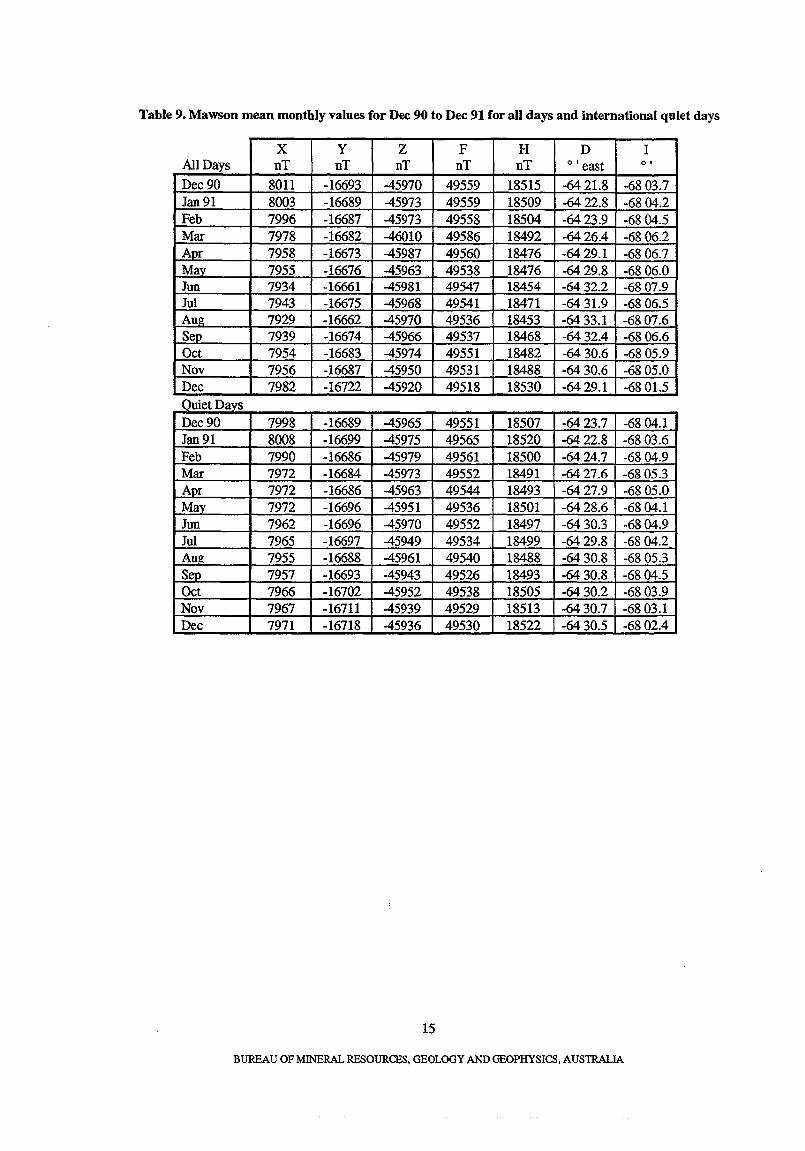
Table 9. Mawson mean monthly values for Dec 90 to Dec 91 for all days and international quiet days
x y Z F H D I All Days nT nT nT nT nT 0' east 0'
Dec 90 8011 -16693 -45970 49559 18515 -64 21.8 -6803.7 Jan 91 8003 -16689 -45973 49559 18509 -6422.8 -6804.2 Feb 7996 -16687 -45973 49558 18504 -64 23.9 -6804.5 Mar 7978 -16682 -46010 49586 18492 -64 26.4 -6806.2 Apr 7958 -16673 -45987 49560 18476 -64 29.1 -6806.7 May 7955 -16676 -45963 49538 18476 -64 29.8 -6806.0 Jun 7934 -16661 -45981 49547 18454 -64 32.2 -6807.9 Jut 7943 -16675 -45968 49541 18471 -64 31.9 -6806.5 Au~ 7929 -16662 -45970 49536 18453 -64 33.1 -6807.6 Sep 7939 -16674 -45966 49537 18468 -64 32.4 -6806.6 Oct 7954 -16683 -45974 49551 18482 -64 30.6 -6805.9 Nov 7956 -16687 -45950 49531 18488 -64 30.6 -6805.0 Dec 7982 -16722 -45920 49518 18530 -64 29.1 -6801.5 Quiet Days Dec 90 7998 -16689 -45965 49551 18507 -64 23.7 -6804.1 Jan 91 8008 -16699 -45975 49565 18520 -64 22.8 -6803.6 Feb 7990 -16686 -45979 49561 18500 -64 24.7 -6804.9 Mar 7972 -16684 -45973 49552 18491 -64 27.6 -6805.3 Apr 7972 -16686 -45963 49544 18493 -6427.9 -6805.0 May 7972 -16696 -45951 49536 18501 -64 28.6 -6804.1 Jun 7962 -16696 -45970 49552 18497 -64 30.3 -6804.9 Jut 7965 -16697 -45949 49534 18499 -64 29.8 -6804.2 Aug 7955 -16688 -45961 49540 18488 -64 30.8 -6805.3 Sep 7957 -16693 -45943 49526 18493 -64 30.8 -6804.5 Oct 7966 -16702 -45952 49538 18505 -64 30.2 -6803.9 Nov 7967 -16711 -45939 49529 18513 -64 30.7 -6803.1 Dec 7971 -16718 -45936 49530 18522 -64 30.5 -6802.4
15
BUREAU OF MINERAL RESOURCES, GEOLOGY AND GEOPHYSICS. AUSTRALIA
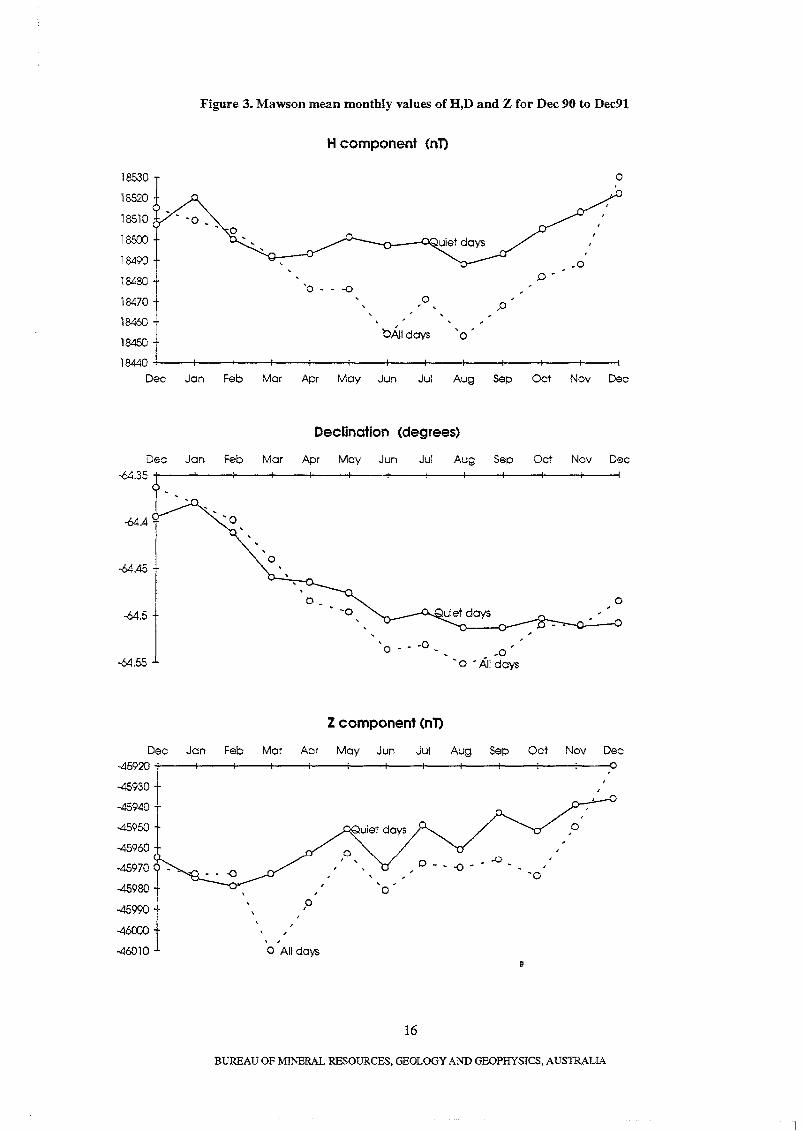
Figure 3. Mawson mean monthly values of H,D and Z for Dec 90 to Dec91
H component (n1)
18530 0
18520
18510
18500
18490
18480 {:) .
'0 - - -0 18470 ° ,0 , ,
18460 bNldays
, . 18450
0
18440 Dec Jan Feb Mar Apr May Jun Jul Aug Sap Oct Nov Dec
Declination (degrees)
Dec Jan Feb Mar Apr May Jun Jul Aug Sep Oct Nov Dec -64.35 +---+----1---+---+----1---+---+---+----\---+---+---1
-64 A
-64.45
~.5
-64,55
Dec Jan -45920
-45930
-45940
-45950
-45960
-45970
-45980
-45990
-46000
-46010
o
'0 •• -0 ,
Z component (n1)
Feb Mar Apr May Jun Jul
, . 0
0 ,
, , o All days
16
.0 '0 • All days
Aug Sap Oct
o
Nov Dec
0 ,
BUREAU OF Mll\'ERAL RESOURCES. GEOLOGY AND GEOPHYSICS, AUSTRALIA
2.7 Digital Communications
Telemetry was available between the ASC Unix network and a 300 baud data line to the acquisition PC (variometer hut) and a 1200 baud terminal line to the office PC (science building). The data line was used for telemetry on demand, controlled from Canberra - real time data flow was not used because of loss problems. Ie-11 RS-2321RS-485 converters were used as line drivers between the Variometer building and the science building, and both the data and terminal lines used Schmidt model 123AT modems to transmit to the Anaresat module, where they were received by a rack mounted Consolidated Electronics 123AD modem. From there the signal was transmitted via satellite to Ceduna, on to Broadway in Sydney and then to ASC, Canberra.
Both circuits were very susceptible to malfunction due to power failures, bad data and blizzard static, and required frequent (approximately weekly) resetting and fault finding. Intermittent equipment problems occurred often in all stages of the circuit, modems and statistical multiplexers at Mawson, Broadway and Canberra. The problems were rectified by component resets. On 29 April the Schmidt modems in the Science building and the CE modem in Anaresat were replaced by Blackbox 4-wire linedrivers, after which only 2 or 3 malfunctions occurred for the remainder of the year.
On 16 July a terminal line was installed from the Science building to the Antarctic Division V AX. network via the Equinox in radio VL V. This was invaluable for processing Davis and Casey variometer data.
2.8 Micropulsations Magnet Calibrations
During the 90/91 summer, a geophysicist from the University of Newcastle, Ian Dunlop, was working at Mawson upgrading the magnetic micropulsations experiment (normally operated by the ASP section). He requested assistance in calibrating the bar magnet used in the "gamma-slinger" calibrator. The DIM was used with the technique described in Crosthwaite (1991). Briefly, the DIM was mounted on pier A with the optical axis horizontal and perpendicular to the magnetic field. A tripod was set up a known distance from the DIM along the optical axis, and at a height such that the bar magnet would be level with the DIM sensor when placed on the tripod. The DIM was nulled before placing the magnet on the tripod and recording the field intensity measured by the DIM. The bar magnet was reversed several times to offset any small misalignment from magnetic east/west. The procedure took only 30 seconds so no allowance was made for variations in the earth's field. Using the formula 2M cose 1 r3 where M is the dipole magnetic moment, r, and e are the polar coordinates of the sensing point relative to the dipole axis, then the measured value of M for magnet 31 was 650.2 nT .m3.
This technique assumed that the DIM is a true absolute instrument. This was tested by using the DIM to measure the magnetic field intensity and comparing with that measured by PPM 199 at the same time. In order to do this using the nT rather than the J..lT scale on the DIM, it was nulled in the horizontal plane, then rotated by a small (measured) angle. This caused a small component of the field along the sensor axis to be observed. The corresponding total field was measured with the PPM, and simple geometry used to determined what the observed small component should have been. The DIM error was negligible (0.2%) assuming the PPM to be correct. The result quoted above compares well with that quoted by Crosthwaite (1991) for magnet 31 (652.9 nT.m3 including a correction for the DIM).
17
BUREAU OF MINERAL RESOURCES, GEOLOGY AND GEOPHYSICS, AUSTRALIA
CHAPTER 3. MAWSON SEISMOLOGICAL OBSERVATORY
Seismic activity is monitored and continuously recorded by two separate systems at the Mawson observatory. One consists of sbort and long period analogue seismometers recording to local helicorders; the second consists of wide band Guralp seismometers wbose data is telemetered in real time to the Australian Seismological Centre in Canberra. Seismometers for both systems were located in the Cosmic Ray Vault, at the bottom of a 13 metre deep sbaft beneath the Cosray Building.
3.1 Analogue System
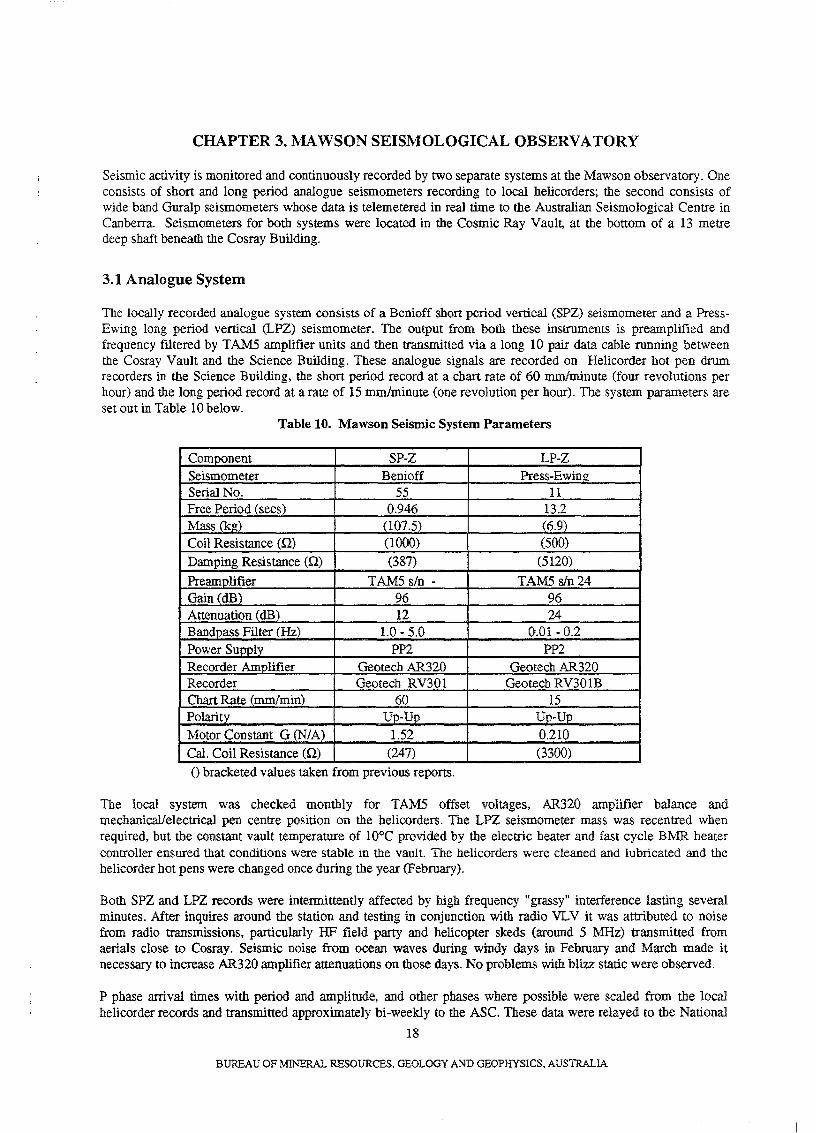
The locally recorded analogue system consists of a Benioff short period vertical (SPZ) seismometer and a PressEwing long period vertical (LPZ) seismometer. The output from both these instruments is preamplified and frequency ftltered by T AM5 amplifier units and then transmitted via a long 10 pair data cable running between the Cosray Vault and the Science Building. These analogue signals are recorded on Helicorder bot pen drum recorders in the Science Building, the short period record at a cbart rate of 60 mm1minute (four revolutions per hour) and the long period record at a rate of 15 mmJminute (one revolution per bour). The system parameters are set out in Table 10 below.
Table 10. Mawson Seismic System Parameters
Component SP-z LP-Z Seismometer Benioff Press-Ewing Serial No. 55 11 Free Period (sees) 0.946 13.2 Mass (kg) (107.5) (6.9) Coil Resistance (Q) (1000) (500)
Damping Resistance en) (387) (5120)
Preamplifier TAMS sin - TAMS sin 24 Gain (dB) 96 96 Attenuation (dB). 12 24 Bandpass Filter (Hz) 1.0 - 5.0 0.01 - 0.2 Power Supply PP2 PP2 Recorder Amplifier Geotech AR320 Geotech AR320 Recorder Geotecb RV301 Geotech RV30lB Chart Rate (mmlmin) 60 15 Polarity Up-Up Up-Up
Motor Constant G (N/A) 1.52 0.210 Cal. Coil Resistance (n) (247) (3300)
o bracketed values taken from previous reports.
The local system was cbecked monthly for TAMS offset voltages, AR320 amplifier balance and mechanical/electrical pen centre position on the helicorders. The LPZ seismometer mass was recentred when required, but the constant vault temperature of 10°C provided by the electric beater and fast cycle B:MR beater controller ensured that conditions were stable in the vault. The helicorders were cleaned and lubricated and the belicorder bot pens were changed once during the year (February).
Both SPZ and LPZ records were intermittently affected by high frequency "grassy" interference lasting several minutes. After inquires around the station and testing in conjunction with radio VL V it was attributed to noise from radio transmissions, particularly HF field party and helicopter skeds (around 5 MHz) transmitted from aerials close to Cosray. Seismic noise from ocean waves during windy days in February and March made it necessary to increase AR320 amplifier attenuations on fuose days. No problems with blizz static were observed.
P phase arrival times with period and amplitude, and other phases wbere possible were scaled from the local helicorder records and transmitted approximately bi-weekly to the ASC. These data were relayed to the National
18
BUREAU OF MIl\'ERAL RESOURCES, GEOLOGY AND GEOPHYSICS, AUSTRALIA
Earthquake Information Service via the Global Telecommunications System. Quick Epicentre Determination files (QEDs) were accessed on the ASC Sun via the terminal line and used occasionally to check the scalings. A total of about 700 events were reported throughout the year, less than half the number in 1990. This is most likely due to the subjectivity of differentiating between ice and earth movements; as this skill is basically self-taught, the results vary between individuals. Ice movements were common on records throughout the year but increased with the onset of the summer melt in November and decreased with the freeze in April. One identifiable icefall occurred in West Bay on 02/3/91.
Notification of all nuclear explosions recorded by the Australian nuclear monitoring network were received via telex. Some of the explosions during 1991 were also recorded by the SPZ system at Mawson, including confirmed blasts on 4 April and 16 April from Nevada. USA, and on 29 May and 15 June from Mumroa.
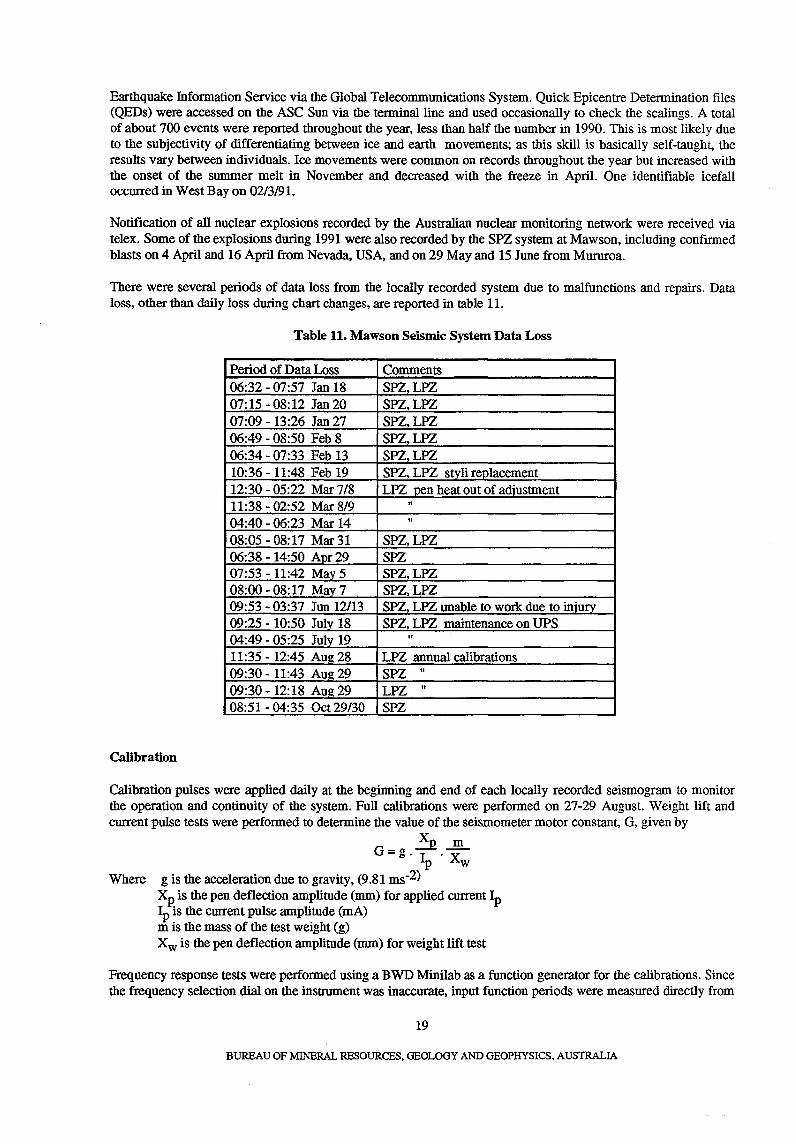
There were several periods of data loss from the locally recorded system due to malfunctions and repairs. Data loss, other than daily loss during chart changes, are reported in table 11.
Table 11. Mawson Seismic System Data Loss
Period of Data Loss Comments 06:32 - 07:57 Jan 18 SPZ,LPZ 07:15 - 08:12 Jan 20 SPZ,LPZ 07:09 - 13:26 Jan 27 SPZ,LPZ 06:49 - 08:50 Feb 8 SPZ,LPZ 06:34 - 07:33 Feb 13 SPZ,LPZ 10:36 - 11:48 Feb 19 SPZ, LPZ styli replacement 12:30 - 05:22 Mar 7/8 LPZ ~n heat out of a<!iustment 11:38 - 02:52 Mar 8/9 It
04:40 - 06:23 Mar 14 It
08:05 - 08:17 Mar 31 SPZ,LPZ 06:38 - 14:50 Apr 29 SPZ 07:53 -11:42 May 5 SPZ,LPZ 08:00 - 08:17 May 7 SPZ,LPZ 09:53 - 03:37 Jun 12113 SPZ, LPZ unable to work due to injlLry 09:25 - 10:50 July 18 SPZ, LPZ maintenance on UPS 04:49 - 05:25 July 19 " 11:35 - 12:45 Aug28 LPZ annual calibrations 09:30 - 11:43 Aug29 SPZ It
09:30 - 12: 18 Au~ 29 LPZ It
08:51 - 04:35 Oct 29/30 SPZ
Calibration
Calibration pulses were applied daily at the beginning and end of each locally recorded seismogram to monitor the operation and continuity of the system. Full calibrations were performed on 27-29 August. Weight lift and current pulse tests were performed to determine the value of the seismometer motor constant, G, given by
~ m G=g'I 'X P w
Where g is the acceleration due to gravity, (9.81 ms-2) Xp is the pen deflection amplitude (mm) for applied current Ip Ip is the current pulse amplitude (rnA) m is the mass of the test weight (g) Xw is the pen deflection amplitude (mm) for weight lift test
Frequency response tests were performed using a BWD Minilab as a function generator for the calibrations. Since the frequency selection dial on the instrument was inaccurate, input function periods were measured directly from
19
BUREAU OF MINERAL RESOURCES, GEOLOGY AND GEOPHYSICS, AUS1RALIA
the seismograms. Input currents were monitored by measuring the voltage across a 10010. resistor with a Fluke-77 digital multimeter, and the input wave forms were monitored with an oscilloscope. From the reSUlts, the seismometer amplification for sinusoidal input functions of various frequencies is calculated using the equation:
A. (2nf)2. M Mag. = G. Is
where Mag is the seismometer magnification A is the peak to peak pen deflection amplitude (mm) f is the frequency of the input sinusoidal signal (Hz) Is is peak to peak current through the coil of the input signal (rnA) M is the seismometer mass (kg)
SPZ Seismometer Calibrations
The following equipment settings were used during the calibrations: T AM5 Gain = 96 dB
Attenuation = 12 dB Bandpass = 1 to 5 Hz
AR320 Attenuation = 24 dB Weight lift tests were done using weigbts of masses 111.5, 202.2, 301.5 and 357.4 mg. Pulse tests were done with currents of 0.212,0.431,0.894 and 1.606 mAo
The results gave a mean value of G = 1.52 ±O.OS NI A The measured free period was T = 0.946s
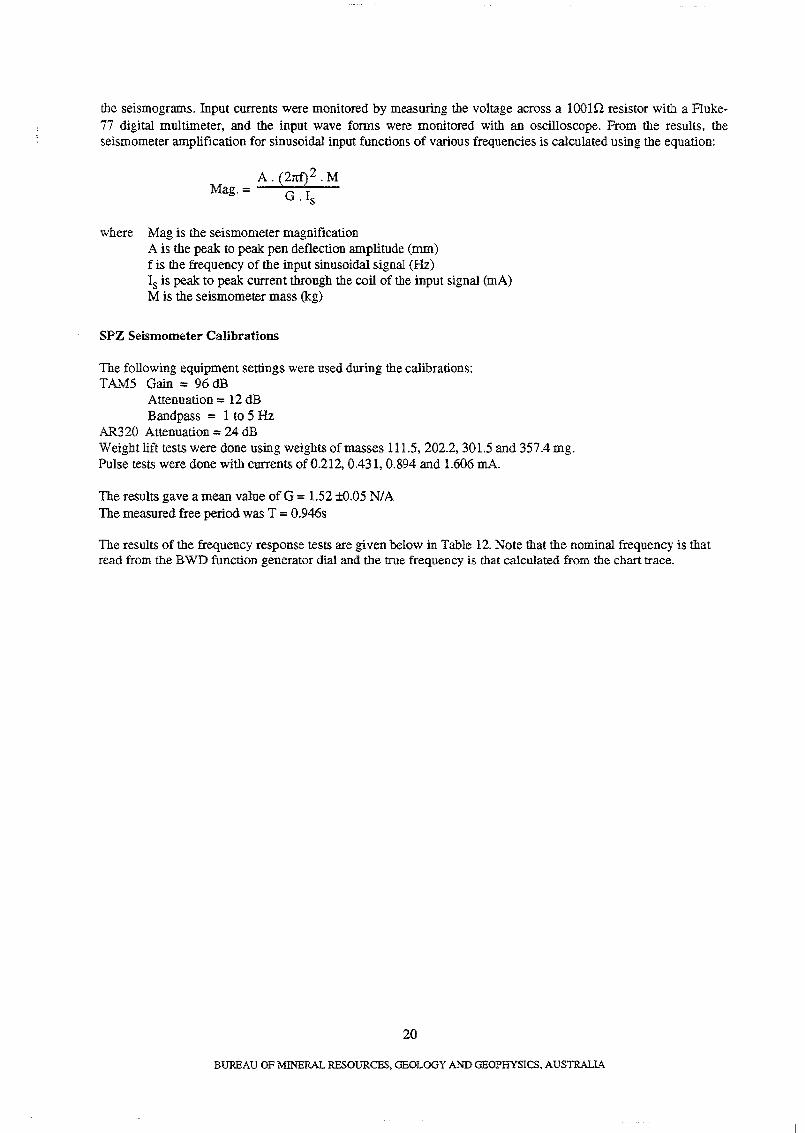
The results of the frequency response tests are given below in Table 12. Note that the nominal frequency is that read from the BWD function generator dial and the true frequency is that calculated from the chart trace.
20
BUREAU OF MINERAL RESOURCES, GEOLOGY AND GEOPHYSICS, AUSTRALIA
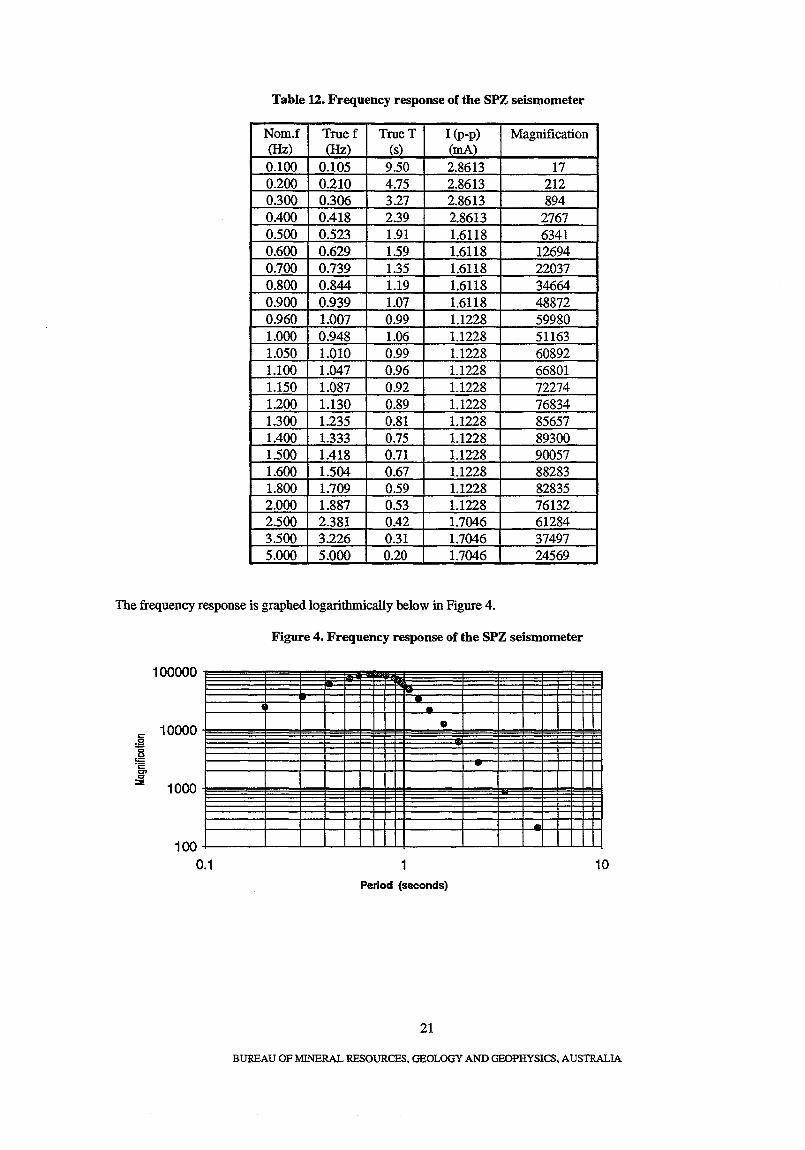
Table 12. Frequency response of the SPZ seismometer
Nom.f Truef TrueT I (P-p) Magnification (Hz) (Hz) (~- JmA) 0.100 0.105 9.50 2.8613 17 0.200 0.210 4.75 2.8613 212 0.300 0.306 3.27 2.8613 894 0.400 0.418 2.39 2.8613 2767 0.500 0.523 1.91 1.6118 6341 0.600 0.629 1.59 1.6118 12694 0.700 0.739 1.35 1.6118 22037 0.800 0.844 1.19 1.6118 34664 0.900 0.939 1.07 1.6118 48872 0.960 1.007 0.99 1.1228 59980 1.000 0.948 1.06 1.1228 51163 1.050 1.010 0.99 1.1228 60892 1.100 1.047 0.96 1.1228 66801 1.150 1.087 0.92 1.1228 72274 1.200 1.130 0.89 1.1228 76834 1.300 1.235 0.81 1.1228 85657 1.400 1.333 0.75 1.1228 89300 1.500 1.418 0.71 1.1228 90057 1.600 1.504 0.67 1.1228 88283 1.800 1.709 0.59 1.1228 82835 2.000 1.887 0.53 1.1228 76132 2.500 2.381 0.42 1.7046 61284 3.500 3.226 0.31 1.7046 37497 5.000 5.000 0.20 1.7046 24569
The frequency response is graphed logarithmically below in Figure 4.
100000
10000 ~ ~ 'E en co
::::E 1000
100 0.1
Figure 4. Frequency response of the SPZ seismometer
'1 •
• ..
-1 10
Period (seconds)
21
BUREAU OF MINERAL RESOURCES. GEOLOGY AND GEOPHYSICS. AUSTRALIA
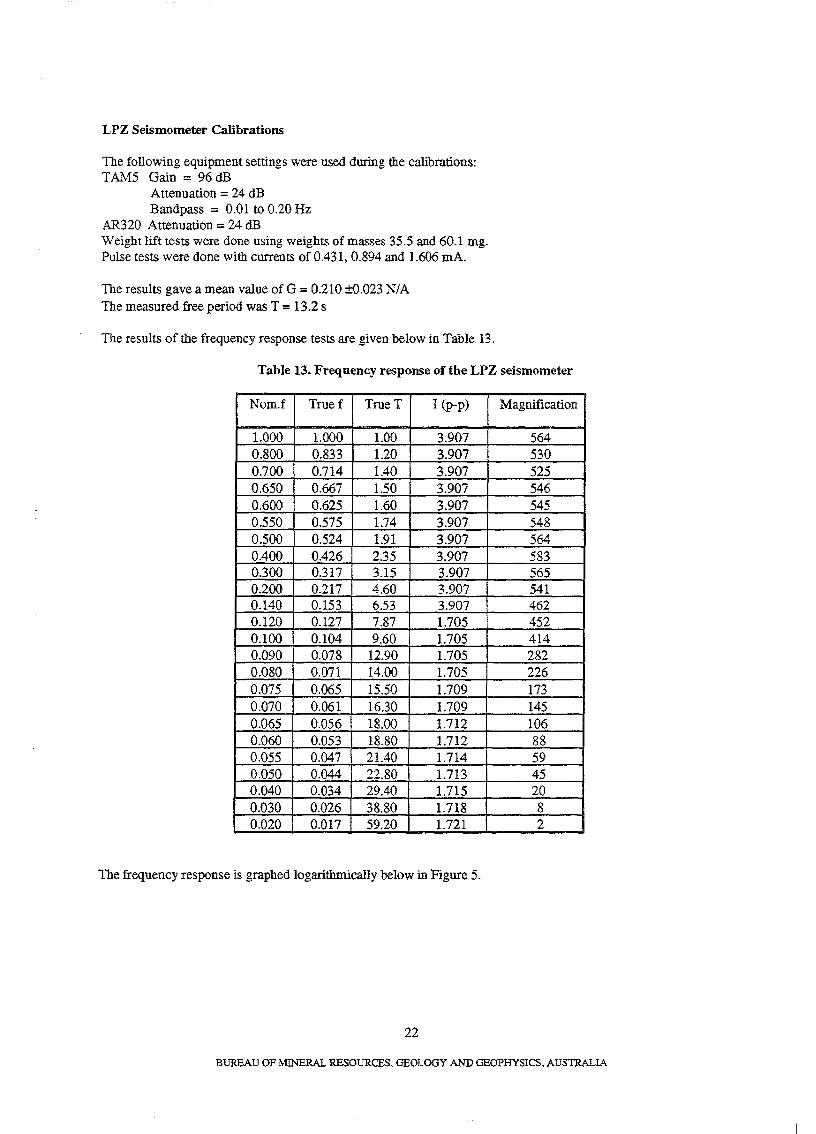
LPZ Seismometer Calibrations
The following equipment settings were used during the calibrations: T AM5 Gain = 96 dB
Attenuation = 24 dB Bandpass = 0.01 to 0.20 Hz
AR320 Attenuation = 24 dB Weight lift tests were done using weights of masses 35.5 and 60.1 mg. Pulse tests were done with currents of 0.431, 0.894 and 1.606 mAo
The results gave a mean value of G = 0.210 10.023 N/A The measured free period was T = 13.2 s
The results of the frequency response tests are given below in Table 13.
Table 13. Frequency response of the LPZ seismometer
Nom.f Truef TrueT I (P-p) Magnification
1.000 1.000 1.00 3.907 564 0.800 0.833 1.20 3.907 530 0.700 0.714 1.40 3.907 525 0.650 0.667 1.50 3.907 546 0.600 0.625 1.60 3.907 545 0.550 0.575 1.74 3.907 548 0.500 0.524 1.91 3.907 564 00400 0.426 2.35 3.907 583 0.300 0.317 3.15 3.907 565 0.200 0.217 4.60 3.907 541 0.140 0.153 6.53 3.907 462 0.120 0.127 7.87 1.705 452 0.100 0.104 9.60 1.705 414 0.090 0.078 12.90 1.705 282 0.080 0.071 14.00 1.705 226 0.075 0.065 15.50 1.709 173 0.070 0.061 16.30 1.709 145 0.065 0.056 18.00 1.712 106 0.060 0.053 18.80 1.712 88 0.055 0.047 21.40 1.714 59 0.050 0.044 22.80 1.713 45 0.040 0.034 29.40 1.715 20 0.030 0.026 38.80 1.718 8 0.020 0.017 59.20 1.721 2
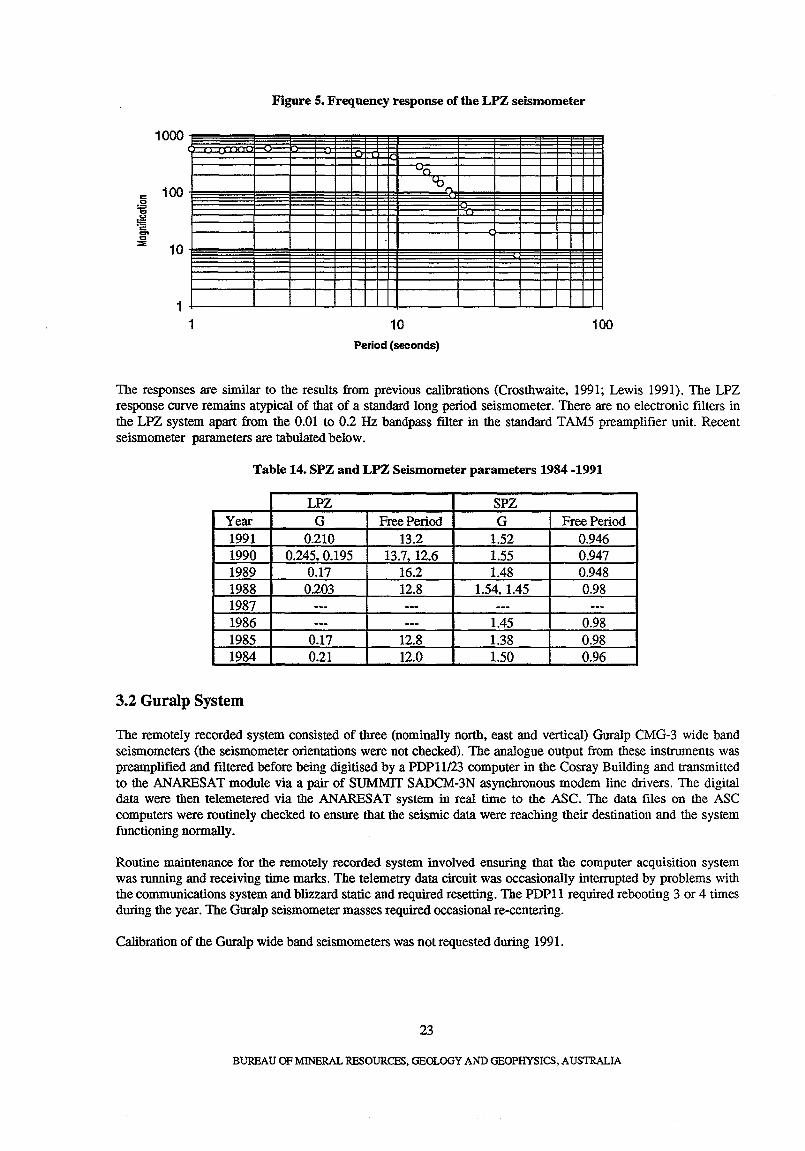
The frequency response is graphed logarithmically below in Figure 5.
22
BUREAU OF MINERAL RESOURCES. GEOLOGY AND GEOPHYSICS, AUSTRALIA
1000
100
10
1 1
Figure 5. Frequency response of the LPZ seismometer
""n ~n
-
10 Period (seconds)
100
The responses are similar to the results from previous calibrations (Crosthwaite, 1991; Lewis 1991). The LPZ response curve remains atypical of that of a standard long period seismometer. There are no electronic filters in the LPZ system apart from the 0.01 to 0.2 Hz bandpass filter in the standard TAM5 preamplifier unit. Recent seismometer parameters are tabulated below.
Table 14. SPZ and LPZ Seismometer parameters 1984 -1991
LPZ SPZ Year G Free Period G Free Period 1991 0.210 13.2 1.52 0.946 1990 0.245, 0.195 13.7,12.6 1.55 0.947 1989 0.17 16.2 1.48 0.948 1988 0.203 12.8 1.54,1.45 0.98 1987 --- --- --- ---1986 --- --- 1.45 0.98 1985 0.17 12.8 1.38 0.98 1984 0.21 12.0 1.50 0.96
3.2 Guralp System
The remotely recorded system consisted of three (nominally north, east and vertical) Guralp CMG-3 wide band seismometers (the seismometer orientations were not checked). The analogue output from these instruments was preamplified and filtered before being digitised by a PDPll/23 computer in the Cosray Building and transmitted to the ANARESAT module via a pair of SUMMIT SADCM-3N asynchronous modem line drivers. The digital data were then telemetered via the ANARESAT system in real time to the ASC. The data files on the ASC computers were routinely checked to ensure that the seismic data were reaching their destination and the system functioning normally.
Routine maintenance for the remotely recorded system involved ensuring that the computer acquisition system was running and receiving time marks. The telemetry data circuit was occasionally interrupted by problems with the communications system and blizzard static and required resetting. The PDP11 required rebooting 3 or 4 times during the year. The Guralp seismometer masses required occasional re-centering.
Calibration of the Guralp wide band seismometers was not requested during 1991.
23
BUREAU OF MINERAL RESOURCES. GEOLOGY AND GEOPHYSICS. AUSTRALIA

3.3 Time Keeping
Observatory timing was provided by the master GED clock in the Science Building. Timing for the Guralp system was taken from the internal clock of the PDP 11123 computer which was synchronised to 12V minute pulses of 2 second duration from the GED clock via the long data cable to the Cosray BUilding. The clock also provided minute pulses to the AR320 seismic amplifiers in the seismic instrument rack in the Science Building to produce minute marks on the charts of the analogue system. The clock was kept running to an accuracy of within flO ms of UTC by regular comparisons of the second pulses from the clock to time signals from radio station WWV -H received on a portable Sony world band radio receiver. The old Collins 511-4 radio receiver was never used as most as attempts at receiving time signals on it were unsuccessfuL
24
BUREAU OF MINERAL RESOURCES, GEOLOGY AND GEOPHYSICS, AUSTRALIA
CHAPTER 4. CONTROL EQUIPMENT
4.1 Power Supplies
Station power was supplied by four diesel alternators as 240V, 50 Hz. The station power house was reliable but numerous short periods of power loss were experienced throughout the year. However minimal data loss occurred during these power failures because of the backup power supplies.
Science Building
Backup power was supplied to the Science building by an Invertech UPS-100-FF-P rated at 100VA 150Hz and a Precision Power Standby Power System model SPS1000 rated at 1000V A. The equipment was distributed as follows: Invertech UPS: SPZ, LPZ helicorders
Secondary GED clock SPS1000: AR320 seismic amplifiers
Primary GED clock (also uses 24V DC backup) W & W chart recorder 9V DC adaptor for RS232/485 converter
The office PC was run straight from the mains supply. The backups were tested for 30 mins each month to cycle the batteries. The Invertech batteries failed on 18 July and were replaced.
Variometer Building
All equipment in the Variometer building apart from the heating and the PC monitor was backed up by a Precision Power SPS1000: NEC acquisition computer
PEM control unit 9V DC adaptor for RS232/485 converter Doric trendicator Statronics 53/3B power supply for PPM Statronics 53/3B power supply for fiducial latch, time mark, receiver latch and analogue buffers
Problems encountered with this backup system were described in section 2.4.
Cosray Building
The Guralp system and PDP rack were backed by a General Systems UPS model GPS-1K245RV4. The analogue system seismic rack in the vault was powered by 12V from the Cosray building supply and converted to ±8V by a PP210w power converter.
4.2 Timing
Two master clocks, GED crystal oven type 105, were available at the observatory. Both clocks were kept running to within ±50 msecs of UTC throughout the year. Observatory timing was taken from only one of these clocks, known as the primary clock, which provided all timing control for the geomagnetic and seismic equipment via a time mark relay driver (Kelsey, 1987). The primary clock was kept running to an accuracy of ±10 msecs of UTe. One-second pulses from the primary GED clock were transmitted to the secondary clock, so a continuous comparison between the two clock times was available to monitor sudden drift rate alterations and clock accuracy. The primary GED maintained a drift rate of approximately 2mslday; the secondary GED maintained a drift rate of around 30ms/day until it was adjusted on 25 November to a more acceptable level (unmeasured). The primary clock was compared regularly with radio time pips using a two channel oscilloscope. Time signals from radio station WWV-H were received on 10 MHz using a Sony ICF2001D portable world band receiver connected to the unused east mast of the Ionospheric Prediction Service antenna. The best signals were received between 19:00 and 22:00 local time. A radio signal propagation delay time of 50 msecs for WWV -H was assumed. (Crosthwaite, 1986). An unidentified radio station could be heard on the same frequency on some days with a propagation delay time of around 80 msecs.
25
BUREAU OF MINERAL RESOURCES, GEOLOGY AND GEOPHYSICS, AUSTRALIA
CHAPTER S. BUILDJNGS AND l\1AINTENANCE
Five buildings were either in use for the operation of the Mawson geophysical observatories during 1991 or remnants from previous years. Those buildings were; Science Building (known as Wombat), new Variometer Building, Absolute Hut, Cosray Building and the old Variometer Building.
The Science Building was in a good state of repair and provided more than adequate room for observatory operation. During the 1991 winter the building was used for both BMR and IPS (Ionospheric Prediction Service) activities, as the IPS equipment was reinstalled in December 1990. Due to the increased pressure for office space over summer, the workroom was used as an office for Auslig survey work and the IPS room was used as an office for ACS maintenance group. The water supply to the Science building was unavoidably cut off during 1990. The leak was repaired in January 1991 but recurred twice before being adequately ftxed just before winter. Some time was spent on organising the spares and components in the workroom and installing a toolboard and shelving. The ratty old carpet tiles were removed from the office and efforts made to improve the condition of the floor. With the increased traffic over summer the effort is not worthwhile, and the lino in the office at least should be replaced with anti-static flooring. The ASP section of the Antarctic Division has technical information on this. Arrangements were made to have the office painted and new shelving/display boards installed. This was carried out in January 1992.
The Absolute Hut is adequate for the purpose of doing absolutes, and may well be required to serve indefinitely with the current pressure on the rebuilding program - the absolute hut is not currently scheduled as part of the final year of building (1993). The absolute pier is unstable in strong winds, but any gradual movements during the year were not signiflcant. Drift frequently entered the building in various places during blizzes, but this was significantly cut down with repairs to the outer southward wall, to the door seals, and resealing of the inner walls with silastic. A new gusset and insulation between the base of the absolute pier and the floor prevented the invariable puddle of water/ice around the pier after each blizzard. If the building is to be used for many more years, the outer walls need repair andlor painting. The blizz line from the Science building to the Absolute hut was used occasionally in strong winds and only required tightening. The bUzz line between the Absolute but and the Variometer building abraded and broke during the year and was not replaced due to a shortage of suitable rope. Because of the lack of support between these two buildings, blizz lines will abrade against the ground and break each year - a simple non-magnetic solution may be to build a rock cairn and secure the line into this to lift the span clear of the ground. Wind gusts of >100knots and low visibility make it too dangerous to venture into this area without lines during bad weather.
The new variometer Building was in excellent condition and provided adequate, temperature stable housing for the variometer. Small amounts of drift occasionally iced up the cold porch door during blizzards. No maintenance, apart from routine light bulb changes, was required. The sign declaring a magnetic quiet zone around the Variometer and Absolute huts was accidentally removed during quarry operations late in the year. A new professionally painted sign would be a valuable asset for the observatory in the near future.
The old Variometer Building was used only as a junction box for mains power to the light on azimuth mark SOH and to the Absolute Hut. It contained some old concrete variometer piers which could be stored elsewhere. The maintenance carpenter recommended in his report that it be pulled down or removed.
A small area of the Cosray office was used to bouse the Guralp controller and PDP!1 rack. One side of the Cosray vault housed the analogue equipment rack and analogue and Guralp seismometers. The vault provided a stable isolated environment for the seismometers. No maintenance was required on the vault or office area. The seismic room in the vault was also occupied by a rack of cosmic ray equipment However, the engineer in charge of cosray had no knowledge of the equipment (thought it belonged to BMR) so if it is unused, it should be removed.
26
BUREAU OF MINERAL RESOURCES. GEOLOGY AND GEOPHYSICS. AUSTRALIA
CHAPTER 6. DAVIS AND CASEY GEOMAGNETIC INSTALLATIONS
The geomagnetic program at Davis and Casey is conducted in association with the ASP section of the Australian Antarctic Division. Regular observations of the magnetic field were initiated in the early 70's to determine longterm secular variations. Until 1990 observations were carried out 1-2 times per week on average. Monthly values of the magnetic field were derived from these and published in the Australian Geomagnetism Report. These were at best. crude estimates considering the activity of the field at high latitudes and the often limited number of observations per month.
Three component variometers (BDA FM100 fluxgate magnetometers) were installed by ASP at Davis in Jan 1986 assisted by BMR (Welsh 1986), and at Casey in Jan 1988. The EDA data were used to monitor the variations in the magnetic field to assist ASP in their upper atmospheric physics investigations. Although the variometers are not calibrated to observatory standard, using the digital data in association with the absolute observations would provide much improved estimates of monthly field values. The author was given the task of developing a procedure of doing this. The work was begun in March 1991 and expected to take 1-2 months to complete. A procedure was set up in this time, but continual problems meant that it only became routine towards the end of the year. A general deScription of the setup follows. Note well that it describes the situation as it was in 1991; the system and sites are in a state of change and the information may possibly be redundant within a year or two.
The variometer output is logged as lOs data by ASP's LSIlI computers on station, using a routine called LOGIT which is common to several of ASP's experiments. The data are collected in daily files and telemetered back to the V AX network at the Antarctic Division at the end of each month, where they are archived some days/weeks later. An averaging program, MAG.FOR, was written on the V AX by Dr Russell McLoughlin to average the variometer data for selected days and to use baseline values and scale values determined from absolute calibration to produce average field values for the selected days. I was allocated a personal account on the V AX (Antarctic Division ADP does not like issuing group user accounts) from which to access MAG.FOR and the digital data. Using these, I obtained daily averages for the 5 quiet days (as determined at Mawson), and returned these monthly for the Australian Geomagnetism Report. The procedure is quite straightforward and the sequence of steps required is given in Appendix D. However, many problems were encountered in reaching this stage, including handling of corrupted variometer data, verification of absolute instrument constants and comparisons, modifications to the variometers, bugs in reduction and averaging programs, site contamination and further unidentified causes of large baseline value shifts. Corrupted data is quite uncommon, but dealing with it is fairly time consuming process involving telemetering the me back down to the Mawson LSIll and examining it using ASP's RDLU1L utility. (NOTE: Since 1991 this procedure has become redundant. see Appendix A). ASP in Kingston should be informed of any corrupted data. Other listed problems are described below. Additional details on these developmental problems are given in the correspondence GE065 of 1 December 1991.
6.1 Absolute Instruments
Both Davis and Casey used QHMs on QHM circles and PPMs (with a BMZ as a backup) to do two sets of absolutes per month. Three QHMs are rotated through the Davis and Casey observatories every 3-5 years; two are in use while one is being calibrated against Australian standards in Canberra for reference to international standards. When a QHM is returned to Antarctica. the newly determined constants are sent with it and used for the whole 3-5 year stint. Instrument comparisons are done on station, but on an opportunistic basis, and the results are used as a check on the state on the instrument. rather than to update the instrument corrections. The recent history of comparisons (according to annual reports 1986-1990) is:
27
BUREAU OF MINERAL RESOURCES, GEOLOGY AND GEOPHYSICS, AUSTRALIA
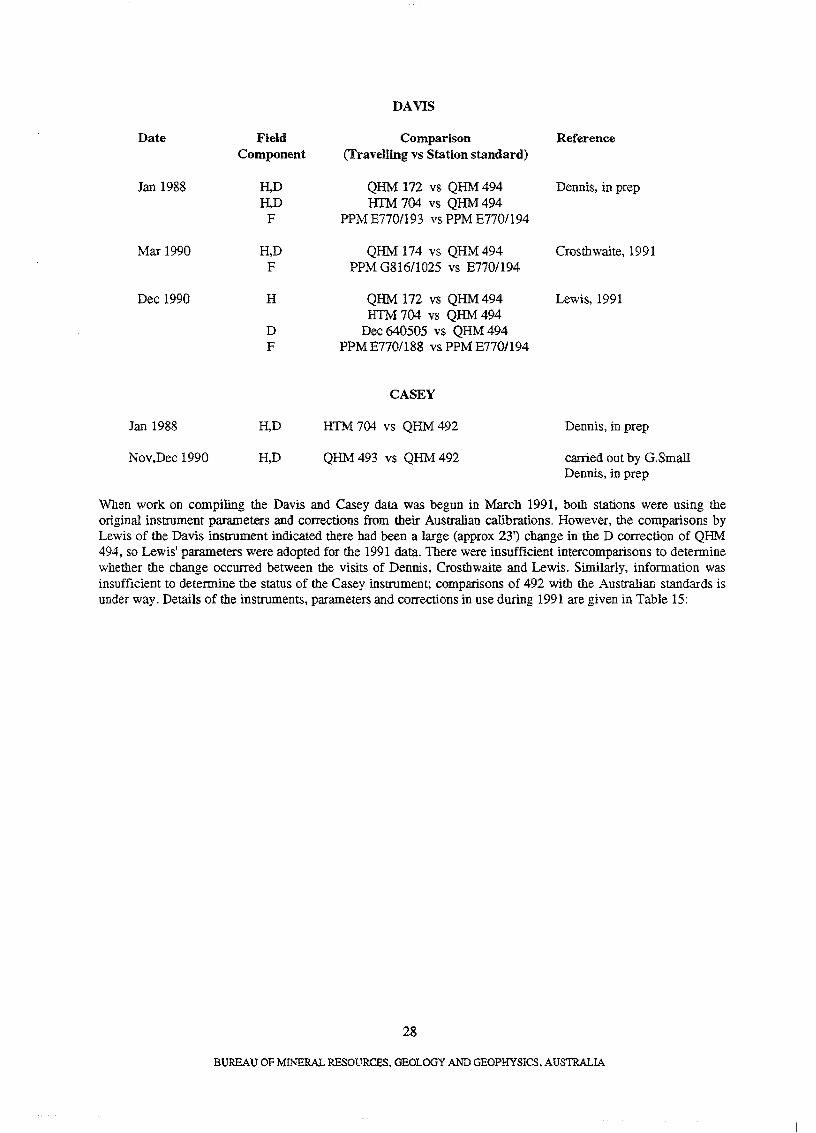
Date Field Component
Jan 1988 H,D H,D
F
Mar 1990 H,D F
Dec 1990 H
D F
Jan 1988 H,D
Nov.Dec 1990 H.D
DAVIS
Comparison (Travelling vs Station standard)
QHM 172 vs QHM 494 IITM 704 vs QHM 494
PPM E770/193 vs PPM E770/194
QHM 174 vs QHM 494 PPM G816/1025 vs E7701194
QHM 172 vs QHM 494 HTM 704 vs QHM 494
Dec 640505 vs QHM 494 PPM E770/188 vs PPM E7701194
CASEY
HTh1 704 vs QHM 492
QHM 493 vs QHM 492
Reference
Dennis, in prep
Crosthwaite, 1991
Lewis, 1991
Dennis, in prep
carried out by G.Small Dennis, in prep
When work on compiling the Davis and Casey data was begun in March 1991, both stations were using the original instrument parameters and corrections from their Australian calibrations. However. the comparisons by Lewis of the Davis instrument indicated there had been a large (approx 23') change in the D correction of QHM 494, so Lewis' parameters were adopted for the 1991 data. There were insufficient intercomparisons to determine whether the change occurred between the visits of Dennis, Crosthwaite and Lewis. Similarly, information was insufficient to determine the status of the Casey instrument; comparisons of 492 with the Australian standards is under way. Details of the instruments, parameters and corrections in use during 1991 are given in Table 15:
28
BUREAU OF MINERAL RESOURCES, GEOLOGY AND GEOPHYSICS. AUSTRALIA
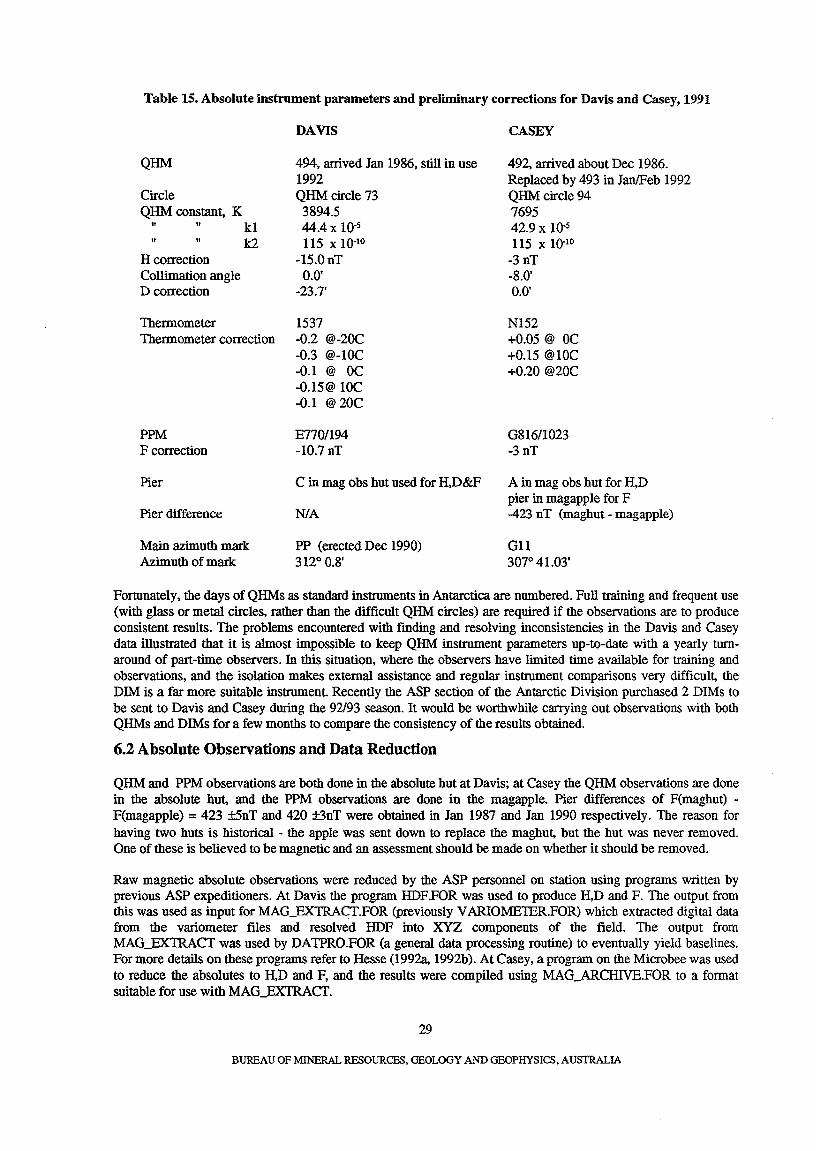
Table 15. Absolute instrument parameters and preliminary corrections for Davis and Casey~ 1991
DAVIS CASEY
QHM 494, arrived Jan 1986, still in use 492, arrived about Dec 1986. 1992 Replaced by 493 in Jan/Feb 1992
Circle QHM circle 73 QHM circle 94 QHM constant, K 3894.5 7695
" " kl 44.4 x 10⁻⁵ 42.9 X 10.5
" k2 115 X 10-10 115 X 10.10
H correction -15.0nT -3nT Collimation angle 0.0' -8.0' D correction -23.7' 0.0'
Thermometer 1537 N152 Thermometer correction -0.2 @-2OC +0.05 @ OC
-0.3 @-IOC +0.15 @10C -0.1 @ OC +0.20 @20C -0.15@ lOC -0.1 @ 20C
PPM E770/194 G81611023 F correction -10.7 nT -3nT
Pier C in mag obs hut used for H,D&F A in mag obs hut for H,D pier in magapple for F
Pier difference N/A -423 nT (maghut - magapple)
Main azimuth mark PP (erected Dec 1990) Gll Azimuth of mark 3120 0.8' 3070 41.03'
Fortunately, the days of QHMs as standard instruments in Antarctica are numbered. Full training and frequent use (with glass or metal circles, rather than the difficult QHM circles) are required if the observations are to produce consistent results. The problems encountered with finding and resolving inconsistencies in the Davis and Casey data illustrated that it is almost impossible to keep QHM instrument parameters up-to-date with a yearly turnaround of part-time observers. In this situation, where the observers have limited time available for training and observations, and the isolation makes external assistance and regular instrument comparisons very difficult, the DIM is a far more suitable instrument. Recently the ASP section of the Antarctic Division purchased 2 DIMs to be sent to Davis and Casey during the 92/93 season. It would be worthwhile carrying out observations with both QHMs and DIMs for a few months to compare the consistency of the results obtained.
6.2 Absolute Observations and Data Reduction
QHM and PPM observations are both done in the absolute hut at Davis; at Casey the QHM observations are done in the absolute hut, and the PPM observations are done in the magapple. Pier differences of F(maghut) -F(magapple) = 423 ±5nT and 420 ±3nT were obtained in Jan 1987 and Jan 1990 respectively. The reason for having two huts is historical - the apple was sent down to replace the maghut, but the hut was never removed. One of these is believed to be magnetic and an assessment should be made on whether it should be removed.
Raw magnetic absolute observations were reduced by the ASP personnel on station using programs written by previous ASP expeditioners. At Davis the program HDF.FOR was used to produce H,D and F. The output from this was used as input for MAG_EXTRACT.FOR (previously V ARIOMElER.FOR) which extracted digital data from the variometer mes and resolved HDF into XYZ components of the field. The output from MAG_EXTRACT was used by DATPRO.FOR (a general data processing routine) to eventually yield baselines. For more details on these programs refer to Hesse (1992a, 1992b). At Casey, a program on the Microbee was used to reduce the absolutes to H,D and F, and the results were compiled using MAG_ARCHIVE.FOR to a format suitable for use with MAG_EXTRACT.
29
BUREAU OF MINERAL RESOURCES, GEOLOGY AND GEOPHYSICS, AUSTRALIA
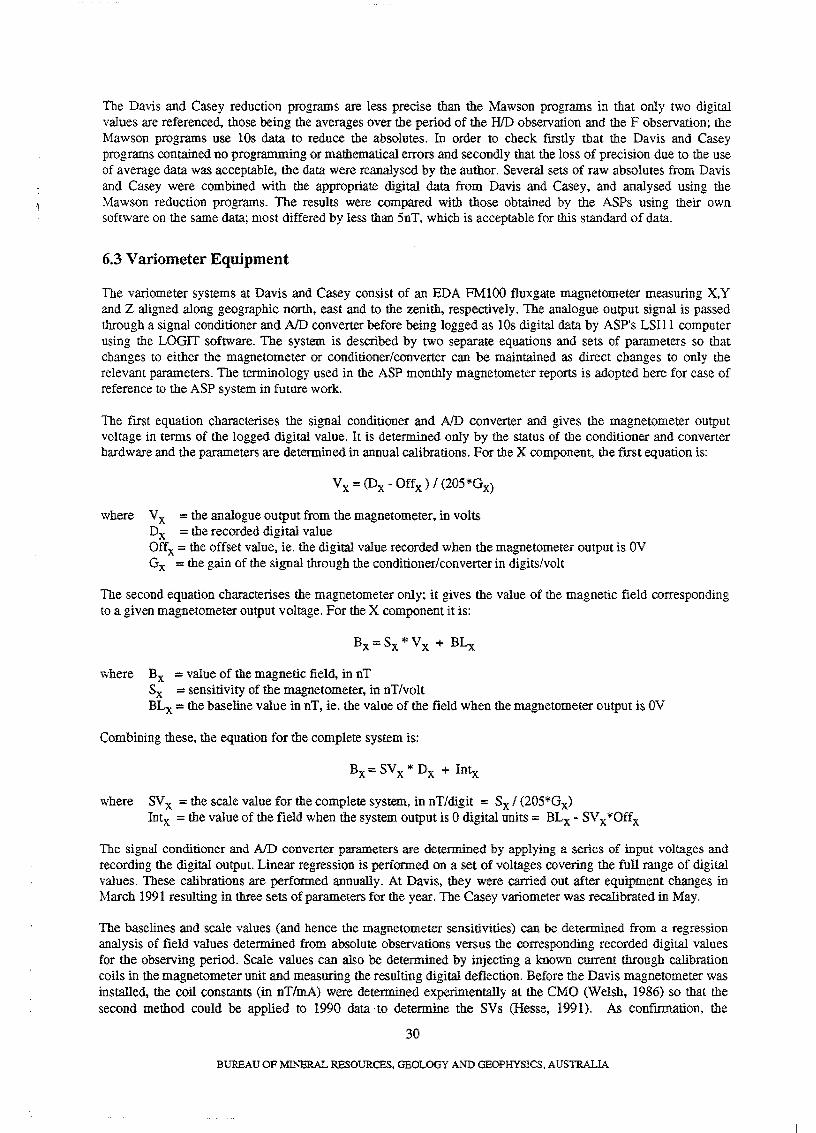
The Davis and Casey reduction programs are less precise than the Mawson programs in that only two digital values are referenced, those being the averages over the period of the HID observation and the F observation; the Mawson programs use lOs data to reduce the absolutes. In order to check flrstly that the Davis and Casey programs contained no programming or mathematical errors and secondly that the loss of preCision due to the use of average data was acceptable, the data were reanalysed by the author. Several sets of raw absolutes from Davis and Casey were combined with the appropriate digital data from Davis and Casey, and analysed using the Mawson reduction programs. The results were compared with those obtained by the ASPs using their own software on the same data; most differed by less than SnT, which is acceptable for this standard of data.
6.3 Varlometer Equipment
The variometer systems at Davis and Casey consist of an EDA FMlOO fluxgate magnetometer measuring X,Y and Z aligned along geographic north, east and to the zenith, respectively. The analogue output signal is passed through a signal conditioner and AID converter before being logged as lOs digital data by ASP's LSIll computer using the LOGIT software. The system is described by two separate equations and sets of parameters so that changes to either the magnetometer or conditioner/converter can be maintained as direct changes to only the relevant parameters. The terminology used in the ASP monthly magnetometer reports is adopted here for ease of reference to the ASP system in future work.
The fIrst equation characterises the signal conditioner and AID converter and gives the magnetometer output voltage in terms of the logged digital value. It is determined only by the status of the conditioner and converter hardware and the parameters are determined in annual calibrations. For the X component, !he first equation is:
v x = (Ox - Offx ) / (205*Gx)
where V x = the analogue output from the magnetometer, in volts Dx = the recorded digital value Offx = the offset value, ie. the digital value recorded when the magnetometer output is OV Gx = the gain of the signal through the conditioner/converter in digits/volt
The second equation characterises the magnetometer only; it gives the value of the magnetic fIeld corresponding to a given magnetometer output voltage. For the X component it is:
where Bx = value of the magnetic fleld, in nT Sx = sensitivity of the magnetometer, in nT/volt BLx = the baseline value in nT, ie. the value of the field when the magnetometer output is OV
Combining these, the equation for the complete system is:
Bx = SV x * Dx + Intx
where SV x = the scale value for the complete system., in nT/digit = Sx / (205*Gx) Intx = the value of the field when the system output is 0 digital units = BLx - SV x *Offx
The signal conditioner and AID converter parameters are determined by applying a series of input voltages and recording the digital output. Linear regresSion is performed on a set of voltages covering the full range of digital values. These calibrations are performed annually. At Davis, they were carried out after equipment changes in March 1991 resulting in three sets of parameters for the year. The Casey variometer was recalibrated in May.
The baselines and scale values (and hence the magnetometer sensitivities) can be determined from a regression analysis of fIeld values determined from absolute observations versus the corresponding recorded digital values for the observing period. Scale values can also be determined by injecting a known current through calibration coils in the magnetometer unit and measuring the resulting digital deflection. Before the Davis magnetometer was installed, the coil constants (in nT/rnA) were detemlined experimentally at the CMO (Welsh, 1986) so that the second method could be applied to 1990 data ·to determine the SVs (Hesse, 1991). As confl11ll.ation, the
30
BUREAU OF MTh'ERAL RESOURCES, GEOLOGY AND GEOPHYSICS. AUSTRALIA
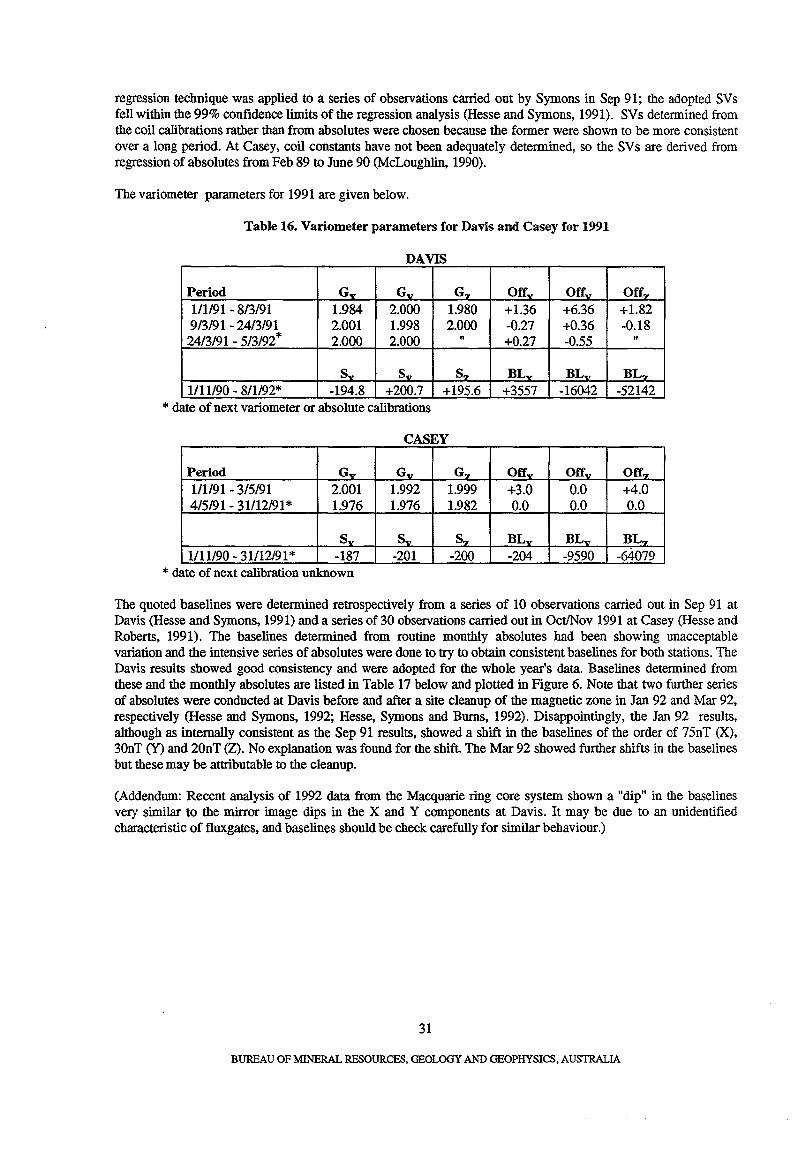
regression technique was applied to a series of observations carried out by Symons in Sep 91; the adopted SVs fell within the 99% confidence limits of the regression analysis (Hesse and Symons, 1991). SVs determined from the coil calibrations rather than from absolutes were chosen because the former were shown to be more consistent over a long period. At Casey, coil constants have not been adequately determined, so the SVs are derived from regression of absolutes from Feb 89 to June 90 (McLoughlin, 1990).
The variometer parameters for 1991 are given below.
Table 16. Variometer parameters for Davis and Casey for 1991
DAVIS
Period Gy G~ G ... Offy Oft'v Off'Z 111/91 - 813/91 1.984 2.000 1.980 +1.36 +6.36 +1.82 9/3/91 - 2413/91 2.001 1.998 2.000 -0.27 +0.36 -0.18 24/3/91 - 5/3/92* 2.000 2.000 " +0.27 -0.55 "
Sy Sv S ... BLy BLv BL ... 1111/90 - 8/1192* -194.8 +200.7 +195.6 +3557 -16042 -52142
* date of next variometer or absolute calibrations
CASEY
Period Gy Gv G ... Offy Offv Off~
1/1191 - 3/5191 2.001 1.992 1.999 +3.0 0.0 +4.0 4/5191 - 31112/91 * 1.976 1.976 1.982 0.0 0.0 0.0
Sy Sv S'I' BLy BLv BLoz 1111190 - 31112/91 * -187 -201 -200 -204 -9590 -64079
* date of next calibration unknown
The quoted baselines were determined retrospectively from a series of 10 observations carried out in Sep 91 at Davis (Hesse and Symons, 1991) and a series of 30 observations carried out in Oct/Nov 1991 at Casey (Hesse and Roberts, 1991). The baselines determined from routine monthly absolutes had been showing unacceptable variation and the intensive series of absolutes were done to try to obtain consistent baselines for both stations. The Davis results showed good consistency and were adopted for the whole year's data. Baselines determined from these and the monthly absolutes are listed in Table 17 below and plotted in Figure 6. Note that two further series of absolutes were conducted at Davis before and after a site cleanup of the magnetic zone in Jan 92 and Mar 92, respectively (Hesse and Symons, 1992; Hesse, Symons and Burns, 1992). Disappointingly, the Jan 92 results, although as internally consistent as the Sep 91 results, showed a shift in the baselines of the order of 75nT (X), 30nT (Y) and 20nT (Z). No explanation was found for the shift. The Mar 92 showed further shifts in the baselines but these may be attributable to the cleanup.
(Addendum: Recent analysis of 1992 data from the Macquarie ring core system shown a "dip" in the baselines very similar to the mirror image dips in the X and Y components at Davis. It may be due to an unidentified characteristic of fluxgates, and baselines should be check carefully for similar behaviour.)
31
BUREAU OF MINERAL RESOURCES, GEOLOGY AND GEOPHYSICS, AUSTRALIA
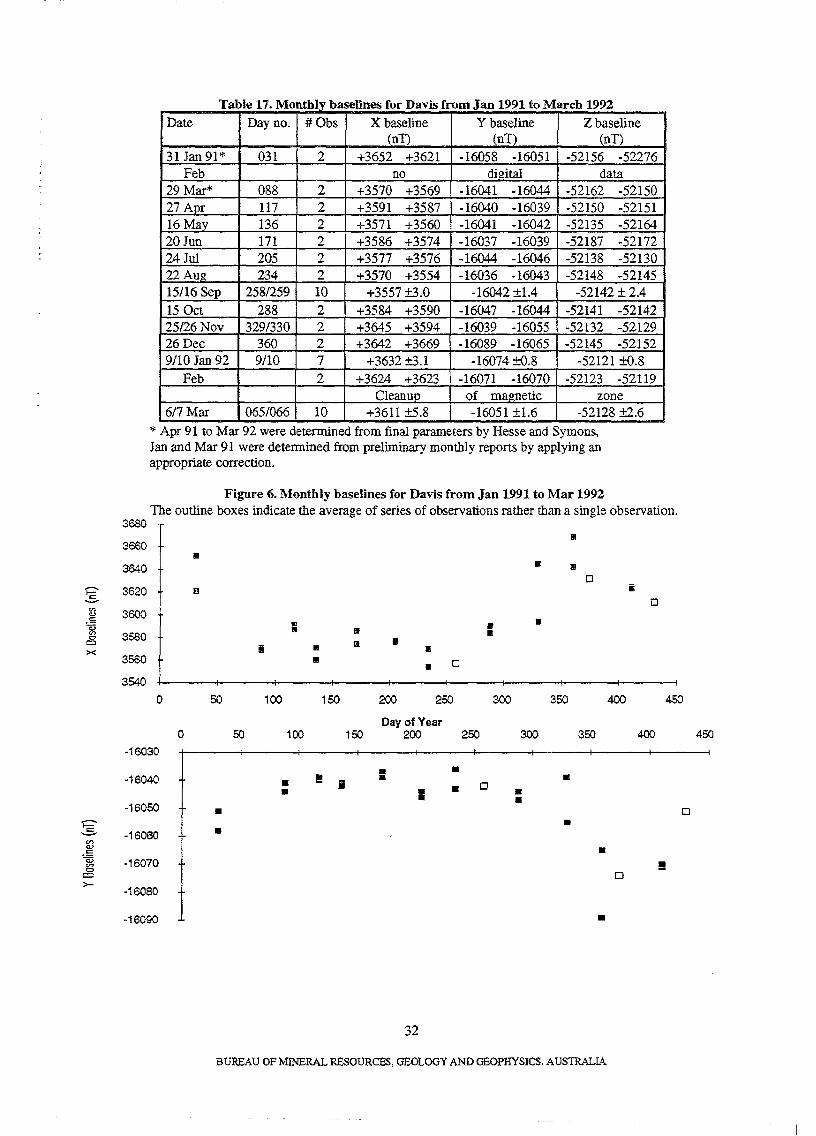
........ "C -'" 0.> .E: -.:;
'" c cc x
~ -'" <l> 0= .-§ en 0:::> =
>-
T bl 7 M 1 J 9 a e 1 • ontbly baselines for DaVIS from an 1 91 to M b arc 1992
Date Day no. #Obs X baseline Y baseline Z baseline (nn .(n]) (nT)
31 Jan 91* 031 2 +3652 +3621 -16058 -16051 -52156 -52276 Feb no digital data
29 Mar* 088 2 +3570 +3569 -16041 -16044 -52162 -52150 27 Apr 117 2 +3591 +3587 -16040 -16039 -52150 -52151 16 May 136 2 +3571 +3560 -16041 -16042 -52135 -52164 20Jun 171 2 +3586 +3574 -16037 -16039 -52187 -52172 24 Jul 205 2 +3577 +3576 -16044 -16046 -52138 -52130 22 Aug; 234 2 +3570 +3554 -16036 -16043 -52148 -52145 15116 Sep 258/259 10 +3557 ±3.0 -16042 ±1.4 -52142 ± 2.4 15 Oct 288 2 +3584 +3590 -16047 -16044 -52141 -52142 25/26 Nov 329/330 2 +3645 +3594 -16039 -16055 -52132 -52129 26 Dec 360 2 +3642 +3669 -16089 -16065 -52145 -52152 9/10 Jan 92 9/10 7 +3632 ±3.1 -16074±O.8 -52121 ±O.8
Feb 2 +3624 +3623 -16071 -16070 -52123 -52119 Cleanup of maQIletic zone
6/7 Mar 065/066 10 +3611 ±S.8 -16051 ±1.6 -52128 ±2.6 * Apr 91 to Mar 92 were determined from final parameters by Hesse and Symons, Jan and Mar 91 were determined from preliminary monthly reports by applying an appropriate correction.
Figure 6. Monthly baselines for Davis from Jan 1991 to Mar 1992 The outline boxes indicate the average of series of observations rather than a single observation.
3680 11/
3660 II
3640 • III
0 3620 IJ i
0
.. II II
II i II II II
II II II
3600
3580
II 0 II 3560
3540
0 50 100 150 200 250 300 350 400 450
0
-16030
-16040
-16050
-16060
-16070
-16080
-16090
50
• •
100
• • !! i
Day of Year 150 200
II II
32
250
• • o
300 350 400 450
• • •
• •
•
o
!! o
BUREAU OF MINERAL RESOURCES, GEOLOGY AND GEOPHYSICS, AUSTRALIA
---...5-CI.>
. 5 c;:; en CJ =
r-.I
0 50 100 150 200 250 300 350 400 450
-52110
-52120 0 • • -52130 • • 0 • • -52140 • 0 ii • • -52150 • ii • • • -52160 • • -52170 • -52180
-52190 •
The Casey monthly baselines and results of the series of 30 observations in OctINov are listed below in Table 18 and plotted in Figure 7. Again, the series of observations showed good consistency but the monthly results for the year were quite variable.
T bl 18 M thl b r f: Ca f D 1990 t D 1991 a e . on Iy_ ase me va ues or sey rom ec 0 ec Date Day of #Obs X Baseline (nT) Y Baseline (nT) Z Baseline (nT)
Year 24 Dec 90 358 2 -252 -183 -9601 -9608 -64073 -64102 30 Jan 91 030 2 -251 -221 -9590 -9584 -64065 -64069 25 Feb 056 2 -143 -182 -9579 -9598 -64076 -64068 28 Mar 087 2 -252 -228 -9582 -9592 -64065 -64064 16 Apr 106 2 -72 -182 -9580 -9572 -64207 -64196 29 May 149 2 -204 -162 -9601 -9594 -64079 -64078 27 Jun 178 2 -116 -167 -9581 -9590 -64078 -64078 23 Jul 204 2 -166 -194 -9637 -9632 -64074 -64069 28 Aug 240 2 -265 -220 -9645 -9632 -64151 -64110 25Sep 268 2 -229 -174 -9654 -9653 -64067 -64068 26 Oct 299 2 -209 -289 -9578 -9626 -64109 -64101 OctINov 21 -203 ±8.1 -9589 ±2.1 -64079 ±3.6 24 Nov 328 2 -166 -160 -9592 -9592 -64075 -64078 30 Dec 364 2 -202 -175 -9601 -9597 -64057 -64059
33
BUREAU OF MINERAL RESOURCES. GEOLOGY AND GEOPHYSICS. AUSTRALIA
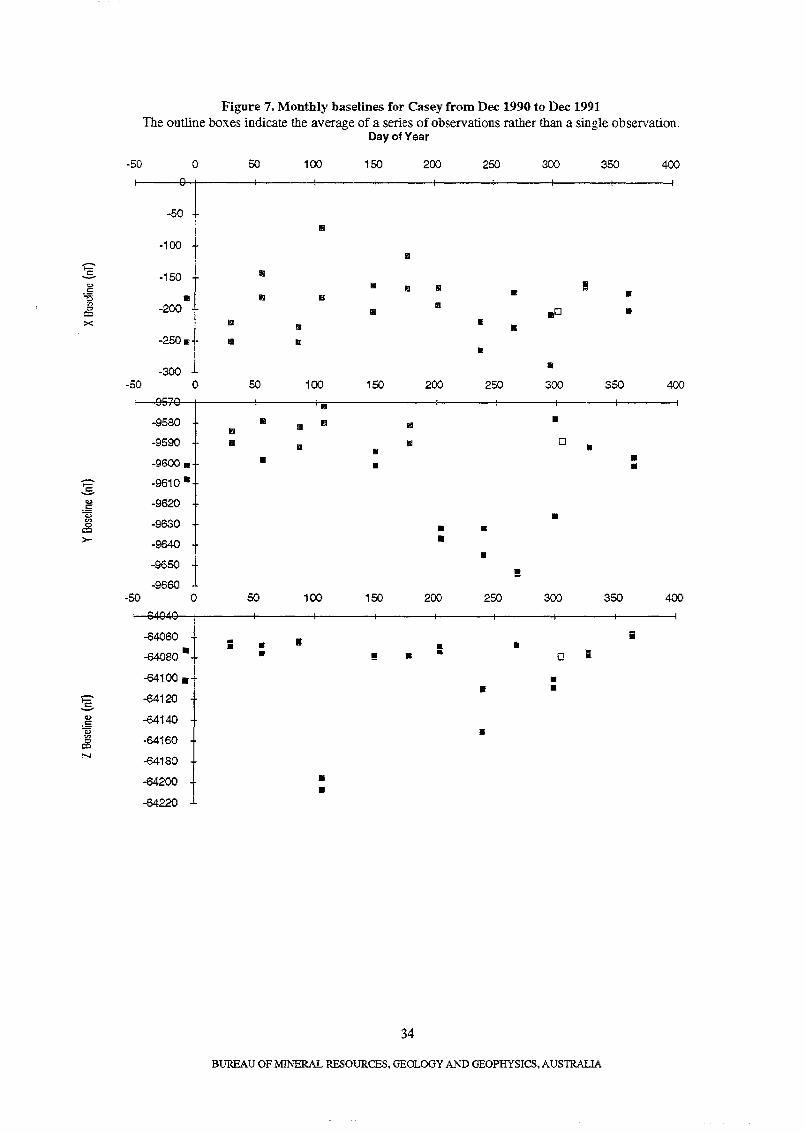
Figure 7. Monthly baselines for Casey from Dec 1990 to Dec 1991 The outline boxes indicate the average of a series of observations rather than a single observation.
Day of Year
-50 0 50 100 150 200 250 300 350 400
-50 II
-100 III
~ -150 III .., III iii II ! .S II • c:; II II II
"" -200 II '" III .0 II c:c
>< II II II
II
-250. III II II
-300 • -50 0 50 100 150 200 250 300 350 400
II
-9580 II II II iii III
II
-9590 III III II 0 II •
-9600 • II II
• II
'2 ----9610 II
.., -9620 .S c:; II en -9630 cB II II
>- -9640 II
• -9650 !!
-9660 -50 0 50 100 150 200 250 300 350 400
-64060 • • i
-64080 II II II • II
II II! II • 0 ;
-64100 • II
• II .--..
-= -64120 "-'"
0> -64140 c: ~ II '" -64160 cB
N -64180
-64200 II II
-64220
34
BUREAU OF MINERAL RESOURCES, GEOLOGY AND GEOPHYSICS, AUSTRALIA
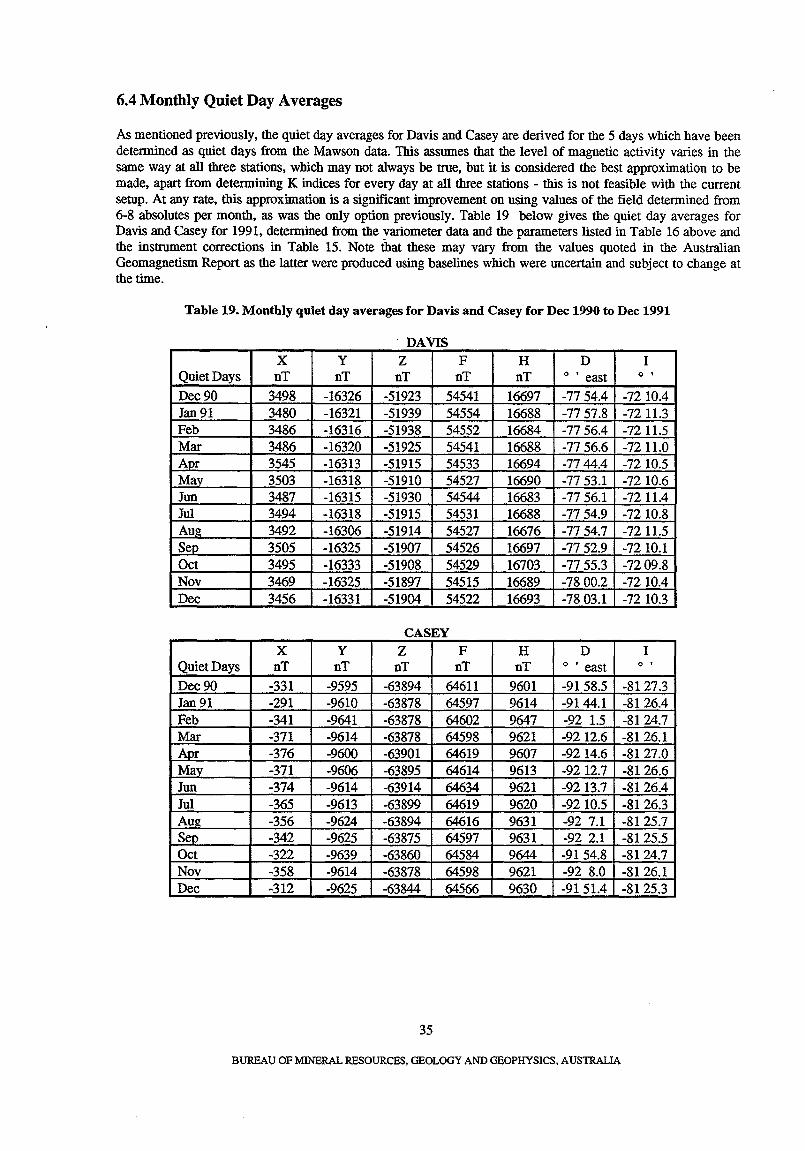
6.4 Monthly Quiet Day Averages
As mentioned previously, the quiet day averages for Davis and Casey are derived for the 5 days which have been determined as quiet days from the Mawson data. This assumes that the level of magnetic activity varies in the same way at all three stations, which may not always be true, but it is considered the best approximation to be made, apart from determining K indices for every day at all three stations - this is not feasible with the current setup. At any rate, this approximation is a significant improvement on using values of the field determined from 6-8 absolutes per month, as was the only option previously. Table 19 below gives the quiet day averages for Davis and Casey for 1991, determined from the variometer data and the parameters listed in Table 16 above and the instrument corrections in Table 15. Note that these may vary from the values quoted in the Australian Geomagnetism Report as the latter were produced using baselines which were uncertain and subject to change at the time.
Table 19. Monthly quiet day averages for Davis and Casey for Dec 1990 to Dec 1991
. DAVIS
x y Z F H D I Quiet Days nT nT nT nT nT o , east o ,
Dec 90 3498 -16326 -51923 54541 16697 -7754.4 -7210.4 Jan 91 3480 -16321 -51939 54554 16688 -7757.8 -72 11.3 Feb 3486 -16316 -51938 54552 16684 -7756.4 -72 11.5 Mar 3486 -16320 -51925 54541 16688 -77 56.6 -72 11.0 A~ 3545 -16313 -51915 54533 16694 -77 44.4 -72 10.5 May 3503 -16318 -51910 54527 16690 -77 53.1 -72 10.6 Jun 3487 -16315 -51930 54544 16683 -7756.1 -72 11.4 Jul 3494 -16318 -51915 54531 16688 -77 54.9 -72 10.8 Aug 3492 -16306 -51914 54527 16676 -77 54.7 -72 11.5 Sep 3505 -16325 -51907 54526 16697 -7752.9 -7210.1 Oct 3495 -16333 -51908 54529 16703 -77 55.3 -72 09.8 Nov 3469 -16325 -51897 54515 16689 -7800.2 -72 10.4 Dec 3456 -16331 -51904 54522 16693 -7803.1 -72 10.3
CASEY x y Z F H D I
Quiet Days nT nT nT nT nT o , east o ,
Dec 90 -331 -9595 -63894 64611 9601 -9158.5 -8127.3 Jan 91 -291 -9610 -63878 64597 9614 -9144.1 -8126.4 Feb -341 -9641 -63878 64602 9647 -92 1.5 -8124.7 Mar -371 -9614 -63878 64598 9621 -9212.6 -8126.1 AJ!r -376 -9600 -63901 64619 9607 -9214.6 -8127.0 May -371 -9606 -63895 64614 9613 -9212.7 -8126.6 Jun -374 -9614 -63914 64634 9621 -9213.7 -8126.4 Jul -365 -9613 -63899 64619 9620 -9210.5 -8126.3 AtJg -356 -9624 -63894 64616 9631 -92 7.1 -8125.7 Sep -342 -9625 -63875 64597 9631 -92 2.1 -8125.5 Oct -322 -9639 -63860 64584 9644 -9154.8 -8124.7 Nov -358 -9614 -63878 64598 9621 -92 8.0 -8126.1 Dec -312 -9625 -63844 64566 9630 -9151.4 -8125.3
35
BUREAU OF MINERAL RESOURCES, GEOLOGY AND GEOPHYSICS, AUSTRALIA
6.5 Site Contamination
A thorough investigation of problems with the magnetic data was done by Lloyd Symons, both at Davis and after his return. All problems and corrections to instrument parameters etc were carried through and the consistency within the Sep91/Jan921Mar92 series conflrms Lloyd's good observing technique. Yet anomalies in the data still remained, in particular the baseline shift between the Sep 91 and the Jan 92 results. Plots of baselines covering 1990 to 1992 sbow some seasonal trends. Various seasonal effects were discussed, including heating of the fluxgate beads over summer and warping of the absolute or variometer piers. At Davis the pier is a concrete block supported on a wooden frame and if this was warping and causing rotation and some translation of the pier (say <1Omm), one would expect D to sbow the effects of this whilst H would remain mostly unaffected. Plotting of D and H for Apr 91 to Mar 92 did not support this - D and H both showed some seasonal trend. The EDA head contains the X, Y and Z sensors on one pier, so cbanges in the variometer pier should be reflected in at least 2 components. It is unlikely that beating of the beads was a problem - Lloyd did not observe them to vary from 20.0±0.I°C, as his observations were generally done in the evening wben heating effects would be minimal.
A more noticeable seasonal problem is the possible influx of vehicles and building materials over the summer period. At Davis vebicles, have been "winterised" in an area about 50m from the absolute but. This was done in 1989 and assumed to have been done in 1988. This area was kept clear in 1990 and 1991, but there may have been other contamination in the form of the old ASP lab (60-7Om from the absolute hut) and addition of building material for the new ASP lab (80m from the absolute hut). Excess building material and 2 seacontainers from the old lab were removed in Feb 92, and the old lab is due to be removed completely in the 92/93 summer. The variometer is located about 10m from the absolute hut, and from the author's experience of vehicles near the Mawson Observatory, it seems unlikely that the changes to the ASP labs would cause the shifts observed in the Davis data. The Casey site has similar problems with large stacks of building material stored near the magnetic quiet zone and then used as summer progresses. The problem is possibly worse here in that the variometer is located near the old station on a coastal outcrop, whereas the absolute hut is located 1-2km inland past the new station. Contamination to either site would show up more clearly than contamination at Davis. The variometer is scheduled to be relocated over the 92/93 summer, to the west of the maghut just past the melt lake.
Given these factors, and the uncertainty over the QHM performances, the Davis and Casey 1991 data cannot be regarded as of observatory standard. An improvement to data quality would be achieved if sites were cleaned up, cbecked over and baselines reliably determined, preferably by a summer geophysicist. This has been partly achieved with the cleanup of the Davis site and (near?) completion of the ASP lab and the erection of quiet zone signs around the Davis site in Nov 91. ASP's proposed summer work at Casey and the introduction of DIMs should go further to improving data quality. The importance of maintaining a quiet zone should be stressed to an expeditioners, both at Brighton training and when they arrive at the station. This is surprisingly effective at keeping others aware of the quiet zone.
36
BUREAU OF MLl\'ERAL RESOURCES. GEOLOGY AND GEOPHYSICS, AUSTRALIA
CHAPTER 7. OTHER DUTIES
As part of the agreement between BMR and the ASP section of the Antarctic Division, the author was required to carry out work for IPS. The previous ionosonde was returned to Australia during the 89/90 summer and a replacement arrived and was installed in the Science building in December 1990. The ASP engineer was responsible for the installation and maintenance of the sonde, the author set up the darkroom for processing and carried out routine fIlm changes, developing and scaling. This required around 3-4 hours per week. The cables from the sonde to the aerial were rerouted to run along the cable trays and a pair of old unused cables were removed.
Occasional assistance was provided to the Cosray engineer while he was off-station. A Global POSitioning System (GPS) satellite tracking unit was operated at Mawson for the Australian Surveying and Land Information Group (AUSLIG) as part of the Lambert Glacier 90/91 summer project. The unit was operated by the author for one week during February.
Everyone on station is required to perform a share of the day to day work of running the station. This involves kitchen hand duties, cooking, daycare (a progressive step on from nightwatch), Saturday afternoon station duties, and ad hoc assistance during summer activities, especially shipping visits. The author was station hairdresser, and was also fortunate enough to be in charge of the dogs for the year. The importance of activities with the dogs and such like in maintaining a positive attitude to all aspects of Antarctic life (including work), cannot be overemphasised.
ACKNOWLEDGEMENTS.
The support and assistance of many fellow expeditioners made the task of running the observatory easier, and the experience of a year in Antarctica memorable. In particular I am grateful for the assistance of Tony Oeterlli and Mick Craven in changing charts and Chris Underwood in changing ionosonde f1lm during my absences, of Chris Harrison and Kit Scally in chasing down problems with the comms lines. Advise and assistance from Graeme Small, Stewart Dennis and Peter Crosthwaite in Canberra was much appreciated.
37
BUREAU OF MINERAL RESOURCES. GEOLOGY AND GEOPHYSICS. AUSTRALIA
REFERENCES
Almond, R, 1975, Mawson Geophysical Observatory Annual Report. 1973 Bureau of Mineral Resources Record 1975/140
Black, I.E., 1965, Mawson Geophysical Observatory Work, Antarctica, 1963 Bureau of Mineral Resources Record 19651185
Cechet, R.P., 1984, Mawson Geophysical Observatory Annual Report. 1983. Bureau of Mineral Resources Record 1984/36
Crosthwaite, P., 1986, Mawson Geophysical Observatory Annual Report. 1984 Bureau of Mineral Resources Record 1986/12
Crosthwaite, P.,1991, Mawson Geophysical Observatory Annual Report. 1989 Bureau of Mineral Resources Record 1991/26
Crosthwaite, P.,1992, Mawson Geomagnetic Observatory Magnetic Results, 1989 Bureau of Mineral Resources Record, 1992/56
de Deuge M.A., 1992, FIrst Order Regional Magnetic Survey in the Prince Charles Mountains, Antarctica, and at Heard Island, 1992. Bureau of Mineral Resources Record, 1992/58
Dent, V.R, 1971, Mawson Geopbysical Observatory Annual Report. 1967 Bureau of Mineral Resources Record 1971/9
Hill, PJ., 1978, Mawson Geophysical Observatory Annual Report. 1975 Bureau of Mineral Resources Record 1978/59
Hutchinson, R, 1987, Mawson Geophysical Observatory Annual Report. 1986 Bureau of Mineral Resources Record 1987/46
Hutchinson, R., 1989. Mawson Geophysical Observatory Annual Report. 1988 Bureau of Mineral Resources Record 1989125
Lewis, A.M .• 1991, Mawson Geophysical Observatory Annual Report. 1990 Bureau of Mineral Resources Record 1991159
Kelsey, P.J., 1987. Mawson Geophysical Observatory Annual Report. 1985 Bureau of Mineral Resources Record 1987/29
Merrick, RW .• 1961, Mawson Geophysical Observatory Work. Antarctica, 1960 Bureau of Mineral Resources Record 19611118
Oldham, W.H., 1957, Magnetic Work at Mawson, Antarctica, 1955-1956 Bureau of Mineral Resources Record 1957179
Pinn, J.D., 1961, Mawson Geophysical Observatory Work, Antarctica, 1957 Bureau of Mineral Resources Record 1961/27
Robertson, M.J.M., 1972, Mawson Geophysical Observatory Annual Report. 1970 Bureau of Mineral Resources Record 1972144
Silberstein, RP .• 1984, Mawson Geophysical Observatory Annual Report. 1982 Bureau of Mineral Resources Record 1984/35
38
BUREAU OF MINERAL RESOURCES, GEOLOGY A.ND GEOPHYSICS. AUSTRALIA
Smith, R.S., 1971,
Welsh, W., 1986,
Mawson Geophysical Observatory Annual Report, 1968 Bureau of Mineral Resources Record 1971/10
Geomagnetic Activities at Davis, Mawson and Casey, Antarctica - 1985/86 Summer Bureau of Mineral Resources Record 1986116
The following references are internal publications of the Auroral and Space Physics Section of the Australian Antarctic Division:
Hesse, M., 1991 Davis magnetometer calibration, 1990
Hesse, M., 1992a Datpro - Data processing program
Hesse, M., 1992b Magnetic absolutes and magnetometer calibrations programs
Hesse, M. and Roberts, P., 1991 Casey magnetometer calibration, OctoberlNovember 1991
Hesse, M. and Symons, L" 1991 Davis magnetometer calibrations, September 1991
Hesse,M. and Symons, L., 1992 Davis magnetomete calibrations, January 1992
Hesse, M., Symons, L. and Bums, G., 1992 Davis magnetometer calibrations, March 1992
McLoughlin, R., 1990 Casey magnetometer calibration
39
BUREAU OF MINERAL RESOURCES. GEOLOGY AND GEOPHYSICS, AUSTRALIA
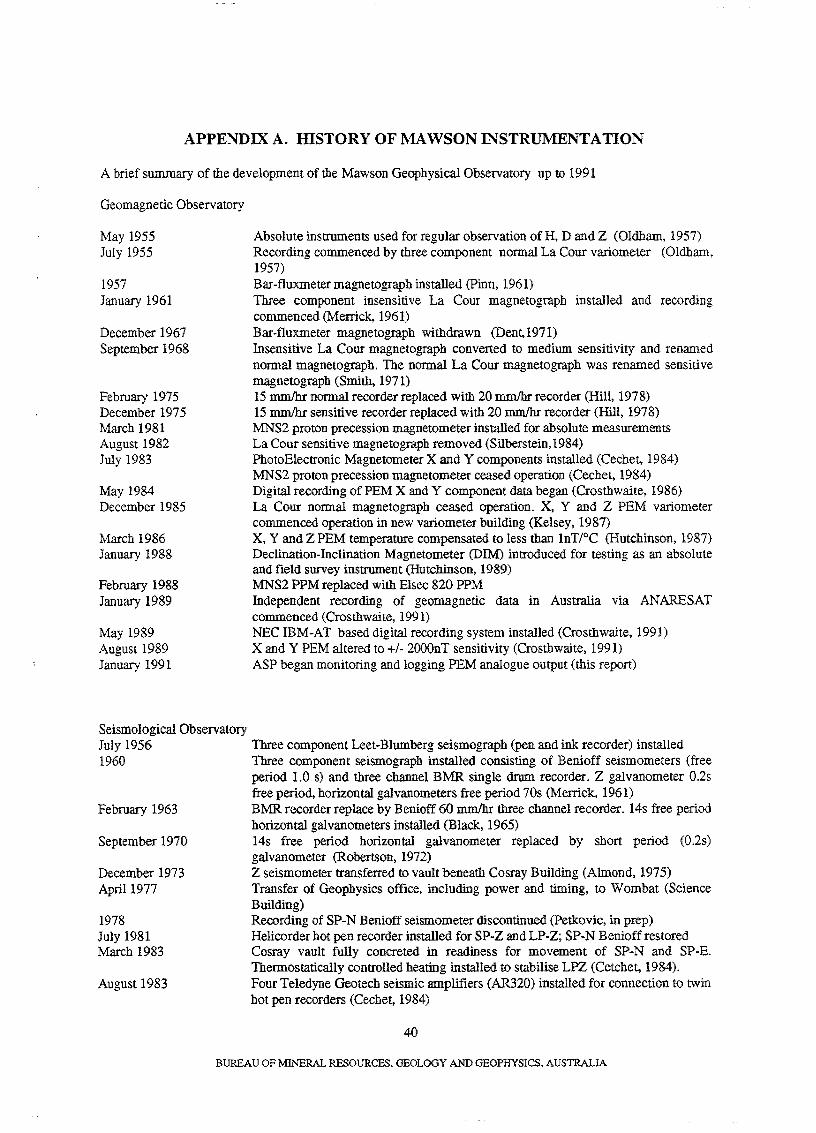
APPENDIX A. mSTORY OF MAWSON INSTRUMENTATION
A brief summary of the development of the Mawson Geophysical Observatory up to 1991
Geomagnetic Observatory
May 1955 July 1955
1957 January 1961
December 1967 September 1968
February 1975 December 1975 March 1981 August 1982 July 1983
May 1984 December 1985
March 1986 January 1988
February 1988 January 1989
May 1989 August 1989 January 1991
Seismological Observatory July 1956 1960
February 1963
September 1970
December 1973 April 1977
1978 July 1981 March 1983
August 1983
Absolute instruments used for regular observation ofH, D and Z (Oldham, 1957) Recording commenced by three component normal La Cour variometer (Oldham, 1957) Bar-fluxmeter magnetograpb installed (pinn, 1961) Three component insensitive La Cour magnetograph installed and recording commenced (Merrick, 1961) Bar-fluxmeter magnetograph withdrawn (Dent:. 1971) Insensitive La Cour magnetograph converted to medium sensitivity and renamed normal magnetograph. The normal La Cour magnetograph was renamed sensitive magnetograpb (Smith, 1971) 15 mmIhr normal recorder replaced with 20 mmlbr recorder (Hill, 1978) 15 mmJhr sensitive recorder replaced with 20 mmJbr recorder (Hill, 1978) MNS2 proton precession magnetometer installed for absolute measurements La Cour sensitive magnetograpb removed (Silberstein,1984) PhotoElectronic Magnetometer X and Y components installed (Cechet, 1984) MNS2 proton precession magnetometer ceased operation (Cechet, 1984) Digital recording ofPEM X and Y component data began (Crosthwaite, 1986) La Cour normal magnetograph ceased operation. X, Y and Z PEM variometer commenced operation in new variometer building (Kelsey, 1987) X, Y and Z PEM temperature compensated to less than InT/oC (Hutchinson, 1987) Declination-Inclination Magnetometer (DIM) introduced for testing as an absolute and field survey instrument (Hutchinson, 1989) MNS2 PPM replaced with Elsec 820 PPM Independent recording of geomagnetic data in Australia via ANARESAT commenced (Crosthwaite, 1991) NEC ffiM-AT based digital recording system installed (Crosthwaite, 1991) X and Y PEM altered to +/- 2000nT sensitivity (Crosthwaite, 1991) ASP began monitoring and logging PEM analogue output (this report)
Three component Leet-Blumberg seismograph (pen and ink recorder) installed Three component seismograph installed consisting of Benioff seismometers (free period 1.0 s) and three channel BMR single drum recorder. Z galvanometer 0.2s free period, horizontal galvanometers free period 70s (Merrick, 1961) BMR recorder replace by Benioff 60 mmlhr tbree channel recorder. 14s free period horizontal galvanometers installed (Black, 1965) 14s free period horizontal galvanometer replaced by short period (0.2s) galvanometer (Robertson, 1972) Z seismometer transferred to vault beneath Cosray Building (Almond, 1975) Transfer of Geophysics office, including power and timing, to Wombat (SCience Building) Recording of SP-N Benioff seismometer discontinued (Petkovic, in prep) Helicorder hot pen recorder installed for SP-Z and LP-Z; SP-N Benioff restored Cosray vault fully concreted in readiness for movement of SP-N and SP-E. Thermostatically controlled heating installed to stabilise LPZ (Cetchet, 1984). Four Teledyne Geotech seismic amplifiers (AR320) installed for connection to twin hot pen recorders (Cechet, 1984)
40
BUREAU OF MINERAL RESOURCES, GEOLOGY AND GEOPHYSICS. AUSTRALIA
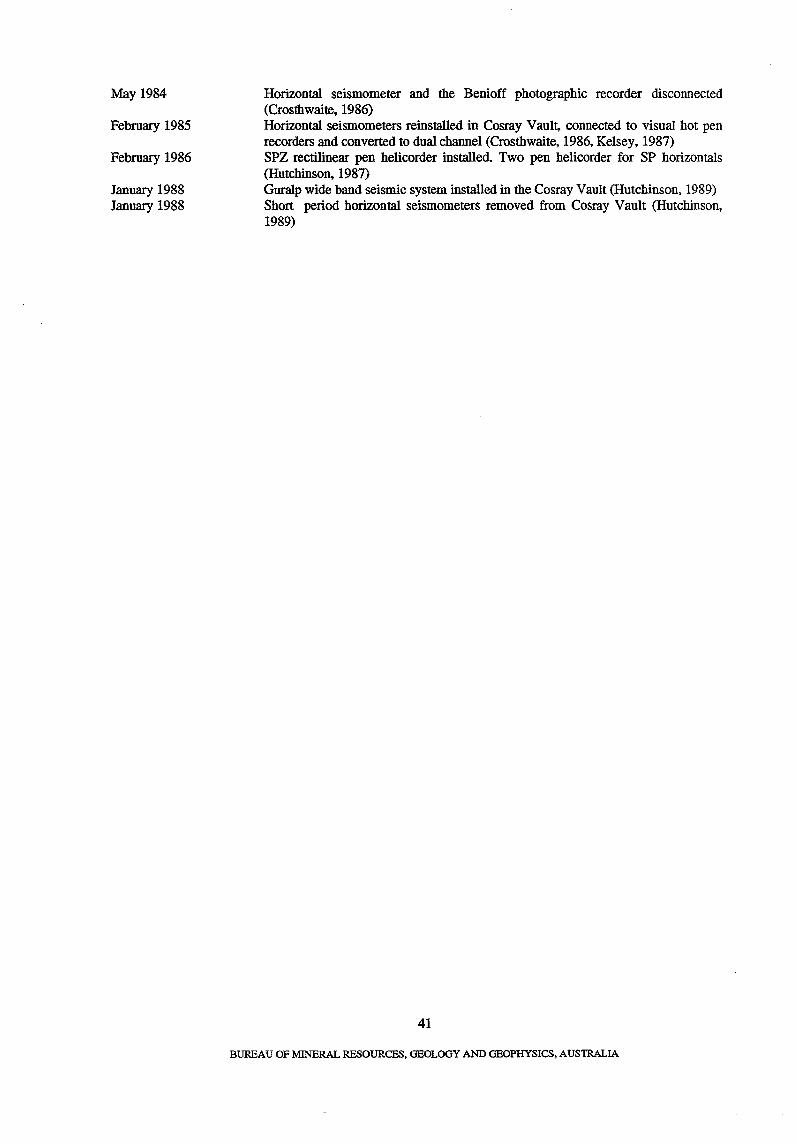
May 1984
February 1985
February 1986
January 1988 January 1988
Horizontal seismometer and the Benioff photographic recorder disconnected (Crosthwaite, 1986) Horizontal seismometers reinstalled in Cosray Vault, connected to visual hot pen recorders and converted to dual channel (Crosthwaite, 1986, Kelsey, 1987) SPZ rectilinear pen helicorder installed. Two pen helicorder for SP horizontals (Hutchinson, 1987) Guralp wide band seismic system installed in the Cosray Vault (Hutchinson, 1989) Short period horizontal seismometers removed from Cosray Vault (Hutchinson, 1989)
41
BUREAU OF MINERAL RESOURCES. GEOLOGY AND GEOPHYSICS. AUSTRALIA
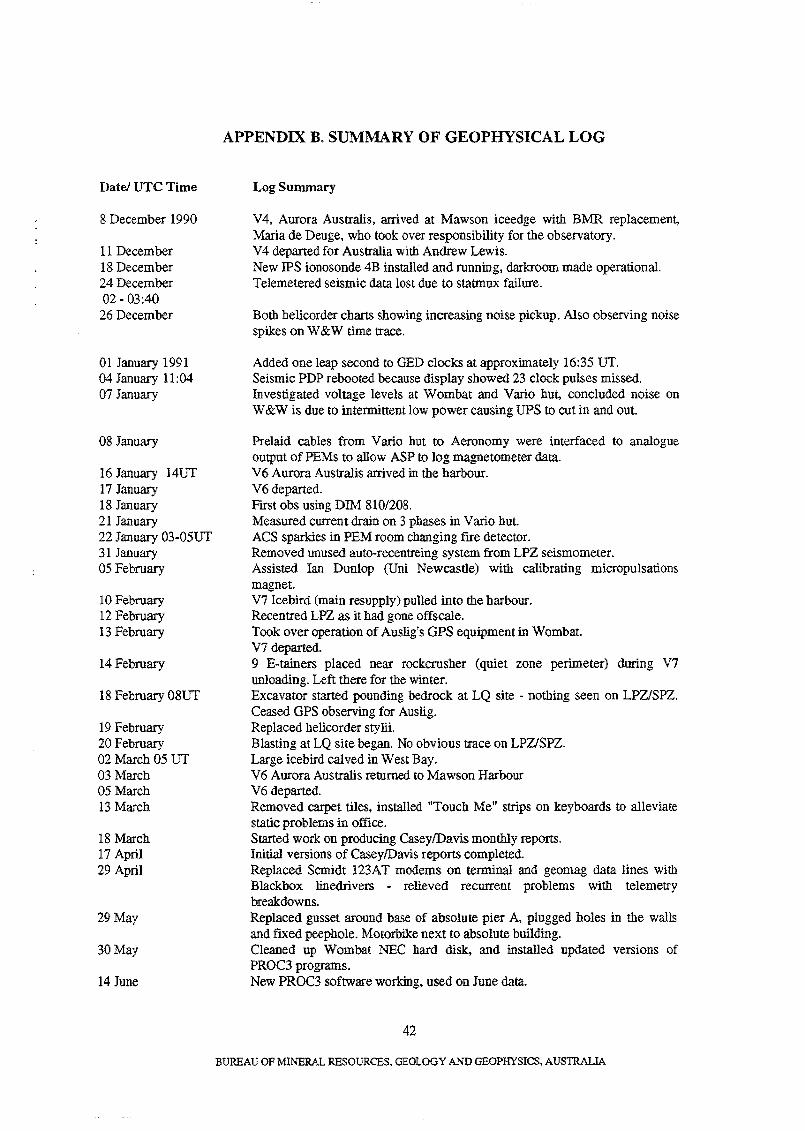
Date! UTe Time
8 December 1990
11 December 18 December 24 December 02 - 03:40 26 December
01 January 1991 04 January 11:04 07 January
08 January
16 January 14UT 17 January 18 January 21 January 22 January 03-05UT 31 January 05 February
10 February 12 February 13 February
14 February
18 February 08UT
19 February 20 February 02 March 05 UT 03 March 05 March 13 March
18 March 17 April 29 April
29 May
30 May
14 June
APPENDIX B. SUMMARY OF GEOPHYSICAL LOG
Log Summary
V4, Aurora Australis, arrived at Mawson iceedge with BMR replacement, Maria de Deuge, who took over responsibility for the observatory. V4 departed for Australia with Andrew Lewis. New IPS ionosonde 4B installed and running, darkroom made operational. Telemetered seismic data lost due to statmux failure.
Both belicorder charts showing increasing noise pickup. Also observing noise spikes on W&W time trace.
Added one leap second to GED clocks at approximately 16:35 UT. Seismic PDP rebooted because display sbowed 23 clock pulses missed. Investigated voltage levels at Wombat and Vario hut, concluded noise on W &W is due to intermittent low power causing UPS to cut in and out.
Prelaid cables from Vario hut to Aeronomy were interfaced to analogue output of PEMs to allow ASP to log magnetometer data. V6 Aurora Australis arrived in the harbour. V 6 departed. First obs using DIM 810/208. Measured current drain on 3 phases in Vario but. ACS sparkies in PEM room cbanging flre detector. Removed unused auto-recentreing system from LPZ seismometer. Assisted Ian Dunlop (Uni Newcastle) with calibrating micropulsations magnet. V7 lcebird (main resupply) pulled into the harbour. Recentred LPZ as it had gone offscale. Took over operation of Auslig's GPS equipment in Wombat. V7 departed. 9 E-tainers placed near rockcrusher (quiet zone perimeter) during V7 unloading. Left there for the winter. Excavator started pounding bedrock at LQ site - nothing seen on LPZlSPZ. Ceased GPS observing for Auslig. Replaced belicorder stylii. Blasting at LQ site began. No obvious trace on LPZlSPZ. Large icebird calved in West Bay. V6 Aurora Australis returned to Mawson Harbour V6 departed. Removed carpet tiles, installed "Touch Me" strips on keyboards to alleviate static problems in offlce. Started work on producing Casey/Davis monthly reports. Initial versions of Casey/Davis reports completed. Replaced Scmidt 123AT modems on terminal and geomag data lines with Blackbox linedrivers - relieved recurrent problems with telemetry breakdowns. Replaced gusset around base of absolute pier A, plugged holes in the walls and fixed peephole. Motorbike next to absolute building. Cleaned up Wombat NEC hard disk. and installed updated versions of PROC3 programs. New PROC3 software working. used on June data.
42
BUREAU OF MINERAL RESOURCES, GEOLOGY M"D GEOPHYSICS, AUSTRALIA
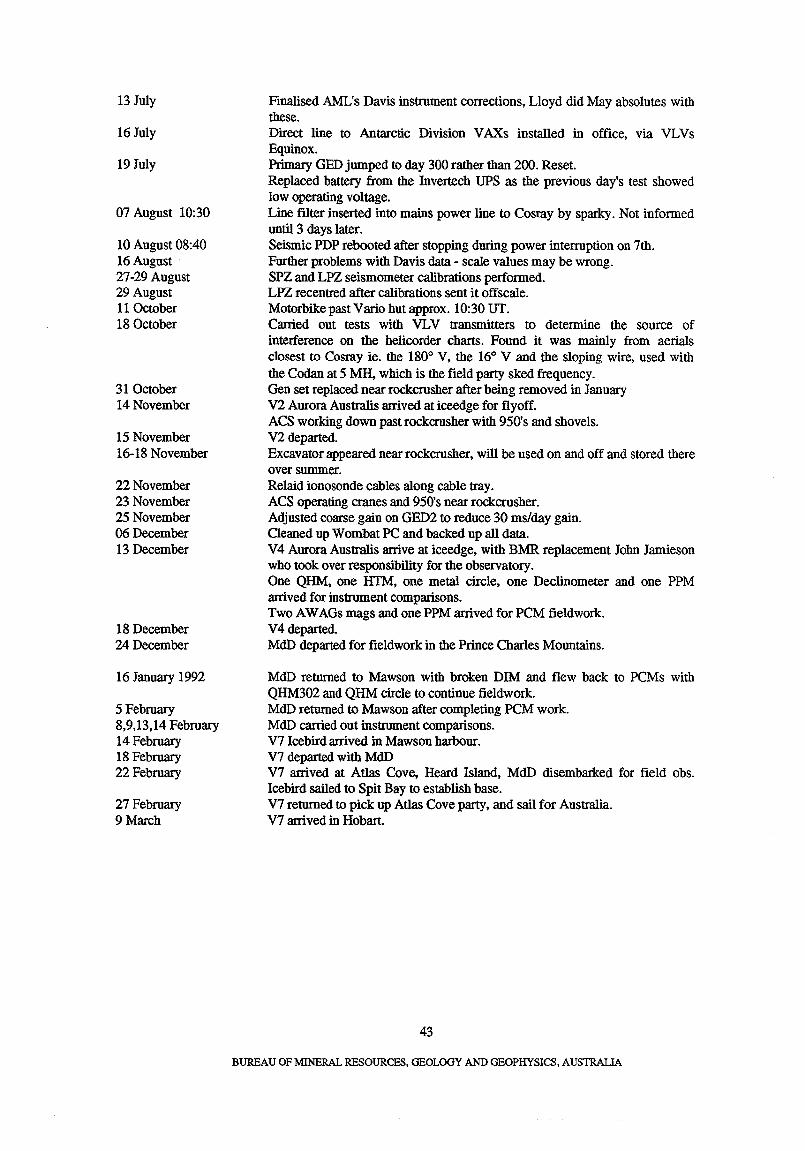
13 July
16 July
19 July
07 August 10:30
10 August 08:40 16 August 27-29 August 29 August 11 October 18 October
31 October 14 November
15 November 16-18 November
22 November 23 November 25 November 06 December 13 December
18 December 24 December
16 January 1992
5 February 8,9.13,14 February 14 February 18 February 22 February
27 February 9 Marcb
Finalised AML's Davis instrument corrections, Lloyd did May absolutes with these. Direct line to Antarctic Division V AXs installed in office. via VL V s Equinox. Primary GED jumped to day 300 rather than 200. Reset. Replaced battery from the Invertecb UPS as the previous day's test sbowed low operating voltage. Line fIlter inserted into mains power line to Cosray by sparky. Not informed until 3 days later. Seismic PDP rebooted after stopping during power interruption on 7th. Further problems with Davis data - scale values may be wrong. SPZ and LPZ seismometer calibrations performed. LPZ recentred after calibrations sent it offscale. Motorbike past Vario but approx. 10:30 UT. Carried out tests with VL V transmitters to determine the source of interference on the belicorder charts. Found it was mainly from aerials closest to Cosray ie. the 1800 V, the 160 V and the sloping wire, used with the Codan at 5 MH, whicb is the field party sked frequency. Gen set replaced near rockcrusher after being removed in January V2 Aurora Australis arrived at iceedge for flyoff. ACS working down past rockcrusher with 950's and shovels. V2 departed. Excavator appeared near rockcrusber, will be used on and off and stored there over summer. Relaid ionosonde cables along cable tray. ACS operating cranes and 950's near rockcrusher. Adjusted coarse gain on GED2 to reduce 30 ms/day gain. Cleaned up Wombat PC and backed up all data. V 4 Aurora Australis arrive at iceedge, with BMR replacement John Jamieson who took over responsibility for the observatory. One QHM, one HfM, one metal circle, one Declinometer and one PPM arrived for instrument comparisons. Two AW AGs mags and one PPM arrived for PCM fieldwork. V 4 departed. MdD departed for fieldwork in the Prince Cbarles Mountains.
MdD returned to Mawson with broken DIM and flew back to PCMs with QHM302 and QHM circle to continue fieldwork. MdD returned to Mawson after completing PCM work. MdD carried out instrument comparisons. V7 Icebird arrived in Mawson harbour. V7 departed with MdD V7 arrived at Atlas Cove, Heard Island, MdD disembarked for field obs. Icebird sailed to Spit Bay to establisb base. V7 returned to pick up Atlas Cove party, and sail for Australia. V7 arrived in Hobart.
43
BUREAU OF MINERAL RESOURCES. GEOLOGY AND GEOPHYSICS. AUSTRALIA
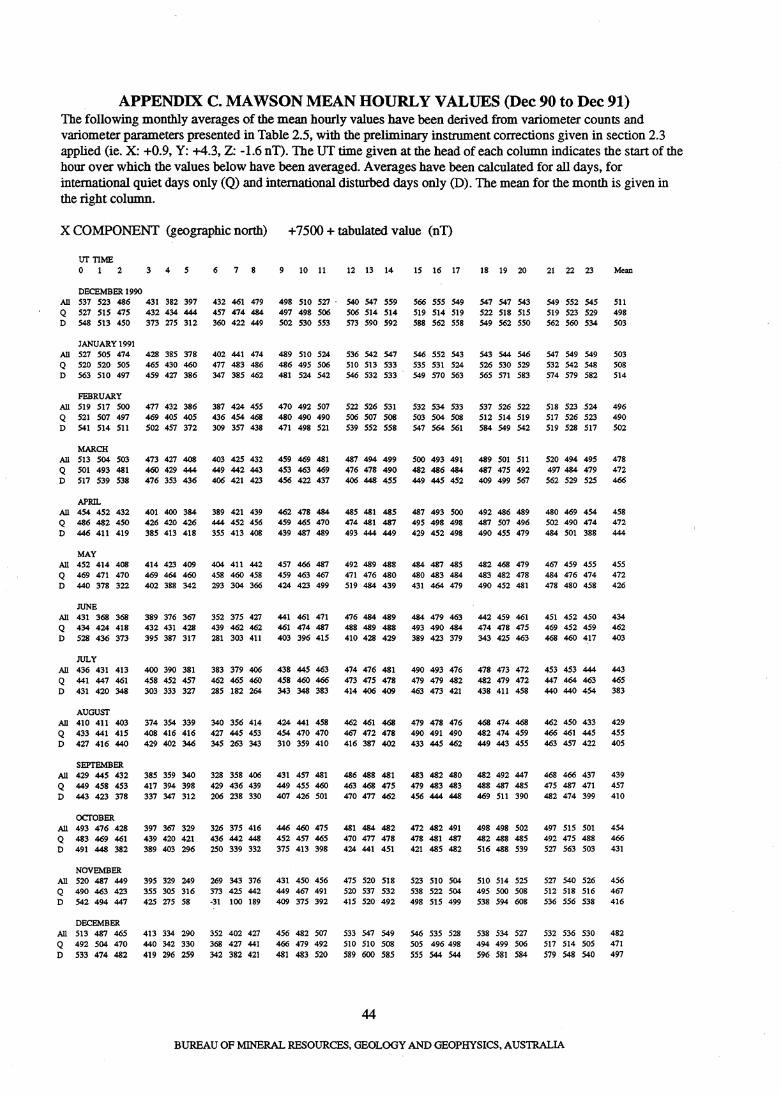
APPENDIX C. MAWSON MEAN HOURLY VALUES (Dec 90 to Dec 91) The following monthly averages of the mean hourly values have been derived from variometer counts and variometer parameters presented in Table 2.5, with the preliminary instrument corrections given in section 2.3 applied (ie. X: +0.9, Y: +4.3, Z: -1.6 nT). The UT time given at the head of each column indicates the start of the hour over which the values below have been averaged. Averages have been calculated for all days, for international quiet days only (Q) and international disturbed days only (D). The mean for the month is given in the right column.
X COMPONENT (geographic north)
UT TIME o I 2 345 6 7
DECEMBER 1990 All 537 523 486 431 382 397 432 461 479
457 474 484 360 422 449
Q 527 515 475 432 434 444 D 548 513 450 373 275 312
JANUARY 1991 All 527 50S 474 Q 520 520 505 D 563 510 497
FEBRUARY All 519 517 500 Q 521 507 497 D 541 514 511
MARCH All 513 504 503 Q 501 493 481 D 517 539 538
APRIL All 454 452 432 Q 486 482 450 D 446 411 419
MAY All 452 414 408 Q 469 471 470 D 440 378 322
JUNE All 431 368 368 Q 434 424 418 D 528 436 373
JULY All 436 431 413 Q 441 447 461 D 431 420 348
AUGUST All 410 411 403 Q 433 441 415 D 427 416 440
SEPTEMBER All 429 445 432 Q 449 458 453 D 443 423 378
ocrOBER All 493 476 428 Q 483 469 461 D 491 448 382
NOVEMBER All 520 487 449 Q 490 463 423 D 542 494 447
DECEMBER All 513 487 465 Q 492 504 470 D 533 474 482
428 385 378 465 430 460 459 427 386
477 432 386 469 405 405 502 457 372
473 427 408 460 429 444 476 353 436
402 441 474 477 483 486 347 385 462
387 424 455 436 454 468 309 357 438
403 425 432 449 442 443 406 421 423
401 400 384 389 421 439 426 420 426 444 452 456 385 413 418 355 413 408
414 423 409 404 411 442 469 464 460 458 460 458 402 388 342 293 304 366
389 376 367 432 431 428 395 387 317
400 390 381 458 452 457 303 333 327
352 375 427 439 462 462 281 303 411
383 379 406 462 465 460 285 182 264
374 354 339 340 356 414 408 416 416 427 445 453 429 402 346 345 263 343
385 359 340 328 358 406 417 394 398 429 436 439 337 347 312 206 238 330
397 367 329 326 375 416 439 420 421 436 442 448 389 403 296 250 339 332
395 329 249 355 305 316 425 275 58
413 334 290 440 342 330 419 296 259
269 343 376 373 425 442 ·31 100 189
352 402 427 368 427 441 342 382 421
+7500 + tabulated value (nT)
9 10 11 12 13 14
498 510 527 - 540 547 559 497 498 506 506 514 514 502 530 553 573 590 592
489 510 524 486 495 506 481 524 542
470 492 507 480 490 490 471 498 521
459 469 481 453 463 469 456 422 437
462 478 484 459 465 470 439 487 489
457 466 487 459 463 467 424 423 499
441 461 471 461 474 487 403 396 415
438 445 463 458 460 466 343 348 383
424 441 458 454 470 470 310 359 410
431 457 481 449 455 460 407 426 501
446 460 475 452 457 465 375 413 398
431 450 456 449 467 491 409 375 392
456 482 507 466 479 492 481 483 520
536 542 547 510 513 533 S46 532 533
522 526 531 506 507 508 539 552 558
487 494 499 476 478 490 406 448 455
485 481 485 474 481 487 493 444 449
492 489 488 471 476 480 519 484 439
476 484 489 488 489 488 410 428 429
474 476 481 473 475 478 414 406 409
462 461 468 467 472 478 416 387 402
486 488 481 463 468 475 470 477 462
481 484 482 470 477 478 424 441 451
475 520 518 520 537 532 415 520 492
533 547 549 510 510 508 589 600 585
44
15 16 17
566 555 549 519 514 519 588 562 558
546 552 543 535 531 524 549 570 563
532 534 533 503 504 508 547 564 561
500 493 491 482 486 484 449 445 452
18 19 20
547 547 543 522 518 515 549 562 550
543 544 546 526 530 529 565 571 583
537 526 522 512 514 519 584 549 542
489 SOl 511 487 475 492 409 499 567
487 493 500 492 486 489 495 498 498 487 507 496 429 452 498 490 455 479
484 487 485 482 468 479 480 483 484 483 482 478 431 464 479 490 452 481
484 479 463 493 490 484 389 423 379
442 459 461 474 478 475 343 425 463
490 493 476 478 473 472 479 479 482 482 479 472 463 473 421 438 411 458
479 478 476 490 491 490 433 445 462
483 482 480 479 483 483 456 444 448
468 474 468 482 474 459 449 443 455
482 492 447 488 487 485 469 511 390
472 482 491 498 498 502 478 481 487 482 488 485 421 485 482 516 488 539
523 510 504 538 522 504 498 SIS 499
S46 535 528 50S 496498 555 544 544
510 514 525 495 500 508 538 594 608
538 534 527 494 499 506 596 581 584
21 22 23
549 552 545 519 523 529 562 560 534
547 549 549 532 542 548 574 579 582
518 523524 517 526 523 519 528 517
520 494 495 497 484 479 562 529 525
480 469 454 502 490 474 484 501 388
467 459 455 484 476 474 478 480 458
451 452 450 469 452 459 468 460 417
453 453 444 447 464 463 440 440 454
462 450 433 466 461 445 463 457 422
468 466 437 475 487 471 482 474 399
497 515 501 492 475 488 527 563 503
527 540 526 512 518 516 536 556 538
532 536 530 517 514 505 579 548 540
BUREAU OF MINERAL RESOURCES, GEOLOGY AND GEOPHYSICS, AUSTRALIA
Mean
511 498 503
503 508 514
496 490 502
478 472 466
458 472 444
455 472 426
434 462 403
443 465 383
429 455 405
439 457 410
454 466 431
456 467 416
482 471 497

Y COMPONENT (geographic east) -16500 - tabulated value (nT)
UT TIME 00 01 02 03 04 05 06 07 08 09 10 11
DECEMBER 1990 All 174 185 197 184 187 191 193 188 183
203 191 167 171 182 220
175 180 192 161 159 165 210 206 228
Q 183 189 198 200 217 212 D 118 153 159 136 150 139
JANUARY 1991 All 166 170 173 Q 191 207 c 213 D 217 145 147
FEBRUARY All 168 187 199 Q 165 168 184 D 165 199 185
MARCH All 174 164 171 Q 190 170 181 D 173 182 144
APRIL All 162 169 160 Q 200 192 163 D 160 135 198
MAY All 158 142 157 Q 191 198 198 D 154 63 82
JUNE All mmw Q 154 n7 n1 D ~m~
JULY All 140 167 161 Q 177 185 201 D 122 171 92
AUGUsr All 132 143 143 Q 161 158 159 D 162 162 218
SEPTEMBER All 135 171 175 Q 171 180 192 D 108 153 128
OCTOBER All 162 175 151 Q 193 192 213 D 120 85 72
NOVEMBER All 199 201 200 Q 197 197 209 D 239 245 187
DECEMBER All 203 215 230 Q 195 206 231 D 230 208 238
180 192 199 22S 220 240 184 227 205
211 218 199 194 218 224 232 247 172
180 198 198 178 192 214 188 169 170
146 174 176 164 176 197 148 191 208
173 185 177 201 202 207 172 160 141
171 165 143 184 165 180 215 234 66
170 166 174 204 204 213 91 122 158
193 182 168 222 203 183 170 162 153
194 193 182 211 202 179 138 146 169
228 224 218 217 203 187 381 369 352
172 181 185 207 204 195 149 164 181
170 164 179 203 201 200 114 111 147
159 165 190 195 205 202 169 199 242
181 163 167 215 212 206 186 82 110
171 176 183 170 163 164 171 196 197
173 171 188 163 162 155 168 176 207
220 221 211 178 185 178 381 320 297
203 204 201 191 188 180 215 242 239
193 201 211 196 191 190 207 215 246
194 205 206 199 198 206 201 215 183
194 186 204 200 195 197 198 174 189
140 146 143 171 195 195 196 184 127
153 154 184 189 193 195 198 205 196 196 199 202 177 128 180 168 174 162
164 174 181 171 170 189 199 206 22S 179 190 205 220 218 203 191 187 188 119 182 177 134 120 160 198 209 270
183 214 216 208 209 228 239 243 246 232 227 233 224 216 200 188 182 182 170 263 262 242 268 311 309 304 256
221 221 201 201 202 211 22S 189 125
175 182 193 204 195 185 73 148 147
238 231 210 219 207 196 240 248 231 211 211 187 248 249 218 236 216 234
212 233 231 179 189 222 225 231 203
204 228 264 175 180 217 268 317 372
12 13 14
211 215 227 167 175 185 255 256 256
203 210 220 169 176 203 217 203 208
198 198 204 171 177 186 221 220 224
198 192 202 167 171 182 223 191 183
197 189 191 181 182 184 226 174 165
212 212 206 191 193 196 250 231 174
215 220 218 212 214 215 154 155 156
212 211 217 200 200 202 189 169 178
193 189 199 198 203 204 158 120 131
15 16 17
229 216 206 193 195 197 229 201 185
221 225 205 2n 220 213 218 216 142
212 206 180 189 195 201 229 178 82
207 190 170 188 190 186 188 164 105
191 190 184 192 195 192 130 121 123
196 196 187 197 201 201 142 138 128
208 188 141 217 218 213 77 84 -14
218 215 195 205 208 211 167 154 124
206 200 192 214 219 224 148 129 132
214 210 195 200 191 181 190 192 197 204 212 213 204 189 134 133 113 85
220 198 183 162 155 123 184 190 196 204 212 218 204 160 143 70 63 ~3
216 233 206 264 282 267 113 169 47
296 301 288 248 246 247 355 349 290
45
218 189 133 252 243 210 69 13 -216
258 230 209 244 234 230 216 170 149
18 19 20
191 194 187 197 194 194 157 178 165
201 194 178 210 208 201 160 179 155
190 179 170 207 196 178 163 148 152
~2 U3 124 1~ ~5 H2 34 ~ ~
168 140 145 192 192 181 69 31 35
170 149 154 199 195 186 163 163 159
158 122 91 209 211 209 73 ~ -5
190 167 141 212 205 181 106 66 49
166 151 143 206 193 167 122 121 131
141 160 113 208 192 166 7 66 -27
122 130 135 209 209 199 21 51 94
115 104 138 195 196 195 -119 -20 55
182 178 162 224 222 220 61 49 75
21 22 23
180 171 166 198 199 204 176 162 129
176 168 173 192 182 185 185 159 198
147 157 165 177 184 172 76 117 120
143 124 145 196 150 145 47 -2 80
147 144 146 175 n3 179 105 115 38
151 140 132 195 181 184 161 ISS 128
101 118 123 193 180 177 121 112 51
116 122 134 143 170 177 IS 55 136
121 114 99 167 147 146 138 127 55
125 148 138 166 180 195 68 113 59
wm ~ HI nl 1~ n Wl~
132 178 162 182 196 183 -9 128 191
183 195 205 209 197 187 107 141 198
BUREAU OF MINERAL RESOURCES, GEOLOGY AND GEOPHYSICS, AUSTRALIA
Mean
193 189 184
189 199 184
187 186 172
182 184 181
173 186 148
176 196 158
161 196 132
175 197 129
162 188 148
174 193 129
183 202 158
187 211 111
222 218 216
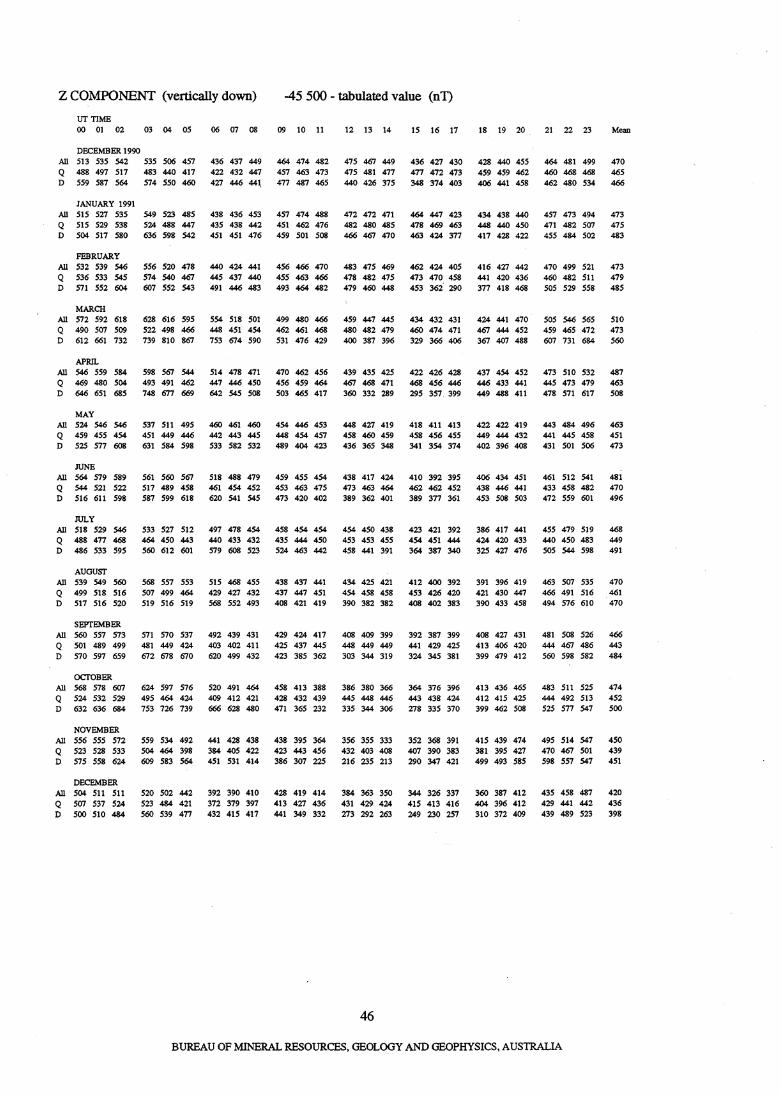
Z COMPONENT (vertically down) -45 500 - tabulated value (nT)
UT TIME 00 01 02 03 04 05 06 07 08 09 10 11
DECEMBER 1990 All 513 535 542 535 506 457 436 437 449
422 432 447 427 446 441.
464 474 482 457 463 473 477 487 465
Q 488 497 517 483 440 417 D 559 587 564 574 550 460
JANUARY 1991 All 515 527 535 Q 515 529 538 D 504 517 580
FEBRUARY All 532 539 S46 Q 536 533 545 D 571 552 604
MARCH All 572 592 618 Q 490 507 509 D 612 661 732
APRIL All S46 559 584 Q 469 480 504 D 646 651 685
MAY All 524 S46 S46 Q 459 455 454 D 525 577 608
JUNE All 564 579 589 Q S44 521 522 D 516 611 598
JULY All 518 529 S46 Q 488 477 468 D 486 533 595
AUGUST
549 523 485 524 488 447 636 598 542
556 520 478 574 S40 467 607 552 543
628 616 595 522 498 466 739 810 867
598 567 S44 493 491 462 748 677 669
537 511 495 451 449 446 631 584 598
561 560 567 517 489 458 587 599 618
533 527 512 464 450 443 560 612 601
438 436 453 435 438 442 451 451 476
440 424 441 445 437 440 491 446 483
554 518 501 448 451 454 753 674 590
514 478 471 447 446 450 642 545 508
460 461 460 442 443 445 533 582 532
457 474 488 451 462 476 459 501 508
456 466 470 455 463 466 493 464 482
499 480 466 462 461 468 531 476 429
470 462 456 456 459 464 503 465 417
454 446 453 448 454 457 489 404 423
518 488 479 459 455 454 461 454 452 453 463 475 620 541 545 473 420 402
497 478 454 458 454 454 440 433 432 435 444 450 579 608 523 524 463 442
All 539 549 560 568 557 553 515 468 455 438 437 441 Q 499 518 516 507 499 464 429 427 432 437 447 451 D 517 516 520 519 516 519 568 552 493 408 421 419
SEPTEMBER All 560 557 573 Q 501 489 499 D 570 597 659
OCTOBER All 568 578 607 Q 524 532 529 D 632 636 684
NOVEMBER All 556 555 572 Q 523 528 533 D 575 558 624
DECEMBER All 504 511 511 Q 507 537 524 D 500 510 484
571 570 537 492 439 431 481 449 424 403 402 411 672 678 670 620 499 432
624 597 576 520 491 464 495 464 424 409 412 421 753 726 739 666 628 480
559 534 492 441 428 438 504 464 398 384 405 422 609 583 564 451 531 414
520 502 442 392 390 410 523 484 421 372 379 397 560 539 477 432 415 417
429 424 417 425 437 445 423 385 362
458 413 388 428 432 439 471 365 232
438 395 364 423 443 456 386 307 225
428 419 414 413 427 436 441 349 332
12 13 14
475 467 449 475 481 477 440 426 375
472 472 471 482 480 485 466 467 470
483 475 469 478 482 475 479 460 448
459 447 445 480 482 479 400 387 396
439 435 425 467 468 471 360 332 289
448 427 419 458 460 459 436 365 348
438 417 424 473 463 464 389 362 401
454 450 438 453 453 455 458 441 391
434 425 421 454 458 458 390 382 382
408 409 399 448 449 449 303 344 319
386 380 366 445 448 446 335 344 306
356 355 333 432 403 408 216 235 213
384 363 350 431 429 424 273 292 263
46
15 16 17
436 427 430 477 472 473 348 374 403
464 447 423 478 469 463 463 424 377
462 424 405 473 470 458 453 362 290
434 432 431 460 474 471 329 366 406
422 426 428 468 456 446 295 357 399
418 411 413 458 456 455 341 354 374
410 392 395 462 462 452 389 377 361
423 421 392 454 451 444 364 387 340
412 400 392 453 426 420 408 402 383
392 387 399 441 429 425 324 345 381
364 376 396 443 438 424 278 335 370
352 368 391 407 390 383 290 347 421
344 326 337 415 413 416 249 230 257
18 19 20
428 440 455 459 459 462 406 441 458
434 438 440 448 440 450 417 428 422
416 427 442 441 420 436 377 418 468
424 441 470 467 444 452 367 407 488
437 454 452 446 433 441 449 488 411
422 422 419 449 444 432 402 396 408
406 434 451 438 446 441 453 508 503
386 417 441 424 420 433 325 427 476
391 396 419 421 430 447 390 433 458
408 427 431 413 406 420 399 479 412
413 436 465 412 415 425 399 462 508
415 439 474 381 395 427 499 493 585
360 387 412 404 396 412 310 372 409
21 22 23
464 481 499 460 468 468 462 480 534
457 473 494 471 482 507 455 484 502
470 499 521 460 482 511 505 529 558
505 S46 565 459 465 472 607 731 684
473 510 532 445 473 479 478 571 617
443 484 496 441 445 458 431 501 506
461 512 541 433 458 482 472 559 601
455 479 519 440 450 483 505 S44 598
463 507 535 466 491 516 494 576 610
481 508 526 444 467 486 560 598 582
483 511 525 444 492 513 525 577 547
495 514 547 470 467 501 598 557 547
435 458 487 429 441 442 439 489 523
BUREAU OF MINERAL RESOURCES. GEOLOGY AND GEOPHYSICS. AUSTRALIA
Mean
470 465 466
473 475 483
473 479 485
510 473 560
487 463 508
463 451 473
481 470 496
468 449 491
470 461 470
466 443 484
474 452 500
450 439 451
420 436 398
APPENDIX D. DETERMINATION OF QUIET DA Y AVERAGES FOR DA VIS AND CASEY
Maria de Deuge, Nov 1991
BMR magnetometers (QHM's, PPM's, BMZ's) have been used at Casey and Davis for many years, operated by ASP expeditioners or the station leader. Since there were no accompanying variometers, the absolutes were used as a measure of the quiet field at these stations - not very· accurate, but the best that was available. However in late 1986 and 1987, ASP installed XYZ fluxgate magnetometers at Davis and Casey. These operated successfully but without accurately determined baselines (accurate enough for use in ASP work, but not for B:tv.1R observatory reporting).
It was agreed between ASP and B:tv.1R that the digital magnetometer data from Casey and Davis would be made available to the Mawson BMR geophysicist for use in determining monthly quiet day averages for these stations. ASP were to write an averaging program to determine daily averages from the raw digital data. Many unforseen difficulties arose and a history of these is given in 1991 correspondence GE065.
First. a general description of the process. The ASP observers do one set of 2 absolutes (pPM, QIW, QIW, PPM) each month, and fax the obs forms to Mawson, for info. The absolutes are analysed by the ASPs for HDF and then, incorporating the digital data, for XYZ baselines. The results are included in the monthly ASP magnetometer report, a copy of which is emailed or telexed to the Mawson geo, for info. The ASP variometers log continuously onto PDP's at each station, using a general ASP routine called LOGIT. The data are logged as daily files and telemetered back to the Division V AX at the end of each month. The Mawson geo must have an account on the V AX from which to run the averaging program MAG.FOR. This converts the raw digital data to hourly and daily averages of the field in nT, for specified files. Daily averages for the 5 quiet days are combined to give average quiet field values for the month.
The procedure for obtaining monthly quiet day averages is as follows:
O. To assist in keeping track of things, you should ask the Davis and Casey observers for the following - Copies of all mag. correspondence between them and Kingston HO - Faxes of each month's set of 2 absolutes - Email or telex copies of their magnetometer monthly reports
1. To rigorously choose the 5 quietest days at each of Davis and Casey would involve analysing the whole month's data. Since the system is not yet set up to do this, the days used are the 5 quiet days determined from the Mawson data. This assumes a strong correlation between the levels of activity at the 3 stations which mayor may not be accurate.
The Mawson geo must arrange for a personal account on the Ant.Div. V AX - I've asked for a general BMR account, but they prefer not to set up group accounts for security reasons. Talk to any of the programmers in ADP. The digital data are sent by Perry to the directory PHYS:[CASEY RDL] and by Lloyd to PHYS:[DA VIS.RDL] after the end of the month. If they are not available, send an email message to DANNY_RAT who will either restore it from archive, or prompt the stations if it has not been sent. Copy the 5 quiet days to [KINGSTON.RDL.B:tv.1R], from where MAG accesses it.
2. Set the default directory to where MAG resides: $SDMAGAVE
and type $ R MAG - the execution of the program is self-explanatory. The hourly and daily averages are written to your top level directory into a me called MAGNET.LOG. Either type this out to screen or use an editor to scan the file for the averages given at the end of each day (these are in nT). Calculate the average X,Y and Z for the 5 quiet days and from these H, D, F, 1.
3. The monthly report is written up on the NEC in the files \MAll-91\OUI\GEnnnCD.mmm where nnn is a sequential number and mmm is the month, and sent back to Canberra in the usual way.
47
BUREAU OF MINERAL RESOURCES. GEOLOGY AND GEOPHYSICS. AUSTRALIA
4. Sometimes MAG bombs out when the digital data are corrupt. in which case you can either email MORRIS at Ant.Div. and ask him to check that specific me, or else you can check it yourself using the ASP PDP. The data are written by PDP's at the station, and at the moment there is no general routine on the V AX for reading and examining the data, so it must be transferred back to Mawson to be examined. The procedure is:
o go up to the ASP lab and ask if you can use their PDP o put the operating system disk (currently called "ernie") into the top RL02 drive, and a scratch disk (currently
called "mag mes for maria") into the bottom drive, and reboot the PDP - at the "." prompt connect to the V AX by typing "X, then VTCOM <CR> <CR> - log into your V AX account. go to [KINGSTON.RDL.BMR] and type:
$ TRANSFER DAMG91.ddd DL1:DAMG91.dddJIMAGEIREMOTEfLOG/STAT where ddd is the day number. It will take at least 45 mins to transfer.
o Log off the V AX and return to the PDP by typing "B. o To examine the data, use ASP's RDLU1L routine: at the "." prompt type V <CR>, then RDLU1L <CR>
The routine is menu driven, and self-explanatory.
NOTE: Since 1991 point 4 has become redundant. The data can be checked on the V AX using a command: ALLOm <f1J.ename, in upper case>
5. The RDLU1L routine can also be used to obtain digital data in order to reanalyse the CaseylDavis absolutes for checking purposes ... Use RDLU1L to obtain digital data at the time of the obs, and type these and the absolute data up on the NEC into the me WAGOBS\sss\A91ddd.OBS where sss is the station, CAS or DAV, ddd is the day number. From \MAGOBS they can be analysed with the REDUCE and COMPARE programs as for Mawson absolutes using the commands
DA VRED ddd, CASRED ddd, DA VBLV ddd, and CASBLV ddd The constants are held in the flIes DA VINFO.CON, DAVTRlAL.CON, DAVOBS.CP, CASINFO.CON, CASTRIAL.CON, CASOBS.CP.
NOTE: Since 1991, point 5 has also become redundant. The data can be obtained on the V AX using a command: ALLOm <flIename, in upper case>
6. If there are any changes to the instrument or logging equipment parameters (baselines, Scale values, conditioner sensitivity etc) the constants flIes DA_SCALE_ V ALUES.DAT and CA_SCALE_ V ALUES.DAT in the MAGA VB directory must be changed. The me EXCLUDE_TIMES.DAT contains a list of times for which data must be excluded (due to calibration pulses, contamination etc). The averaging program offers the option of adding to this file manually.
7. If there are any problems, the contact people and email addresses at AntDiv. are: Gary Burns (BURNS) - Research scientist; previous program manager for ASP, and has been heavily involved
in setting up the magnetometers Ray Morris (MORRIS) - Program Manager for ASP Danny Ratcliffe (DANNY _RAn· T.A.; used to do archiving etc, for ASP, but this may change Keith Anderson (KEIlli_AND) - ADP manager for computing problems, else ring computer help on X488 Perry Roberts (pERRY_ROB) - 1991 ASP at Casey Lloyd Symons (LLOYD _SYM) - 1991 ASP at Davis
These last two will change each year.: Lloyd Symons (LLOYD_SYM) - 1993 ASP at Casey Simon Parcell (SIMON_PAR) - 1993 ASP at Davis
48
BUREAU OF MINERAL RESOURCES. GEOLOGY AND GEOPHYSICS, AUSTRALIA