Embed Size (px)
Citation preview
1
Navigating through State and Federal Data Requirements
Published by the Illinois State Board of Education
Special Education and Support Services
Updated August 2012
2
INTRODUCTION:
In accordance with 20 U.S.C 1416(b)(2)(C)(ii)(II) of the Individuals with Disabilities Education Act (IDEA), each
February, the Illinois State Board of Education (ISBE) is required to submit an Annual Performance Report
(APR) to the Office of Special Education Programs (OSEP) regarding the State’s overall performance in relation
to the 20 Indicators in the State Performance Plan. The State Performance Plan (SPP) was developed as a six-
year plan that was to be comprised of Compliance Indicators including Disproportionality, Early Childhood
Transition, Secondary Transition and General Supervision, and Results Indicators, including Graduation, Drop
Out, Assessment and Educational Environments. Each Indicator incorporates a measurable and rigorous target
for each year of the SPP cycle. These targets are used as a basis for analyzing each districts’ data for students
with disabilities. To obtain a copy of Illinois’ SPP or APR, please visit the ISBE website at:
http://www.isbe.net/spec-ed/Default.htm.
The purpose of this document is to help districts and special education cooperatives understand the “big
picture” of special education data in Illinois by showing the process between district’s reporting of data to ISBE
and the final reports and decisions based on these data. In this document, you will find a brief description of
each SPP Indicator, the data systems ISBE utilizes to collect district reported data and additional information
regarding each collection. You will also find how these data are used to make decisions at the state and
federal levels. Along the way, there are helpful roadside assistance tips to ensure accurate and consistent
reporting for your district, as well as a few frequently asked questions.
ISBE’s intent is to give districts and special education cooperatives a better understanding of how their data
drives decision making to improve results for students with disabilities statewide.
3
Table of Contents:
Special Education Data Reporting Requirements: Putting the Pieces Together.. 4
Why Does ISBE Collect Special Education Data………………………………………………. 5
SPP Indicator 1: Graduation Rates…..……………………………………………………………… 6
SPP Indicator 2: Dropout Rates...……………………………………………………………………. 8
SPP Indicator 3: Assessment Participation & Performance..…………………………… 10
SPP Indicator 4: Suspension/Expulsion Rates…………………………………………………. 12
SPP Indicator 5: Educational Environments for Students 6-21………………………… 17
SPP Indicator 6: Educational Environments for Students 3-5………………………….. 19
SPP Indicator 7: Early Childhood Outcomes………………………….………………………… 21
SPP Indicator 8: Parent Survey………………………………………………………………………. 24
SPP Indicators 9 and 10: Disproportionality…………………………………………………… 25
SPP Indicator 11: Child Find Timelines .…………………………………………………………. 27
SPP Indicator 12: Early Childhood Transition (Part C to Part B)………………….….. 29
SPP Indicator 13: Secondary Transition…………………………………………………………. 32
SPP Indicator 14: Secondary Transition/Post School Outcomes…………………..…. 34
SPP Indicators 15 - 20: General Supervision & Dispute Resolution …..……………. 36
FACTS December 1 Child Count……………………………………………………………………… 37
SIS Exit Codes for Students with IEPs Receiving Services Through Age 21 ……… 38
Coordinated Early Intervening Services (CEIS) Reporting……………………………….. 40
Resources Links….…………………………………………………………………………………………. 41
4
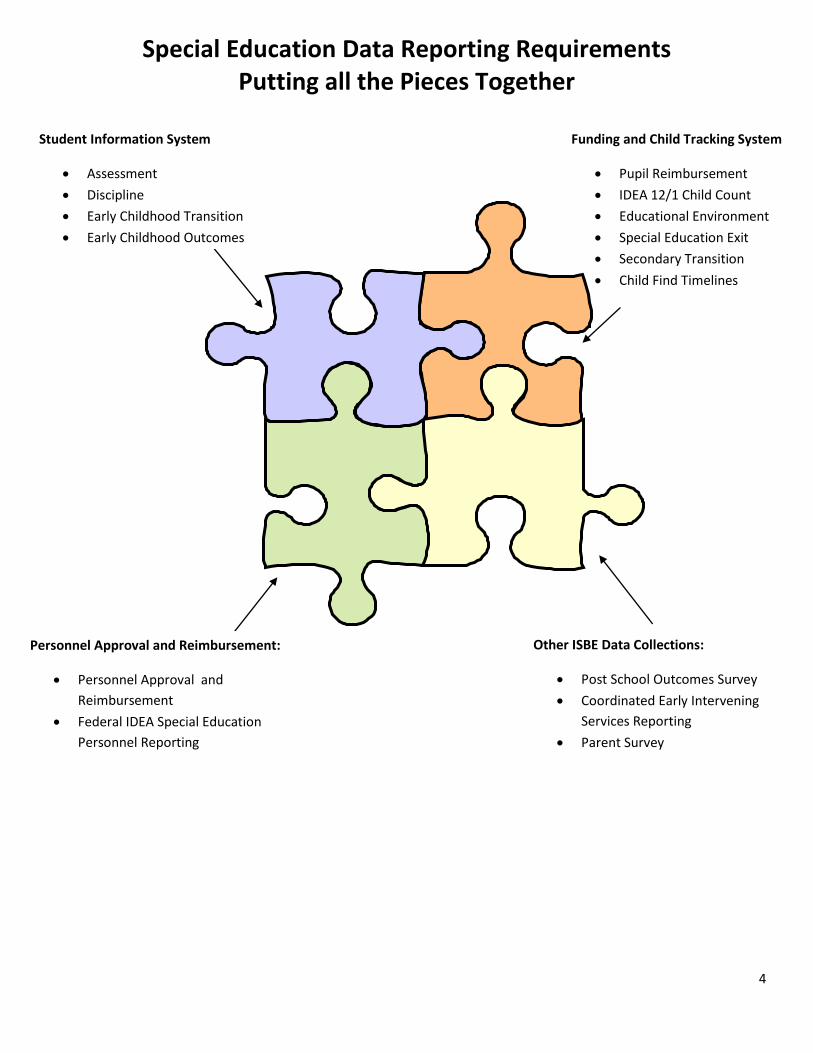
Funding and Child Tracking System
Pupil Reimbursement
IDEA 12/1 Child Count
Educational Environment
Special Education Exit
Secondary Transition
Child Find Timelines
Special Education Data Reporting Requirements Putting all the Pieces Together
Personnel Approval and Reimbursement:
Personnel Approval and
Reimbursement
Federal IDEA Special Education
Personnel Reporting
Student Information System
Assessment
Discipline
Early Childhood Transition
Early Childhood Outcomes
Other ISBE Data Collections:
Post School Outcomes Survey
Coordinated Early Intervening
Services Reporting
Parent Survey
5
Why does ISBE collect special education data?
IDEA Section 616
State Performance Plan (SPP)
Annual Performance Report (APR)
State and Local Determinations
Public Reporting
IDEA Section 618
Child Count
Personnel
Educational Environment
Exiting Special Education
Disciplinary Removals
Assessment
Dispute Resolution
Coordinated Early Intervening
Services (CEIS)
6
SPP Indicator 1: Graduation Rates
Indicator 1 Definition: The percent of youth with IEPs graduating from high school
with a regular diploma.
Indicator 1 Measurement: Percent = # of youth with IEPs graduating from high
school with a regular diploma divided by the (# of original freshmen with IEPs +
Transfer in with IEPs – Transfer out or died with IEPs) times 100.
Starting Point: Data Collection
Graduation rates are based on Exit Enrollment data for students, entered by
districts in the Student Information System (SIS). Districts must use the proper exit
codes for all students in SIS. For more information on Exit Enrollment codes, please
review the SIS data elements at: http://www.isbe.net/sis/html/data_elements.htm.
Next Steps: Data Analysis
The graduation rate is calculated based on the NCLB High School Graduation Rate
guidance (http://www2.ed.gov/policy/elsec/guid/hsgrguidance.pdf).
The SIS webinar “Adjusted Cohort Graduation Rate” from April 19, 2012 explains
ISBE’s calculation process in greater detail. The archived webinar materials and
recording are available at:
http://www.isbe.net/sis/html/archived_meetings.htm#adj_cohort041912
Definition of a “graduate” under the four-year adjusted cohort graduation rate:
Graduates only include students who graduate with a regular high school diploma
in four years or less in the original cohort that is, the cohort with which he or she
started 9th grade. For example If a student who entered 9th grade for the first time
in the 2008-2009 school year and graduates in three years or less, this student
would be included in the cohort of students expected to graduate in the 2011-
2012 school year.
A student with a disability who does not graduate with a regular high school
diploma, but instead receives an alternative diploma, certificate of completion, or
any other degree or certificate that is not fully aligned with a State’s academic
content standards may not be counted as graduating.
Destination: Reporting
Adequate Yearly Progress (http://www.isbe.net/ayp/default.htm)
Illinois School Report Cards
(http://webprod.isbe.net/ereportcard/publicsite/getsearchcriteria.aspx)
Road Side Assistance Tip!
Accurate reporting of IEP
Status (Yes or No) in SIS will
ensure graduation rates are
accurately calculated for the
IEP subgroup.
7
District Special Education Profiles
(http://webprod.isbe.net/LEAProfile/SearchCriteria1.aspx)
Annual Performance Report (http://www.isbe.net/spec-
ed/pdfs/annual_partB.pdf)
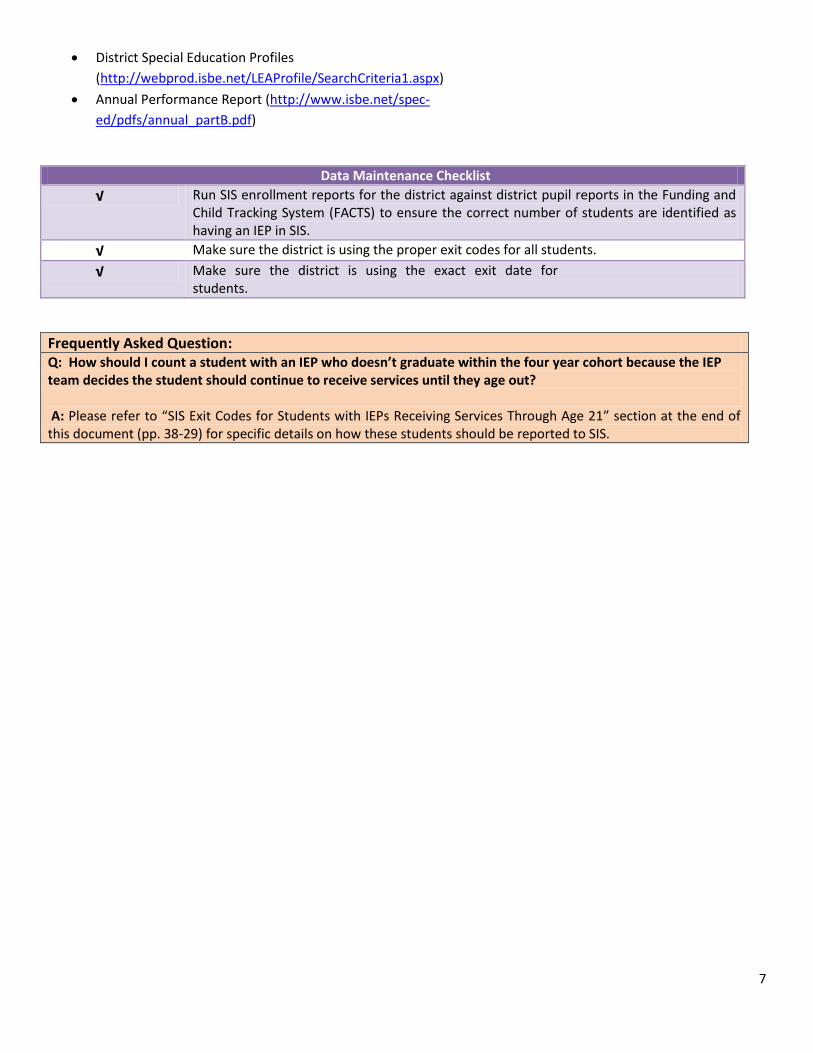
Data Maintenance Checklist
√ Run SIS enrollment reports for the district against district pupil reports in the Funding and Child Tracking System (FACTS) to ensure the correct number of students are identified as having an IEP in SIS.
√ Make sure the district is using the proper exit codes for all students.
√ Make sure the district is using the exact exit date for students.
Frequently Asked Question: Q: How should I count a student with an IEP who doesn’t graduate within the four year cohort because the IEP team decides the student should continue to receive services until they age out? A: Please refer to “SIS Exit Codes for Students with IEPs Receiving Services Through Age 21” section at the end of this document (pp. 38-29) for specific details on how these students should be reported to SIS.
8
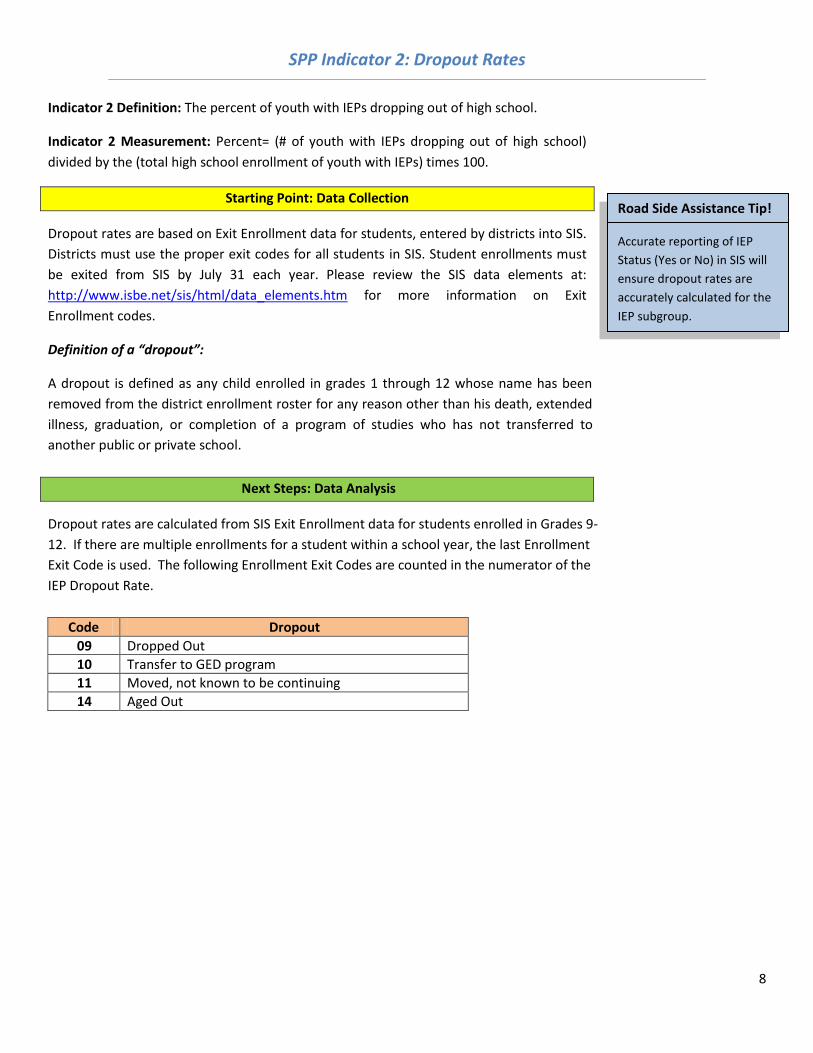
SPP Indicator 2: Dropout Rates
Indicator 2 Definition: The percent of youth with IEPs dropping out of high school.
Indicator 2 Measurement: Percent= (# of youth with IEPs dropping out of high school)
divided by the (total high school enrollment of youth with IEPs) times 100.
Starting Point: Data Collection
Dropout rates are based on Exit Enrollment data for students, entered by districts into SIS.
Districts must use the proper exit codes for all students in SIS. Student enrollments must
be exited from SIS by July 31 each year. Please review the SIS data elements at:
http://www.isbe.net/sis/html/data_elements.htm for more information on Exit
Enrollment codes.
Definition of a “dropout”:
A dropout is defined as any child enrolled in grades 1 through 12 whose name has been
removed from the district enrollment roster for any reason other than his death, extended
illness, graduation, or completion of a program of studies who has not transferred to
another public or private school.
Next Steps: Data Analysis
Dropout rates are calculated from SIS Exit Enrollment data for students enrolled in Grades 9-
12. If there are multiple enrollments for a student within a school year, the last Enrollment
Exit Code is used. The following Enrollment Exit Codes are counted in the numerator of the
IEP Dropout Rate.
Code Dropout
09 Dropped Out
10 Transfer to GED program
11 Moved, not known to be continuing
14 Aged Out
Road Side Assistance Tip!
Accurate reporting of IEP
Status (Yes or No) in SIS will
ensure dropout rates are
accurately calculated for the
IEP subgroup.
9
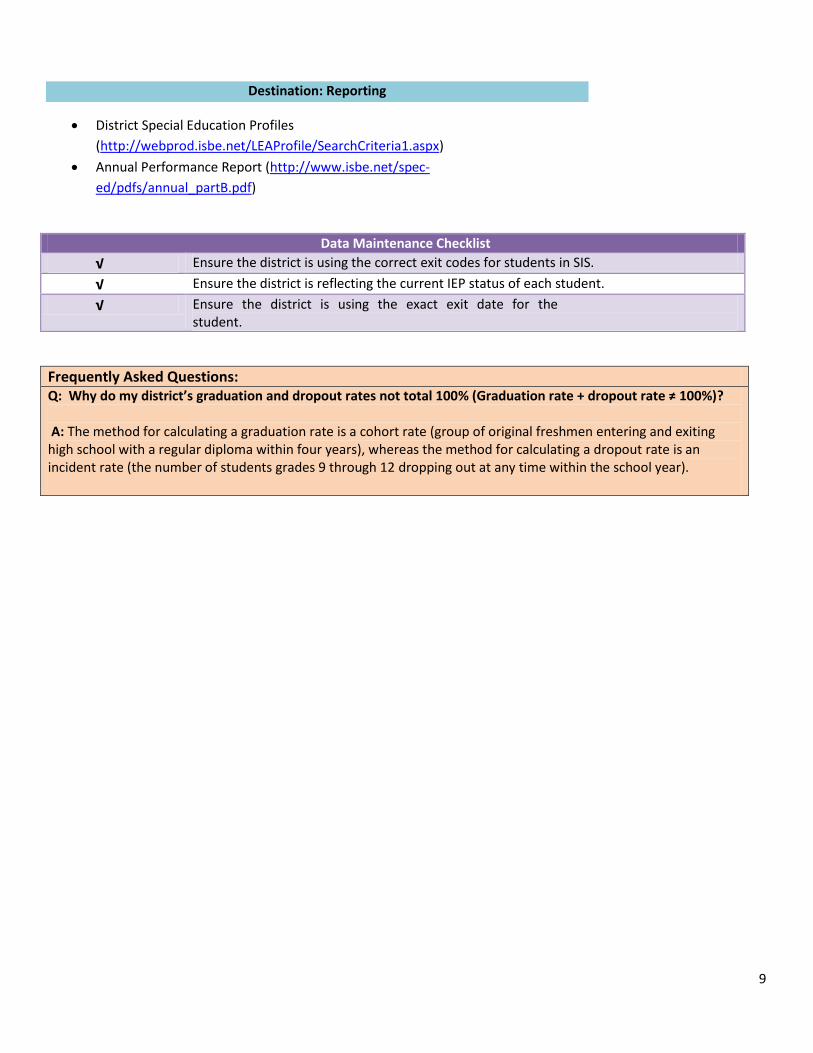
Destination: Reporting
District Special Education Profiles
(http://webprod.isbe.net/LEAProfile/SearchCriteria1.aspx)
Annual Performance Report (http://www.isbe.net/spec-
ed/pdfs/annual_partB.pdf)
Data Maintenance Checklist
√ Ensure the district is using the correct exit codes for students in SIS.
√ Ensure the district is reflecting the current IEP status of each student.
√ Ensure the district is using the exact exit date for the student.
Frequently Asked Questions: Q: Why do my district’s graduation and dropout rates not total 100% (Graduation rate + dropout rate ≠ 100%)? A: The method for calculating a graduation rate is a cohort rate (group of original freshmen entering and exiting high school with a regular diploma within four years), whereas the method for calculating a dropout rate is an incident rate (the number of students grades 9 through 12 dropping out at any time within the school year).
10
SPP Indicator 3: Assessment Participation & Performance
Indicator 3 Definition:
Participation and performance of children with IEPs on statewide assessments:
A. Percent of the districts with a disability subgroup that meets the State’s
minimum “n” size that meet the State’s AYP targets for the disability subgroup.
B. Participation rate for children with IEPs.
C. Proficiency rate for children with IEPs against grade level, modified, and
alternate academic achievement standards.
Indicator 3 Measurement:
A. AYP percent = # of districts with a disability subgroup that meets the State’s
minimum “n” size that meets the State’s AYP targets for the disability subgroup
divided by the total # of districts that have a disability subgroup that meets the
State’s minimum “n” size. The current “n” size used in calculating AYP is 45
students. Subgroups with fewer than 45 students are not reported.
B. Participation rate percent = # of children with IEPs participating in the
assessment divided by the total # of children with IEPs enrolled during the testing
window, calculated separately for reading and math.
C. Proficiency rate percent = # of children with IEPs enrolled for a full academic
year scoring at or above proficient divided by the total # of children with IEPs
enrolled for a full academic year, calculated separately for reading and math.
Starting Point: Data Collection
Student Assessment data is collected in SIS. For more information regarding the technical
assistance resources for the Illinois Student Assessment Reporting and the SIS Assessment
process please visit the following links:
ISBE Student Assessment Division: http://www.isbe.net/assessment/default.htm
SIS Key Dates: http://www.isbe.net/sis/html/key_dates.htm
SIS User Manual: http://www.isbe.net/sis/html/user_manual.htm
SIS Data Elements: http://www.isbe.net/sis/html/data_elements.htm
Archived SIS Webinars: http://www.isbe.net/sis/html/archived_meetings.htm
SIS FAQs: http://www.isbe.net/sis/html/faqs.htm
11
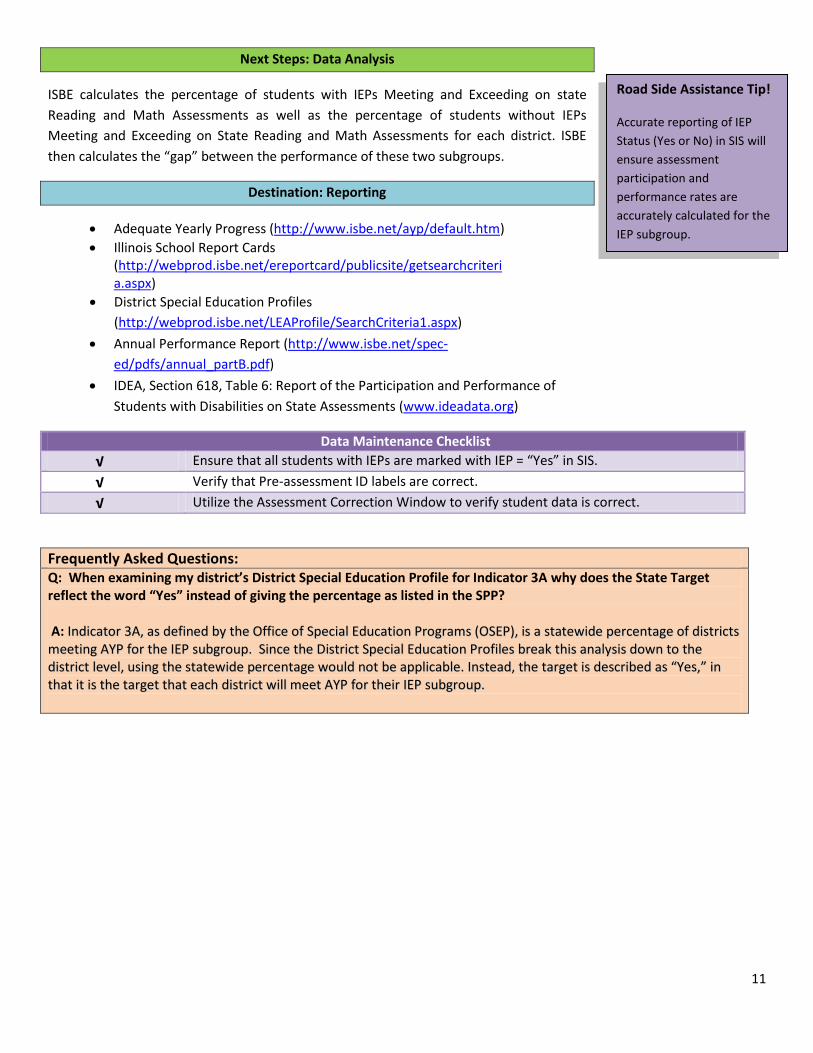
Next Steps: Data Analysis
ISBE calculates the percentage of students with IEPs Meeting and Exceeding on state
Reading and Math Assessments as well as the percentage of students without IEPs
Meeting and Exceeding on State Reading and Math Assessments for each district. ISBE
then calculates the “gap” between the performance of these two subgroups.
Destination: Reporting
Adequate Yearly Progress (http://www.isbe.net/ayp/default.htm)
Illinois School Report Cards (http://webprod.isbe.net/ereportcard/publicsite/getsearchcriteria.aspx)
District Special Education Profiles
(http://webprod.isbe.net/LEAProfile/SearchCriteria1.aspx)
Annual Performance Report (http://www.isbe.net/spec-
ed/pdfs/annual_partB.pdf)
IDEA, Section 618, Table 6: Report of the Participation and Performance of
Students with Disabilities on State Assessments (www.ideadata.org)
Data Maintenance Checklist
√ Ensure that all students with IEPs are marked with IEP = “Yes” in SIS.
√ Verify that Pre-assessment ID labels are correct.
√ Utilize the Assessment Correction Window to verify student data is correct.
Frequently Asked Questions: Q: When examining my district’s District Special Education Profile for Indicator 3A why does the State Target reflect the word “Yes” instead of giving the percentage as listed in the SPP? A: IInnddiiccaattoorr 33AA,, aass ddeeffiinneedd bbyy tthhee OOffffiiccee ooff SSppeecciiaall EEdduuccaattiioonn PPrrooggrraammss ((OOSSEEPP)),, iiss aa ssttaatteewwiiddee ppeerrcceennttaaggee ooff ddiissttrriiccttss
mmeeeettiinngg AAYYPP ffoorr tthhee IIEEPP ssuubbggrroouupp.. SSiinnccee tthhee DDiissttrriicctt SSppeecciiaall EEdduuccaattiioonn PPrrooffiilleess bbrreeaakk tthhiiss aannaallyyssiiss ddoowwnn ttoo tthhee
ddiissttrriicctt lleevveell,, uussiinngg tthhee ssttaatteewwiiddee ppeerrcceennttaaggee wwoouulldd nnoott bbee aapppplliiccaabbllee.. IInnsstteeaadd,, tthhee ttaarrggeett iiss ddeessccrriibbeedd aass ““YYeess,,”” iinn
tthhaatt iitt iiss tthhee ttaarrggeett tthhaatt eeaacchh ddiissttrriicctt wwiillll mmeeeett AAYYPP ffoorr tthheeiirr IIEEPP ssuubbggrroouupp..
Road Side Assistance Tip!
Accurate reporting of IEP
Status (Yes or No) in SIS will
ensure assessment
participation and
performance rates are
accurately calculated for the
IEP subgroup.
12
SPP Indicator 4: Suspension/Expulsion Rates
Indicator 4 Definition:
A. The percent of districts that have a significant discrepancy in the rate of
suspensions and expulsions of greater than 10 days in the school year for children
with IEPs.
B. The percent of districts that have (a) a significant discrepancy, by race or ethnicity,
in the rate of suspensions and expulsions of greater than 10 days in a school year
for children with IEPs; and (b) policies, procedures or practices that contribute to
the significant discrepancy and do not comply with requirements relating to the
development and implementation of IEPs, the use of positive behavioral
interventions and supports, and procedural safeguards.
Indicator 4 Measurement:
Percent = # of districts that have a significant discrepancy in the rates of
suspensions and expulsions for greater than 10 days in a school year of children
with IEPs divided by the # of districts in the state.
Percent= # of districts that have (a) a significant discrepancy, by race or ethnicity,
in the rate of suspensions and expulsions of greater than 10 days in a school year
for children with IEPs; and (b) policies, procedures and practices that contribute to
the significant discrepancy and do not comply with requirements relating to the
development and implementation of IEPs, the use of positive behavioral
interventions and supports, and procedural safeguards divided by the # of districts
in the state.
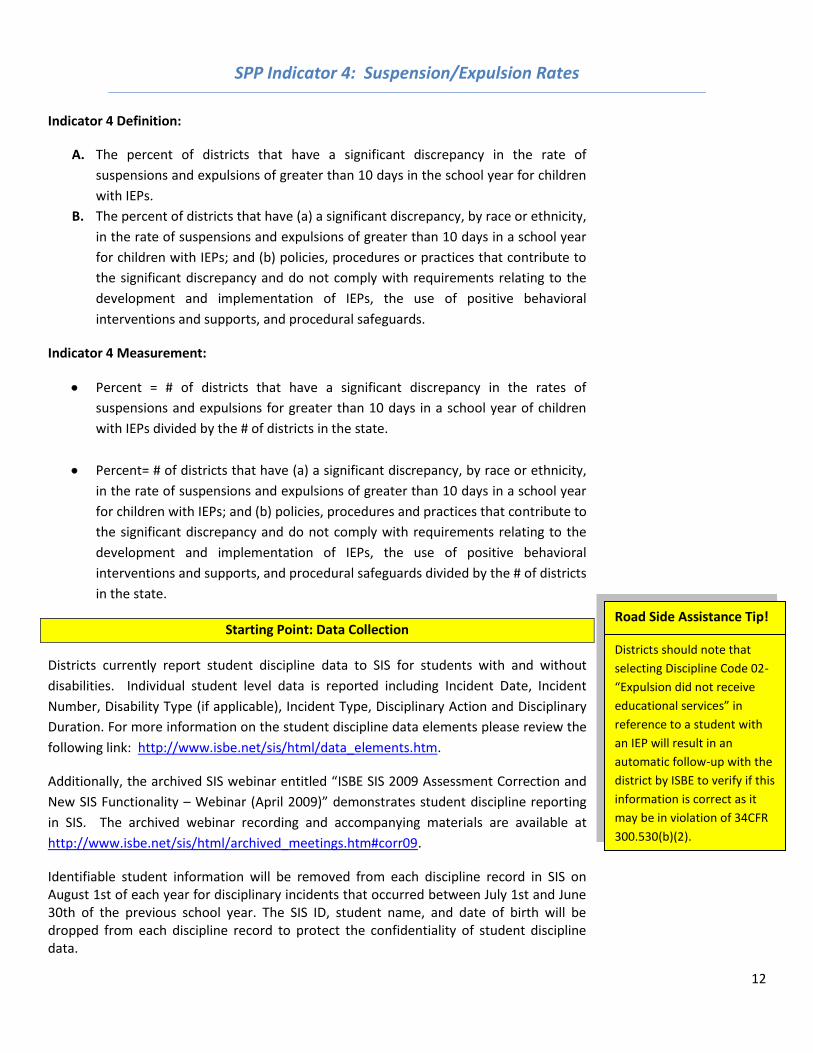
Starting Point: Data Collection
Districts currently report student discipline data to SIS for students with and without
disabilities. Individual student level data is reported including Incident Date, Incident
Number, Disability Type (if applicable), Incident Type, Disciplinary Action and Disciplinary
Duration. For more information on the student discipline data elements please review the
following link: http://www.isbe.net/sis/html/data_elements.htm.
Additionally, the archived SIS webinar entitled “ISBE SIS 2009 Assessment Correction and
New SIS Functionality – Webinar (April 2009)” demonstrates student discipline reporting
in SIS. The archived webinar recording and accompanying materials are available at
http://www.isbe.net/sis/html/archived_meetings.htm#corr09.
Identifiable student information will be removed from each discipline record in SIS on August 1st of each year for disciplinary incidents that occurred between July 1st and June 30th of the previous school year. The SIS ID, student name, and date of birth will be dropped from each discipline record to protect the confidentiality of student discipline data.
Road Side Assistance Tip!
Districts should note that
selecting Discipline Code 02-
“Expulsion did not receive
educational services” in
reference to a student with
an IEP will result in an
automatic follow-up with the
district by ISBE to verify if this
information is correct as it
may be in violation of 34CFR
300.530(b)(2).
13
Next Steps: Data Analysis
Indicator 4A & 4B:
ISBE employs a two-step process for district Indicator 4A & 4B analysis:
First, ISBE determines if the district shows a significant discrepancy in the rates of
out-of-school suspensions/expulsions when compared to the State rate.
Significant discrepancy for Indicator 4A and 4B is determined as follows:
1. A Suspension/Expulsion Rate is calculated for each district as follows: ((# of
students with IEPs suspended or expelled for more than 10 days)/ (# of
students with IEPs)) * 100.
2. A State Suspension/Expulsion Rate is calculated in the same manner by using
the total number of students with IEPs suspended or expelled for more than
10 days in the entire state, and the total number of students with IEPs in the
entire state.
3. A standard deviation from the State Suspension/Expulsion Rate is then
calculated.
4. A district is determined to have a significant discrepancy if :
a. Its Suspension/Expulsion Rate is greater than the State
Suspension/Expulsion Rate + one standard deviation for three
consecutive years, AND
b. The district had at least five students suspended or expelled more
than 10 days.
In Illinois, a LEA is determined to meet the state definition of “significant
discrepancy” if its suspension/expulsion rate is greater than the State suspension/
expulsion rate plus one standard deviation for three consecutive years and the
LEA has had at least five students suspended or expelled for more than 10 days.
Second, districts identified as having a potential significant discrepancy for three
consecutive years are required to complete a self-assessment process in
accordance to the requirements of 34 CFR 300.170(b). The purpose of the self-
assessment is to review the district’s policies, procedures and practices to
determine whether or not they contribute to the significant discrepancy or do not
comply with requirements relating to the development and implementation of
IEPs, the use of positive behavioral interventions and supports, and procedural
safeguards.
To review this indicator and its measurable and rigorous targets, please visit the following
link: http://www.isbe.net/spec-ed/pdfs/state_performance.pdf.
14
Data Verification Desk Audits
In addition to the Indicator 4A & 4B analysis described above, ISBE also conducts a data
verification desk audit with districts whose data show one of the following conditions:
Districts which report low amounts of disciplinary incidents for students with IEPs
within a school year, as compared to the district’s Special Education December 1st
Child Count.
Districts which report Discipline Code 02-“Expulsion did not receive educational
services,” in reference to a student with an IEP, as this may be in violation of
34CFR 300.530(b)(2).
Districts selected for these data verification desk audits must verify the accuracy of data
reported to SIS.
Destination: Reporting
District Special Education Profiles
(http://webprod.isbe.net/LEAProfile/SearchCriteria1.aspx)
Annual Performance Report (http://www.isbe.net/spec-
ed/pdfs/annual_partB.pdf)
Overview of Illinois’ Process for Determining and Addressing Disproportionality in
Special Education identification and Significant Disproportionality in Identification,
Placement and Discipline: (http://www.isbe.net/spec-
ed/pdfs/disproportionality_process.pdf)
IDEA, Section 618, Table 5: Report of Children with Disabilities Subject to
Disciplinary Removal (www.ideadata.org)
Data Maintenance Checklist
√ Submit your district’s discipline data by the July 31st SIS deadline.
√ Before reporting on a student with a disability, verify that at the time of the incident the student had an IEP to ensure the proper coding of the student’s disability type.
√ Verify that the appropriate discipline codes were chosen for each student and incident.
15
Frequently Asked Questions:
Q: Are school districts responsible for collecting discipline data for students who are attending alternative educational settings? A: The “Home School” is responsible for reporting all student discipline data. Q: When a student receives a disciplinary action that removes him/her from regular classes, we isolate that student from other students for the day and they have a teacher with them giving instruction. Should this be called in-school suspension?
A: This description seems to fit the definition of “In-School Suspension” as found in the Data Elements. Instances in which a child is temporarily removed from his/her regular classroom(s) for disciplinary purposes but remains under the direct supervision of school personnel should be reported as an in-school suspension. For further information, please refer to the SIS Data Elements documentation. Q: Our district gives suspensions in ½ day increments (e.g. 2 ½ days suspension). Since SIS only allows us to report in whole numbers, should we round up or down?
A: The district should round up when reporting discipline data to SIS. A 2 ½ day suspension would be reported in SIS with the Disciplinary Duration Code 03. Q: Does the district need to report after school, Saturday or lunch detentions to SIS?
A: No. The district should only report instances in which a child is temporarily removed from his/her regular classroom(s) for disciplinary purposes. Q: What is the difference between the disciplinary action of ‘Transfer to Alternative Program in lieu of another disciplinary action’ versus ‘Unilateral Removal to an Interim Alternative Educational Setting by School Personnel’?
A: Please refer to the Data Elements documentation for complete definitions regarding the Disciplinary Action Codes. “Unilateral Removal to an Interim Alternative Educational Setting by School Personnel” would only be used for students who have an IEP. School personnel would be taking this action in accordance with 34 CFR §300.530(g) of the IDEA regulations. “Transfer to Alternative Program in lieu of another disciplinary action” could be applicable any student, regardless of whether the student has an IEP or not. Q: If a student has an IEP for only a portion of the school year, how do we report their discipline data in SIS?
AA:: If the student did not have an IEP at the time of the disciplinary incident, the district should report “Code 99: None” in the Disability Type Category Description, at which time these incidents do not accumulate toward the 10 day or greater analysis under Indicator 4. If the student did have an IEP at the time of the disciplinary incidents, the district is required to appropriately report the student’s primary disability category. For more information on this please review the “Student Discipline” SIS data elements at: http://www.isbe.net/sis/html/data_elements.htm.
16
Q: When examining my district’s District Special Education Profile for Indicator 4A why does the State Target reflect the word “No” instead of giving the percentage as listed in the SPP?
A: Indicator 4A as defined by OSEP, is that no more than that statewide percentage of districts reflect having a significant discrepancy in the rates of suspensions/expulsions greater than 10 days in regard to students with IEPs . Since the District Special Education Profiles break this analysis down to the district level, using the statewide percentage would not be applicable. Instead, the target is described as “No,” in that it is the target that each district would not reflect a significant discrepancy. Q: Our district received a data verification letter state that there were “0” instances of disciplinary removals for student with disabilities last school year. However, when reviewing the SIS discipline report, it seems to include students with IEPs on the report. Can you explain?
AA:: The issue may be that while the district reported discipline incidents for students with IEPs, the district may have reported the Disability Category as "None" for these students (See Column G of the SIS Discipline Report). With this field reported as "None," ISBE cannot include these students in federal IDEA discipline reports and analysis. There is not a block in SIS for this since a student could have an IEP for only a portion of the school year, which makes IEP = Yes. That is, if the student did not have an IEP at the time of the disciplinary incident, the district should report "None" in the Disability Category Description, at which time these incidents do not accumulate toward the 10 day or greater analysis under Indicator 4. If the student did have an IEP at the time of the disciplinary incidents, the district is required to appropriately report the student's primary disability category.
17
Indicator 5: Educational Environments for students 6-21
Indicator 5 Definition: Percent of children with IEPs aged 6 through 21 served:
A. Inside the regular class 80% or more of the day.
B. Inside the regular class less than 40% of the day; and
C. In separate schools, residential facilities, or homebound/hospital placements.
Indicator 5 Measurement:
A. Percent = # of children with IEPs served inside the regular classroom 80% or more
of the day divided by the total # of students aged 6 through 21 with IEPs.
B. Percent = # of children with IEPs served inside the regular classroom less than 40%
of the day divided by the total # of students aged 6 through 21 with IEPs.
C. Percent = # of children with IEPs served in separate schools, residential facilities,
or homebound/hospital placements divided by the total # of students aged 6
through 21 with IEPs.
Starting Point: Data Collection
For students with IEPs ages 6-21, districts report Educational Environment data to the
Funding and Child Tracking System (FACTS). Districts must report these data throughout
the school year as outlined in the Special Education Due Dates on the Funding &
Disbursements website (http://www.isbe.net/funding/html/specialed.htm). The final
FACTS transmission is due June 30th of each year.
For more information on the Percent Time inside General Education Environment
calculation for students aged 6 through 21, Educational Environment codes, and
instructions on how to report these data to FACTS, please review the FACTS Instructions
available at http://www.isbe.net/funding/pdf/34-30_sped_facts.pdf.
Next Steps: Data Analysis
After the final June 30 FACTS transmission, ISBE calculates Indicators 5A, 5B, & 5C based
on the December 1st child count for children with IEPs ages 6-21. Students reported under
EE Code 28 (Parentally placed in Nonpublic Schools and Home-Schooled) as of the
December 1st child count are not included in Indicator 5A, 5B, or 5C calculations.
Focused Monitoring:
Indicator 5A (the percentage of children with IEPs aged 6 through 21 served inside the
regular class 80% or more of the day) has been chosen as the priority area for focused
monitoring. The ISBE focused monitoring district selection process divides districts into
similar groups based upon district type and enrollment size in order to rank each district
according to the district’s performance on the priority area. The process of clustering
districts allows comparability between similar or “like” districts.
Road Side Assistance Tip!
Districts are selected for
focused monitoring visits
based on Indicator 5 data.
As such, the accuracy of
these data is critical.
18
Districts are selected for an on-site focused monitoring review based on their ranking
within their group on the selected performance indicator. Those districts in each group
performing lowest on the critical performance indicator will receive an on-site review.
Districts that received a focused monitoring on-site review the previous year and are
currently implementing an improvement plan are exempt from selection for the same
priority area. In addition, districts that have completed a monitoring review within the
past three school years and are in the process of collecting trend data on their progress
are exempt from selection for the same priority area.
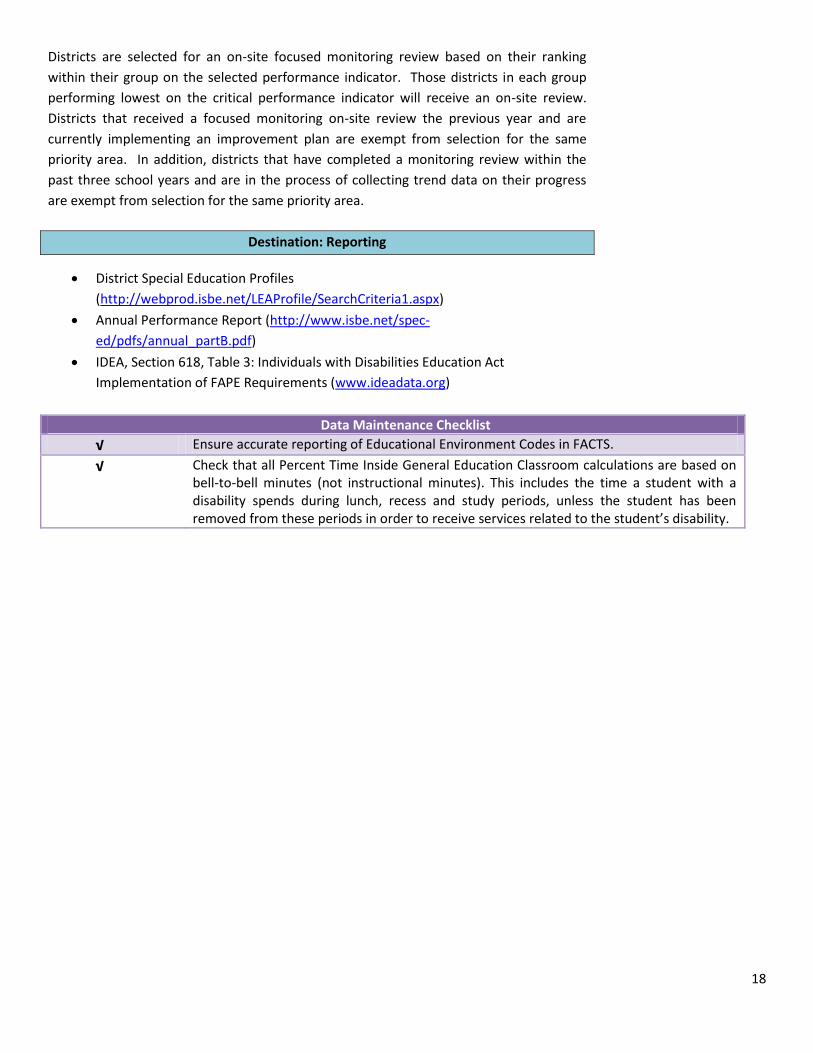
Destination: Reporting
District Special Education Profiles
(http://webprod.isbe.net/LEAProfile/SearchCriteria1.aspx)
Annual Performance Report (http://www.isbe.net/spec-
ed/pdfs/annual_partB.pdf)
IDEA, Section 618, Table 3: Individuals with Disabilities Education Act
Implementation of FAPE Requirements (www.ideadata.org)
Data Maintenance Checklist
√ Ensure accurate reporting of Educational Environment Codes in FACTS.
√ Check that all Percent Time Inside General Education Classroom calculations are based on bell-to-bell minutes (not instructional minutes). This includes the time a student with a disability spends during lunch, recess and study periods, unless the student has been removed from these periods in order to receive services related to the student’s disability.
19
Indicator 6: Educational Environment Ages 3-5
Indicator 6 Definition: Percent of children with IEPs aged 3-5 attending a:
A. Regular early childhood program and receiving the majority of special education
and related services in the regular early childhood program; and;
B. Separate special education class, separate school or residential facility.
Indicator 6 Measurement:
A. Percent = # of children aged 3 through 5 with IEPs attending a regular early
childhood program and receiving the majority of special education and related
services in the regular early childhood program.
B. Percent = # of children aged 3 through 5 with IEPs attending a separate special
education class, separate school or residential facility.
Starting Point: Data Collection
For children with IEPs ages 3-5, districts report Educational Environment data to the
Funding and Child Tracking System (FACTS). Districts must report these data throughout
the school year as outlined in the Special Education Dues Dates on the Funding &
Disbursements website (http://www.isbe.net/funding/html/specialed.htm). The final
FACTS transmission is due June 30th of each year.
For a more information on how to report these data to FACTS, please review the FACTS
Instructions available at http://www.isbe.net/funding/pdf/34-30_sped_facts.pdf.
Several resources are available at http://www.isbe.net/earlychi/html/ec_speced_lre.htm to assist school districts and special education cooperatives in reporting Early Childhood (EC) Educational Environment Codes. These resources include:
A revised document describing the new reporting requirements.
A worksheet for determining the correct EC Educational Environment Codes.
A PowerPoint presentation.
A document describing scenarios.
A training video for the new EC Educational Environment Codes.
20
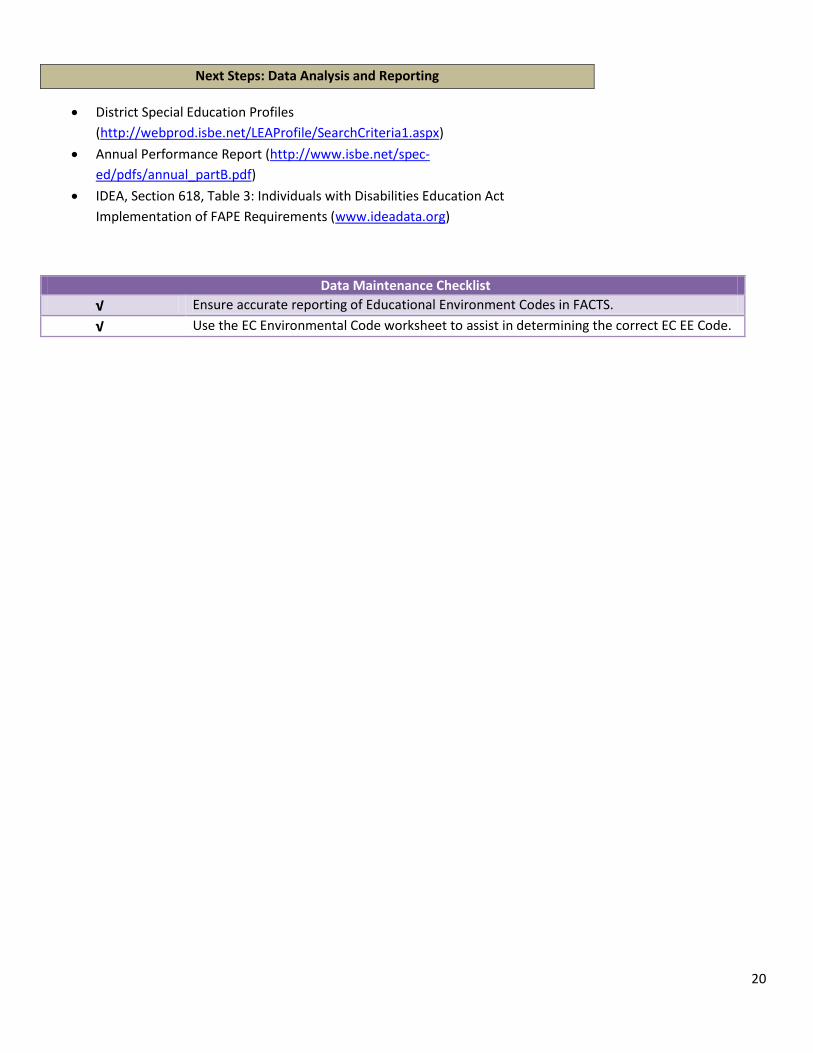
Next Steps: Data Analysis and Reporting
District Special Education Profiles
(http://webprod.isbe.net/LEAProfile/SearchCriteria1.aspx)
Annual Performance Report (http://www.isbe.net/spec-
ed/pdfs/annual_partB.pdf)
IDEA, Section 618, Table 3: Individuals with Disabilities Education Act
Implementation of FAPE Requirements (www.ideadata.org)
Data Maintenance Checklist
√ Ensure accurate reporting of Educational Environment Codes in FACTS.
√ Use the EC Environmental Code worksheet to assist in determining the correct EC EE Code.
21
Indicator 7: Early Childhood Outcomes
Indicator 7 Definition: Percent of preschool children aged 3 through 5 with IEPs who
demonstrate improved:
A. Positive-social emotional skills (including relationships);
B. Acquisition and use of knowledge and skills (including early
language/communication and early literacy)
C. Use of appropriate behaviors to meet their needs
Indicator 7 Measurement: For each of the above mentioned outcomes the following
percentages need to be calculated:
A. Percent of preschool children who did not improve functioning.
B. Percent of preschool children who improved functioning but not sufficient to
move nearer to functioning comparable to same-aged peers
C. Percent of preschool children who improved functioning to a level nearer same-
aged peers but did not reach it.
D. Percent of preschool children who improved functioning to reach a level
comparable to same-aged peers.
E. Percent of preschool children who maintained functioning at a level comparable
to same-aged peers.
Starting Point: Data Collection
Step 1: Collecting Entry and Exit Rating for Children (Ages 3-5) with IEPs
Several resources regarding obtaining Early Childhood (EC) Outcomes for children with
IEPs ages 3-5 are available at
http://www.isbe.net/earlychi/html/ec_speced_outcomes.htm, including frequently asked
questions, training on obtaining outcome ratings, and recommended forms. There are
several steps districts should take to collect Early Childhood Outcomes ratings for
students:
The district team of two or more members should base the entry and exit ratings
of the student on existing child data, including evaluations and information
provided by the parents of the child, current classroom-based assessments and
observations, and observations by teachers and related service providers to
determine the outcome ratings in each of the three areas.
To obtain accurate EC outcome ratings for a student, districts may choose from a
variety of assessment tools identified by ISBE as researched-based and technically
adequate. For more information on these assessments, please review the SPP
Indicator 7 section found at the following link: http://www.isbe.net/spec-
ed/pdfs/state_performance.pdf.
Road Side Assistance Tip!
Students receiving only
speech services still need to
be assessed in all three
outcomes areas. Screening
information, Ages and Stages
Questionnaire (ASQ)
checklists, parent and/or
therapist information may be
used as evidence in
determining a rating.
22
When having the discussions on ratings, district teams should utilize the Decision
Tree for Summary Rating Discussions found at the following link:
http://www.isbe.net/sis/pdf/early_childhood_decision_tree.pdf.
Entry outcome ratings should be compiled as soon as possible after the child has
enrolled in early childhood special education, but in no case later than 45 days
after the child enters the program (when school is in session).
Exit outcome ratings should be compiled at the time the student exits early
childhood special education and makes a natural transition to the next program,
when the child turns 6, or if the child is deemed no longer to have an IEP.
Districts are required to use the Illinois Childhood Outcomes Summary Form
(COSF) which aligns the ratings process and utilizes the 7 point rating scale for
each required outcome area.
Step 2: Reporting Entry and Exit Rating to SIS
The Early Childhood Outcomes (ECO) collection has been incorporated into SIS. Data for the previous school year must be reported to SIS no later than July 31st of each year. For more information on the SIS data elements to be used when reporting this data to SIS, please visit the following link: http://www.isbe.net/sis/html/data_elements.htm. A March 2009 webinar described the Early Childhood Outcomes collection and reporting process in Illinois. The archived webinar recording and materials are available at: http://www.isbe.net/sis/html/archived_meetings.htm#ind7.
Next Steps: Data Analysis
Once ECO data has been reported to SIS, ISBE analyzes each district’s data to determine
where their students’ outcomes growth falls into the Indicator 7 measurements for each
category:
A. Positive-social emotional skills (including relationships);
B. Acquisition and use of knowledge and skills (including early
language/communication and early literacy);
C. Use of appropriate behaviors to meet their needs.
ISBE uses the analysis methods prescribed by the national Early Childhood Outcomes
Center. More information about this can be found at the following links:
http://www.fpg.unc.edu/~eco/pages/outcomes.cfm#CalculatingProgress
http://www.fpg.unc.edu/~eco/pages/summary.cfm
Destination: Reporting
District Special Education Profiles
(http://webprod.isbe.net/LEAProfile/SearchCriteria1.aspx)
Annual Performance Report (http://www.isbe.net/spec-
ed/pdfs/annual_partB.pdf)
23
Data Maintenance Checklist
√ Ensure that outcomes ratings are obtained at student’s entry and exit from the early childhood program.
√ Ensure that the district is using assessments ISBE has identified as being research-based and technically adequate.
√ Use the Illinois Childhood Outcomes Summary Form (COSF) which aligns the ratings process and utilizes the 7 point rating scale for each required outcome area.
Frequently Asked Questions: Q: Should students who come in for only speech services be reported to SIS? A: Early childhood students who are enrolled in a public school district and are receiving itinerant speech services under an Individualized Education Program (IEP) should be reported in SIS by the child’s Home School. Q: Do programs need to assess children in all three outcome areas even when it is not an area of concern (e.g. children receiving only speech services)? A: Yes. Screening information, Ages and Stages Questionnaire (ASQ) checklists, parent and/or therapists’ information may be used as evidence in determining ratings.
Q: When must Exit Ratings be reported to SIS for children ages 3-5 with IEPs?
AA:: Exit outcome ratings should be entered under the following circumstances:
When the child goes to kindergarten;
If the child remains in early childhood for his/her kindergarten year, then when the child turns 6; or
If the child is staffed out of special education and no longer has an Individualized Education Program (IEP).
Q: When looking at my District Special Education Profile, I know that my district does serve 3-5 year olds, why does the profile state N/A for these categories? A: Cell sizes of fewer than 10 students are suppressed to protect student identity. Q: The district accidently reported a student with an IEP as grade Pre-K, when the student was really in Kindergarten. Now the system is asking for entry and exit ratings. What do we do in this instance? A: This student’s EC Outcome ratings should be marked as an erroneous. For more information on this, please review the data elements for the Student Information System Early Childhood Outcomes found at: http://www.isbe.net/sis/pdf/early_childhood_sped_outcomes.pdf. Q: A student with an IEP who was previously enrolled in Pre-K in another district is now enrolling in Kindergarten in our district. After several attempts to obtain the EC Outcome ratings, we have been unsuccessful in obtaining these records from the previous district. How should we report this student’s exit ratings? A: After ensuring that every attempt has been made to obtain this student’s EC exit ratings, you may need to mark this student’s exit ratings as erroneous.
24
Indicator 8: Parent Survey
Indicator 8 Definition: Percent of parents with a child receiving special education services
who report that schools facilitated parent involvement as a means of improving services
and results for children with disabilities.
Indicator 8 Measurement: Percent of respondent parents who reported schools
facilitated parent involvement as a means of improving services and results for children
with disabilities. This measurement is calculated based on results of a 25 question Parent
Involvement Survey developed by the National Center for Special Education
Accountability Monitoring (NCSEAM).
Starting Point: Data Collection
ISBE sends the Parent Involvement Survey to a representative sample of parents of
children with disabilities annually. ISBE developed a six-year cycle to ensure that every
LEA is included in this data collection over the span of the SPP. Although districts do not
administer the survey themselves, the Superintendent and State Approved Director of
Special Education for the districts being surveyed will be notified prior to the survey being
sent to district families. For more information, please review Indicator 8 in the SPP found
at the following link: http://www.isbe.net/spec-ed/pdfs/state_performance.pdf.
Since the survey is sent to families by ISBE’s contractor based on the addresses provided
in FACTS, it is imperative that districts keep this student contact information up to date.
Through the iePoint software, districts have the ability import addresses for students from
another district database to assist in keeping addresses updated. For instructions and
more information on this utility, please visit the Harrisburg Project website at the
following link: http://www.hbug.k12.il.us/resources/RL_Stu.htm.
Next Steps: Data Analysis
Once ISBE has received the results from the Parent Involvement Survey, ISBE then
analyzes the responses and determines the representativeness of the sample
respondents. ISBE also calculates each survey respondent’s average level of agreement
across all 25 survey items on the Illinois Parent Involvement Survey.
Destination: Reporting
District Special Education Profiles
(http://webprod.isbe.net/LEAProfile/SearchCriteria1.aspx)
Annual Performance Report (http://www.isbe.net/spec-ed/pdfs/annual_partB.pdf)
Data Maintenance Checklist
√ Ensure student addresses are kept up-to-date in FACTS/iePoint.
25
Indicators 9 and 10: Disproportionality
Indicators 9 and 10 Definition:
Indicator 9: Percent of districts with disproportionate representation of racial and
ethnic groups in special education and related services that is the result of
inappropriate identification.
Indicator 10: Percent of districts identified with disproportionate representation
of racial and ethnic groups in specific disability categories that are the result of
inappropriate identification.
Indicators 9 and 10 Measurements:
Indicator 9: Percent = # of districts with disproportionate representation of racial and
ethnic groups in special education and related services that is the result of inappropriate
identification divided by the # of districts in the State.
Indicator 10: Percent = # of districts with disproportionate representation of racial and
ethnic groups in specific disability categories that is the result of inappropriate
identification divided by the # of districts in the State.
Starting Point: Data Collection
Student level data reported in FACTS and SIS is used by ISBE to meet Indicators 9 & 10
reporting and analysis requirements. Student information from FACTS is based on the
annual December 1st child count. Student information from SIS is based on the annual fall
enrollment counts. For more information on these systems, please visit the following links:
Student Information System: (http://www.isbe.net/sis/default.htm)
Funding and Child Tracking System: (http://www.isbe.net/funding/pdf/34-
30_sped_facts.pdf)
Next Steps: Data Analysis
ISBE employs a two-step process to determine the existence of disproportionality based on
race and ethnicity in special education that is the result of inappropriate identification:
First, ISBE calculates a weighted or alternate risk ratio for every school district in the
state with regard to overall special education eligibility. These risk ratios are
calculated for each racial/ethnic group enrolled in the district. The criteria for
overrepresentation and underrepresentation are as follows:
o Overrepresentation is a calculated risk ratio (weighted or alternate) of 3.0
or higher for three consecutive years for a particular racial/ethnic group in
which there are at least ten students in the special education population.
o Underrepresentation is a calculated risk ratio (weighted or alternate) of
0.25 or lower for three consecutive years for a particular racial/ethnic
Road Side Assistance Tip!
Because disproportionality
calculations are based on
district reported data, it is
imperative that districts
maintain accurate records of
students in both FACTS and
SIS.
26
group in which there are at least ten students in the special education
population.
Second, in order to verify whether the disproportionality is the result of
inappropriate identification in those districts with risk ratios of 3.0 or higher or
0.25 or lower, ISBE requires the identified districts to conduct self-assessment
activities, including data verification and a review of policies, practices, and
procedures, and then submit the results of those activities to ISBE.
For more information on the risk ratios and the methods used to calculate the risk ratios for
the districts please review the following links:
Overview of Illinois’ Process for Determining and Addressing Disproportionality in
Special Education identification and Significant Disproportionality in Identification,
Placement and Discipline: (http://www.isbe.net/spec-
ed/pdfs/disproportionality_process.pdf)
Methods for Assessing Racial/Ethnic Disproportionality in Special Education: A
Technical Assistance Guide (specifically pages 22-24):
(https://www.ideadata.org/docs/RevisedDisproportionalityTAguide_FINAL.pdf)
Destinations: Reporting
District Special Education Profiles
(http://webprod.isbe.net/LEAProfile/SearchCriteria1.aspx)
Annual Performance Report (http://www.isbe.net/spec-
ed/pdfs/annual_partB.pdf)
Data Maintenance Checklist
√ Accurately report the race/ethnicity for each student. For more information on how to collect and report racial/ethnic codes, please review the resources at http://www.isbe.net/research/Default.htm
√ Verify that race/ethnicity data reported in SIS matches data that is reported in FACTS for students with disabilities.
Frequently Asked Questions: Q: Are risk ratios used to calculate disproportionality based on the primary or secondary disability of a student? A: The primary disability of each student is used to calculate the risk ratios.
QQ:: What are the comparison groups used when calculating disproportionality?
AA:: Comparison groups are comprised of students of all other races/ethnicities enrolled in the district, regardless of whether or not they receive special education services. For example, if you were looking at Hispanic students receiving special education services overall or in a particular disability category within your district, the comparison group would be all other races/ethnicities (American Indian or Alaska Native, Asian, Black or African American, Native Hawaiian or Other Pacific Islander, White and Two or More Races).
27
Indicator 11: Child Find Timelines
Indicator 11 Definition: Percent of children who are evaluated within 60 days of receiving
parental consent for initial evaluation or, if the State establishes a timeframe within which
the evaluation must be conducted within that timeframe. The 60 school day timeline is
used in Illinois, as prescribed in 105 ILCS 5/14-8.02.
Indicator 11 Measurement:
A. # of children for whom parental consent to evaluate was received.
B. # of children whose evaluations were completed within 60 days (or State
established timeline). The 60 school day timeline is used in Illinois, as prescribed in
105 ILCS 5/14-8.02.
Percent = (b) divided by (a).
Starting Point: Data Collection
Districts report data on Indicator 11 timelines to the Funding and Child Tracking System
(FACTS). Districts must report these data throughout the school year as outlined in the
Special Education Dues Dates on the Funding & Disbursements website
(http://www.isbe.net/funding/html/specialed.htm). The final FACTS transmission is due
June 30th of each year.
For a more information on reporting Indicator 11 timelines, please review the FACTS
Instructions available at http://www.isbe.net/funding/pdf/34-30_sped_facts.pdf.
Districts must also submit district calendars to ISBE through IWAS. These calendars are used
to calculate the 60 school day timeline. More information on this is available at:
http://www.isbe.net/funding/html/school_calendar.htm.
Districts are also encouraged to utilize the Indicator 11 Resource Guide, available at the
following link: http://www.isbe.net/spec-ed/pdfs/indicator_11_res_guide.pdf.
Next Steps: Data Analysis
After the final June 30 FACTS transmission, ISBE examines the data to determine the
percentage of students who were evaluated within the 60 school day timeline for each
district. If a district reports that there was a delay in the initial evaluation, ISBE also
determines if a reason for delay has been properly reported.
Destination: Reporting
District Special Education Profiles
(http://webprod.isbe.net/LEAProfile/SearchCriteria1.aspx)
Annual Performance Report (http://www.isbe.net/spec-
ed/pdfs/annual_partB.pdf)
Road Side Assistance Tip!
Only initial eligibility
determination timelines
should be reported to FACTS.
28
Data Maintenance Checklist
√ Ensure that the date for parental consent and the date for initial eligibility determination are reported accurately.
√ Ensure that the district is not reporting re-evaluation timelines.
√ Timelines for students found ineligible for Special Education Services should still be reported in FACTS, under Fund Code N or U (as appropriate).
√ If there is a reason for delay in the initial eligibility of a student, ensure the district is reporting the proper reason for delay code.
29
Indicator 12: Early Childhood Transition (Part C to Part B)
Indicator 12 Definition: Percent of children referred by Part C prior to age 3, who were
found eligible for Part B, and who have an IEP developed and implemented by the 3rd
birthdays.
Indicator 12 Measurement:
a. # of children who have been served in Part C and referred to Part B for eligibility
determination.
b. # of those referred determined to be NOT eligible and who eligibility was
determined prior to their third birthdays.
c. # of those found eligible who have an IEP developed and implemented by their third
birthdays.
d. # of children for whom parental consent caused delays in evaluation or initial
services.
e. # of children who were referred to Part C less than 90 days before their third
birthdays.
Percent = (c) divided by (a-b-d-e).
Starting Point: Data Collection
There are several steps involved in the early childhood transition data sharing and reporting
process involving the Department of Human Services (DHS), Child and Family Connections
(CFC) offices, ISBE, school districts, and special education cooperatives:
ISBE receives a list from DHS regarding children between the ages of 27 and 36
months who potentially will transition from Part C to Part B.
o This list includes information from DHS regarding the district to which the
child will potentially transition.
o Every other month, ISBE distributes the Early Intervention to Early
Childhood Special Education Transition Report (commonly known as the “27
Month List”) based on the district identified by DHS for each child.
o This report is sent to the Early Childhood Special Education Transition
Coordinator identified for each district/special education cooperative.
o Districts should review this report and first contact the CFC regarding the
status of children for whom a referral has not been received.
At least 90 days prior to a child’s third birthday, the CFC office, with the family’s
consent, is required to hold a transition meeting and invite the intended school
district of the student. During this period the Early Intervention to Early Childhood
Transition Tracking Form is developed and shared with the district. The district is
required to participate in this process.
Prior to the child’s third birthday, the district needs to hold an IEP meeting with the
family to determine the child’s eligibility, discuss what services will be needed,
develop the IEP, and determine when the IEP will be implemented for the student.
Road Side Assistance Tip!
ISBE sends the Early
Intervention to Early
Childhood Special Education
Transition Report to one
individual per district. In
many instances, this
individual is at the district’s
special education
cooperative. Changes to the
recipient of the report
should be sent to ISBE.
30
Districts should complete the Tracking Form for this student and send it back to the
CFC. The CFC will then forward this information on the DHS. Districts do not need to
send a copy of this Tracking Form to ISBE, unless otherwise requested.
For students who enroll in the school district, data regarding the student’s transition
from Early Intervention to Early Childhood must be reported to SIS no later than July
31st of each school year. For more information on the reporting of Early Intervention
to Early Childhood transition data in SIS, please visit the following link:
http://www.isbe.net/sis/pdf/early_childhood.pdf.
Students who are found ineligible and do not enroll in the school district cannot be
reported to SIS, since they are not enrolled in the district. Data regarding the
transition status of these children will be determined from final DHS data for that
particular fiscal year.
Districts are also encouraged to utilize the Early Childhood Special Education Transition
webpage (http://www.isbe.net/earlychi/html/ec_speced_intervention.htm) when going
through the transition process. This webpage provides helpful tools and resources to guide
districts through the transition steps from Early Intervention through Early Childhood.
Next Steps: Data Analysis
At the end of each fiscal year, ISBE receives final data from DHS regarding the status of each
child’s transition. Using final SIS and DHS data from the previous fiscal year, ISBE examines
the data to determine the percentage of students that fall into each of the measurement
categories for Indicator 12. If a district reports that there was a delay in the eligibility
determination and/or the development of the IEP, ISBE verifies that a proper reason for
delay has been reported.
There are instances when there are discrepancies between the final data received from
DHS and those reported in SIS. For these instances, ISBE also utilizes a follow-up process
with districts in which ISBE notifies the LEAs of these discrepancies. In particular, ISBE
follows up with LEAs where, based on final DHS data, there appears to be a delay in
transition which does not agree with data report to SIS. During this follow-up process,
districts are able to clarify any discrepancies within the specified timeframe. ISBE then
uses these updated district reported data for final Indicator 12 analysis and reporting.
Destination: Reporting
District Special Education Profiles
(http://webprod.isbe.net/LEAProfile/SearchCriteria1.aspx)
Annual Performance Report (http://www.isbe.net/spec-
ed/pdfs/annual_partB.pdf)
31
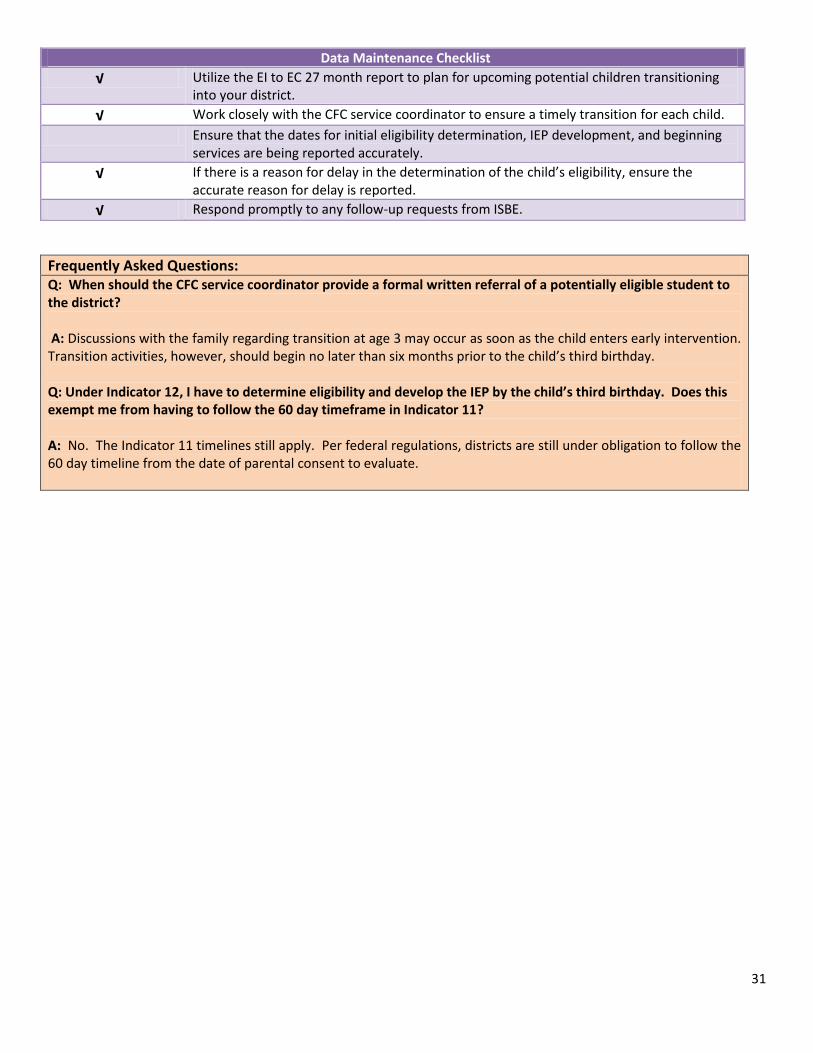
Data Maintenance Checklist
√ Utilize the EI to EC 27 month report to plan for upcoming potential children transitioning into your district.
√ Work closely with the CFC service coordinator to ensure a timely transition for each child.
Ensure that the dates for initial eligibility determination, IEP development, and beginning services are being reported accurately.
√ If there is a reason for delay in the determination of the child’s eligibility, ensure the accurate reason for delay is reported.
√ Respond promptly to any follow-up requests from ISBE.
Frequently Asked Questions: Q: When should the CFC service coordinator provide a formal written referral of a potentially eligible student to the district? A: Discussions with the family regarding transition at age 3 may occur as soon as the child enters early intervention. Transition activities, however, should begin no later than six months prior to the child’s third birthday.
Q: Under Indicator 12, I have to determine eligibility and develop the IEP by the child’s third birthday. Does this exempt me from having to follow the 60 day timeframe in Indicator 11?
AA:: No. The Indicator 11 timelines still apply. Per federal regulations, districts are still under obligation to follow the 60 day timeline from the date of parental consent to evaluate.
32
Indicator 13: Secondary Transition
Indicator 13 Definition: Percent of youth with IEPs aged 16 and above with an IEP that
includes appropriate measureable postsecondary goals that are annually updated and based
upon an age appropriate transition assessment, transition services, including courses of
study, that will reasonably enable the student to meet those post secondary goals, and
annual IEP goals related to the student’s transition services needs. There also must be
evidence that the student was invited to the IEP Team meeting where transition services are
to be discussed and evidence that, if appropriate, a representative of any participating
agency was invited to the IEP Team meeting with the prior consent of the parent or student
who has reached the age of majority.
Indicator 13 Measurement: Percent= (# of youth with IEPs aged 16 and above with an IEP
that includes appropriate measureable postsecondary goals that are annually updated and
based upon an age appropriate transition assessment, transition services, including courses
of study, that will reasonably enable the student to meet those postsecondary goals, and
annual IEP goals related to the student’s transition services needs. There also must be
evidence that the student was invited to the IEP Team meeting where transition services are
to be discussed and evidence that, if appropriate, a representative of any participating
agency was invited to the IEP Team meeting with the prior consent of the parent or student
who has reached the age of majority) divided by (the # of youth with an IEP age 16 and
above).
Starting Point: Data Collection
Districts report data on Indicator 13 to the Funding and Child Tracking System (FACTS).
Districts must report these data throughout the school year as outlined in the Special
Education Due Dates on the Funding & Disbursements website
(http://www.isbe.net/funding/html/specialed.htm). The final FACTS transmission is due
June 30th of each year.
For a more information on reporting Indicator 13, please review the FACTS Instructions
available at http://www.isbe.net/funding/pdf/34-30_sped_facts.pdf.
Districts should also review the Indicator 13 Transition webpage (http://www.isbe.net/spec-
ed/html/indicator13.htm) for useful tools and resources regarding implementing Secondary
Transition plans for students.
Next Steps: Data Analysis
After the final June 30 FACTS transmission, ISBE calculates Indicators 13 based on the
December 1st child count for students with IEPs ages 16-21.
ISBE also incorporates a data verification process for district reported Indicator 13 data.
Districts are randomly selected in this process and are required to submit a pre-
33
determined number of IEPs for review by ISBE. After subsequent review, ISBE will notify
districts of the results of their examination.
Destination: Reporting
District Special Education Profiles
(http://webprod.isbe.net/LEAProfile/SearchCriteria1.aspx)
Annual Performance Report (http://www.isbe.net/spec-
ed/pdfs/annual_partB.pdf)
Data Maintenance Checklist
√ Use the Illinois State Performance Plan Indicator 13 Checklist to Meet SPP/APR Requirements.
√ Ensure that all questions are answered in the iePoint application regarding the student’s transition plan.
√ Ensure the checklist answers accurately reflect the content of the student’s transition plan.
√ Ensure this data is reported for the students aged 14 ½ and older.
Frequently Asked Questions: Q: Which students are included in my district’s Indicator 13 calculation? A. For Indicator 13, the calculation includes all students with IEPs in the district ages 16 and older (as of the December 1st child count). Data from the final June 30th FACTS transmission is used for this calculation.
34
Indicator 14: Secondary Transition/Post School Outcomes
Indicator 14 Definition: Percent of youth who are no longer in secondary school, had IEPs in
effect at the time they left school, and were:
A. Enrolled in higher education within one year of leaving high school.
B. Enrolled in higher education or competitively employed within one year of leaving
high school.
C. Enrolled in higher education or in some other postsecondary education or training
program; or competitively employed or in some other employment within one year
of leaving high school.
Indicator 14 Measurement:
A. Percent enrolled in higher education = (# of youth who are no longer in secondary
school, had IEPs in effect at the time they left school and were enrolled in higher
education within one year of leaving high school) divided by the (# of respondent
youth who are no longer in secondary school and had IEPs in effect at the time they
left school)
B. Percent enrolled in higher education or competitively employed within in one year
of leaving high school = (# of youth who are no longer in secondary school, had IEPs
in effect at the time they left school and were enrolled in higher education or
competitively employed within one year of leaving high school) divided by (# of
respondent youth who are no longer in secondary school and had IEPs in effect at
the time they left school).
C. Percent enrolled in higher education, or in some other postsecondary education or
training program; or competitively employed or in some other employment = (# of
youth who are no longer in secondary school, had IEPs in effect at the time they left
school and were enrolled in higher education, or some other postsecondary
education or training program; or competitively employed or in some other
employment) divided by the (# of respondent youth who are no longer in secondary
school and had IEPs in effect at the time they left school)
Starting Point: Data Collection
Definition of a “school leaver”: Any student with a disability, who drops out, ages out, or
graduates.
ISBE developed a cycle in which each district is required to report Indicator 14 survey data.
Each district was categorized by type and size and was assigned a school year in which to
complete the surveys for their high school leavers. Districts required to complete the survey
for that year are notified in the spring. The notification includes instructions on how to
obtain the list of students they are to survey from the Harrisburg Project website as well as
information regarding the web application used to report the survey results. Districts also
receive copies of the Illinois Post School Survey Interview Questions and Interviewer
Script, which gives detailed instructions on how to conduct the survey and what questions
35
need to be asked. A sample form letter has also been developed for districts to use to notify
their school leavers that the district would like to set up a time with them to conduct the
survey. For these and other tools and resources on Indicator 14 data collection, please visit
the following website: http://www.isbe.net/spec-ed/html/indicator14.htm.
Districts are encouraged to review the Indicator 14 reporting tutorial which is located at:
https://www.hbug.k12.il.us/SPPDC/.
Districts are required to make and report three attempts to collect the data for each of the
school leavers (unless the survey is completed or the family refuses to be surveyed). These
attempts could include, but are not limited to: direct mail, telephone, or in- person contacts.
Next Steps: Data Analysis
Once ISBE has received the district reported data for Indicator 14, ISBE applies the Indicator
14 calculations to determine the percentage of students in each of the 3 categories.
Destination: Reporting
District Special Education Profiles
(http://webprod.isbe.net/LEAProfile/SearchCriteria1.aspx)
Annual Performance Report (http://www.isbe.net/spec-
ed/pdfs/annual_partB.pdf)
Data Maintenance Checklist
√ Ensure that when conducting the survey you have asked the respondent all of the applicable questions outlined in the survey script.
√ When reporting the data in the web application, ensure that you have accurately reported every response.
√ Ensure that your district reports at least 3 attempts to contact students (unless they complete or refuse to complete the survey earlier).
Frequently Asked Questions: Q: Do I need to contact all the students that I have on my list of school leavers? A. Yes. Districts are required to make at least 3 attempts to contact every student on their listing (unless they complete or refuse to complete the survey). Q: If a student has indicated that they do not wish to complete the survey, but the district is aware of some of the answers to the questions for that student, can the district enter this information on the student’s behalf? A: No. If the student has indicated that he/she does not wish to be a part of the survey, then the district should select the code for “Refused to complete survey” as the first contact attempt. The survey questions should remain unanswered in this instance.
Road Side Assistance Tip!
For districts with 35 or
fewer school leavers, all
school leavers are required
to be contacted for the
survey. For districts with
more than 35 school
leavers, a random sample of
school leavers will be
selected by ISBE.
36
Indicators 15-20: General Supervision
Indicator 15 Definition: General supervision system (including monitoring, complaints,
hearings, etc.) identifies and corrects noncompliance as soon as possible but in no case later
than one year from identification.
Indicator 16 Definition: Percent of signed written complaints with reports issued that were
resolved within 60-day timeline extended for exceptional circumstances with respect to a
particular complaint, or because the parent (or individual or organization) and the public
agency agree to extend the time to engage in mediation or other alternative means of
dispute resolution, if available in the State.
Indicator 17 Definition: Percent of adjudicated due process hearing requests that were
adjudicated within the 45-day timeline or a timeline that is properly extended by the
hearing officer at the request of either party or in the case of an expedited hearing, within
the required timelines.
Indicator 18 Definition: Percent of hearing requests that went to resolution sessions that
were resolved through resolution sessions settlement agreements.
Indicator 19 Definition: Percent of mediations held that resulted in mediation agreements.
Indicator 20 Definition: State reported data (618 and State Performance Plan and Annual
Performance Report) are timely and accurate.
Starting Point: Data Collection
Data for these indicators are based on statewide data which is collected and maintained by
ISBE. Districts are not required to report specifically on these Indicators.
Destination: Reporting
Annual Performance Report (http://www.isbe.net/spec-
ed/pdfs/annual_partB.pdf)
37
FACTS December 1 Child Count Data
Throughout the school year, districts have several opportunities to report Child Count Data for students with disabilities
into FACTS. The final FACTS transmission is June 30th annually. Per 34CFR 300.641, States are required to establish a
state-specific Child Count Data collection date between October 1st and December 1st. Once the State has established
such a date the date must continue to be used as the Child Count Data collection date every year.
Per Section 2-3.30 of the Illinois School Code, Illinois uses December 1st as the Child Count date. Since ISBE uses the
December 1st Child Count Data for the following federal reporting purposes, the accuracy of these data is paramount:
Indicator 4: Discipline Data
Indicator 5: Educational Environments for Students 6-21
Indicator 6: Educational Environments for Students 3-5
Indicator 8: Parent Involvement Survey
Indicators 9 and 10: Disproportionality
Indicator 13: Post Secondary Transition
Indicator 20: Timely, Accurate Data Reporting
38
SIS Exit Codes for Students with IEPs Receiving Services Through Age 21
The IDEA 2004 regulations at 34 CFR 300.101(a) and state special education rules at 23 IAC 226.50 require school districts to provide a free appropriate public education (FAPE) in accordance with 34 CFR 300.101 through 300.103 to eligible students through the age of 21, inclusive (i.e., the day before the student’s 22nd birthday). The following scenarios are provided to help guide districts in reporting SIS Exit Codes for students whose IEP provides for special education and/or related services through the age of 21.
For a student who meets graduation requirements within 4 years of high school, but the issuance of a diploma
is deferred to provide special education, transition planning, transition services or related services prescribed by
the student’s IEP as described in 23 IAC 226.50(c)(3)(a):
While the student is still in school, use Exit Code 05: “Promotion” or Exit Code 12: “Retained in Same
Grade,” as appropriate.
When the student has completed his/her transition planning, transition services, special education
and/or related services and a regular high school diploma has been issued to the student, use Exit Code
06: “Graduated with a regular diploma”. (At this time the provision of FAPE is no longer required and
the student should not be subsequently reported to SIS.)
For a student who meets graduation requirements after the 4th year of high school:
While the student is still in school, use Exit Code 05: “Promotion” or Exit Code 12: “Retained in Same
Grade,” as appropriate.
When the student has completed his/her transition planning, transition services, special education
and/or related services and a regular high school diploma has been issued to the student, use Exit Code
06: “Graduated with a regular diploma”. (At this time the provision of FAPE is no longer required and
the student should not be subsequently reported to SIS.)
For a student who does not meet graduation requirements and continues to be eligible for special education,
transition planning, transition services or related services and the student ultimately receives a certificate of completion:
While the student is still in school, use Exit Code 05: “Promotion” or Exit Code 12: “Retained in Same
Grade,” as appropriate.
When the student has completed recommended special education, transition planning, transition
services and/or related services and receives a certificate of completion, use exit code 15: “Certificate of
Completion.”
In this circumstance, the district should not use the Exit Code 14: “Aged Out” (even if the
student has reached the age of 22 when the certificate of completion is received), as the “Aged
Out” code would be counted in the numerator of the dropout rate calculation. (See Indicator 2;
page 8).
39
For a student who does not meet graduation requirements and the student reaches the maximum age for
services (i.e., the day before the student’s 22nd birthday) and does not receive a certificate of completion:
While the student is still in school, use Exit Code 05: “Promotion” or Exit Code 12: “Retained in Same
Grade,” as appropriate.
When the student has reached the maximum age for services, use the Exit Code 14: “Aged Out”.
40
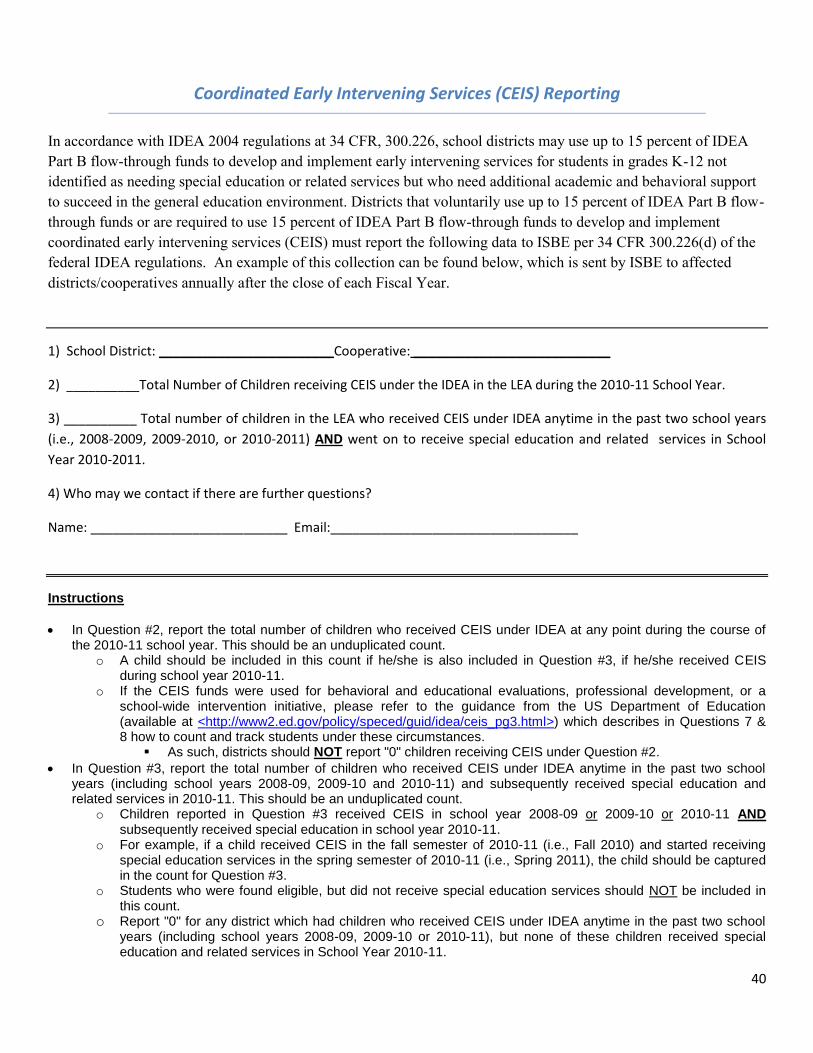
Coordinated Early Intervening Services (CEIS) Reporting
In accordance with IDEA 2004 regulations at 34 CFR, 300.226, school districts may use up to 15 percent of IDEA Part B flow-through funds to develop and implement early intervening services for students in grades K-12 not identified as needing special education or related services but who need additional academic and behavioral support to succeed in the general education environment. Districts that voluntarily use up to 15 percent of IDEA Part B flow-through funds or are required to use 15 percent of IDEA Part B flow-through funds to develop and implement coordinated early intervening services (CEIS) must report the following data to ISBE per 34 CFR 300.226(d) of the federal IDEA regulations. An example of this collection can be found below, which is sent by ISBE to affected districts/cooperatives annually after the close of each Fiscal Year.
1) School District: ________________________Cooperative: ___________________________
2) __________Total Number of Children receiving CEIS under the IDEA in the LEA during the 2010-11 School Year.
3) __________ Total number of children in the LEA who received CEIS under IDEA anytime in the past two school years
(i.e., 2008-2009, 2009-2010, or 2010-2011) AND went on to receive special education and related services in School
Year 2010-2011.
4) Who may we contact if there are further questions?
Name: ___________________________ Email:__________________________________
Instructions
In Question #2, report the total number of children who received CEIS under IDEA at any point during the course of the 2010-11 school year. This should be an unduplicated count.
o A child should be included in this count if he/she is also included in Question #3, if he/she received CEIS during school year 2010-11.
o If the CEIS funds were used for behavioral and educational evaluations, professional development, or a school-wide intervention initiative, please refer to the guidance from the US Department of Education (available at <http://www2.ed.gov/policy/speced/guid/idea/ceis_pg3.html>) which describes in Questions 7 & 8 how to count and track students under these circumstances.
As such, districts should NOT report "0" children receiving CEIS under Question #2.
In Question #3, report the total number of children who received CEIS under IDEA anytime in the past two school years (including school years 2008-09, 2009-10 and 2010-11) and subsequently received special education and related services in 2010-11. This should be an unduplicated count.
o Children reported in Question #3 received CEIS in school year 2008-09 or 2009-10 or 2010-11 AND subsequently received special education in school year 2010-11.
o For example, if a child received CEIS in the fall semester of 2010-11 (i.e., Fall 2010) and started receiving special education services in the spring semester of 2010-11 (i.e., Spring 2011), the child should be captured in the count for Question #3.
o Students who were found eligible, but did not receive special education services should NOT be included in this count.
o Report "0" for any district which had children who received CEIS under IDEA anytime in the past two school years (including school years 2008-09, 2009-10 or 2010-11), but none of these children received special education and related services in School Year 2010-11.
41
Resource Links
ISBE Special Education webpage
http://www.isbe.net/spec-ed/Default.htm
Illinois State Performance Plan
http://www.isbe.net/spec-ed/pdfs/state_performance.pdf
Illinois Annual Performance Report
http://www.isbe.net/spec-ed/pdfs/annual_partB.pdf
District Special Education Profiles
http://webprod1.isbe.net/LEAProfile/SearchCriteria1.aspx
Funding and Child Tracking System Instructions
http://www.isbe.net/funding/pdf/34-30_sped_facts.pdf
Illinois State Board of Education Early Childhood webpage
http://www.isbe.net/spec-ed/html/lea_determinations.htm
Student Information System
http://www.isbe.net/sis/default.htm