Embed Size (px)
Citation preview
Published by the Stationery Office, Dublin, Ireland.
To be purchased from the:
Central Statistics Office, Information Section, Skehard Road, Cork.
Government Publications Sales Office, Sun Alliance House,Molesworth Street, Dublin 2,
or through any bookseller.
Prn A8/0790 Price €15.00 June 2008

© Government of Ireland 2008
Material compiled and presented by theCentral Statistics Office.
Reproduction is authorised, except for commercialpurposes, provided the source is acknowledged.
ISBN 1-4064-2055-5
3
Table of Contents
Page
Introduction 5 1. Non-Irish nationals living in Ireland
Country of origin 8Geographic distribution 11Housing characteristics 13Demographic characteristics 15Living Arrangements 17Education 18Economic characteristics 19
2. Profiles of nationalities
Profile 1 - UK nationals 24Profile 2 - Polish nationals 28Profile 3 - Lithuanian nationals 32Profile 4 - Nigerian nationals 36Profile 5 - Latvian nationals 40Profile 6 - US nationals 44Profile 7 - Chinese nationals 48Profile 8 - German nationals 52Profile 9 - Filipino nationals 56Profile 10 - French nationals 60
Snapshot profiles of other important nationalities 65 Appendices
1 Glossary 69
2 2006 Census questionnaire 72
3 Supporting tables 85
4 Acknowledgements 94

Introduction
5
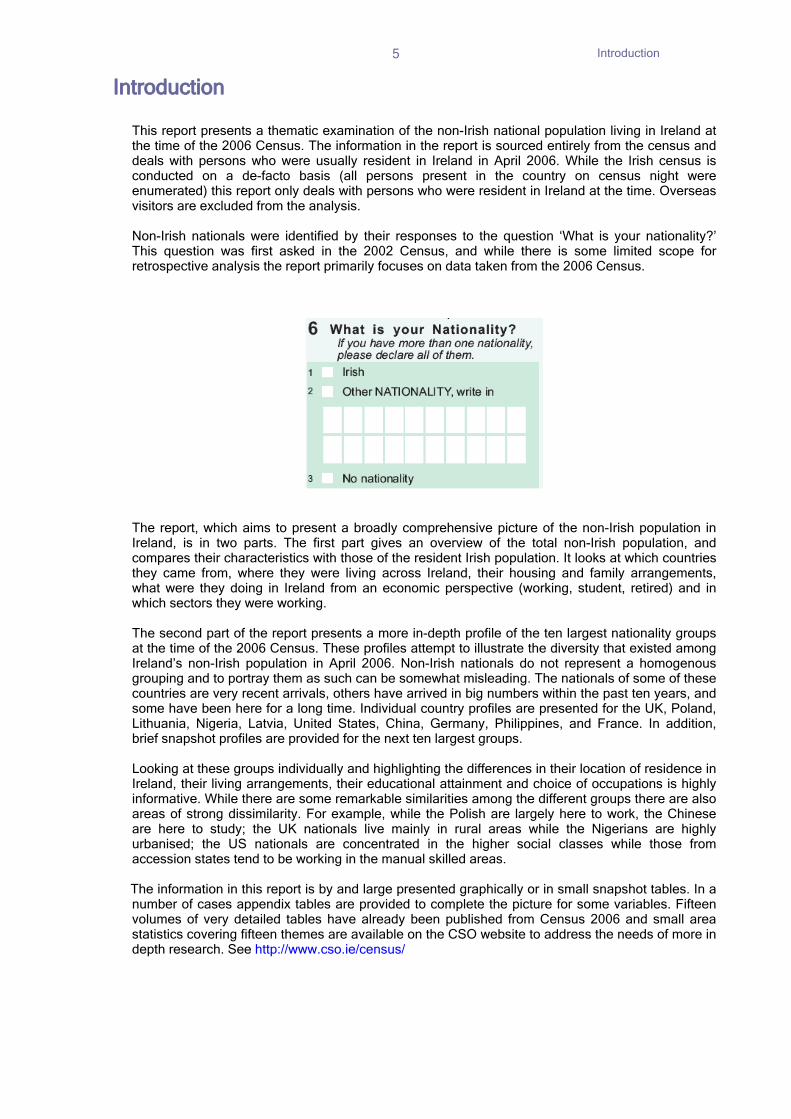
Introduction This report presents a thematic examination of the non-Irish national population living in Ireland at the time of the 2006 Census. The information in the report is sourced entirely from the census and deals with persons who were usually resident in Ireland in April 2006. While the Irish census is conducted on a de-facto basis (all persons present in the country on census night were enumerated) this report only deals with persons who were resident in Ireland at the time. Overseas visitors are excluded from the analysis. Non-Irish nationals were identified by their responses to the question ‘What is your nationality?’ This question was first asked in the 2002 Census, and while there is some limited scope for retrospective analysis the report primarily focuses on data taken from the 2006 Census.
The report, which aims to present a broadly comprehensive picture of the non-Irish population in Ireland, is in two parts. The first part gives an overview of the total non-Irish population, and compares their characteristics with those of the resident Irish population. It looks at which countries they came from, where they were living across Ireland, their housing and family arrangements, what were they doing in Ireland from an economic perspective (working, student, retired) and in which sectors they were working. The second part of the report presents a more in-depth profile of the ten largest nationality groups at the time of the 2006 Census. These profiles attempt to illustrate the diversity that existed among Ireland’s non-Irish population in April 2006. Non-Irish nationals do not represent a homogenous grouping and to portray them as such can be somewhat misleading. The nationals of some of these countries are very recent arrivals, others have arrived in big numbers within the past ten years, and some have been here for a long time. Individual country profiles are presented for the UK, Poland, Lithuania, Nigeria, Latvia, United States, China, Germany, Philippines, and France. In addition, brief snapshot profiles are provided for the next ten largest groups. Looking at these groups individually and highlighting the differences in their location of residence in Ireland, their living arrangements, their educational attainment and choice of occupations is highly informative. While there are some remarkable similarities among the different groups there are also areas of strong dissimilarity. For example, while the Polish are largely here to work, the Chinese are here to study; the UK nationals live mainly in rural areas while the Nigerians are highly urbanised; the US nationals are concentrated in the higher social classes while those from accession states tend to be working in the manual skilled areas. The information in this report is by and large presented graphically or in small snapshot tables. In a number of cases appendix tables are provided to complete the picture for some variables. Fifteen volumes of very detailed tables have already been published from Census 2006 and small area statistics covering fifteen themes are available on the CSO website to address the needs of more in depth research. See http://www.cso.ie/census/

Further information For further information contact:
Census Enquiries Section Central Statistics Office Swords Business Campus Balheary Road Swords Co. Dublin Phone (01) 8951460 Ext. 1461/63/66 LoCall 1890 236 787
Fax (01) 895 1399 E-mail [email protected]
Web www.cso.ie
1. Non-Irish Nationals living in Ireland
Non-Irish Nationals Living in Ireland
8
Country of Origin
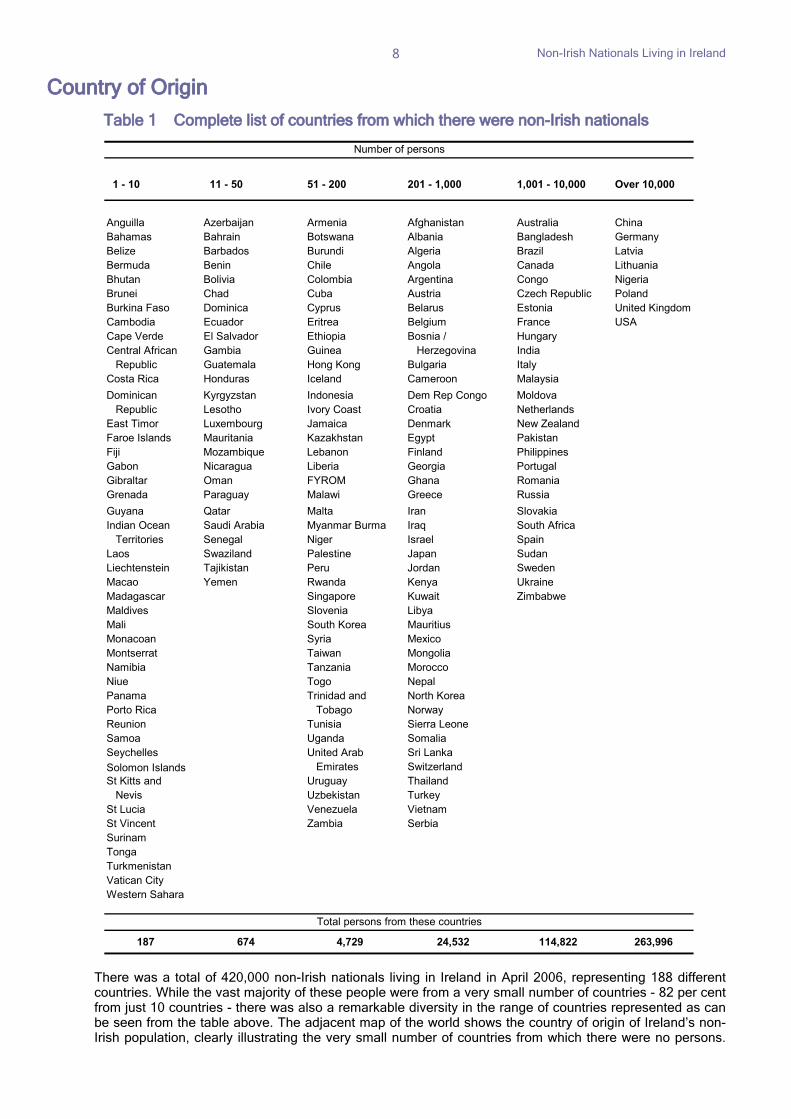
Table 1 Complete list of countries from which there were non-Irish nationals
1 - 10 11 - 50 51 - 200 201 - 1,000 1,001 - 10,000 Over 10,000
Anguilla Azerbaijan Armenia Afghanistan Australia ChinaBahamas Bahrain Botswana Albania Bangladesh GermanyBelize Barbados Burundi Algeria Brazil LatviaBermuda Benin Chile Angola Canada LithuaniaBhutan Bolivia Colombia Argentina Congo NigeriaBrunei Chad Cuba Austria Czech Republic PolandBurkina Faso Dominica Cyprus Belarus Estonia United KingdomCambodia Ecuador Eritrea Belgium France USACape Verde El Salvador Ethiopia Bosnia / HungaryCentral African Gambia Guinea Herzegovina India Republic Guatemala Hong Kong Bulgaria ItalyCosta Rica Honduras Iceland Cameroon MalaysiaDominican Kyrgyzstan Indonesia Dem Rep Congo Moldova Republic Lesotho Ivory Coast Croatia NetherlandsEast Timor Luxembourg Jamaica Denmark New ZealandFaroe Islands Mauritania Kazakhstan Egypt PakistanFiji Mozambique Lebanon Finland PhilippinesGabon Nicaragua Liberia Georgia PortugalGibraltar Oman FYROM Ghana RomaniaGrenada Paraguay Malawi Greece RussiaGuyana Qatar Malta Iran SlovakiaIndian Ocean Saudi Arabia Myanmar Burma Iraq South Africa Territories Senegal Niger Israel SpainLaos Swaziland Palestine Japan SudanLiechtenstein Tajikistan Peru Jordan SwedenMacao Yemen Rwanda Kenya UkraineMadagascar Singapore Kuwait ZimbabweMaldives Slovenia LibyaMali South Korea MauritiusMonacoan Syria MexicoMontserrat Taiwan MongoliaNamibia Tanzania MoroccoNiue Togo NepalPanama Trinidad and North KoreaPorto Rica Tobago NorwayReunion Tunisia Sierra LeoneSamoa Uganda SomaliaSeychelles United Arab Sri LankaSolomon Islands Emirates SwitzerlandSt Kitts and Uruguay Thailand Nevis Uzbekistan TurkeySt Lucia Venezuela VietnamSt Vincent Zambia SerbiaSurinamTongaTurkmenistanVatican CityWestern Sahara
187 674 4,729 24,532 114,822 263,996
Number of persons
Total persons from these countries
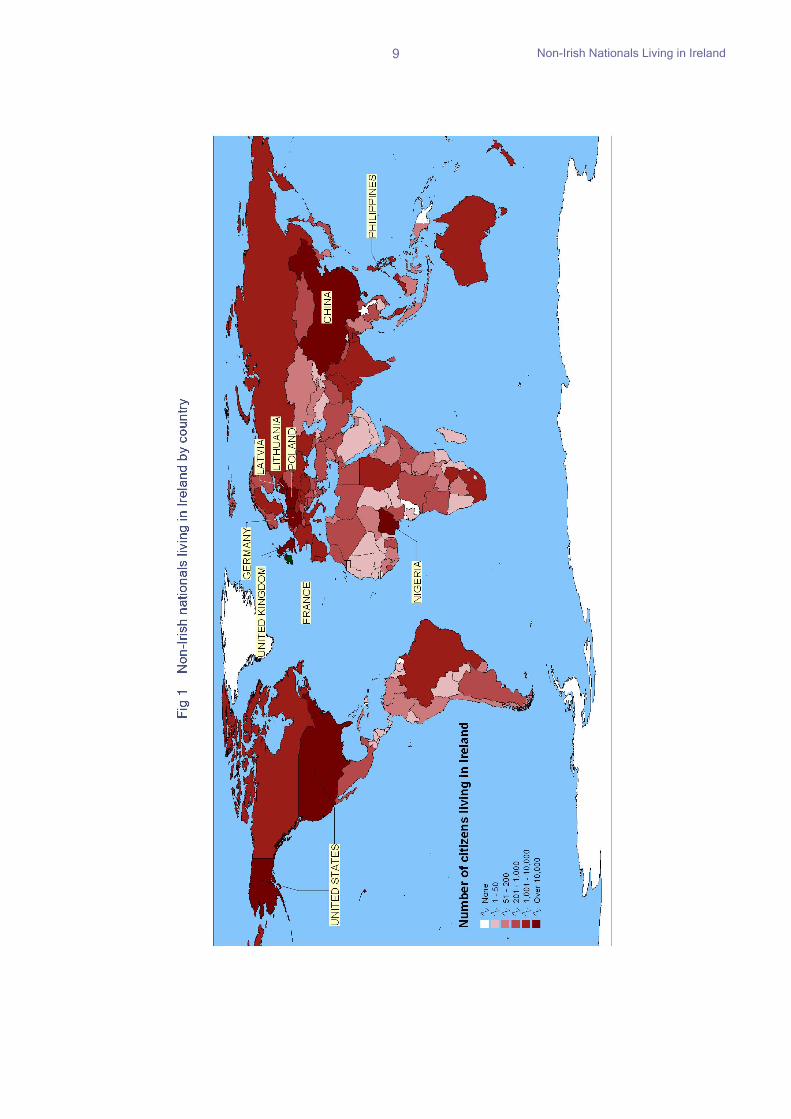
There was a total of 420,000 non-Irish nationals living in Ireland in April 2006, representing 188 different countries. While the vast majority of these people were from a very small number of countries - 82 per cent from just 10 countries - there was also a remarkable diversity in the range of countries represented as can be seen from the table above. The adjacent map of the world shows the country of origin of Ireland’s non-Irish population, clearly illustrating the very small number of countries from which there were no persons.
Non-Irish Nationals Living in Ireland
9
Non-Irish Nationals Living in Ireland
10
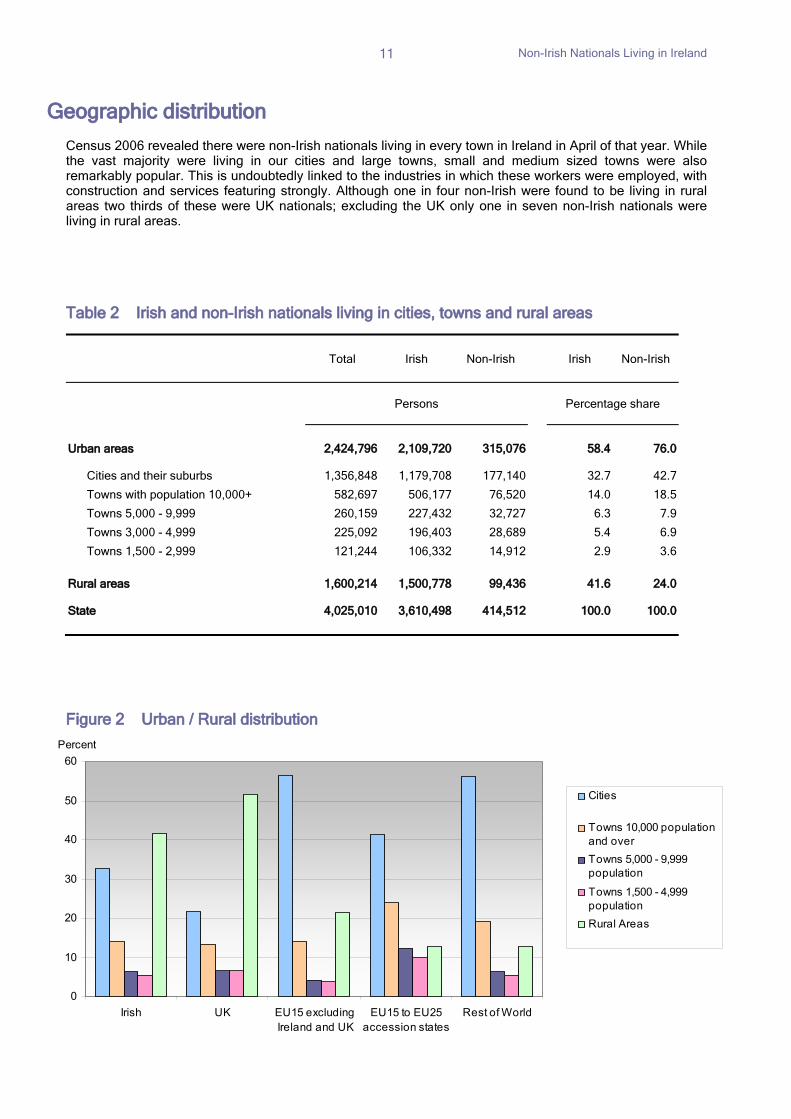
Different nationality groups in Ireland The following sections look at the various characteristics of the non-Irish population compared with the Irish. As well as differentiating between Irish/non-Irish, the non-Irish are further sub-divided into four groups – United Kingdom, EU 15 (excl. UK and Ireland), EU15 to EU25 Accession States (i.e. the 10 states which joined the EU in May 2004) and Rest of World. United Kingdom – the largest non-Irish group. There were over 112,000 UK nationals living in Ireland. They have been resident here for longer than the other groups, with large numbers having been here since the 1970s and 1980s, and the majority taking up residence here in the 1990s. The characteristics of UK nationals tend to be similar to those of the Irish population. EU 15 (excluding Ireland and UK) – people from the 15 states comprising the EU before May 2004. A majority of these arrived during the period 2001–2006, but a substantial number had been here since the 1990s. The EU 15 (excluding Ireland and UK) group comprises Austria, Belgium, Denmark, Finland, France, Germany, Greece, Italy, Luxembourg, Netherlands, Portugal, Spain and Sweden EU15 to EU25 Accession States – this group saw the largest growth between 2002 and 2006, reflecting the accession of these states to the EU in 2004. Over 44 per cent of the citizens of these countries arrived in Ireland in 2005 or later. The states in this group are Cyprus, Czech Republic, Estonia, Hungary, Latvia, Lithuania, Malta, Poland, Slovakia and Slovenia Rest of World – The remaining nationalities comprise a varied group, but mainly composed of the USA, African and Asian nationalities.
Non-Irish Nationals Living in Ireland
11
0
10
20
30
40
50
60
Irish UK EU15 excludingIreland and UK
EU15 to EU25accession states
Rest of World
Percent
Cities
Towns 10,000 populationand overTowns 5,000 - 9,999population
Towns 1,500 - 4,999populationRural Areas
Geographic distribution
Census 2006 revealed there were non-Irish nationals living in every town in Ireland in April of that year. While the vast majority were living in our cities and large towns, small and medium sized towns were also remarkably popular. This is undoubtedly linked to the industries in which these workers were employed, with construction and services featuring strongly. Although one in four non-Irish were found to be living in rural areas two thirds of these were UK nationals; excluding the UK only one in seven non-Irish nationals were living in rural areas. Table 2 Irish and non-Irish nationals living in cities, towns and rural areas
Total Irish Non-Irish Irish Non-Irish
Persons Percentage share
Urban areas
2,424,796 2,109,720 315,076 58.4 76.0
Cities and their suburbs 1,356,848 1,179,708 177,140 32.7 42.7
Towns with population 10,000+ 582,697 506,177 76,520 14.0 18.5
Towns 5,000 - 9,999 260,159 227,432 32,727 6.3 7.9
Towns 3,000 - 4,999 225,092 196,403 28,689 5.4 6.9
Towns 1,500 - 2,999 121,244 106,332 14,912 2.9 3.6
Rural areas 1,600,214 1,500,778 99,436 41.6 24.0 State 4,025,010 3,610,498 414,512 100.0 100.0
Figure 2 Urban / Rural distribution
Non-Irish Nationals Living in Ireland
12
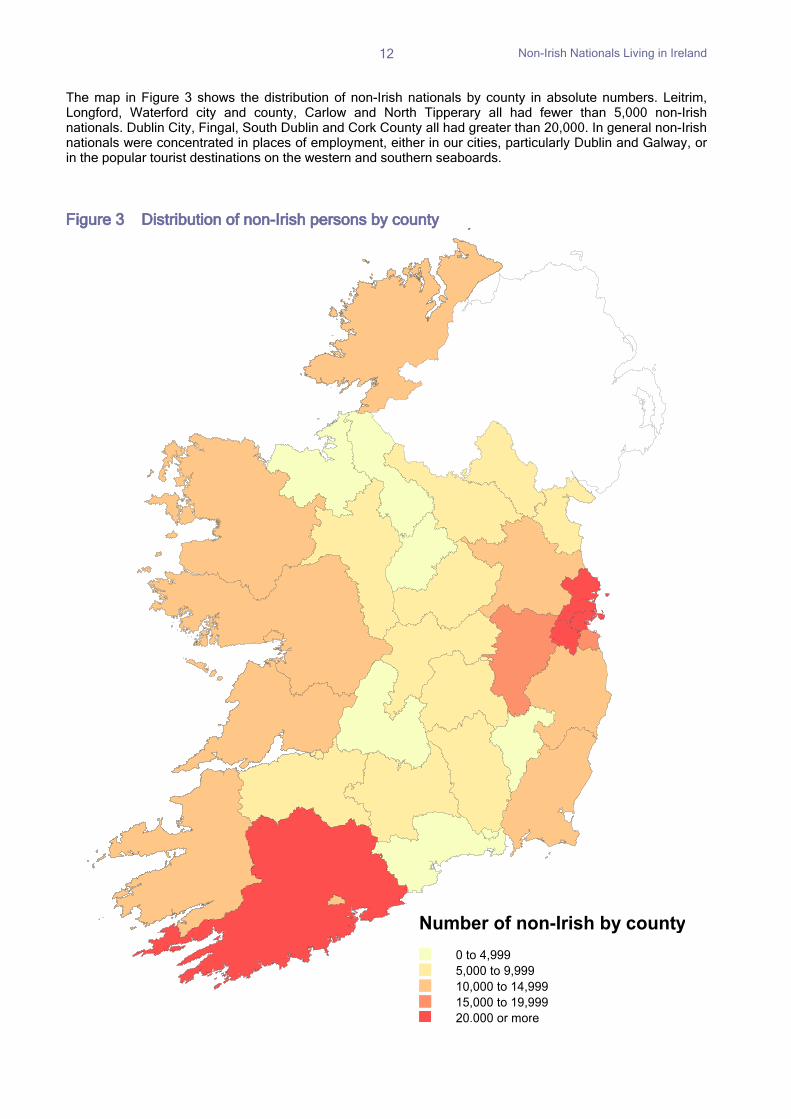
The map in Figure 3 shows the distribution of non-Irish nationals by county in absolute numbers. Leitrim, Longford, Waterford city and county, Carlow and North Tipperary all had fewer than 5,000 non-Irish nationals. Dublin City, Fingal, South Dublin and Cork County all had greater than 20,000. In general non-Irish nationals were concentrated in places of employment, either in our cities, particularly Dublin and Galway, or in the popular tourist destinations on the western and southern seaboards. Figure 3 Distribution of non-Irish persons by county
20,000 or more15,000 to 19,999
5,000 to 9,99910,000 to 14,999
0 to 4,999
Number of non-Irish by county
Non-Irish Nationals Living in Ireland
13
0
25
50
75
100
Percent
Irish UK EU15excluding
Ireland andUK
EU15 toEU25
accessionstates
Rest ofworld
Owner Occupied Rented from Local Authority Other rented
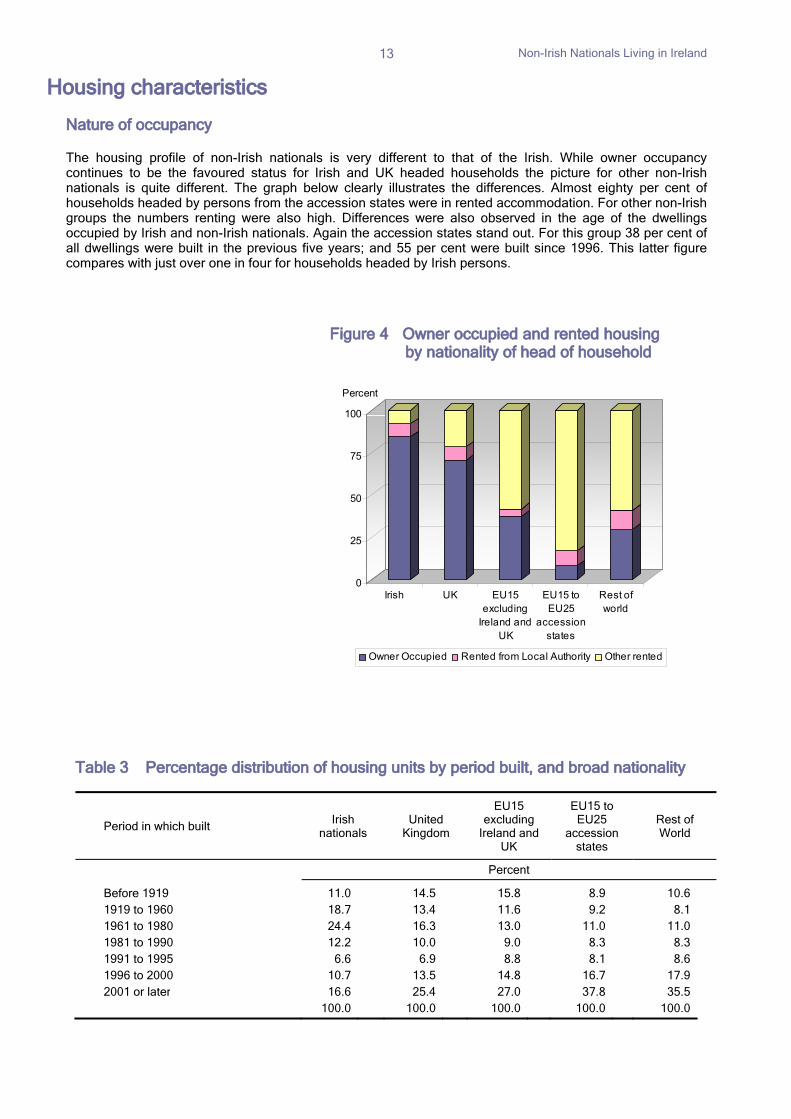
Housing characteristics Nature of occupancy The housing profile of non-Irish nationals is very different to that of the Irish. While owner occupancy continues to be the favoured status for Irish and UK headed households the picture for other non-Irish nationals is quite different. The graph below clearly illustrates the differences. Almost eighty per cent of households headed by persons from the accession states were in rented accommodation. For other non-Irish groups the numbers renting were also high. Differences were also observed in the age of the dwellings occupied by Irish and non-Irish nationals. Again the accession states stand out. For this group 38 per cent of all dwellings were built in the previous five years; and 55 per cent were built since 1996. This latter figure compares with just over one in four for households headed by Irish persons.
Figure 4 Owner occupied and rented housing
by nationality of head of household
Table 3 Percentage distribution of housing units by period built, and broad nationality
Period in which built Irish
nationals United
Kingdom
EU15 excluding
Ireland and UK
EU15 to EU25
accession states
Rest of World
Percent
Before 1919 11.0 14.5 15.8 8.9 10.61919 to 1960 18.7 13.4 11.6 9.2 8.11961 to 1980 24.4 16.3 13.0 11.0 11.01981 to 1990 12.2 10.0 9.0 8.3 8.31991 to 1995 6.6 6.9 8.8 8.1 8.61996 to 2000 10.7 13.5 14.8 16.7 17.92001 or later 16.6 25.4 27.0 37.8 35.5
100.0 100.0 100.0 100.0 100.0
Non-Irish Nationals Living in Ireland
14
0
10
20
30
40
50
60Percent
Irish UK EU15 excludingIreland and UK
EU15 to EU25accession
states
Rest of World
Detached house Semi-detached or terracedFlat or apartment Other
0102030405060708090
100
Percent
Irish UK EU 15excluding
Ireland andUK
EU15 toEU25
accessionstates
Rest ofWorld
No internet access Other internet connection Broadband connection
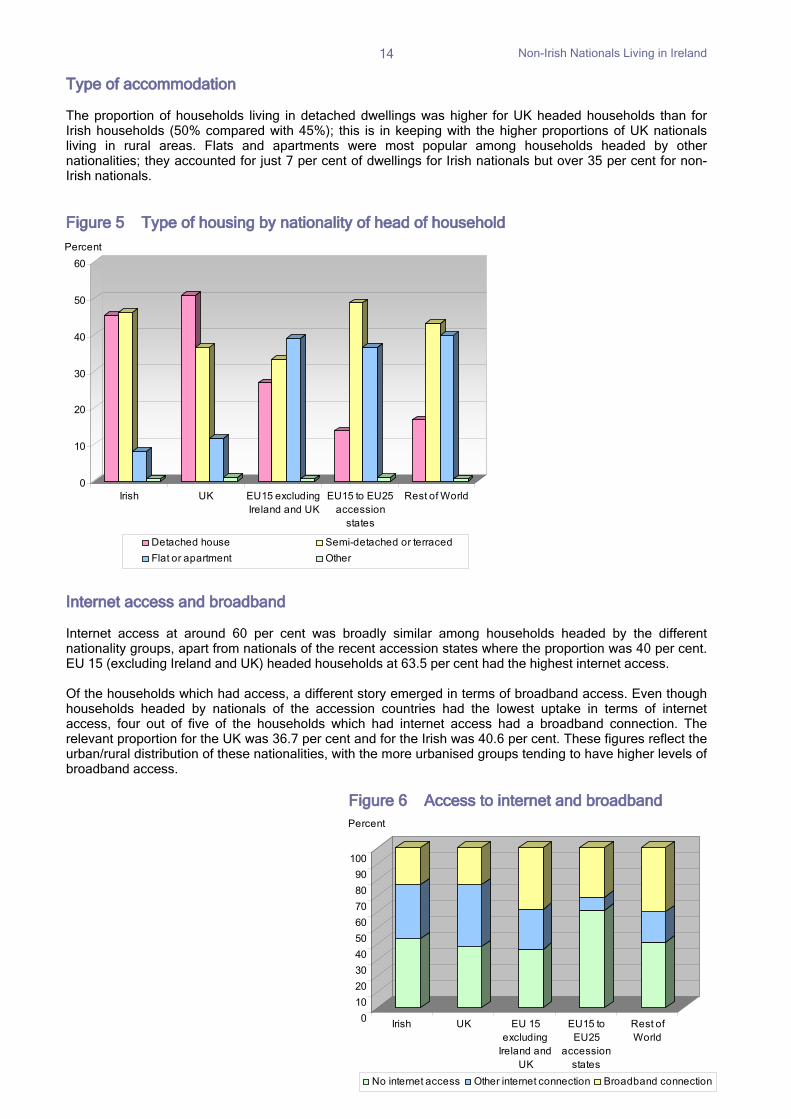
Type of accommodation The proportion of households living in detached dwellings was higher for UK headed households than for Irish households (50% compared with 45%); this is in keeping with the higher proportions of UK nationals living in rural areas. Flats and apartments were most popular among households headed by other nationalities; they accounted for just 7 per cent of dwellings for Irish nationals but over 35 per cent for non-Irish nationals. Figure 5 Type of housing by nationality of head of household
Internet access and broadband Internet access at around 60 per cent was broadly similar among households headed by the different nationality groups, apart from nationals of the recent accession states where the proportion was 40 per cent. EU 15 (excluding Ireland and UK) headed households at 63.5 per cent had the highest internet access. Of the households which had access, a different story emerged in terms of broadband access. Even though households headed by nationals of the accession countries had the lowest uptake in terms of internet access, four out of five of the households which had internet access had a broadband connection. The relevant proportion for the UK was 36.7 per cent and for the Irish was 40.6 per cent. These figures reflect the urban/rural distribution of these nationalities, with the more urbanised groups tending to have higher levels of broadband access.
Figure 6 Access to internet and broadband
Non-Irish Nationals Living in Ireland
15
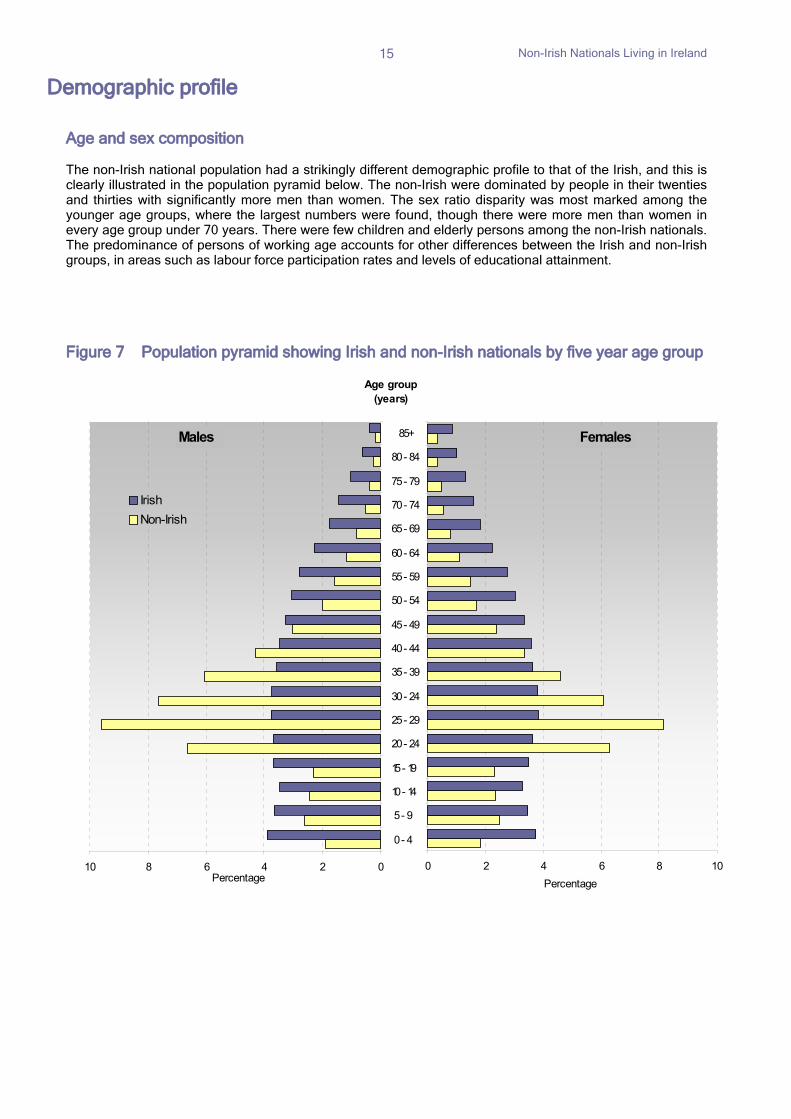
Demographic profile Age and sex composition The non-Irish national population had a strikingly different demographic profile to that of the Irish, and this is clearly illustrated in the population pyramid below. The non-Irish were dominated by people in their twenties and thirties with significantly more men than women. The sex ratio disparity was most marked among the younger age groups, where the largest numbers were found, though there were more men than women in every age group under 70 years. There were few children and elderly persons among the non-Irish nationals. The predominance of persons of working age accounts for other differences between the Irish and non-Irish groups, in areas such as labour force participation rates and levels of educational attainment. Figure 7 Population pyramid showing Irish and non-Irish nationals by five year age group
0 2 4 6 8 10
0 - 4
5 - 9
10 - 14
15 - 19
20 - 24
25 - 29
30 - 24
35 - 39
40 - 44
45 - 49
50 - 54
55 - 59
60 - 64
65 - 69
70 - 74
75 - 79
80 - 84
85+
Percentage
Females
10 8 6 4 2 0
0 - 4
5 - 9
10 - 14
15 - 19
20 - 24
25 - 29
30 - 24
35 - 39
40 - 44
45 - 49
50 - 54
55 - 59
60 - 64
65 - 69
70 - 74
75 - 79
80 - 84
85+
Age group (years)
Percentage
IrishNon-Irish
Males
Non-Irish Nationals Living in Ireland
16
0
10
20
30
40
50
Percent
Single (nevermarried)
Married (firstmarriage)
Remarried Separated(includingDeserted)
Divorced Widowed
IrishNon-Irish
0 25 50 75 100
Percent
Irish
UK
EU15 excludingIreland and UK
EU15 to EU25accession states
Rest of World
Living with partner/ spouse Not living with partner/ spouse
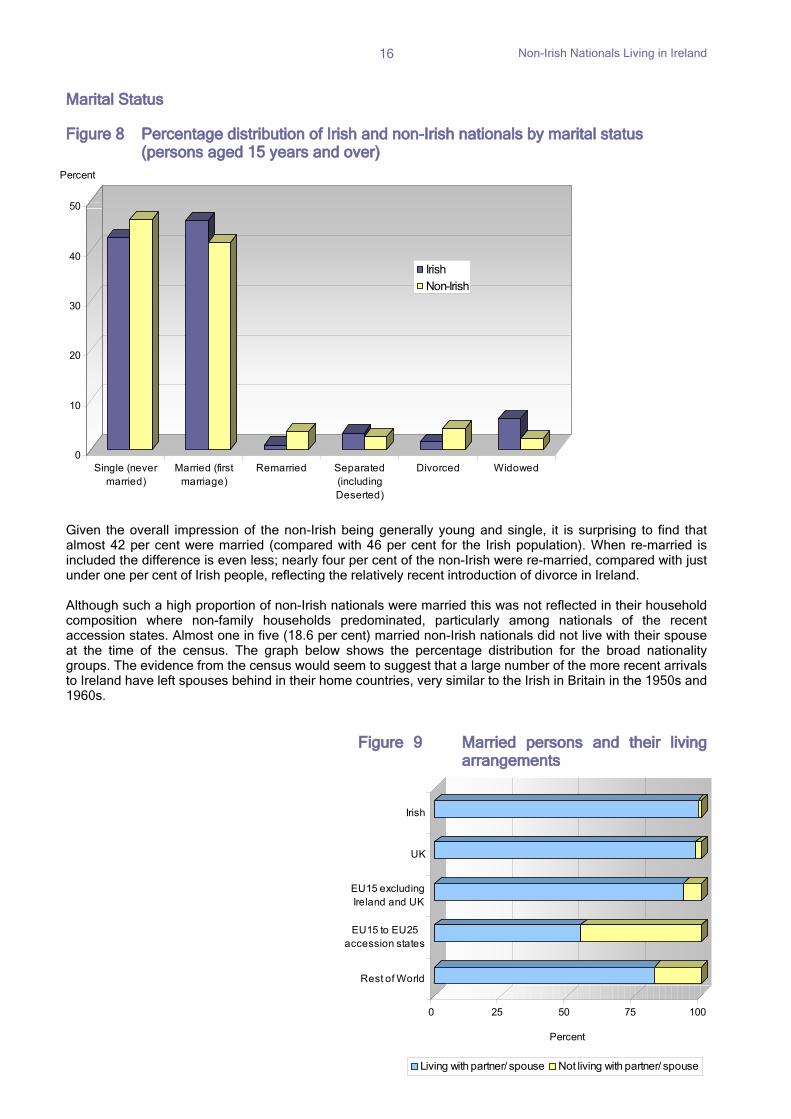
Marital Status Figure 8 Percentage distribution of Irish and non-Irish nationals by marital status
(persons aged 15 years and over)
Given the overall impression of the non-Irish being generally young and single, it is surprising to find that almost 42 per cent were married (compared with 46 per cent for the Irish population). When re-married is included the difference is even less; nearly four per cent of the non-Irish were re-married, compared with just under one per cent of Irish people, reflecting the relatively recent introduction of divorce in Ireland. Although such a high proportion of non-Irish nationals were married this was not reflected in their household composition where non-family households predominated, particularly among nationals of the recent accession states. Almost one in five (18.6 per cent) married non-Irish nationals did not live with their spouse at the time of the census. The graph below shows the percentage distribution for the broad nationality groups. The evidence from the census would seem to suggest that a large number of the more recent arrivals to Ireland have left spouses behind in their home countries, very similar to the Irish in Britain in the 1950s and 1960s.
Figure 9 Married persons and their living arrangements
Non-Irish Nationals Living in Ireland
17
0
25
50
75
100
Percent
Irish households Mixed households Non-Irish households
Husband and wife or couple with or without children
Lone parent
Non-family households
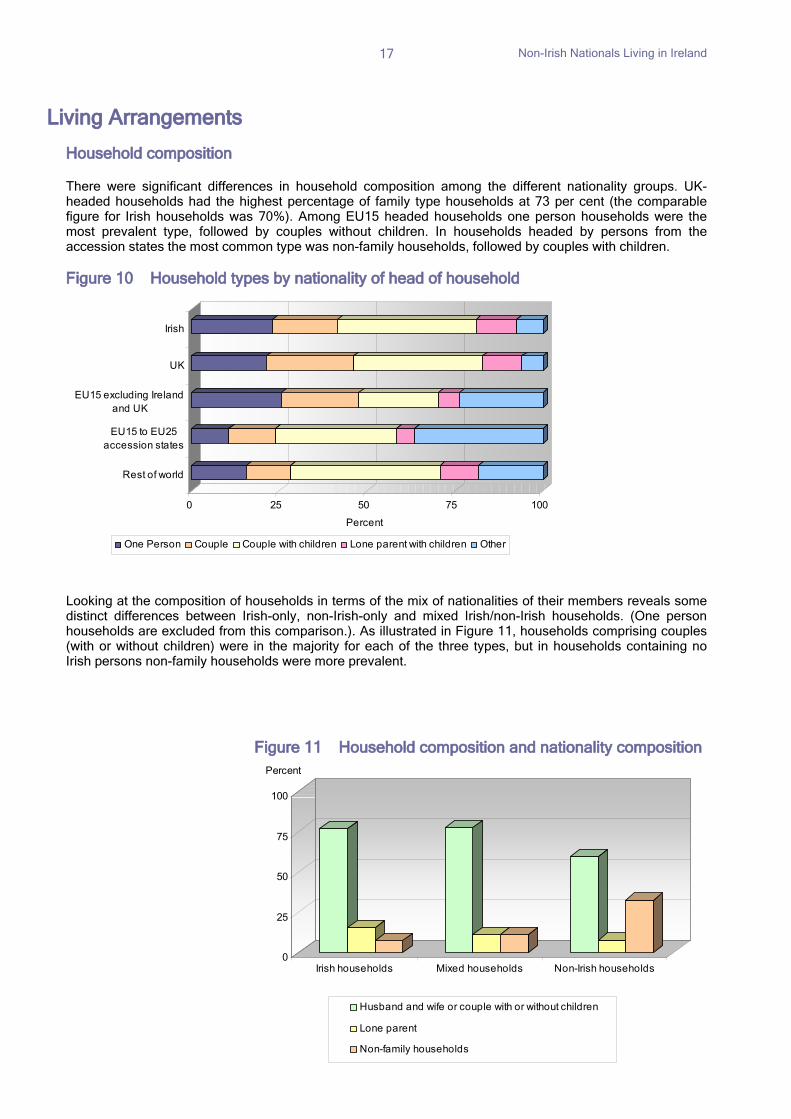
Living Arrangements Household composition There were significant differences in household composition among the different nationality groups. UK-headed households had the highest percentage of family type households at 73 per cent (the comparable figure for Irish households was 70%). Among EU15 headed households one person households were the most prevalent type, followed by couples without children. In households headed by persons from the accession states the most common type was non-family households, followed by couples with children. Figure 10 Household types by nationality of head of household
0 25 50 75 100
Percent
Irish
UK
EU15 excluding Irelandand UK
EU15 to EU25accession states
Rest of world
One Person Couple Couple with children Lone parent with children Other
Looking at the composition of households in terms of the mix of nationalities of their members reveals some distinct differences between Irish-only, non-Irish-only and mixed Irish/non-Irish households. (One person households are excluded from this comparison.). As illustrated in Figure 11, households comprising couples (with or without children) were in the majority for each of the three types, but in households containing no Irish persons non-family households were more prevalent.
Figure 11 Household composition and nationality composition
Non-Irish Nationals Living in Ireland
18
0
5
10
15
20
25
30Percent
Education Humanitiesand Arts
SocialSciences,
Business andLaw
Engineering,Manufacturing
andConstruction
Health Services Multiplesubjects
Other
Irish UK EU15 excluding Ireland and UK EU15 to EU25 accession states Rest of World
0 25 50 75 100
Percent
Irish
UK
EU 15 excludingIreland and UK
EU15 to EU25accession states
Rest of world
Primary Secondary Third level
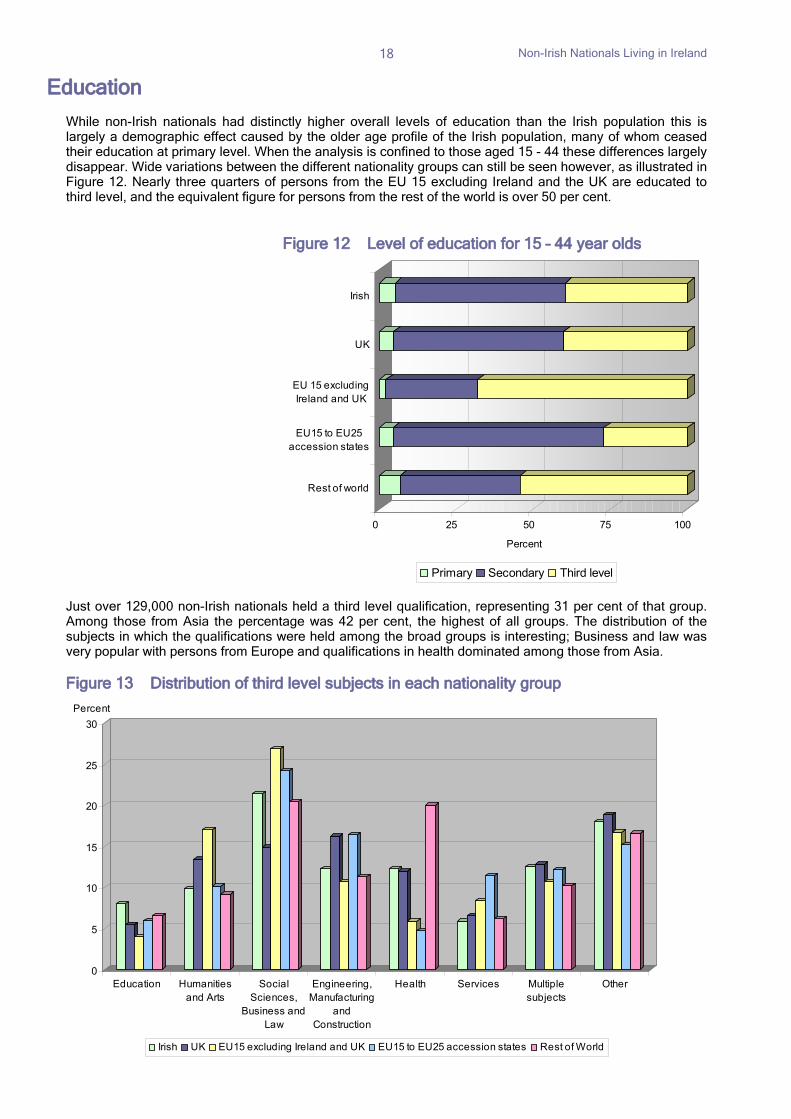
Education While non-Irish nationals had distinctly higher overall levels of education than the Irish population this is largely a demographic effect caused by the older age profile of the Irish population, many of whom ceased their education at primary level. When the analysis is confined to those aged 15 - 44 these differences largely disappear. Wide variations between the different nationality groups can still be seen however, as illustrated in Figure 12. Nearly three quarters of persons from the EU 15 excluding Ireland and the UK are educated to third level, and the equivalent figure for persons from the rest of the world is over 50 per cent.
Figure 12 Level of education for 15 – 44 year olds Just over 129,000 non-Irish nationals held a third level qualification, representing 31 per cent of that group. Among those from Asia the percentage was 42 per cent, the highest of all groups. The distribution of the subjects in which the qualifications were held among the broad groups is interesting; Business and law was very popular with persons from Europe and qualifications in health dominated among those from Asia. Figure 13 Distribution of third level subjects in each nationality group
Non-Irish Nationals Living in Ireland
19
0
25
50
75
100
Percent
Irish UK EU15 excludingIreland and UK
EU15 to EU25accession
states
Rest of World
At work
Looking for first regular job
Unemployed having lost or givenup previous jobStudent
Looking after home/family
Retired
Unable to work due to permanentsickness or disability
0
25
50
75
100
Percent
Irish UK EU15excluding
Ireland and UK
EU15 to EU25accession
states
Rest of world
Agriculture Industry Services
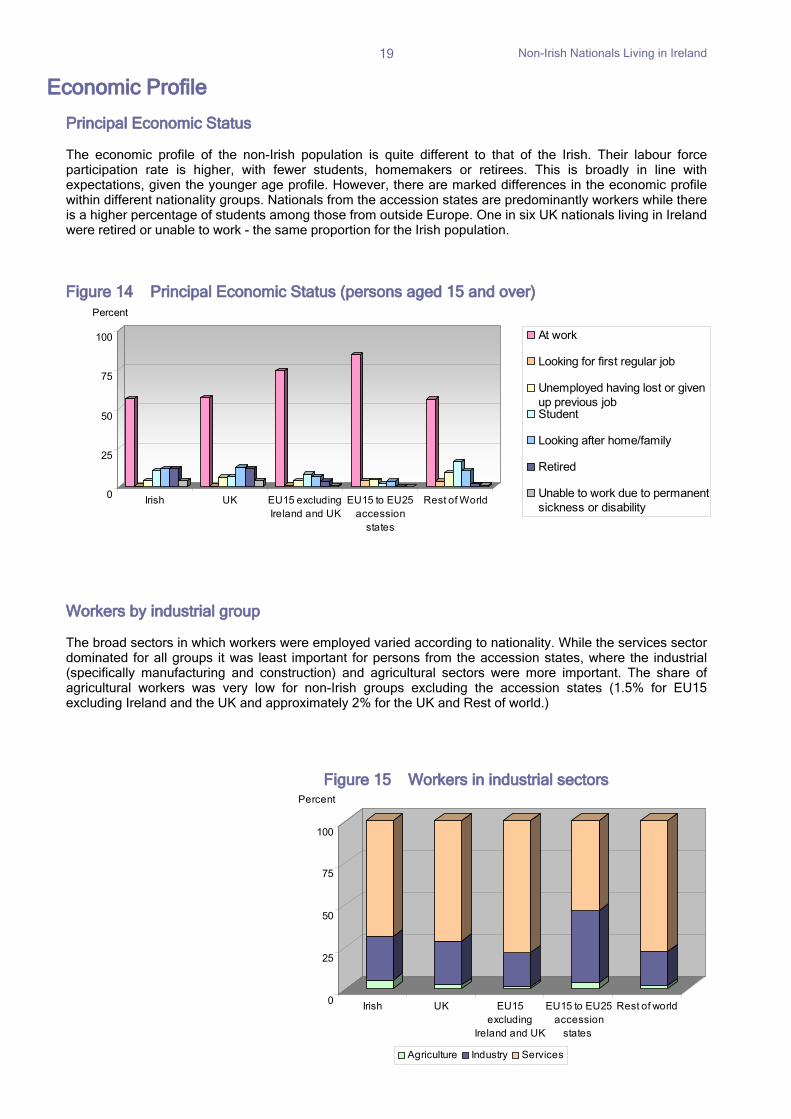
Economic Profile Principal Economic Status The economic profile of the non-Irish population is quite different to that of the Irish. Their labour force participation rate is higher, with fewer students, homemakers or retirees. This is broadly in line with expectations, given the younger age profile. However, there are marked differences in the economic profile within different nationality groups. Nationals from the accession states are predominantly workers while there is a higher percentage of students among those from outside Europe. One in six UK nationals living in Ireland were retired or unable to work - the same proportion for the Irish population. Figure 14 Principal Economic Status (persons aged 15 and over) Workers by industrial group The broad sectors in which workers were employed varied according to nationality. While the services sector dominated for all groups it was least important for persons from the accession states, where the industrial (specifically manufacturing and construction) and agricultural sectors were more important. The share of agricultural workers was very low for non-Irish groups excluding the accession states (1.5% for EU15 excluding Ireland and the UK and approximately 2% for the UK and Rest of world.)
Figure 15 Workers in industrial sectors
Non-Irish Nationals Living in Ireland
20
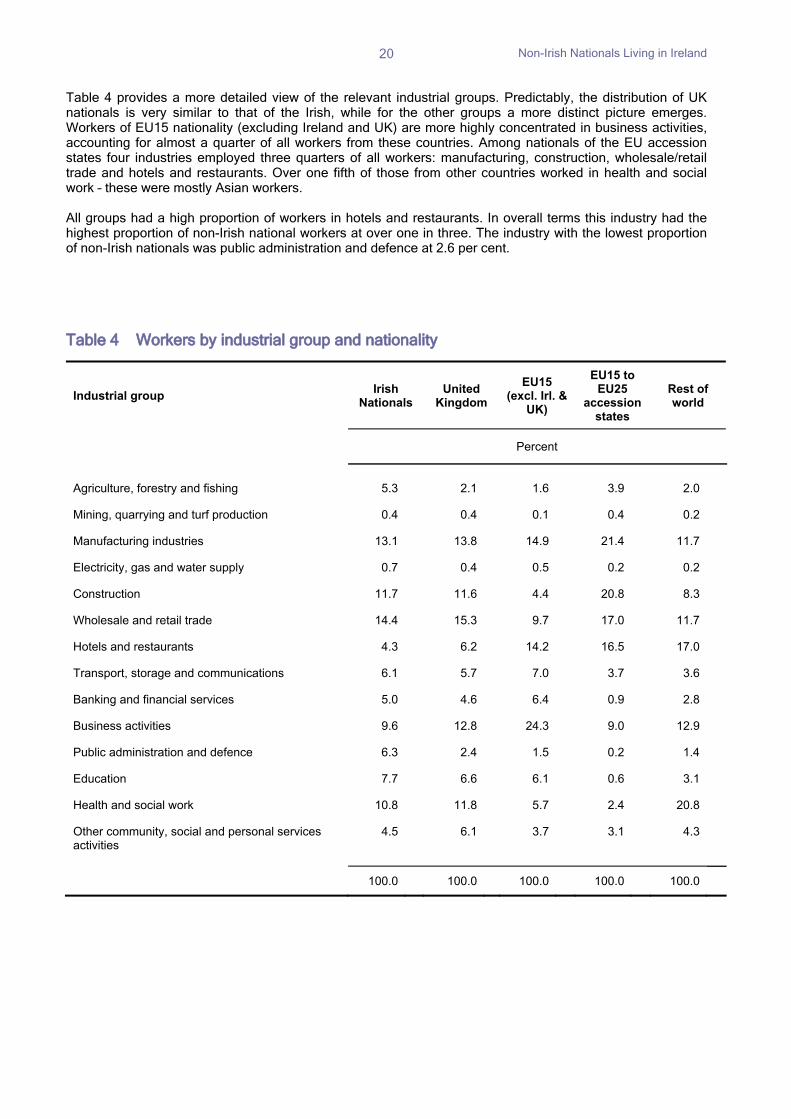
Table 4 provides a more detailed view of the relevant industrial groups. Predictably, the distribution of UK nationals is very similar to that of the Irish, while for the other groups a more distinct picture emerges. Workers of EU15 nationality (excluding Ireland and UK) are more highly concentrated in business activities, accounting for almost a quarter of all workers from these countries. Among nationals of the EU accession states four industries employed three quarters of all workers: manufacturing, construction, wholesale/retail trade and hotels and restaurants. Over one fifth of those from other countries worked in health and social work – these were mostly Asian workers. All groups had a high proportion of workers in hotels and restaurants. In overall terms this industry had the highest proportion of non-Irish national workers at over one in three. The industry with the lowest proportion of non-Irish nationals was public administration and defence at 2.6 per cent. Table 4 Workers by industrial group and nationality
Industrial group Irish Nationals
United Kingdom
EU15 (excl. Irl. &
UK)
EU15 to EU25
accession states
Rest of world
Percent
Agriculture, forestry and fishing 5.3 2.1 1.6 3.9 2.0
Mining, quarrying and turf production 0.4 0.4 0.1 0.4 0.2
Manufacturing industries 13.1 13.8 14.9 21.4 11.7
Electricity, gas and water supply 0.7 0.4 0.5 0.2 0.2
Construction 11.7 11.6 4.4 20.8 8.3
Wholesale and retail trade 14.4 15.3 9.7 17.0 11.7
Hotels and restaurants 4.3 6.2 14.2 16.5 17.0
Transport, storage and communications 6.1 5.7 7.0 3.7 3.6
Banking and financial services 5.0 4.6 6.4 0.9 2.8
Business activities 9.6 12.8 24.3 9.0 12.9
Public administration and defence 6.3 2.4 1.5 0.2 1.4
Education 7.7 6.6 6.1 0.6 3.1
Health and social work 10.8 11.8 5.7 2.4 20.8
Other community, social and personal services activities
4.5 6.1 3.7 3.1 4.3
100.0 100.0 100.0 100.0 100.0
Non-Irish Nationals Living in Ireland
21
0
25
50
75
100
Percent
Irish Non-Irish UK EU15excluding
Irelandand UK
EU15 toEU25
accessionstates
Rest ofworld
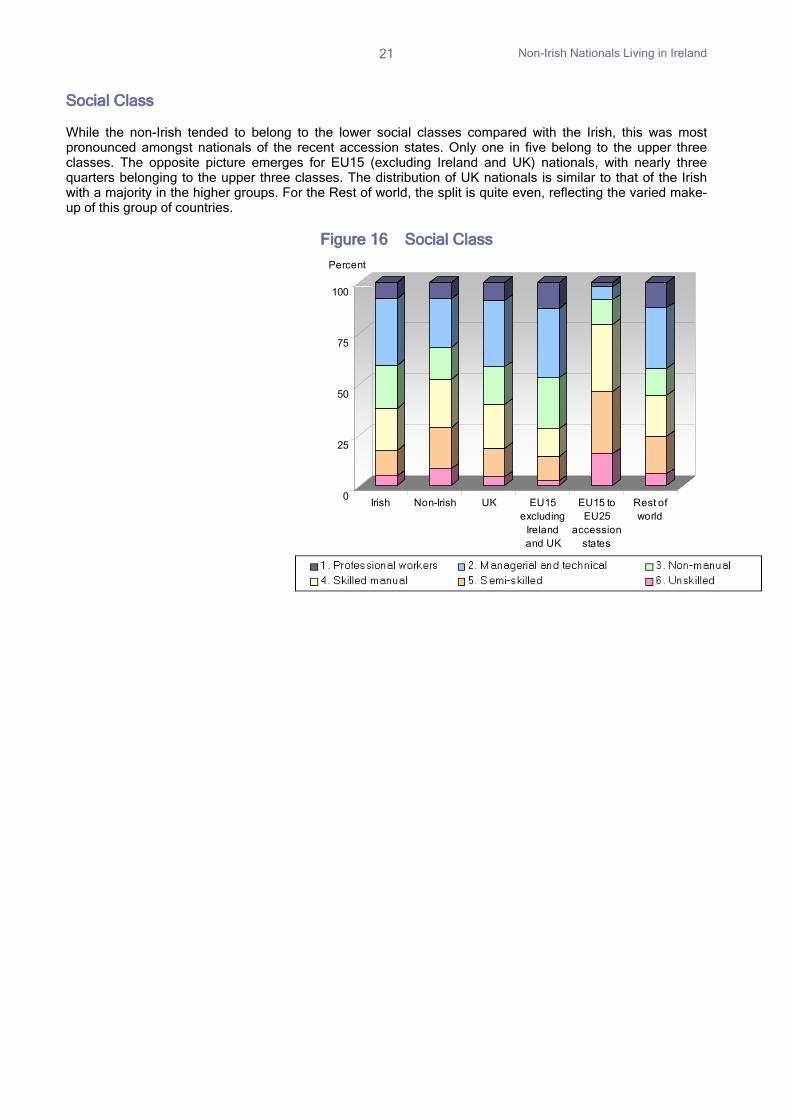
Social Class While the non-Irish tended to belong to the lower social classes compared with the Irish, this was most pronounced amongst nationals of the recent accession states. Only one in five belong to the upper three classes. The opposite picture emerges for EU15 (excluding Ireland and UK) nationals, with nearly three quarters belonging to the upper three classes. The distribution of UK nationals is similar to that of the Irish with a majority in the higher groups. For the Rest of world, the split is quite even, reflecting the varied make-up of this group of countries.
Figure 16 Social Class

2. Profiles of nationalities
UK Nationals
24
16%
6%
13%
7%7%
51%
Dublin City and suburbsOther cities and their suburbsTowns 10,000 population and overTowns 5,000 - 9,999Towns 1,500 - 4,999Rural area
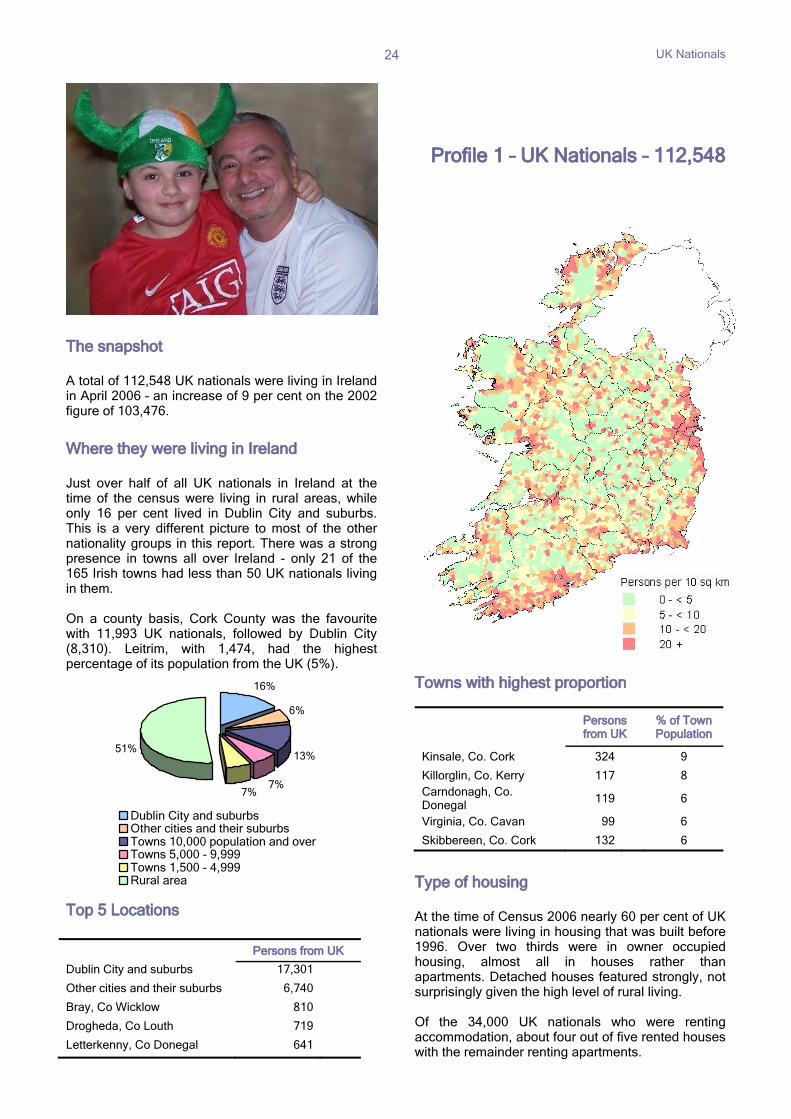
The snapshot A total of 112,548 UK nationals were living in Ireland in April 2006 – an increase of 9 per cent on the 2002 figure of 103,476.
Where they were living in Ireland Just over half of all UK nationals in Ireland at the time of the census were living in rural areas, while only 16 per cent lived in Dublin City and suburbs. This is a very different picture to most of the other nationality groups in this report. There was a strong presence in towns all over Ireland - only 21 of the 165 Irish towns had less than 50 UK nationals living in them. On a county basis, Cork County was the favourite with 11,993 UK nationals, followed by Dublin City (8,310). Leitrim, with 1,474, had the highest percentage of its population from the UK (5%).
Top 5 Locations
Persons from UK
Dublin City and suburbs 17,301
Other cities and their suburbs 6,740
Bray, Co Wicklow 810
Drogheda, Co Louth 719
Letterkenny, Co Donegal 641
Profile 1 – UK Nationals – 112,548
Towns with highest proportion
Persons from UK
% of Town Population
Kinsale, Co. Cork 324 9
Killorglin, Co. Kerry 117 8 Carndonagh, Co. Donegal 119 6
Virginia, Co. Cavan 99 6
Skibbereen, Co. Cork 132 6
Type of housing At the time of Census 2006 nearly 60 per cent of UK nationals were living in housing that was built before 1996. Over two thirds were in owner occupied housing, almost all in houses rather than apartments. Detached houses featured strongly, not surprisingly given the high level of rural living. Of the 34,000 UK nationals who were renting accommodation, about four out of five rented houses with the remainder renting apartments.
UK Nationals
25
Age pyramid
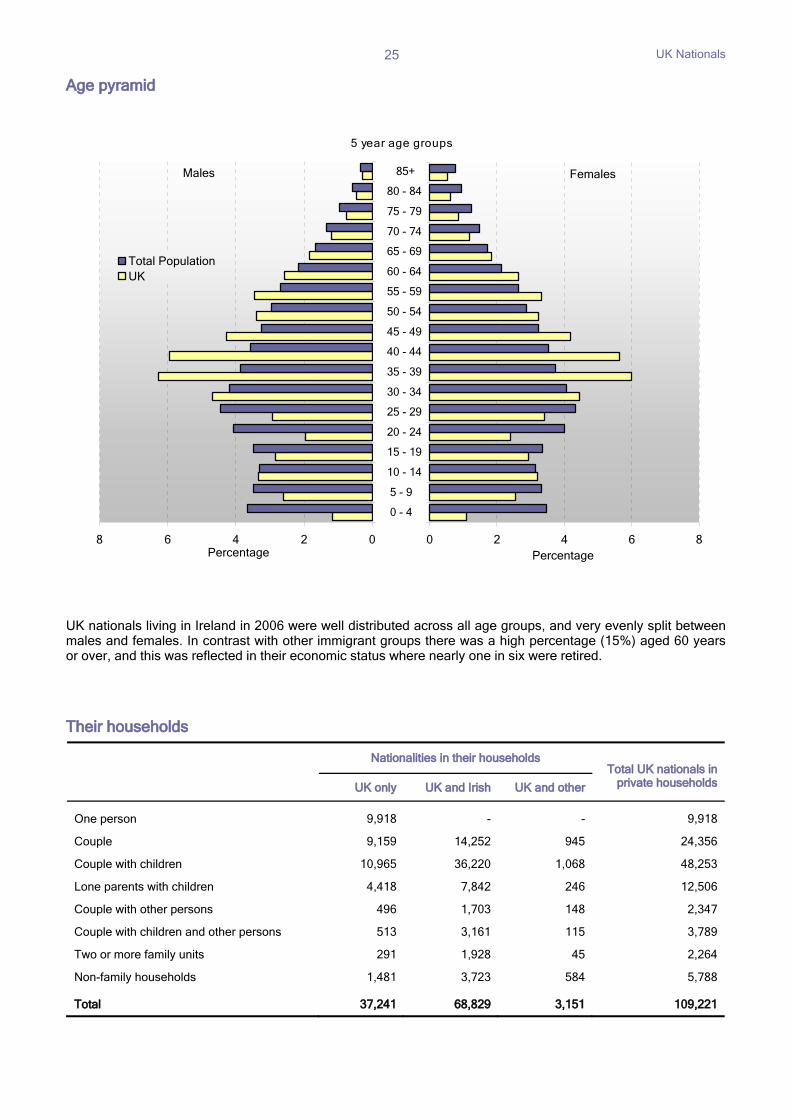
UK nationals living in Ireland in 2006 were well distributed across all age groups, and very evenly split between males and females. In contrast with other immigrant groups there was a high percentage (15%) aged 60 years or over, and this was reflected in their economic status where nearly one in six were retired. Their households
Nationalities in their householdsTotal UK nationals in
private households UK only UK and Irish UK and other
One person 9,918 - - 9,918
Couple 9,159 14,252 945 24,356
Couple with children 10,965 36,220 1,068 48,253
Lone parents with children 4,418 7,842 246 12,506
Couple with other persons 496 1,703 148 2,347
Couple with children and other persons 513 3,161 115 3,789
Two or more family units 291 1,928 45 2,264
Non-family households 1,481 3,723 584 5,788
Total 37,241 68,829 3,151 109,221
0 2 4 6 8
0 - 4
5 - 9
10 - 14
15 - 19
20 - 24
25 - 29
30 -44
35 - 39
40 - 44
45 - 49
50 - 54
55 - 59
60 - 64
65 - 69
70 - 74
75 - 79
80 - 84
85+
Percentage
Females
8 6 4 2 0
0 - 4
5 - 9
10 - 14
15 - 19
20 - 24
25 - 29
30 - 34
35 - 39
40 - 44
45 - 49
50 - 54
55 - 59
60 - 64
65 - 69
70 - 74
75 - 79
80 - 84
85+
Percentage
Total PopulationUK
Males
5 year age groups
UK Nationals
26
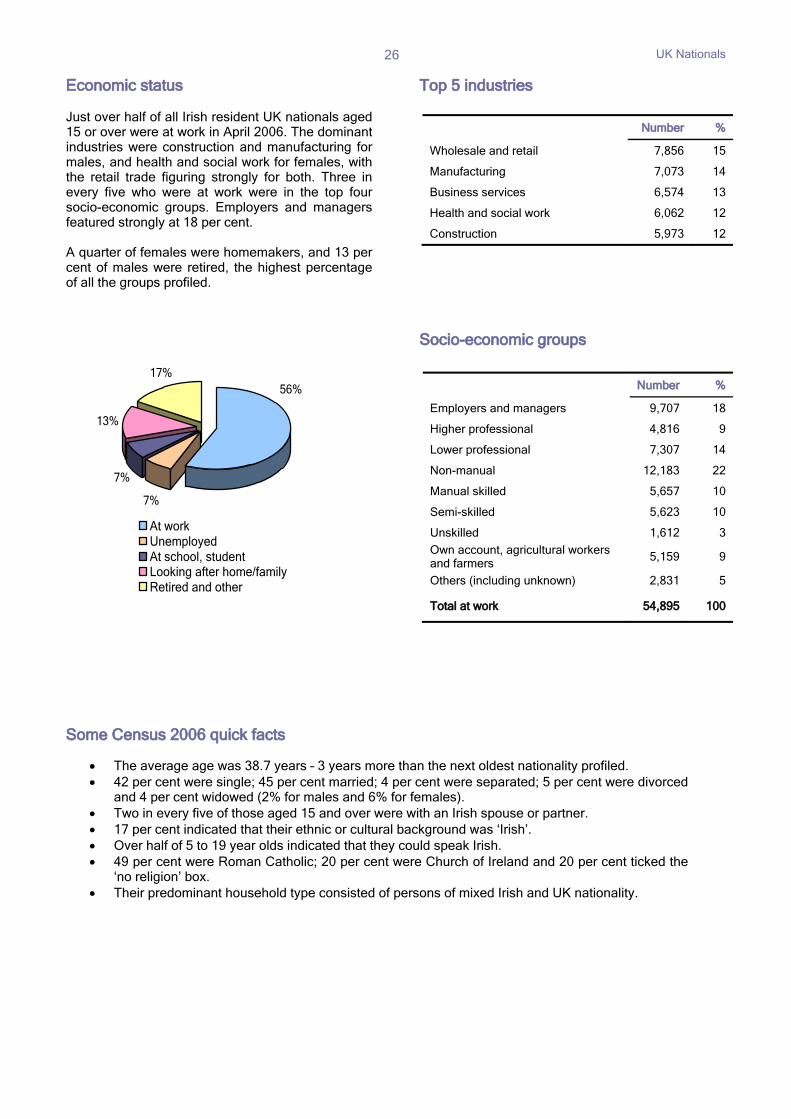
Economic status Just over half of all Irish resident UK nationals aged 15 or over were at work in April 2006. The dominant industries were construction and manufacturing for males, and health and social work for females, with the retail trade figuring strongly for both. Three in every five who were at work were in the top four socio-economic groups. Employers and managers featured strongly at 18 per cent. A quarter of females were homemakers, and 13 per cent of males were retired, the highest percentage of all the groups profiled.
Top 5 industries
Socio-economic groups
Some Census 2006 quick facts
• The average age was 38.7 years – 3 years more than the next oldest nationality profiled. • 42 per cent were single; 45 per cent married; 4 per cent were separated; 5 per cent were divorced
and 4 per cent widowed (2% for males and 6% for females). • Two in every five of those aged 15 and over were with an Irish spouse or partner. • 17 per cent indicated that their ethnic or cultural background was ‘Irish’. • Over half of 5 to 19 year olds indicated that they could speak Irish. • 49 per cent were Roman Catholic; 20 per cent were Church of Ireland and 20 per cent ticked the
‘no religion’ box. • Their predominant household type consisted of persons of mixed Irish and UK nationality.
Number %
Wholesale and retail 7,856 15
Manufacturing 7,073 14
Business services 6,574 13
Health and social work 6,062 12
Construction 5,973 12
Number %
Employers and managers 9,707 18
Higher professional 4,816 9
Lower professional 7,307 14
Non-manual 12,183 22
Manual skilled 5,657 10
Semi-skilled 5,623 10
Unskilled 1,612 3
Own account, agricultural workers and farmers 5,159 9
Others (including unknown) 2,831 5
Total at work 54,895 100
7%
13%
56%17%
7%
At workUnemployedAt school, studentLooking after home/familyRetired and other
UK Nationals
27
0 500 1000 1500 2000 2500 3000 3500 4000 4500 5000
Agriculture/Veterinary
Computing
Education
Engineering
Health
Humanities/Arts
Sciences
Multi-subject
Services
Social Science/Business/Law
Social Services
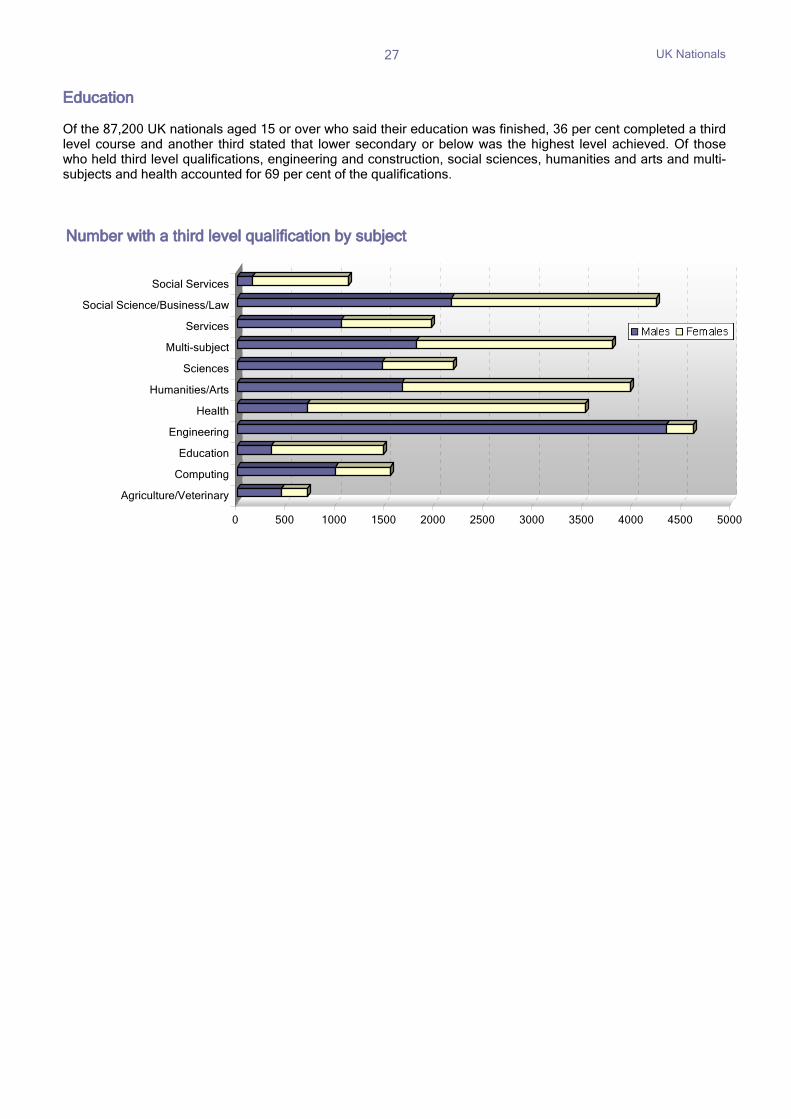
Number with a third level qualification by subject
Education Of the 87,200 UK nationals aged 15 or over who said their education was finished, 36 per cent completed a third level course and another third stated that lower secondary or below was the highest level achieved. Of those who held third level qualifications, engineering and construction, social sciences, humanities and arts and multi-subjects and health accounted for 69 per cent of the qualifications.
Polish Nationals
28
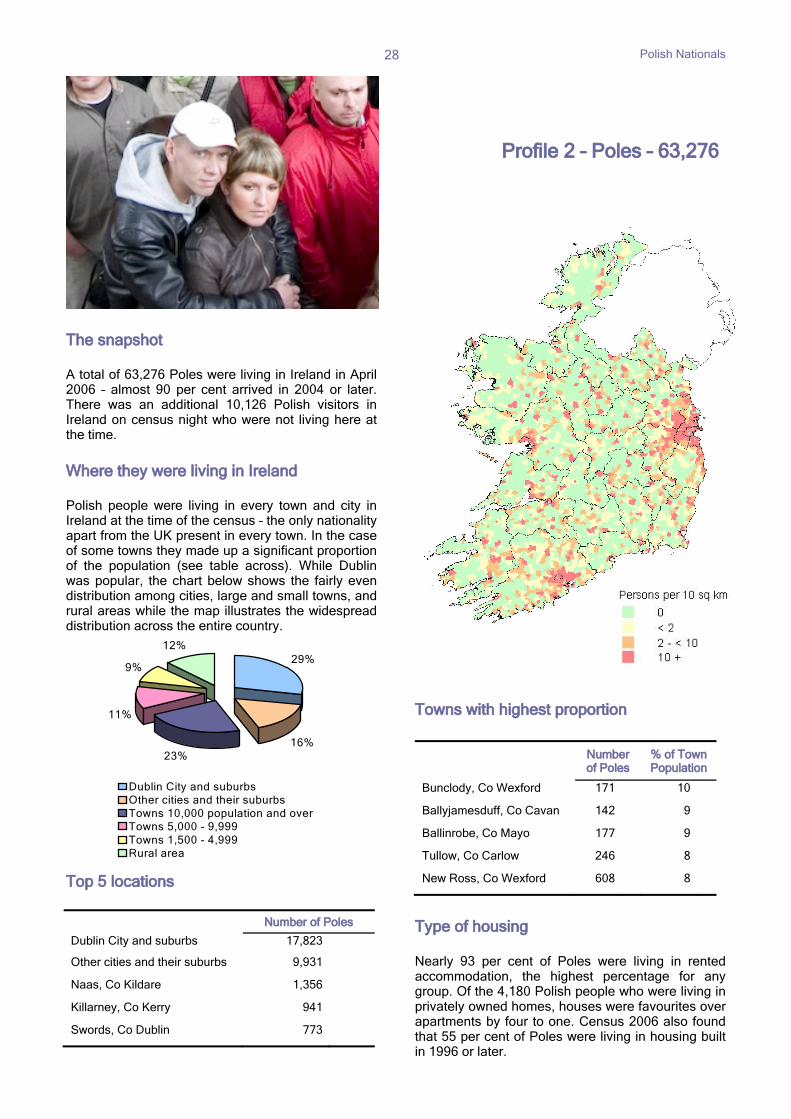
The snapshot A total of 63,276 Poles were living in Ireland in April 2006 – almost 90 per cent arrived in 2004 or later. There was an additional 10,126 Polish visitors in Ireland on census night who were not living here at the time. Where they were living in Ireland Polish people were living in every town and city in Ireland at the time of the census – the only nationality apart from the UK present in every town. In the case of some towns they made up a significant proportion of the population (see table across). While Dublin was popular, the chart below shows the fairly even distribution among cities, large and small towns, and rural areas while the map illustrates the widespread distribution across the entire country.
Top 5 locations
Profile 2 – Poles – 63,276
Towns with highest proportion
Number of Poles
% of Town Population
Bunclody, Co Wexford 171 10
Ballyjamesduff, Co Cavan 142 9
Ballinrobe, Co Mayo 177 9
Tullow, Co Carlow 246 8
New Ross, Co Wexford 608 8
Type of housing Nearly 93 per cent of Poles were living in rented accommodation, the highest percentage for any group. Of the 4,180 Polish people who were living in privately owned homes, houses were favourites over apartments by four to one. Census 2006 also found that 55 per cent of Poles were living in housing built in 1996 or later.
Number of Poles
Dublin City and suburbs 17,823
Other cities and their suburbs 9,931
Naas, Co Kildare 1,356
Killarney, Co Kerry 941
Swords, Co Dublin 773
29%
16%23%
11%
9%
12%
Dublin City and suburbsOther cities and their suburbsTowns 10,000 population and overTowns 5,000 - 9,999 Towns 1,500 - 4,999Rural area
Polish Nationals
29
Age graph
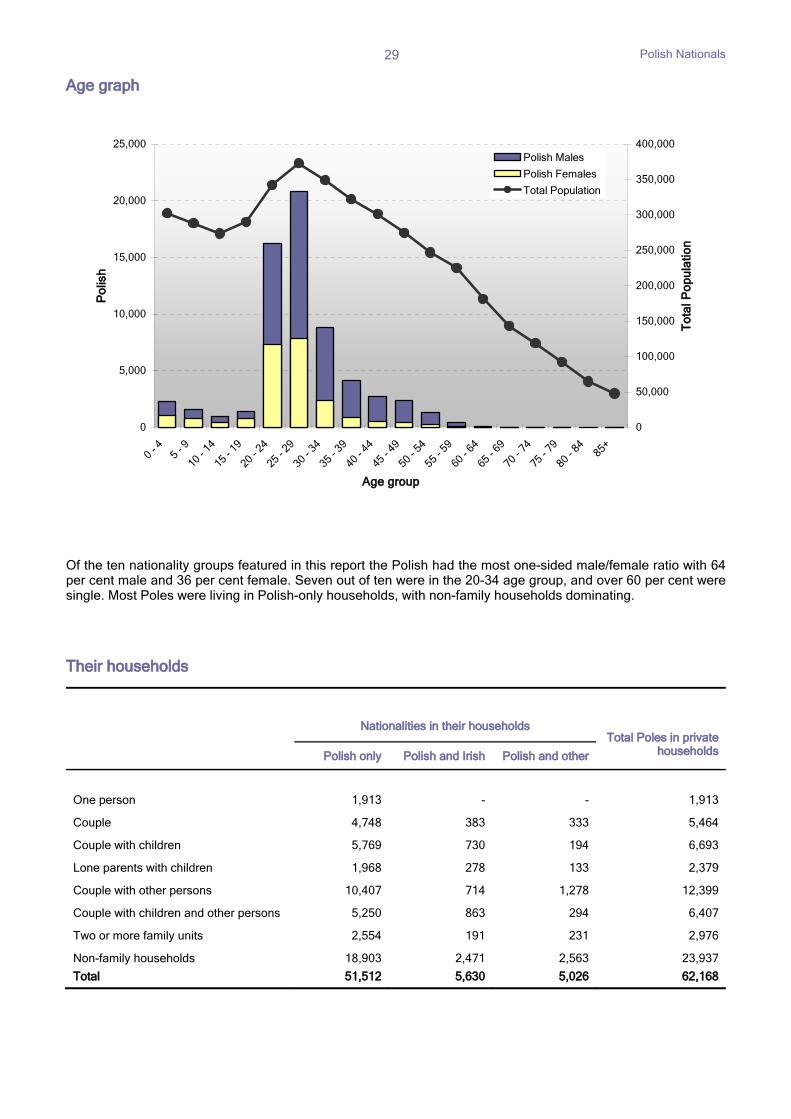
Of the ten nationality groups featured in this report the Polish had the most one-sided male/female ratio with 64 per cent male and 36 per cent female. Seven out of ten were in the 20-34 age group, and over 60 per cent were single. Most Poles were living in Polish-only households, with non-family households dominating. Their households
Nationalities in their householdsTotal Poles in private
households Polish only Polish and Irish Polish and other
One person 1,913 - - 1,913
Couple 4,748 383 333 5,464
Couple with children 5,769 730 194 6,693
Lone parents with children 1,968 278 133 2,379
Couple with other persons 10,407 714 1,278 12,399
Couple with children and other persons 5,250 863 294 6,407
Two or more family units 2,554 191 231 2,976
Non-family households 18,903 2,471 2,563 23,937
Total 51,512 5,630 5,026 62,168
0
5,000
10,000
15,000
20,000
25,000
0 -
4
5 -
9
10 -
14
15 -
19
20 -
24
25 -
29
30 -
34
35 -
39
40 -
44
45 -
49
50 -
54
55 -
59
60 -
64
65 -
69
70 -
74
75 -
79
80 -
84 8
5+
Age group
Po
lish
0
50,000
100,000
150,000
200,000
250,000
300,000
350,000
400,000
To
tal P
op
ula
tion
Polish Males
Polish Females
Total Population
Polish Nationals
30
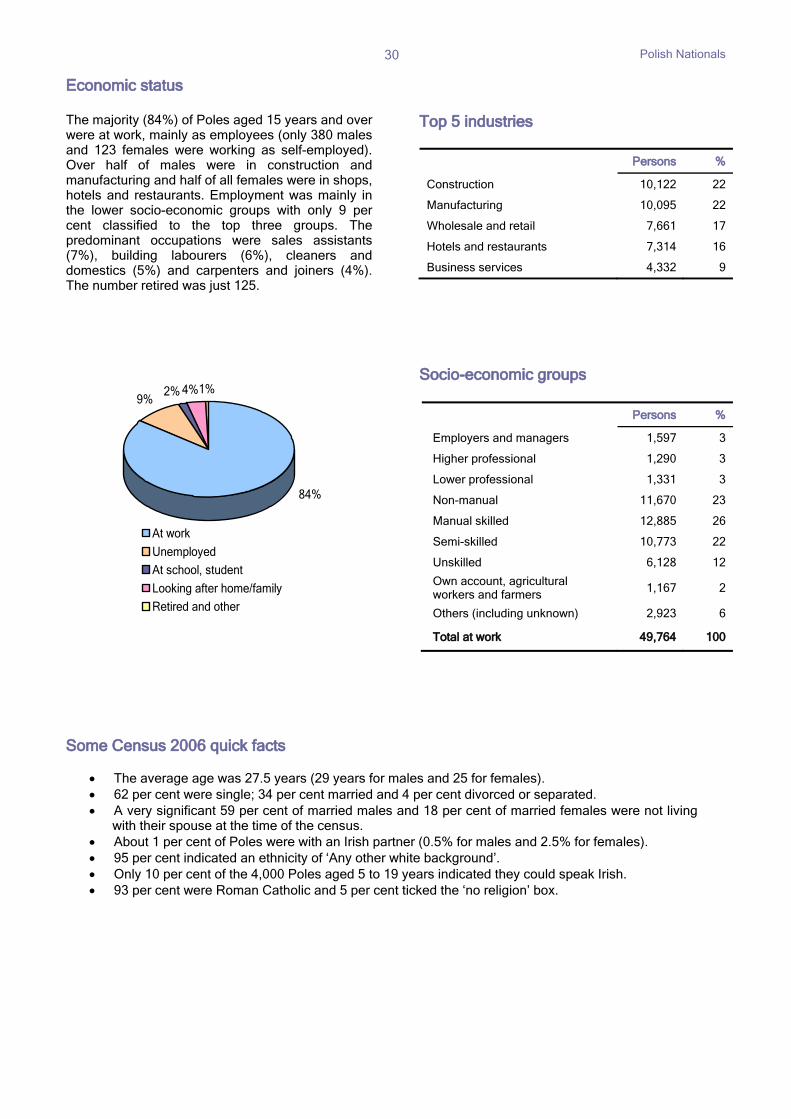
Economic status The majority (84%) of Poles aged 15 years and over were at work, mainly as employees (only 380 males and 123 females were working as self-employed). Over half of males were in construction and manufacturing and half of all females were in shops, hotels and restaurants. Employment was mainly in the lower socio-economic groups with only 9 per cent classified to the top three groups. The predominant occupations were sales assistants (7%), building labourers (6%), cleaners and domestics (5%) and carpenters and joiners (4%). The number retired was just 125.
Top 5 industries
Socio-economic groups
Some Census 2006 quick facts
• The average age was 27.5 years (29 years for males and 25 for females). • 62 per cent were single; 34 per cent married and 4 per cent divorced or separated. • A very significant 59 per cent of married males and 18 per cent of married females were not living
with their spouse at the time of the census. • About 1 per cent of Poles were with an Irish partner (0.5% for males and 2.5% for females). • 95 per cent indicated an ethnicity of ‘Any other white background’. • Only 10 per cent of the 4,000 Poles aged 5 to 19 years indicated they could speak Irish. • 93 per cent were Roman Catholic and 5 per cent ticked the ‘no religion’ box.
Persons %
Construction 10,122 22
Manufacturing 10,095 22
Wholesale and retail 7,661 17
Hotels and restaurants 7,314 16
Business services 4,332 9
Persons %
Employers and managers 1,597 3
Higher professional 1,290 3
Lower professional 1,331 3
Non-manual 11,670 23
Manual skilled 12,885 26
Semi-skilled 10,773 22
Unskilled 6,128 12
Own account, agricultural workers and farmers 1,167 2
Others (including unknown) 2,923 6
Total at work 49,764 100
9%2% 4%1%
84%
At work
Unemployed
At school, student
Looking after home/family
Retired and other
Polish Nationals
31
Education
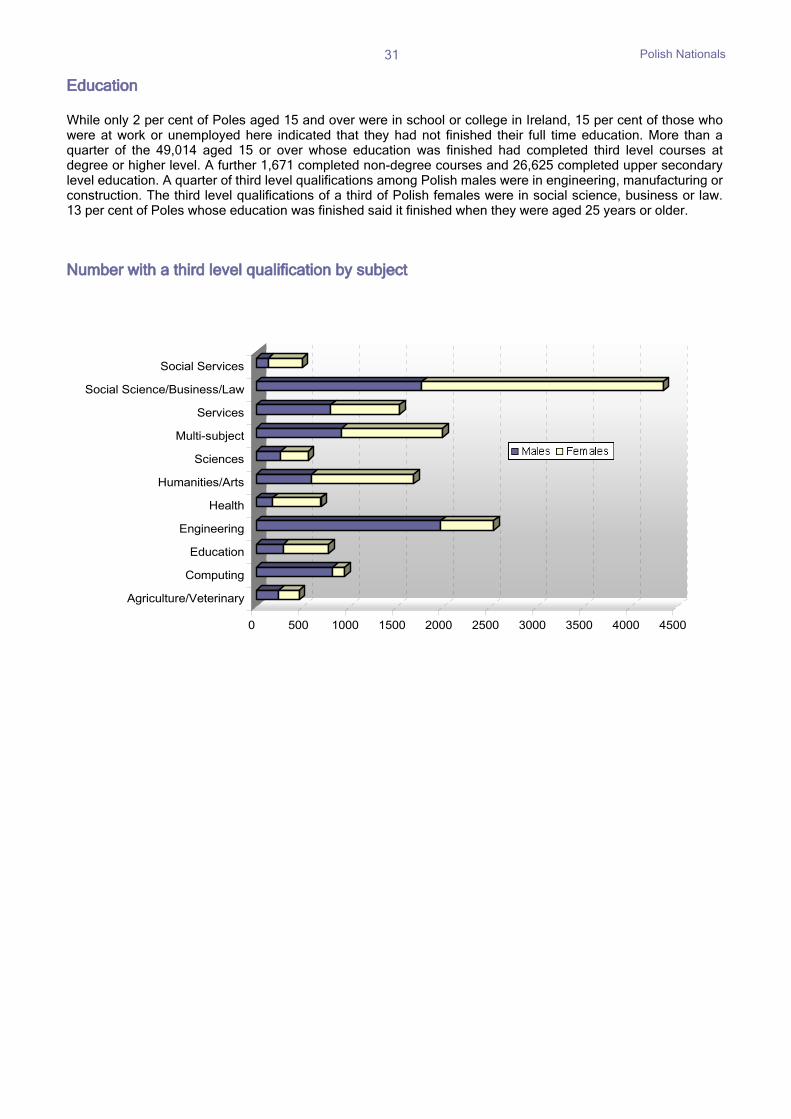
While only 2 per cent of Poles aged 15 and over were in school or college in Ireland, 15 per cent of those who were at work or unemployed here indicated that they had not finished their full time education. More than a quarter of the 49,014 aged 15 or over whose education was finished had completed third level courses at degree or higher level. A further 1,671 completed non-degree courses and 26,625 completed upper secondary level education. A quarter of third level qualifications among Polish males were in engineering, manufacturing or construction. The third level qualifications of a third of Polish females were in social science, business or law. 13 per cent of Poles whose education was finished said it finished when they were aged 25 years or older.
Number with a third level qualification by subject
0 500 1000 1500 2000 2500 3000 3500 4000 4500
Agriculture/Veterinary
Computing
Education
Engineering
Health
Humanities/Arts
Sciences
Multi-subject
Services
Social Science/Business/Law
Social Services
Lithuanian Nationals
32
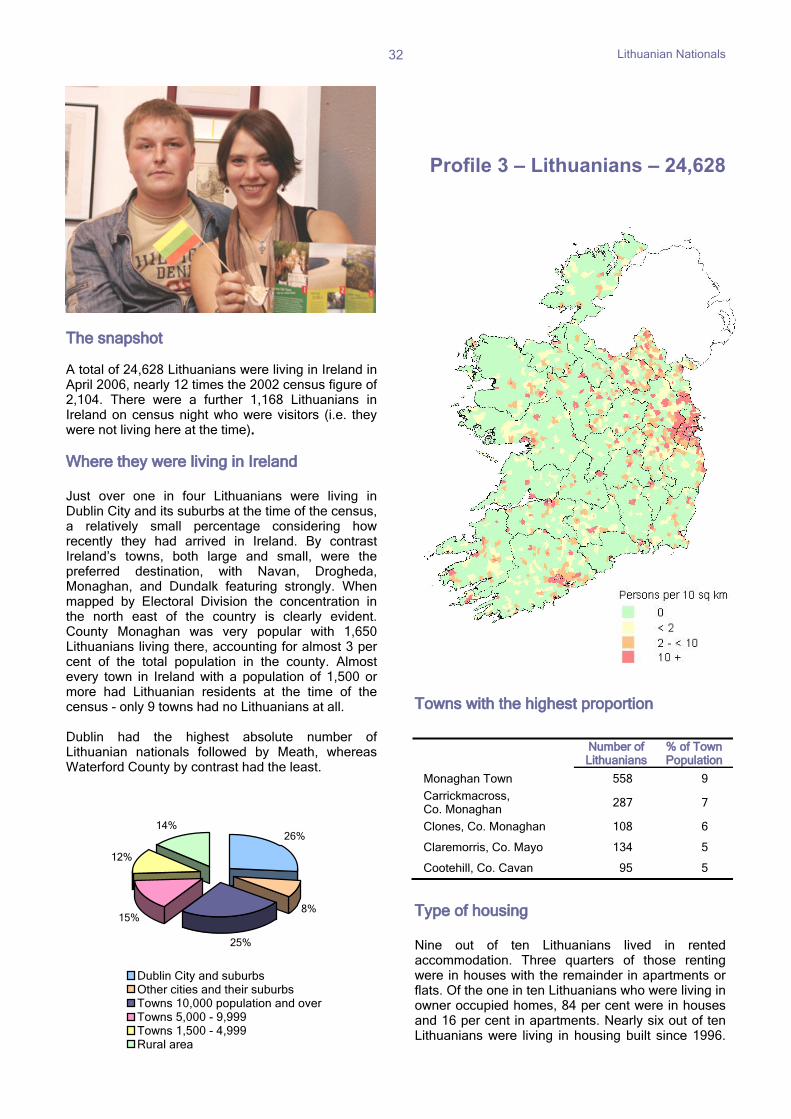
The snapshot A total of 24,628 Lithuanians were living in Ireland in April 2006, nearly 12 times the 2002 census figure of 2,104. There were a further 1,168 Lithuanians in Ireland on census night who were visitors (i.e. they were not living here at the time). Where they were living in Ireland Just over one in four Lithuanians were living in Dublin City and its suburbs at the time of the census, a relatively small percentage considering how recently they had arrived in Ireland. By contrast Ireland’s towns, both large and small, were the preferred destination, with Navan, Drogheda, Monaghan, and Dundalk featuring strongly. When mapped by Electoral Division the concentration in the north east of the country is clearly evident. County Monaghan was very popular with 1,650 Lithuanians living there, accounting for almost 3 per cent of the total population in the county. Almost every town in Ireland with a population of 1,500 or more had Lithuanian residents at the time of the census - only 9 towns had no Lithuanians at all. Dublin had the highest absolute number of Lithuanian nationals followed by Meath, whereas Waterford County by contrast had the least.
Profile 3 – Lithuanians – 24,628
Towns with the highest proportion
Type of housing Nine out of ten Lithuanians lived in rented accommodation. Three quarters of those renting were in houses with the remainder in apartments or flats. Of the one in ten Lithuanians who were living in owner occupied homes, 84 per cent were in houses and 16 per cent in apartments. Nearly six out of ten Lithuanians were living in housing built since 1996.
Number of Lithuanians
% of Town Population
Monaghan Town 558 9
Carrickmacross, Co. Monaghan 287 7
Clones, Co. Monaghan 108 6
Claremorris, Co. Mayo 134 5
Cootehill, Co. Cavan 95 5
26%
8%
25%
15%
12%
14%
Dublin City and suburbsOther cities and their suburbsTowns 10,000 population and overTowns 5,000 - 9,999 Towns 1,500 - 4,999 Rural area
Lithuanian Nationals
33
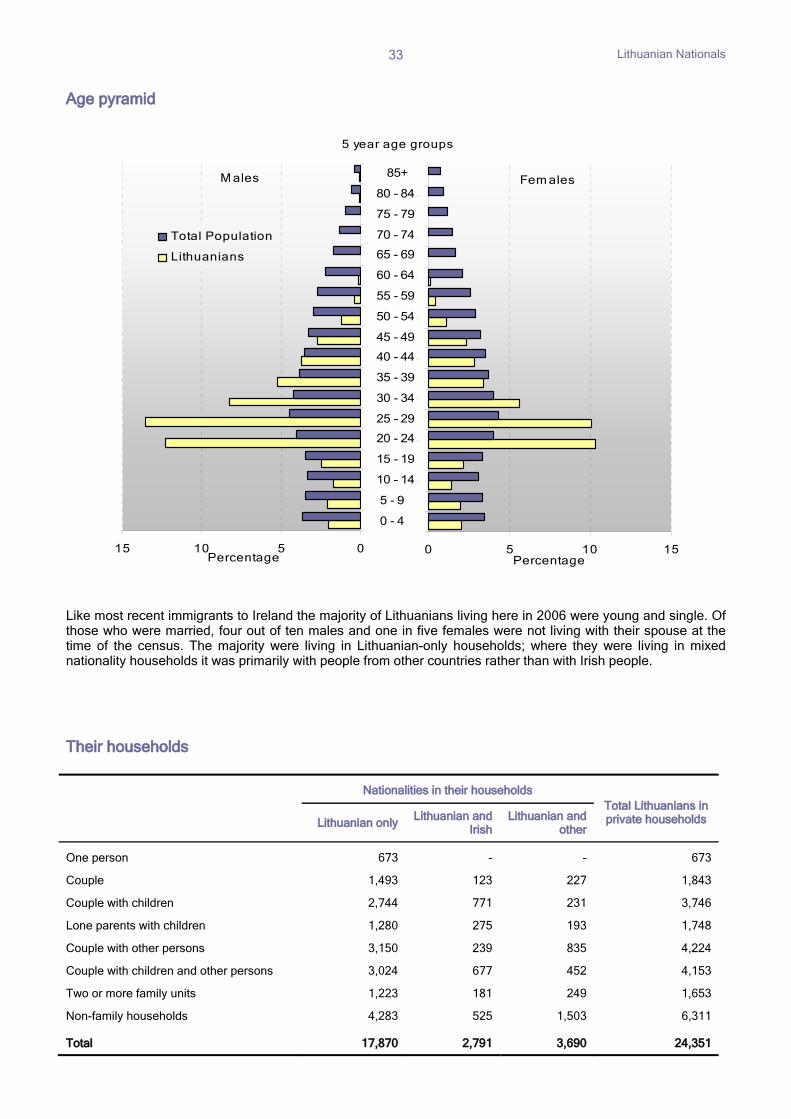
Age pyramid Like most recent immigrants to Ireland the majority of Lithuanians living here in 2006 were young and single. Of those who were married, four out of ten males and one in five females were not living with their spouse at the time of the census. The majority were living in Lithuanian-only households; where they were living in mixed nationality households it was primarily with people from other countries rather than with Irish people. Their households
Nationalities in their householdsTotal Lithuanians in private households
Lithuanian only
Lithuanian and Irish
Lithuanian and other
One person 673 - - 673
Couple 1,493 123 227 1,843
Couple with children 2,744 771 231 3,746
Lone parents with children 1,280 275 193 1,748
Couple with other persons 3,150 239 835 4,224
Couple with children and other persons 3,024 677 452 4,153
Two or more family units 1,223 181 249 1,653
Non-family households 4,283 525 1,503 6,311
Total 17,870 2,791 3,690 24,351
0 5 10 15
0 - 4
10 - 14
20 - 24
30 - 34
40 - 44
50 - 54
60 - 64
70 - 74
80 - 84
Percentage
Fem ales
15 10 5 0
0 - 4
5 - 9
10 - 14
15 - 19
20 - 24
25 - 29
30 - 34
35 - 39
40 - 44
45 - 49
50 - 54
55 - 59
60 - 64
65 - 69
70 - 74
75 - 79
80 - 84
85+
Percentage
Total Population
Lithuanians
M ales
5 year age groups
Lithuanian Nationals
34
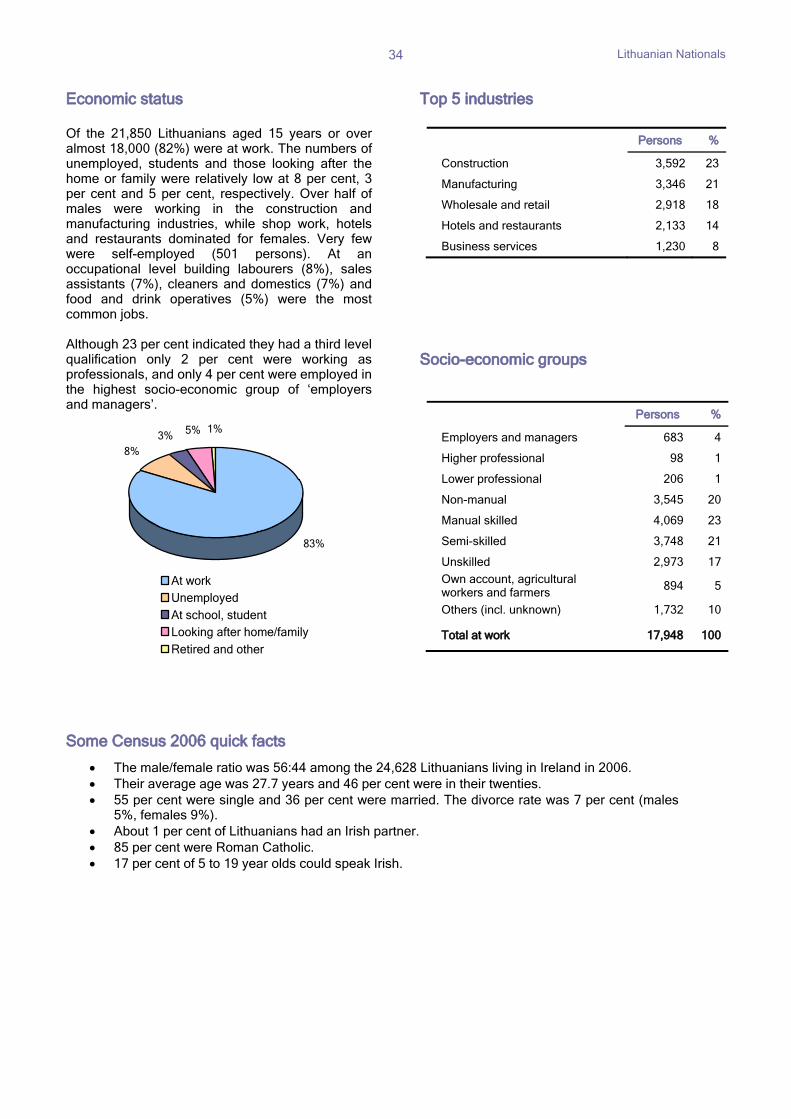
Economic status Of the 21,850 Lithuanians aged 15 years or over almost 18,000 (82%) were at work. The numbers of unemployed, students and those looking after the home or family were relatively low at 8 per cent, 3 per cent and 5 per cent, respectively. Over half of males were working in the construction and manufacturing industries, while shop work, hotels and restaurants dominated for females. Very few were self-employed (501 persons). At an occupational level building labourers (8%), sales assistants (7%), cleaners and domestics (7%) and food and drink operatives (5%) were the most common jobs. Although 23 per cent indicated they had a third level qualification only 2 per cent were working as professionals, and only 4 per cent were employed in the highest socio-economic group of ‘employers and managers’.
Top 5 industries
Socio-economic groups
Some Census 2006 quick facts
• The male/female ratio was 56:44 among the 24,628 Lithuanians living in Ireland in 2006. • Their average age was 27.7 years and 46 per cent were in their twenties. • 55 per cent were single and 36 per cent were married. The divorce rate was 7 per cent (males
5%, females 9%). • About 1 per cent of Lithuanians had an Irish partner. • 85 per cent were Roman Catholic. • 17 per cent of 5 to 19 year olds could speak Irish.
Persons %
Construction 3,592 23
Manufacturing 3,346 21
Wholesale and retail 2,918 18
Hotels and restaurants 2,133 14
Business services 1,230 8
Persons %
Employers and managers 683 4
Higher professional 98 1
Lower professional 206 1
Non-manual 3,545 20
Manual skilled 4,069 23
Semi-skilled 3,748 21
Unskilled 2,973 17
Own account, agricultural workers and farmers
894 5
Others (incl. unknown) 1,732 10
Total at work 17,948 100
5%
83%
8%
1%3%
At workUnemployedAt school, studentLooking after home/familyRetired and other
Lithuanian Nationals
35
Number with a third level qualification by subject
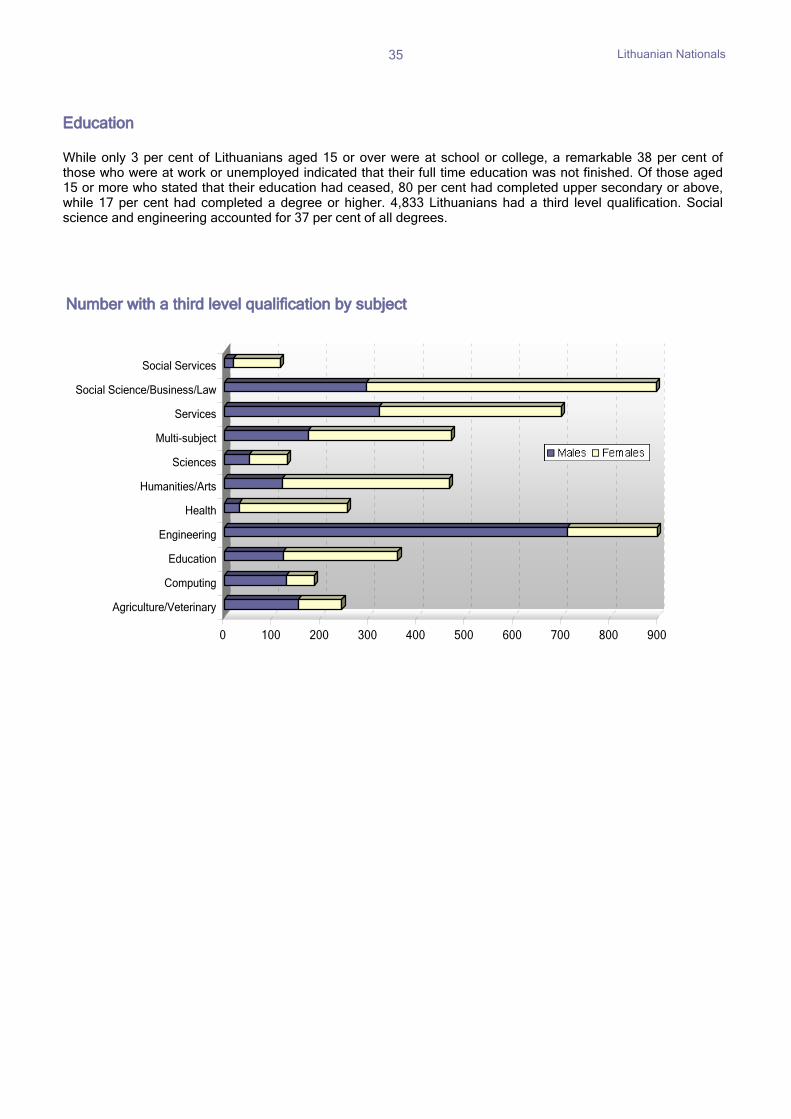
Education While only 3 per cent of Lithuanians aged 15 or over were at school or college, a remarkable 38 per cent of those who were at work or unemployed indicated that their full time education was not finished. Of those aged 15 or more who stated that their education had ceased, 80 per cent had completed upper secondary or above, while 17 per cent had completed a degree or higher. 4,833 Lithuanians had a third level qualification. Social science and engineering accounted for 37 per cent of all degrees.
0 100 200 300 400 500 600 700 800 900
Agriculture/Veterinary
Computing
Education
Engineering
Health
Humanities/Arts
Sciences
Multi-subject
Services
Social Science/Business/Law
Social Services
Nigerian Nationals
36
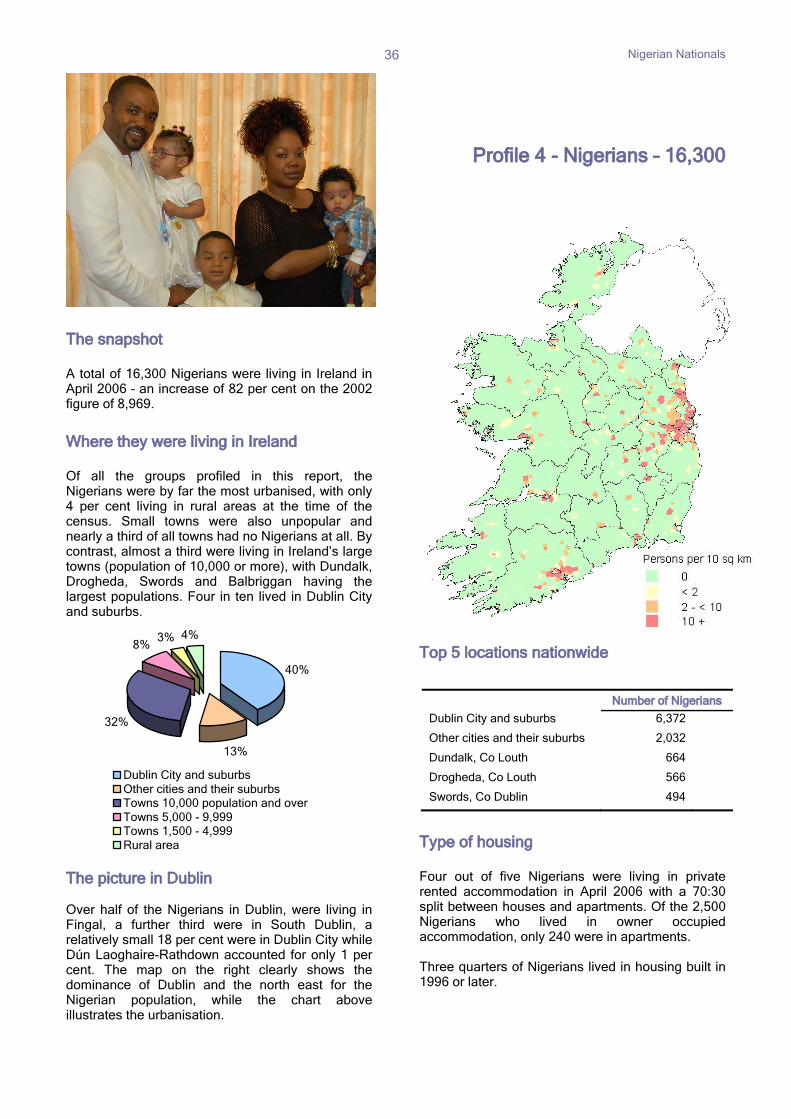
The snapshot A total of 16,300 Nigerians were living in Ireland in April 2006 – an increase of 82 per cent on the 2002 figure of 8,969.
Where they were living in Ireland Of all the groups profiled in this report, the Nigerians were by far the most urbanised, with only 4 per cent living in rural areas at the time of the census. Small towns were also unpopular and nearly a third of all towns had no Nigerians at all. By contrast, almost a third were living in Ireland’s large towns (population of 10,000 or more), with Dundalk, Drogheda, Swords and Balbriggan having the largest populations. Four in ten lived in Dublin City and suburbs.
The picture in Dublin Over half of the Nigerians in Dublin, were living in Fingal, a further third were in South Dublin, a relatively small 18 per cent were in Dublin City while Dún Laoghaire-Rathdown accounted for only 1 per cent. The map on the right clearly shows the dominance of Dublin and the north east for the Nigerian population, while the chart above illustrates the urbanisation.
Profile 4 - Nigerians – 16,300 Top 5 locations nationwide
Type of housing Four out of five Nigerians were living in private rented accommodation in April 2006 with a 70:30 split between houses and apartments. Of the 2,500 Nigerians who lived in owner occupied accommodation, only 240 were in apartments. Three quarters of Nigerians lived in housing built in 1996 or later.
Number of Nigerians
Dublin City and suburbs 6,372
Other cities and their suburbs 2,032
Dundalk, Co Louth 664
Drogheda, Co Louth 566
Swords, Co Dublin 494
40%
13%
32%
8%3% 4%
Dublin City and suburbsOther cities and their suburbsTowns 10,000 population and overTowns 5,000 - 9,999 Towns 1,500 - 4,999 Rural area
Nigerian Nationals
37
Age pyramid
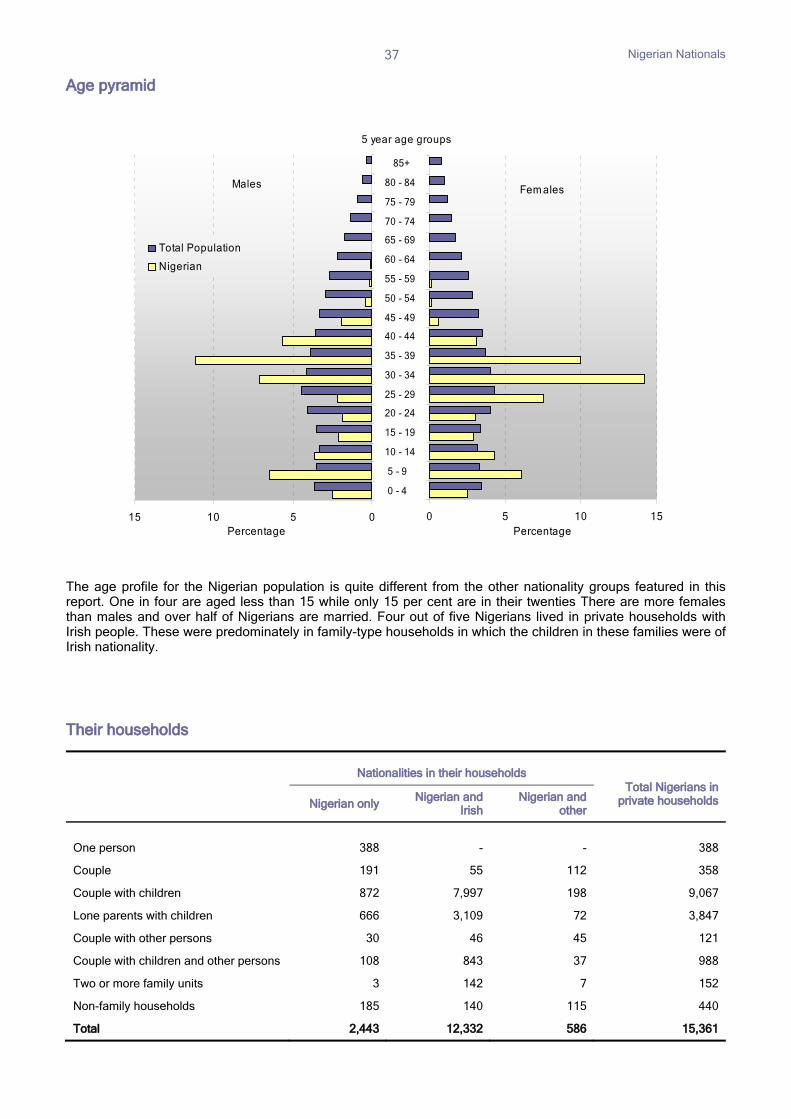
The age profile for the Nigerian population is quite different from the other nationality groups featured in this report. One in four are aged less than 15 while only 15 per cent are in their twenties There are more females than males and over half of Nigerians are married. Four out of five Nigerians lived in private households with Irish people. These were predominately in family-type households in which the children in these families were of Irish nationality. Their households
Nationalities in their households
Total Nigerians in private households
Nigerian only
Nigerian and Irish
Nigerian and other
One person 388 - - 388
Couple 191 55 112 358
Couple with children 872 7,997 198 9,067
Lone parents with children 666 3,109 72 3,847
Couple with other persons 30 46 45 121
Couple with children and other persons 108 843 37 988
Two or more family units 3 142 7 152
Non-family households 185 140 115 440
Total 2,443 12,332 586 15,361
0 5 10 15
0 - 4
10 - 14
20 - 24
30 - 24
40 - 44
50 - 54
60 - 64
70 - 74
80 - 84
Percentage
Fem ales
15 10 5 0
0 - 4
5 - 9
10 - 14
15 - 19
20 - 24
25 - 29
30 - 34
35 - 39
40 - 44
45 - 49
50 - 54
55 - 59
60 - 64
65 - 69
70 - 74
75 - 79
80 - 84
85+
Percentage
Total Population
Nigerian
Males
5 year age groups
Nigerian Nationals
38
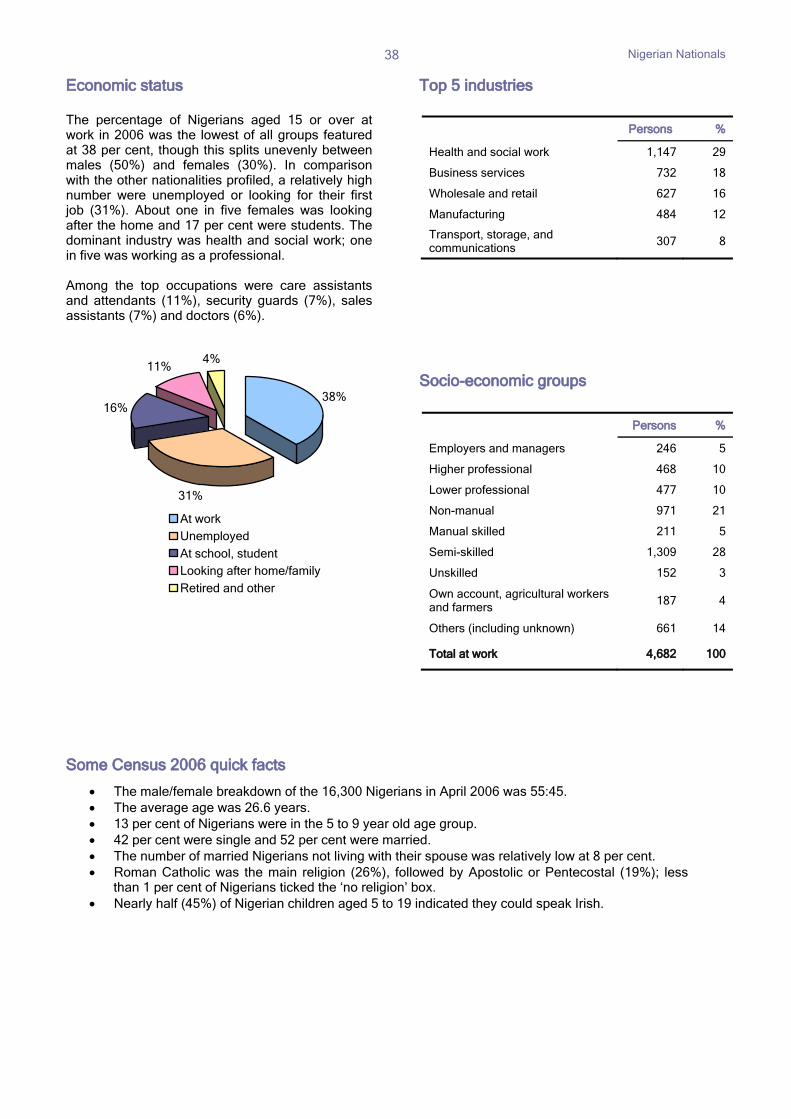
Economic status The percentage of Nigerians aged 15 or over at work in 2006 was the lowest of all groups featured at 38 per cent, though this splits unevenly between males (50%) and females (30%). In comparison with the other nationalities profiled, a relatively high number were unemployed or looking for their first job (31%). About one in five females was looking after the home and 17 per cent were students. The dominant industry was health and social work; one in five was working as a professional. Among the top occupations were care assistants and attendants (11%), security guards (7%), sales assistants (7%) and doctors (6%).
Top 5 industries
Socio-economic groups
Some Census 2006 quick facts
• The male/female breakdown of the 16,300 Nigerians in April 2006 was 55:45. • The average age was 26.6 years. • 13 per cent of Nigerians were in the 5 to 9 year old age group. • 42 per cent were single and 52 per cent were married. • The number of married Nigerians not living with their spouse was relatively low at 8 per cent. • Roman Catholic was the main religion (26%), followed by Apostolic or Pentecostal (19%); less
than 1 per cent of Nigerians ticked the ‘no religion’ box. • Nearly half (45%) of Nigerian children aged 5 to 19 indicated they could speak Irish.
Persons %
Health and social work 1,147 29
Business services 732 18
Wholesale and retail 627 16
Manufacturing 484 12
Transport, storage, and communications
307 8
Persons %
Employers and managers 246 5
Higher professional 468 10
Lower professional 477 10
Non-manual 971 21
Manual skilled 211 5
Semi-skilled 1,309 28
Unskilled 152 3
Own account, agricultural workers and farmers
187 4
Others (including unknown) 661 14
Total at work 4,682 100
38%
31%
16%
11%4%
At workUnemployed
At school, studentLooking after home/familyRetired and other
Nigerian Nationals
39
Number with a third level qualification by subject
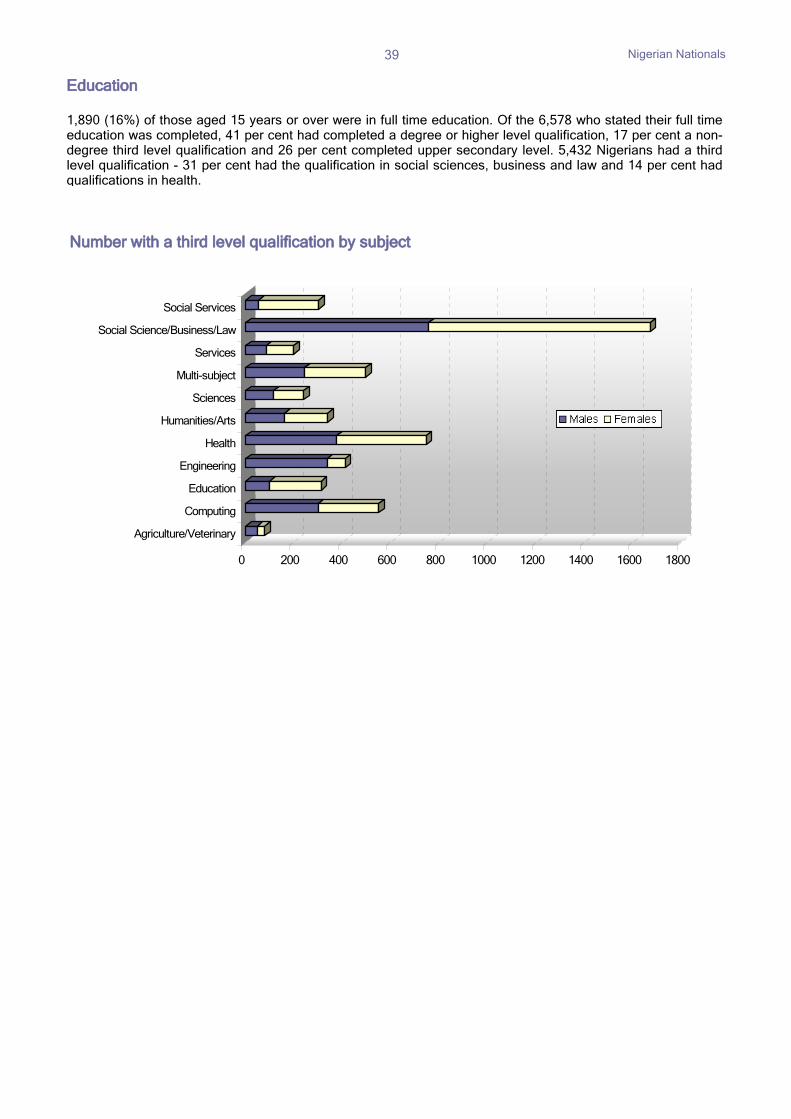
Education 1,890 (16%) of those aged 15 years or over were in full time education. Of the 6,578 who stated their full time education was completed, 41 per cent had completed a degree or higher level qualification, 17 per cent a non-degree third level qualification and 26 per cent completed upper secondary level. 5,432 Nigerians had a third level qualification - 31 per cent had the qualification in social sciences, business and law and 14 per cent had qualifications in health.
0 200 400 600 800 1000 1200 1400 1600 1800
Agriculture/Veterinary
Computing
Education
Engineering
Health
Humanities/Arts
Sciences
Multi-subject
Services
Social Science/Business/Law
Social Services
Latvian Nationals
40
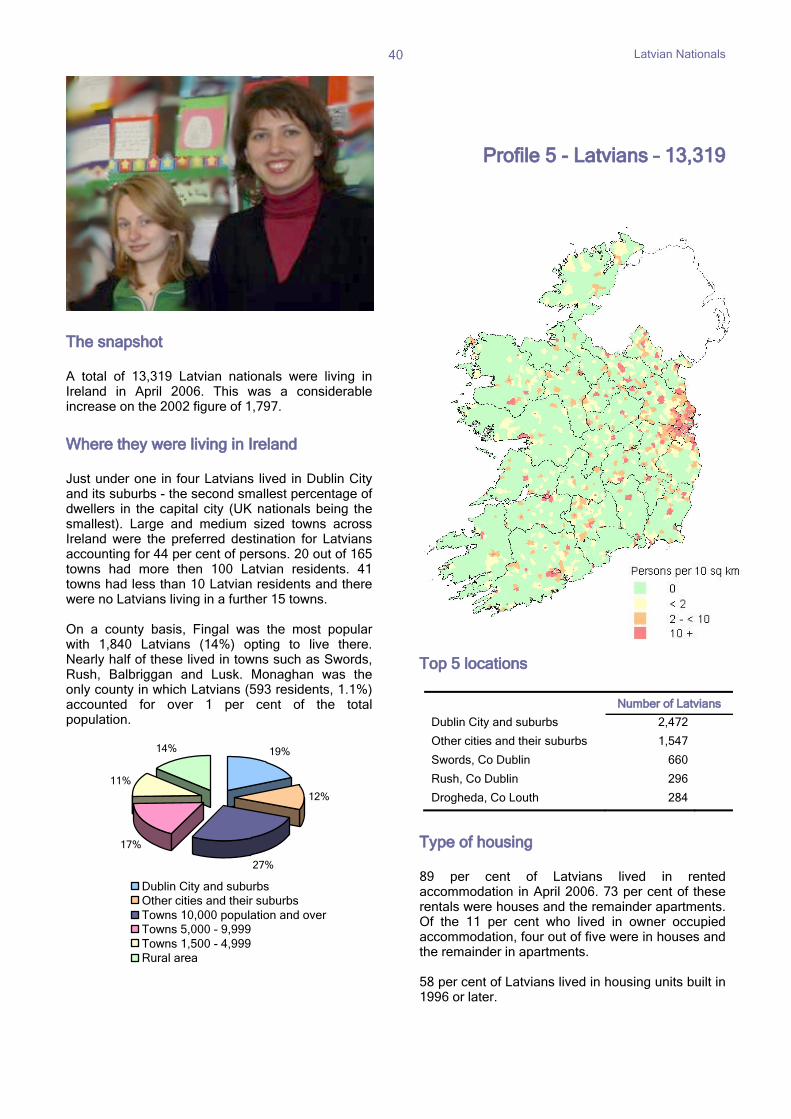
The snapshot A total of 13,319 Latvian nationals were living in Ireland in April 2006. This was a considerable increase on the 2002 figure of 1,797.
Where they were living in Ireland Just under one in four Latvians lived in Dublin City and its suburbs - the second smallest percentage of dwellers in the capital city (UK nationals being the smallest). Large and medium sized towns across Ireland were the preferred destination for Latvians accounting for 44 per cent of persons. 20 out of 165 towns had more then 100 Latvian residents. 41 towns had less than 10 Latvian residents and there were no Latvians living in a further 15 towns. On a county basis, Fingal was the most popular with 1,840 Latvians (14%) opting to live there. Nearly half of these lived in towns such as Swords, Rush, Balbriggan and Lusk. Monaghan was the only county in which Latvians (593 residents, 1.1%) accounted for over 1 per cent of the total population.
Profile 5 - Latvians – 13,319 Top 5 locations
Type of housing 89 per cent of Latvians lived in rented accommodation in April 2006. 73 per cent of these rentals were houses and the remainder apartments. Of the 11 per cent who lived in owner occupied accommodation, four out of five were in houses and the remainder in apartments. 58 per cent of Latvians lived in housing units built in 1996 or later.
Number of Latvians
Dublin City and suburbs 2,472 Other cities and their suburbs 1,547 Swords, Co Dublin 660 Rush, Co Dublin 296 Drogheda, Co Louth 284
19%
12%
27%
17%
11%
14%
Dublin City and suburbsOther cities and their suburbsTowns 10,000 population and overTowns 5,000 - 9,999Towns 1,500 - 4,999Rural area
Latvian Nationals
41
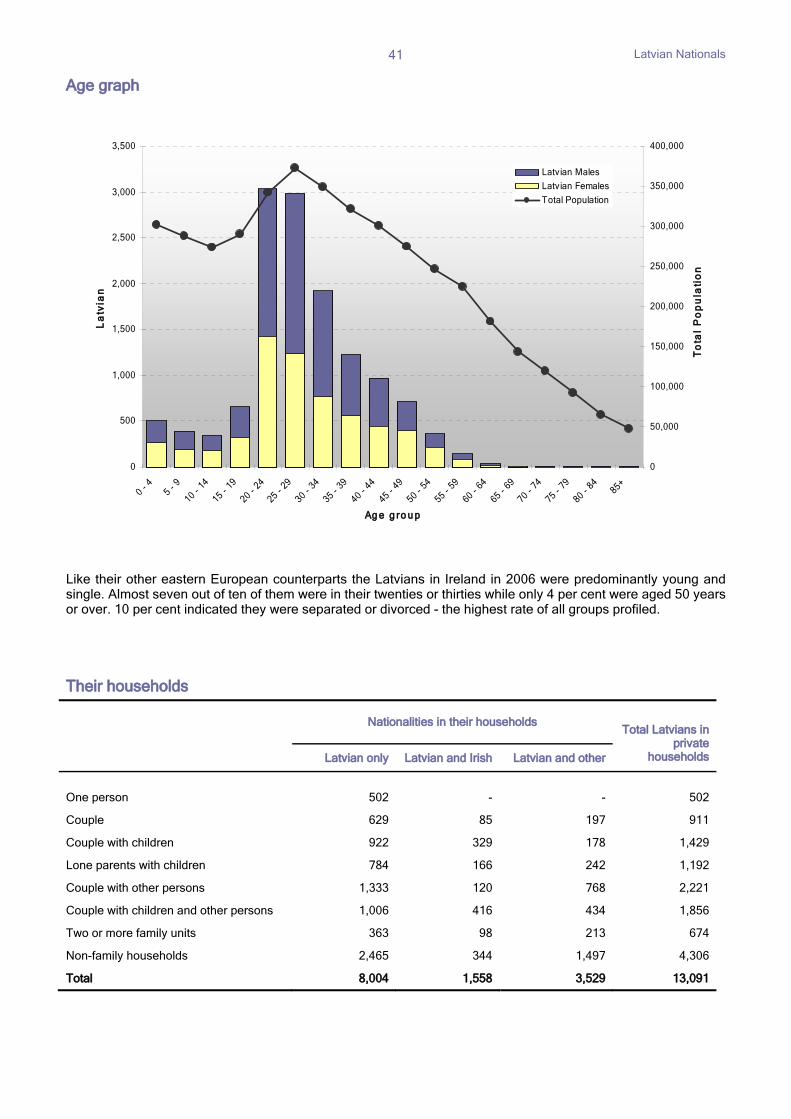
Age graph
Like their other eastern European counterparts the Latvians in Ireland in 2006 were predominantly young and single. Almost seven out of ten of them were in their twenties or thirties while only 4 per cent were aged 50 years or over. 10 per cent indicated they were separated or divorced - the highest rate of all groups profiled. Their households
Nationalities in their households
Total Latvians in private
households Latvian only Latvian and Irish Latvian and other
One person 502 - - 502
Couple 629 85 197 911
Couple with children 922 329 178 1,429
Lone parents with children 784 166 242 1,192
Couple with other persons 1,333 120 768 2,221
Couple with children and other persons 1,006 416 434 1,856
Two or more family units 363 98 213 674
Non-family households 2,465 344 1,497 4,306
Total 8,004 1,558 3,529 13,091
0
500
1,000
1,500
2,000
2,500
3,000
3,500
0 -
4
5 -
9
10 - 14
15 - 19
20 - 24
25 - 29
30 - 34
35 - 39
40 - 44
45 - 49
50 - 54
55 - 59
60 - 64
65 - 69
70 - 74
75 - 79
80 - 84
85+
Ag e g ro u p
La
tvia
n
0
50,000
100,000
150,000
200,000
250,000
300,000
350,000
400,000
To
tal
Po
pu
lati
on
Latvian Males
Latvian Females
Total Population
Latvian Nationals
42
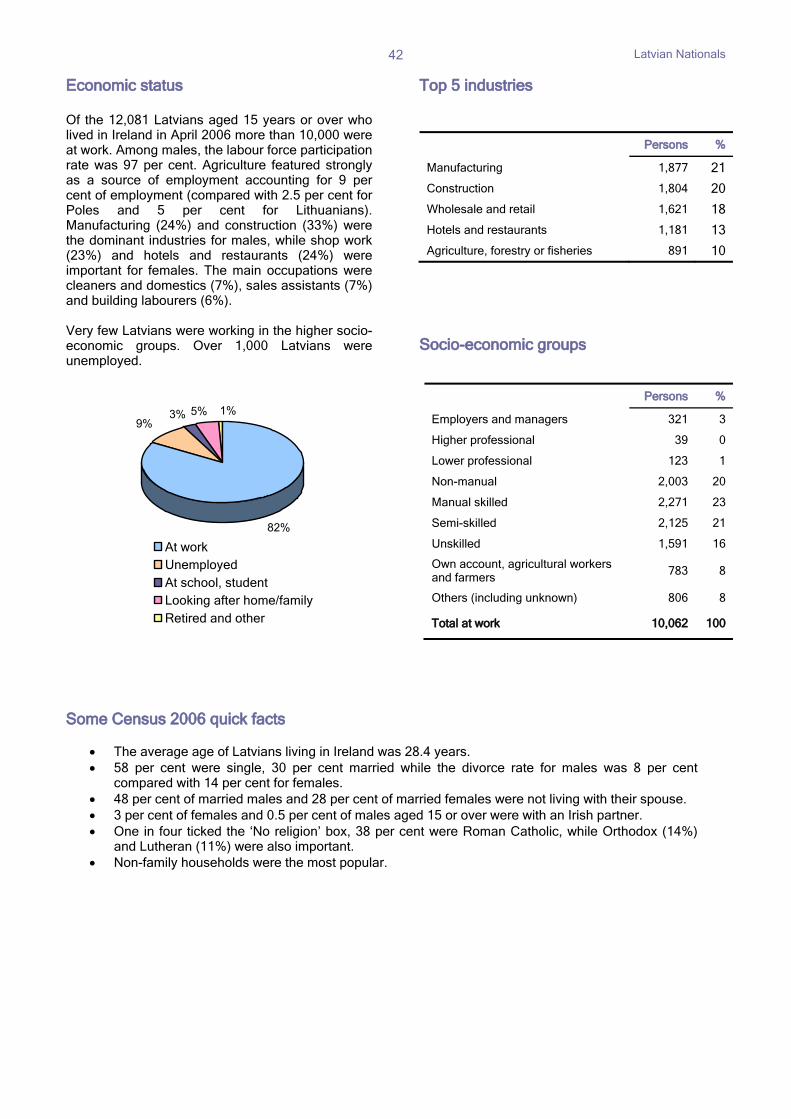
Economic status Of the 12,081 Latvians aged 15 years or over who lived in Ireland in April 2006 more than 10,000 were at work. Among males, the labour force participation rate was 97 per cent. Agriculture featured strongly as a source of employment accounting for 9 per cent of employment (compared with 2.5 per cent for Poles and 5 per cent for Lithuanians). Manufacturing (24%) and construction (33%) were the dominant industries for males, while shop work (23%) and hotels and restaurants (24%) were important for females. The main occupations were cleaners and domestics (7%), sales assistants (7%) and building labourers (6%). Very few Latvians were working in the higher socio-economic groups. Over 1,000 Latvians were unemployed.
Top 5 industries
Socio-economic groups
Some Census 2006 quick facts
• The average age of Latvians living in Ireland was 28.4 years. • 58 per cent were single, 30 per cent married while the divorce rate for males was 8 per cent
compared with 14 per cent for females. • 48 per cent of married males and 28 per cent of married females were not living with their spouse. • 3 per cent of females and 0.5 per cent of males aged 15 or over were with an Irish partner. • One in four ticked the ‘No religion’ box, 38 per cent were Roman Catholic, while Orthodox (14%)
and Lutheran (11%) were also important. • Non-family households were the most popular.
Persons %
Manufacturing 1,877 21
Construction 1,804 20
Wholesale and retail 1,621 18
Hotels and restaurants 1,181 13
Agriculture, forestry or fisheries 891 10
Persons %
Employers and managers 321 3
Higher professional 39 0
Lower professional 123 1
Non-manual 2,003 20
Manual skilled 2,271 23
Semi-skilled 2,125 21
Unskilled 1,591 16
Own account, agricultural workers and farmers
783 8
Others (including unknown) 806 8
Total at work 10,062 100
82%
3% 5% 1%9%
At workUnemployedAt school, studentLooking after home/familyRetired and other
Latvian Nationals
43
Number with a third level qualification by subject
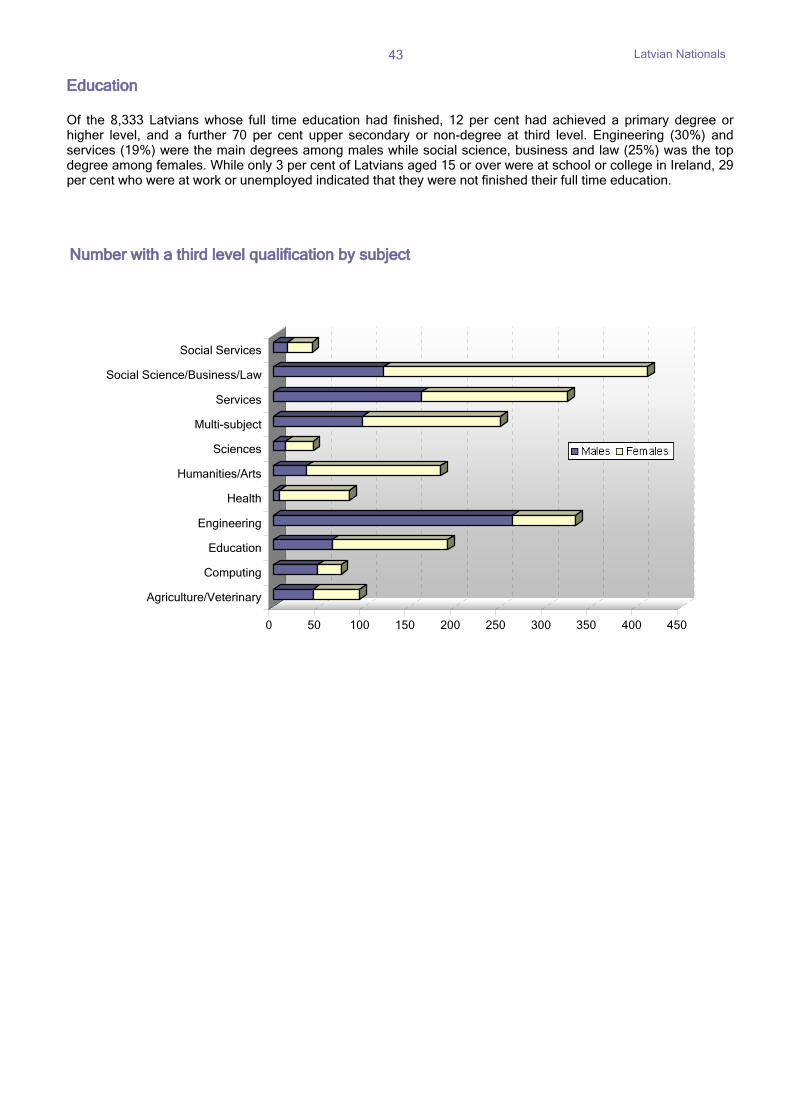
Education Of the 8,333 Latvians whose full time education had finished, 12 per cent had achieved a primary degree or higher level, and a further 70 per cent upper secondary or non-degree at third level. Engineering (30%) and services (19%) were the main degrees among males while social science, business and law (25%) was the top degree among females. While only 3 per cent of Latvians aged 15 or over were at school or college in Ireland, 29 per cent who were at work or unemployed indicated that they were not finished their full time education.
0 50 100 150 200 250 300 350 400 450
Agriculture/Veterinary
Computing
Education
Engineering
Health
Humanities/Arts
Sciences
Multi-subject
Services
Social Science/Business/Law
Social Services
US Nationals
44
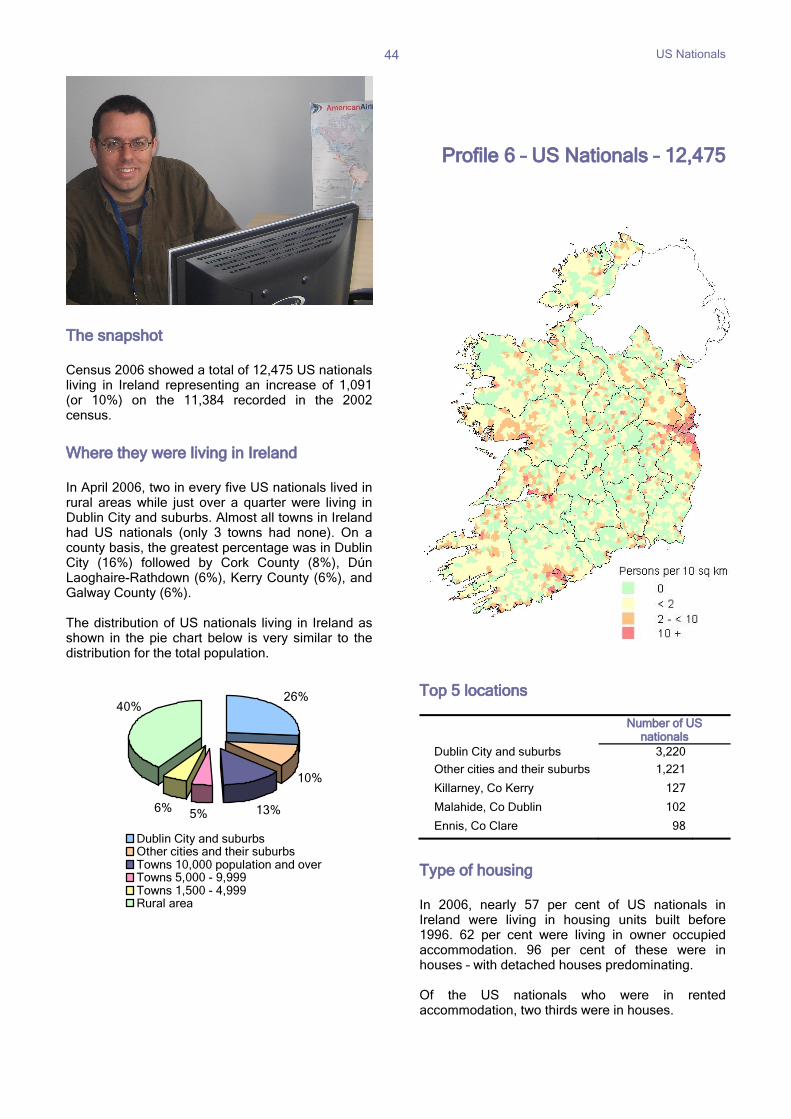
The snapshot Census 2006 showed a total of 12,475 US nationals living in Ireland representing an increase of 1,091 (or 10%) on the 11,384 recorded in the 2002 census.
Where they were living in Ireland In April 2006, two in every five US nationals lived in rural areas while just over a quarter were living in Dublin City and suburbs. Almost all towns in Ireland had US nationals (only 3 towns had none). On a county basis, the greatest percentage was in Dublin City (16%) followed by Cork County (8%), Dún Laoghaire-Rathdown (6%), Kerry County (6%), and Galway County (6%). The distribution of US nationals living in Ireland as shown in the pie chart below is very similar to the distribution for the total population.
Profile 6 – US Nationals – 12,475 Top 5 locations
Number of US nationals
Dublin City and suburbs 3,220
Other cities and their suburbs 1,221
Killarney, Co Kerry 127
Malahide, Co Dublin 102
Ennis, Co Clare 98
Type of housing In 2006, nearly 57 per cent of US nationals in Ireland were living in housing units built before 1996. 62 per cent were living in owner occupied accommodation. 96 per cent of these were in houses – with detached houses predominating. Of the US nationals who were in rented accommodation, two thirds were in houses.
26%
10%
13%5%6%
40%
Dublin City and suburbsOther cities and their suburbsTowns 10,000 population and overTowns 5,000 - 9,999Towns 1,500 - 4,999Rural area
US Nationals
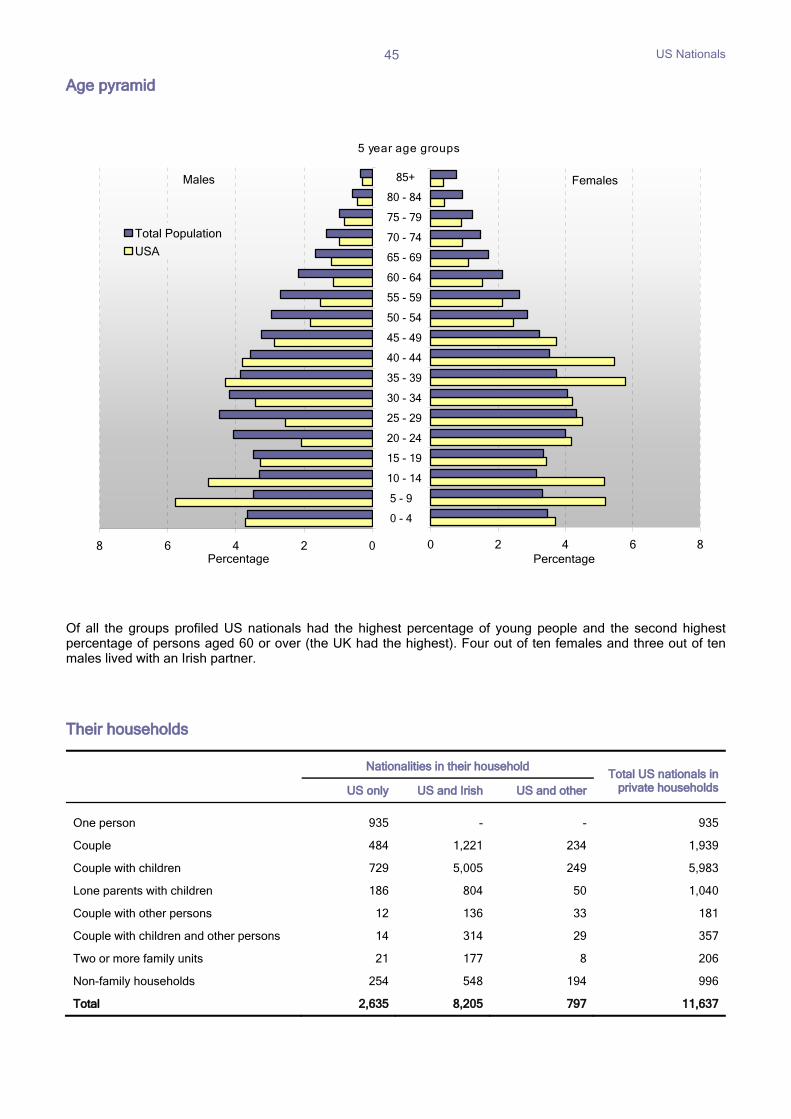
45
Age pyramid
Of all the groups profiled US nationals had the highest percentage of young people and the second highest percentage of persons aged 60 or over (the UK had the highest). Four out of ten females and three out of ten males lived with an Irish partner. Their households
Nationalities in their householdTotal US nationals in
private households US only US and Irish US and other
One person 935 - - 935
Couple 484 1,221 234 1,939
Couple with children 729 5,005 249 5,983
Lone parents with children 186 804 50 1,040
Couple with other persons 12 136 33 181
Couple with children and other persons 14 314 29 357
Two or more family units 21 177 8 206
Non-family households 254 548 194 996
Total 2,635 8,205 797 11,637
0 2 4 6 8
0 - 4
5 - 9
10 - 14
15 - 19
20 - 24
25 - 29
30 - 34
35 - 39
40 - 44
45 - 49
50 - 54
55 - 59
60 - 64
65 - 69
70 - 74
75 - 79
80 - 84
85+
Percentage
Females
8 6 4 2 0
0 - 4
5 - 9
10 - 14
15 - 19
20 - 24
25 - 29
30 - 34
35 - 39
40 - 44
45 - 49
50 - 54
55 - 59
60 - 64
65 - 69
70 - 74
75 - 79
80 - 84
85+
Percentage
Total Population
USA
Males
5 year age groups
US Nationals
46
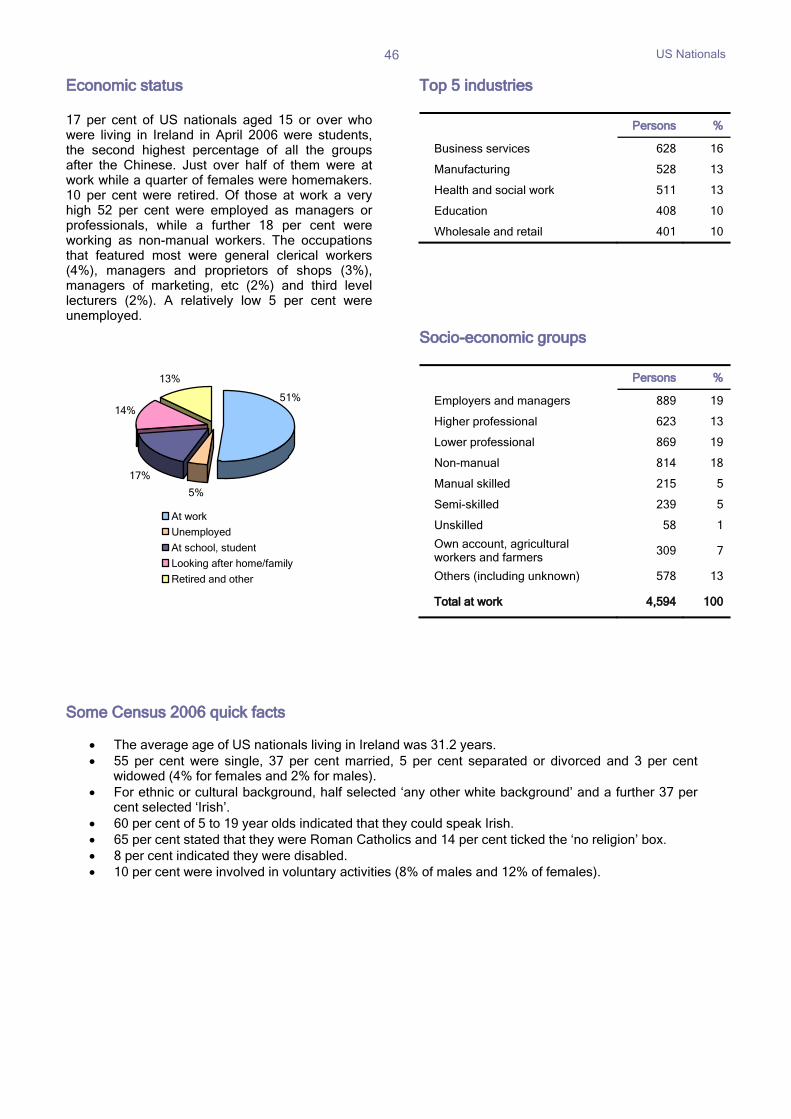
Economic status 17 per cent of US nationals aged 15 or over who were living in Ireland in April 2006 were students, the second highest percentage of all the groups after the Chinese. Just over half of them were at work while a quarter of females were homemakers. 10 per cent were retired. Of those at work a very high 52 per cent were employed as managers or professionals, while a further 18 per cent were working as non-manual workers. The occupations that featured most were general clerical workers (4%), managers and proprietors of shops (3%), managers of marketing, etc (2%) and third level lecturers (2%). A relatively low 5 per cent were unemployed.
Top 5 industries
Persons %
Business services 628 16
Manufacturing 528 13
Health and social work 511 13
Education 408 10
Wholesale and retail 401 10
Socio-economic groups
Persons %
Employers and managers 889 19
Higher professional 623 13
Lower professional 869 19
Non-manual 814 18
Manual skilled 215 5
Semi-skilled 239 5
Unskilled 58 1
Own account, agricultural workers and farmers
309 7
Others (including unknown) 578 13
Total at work 4,594 100
Some Census 2006 quick facts
• The average age of US nationals living in Ireland was 31.2 years. • 55 per cent were single, 37 per cent married, 5 per cent separated or divorced and 3 per cent
widowed (4% for females and 2% for males). • For ethnic or cultural background, half selected ‘any other white background’ and a further 37 per
cent selected ‘Irish’. • 60 per cent of 5 to 19 year olds indicated that they could speak Irish. • 65 per cent stated that they were Roman Catholics and 14 per cent ticked the ‘no religion’ box. • 8 per cent indicated they were disabled. • 10 per cent were involved in voluntary activities (8% of males and 12% of females).
17%
14%
13%
5%
51%
At work
Unemployed
At school, student
Looking after home/family
Retired and other
US Nationals
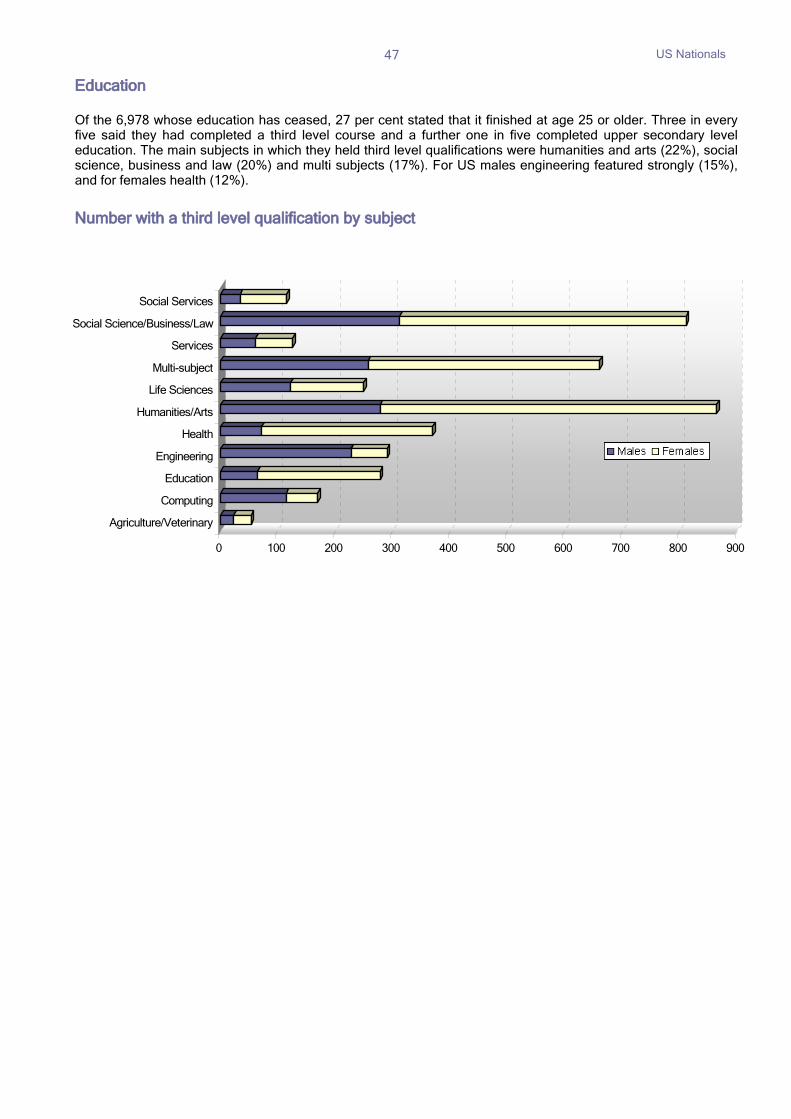
47
Education Of the 6,978 whose education has ceased, 27 per cent stated that it finished at age 25 or older. Three in every five said they had completed a third level course and a further one in five completed upper secondary level education. The main subjects in which they held third level qualifications were humanities and arts (22%), social science, business and law (20%) and multi subjects (17%). For US males engineering featured strongly (15%), and for females health (12%).
Number with a third level qualification by subject
0 100 200 300 400 500 600 700 800 900
Agriculture/Veterinary
Computing
Education
Engineering
Health
Humanities/Arts
Life Sciences
Multi-subject
Services
Social Science/Business/Law
Social Services
Chinese Nationals
48
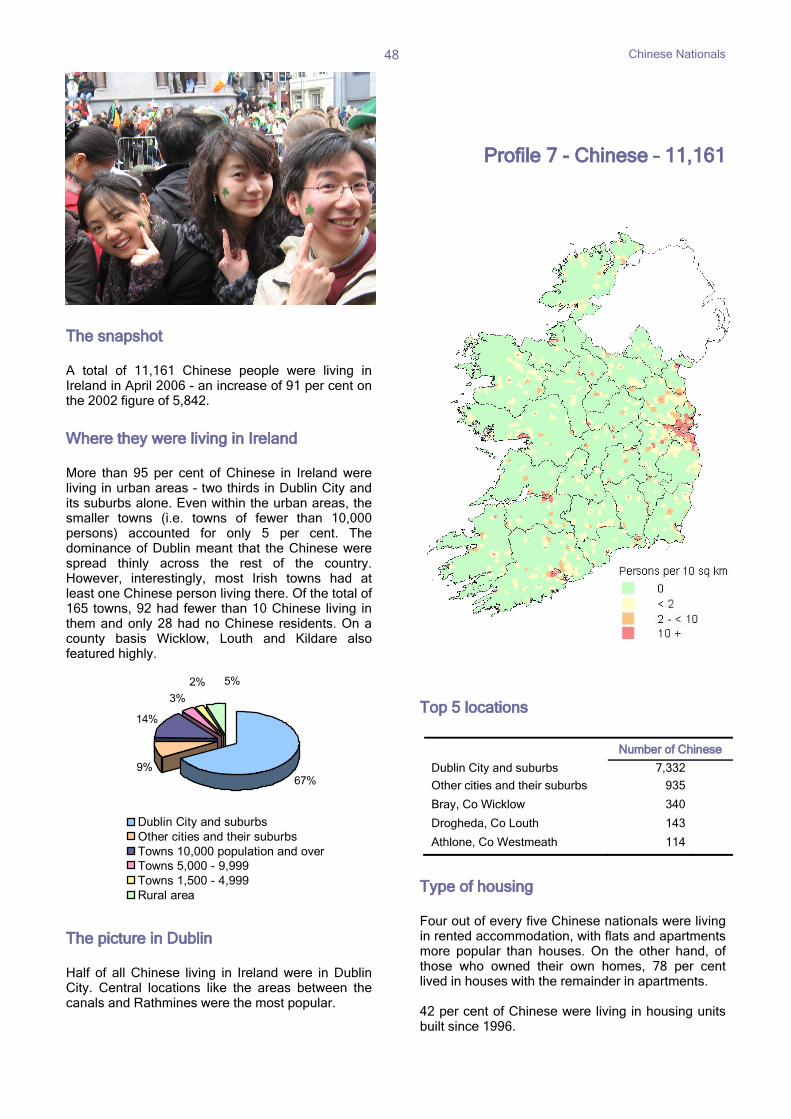
The snapshot A total of 11,161 Chinese people were living in Ireland in April 2006 - an increase of 91 per cent on the 2002 figure of 5,842.
Where they were living in Ireland More than 95 per cent of Chinese in Ireland were living in urban areas – two thirds in Dublin City and its suburbs alone. Even within the urban areas, the smaller towns (i.e. towns of fewer than 10,000 persons) accounted for only 5 per cent. The dominance of Dublin meant that the Chinese were spread thinly across the rest of the country. However, interestingly, most Irish towns had at least one Chinese person living there. Of the total of 165 towns, 92 had fewer than 10 Chinese living in them and only 28 had no Chinese residents. On a county basis Wicklow, Louth and Kildare also featured highly. The picture in Dublin Half of all Chinese living in Ireland were in Dublin City. Central locations like the areas between the canals and Rathmines were the most popular.
Profile 7 - Chinese – 11,161 Top 5 locations
Type of housing Four out of every five Chinese nationals were living in rented accommodation, with flats and apartments more popular than houses. On the other hand, of those who owned their own homes, 78 per cent lived in houses with the remainder in apartments. 42 per cent of Chinese were living in housing units built since 1996.
Number of Chinese Dublin City and suburbs 7,332
Other cities and their suburbs 935
Bray, Co Wicklow 340
Drogheda, Co Louth 143
Athlone, Co Westmeath 114
67%9%
14%
3%2% 5%
Dublin City and suburbsOther cities and their suburbsTowns 10,000 population and overTowns 5,000 - 9,999 Towns 1,500 - 4,999 Rural area
Chinese Nationals
49
Age graph
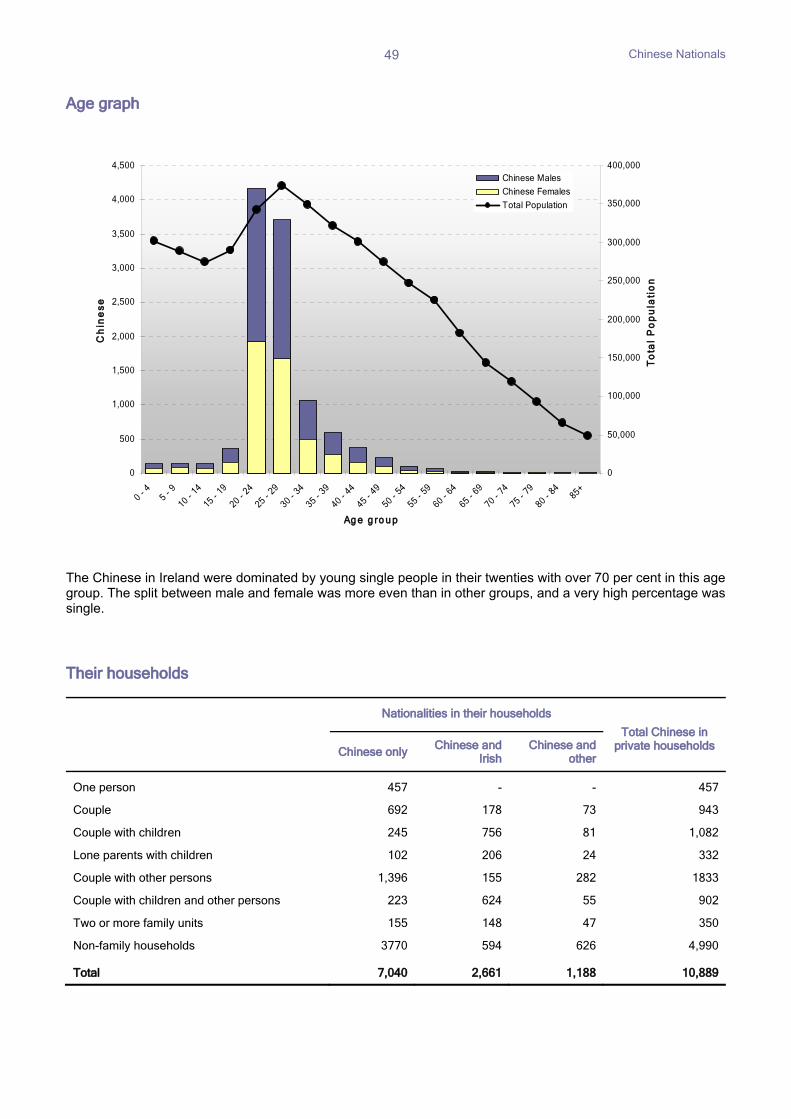
The Chinese in Ireland were dominated by young single people in their twenties with over 70 per cent in this age group. The split between male and female was more even than in other groups, and a very high percentage was single.
Their households
Nationalities in their households
Total Chinese in private households
Chinese only Chinese and
Irish Chinese and
other
One person 457 - - 457
Couple 692 178 73 943
Couple with children 245 756 81 1,082
Lone parents with children 102 206 24 332
Couple with other persons 1,396 155 282 1833
Couple with children and other persons 223 624 55 902
Two or more family units 155 148 47 350
Non-family households 3770 594 626 4,990
Total 7,040 2,661 1,188 10,889
0
500
1,000
1,500
2,000
2,500
3,000
3,500
4,000
4,500
0 -
4
5 -
9
10 - 14
15 - 19
20 - 24
25 - 29
30 - 34
35 - 39
40 - 44
45 - 49
50 - 54
55 - 59
60 - 64
65 - 69
70 - 74
75 - 79
80 - 84
85+
Ag e g ro u p
Ch
ine
se
0
50,000
100,000
150,000
200,000
250,000
300,000
350,000
400,000
To
tal
Po
pu
lati
on
Chinese Males
Chinese Females
Total Population
Chinese Nationals
50
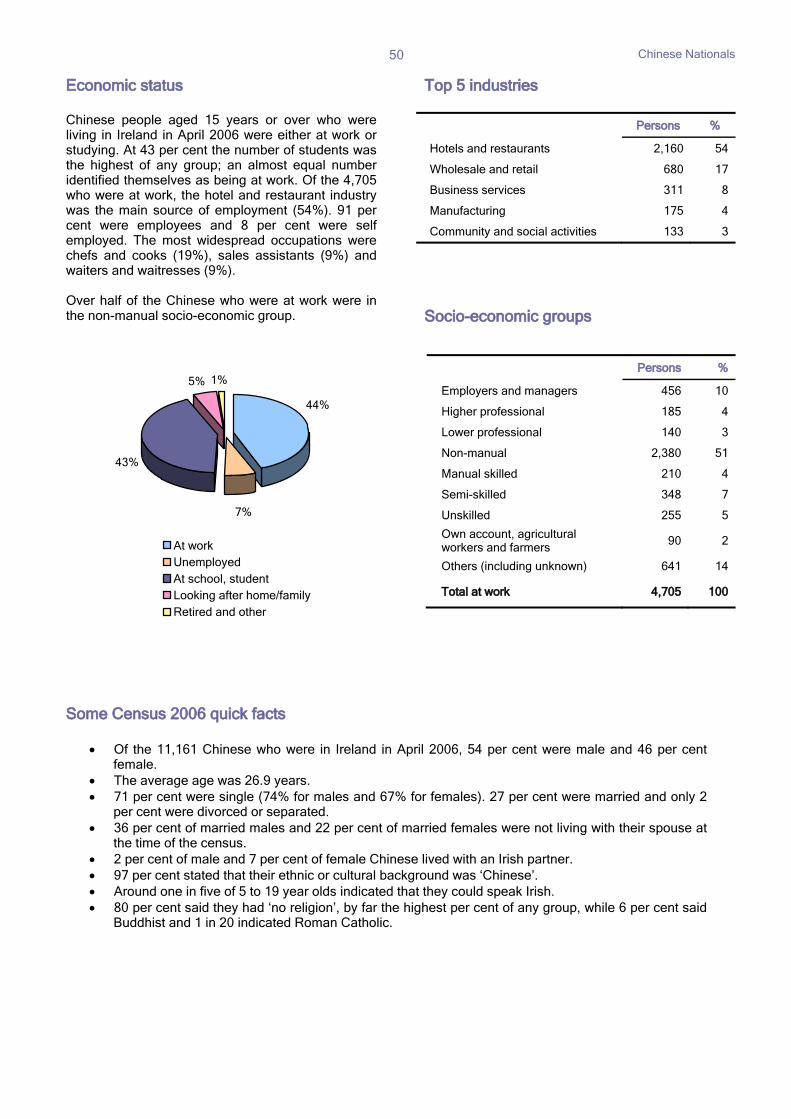
Economic status Chinese people aged 15 years or over who were living in Ireland in April 2006 were either at work or studying. At 43 per cent the number of students was the highest of any group; an almost equal number identified themselves as being at work. Of the 4,705 who were at work, the hotel and restaurant industry was the main source of employment (54%). 91 per cent were employees and 8 per cent were self employed. The most widespread occupations were chefs and cooks (19%), sales assistants (9%) and waiters and waitresses (9%). Over half of the Chinese who were at work were in the non-manual socio-economic group.
Top 5 industries
Socio-economic groups
Some Census 2006 quick facts
• Of the 11,161 Chinese who were in Ireland in April 2006, 54 per cent were male and 46 per cent female.
• The average age was 26.9 years. • 71 per cent were single (74% for males and 67% for females). 27 per cent were married and only 2
per cent were divorced or separated. • 36 per cent of married males and 22 per cent of married females were not living with their spouse at
the time of the census. • 2 per cent of male and 7 per cent of female Chinese lived with an Irish partner. • 97 per cent stated that their ethnic or cultural background was ‘Chinese’. • Around one in five of 5 to 19 year olds indicated that they could speak Irish. • 80 per cent said they had ‘no religion’, by far the highest per cent of any group, while 6 per cent said
Buddhist and 1 in 20 indicated Roman Catholic.
Persons %
Hotels and restaurants 2,160 54
Wholesale and retail 680 17
Business services 311 8
Manufacturing 175 4
Community and social activities 133 3
Persons %
Employers and managers 456 10
Higher professional 185 4
Lower professional 140 3
Non-manual 2,380 51
Manual skilled 210 4
Semi-skilled 348 7
Unskilled 255 5
Own account, agricultural workers and farmers
90 2
Others (including unknown) 641 14
Total at work 4,705 100
43%
5% 1%
44%
7%
At workUnemployedAt school, studentLooking after home/familyRetired and other
Chinese Nationals
51
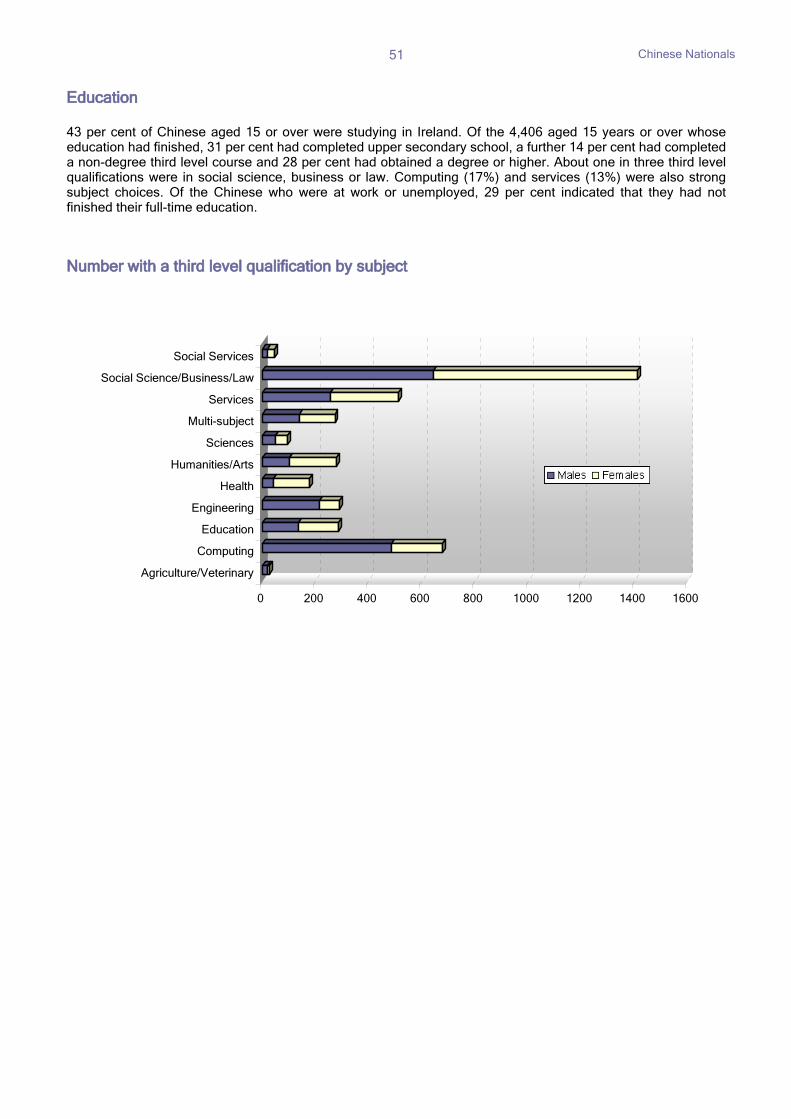
Education 43 per cent of Chinese aged 15 or over were studying in Ireland. Of the 4,406 aged 15 years or over whose education had finished, 31 per cent had completed upper secondary school, a further 14 per cent had completed a non-degree third level course and 28 per cent had obtained a degree or higher. About one in three third level qualifications were in social science, business or law. Computing (17%) and services (13%) were also strong subject choices. Of the Chinese who were at work or unemployed, 29 per cent indicated that they had not finished their full-time education.
Number with a third level qualification by subject
0 200 400 600 800 1000 1200 1400 1600
Agriculture/Veterinary
Computing
Education
Engineering
Health
Humanities/Arts
Sciences
Multi-subject
Services
Social Science/Business/Law
Social Services
German Nationals
52
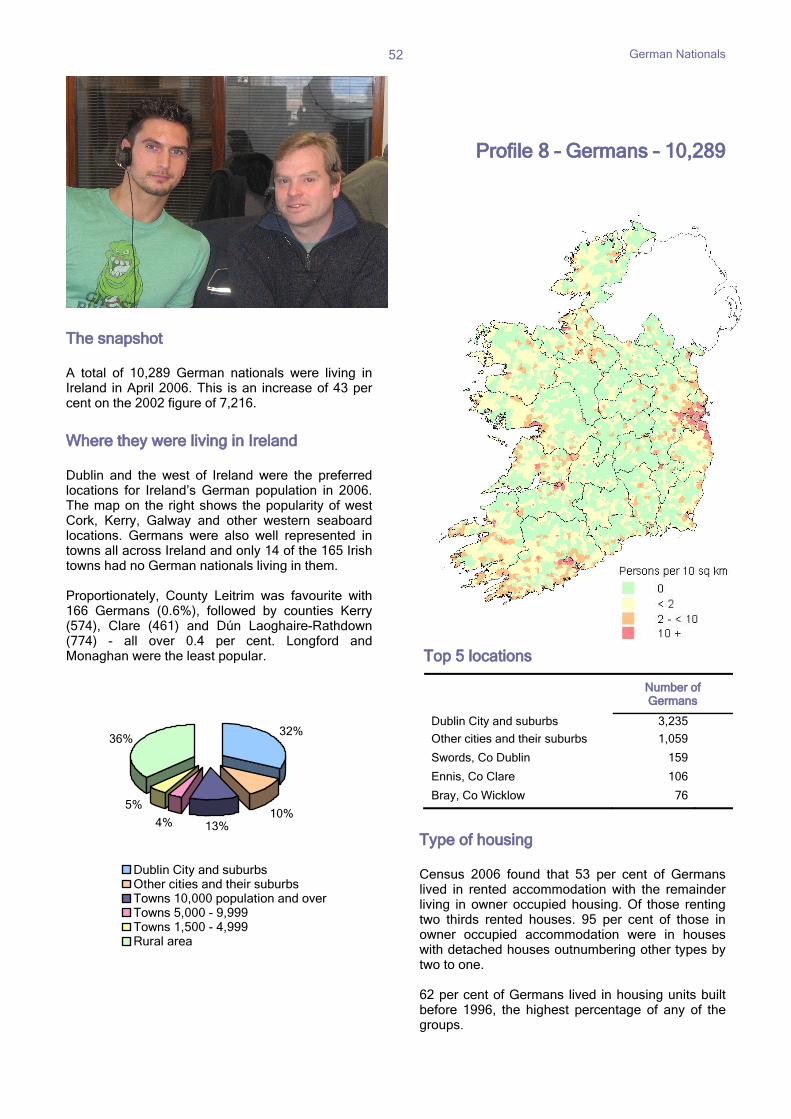
The snapshot A total of 10,289 German nationals were living in Ireland in April 2006. This is an increase of 43 per cent on the 2002 figure of 7,216.
Where they were living in Ireland Dublin and the west of Ireland were the preferred locations for Ireland’s German population in 2006. The map on the right shows the popularity of west Cork, Kerry, Galway and other western seaboard locations. Germans were also well represented in towns all across Ireland and only 14 of the 165 Irish towns had no German nationals living in them. Proportionately, County Leitrim was favourite with 166 Germans (0.6%), followed by counties Kerry (574), Clare (461) and Dún Laoghaire-Rathdown (774) - all over 0.4 per cent. Longford and Monaghan were the least popular.
Profile 8 – Germans – 10,289 Top 5 locations
Type of housing Census 2006 found that 53 per cent of Germans lived in rented accommodation with the remainder living in owner occupied housing. Of those renting two thirds rented houses. 95 per cent of those in owner occupied accommodation were in houses with detached houses outnumbering other types by two to one. 62 per cent of Germans lived in housing units built before 1996, the highest percentage of any of the groups.
Number of Germans
Dublin City and suburbs 3,235
Other cities and their suburbs 1,059
Swords, Co Dublin 159
Ennis, Co Clare 106
Bray, Co Wicklow 76
32%
10%13%4%
36%
5%
Dublin City and suburbsOther cities and their suburbsTowns 10,000 population and overTowns 5,000 - 9,999 Towns 1,500 - 4,999 Rural area
German Nationals
53
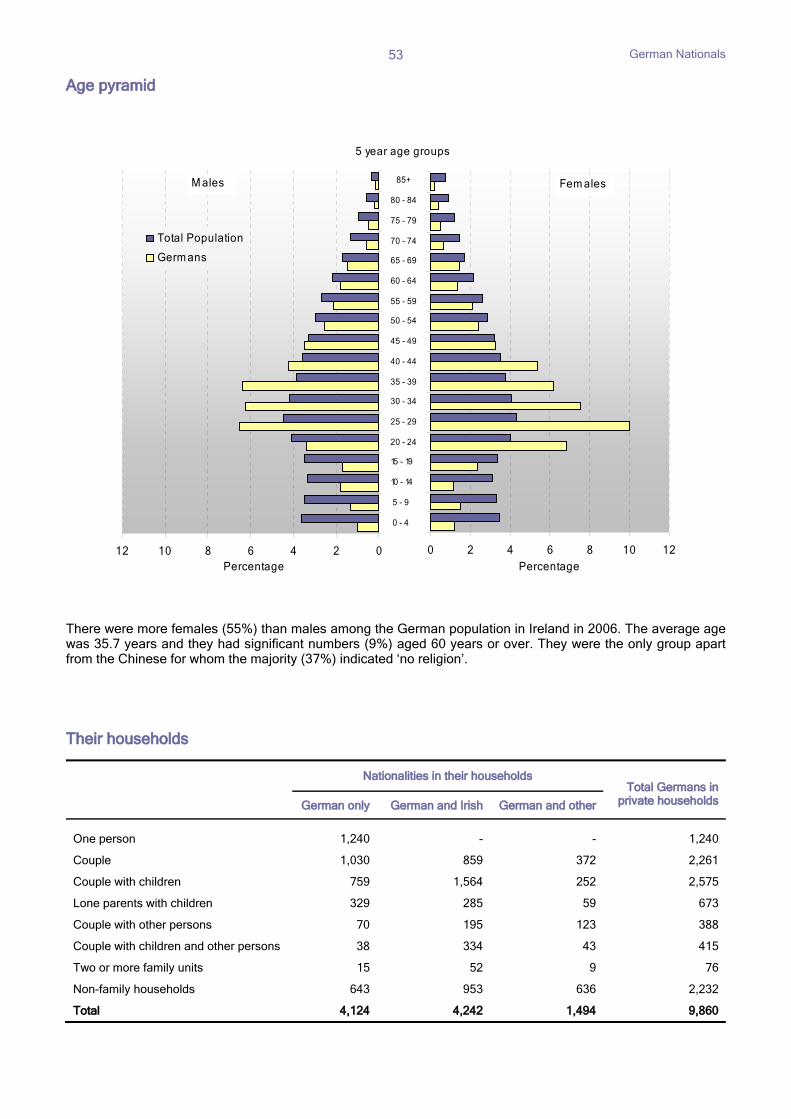
Age pyramid There were more females (55%) than males among the German population in Ireland in 2006. The average age was 35.7 years and they had significant numbers (9%) aged 60 years or over. They were the only group apart from the Chinese for whom the majority (37%) indicated ‘no religion’.
Their households
Nationalities in their householdsTotal Germans in
private households German only German and Irish German and other
One person 1,240 - - 1,240
Couple 1,030 859 372 2,261
Couple with children 759 1,564 252 2,575
Lone parents with children 329 285 59 673
Couple with other persons 70 195 123 388
Couple with children and other persons 38 334 43 415
Two or more family units 15 52 9 76
Non-family households 643 953 636 2,232
Total 4,124 4,242 1,494 9,860
0 2 4 6 8 10 12
0 - 4
10 - 14
20 - 24
30 - 24
40 - 44
50 - 54
60 - 64
70 - 74
80 - 84
Percentage
Fem ales
12 10 8 6 4 2 0
0 - 4
5 - 9
10 - 14
15 - 19
20 - 24
25 - 29
30 - 34
35 - 39
40 - 44
45 - 49
50 - 54
55 - 59
60 - 64
65 - 69
70 - 74
75 - 79
80 - 84
85+
Percentage
Total Population
Germ ans
M ales
5 year age groups
German Nationals
54
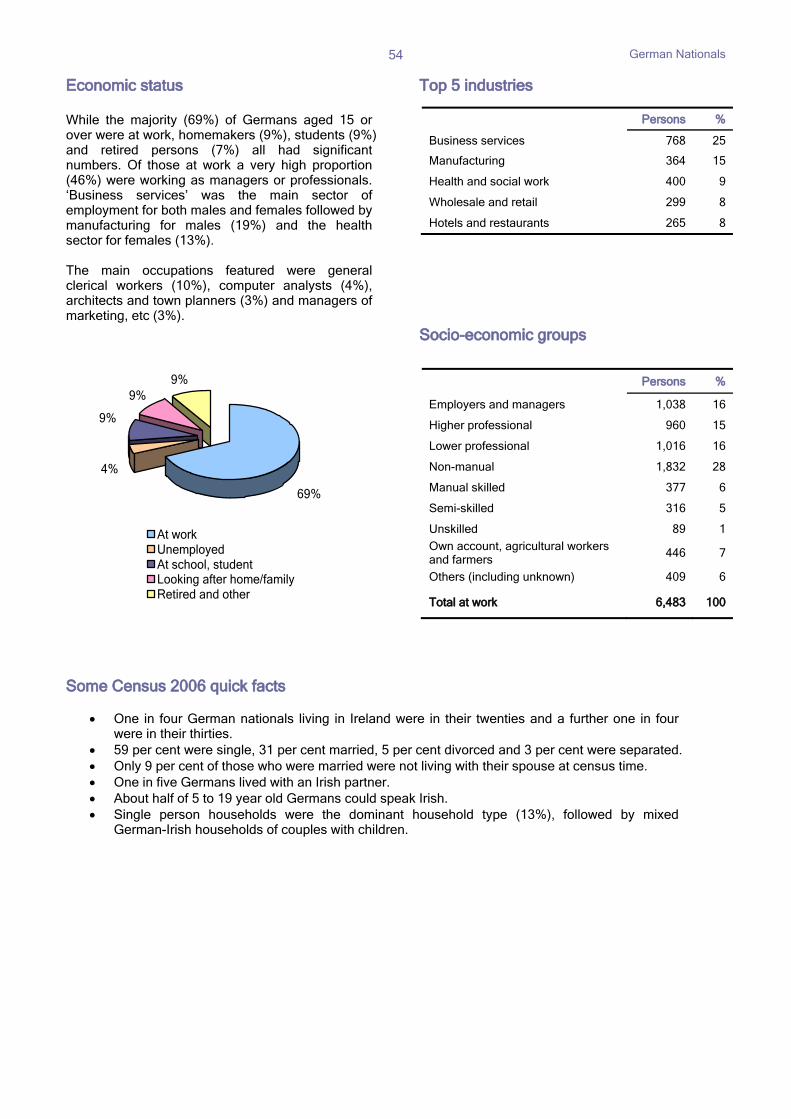
Economic status While the majority (69%) of Germans aged 15 or over were at work, homemakers (9%), students (9%) and retired persons (7%) all had significant numbers. Of those at work a very high proportion (46%) were working as managers or professionals. ‘Business services’ was the main sector of employment for both males and females followed by manufacturing for males (19%) and the health sector for females (13%). The main occupations featured were general clerical workers (10%), computer analysts (4%), architects and town planners (3%) and managers of marketing, etc (3%).
Top 5 industries
Socio-economic groups
Some Census 2006 quick facts
• One in four German nationals living in Ireland were in their twenties and a further one in four were in their thirties.
• 59 per cent were single, 31 per cent married, 5 per cent divorced and 3 per cent were separated. • Only 9 per cent of those who were married were not living with their spouse at census time. • One in five Germans lived with an Irish partner. • About half of 5 to 19 year old Germans could speak Irish. • Single person households were the dominant household type (13%), followed by mixed
German-Irish households of couples with children.
Persons %
Business services 768 25
Manufacturing 364 15
Health and social work 400 9
Wholesale and retail 299 8
Hotels and restaurants 265 8
Persons %
Employers and managers 1,038 16
Higher professional 960 15
Lower professional 1,016 16
Non-manual 1,832 28
Manual skilled 377 6
Semi-skilled 316 5
Unskilled 89 1
Own account, agricultural workers and farmers
446 7
Others (including unknown) 409 6
Total at work 6,483 100
9%9%
69%
4%
9%
At workUnemployedAt school, studentLooking after home/familyRetired and other
German Nationals
55
Number with a third level qualification by subject
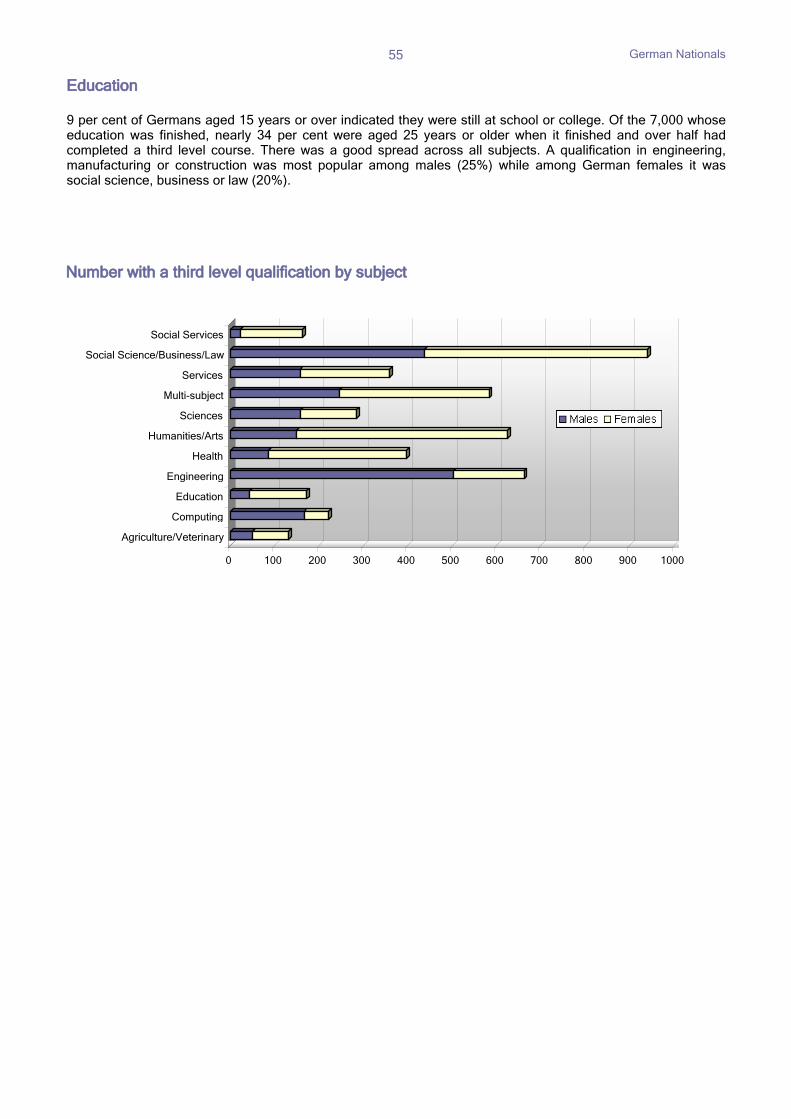
Education 9 per cent of Germans aged 15 years or over indicated they were still at school or college. Of the 7,000 whose education was finished, nearly 34 per cent were aged 25 years or older when it finished and over half had completed a third level course. There was a good spread across all subjects. A qualification in engineering, manufacturing or construction was most popular among males (25%) while among German females it was social science, business or law (20%).
0 100 200 300 400 500 600 700 800 900 1000
Agriculture/Veterinary Computing Education
Engineering Health
Humanities/Arts Sciences
Multi-subject
Services Social Science/Business/Law
Social Services
Filipino Nationals
56
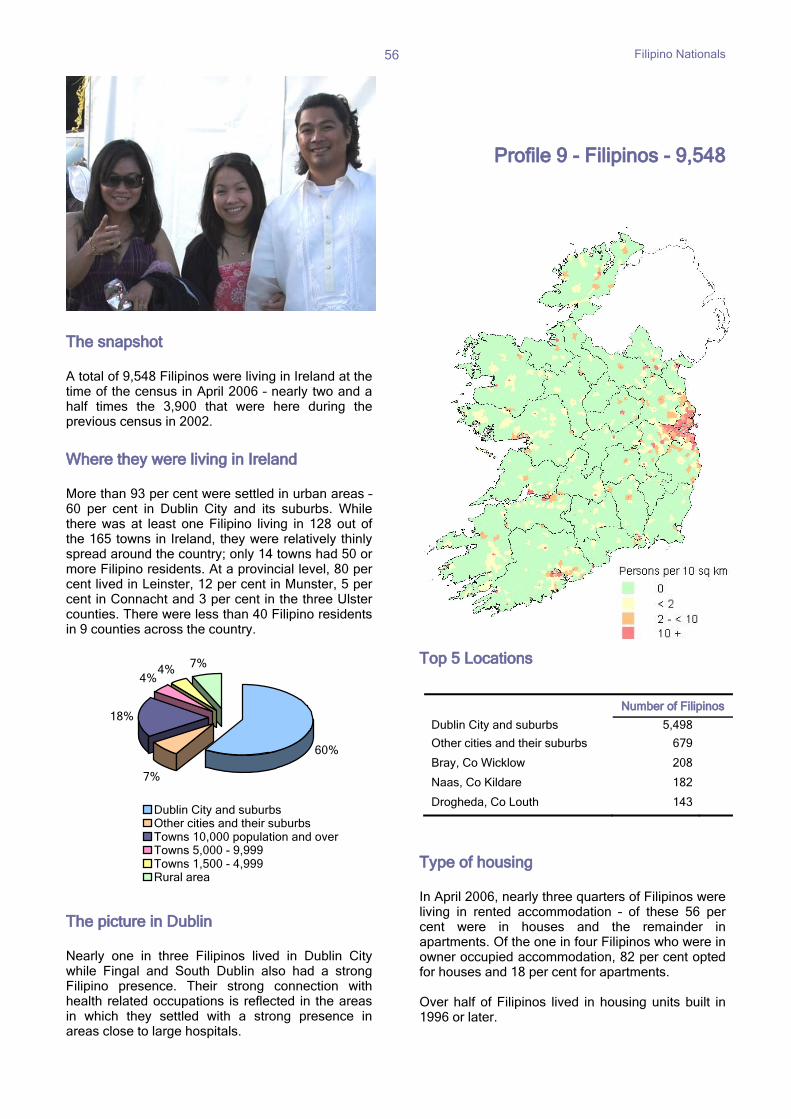
The snapshot A total of 9,548 Filipinos were living in Ireland at the time of the census in April 2006 – nearly two and a half times the 3,900 that were here during the previous census in 2002.
Where they were living in Ireland More than 93 per cent were settled in urban areas – 60 per cent in Dublin City and its suburbs. While there was at least one Filipino living in 128 out of the 165 towns in Ireland, they were relatively thinly spread around the country; only 14 towns had 50 or more Filipino residents. At a provincial level, 80 per cent lived in Leinster, 12 per cent in Munster, 5 per cent in Connacht and 3 per cent in the three Ulster counties. There were less than 40 Filipino residents in 9 counties across the country.
The picture in Dublin Nearly one in three Filipinos lived in Dublin City while Fingal and South Dublin also had a strong Filipino presence. Their strong connection with health related occupations is reflected in the areas in which they settled with a strong presence in areas close to large hospitals.
Profile 9 - Filipinos - 9,548
Top 5 Locations
Type of housing In April 2006, nearly three quarters of Filipinos were living in rented accommodation – of these 56 per cent were in houses and the remainder in apartments. Of the one in four Filipinos who were in owner occupied accommodation, 82 per cent opted for houses and 18 per cent for apartments. Over half of Filipinos lived in housing units built in 1996 or later.
Number of Filipinos
Dublin City and suburbs 5,498
Other cities and their suburbs 679
Bray, Co Wicklow 208
Naas, Co Kildare 182
Drogheda, Co Louth 143
60%
7%
18%
4%4% 7%
Dublin City and suburbsOther cities and their suburbsTowns 10,000 population and overTowns 5,000 - 9,999Towns 1,500 - 4,999Rural area
Filipino Nationals
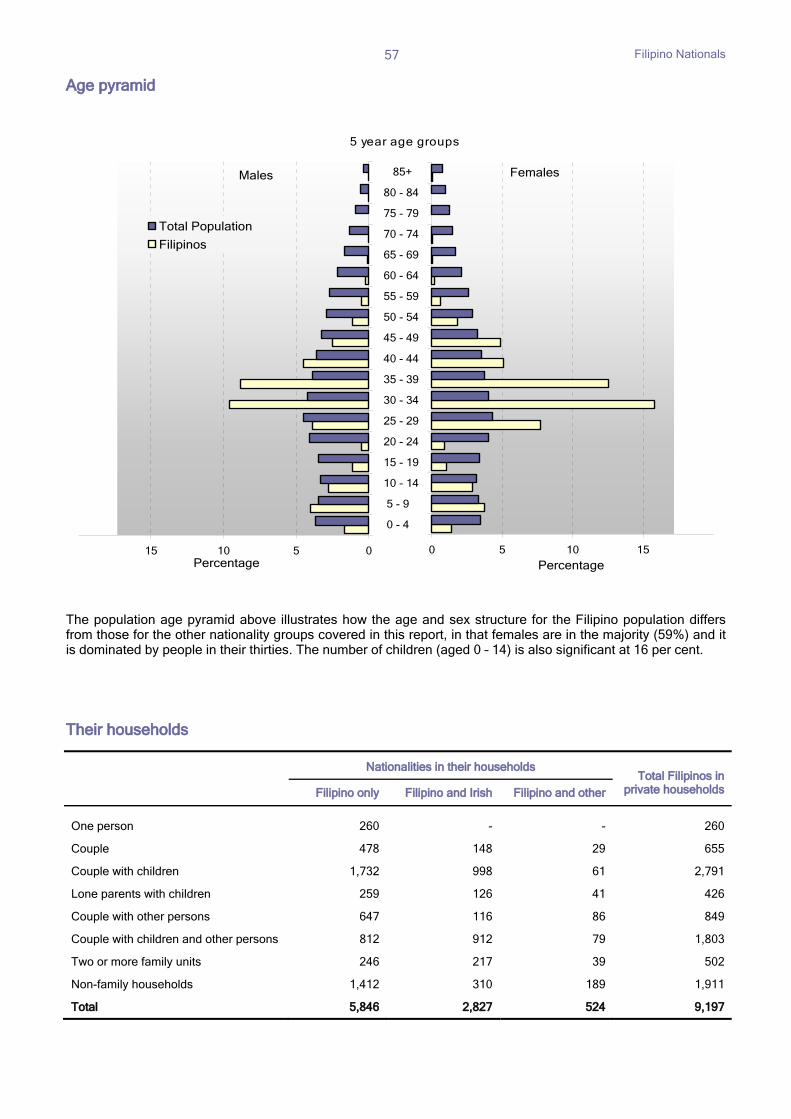
57
Age pyramid The population age pyramid above illustrates how the age and sex structure for the Filipino population differs from those for the other nationality groups covered in this report, in that females are in the majority (59%) and it is dominated by people in their thirties. The number of children (aged 0 – 14) is also significant at 16 per cent.
Their households
Nationalities in their householdsTotal Filipinos in
private households Filipino only Filipino and Irish Filipino and other
One person 260 - - 260
Couple 478 148 29 655
Couple with children 1,732 998 61 2,791
Lone parents with children 259 126 41 426
Couple with other persons 647 116 86 849
Couple with children and other persons 812 912 79 1,803
Two or more family units 246 217 39 502
Non-family households 1,412 310 189 1,911
Total 5,846 2,827 524 9,197
0 5 10 15
0 - 4
5 - 9
10 - 14
15 - 19
20 - 24
25 - 29
30 - 34
35 - 39
40 - 44
45 - 49
50 - 54
55 - 59
60 - 64
65 - 69
70 - 74
75 - 79
80 - 84
85+
Percentage
Females
15 10 5 0
0 - 4
5 - 9
10 - 14
15 - 19
20 - 24
25 - 29
30 - 34
35 - 39
40 - 44
45 - 49
50 - 54
55 - 59
60 - 64
65 - 69
70 - 74
75 - 79
80 - 84
85+
Percentage
Total Population
Filipinos
Males
5 year age groups
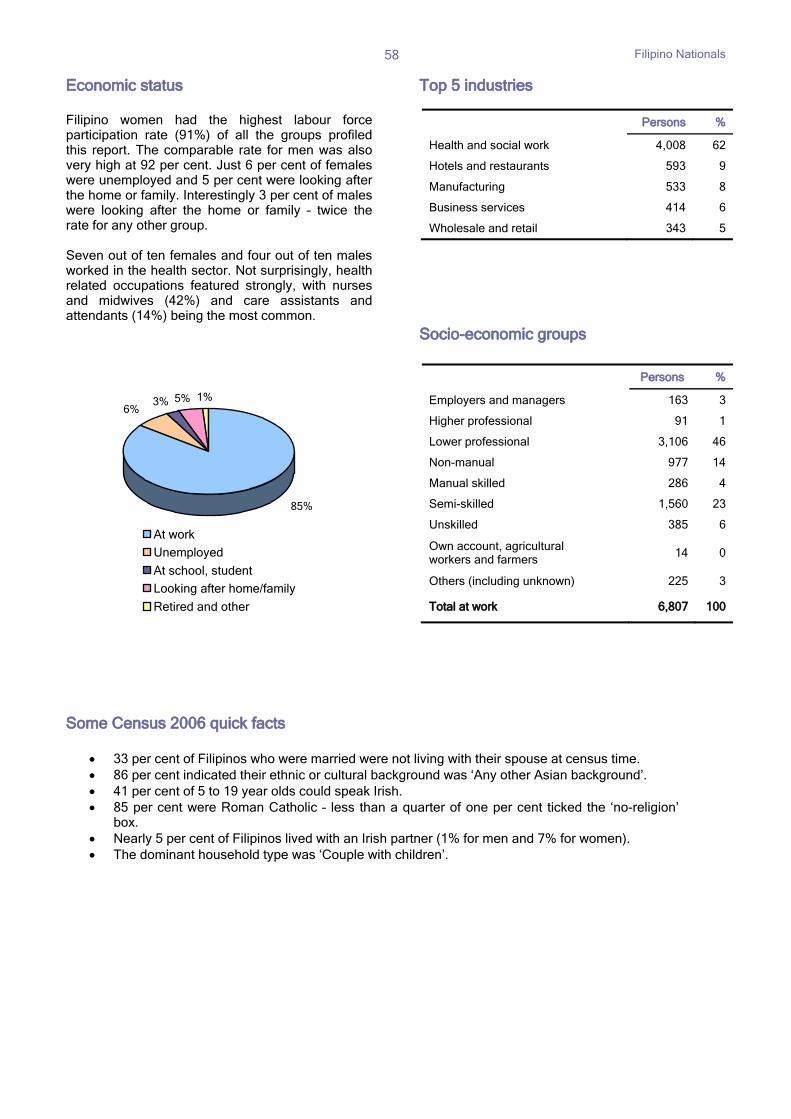
Filipino Nationals
58
Economic status Filipino women had the highest labour force participation rate (91%) of all the groups profiled this report. The comparable rate for men was also very high at 92 per cent. Just 6 per cent of females were unemployed and 5 per cent were looking after the home or family. Interestingly 3 per cent of males were looking after the home or family – twice the rate for any other group. Seven out of ten females and four out of ten males worked in the health sector. Not surprisingly, health related occupations featured strongly, with nurses and midwives (42%) and care assistants and attendants (14%) being the most common.
Top 5 industries
Socio-economic groups
Some Census 2006 quick facts
• 33 per cent of Filipinos who were married were not living with their spouse at census time. • 86 per cent indicated their ethnic or cultural background was ‘Any other Asian background’. • 41 per cent of 5 to 19 year olds could speak Irish. • 85 per cent were Roman Catholic – less than a quarter of one per cent ticked the ‘no-religion’
box. • Nearly 5 per cent of Filipinos lived with an Irish partner (1% for men and 7% for women). • The dominant household type was ‘Couple with children’.
Persons %
Health and social work 4,008 62
Hotels and restaurants 593 9
Manufacturing 533 8
Business services 414 6
Wholesale and retail 343 5
Persons %
Employers and managers 163 3
Higher professional 91 1
Lower professional 3,106 46
Non-manual 977 14
Manual skilled 286 4
Semi-skilled 1,560 23
Unskilled 385 6
Own account, agricultural workers and farmers
14 0
Others (including unknown) 225 3
Total at work 6,807 100
3% 5% 1%
85%
6%
At work
Unemployed
At school, student
Looking after home/family
Retired and other
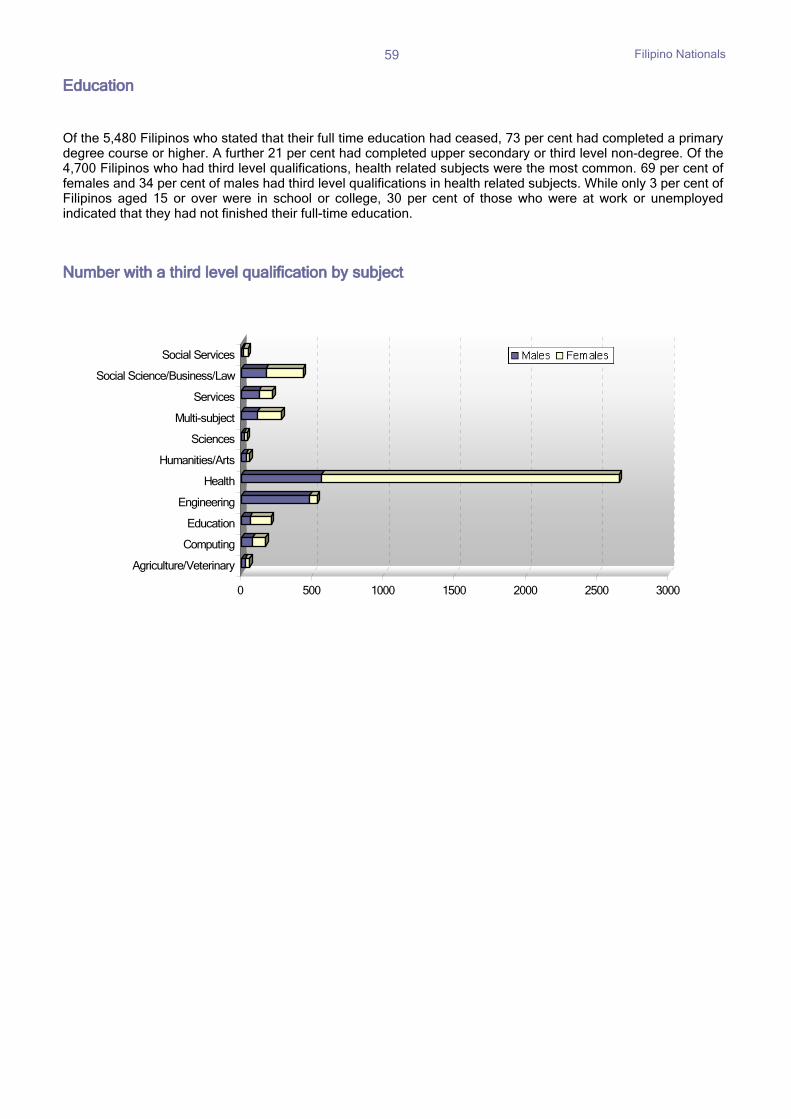
Filipino Nationals
59
Education Of the 5,480 Filipinos who stated that their full time education had ceased, 73 per cent had completed a primary degree course or higher. A further 21 per cent had completed upper secondary or third level non-degree. Of the 4,700 Filipinos who had third level qualifications, health related subjects were the most common. 69 per cent of females and 34 per cent of males had third level qualifications in health related subjects. While only 3 per cent of Filipinos aged 15 or over were in school or college, 30 per cent of those who were at work or unemployed indicated that they had not finished their full-time education.
Number with a third level qualification by subject
0 500 1000 1500 2000 2500 3000
Agriculture/Veterinary
Computing
Education
Engineering
Health
Humanities/Arts
Sciences
Multi-subject
Services
Social Science/Business/Law
Social Services
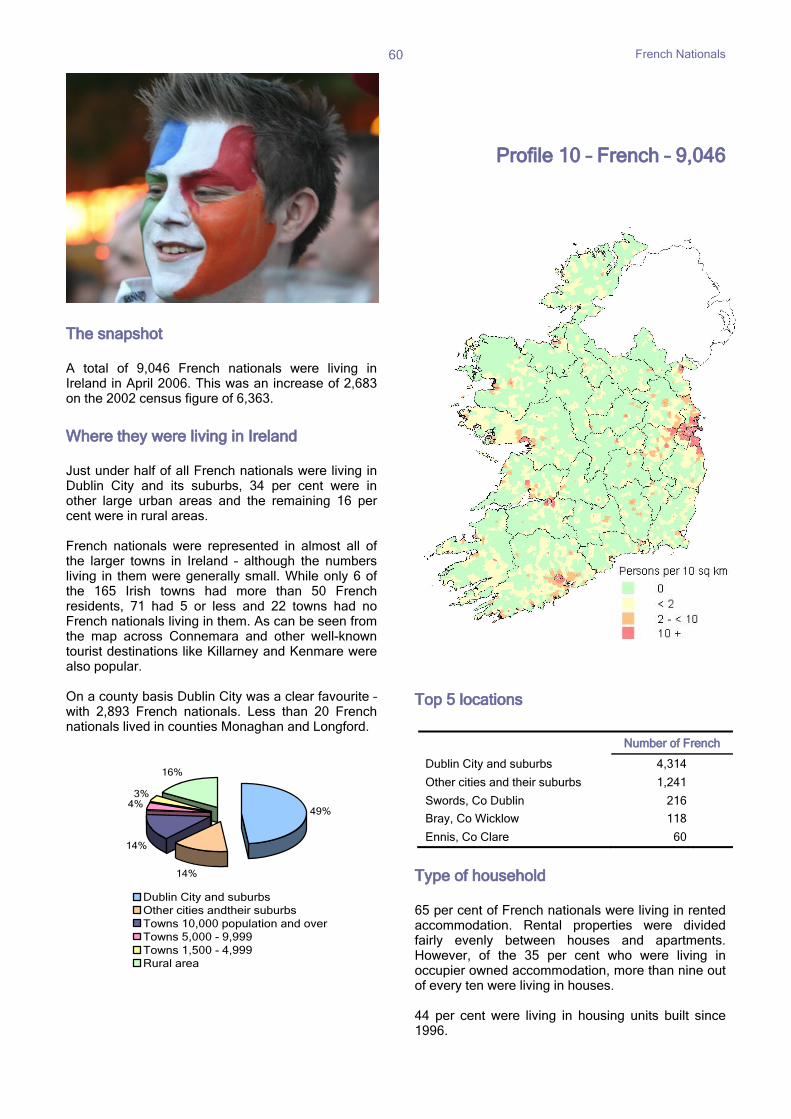
French Nationals
60
The snapshot A total of 9,046 French nationals were living in Ireland in April 2006. This was an increase of 2,683 on the 2002 census figure of 6,363.
Where they were living in Ireland Just under half of all French nationals were living in Dublin City and its suburbs, 34 per cent were in other large urban areas and the remaining 16 per cent were in rural areas. French nationals were represented in almost all of the larger towns in Ireland – although the numbers living in them were generally small. While only 6 of the 165 Irish towns had more than 50 French residents, 71 had 5 or less and 22 towns had no French nationals living in them. As can be seen from the map across Connemara and other well-known tourist destinations like Killarney and Kenmare were also popular. On a county basis Dublin City was a clear favourite – with 2,893 French nationals. Less than 20 French nationals lived in counties Monaghan and Longford.
Profile 10 – French – 9,046
Top 5 locations
Type of household 65 per cent of French nationals were living in rented accommodation. Rental properties were divided fairly evenly between houses and apartments. However, of the 35 per cent who were living in occupier owned accommodation, more than nine out of every ten were living in houses. 44 per cent were living in housing units built since 1996.
Number of French
Dublin City and suburbs 4,314
Other cities and their suburbs 1,241
Swords, Co Dublin 216
Bray, Co Wicklow 118
Ennis, Co Clare 60
49%
14%
14%
4%3%
16%
Dublin City and suburbsOther cities andtheir suburbsTowns 10,000 population and overTowns 5,000 - 9,999 Towns 1,500 - 4,999 Rural area
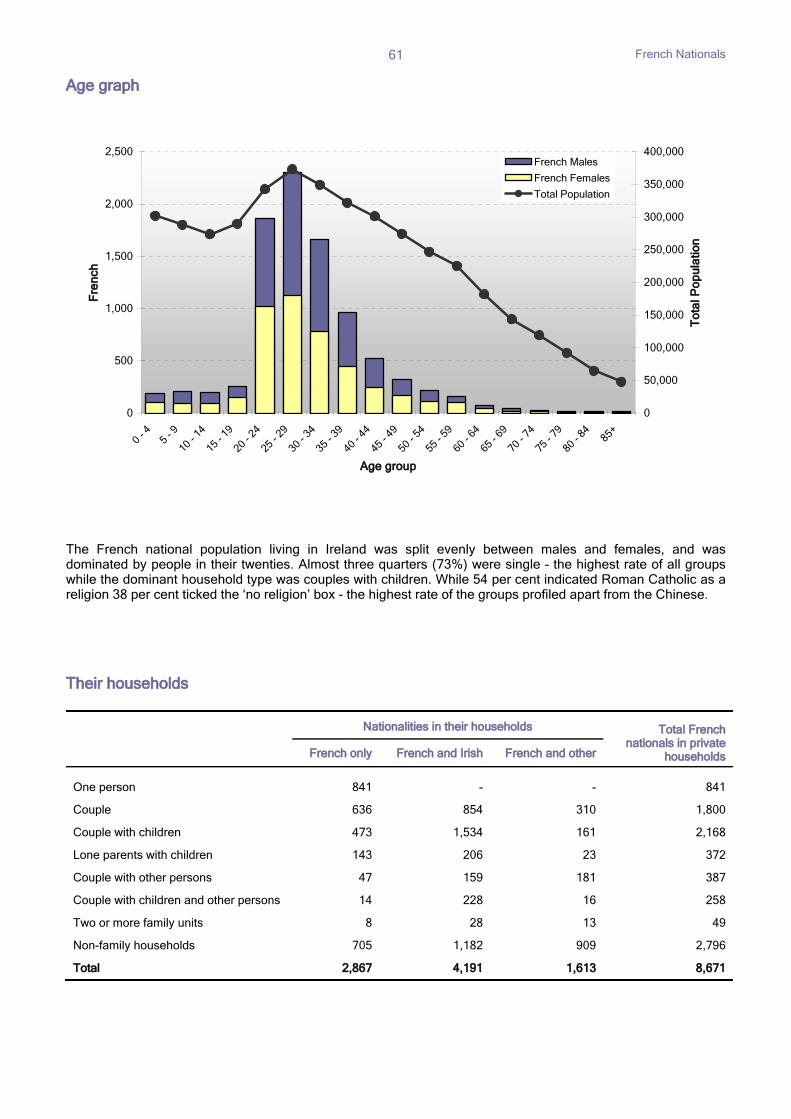
French Nationals
61
Age graph
The French national population living in Ireland was split evenly between males and females, and was dominated by people in their twenties. Almost three quarters (73%) were single – the highest rate of all groups while the dominant household type was couples with children. While 54 per cent indicated Roman Catholic as a religion 38 per cent ticked the ‘no religion’ box - the highest rate of the groups profiled apart from the Chinese. Their households
Nationalities in their households Total French nationals in private
households French only French and Irish French and other
One person 841 - - 841
Couple 636 854 310 1,800
Couple with children 473 1,534 161 2,168
Lone parents with children 143 206 23 372
Couple with other persons 47 159 181 387
Couple with children and other persons 14 228 16 258
Two or more family units 8 28 13 49
Non-family households 705 1,182 909 2,796
Total 2,867 4,191 1,613 8,671
0
500
1,000
1,500
2,000
2,500
0 -
4
5 -
9
10 -
14
15 -
19
20 -
24
25 -
29
30 -
34
35 -
39
40 -
44
45 -
49
50 -
54
55 -
59
60 -
64
65 -
69
70 -
74
75 -
79
80 -
84 8
5+
Age group
Fre
nch
0
50,000
100,000
150,000
200,000
250,000
300,000
350,000
400,000
To
tal P
op
ula
tion
French Males
French Females
Total Population
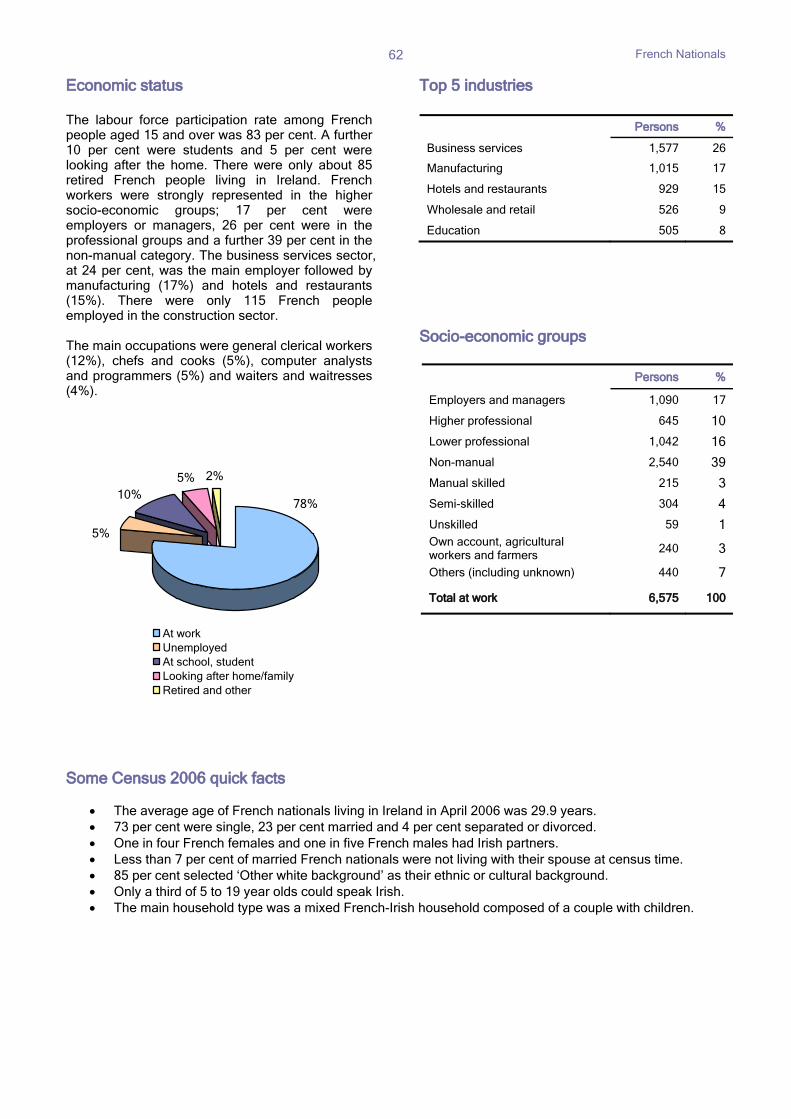
French Nationals
62
Economic status The labour force participation rate among French people aged 15 and over was 83 per cent. A further 10 per cent were students and 5 per cent were looking after the home. There were only about 85 retired French people living in Ireland. French workers were strongly represented in the higher socio-economic groups; 17 per cent were employers or managers, 26 per cent were in the professional groups and a further 39 per cent in the non-manual category. The business services sector, at 24 per cent, was the main employer followed by manufacturing (17%) and hotels and restaurants (15%). There were only 115 French people employed in the construction sector. The main occupations were general clerical workers (12%), chefs and cooks (5%), computer analysts and programmers (5%) and waiters and waitresses (4%).
Top 5 industries
Socio-economic groups
Some Census 2006 quick facts
• The average age of French nationals living in Ireland in April 2006 was 29.9 years. • 73 per cent were single, 23 per cent married and 4 per cent separated or divorced. • One in four French females and one in five French males had Irish partners. • Less than 7 per cent of married French nationals were not living with their spouse at census time. • 85 per cent selected ‘Other white background’ as their ethnic or cultural background. • Only a third of 5 to 19 year olds could speak Irish. • The main household type was a mixed French-Irish household composed of a couple with children.
Persons %
Business services 1,577 26
Manufacturing 1,015 17
Hotels and restaurants 929 15
Wholesale and retail 526 9
Education 505 8
Persons %
Employers and managers 1,090 17
Higher professional 645 10
Lower professional 1,042 16
Non-manual 2,540 39
Manual skilled 215 3
Semi-skilled 304 4
Unskilled 59 1Own account, agricultural workers and farmers
240 3
Others (including unknown) 440 7
Total at work 6,575 100
5% 2%
5%
10%78%
At workUnemployedAt school, studentLooking after home/familyRetired and other
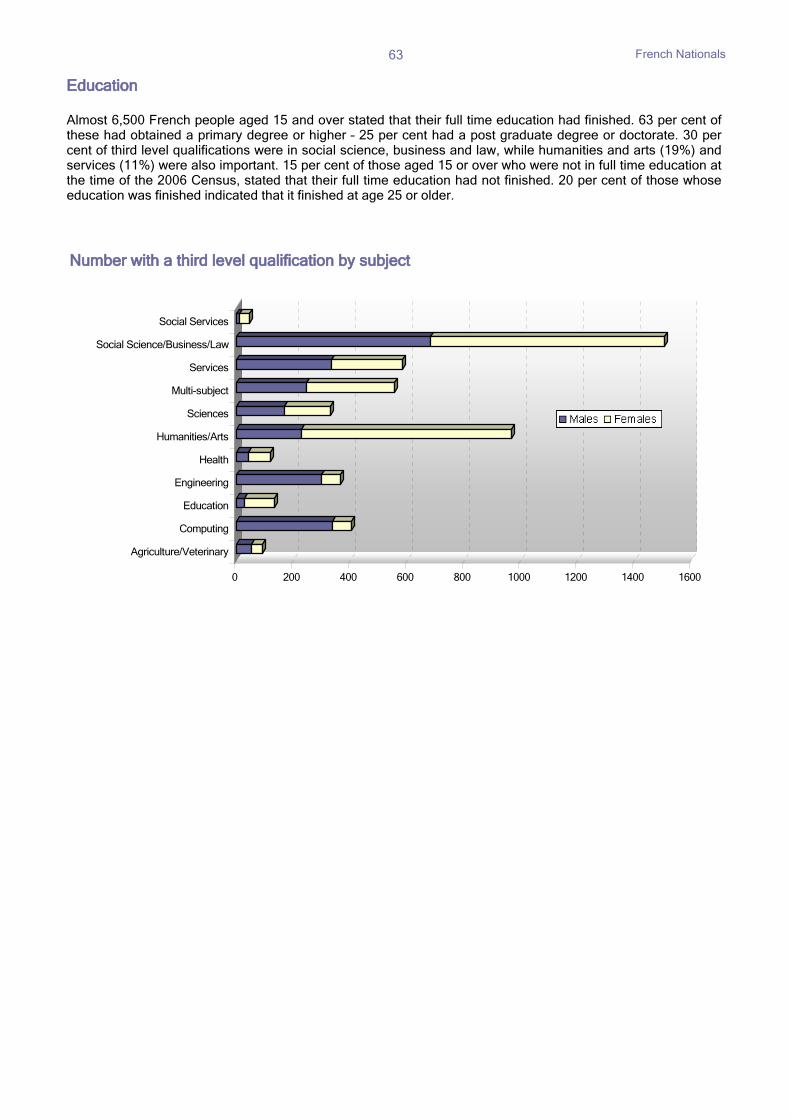
French Nationals
63
Number with a third level qualification by subject
Education Almost 6,500 French people aged 15 and over stated that their full time education had finished. 63 per cent of these had obtained a primary degree or higher – 25 per cent had a post graduate degree or doctorate. 30 per cent of third level qualifications were in social science, business and law, while humanities and arts (19%) and services (11%) were also important. 15 per cent of those aged 15 or over who were not in full time education at the time of the 2006 Census, stated that their full time education had not finished. 20 per cent of those whose education was finished indicated that it finished at age 25 or older.
0 200 400 600 800 1000 1200 1400 1600
Agriculture/Veterinary
Computing
Education
Engineering
Health
Humanities/Arts
Sciences
Multi-subject
Services
Social Science/Business/Law
Social Services

Non-Irish Nationals Living in Ireland
65
Snapshot profiles of other important nationalities
• Sixty per cent of the 8,460 Indians living in Ireland in April 2006 resided in the four Dublin administrative counties (Dublin City, Dún Laoghaire-Rathdown, Fingal and South Dublin)-. They were generally between 25 and 39 years of age and 57 per cent were married. Surprisingly 35 per cent indicated Roman Catholic for their religion and 40 per cent identified Hindu. There were proportionately more women (74%) than men (65%) working; almost all the women were working in the health sector (88%) while for men business services dominated. Nurse (2,246) was the most common occupation followed by software engineers and programmers.
• A fifth of the 8,111 Slovaks in Ireland were in Dublin City, a further 15 per cent were living in the other
Dublin counties and the remainder were spread across the country. They were primarily young (63% in their twenties), and single (77%) and Catholic (71%). The majority were working (92% males at work and 82% females). Manufacturing and construction were the main areas of employment for males while for females it was hotels and restaurants and shop work.
• The 7,696 Romanians usually resident in Ireland in April 2006 were heavily concentrated in Dublin
with 35 per cent in the city alone. The remainder were thinly spread across the country. Like most other eastern Europeans they were primarily in the 25 to 39 age bracket. Almost 60 per cent were married and Orthodox was the main religion (55%). 70 per cent of males and 42 per cent of females were working. The construction sector was the main employer for males (42%) while the hotel and restaurants employed most females (32%).
• Seventy per cent of the 6,190 Italians who were usual residents of Ireland at the time of the census
were single and 60 per cent were aged between 25 and 39. Four out of five of them were Catholic and 80 per cent were at work; hotels and restaurants was the main industry, followed by business services. They were concentrated in the higher socio economic groups; restaurant and catering managers, chefs, and waitresses were among the top occupations.
• The Spaniards favoured Dublin City as a location (43%). 60 per cent were between 25 and 34 years
of age, 77 per cent were single, and 64 per cent were Catholic. Like most other Europeans they were employed with 81 per cent of males and 76 per cent of females working. Business services accounted for a quarter of all work for males (only 93 males were employed in construction). Non-manual was the main social class; clerical work and sales assistants were the main occupations.
• There were 5,432 South Africans spread throughout the country. They were primarily in their
twenties and thirties, and there were more single (47%) than married (40%). They were 61 per cent white and 23 per cent African. 82 per cent of males and 58 per cent of females were working; non-manual was the dominant social class (21%) and no single occupation stood out.
• Cork and Kerry were popular destinations for Czech nationals living in Ireland in 2006, with a further
third living in the four Dublin counties. Thirty five per cent were in the 25-29 age group and 74 per cent were single. A high 58 per cent indicated they had no religion, by far the highest for any of the eastern European countries. They had high numbers at work (88% of males and 74% of females); manufacturing (for males) and hotels and restaurants (for females) were the important industries.
• There were just under 5,000 Pakistanis in the State in April 2006 and Dublin City was the preferred
location. Sixty per cent were married, and they were 97 per cent Muslim, by far the highest single religion of any of the groups profiled. The women were mainly engaged in domestic duties (65% were looking after the home) while the males were either at work (62%) or students (29%). Health was the main area of work for males (27%) and females (54%) followed by the retail sector and hotels / restaurants. Medical professional was the top occupation.
• There were 4,495 Russian nationals in Ireland in April 2006 and while Dublin City was the most
popular location (12 per cent) they were generally well spread throughout the country. Their main religion was Orthodox and the top occupation was cleaners, followed by sales assistants.
• A third of the 4,388 Brazilian nationals were living in County Galway, just over 400 in Kildare, 513 in
Dublin City with the remainder spread across the rest of the country. They were predominantly Catholic and had a labour force participation rate of 92 per cent, with the main occupations being butchers and meat cutters, builder’s labourers and food and drink operatives.

Appendices

Appendix 1 - Glossary
69
Appendix 1
Glossary
Terms used in the report and their meaning
Geographic terms
Greater Dublin Area This refers to Dublin City (as legally defined) together with its suburbs in the three adjacent counties of Dún Laoghaire-Rathdown, Fingal and South Dublin. The boundaries are determined in accordance with UN recommendations which specify that no occupied dwelling is more than 200 metres distant form the nearest occupied dwelling. Following this definition implies that towns such as Swords and Malahide are not classified as suburbs of Dublin. Suburban boundaries do not have any legal standing and are redefined following each census.
Other Cities This refers to the cities of Cork, Limerick, Galway and Waterford and their suburbs
Urban areas This is the same as the Aggregate Town Area used in other Census publications. It covers towns with a population of 1,500 or more.
Rural areas This is the same as the Aggregate Rural Area that is used in other Census publications. It covers all areas other than cities and urban areas.
Towns Reference to towns in this publication is to towns with a population of 1,500 or more.
Housing terms
Owner occupied housing Tick box 1, 2 or 3 in question H3 on the census form
Rented Tick box 4, 5, or 6 in question H3 on the census form
Houses Tick box 1, 2 or 3 in question H1 on the census form
Apartments Tick box 4 or 5 in question H1 on the census form
Other Tick box 6 or 7 in question H1 on the census form
Demographic terms
Married Tick box 2, 3, or 4 in question 10 on the census form
Re-married Tick box 3, or 4 in question 10 on the census form
Family A family unit is defined for census purposes as persons living together who are related as either spouses/partners and/or as parents and children. A family type household is one in which there is at least one family unit.
Appendix 1 - Glossary
70
Level of education
Primary Tick box 2 in question 23 on the census form
Secondary
Tick box 3 - 6 in question 23 on the census form
Third level Tick box 7 – 13 in question 23 on the census form
Lower Secondary (in Table A6) Tick box 3 in question 23 on the census form
Leaving Cert (in Table A6) Tick box 4 – 6 in question 23 on the census form
Post-graduate qualification Tick box 12 and 13 in question 23 on the census form
Third level qualifications Some of the subject areas have been abbreviated as follows:
Education Tick box 1 in question 24
Humanities/Arts Tick box 2 in question 24 Includes Foreign Languages, History, Philosophy, Fine Arts, Music and Performing Arts, Design
Social Science/Business/Law Tick box 3 in question 24 Includes Psychology, Economics, Journalism, Finance Accounting
Engineering, Manufacturing and Construction
Tick box 6 in question 24 Includes Manufacturing, Construction, Architecture
Health Tick box 8 in question 24 Includes Medicine, Nursing, Dental Studies, Therapy and Rehabilitation, Pharmacy
Services Tick box 10 in question 24 Includes Hotel, Catering, Sports, Transport, Environmental Protection, Security, Occupation Health and Safety, Military and Defence
Other Tick boxes 4, 5, 7, and 9 in question 24 includes Life Science, Physical Science, Mathematics and Statistics, Computing, Agriculture and Veterinary and Social Services
Occupations
Architects and town planners UKSOC code 260 Architects & Town planners and Surveyors
Builders labourers UKSOC code 929 Other building & civil engineering labourers
Care assistants and attendants UKSOC code 644 Care assistants & attendants
Carpenters and joiners UKSOC code 570 Carpenters & joiners
Chefs and cooks UKSOC code 620 Chefs, cooks
Cleaners and domestics UKSOC code 958 Cleaners, domestics
Computer analysts and programmers
UKSOC code 320 Computer analyst/programmers
Doctors UKSOC code 220 Medical practitioners
Food and drink operatives UKSOC code 809 Other food, drink (inc. brewing) & tobacco process operatives
General clerical workers UKSOC code 430 Filing, computer, library & other clerks (n.o.s.)
Managers and proprietors of shops
UKSOC code 179 Managers/proprietors of shops etc.
Managers of marketing UKSOC code 121 Marketing etc. managers
Appendix 1 - Glossary
71
Occupations (contd.)
Nurses and midwives UKSOC code 340 Nurses & Midwives
Sales assistants
UKSOC code 720 Sales assistants, check out operators & petrol pump attendants
Security guards UKSOC code 615 Security guards & related occupations
Third level lecturers UKSOC code 230 University, RTC and higher education teachers
Waiters and waitresses UKSOC code 621 Waiters, waitresses
Counts of non-Irish nationals The number of persons present and usually resident in the State on Census Night is generally used as the number of persons for each nationality group living in Ireland. For tables showing the population of towns and cities, the number is restricted to those enumerated at home on Census night. Any other counts are mentioned specifically in the report (e.g. persons aged 15 and over, persons at work etc.).
The figures shown in the various tables exclude those who did not state a nationality (44,279 persons).
Other terms
Unemployed Includes ‘Looking for first regular job’ and ‘Unemployed having lost or given up previous job’, unless otherwise stated
Per cent All percentage breakdowns exclude the ‘Not stated’ category unless stated otherwise.
Maps
Population Density Maps The population distribution maps illustrated in Part 2 of this report show population densities for each of the nationality groups in each Electoral Division (ED) in the country. The maps are colour coded to show the number of nationals per 10 square kilometres. Given the wide variation in ED size (from 0.01 sq km to 127 sq km) and ED population (from under 50 persons to over 24,000 persons), mapping population density of non-Irish nationals provides a more accurate picture than either percentage population shares or absolute numbers of non-Irish nationals per ED.
For a further understanding of definitions, terms and expressions used in census see the appendices of the relevant published volumes. These can be found online at http://www.cso.ie/census/Census2006Results.htm.
Appendix 2 – 2006 Census Questionnaire
72
Appendix 2
2006 Census questionnaire The attached extract is taken from the household form used in the 2006 Census. The household form covers 6 persons and consists of 24 pages. The attached extract covers persons 1 and 2 only. The layouts for persons 3 to 6 are identical to that for person 2, apart from the relationship question (Q3).
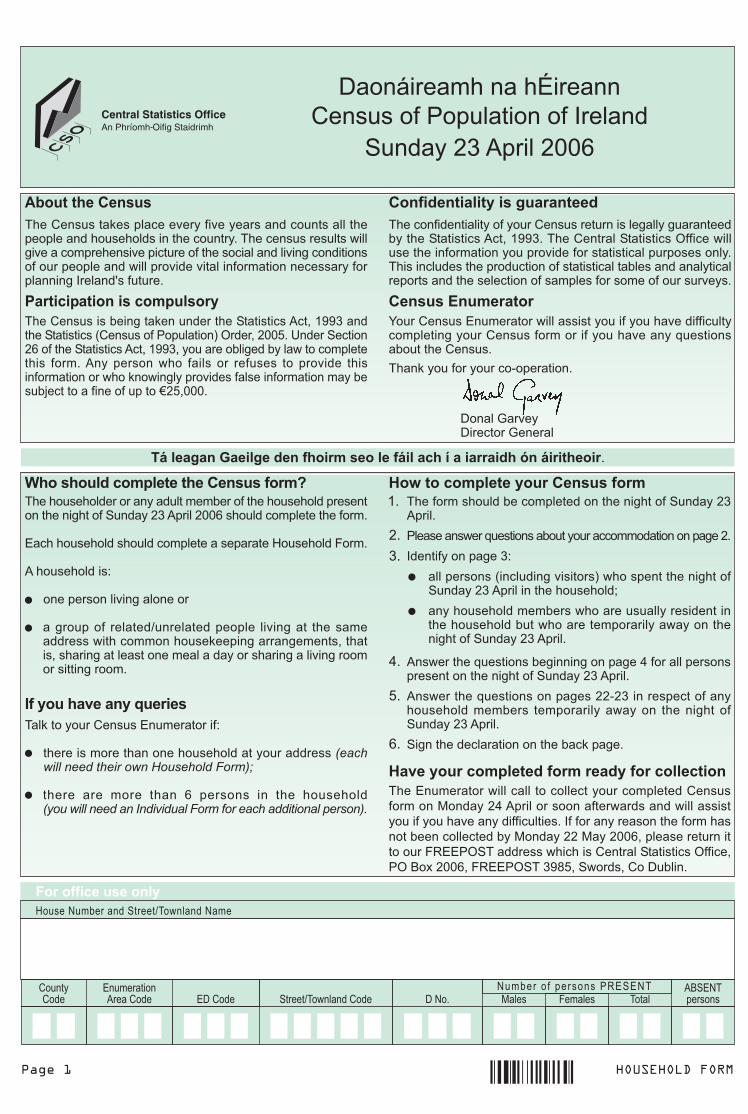
������ ���� �����
������������������� ������������� ����������������������������������
������������������������� �����������������������������������������������������������������������������������������������������������������������������������������������������������������������������������������������������������������������������������������
�� �������������������������������������������������������������������������������������������������� �!""#�����������������������$������������������������������������������������������������������������������������������������������������������������������������������������������������������������������
���������������%�������&�����������������������������������������������������������������������������������'������������������
���� ��������������(����������
)�����*�����)��������*������
������������������������������ ��������������������������������������������������������������������������������+#�������+,,-������������������������
&������������������������������������.�������/����
�����������0
�������������������������
���������� �������1���������������� ���������� ���������������������������� ������������������ ������ ���������������������������������������������������������������������
��� ������������&�����������0
������������������������������������������������������ ���������������������
������ ���� ����� ����� -� ������ ��� ���� ������������������������������������������� ������������
�!������������������������ ���
�"����������������� ���������� ����������������&�������������������������������������������������������2������+3��������������������������������������������������������������������������������������������������������������������2������++�2���+,,- ���������������������/4&&5$����������������������������������$����� 5$�6�7�+,,- �/4&&5$���#"89 ������ ����)�����
�������������������������������������������������+#������
5�����������'�������������������������������������+�
�����������������#0
����������:���������������;����������������������������+#���������������������<
�������������������������������������������������������������������������������������������������������+#�������
!�
+�
����������'������������������������3�������������������������������������������+#�������
����������'��������������++(+#�������������������������������� �������������������� ������������������+#�������
������������������������������� ������
#�
3�
9�
-�
# �������"�����$������
)���=�����������>�������������5�������������������
������+#�������+,,-
%���� ����������������������� ������������ �� �����
����� ������ ������ � � � � � � � � � � � � � � � � � � � � � ������
����� ���� ������
� ����� � ��������� �!����� ���������� �� ������ !���"
&������������������������������������������� ������������������������ �!""#�����������������:�������5��������;�$���� �+,,9��?������������+-�������������������� �!""# �������������������������������������� ���������� ������ ���� ����� ��� ����� ��� �������� ���������������������� �����������������������������������������@����������������������A+9 ,,,�
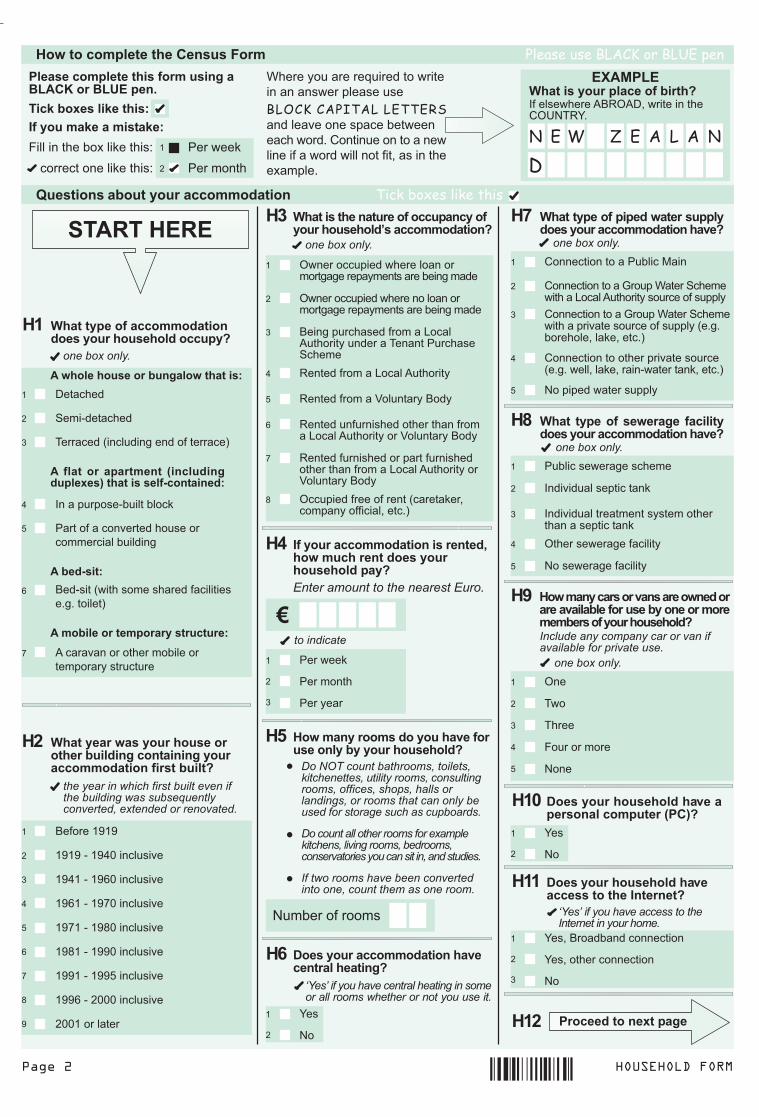
������ ���� �����
/������������������������������� ������������� ���
E��������������'���������������������������������������������������������������������������������������������������������������������������������������� ����������7������
# �������*���������*�-���*���.�����*������-
/�������������7��� �����0
�������������� �����0
!
+
5������
5��������
&�������������������� ����������,2��3����,24����)
5��1�� �1�
�!�����������������������%��� ������������������������
67 �&�����������.������
�
!
�8�9&2�
'���������������������"��������������������:&�;�
6<
%�
C�
!
+
�������������������� ��������������������64$�) ��������������$?C�4%�
" # � � � �
����������� ����������������������������������������
6
����������
��!��������������������!��������-
����(��������
���������:�����������������������;
! )�������
+
#
�������������������������������-
��������������������������������������������
D
�����+���-
6��(���:�����������������������������������;
-
�� ���� ��� ��������� :������������.��;������������ +�������-
����������(���������
5�������������������������������������������
3
9
����������������� ��� ������ ����������������� ��� ������� ��!�� ������������� ���
����������!������������������������������������������������������� �����������
7
!
+
#
3
9
-
D
8
"
6������!"!"
!"!"�(�!"3,��������
!"3!�(�!"-,��������
!"-!�(�!"D,��������
!"D!�(�!"8,��������
!"8!�(�!"",��������
!""!�(�!""9��������
!""-�(�+,,,��������
+,,!���������
'������������������������"���������������
=
"#��$������������ ����� �������������������� ������� ������� �
%�
C�
!
+
�!��������������������"�� ����������������������������
>
%�&'(���� �� ������! ��� �!)� ����� ��!� �� ������!����� ��������!�������!�����!������������!������� �� ���������������� ���������������������
%����� �� �����������������)� �����!����������!��������!�������� ������������� ��!���� ������
�� ��������������������� ���� ����!���� �������������
C������������
������������������� ����������� ��������������?���������������
0
3 4�������������B�������������
9 4�������������F��������6���
- 4��������������������������������B�����������������F��������6���
D 4�����������������������������������������������B����������������F��������6���
! $�����������������������������������������������������������
8 $��������������������:������ �� ���������������� �����;
+ $��������������������������������������������������������������
# 6��������������������B���������������������������5�����������
����������
# ���������������������������@��!���������������������������������
A
B ������� �
5������
5��������
5�������
!
+
#
*� ������� � �������� *����
$��
���
�����
/����������
C���
�!�������������"��������!����������"�������� ����������������������������� ����������������
C
!
+
#
3
9
����������
����������������������������������������� �����
����������� �������!������������������������������������"��
D����������
����������������5�����2���!
����������������*����E������������������B��������������������������
+
����������������*����E���������������������������������������:������������ ��� � �����;
#
��������������������������������:��������� ��� � �����(��������� �����;
3
C������������������9
E ����� ������ ���!������ ��������������������������������"������������
! 5������������������
+ �������������������
# ����������������������������������������������
3 $���������������������
9 C������������������
'���������������������"���������������#������
66
"#��$��������������� � ���� ���� �����������
%� �6�������������������
%� �����������������
C�
!
+
#
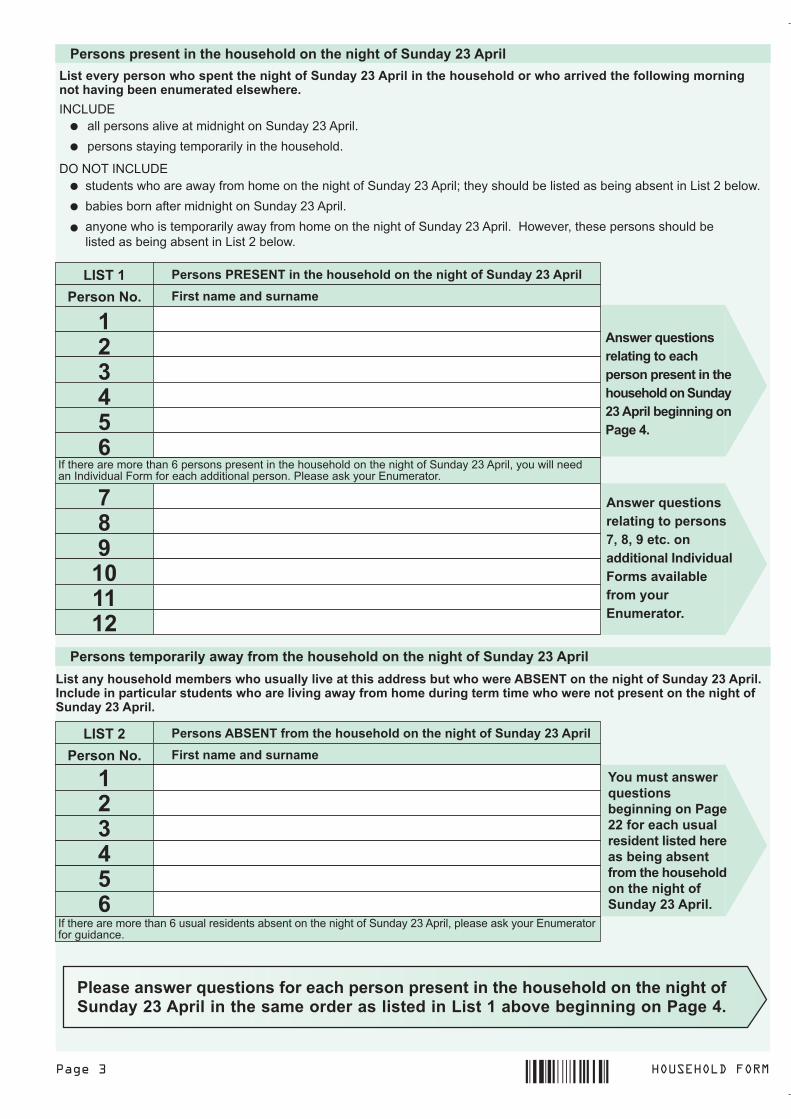
������ ���� �����
&����������������������������������������� �5�����70������
2�����"����������!������������������ �5�����70��������������������������!�������"������� ����!�������������"���������������������!����)
�C�B?)&
)$�C$���C�B?)&
�������������������������������������+#�������
����������������������������������������
���������������������������������������������������+#������<�������������������������������������B���+�������
�����������������������������������+#�������
��������������������������������������������������������������+#���������.������ ������������������������������������������B���+�������
2#5��6 &������&1�5�F������������������������������ �5�����70������
&�����F�) %������������������
670A>=
DEC6<6667
�����������������������-���������������������������������������������������+#������ ��������������������������/�������������������������������5������ �����&���������
&�������������������!��� ������������������������������ �5�����70������
2�������������������������!�������������"����������������������!���!�����,5�F�������������� �5�����70������)#���������������������������!���������"����!��� �������������������������!���!�������������������������� 5�����70������)
2#5��7 &�������,5�F�� ������������������������������ �5�����70������
&�����F�) %������������������
�����������������������-����������������������������������������+#������ �������� �����&��������������������
670A>=
��!���$����������������������������������������������������5����70���������������&����A)
(����������!��$����������������&���77� ��������������������������������������������� ����������������������������� 5�����70������)
&��������!���$�������� ������������������������������������������������� 5�����70������������������������������������2����6����"�����������&����A)
��!���$������������������������D@�E@�C����)������������#��"�����%������"������� �����������������)
������ ���� �����
!
+
#
������ ��� ���� �������� ��"��D.&4&�������������
&������������4&B�C)�:��������C���������������; ���������������$?C�%
&���������64$�) ��������������$?C�4%
%�
C�
!
+
�"��������"��������������1��������� �#������ ��������������������� ����������������
C
+�����������,���������������������������
#%�H(��? �������������%&�4���������� ���������������������4�����������������
�C)
�����$?C�4%������������������������
��2&������
&������������4&B�C)�:��������C���������������; ���������������$?C�%
&���������64$�) ��������������$?C�4%
!
+
#
������������������������"�������������
E+�����������,�����������
����� �����������������������������
6<+�����������,-�����������������������������:������2������;
2�������:�����2�������;
4�(��������:����������E��������;
4�(��������:����������)������1��������;
����������:���������)������;
)�������
E������
!
+
#
3
9
-
D
&�����6 ������������� ��� "�� ������������������������������������:&�����6;���� ��������������
6
������������������� �������A)�� 2���� %���
2���
/�����
5�.!
+
7
����4&B�C)�:���������C���������������; ��������������$?C�%�
�������������64$�) ��������������$?C�4%�
����� ��������������� �������>.��� ����������������� �������� �� ������������ ��
=
!
+
������������� �������� ����� �!�������������� ��������
$�����C���$C�B��% ���������
����� ��� ����� F����������
C�������������#
1�����������$�����������������������&�����6)
0�����������*�#�����67+�����������/������������
#%�H(��?@������������*�#�����
%�
C�
!
+
)���� �������������������������
)���� ������������������������
E�� ��
B�������
C����
!
+
#
3
9
������� �� �����
���������������������60
!
+
#
3
9
-
D
����������
4�������������
����������������
5����������
2�������
����
$���� ��������������4&B�*�$C
C����������
�!���������������"�������"�����������
66
(��� ��� �����������������E�������������������������������������
C���!
���������������������������������*������
6A
0�����'&*��� �������+ �%! ��� ����������� �����
8 $���� ��������������������'�����G����@�����������.������*�����
,�����,���*����,���*�#�����������3
����������6��� ���� �����9
�������������������#����������-
������������������ �����D
���������������!
��������������+
����������E�������� �����#
������ ���� �����
&�����6�+��������� ������������� ��� "�� ������������������
5*������/0A����.������
# �������������������6>@7<
�"����������������� ���+��������������
77
#%�H(��?@�����������*&������������������
%�
C�
!
+
���������������������������"����������������!��*@������������������
6E
6������,-0#,
,-0#!�(�,D0,,
,D0,!�(�,D0#,
,D0#!�(�,80,,
,80,!�(�,80#,
,80#!�(�,"0,,
,"0,!�(�,"0#,
������,"0#,
C�������������
!
+
#
3
9
-
D
8
"
'���������"������������������������������ ���� �������� �������������!��������+�����������@�����������������������������
76
������������������������ �������7��������������������� ������ ��)�������������������������
%� �!(!3����������
%� �!9(+8����������
%� �+"(3+����������
%� �3#������������������
C�
!
+
#
3
9
�!�������������������"�����!��*@�������������������
6D
$������
6������
6 ���������������
����� �)�4�����B?��
2��������������������
)������������
5���������������
B�����������
$���������
E�� �����������������������
C�������������
!
+
#
3
9
-
D
8
"
!,
!!
���������!��� ������� ��� !����� ����!����������2������ ����)!�������������
:�;��6������ ��������������������������������������������
%� C�! +
:�;������������������������������������
%� C�! +
:�;��������������������������������������
%� C�! +
:�;��$���� ��������������������������
%� C�! +
:�;���������������������������������������������������������������������������� ��� ������������� ��������� �������������������
%� C�! +
'��������"������ ����� ����!�����+����������������
6>
:�;��B������� ����������������������������
%� C�! +
:�;��)����� ��������������������������������������
%� C�! +
:�;��*�����������������������������������������������H������
%� C�! +
:�;��E�� ���������@��������������������������������������
%� C�! +
:�;��5������������������������������ ������7��������������������������
%� C�! +
#%�H(��?@�������� ������������������ ������/�������6>@���������"������� ������������������ ���� ����!�������"������
6=
����������������������"���� ���������: ���+������������+����;�!�����������"�������������������
70
����������
)���������:5��);!#
5����������)������:2����;!+
5�������������������������)������!!
6������)������������5����������'�����������!,
5����������'������������:���)����������������;
"
5�������)����� �(����5���8������%������8
������2�"��C���)�����0&� ����0�� ����� �!%�����&0*+9��� � � ���(����������� ������ !&������%�����
D
! C�����������������
5���������������+
5�����2�"��B�������������0:�����9�� ������� �9.����0�� ����� �!"'$5����9.0;*�!&0<+������ ���0�� ����� �!8����;)��(�������0�� ����� ���� ������
#
?�������������05������0�� ����� ����������+��������<��� ����7����������!"+$5����!&0<+5���,0�� ����� ���� ������
3
6����?�������������������������������F����������'�����������
-
�������������F����������'�����������00���� ��+����� �������!&0<+5���=9/0�� ����� �!(������0�� ����� �9%�������� ������
9
'��������������� #1'�2�J�2$���� ������:�;�!������������������ �������������7���������������� �������
7A
#%�H(��?@��������������������������@�������:;��������������'�����������:;��������+55 ������� �� �����
%�
C�
!
+
B����������� �5�������������� �2���������������������
3
��������9
&�������!
.���������������+ ����������������5��������!��� ���!7��������!����+� �!1�������7���������+� �!%������
�����������������������16���1B��#7��������!*��������!:��������!�������!+����� ����
.�����8 ���������1�������!&������!%�� �; �����!(���������>������ � ���!7��������
��������������" ���������0���0������#�� �;�������!;����?��)���0���������
�������!, ����������� �!0� �����!;��� �!(������� !*��������� �7�� �� ���!;����� �!'����� ������� ����;��� �!1�� ������%�������
&���������� �2�������������������������-���������+���� �� ����
��������������F���������D �������������� ��!�������!��� ��� ����
��������������������I������ ������������!��*@�����������������������!����������������������*��
6C
?�� ������ ���� � �������� )���� �����2������ ��������� ���
2����
I��������
������ ���� �����
&�����6�+��������� ������������� ��� "�� ������������������
# ����������������@0< 5*������/0A
��������:!��;����� ���������������!������������������!��*:��;�07
E�� �����������������������! C����7��������������� +
��������:!��;����� ��������� �����G��������������!��*:��;� �������������I���
06�����������������������������!��� ��� ��&+1*�� �����������
��������:!��;���������������������������I���7C���������������� �������� ����������������������� ����2�� � ��3��������� ���������� %�&'(��������� �����������������������$� �%������ !��&�����'�������������� %� ���
2�������������&�������
0��������� ���������������� �������������� � � ��������������� �����!$� �������(���))�����1�������� ��.����4��+��������� � � �������)�(������������� � � ���������� ��������������$��&����'���0��������������������������������������� ������� � *��%������!�%� ����� �����E�����������������$��?5���$C�
# ��� ��������� ����!��*��@����������������G&�������������
.������
+55 ������� �� �����
#����������A�!��*����"������������� ����� ����!�������"������!�����������
7>
! .���������������������� ��������������������������������������
+ .���������������������� ����������������������������
# .���������������������� ��������������������������
3 .���������������������� ��������������������������������������
9 ���������������������������
- C�������������������
'��:���;�����!��*���������������������:!���;�������� +�������������������I���
7E
#�������2���� ��2��������������������)���� ����� ������
&�������! &�������!
����(�������� �������������������+
����(�������� ���������������������#
����������������:������������������7���������������;
3
��������:!��;�������������� ����������������������������!��������!��*:��;������������I���
00�����������������6��������������������� ������������������%������� ������������ ����������������������������������������!$��� %���$������*�������� %�����*����� !��&�!������ *�)��!�"'�������*�$��� %��'��$����������*�� ���������� � %*���)�"����!�(����$� ��� !��������+
��!���$�������� ���&�����7����������������.������)��# ��������������������������������������������������������� �70������@
0A
5*�����������77
# ��������-!��*��� ��������������� ���:/7=���.�6;@����������:/7=���.�0;@��������:/7=���.�=;@
��!������� ����!���$����������������������I��������������������I���� ����������������������������)
G����!���@
7D
5*������/0A
����������
�!�!���������������������������������������������
7=
!
+
#
3
9
-
D
8
E�� �������������������������
B�� ��������������������@��
?���������
��������������
B�� ��������������1������
4����������������������
?������������ ������������������ ���������������
$���� ���������
������ ���� �����
!
+
#
������ ��� ���� �������� ��"��D.&4&�������������
&������������4&B�C)�:��������C���������������; ���������������$?C�%
&���������64$�) ��������������$?C�4%
%�
C�
!
+
�"��������"��������������1��������� �#������ ��������������������� ����������������
C
+�����������,���������������������������
#%�H(��? �������������%&�4���������� ���������������������4�����������������
�C)
�����$?C�4%������������������������
��2&������
&������������4&B�C)�:��������C���������������; ���������������$?C�%
&���������64$�) ��������������$?C�4%
!
+
#
������������������������"�������������
E+�����������,�����������
����� �����������������������������
6<+�����������,-�����������������������������:������2������;
2�������:�����2�������;
4�(��������:����������E��������;
4�(��������:����������)������1��������;
����������:���������)������;
)�������
E������
!
+
#
3
9
-
D
&�����7 ������������� ��� "�� ������������������������������������:&�����7;���� ��������������
6
������������������� �������A)�� 2���� %���
2���
/�����
5�.!
+
7
����4&B�C)�:���������C���������������; ��������������$?C�%�
�������������64$�) ��������������$?C�4%�
����� ��������������� �������>.��� ����������������� �������� �� ������������ ��
=
!
+
������������� �������� ����� �!�������������� ��������
$�����C���$C�B��% ���������
����� ��� ����� F����������
C�������������#
����� �������� ������������ ��&�����6�
0
����������;�������������)�����
.������������
5������
��������������
����(�����
6��������������
2���������������
����(������1(������
���(1�������(��(���
*���������
$������������
?��������:��������������������;
4�������������5&4�$C�+��� 5����
!
+
#
3
9
-
D
8
"
!,
!!
�����������*�#�����67+�����������/������������
#%�H(��?@������������*�#�����
%�
C�
!
+
)���� �������������������������
)���� ������������������������
E�� ��
B�������
C����
!
+
#
3
9
������� �� �����
���������������������60
!
+
#
3
9
-
D
����������
4�������������
����������������
5����������
2�������
����
$���� ��������������4&B�*�$C
C����������
!
�!���������������"�������"�����������
66
(��� ��� �����������������E�������������������������������������
C���!
���������������������������������*������
6A
0�����'&*��� �������+ �%! ��� ����������� �����
8 $���� ��������������������'�����G����@�����������.������*�����
,�����,���*����,���*�#�����������3
����������6��� ���� �����9
�������������������#����������-
������������������ �����D
���������������!
��������������+
����������E�������� �����#
������ ���� �����
&�����7�+��������� ������������� ��� "�� ������������������
5*������/0A����.������
# �������������������6>@7<
�"����������������� ���+��������������
77
#%�H(��?@�����������*&������������������
%�
C�
!
+
���������������������������"����������������!��*@������������������
6E
6������,-0#,
,-0#!�(�,D0,,
,D0,!�(�,D0#,
,D0#!�(�,80,,
,80,!�(�,80#,
,80#!�(�,"0,,
,"0,!�(�,"0#,
������,"0#,
C�������������
!
+
#
3
9
-
D
8
"
'���������"������������������������������ ���� �������� �������������!��������+�����������@�����������������������������
76
������������������������ �������7��������������������� ������ ��)�������������������������
%� �!(!3����������
%� �!9(+8����������
%� �+"(3+����������
%� �3#������������������
C�
!
+
#
3
9
�!�������������������"�����!��*@�������������������
6D
$������
6������
6 ���������������
����� �)�4�����B?��
2��������������������
)������������
5���������������
B�����������
$���������
E�� �����������������������
C�������������
!
+
#
3
9
-
D
8
"
!,
!!
���������!��� ������� ��� !����� ����!����������2������ ����)!�������������
:�;��6������ ��������������������������������������������
%� C�! +
:�;������������������������������������
%� C�! +
:�;��������������������������������������
%� C�! +
:�;��$���� ��������������������������
%� C�! +
:�;���������������������������������������������������������������������������� ��� ������������� ��������� �������������������
%� C�! +
'��������"������ ����� ����!�����+����������������
6>
:�;��B������� ����������������������������
%� C�! +
:�;��)����� ��������������������������������������
%� C�! +
:�;��*�����������������������������������������������H������
%� C�! +
:�;��E�� ���������@��������������������������������������
%� C�! +
:�;��5������������������������������ ������7��������������������������
%� C�! +
#%�H(��?@�������� ������������������ ������/�������6>@���������"������� ������������������ ���� ����!�������"������
6=
����������������������"���� ���������: ���+������������+����;�!�����������"�������������������
70
����������
)���������:5��);!#
5����������)������:2����;!+
5�������������������������)������!!
6������)������������5����������'�����������!,
5����������'������������:���)����������������;
"
5�������)����� �(����5���8������%������8
������2�"��C���)�����0&� ����0�� ����� �!%�����&0*+9��� � � ���(����������� ������ !&������%�����
D
! C�����������������
5���������������+
5�����2�"��B�������������0:�����9�� ������� �9.����0�� ����� �!"'$5����9.0;*�!&0<+������ ���0�� ����� �!8����;)��(�������0�� ����� ���� ������
#
?�������������05������0�� ����� ����������+��������<��� ����7����������!"+$5����!&0<+5���,0�� ����� ���� ������
3
6����?�������������������������������F����������'�����������
-
�������������F����������'�����������00���� ��+����� �������!&0<+5���=9/0�� ����� �!(������0�� ����� �9%�������� ������
9
'��������������� #1'�2�J�2$���� ������:�;�!������������������ �������������7���������������� �������
7A
#%�H(��?@��������������������������@�������:;��������������'�����������:;��������+55 ������� �� �����
%�
C�
!
+
B����������� �5�������������� �2���������������������
3
��������9
&�������!
.���������������+ ����������������5��������!��� ���!7��������!����+� �!1�������7���������+� �!%������
�����������������������16���1B��#7��������!*��������!:��������!�������!+����� ����
.�����8 ���������1�������!&������!%�� �; �����!(���������>������ � ���!7��������
��������������" ���������0���0������#�� �;�������!;����?��)���0���������
�������!, ����������� �!0� �����!;��� �!(������� !*��������� �7�� �� ���!;����� �!'����� ������� ����;��� �!1�� ������%�������
&���������� �2�������������������������-���������+���� �� ����
��������������F���������D �������������� ��!�������!��� ��� ����
��������������������I������ ������������!��*@�����������������������!����������������������*��
6C
?�� ������ ���� � �������� )���� �����2������ ��������� ���
2����
I��������
������ ���� �����
&�����7�+��������� ������������� ��� "�� ������������������
# ����������������@0< 5*������/0A
��������:!��;����� ���������������!������������������!��*:��;�07
E�� �����������������������! C����7��������������� +
��������:!��;����� ��������� �����G��������������!��*:��;� �������������I���
06�����������������������������!��� ��� ��&+1*�� �����������
��������:!��;���������������������������I���7C���������������� �������� ����������������������� ����2�� � ��3��������� ���������� %�&'(��������� �����������������������$� �%������ !��&�����'�������������� %� ���
2�������������&�������
0��������� ���������������� �������������� � � ��������������� �����!$� �������(���))�����1�������� ��.����4��+��������� � � �������)�(������������� � � ���������� ��������������$��&����'���0��������������������������������������� ������� � *��%������!�%� ����� �����E�����������������$��?5���$C�
# ��� ��������� ����!��*��@����������������G&�������������
.������
+55 ������� �� �����
#����������A�!��*����"������������� ����� ����!�������"������!�����������
7>
! .���������������������� ��������������������������������������
+ .���������������������� ����������������������������
# .���������������������� ��������������������������
3 .���������������������� ��������������������������������������
9 ���������������������������
- C�������������������
'��:���;�����!��*���������������������:!���;�������� +�������������������I���
7E
#�������2���� ��2��������������������)���� ����� ������
&�������! &�������!
����(�������� �������������������+
����(�������� ���������������������#
����������������:������������������7���������������;
3
��������:!��;�������������� ����������������������������!��������!��*:��;������������I���
00�����������������6��������������������� ������������������%������� ������������ ����������������������������������������!$��� %���$������*�������� %�����*����� !��&�!������ *�)��!�"'�������*�$��� %��'��$����������*�� ���������� � %*���)�"����!�(����$� ��� !��������+
��!���$�������� ���&�����0����������������.������)��# ���������������!�������������������������������������������� �70������@
0A
5*�����������77
# ��������-!��*��� ��������������� ���:/7=���.�6;@����������:/7=���.�0;@��������:/7=���.�=;@
��!������� ����!���$����������������������I��������������������I���� ����������������������������)
G����!���@
7D
5*������/0A
����������
�!�!���������������������������������������������
7=
!
+
#
3
9
-
D
8
E�� �������������������������
B�� ��������������������@��
?���������
��������������
B�� ��������������1������
4����������������������
?������������ ������������������ ���������������
$���� ���������
������� ���� �����
&�������������������!��� ������������������������������ �5�����70������
��!���$���������6�����E� ������������������������!�������������"���������������������������!�������FG�������������������� �5�����70������)�#���������������������������!���������"����!��� �������������������������!������FG������������������������������������� �5�����70������)
������&�����0������&�����7������&�����6������������������?�������6���� ��������������
5�.�72���
/�����
!
+
#�����������������������!�����������������������
�E
%�
C�
!
+
���������������������1�������� � #��������5�����70�������
�D
%�
C�
!
+
������������������?�����������������������
�>+�����������,-����������������������
�������:������2������;
2�������:���������4�(�������;
����������:���������)������;
)�������
E������
!
+
9
-
D
�A ������������������?�������� �������
)�� 2���� %���
������������������������� ��������������&�����6��������A�
�0
����������
.������������
5������
��������������
$������������ ����������4&B���$C�.�5
?���������:��������������������;
!
+
#
!,
!!
������������������?�������6���� ��������������
5�.�72���
/�����
!
+
#�����������������������!�����������������������
�E
%�
C�
!
+
���������������������1�������� � #��������5�����70�������
�D
%�
C�
!
+
������������������?�����������������������
�>+�����������,-����������������������
�������:������2������;
2�������:���������4�(�������;
����������:���������)������;
)�������
E������
!
+
9
-
D
�A ������������������?�������� �������
)�� 2���� %���
������������������������� ��������������&�����6��������A�
�0
����������
.������������
5������
��������������
$������������ ����������4&B���$C�.�5
?���������:��������������������;
!
+
#
!,
!!
�!������������������������������!��� ���
�=
B�������#������
#��������������
!
+
�!������������������������������!��� ���
�=
B�������#������
#��������������
!
+
�!������������������������������!��� ���
�=
B�������#������
#��������������
!
+
������� ���� �����
&�������������������!��� ������������������������������ �5�����70������
# ��������������������=�������������������������� ����������������������������� �5�����70������@����������*��������������� ����������)
������&�����A ������&�����=������&�����>������������������?�������6���� ��������������
5�.�72���
/�����
!
+
#�����������������������!�����������������������
�E
%�
C�
!
+
���������������������1�������� � #��������5�����70�������
�D
%�
C�
!
+
������������������?�����������������������
�>+�����������,-����������������������
�������:������2������;
2�������:���������4�(�������;
����������:���������)������;
)�������
E������
!
+
9
-
D
�A ������������������?�������� �������
)�� 2���� %���
������������������������� ��������������&�����6��������A�
�0
����������
.������������
5������
��������������
$������������ ����������4&B���$C�.�5
?���������:��������������������;
!
+
#
!,
!!
������������������?�������6���� ��������������
5�.�72���
/�����
!
+
#�����������������������!�����������������������
�E
%�
C�
!
+
���������������������1�������� � #��������5�����70�������
�D
%�
C�
!
+
������������������?�����������������������
�>+�����������,-����������������������
�������:������2������;
2�������:���������4�(�������;
����������:���������)������;
)�������
E������
!
+
9
-
D
�A ������������������?�������� �������
)�� 2���� %���
������������������������� ��������������&�����6��������A�
�0
����������
.������������
5������
��������������
$������������ ����������4&B���$C�.�5
?���������:��������������������;
!
+
#
!,
!!
&����������������������������������*�����)
�!������������������������������!��� ���
�=
B�������#������
#��������������
!
+
�!������������������������������!��� ���
�=
B�������#������
#��������������
!
+
�!������������������������������!��� ���
�=
B�������#������
#��������������
!
+
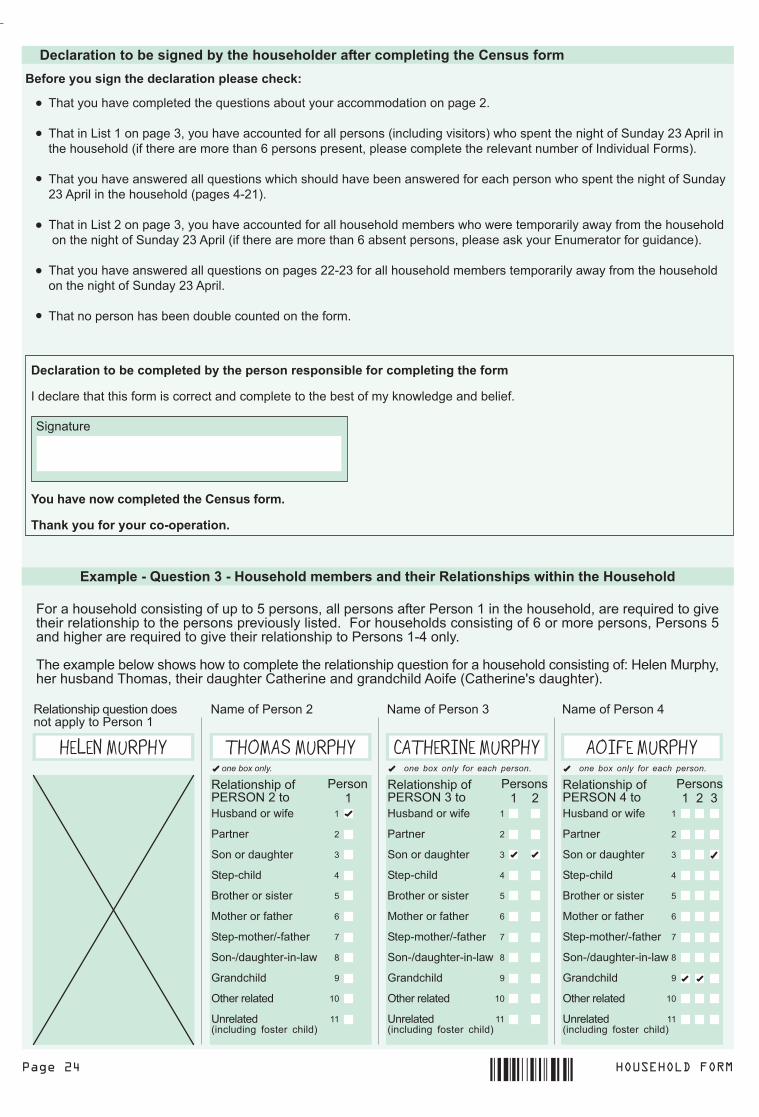
������� ���� �����
'�������������������������������������������������� ����������������� ���
���������������������������������������������������������������� ��������������������
(�����"���!��������������������� ���)
���*����� ����������+��������)
��������
'������������������������������������������ ������������������������ ���
,� ��������������������������������������*-
���������������������������'�������������������������������������+�
��������B���!���������# ��������������������������������:���������������;�����������������������������+#���������������������:�����������������������-������������� ������������������������������������������������/���;�
�������������������������'�����������������������������������������������������������������������������+#����������������������:�����3(+!;�
��������B���+���������# ����������������������������������������������������������������������������������������������������������+#�������:�����������������������-������������ �������� �����&��������������������;�
�������������������������'��������������++(+#�������������������������������������������������������������������������������+#�������
�����������������������������������������������
4�����������'����������������������5�����!
/������������������������������9������ �����������������5�����!��������������� �������'������������������������������������������������������������/�����������������������-�������������� �5�����9�����������������'����������������������������������5�����!(3������
�����7������������������������������������������������'�������������������������������0�.�����2���� ��������������� ����������������������������������������������:������������������;�
�.������+�/�������0�+� ��������������������������1������������!��������� ��������
���������� ��� ��� ��� ��� ���� �������
.������������
5������
��������������
����(�����
6��������������
2���������������
����(������1(������
���(1�������(��(���
*���������
$������������
?��������:��������� ������ �����;
4�������������5&4�$C�3���
5����
!
+
#
3
9
-
D
8
"
!,
!!
C�������5�����3
! + #
� �������� ��� ��� ��� ��� ���� �������
.������������
5������
��������������
����(�����
6��������������
2���������������
����(������1(������
���(1�������(��(���
*���������
$������������
?��������:��������� ������ �����;
4�������������5&4�$C�#���
5����
!
+
#
3
9
-
D
8
"
!,
!!
C�������5�����#
! +
�����������������������
.������������
5������
��������������
����(�����
6��������������
2���������������
����(������1(������
���(1�������(��(���
*���������
$������������
?��������:��������� ������ �����;
4�������������5&4�$C�+���
5����
!
+
#
3
9
-
D
8
"
!,
!!
C�������5�����+
!
�� ��������

Appendix 3 – Supporting tables
85
Appendix 3
Supporting tables The following tables provide more detailed information on the ten profiled nationalities in Part II of this report, covering age, place of residence, marital status, principal economic status, industrial group, educational attainments and religion.

Appendix 3 – Supporting tables
86
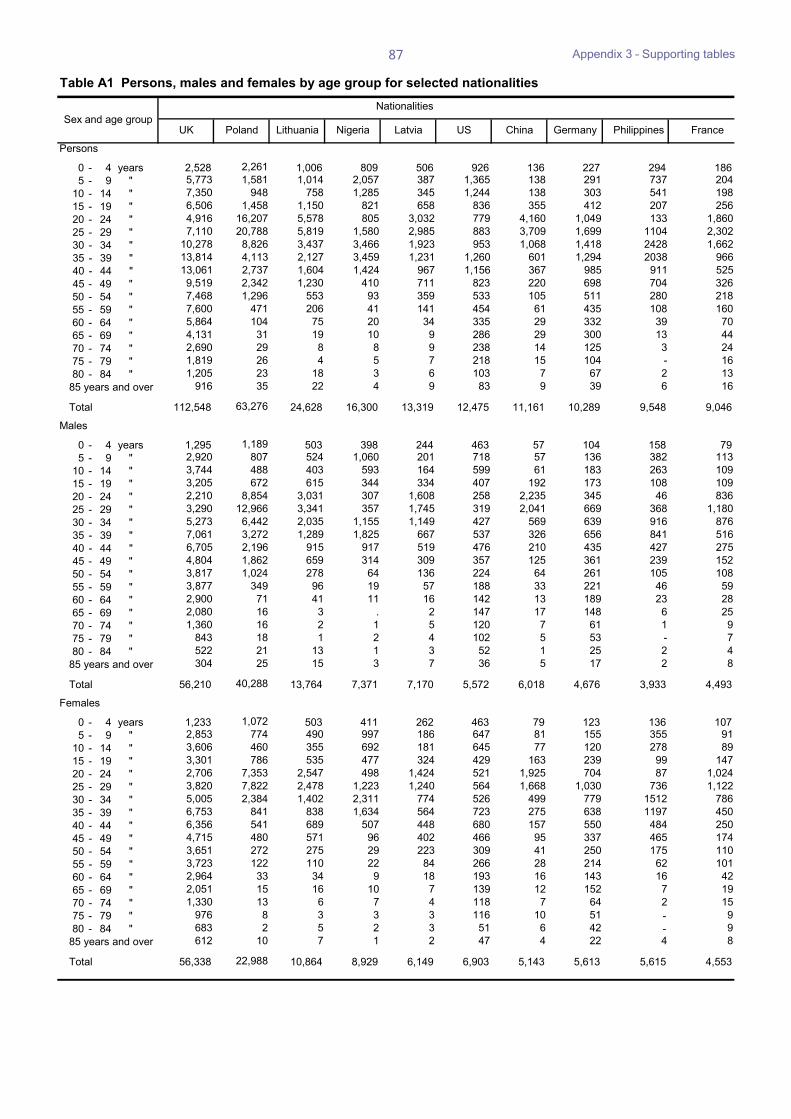
Appendix 3 – Supporting tables
87
Table A1 Persons, males and females by age group for selected nationalitiesNationalities
UK Poland Lithuania Nigeria Latvia US China Germany Philippines France
Persons
0 - 4 years 2,528 2,261 1,006 809 506 926 136 227 294 1865 - 9 " 5,773 1,581 1,014 2,057 387 1,365 138 291 737 204
10 - 14 " 7,350 948 758 1,285 345 1,244 138 303 541 19815 - 19 " 6,506 1,458 1,150 821 658 836 355 412 207 25620 - 24 " 4,916 16,207 5,578 805 3,032 779 4,160 1,049 133 1,86025 - 29 " 7,110 20,788 5,819 1,580 2,985 883 3,709 1,699 1104 2,30230 - 34 " 10,278 8,826 3,437 3,466 1,923 953 1,068 1,418 2428 1,66235 - 39 " 13,814 4,113 2,127 3,459 1,231 1,260 601 1,294 2038 96640 - 44 " 13,061 2,737 1,604 1,424 967 1,156 367 985 911 52545 - 49 " 9,519 2,342 1,230 410 711 823 220 698 704 32650 - 54 " 7,468 1,296 553 93 359 533 105 511 280 21855 - 59 " 7,600 471 206 41 141 454 61 435 108 16060 - 64 " 5,864 104 75 20 34 335 29 332 39 7065 - 69 " 4,131 31 19 10 9 286 29 300 13 4470 - 74 " 2,690 29 8 8 9 238 14 125 3 2475 - 79 " 1,819 26 4 5 7 218 15 104 - 1680 - 84 " 1,205 23 18 3 6 103 7 67 2 13
85 years and over 916 35 22 4 9 83 9 39 6 16
Total 112,548 63,276 24,628 16,300 13,319 12,475 11,161 10,289 9,548 9,046
Males
0 - 4 years 1,295 1,189 503 398 244 463 57 104 158 795 - 9 " 2,920 807 524 1,060 201 718 57 136 382 113
10 - 14 " 3,744 488 403 593 164 599 61 183 263 10915 - 19 " 3,205 672 615 344 334 407 192 173 108 10920 - 24 " 2,210 8,854 3,031 307 1,608 258 2,235 345 46 83625 - 29 " 3,290 12,966 3,341 357 1,745 319 2,041 669 368 1,18030 - 34 " 5,273 6,442 2,035 1,155 1,149 427 569 639 916 87635 - 39 " 7,061 3,272 1,289 1,825 667 537 326 656 841 51640 - 44 " 6,705 2,196 915 917 519 476 210 435 427 27545 - 49 " 4,804 1,862 659 314 309 357 125 361 239 15250 - 54 " 3,817 1,024 278 64 136 224 64 261 105 10855 - 59 " 3,877 349 96 19 57 188 33 221 46 5960 - 64 " 2,900 71 41 11 16 142 13 189 23 2865 - 69 " 2,080 16 3 . 2 147 17 148 6 2570 - 74 " 1,360 16 2 1 5 120 7 61 1 975 - 79 " 843 18 1 2 4 102 5 53 - 780 - 84 " 522 21 13 1 3 52 1 25 2 4
85 years and over 304 25 15 3 7 36 5 17 2 8
Total 56,210 40,288 13,764 7,371 7,170 5,572 6,018 4,676 3,933 4,493
Females
0 - 4 years 1,233 1,072 503 411 262 463 79 123 136 1075 - 9 " 2,853 774 490 997 186 647 81 155 355 91
10 - 14 " 3,606 460 355 692 181 645 77 120 278 8915 - 19 " 3,301 786 535 477 324 429 163 239 99 14720 - 24 " 2,706 7,353 2,547 498 1,424 521 1,925 704 87 1,02425 - 29 " 3,820 7,822 2,478 1,223 1,240 564 1,668 1,030 736 1,12230 - 34 " 5,005 2,384 1,402 2,311 774 526 499 779 1512 78635 - 39 " 6,753 841 838 1,634 564 723 275 638 1197 45040 - 44 " 6,356 541 689 507 448 680 157 550 484 25045 - 49 " 4,715 480 571 96 402 466 95 337 465 17450 - 54 " 3,651 272 275 29 223 309 41 250 175 11055 - 59 " 3,723 122 110 22 84 266 28 214 62 10160 - 64 " 2,964 33 34 9 18 193 16 143 16 4265 - 69 " 2,051 15 16 10 7 139 12 152 7 1970 - 74 " 1,330 13 6 7 4 118 7 64 2 1575 - 79 " 976 8 3 3 3 116 10 51 - 980 - 84 " 683 2 5 2 3 51 6 42 - 9
85 years and over 612 10 7 1 2 47 4 22 4 8
Total 56,338 22,988 10,864 8,929 6,149 6,903 5,143 5,613 5,615 4,553
Sex and age group
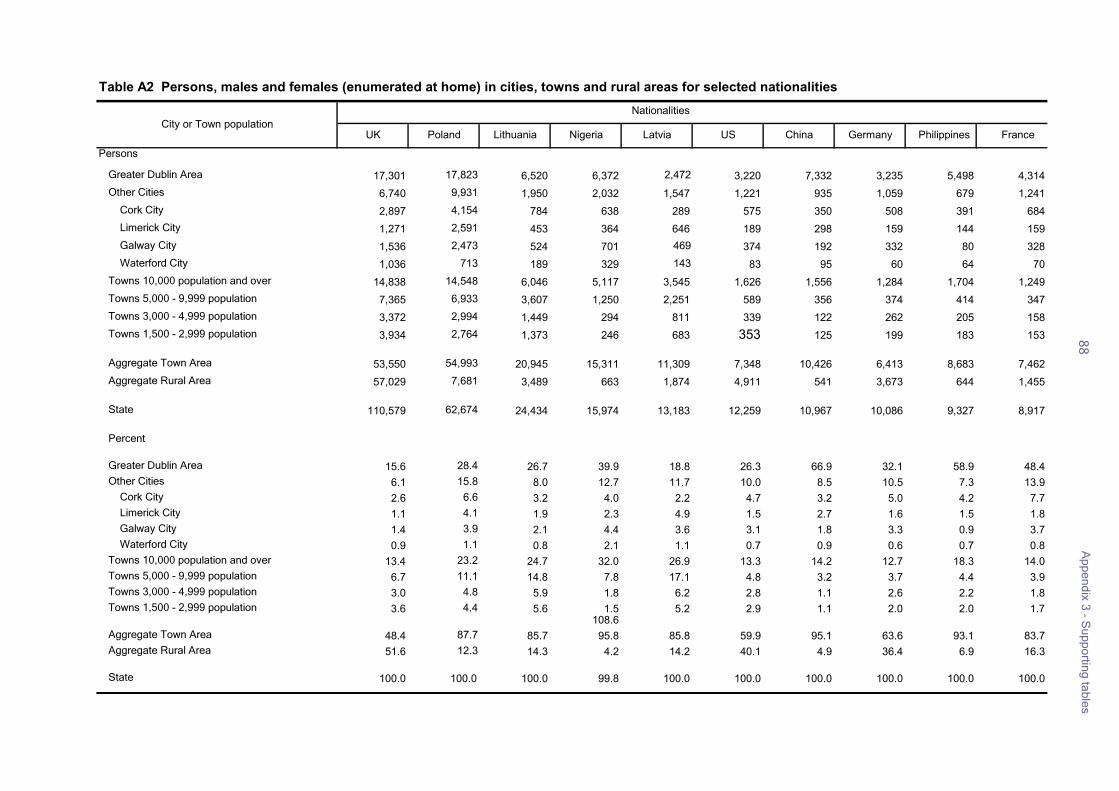
88A
ppendix 3 – Supporting tables
Table A2 Persons, males and females (enumerated at home) in cities, towns and rural areas for selected nationalities
Nationalities
UK Poland Lithuania Nigeria Latvia US China Germany Philippines France
Persons
Greater Dublin Area 17,301 17,823 6,520 6,372 2,472 3,220 7,332 3,235 5,498 4,314Other Cities 6,740 9,931 1,950 2,032 1,547 1,221 935 1,059 679 1,241 Cork City 2,897 4,154 784 638 289 575 350 508 391 684 Limerick City 1,271 2,591 453 364 646 189 298 159 144 159 Galway City 1,536 2,473 524 701 469 374 192 332 80 328 Waterford City 1,036 713 189 329 143 83 95 60 64 70Towns 10,000 population and over 14,838 14,548 6,046 5,117 3,545 1,626 1,556 1,284 1,704 1,249Towns 5,000 - 9,999 population 7,365 6,933 3,607 1,250 2,251 589 356 374 414 347Towns 3,000 - 4,999 population 3,372 2,994 1,449 294 811 339 122 262 205 158Towns 1,500 - 2,999 population 3,934 2,764 1,373 246 683 353 125 199 183 153
Aggregate Town Area 53,550 54,993 20,945 15,311 11,309 7,348 10,426 6,413 8,683 7,462Aggregate Rural Area 57,029 7,681 3,489 663 1,874 4,911 541 3,673 644 1,455
State 110,579 62,674 24,434 15,974 13,183 12,259 10,967 10,086 9,327 8,917
Percent
Greater Dublin Area 15.6 28.4 26.7 39.9 18.8 26.3 66.9 32.1 58.9 48.4Other Cities 6.1 15.8 8.0 12.7 11.7 10.0 8.5 10.5 7.3 13.9 Cork City 2.6 6.6 3.2 4.0 2.2 4.7 3.2 5.0 4.2 7.7 Limerick City 1.1 4.1 1.9 2.3 4.9 1.5 2.7 1.6 1.5 1.8 Galway City 1.4 3.9 2.1 4.4 3.6 3.1 1.8 3.3 0.9 3.7 Waterford City 0.9 1.1 0.8 2.1 1.1 0.7 0.9 0.6 0.7 0.8Towns 10,000 population and over 13.4 23.2 24.7 32.0 26.9 13.3 14.2 12.7 18.3 14.0Towns 5,000 - 9,999 population 6.7 11.1 14.8 7.8 17.1 4.8 3.2 3.7 4.4 3.9Towns 3,000 - 4,999 population 3.0 4.8 5.9 1.8 6.2 2.8 1.1 2.6 2.2 1.8Towns 1,500 - 2,999 population 3.6 4.4 5.6 1.5 5.2 2.9 1.1 2.0 2.0 1.7
108.6Aggregate Town Area 48.4 87.7 85.7 95.8 85.8 59.9 95.1 63.6 93.1 83.7Aggregate Rural Area 51.6 12.3 14.3 4.2 14.2 40.1 4.9 36.4 6.9 16.3
State 100.0 100.0 100.0 99.8 100.0 100.0 100.0 100.0 100.0 100.0
City or Town population
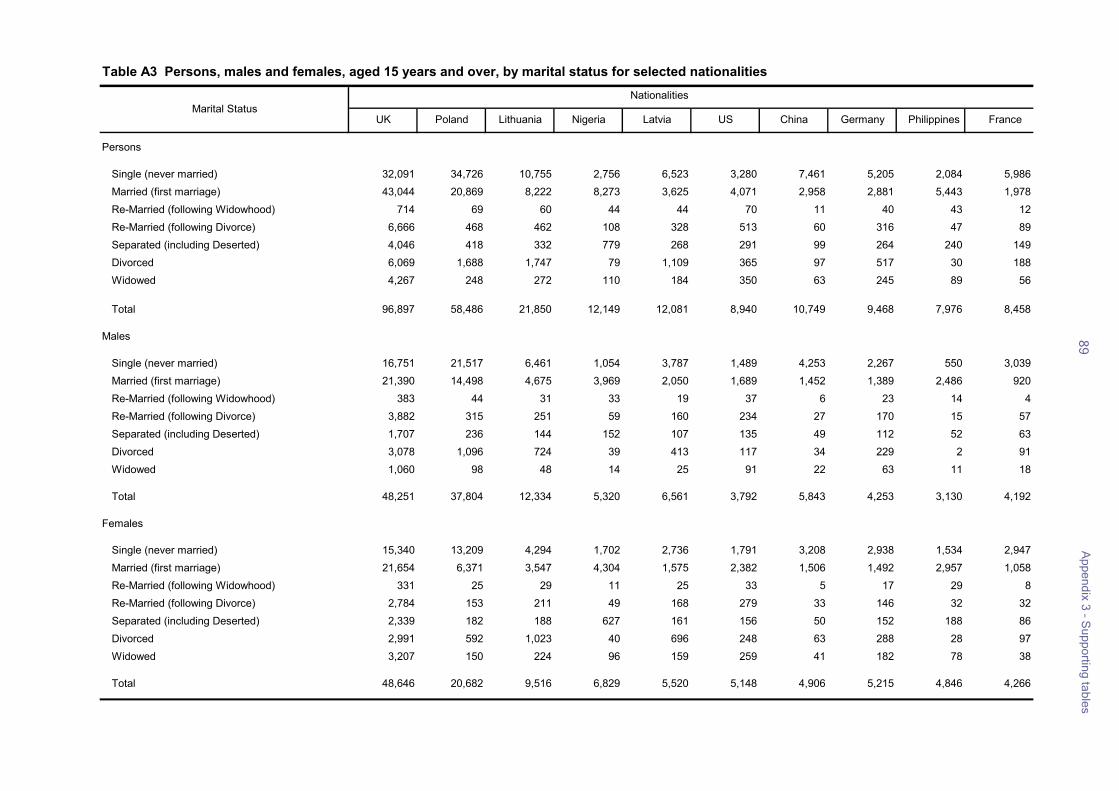
89A
ppendix 3 – Supporting tables
Table A3 Persons, males and females, aged 15 years and over, by marital status for selected nationalitiesNationalities
UK Poland Lithuania Nigeria Latvia US China Germany Philippines France
Persons
Single (never married) 32,091 34,726 10,755 2,756 6,523 3,280 7,461 5,205 2,084 5,986Married (first marriage) 43,044 20,869 8,222 8,273 3,625 4,071 2,958 2,881 5,443 1,978Re-Married (following Widowhood) 714 69 60 44 44 70 11 40 43 12Re-Married (following Divorce) 6,666 468 462 108 328 513 60 316 47 89Separated (including Deserted) 4,046 418 332 779 268 291 99 264 240 149Divorced 6,069 1,688 1,747 79 1,109 365 97 517 30 188Widowed 4,267 248 272 110 184 350 63 245 89 56
Total 96,897 58,486 21,850 12,149 12,081 8,940 10,749 9,468 7,976 8,458
Males
Single (never married) 16,751 21,517 6,461 1,054 3,787 1,489 4,253 2,267 550 3,039Married (first marriage) 21,390 14,498 4,675 3,969 2,050 1,689 1,452 1,389 2,486 920Re-Married (following Widowhood) 383 44 31 33 19 37 6 23 14 4Re-Married (following Divorce) 3,882 315 251 59 160 234 27 170 15 57Separated (including Deserted) 1,707 236 144 152 107 135 49 112 52 63Divorced 3,078 1,096 724 39 413 117 34 229 2 91Widowed 1,060 98 48 14 25 91 22 63 11 18
Total 48,251 37,804 12,334 5,320 6,561 3,792 5,843 4,253 3,130 4,192
Females
Single (never married) 15,340 13,209 4,294 1,702 2,736 1,791 3,208 2,938 1,534 2,947Married (first marriage) 21,654 6,371 3,547 4,304 1,575 2,382 1,506 1,492 2,957 1,058Re-Married (following Widowhood) 331 25 29 11 25 33 5 17 29 8Re-Married (following Divorce) 2,784 153 211 49 168 279 33 146 32 32Separated (including Deserted) 2,339 182 188 627 161 156 50 152 188 86Divorced 2,991 592 1,023 40 696 248 63 288 28 97Widowed 3,207 150 224 96 159 259 41 182 78 38
Total 48,646 20,682 9,516 6,829 5,520 5,148 4,906 5,215 4,846 4,266
Marital Status
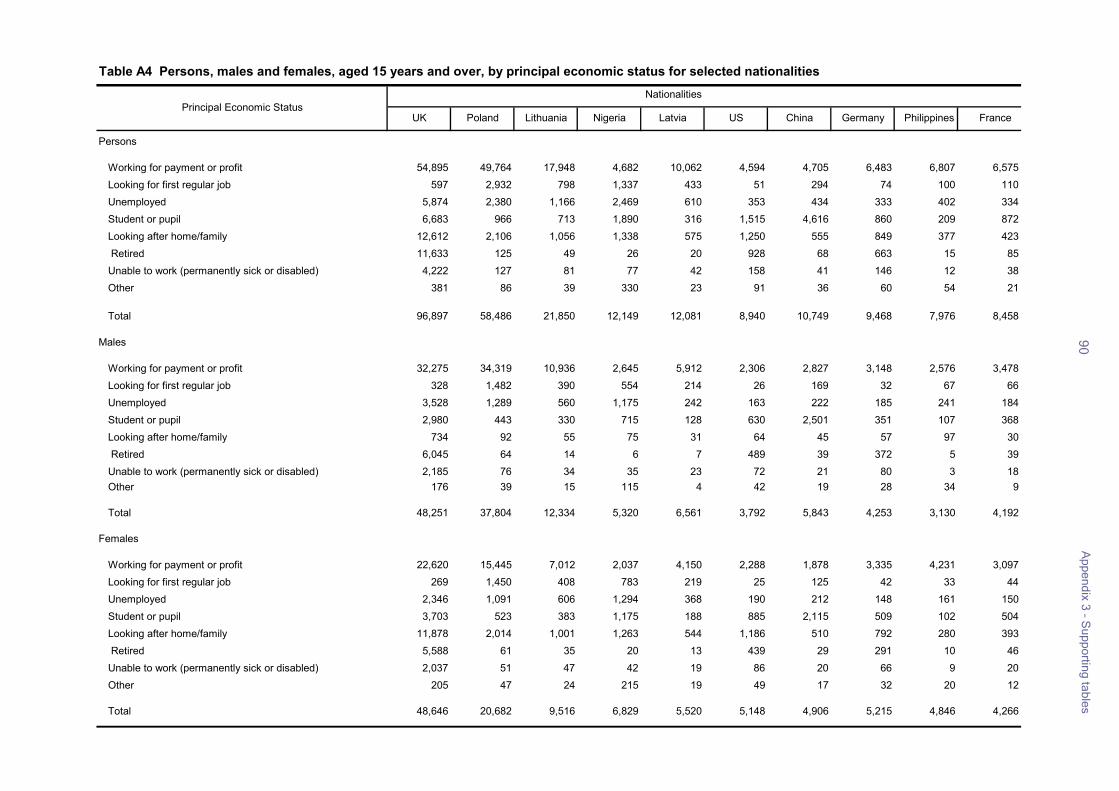
90A
ppendix 3 – Supporting tables
Table A4 Persons, males and females, aged 15 years and over, by principal economic status for selected nationalitiesNationalities
UK Poland Lithuania Nigeria Latvia US China Germany Philippines France
Persons
Working for payment or profit 54,895 49,764 17,948 4,682 10,062 4,594 4,705 6,483 6,807 6,575Looking for first regular job 597 2,932 798 1,337 433 51 294 74 100 110Unemployed 5,874 2,380 1,166 2,469 610 353 434 333 402 334Student or pupil 6,683 966 713 1,890 316 1,515 4,616 860 209 872Looking after home/family 12,612 2,106 1,056 1,338 575 1,250 555 849 377 423 Retired 11,633 125 49 26 20 928 68 663 15 85Unable to work (permanently sick or disabled) 4,222 127 81 77 42 158 41 146 12 38Other 381 86 39 330 23 91 36 60 54 21
Total 96,897 58,486 21,850 12,149 12,081 8,940 10,749 9,468 7,976 8,458
Males
Working for payment or profit 32,275 34,319 10,936 2,645 5,912 2,306 2,827 3,148 2,576 3,478Looking for first regular job 328 1,482 390 554 214 26 169 32 67 66Unemployed 3,528 1,289 560 1,175 242 163 222 185 241 184Student or pupil 2,980 443 330 715 128 630 2,501 351 107 368Looking after home/family 734 92 55 75 31 64 45 57 97 30 Retired 6,045 64 14 6 7 489 39 372 5 39Unable to work (permanently sick or disabled) 2,185 76 34 35 23 72 21 80 3 18Other 176 39 15 115 4 42 19 28 34 9
Total 48,251 37,804 12,334 5,320 6,561 3,792 5,843 4,253 3,130 4,192
Females
Working for payment or profit 22,620 15,445 7,012 2,037 4,150 2,288 1,878 3,335 4,231 3,097Looking for first regular job 269 1,450 408 783 219 25 125 42 33 44Unemployed 2,346 1,091 606 1,294 368 190 212 148 161 150Student or pupil 3,703 523 383 1,175 188 885 2,115 509 102 504Looking after home/family 11,878 2,014 1,001 1,263 544 1,186 510 792 280 393 Retired 5,588 61 35 20 13 439 29 291 10 46Unable to work (permanently sick or disabled) 2,037 51 47 42 19 86 20 66 9 20Other 205 47 24 215 19 49 17 32 20 12
Total 48,646 20,682 9,516 6,829 5,520 5,148 4,906 5,215 4,846 4,266
Principal Economic Status
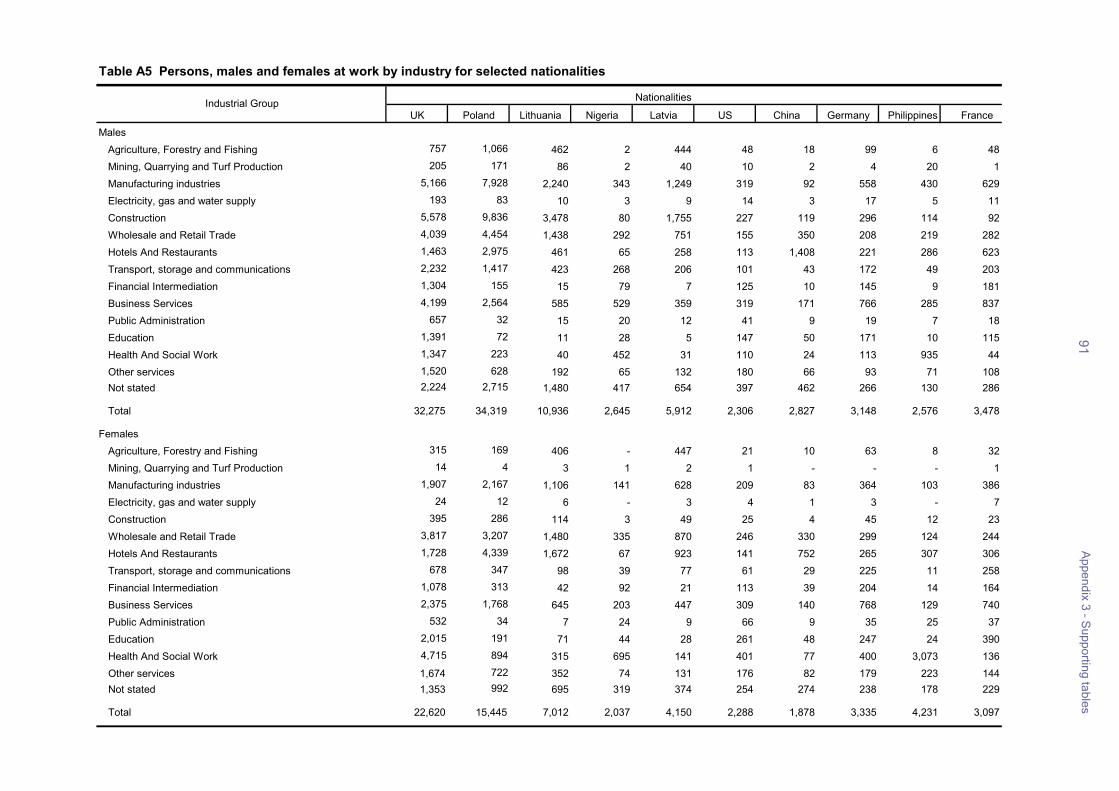
91A
ppendix 3 – Supporting tables
Table A5 Persons, males and females at work by industry for selected nationalities
Nationalities
UK Poland Lithuania Nigeria Latvia US China Germany Philippines FranceMales
Agriculture, Forestry and Fishing 757 1,066 462 2 444 48 18 99 6 48Mining, Quarrying and Turf Production 205 171 86 2 40 10 2 4 20 1Manufacturing industries 5,166 7,928 2,240 343 1,249 319 92 558 430 629Electricity, gas and water supply 193 83 10 3 9 14 3 17 5 11Construction 5,578 9,836 3,478 80 1,755 227 119 296 114 92Wholesale and Retail Trade 4,039 4,454 1,438 292 751 155 350 208 219 282Hotels And Restaurants 1,463 2,975 461 65 258 113 1,408 221 286 623Transport, storage and communications 2,232 1,417 423 268 206 101 43 172 49 203Financial Intermediation 1,304 155 15 79 7 125 10 145 9 181Business Services 4,199 2,564 585 529 359 319 171 766 285 837Public Administration 657 32 15 20 12 41 9 19 7 18Education 1,391 72 11 28 5 147 50 171 10 115Health And Social Work 1,347 223 40 452 31 110 24 113 935 44Other services 1,520 628 192 65 132 180 66 93 71 108Not stated 2,224 2,715 1,480 417 654 397 462 266 130 286
Total 32,275 34,319 10,936 2,645 5,912 2,306 2,827 3,148 2,576 3,478
FemalesAgriculture, Forestry and Fishing 315 169 406 - 447 21 10 63 8 32Mining, Quarrying and Turf Production 14 4 3 1 2 1 - - - 1Manufacturing industries 1,907 2,167 1,106 141 628 209 83 364 103 386Electricity, gas and water supply 24 12 6 - 3 4 1 3 - 7Construction 395 286 114 3 49 25 4 45 12 23Wholesale and Retail Trade 3,817 3,207 1,480 335 870 246 330 299 124 244Hotels And Restaurants 1,728 4,339 1,672 67 923 141 752 265 307 306Transport, storage and communications 678 347 98 39 77 61 29 225 11 258Financial Intermediation 1,078 313 42 92 21 113 39 204 14 164Business Services 2,375 1,768 645 203 447 309 140 768 129 740Public Administration 532 34 7 24 9 66 9 35 25 37Education 2,015 191 71 44 28 261 48 247 24 390Health And Social Work 4,715 894 315 695 141 401 77 400 3,073 136Other services 1,674 722 352 74 131 176 82 179 223 144Not stated 1,353 992 695 319 374 254 274 238 178 229
Total 22,620 15,445 7,012 2,037 4,150 2,288 1,878 3,335 4,231 3,097
Industrial Group
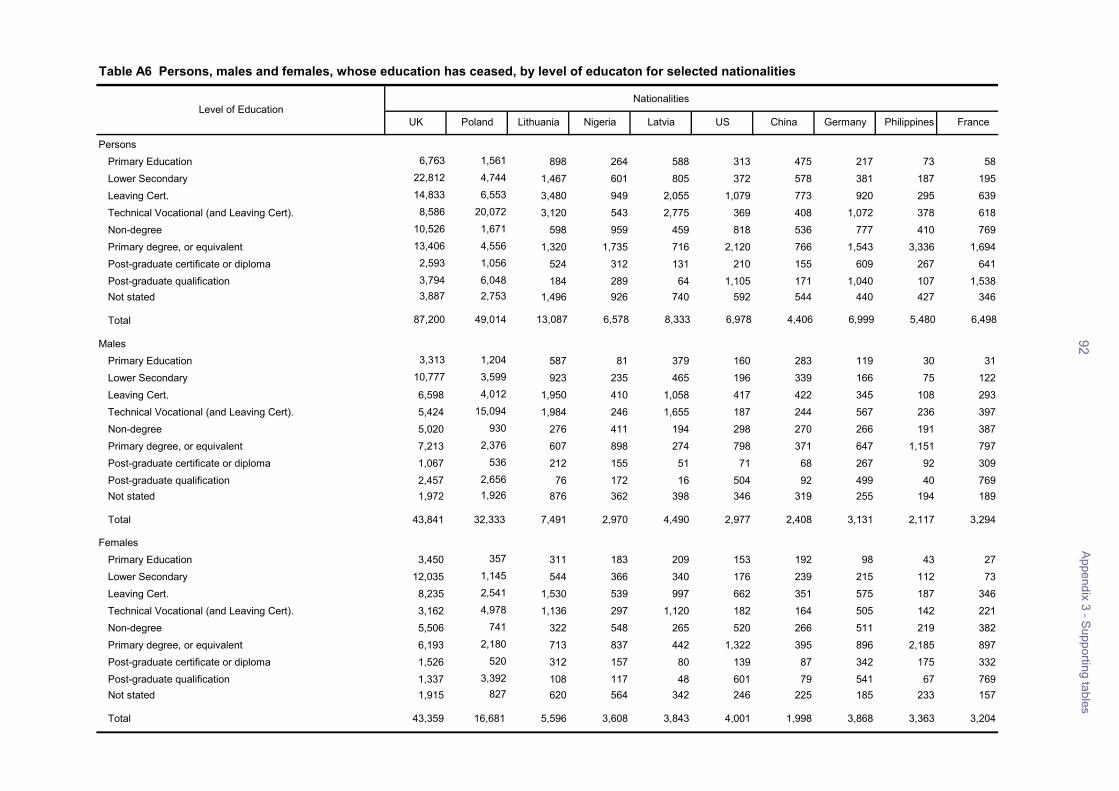
92
Appendix 3 – S
upporting tables
Table A6 Persons, males and females, whose education has ceased, by level of educaton for selected nationalities
Nationalities
UK Poland Lithuania Nigeria Latvia US China Germany Philippines France
PersonsPrimary Education 6,763 1,561 898 264 588 313 475 217 73 58Lower Secondary 22,812 4,744 1,467 601 805 372 578 381 187 195Leaving Cert. 14,833 6,553 3,480 949 2,055 1,079 773 920 295 639Technical Vocational (and Leaving Cert). 8,586 20,072 3,120 543 2,775 369 408 1,072 378 618Non-degree 10,526 1,671 598 959 459 818 536 777 410 769Primary degree, or equivalent 13,406 4,556 1,320 1,735 716 2,120 766 1,543 3,336 1,694Post-graduate certificate or diploma 2,593 1,056 524 312 131 210 155 609 267 641Post-graduate qualification 3,794 6,048 184 289 64 1,105 171 1,040 107 1,538Not stated 3,887 2,753 1,496 926 740 592 544 440 427 346
Total 87,200 49,014 13,087 6,578 8,333 6,978 4,406 6,999 5,480 6,498
MalesPrimary Education 3,313 1,204 587 81 379 160 283 119 30 31Lower Secondary 10,777 3,599 923 235 465 196 339 166 75 122Leaving Cert. 6,598 4,012 1,950 410 1,058 417 422 345 108 293Technical Vocational (and Leaving Cert). 5,424 15,094 1,984 246 1,655 187 244 567 236 397Non-degree 5,020 930 276 411 194 298 270 266 191 387Primary degree, or equivalent 7,213 2,376 607 898 274 798 371 647 1,151 797Post-graduate certificate or diploma 1,067 536 212 155 51 71 68 267 92 309Post-graduate qualification 2,457 2,656 76 172 16 504 92 499 40 769Not stated 1,972 1,926 876 362 398 346 319 255 194 189
Total 43,841 32,333 7,491 2,970 4,490 2,977 2,408 3,131 2,117 3,294
FemalesPrimary Education 3,450 357 311 183 209 153 192 98 43 27Lower Secondary 12,035 1,145 544 366 340 176 239 215 112 73Leaving Cert. 8,235 2,541 1,530 539 997 662 351 575 187 346Technical Vocational (and Leaving Cert). 3,162 4,978 1,136 297 1,120 182 164 505 142 221Non-degree 5,506 741 322 548 265 520 266 511 219 382Primary degree, or equivalent 6,193 2,180 713 837 442 1,322 395 896 2,185 897Post-graduate certificate or diploma 1,526 520 312 157 80 139 87 342 175 332Post-graduate qualification 1,337 3,392 108 117 48 601 79 541 67 769Not stated 1,915 827 620 564 342 246 225 185 233 157
Total 43,359 16,681 5,596 3,608 3,843 4,001 1,998 3,868 3,363 3,204
Level of Education
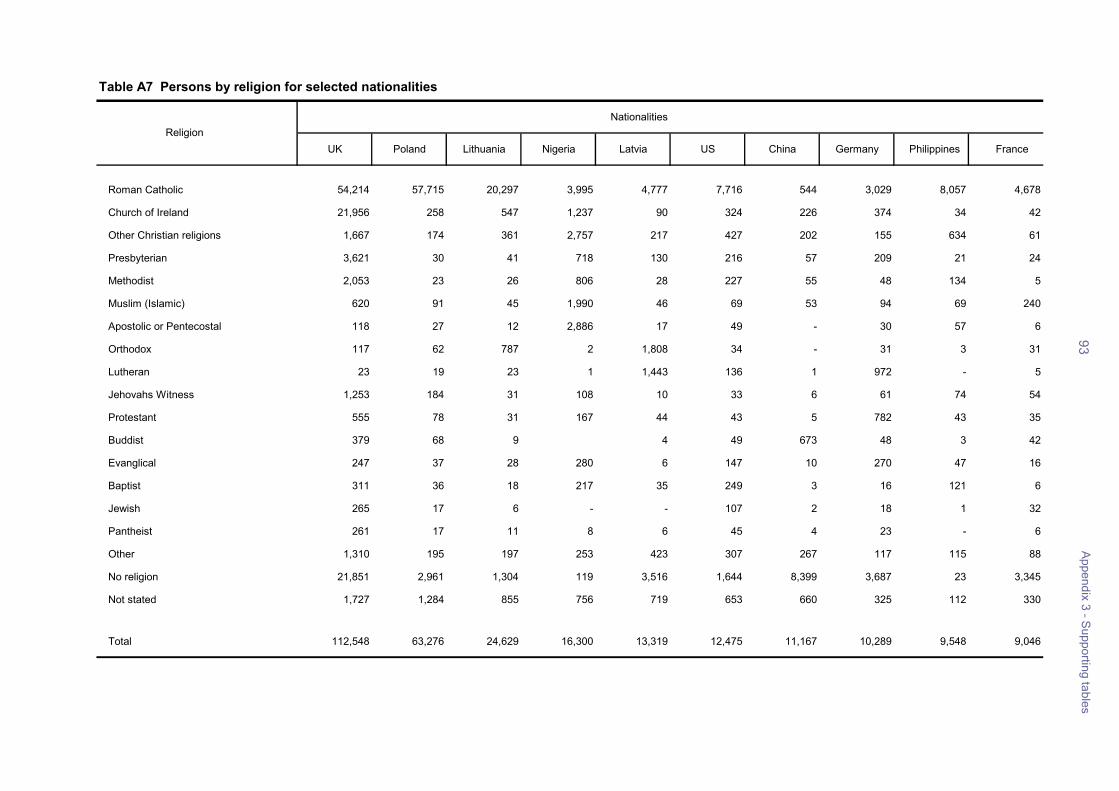
93A
ppendix 3 – Supporting tables
Table A7 Persons by religion for selected nationalities
Nationalities
UK Poland Lithuania Nigeria Latvia US China Germany Philippines France
Roman Catholic 54,214 57,715 20,297 3,995 4,777 7,716 544 3,029 8,057 4,678
Church of Ireland 21,956 258 547 1,237 90 324 226 374 34 42
Other Christian religions 1,667 174 361 2,757 217 427 202 155 634 61
Presbyterian 3,621 30 41 718 130 216 57 209 21 24
Methodist 2,053 23 26 806 28 227 55 48 134 5
Muslim (Islamic) 620 91 45 1,990 46 69 53 94 69 240
Apostolic or Pentecostal 118 27 12 2,886 17 49 - 30 57 6
Orthodox 117 62 787 2 1,808 34 - 31 3 31
Lutheran 23 19 23 1 1,443 136 1 972 - 5
Jehovahs Witness 1,253 184 31 108 10 33 6 61 74 54
Protestant 555 78 31 167 44 43 5 782 43 35
Buddist 379 68 9 4 49 673 48 3 42
Evanglical 247 37 28 280 6 147 10 270 47 16
Baptist 311 36 18 217 35 249 3 16 121 6
Jewish 265 17 6 - - 107 2 18 1 32
Pantheist 261 17 11 8 6 45 4 23 - 6
Other 1,310 195 197 253 423 307 267 117 115 88
No religion 21,851 2,961 1,304 119 3,516 1,644 8,399 3,687 23 3,345
Not stated 1,727 1,284 855 756 719 653 660 325 112 330
Total 112,548 63,276 24,629 16,300 13,319 12,475 11,167 10,289 9,548 9,046
Religion
Appendix 4 - Acknowledgements
94
Appendix 4
Acknowledgements The Central Statistics Office would like to thank the following individuals and organisations for the use of the photographs in this report
UK Patrick and Eoin Fisher Poland Mr. Aro Szwonka/Polski Express Lithuania Andrei Drunov Nigeria Reginald Inya Latvia Latvian Community USA Kevin Smithwick China Ms. Yeni Tang and Ms. Sifan Chan Germany Mr. Matthias Ewart and Mr. Jochen Zaiss Philippines Filipino Cultural Committee Ireland
All maps of Ireland are © Ordnance Survey Ireland. All rights reserved. License number 01/05/001