Embed Size (px)
Citation preview
An Phríomh-Oifig Staidrimh
Central Statistics Office
Published by the Stationery Office, Dublin, Ireland.
Available from:
Central Statistics Office, Information Section, Skehard Road, Cork.
Compiled by the Central Statistics Office on behalf of the Department ofSocial Protection.
[No. 590] February 2012

© Government of Ireland 2012
Material compiled and presented byCentral Statistics Office.
Reproduction is authorised, except for commercialpurposes, provided the source is acknowledged.
ISSN 0790-7710
Contents
Second Quarter 2011
Page
Commentary 4
Tables
Table 1a Marriages and births by quarter, 2006, 2010 and 2011 8
Table 1b Births classified by age of mother at maternity by quarter 2006, 2010 and 2011 and 8their corresponding annual age specific (asfr) and total period fertility rates (tpfr)
Table 2a Deaths registered by cause of death and by quarter, 2006, 2010 and 2011 9
Table 2b Deaths registered by cause of death, by age and region 9
Table 3 Marriages, births, deaths and natural increase 10
Table 4 Annual marriage, birth, death and natural increase rates per 1,000 population 11
Table 5 Births registered, classified by area of residence of mother 12
Table 6 Births registered, classified by age of mother and previous number of liveborn children 13
Table 7 Number and percentage of births within and outside marriage, classified by age 14of mother
Table 8 Number and percentage of births registered within and outside marriage, classified by 15area of residence of mother
Table 9 Births registered, classified by area of residence and age of mother 16
Table 10 Births registered outside marriage, classified by area of residence and age of mother 17
Table 11 Births registered, classified by nationality of mother, marital status and age 17
Table 12 Deaths registered by county of residence of deceased 18
Table 13 Deaths registered by cause of death and county of residence of deceased 19
Table 14 Deaths registered classified by cause and age group 20
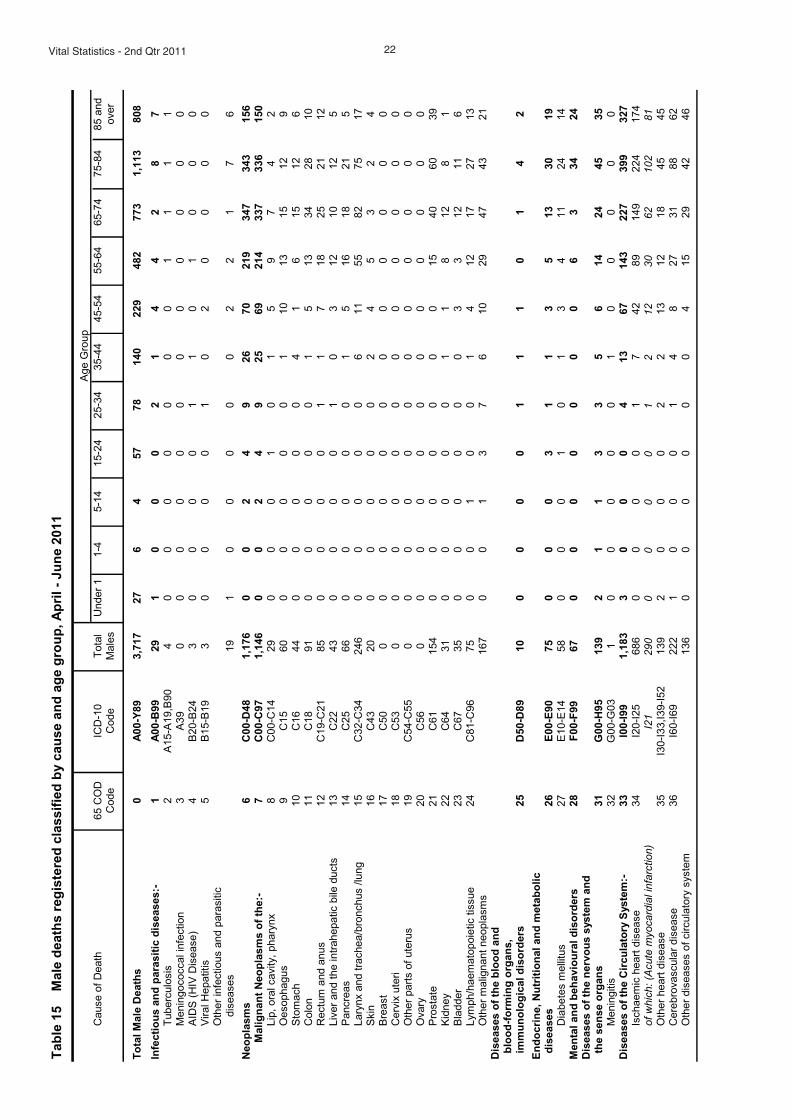
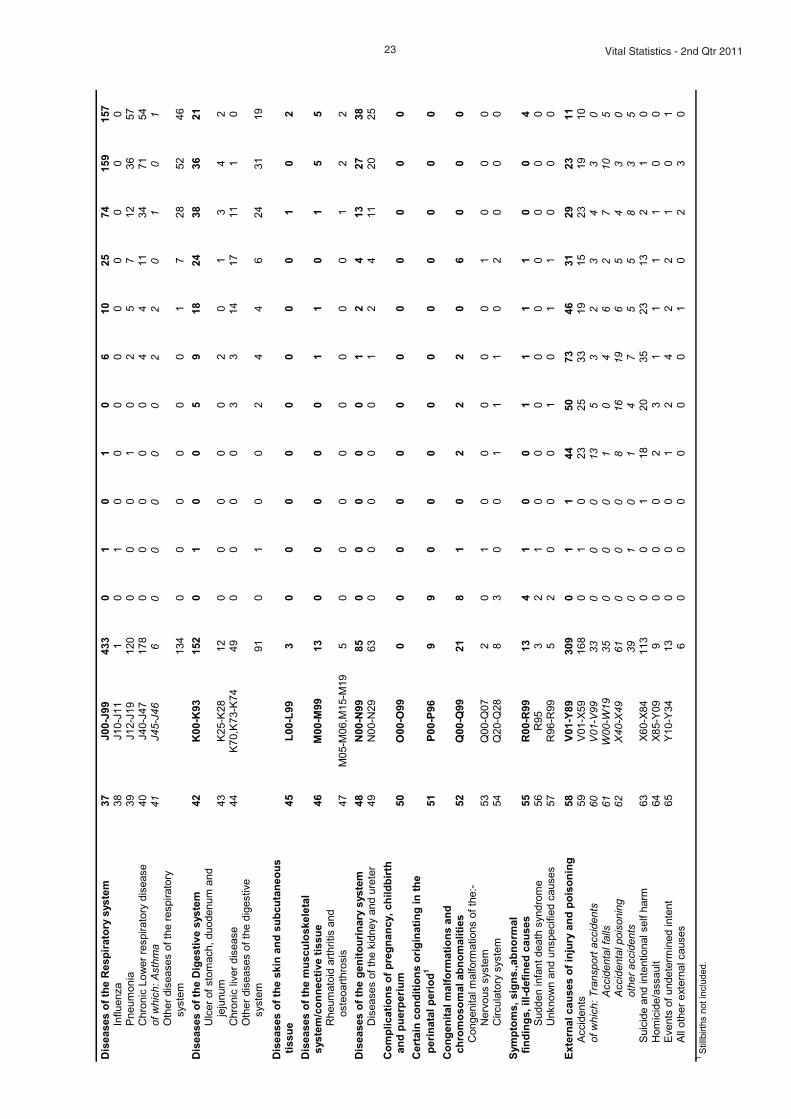
Table 15 Male deaths registered, classified by cause and age group 22
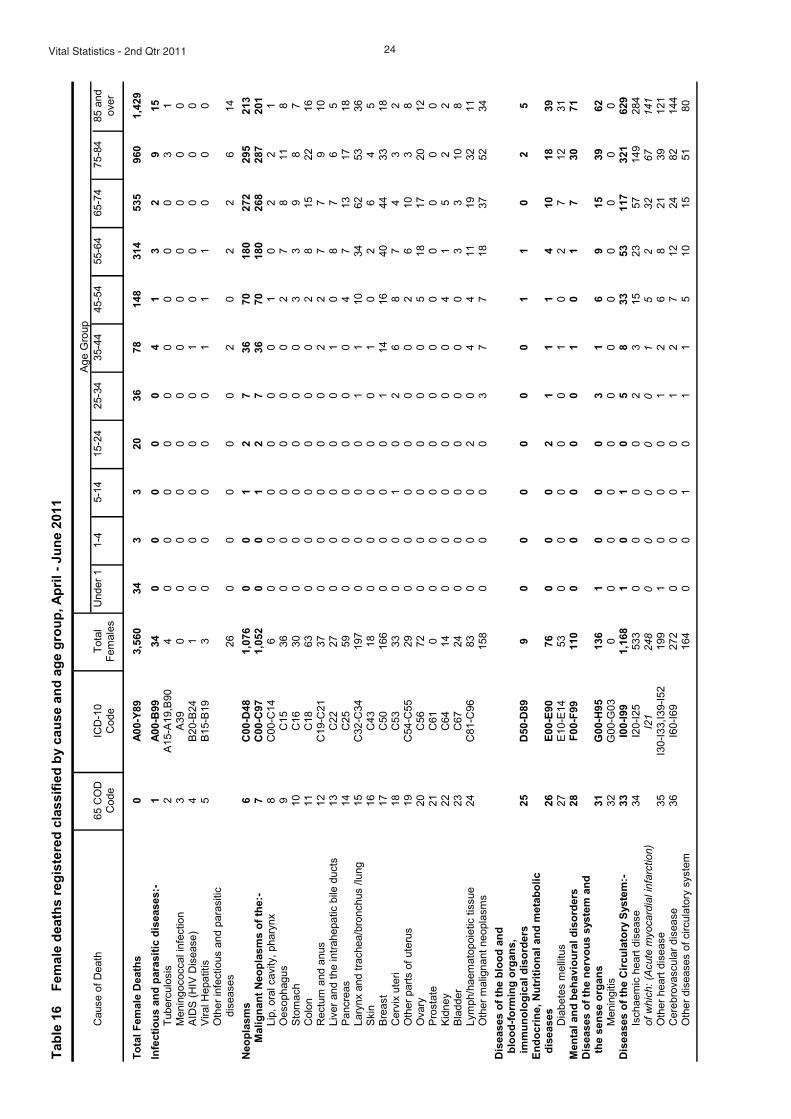
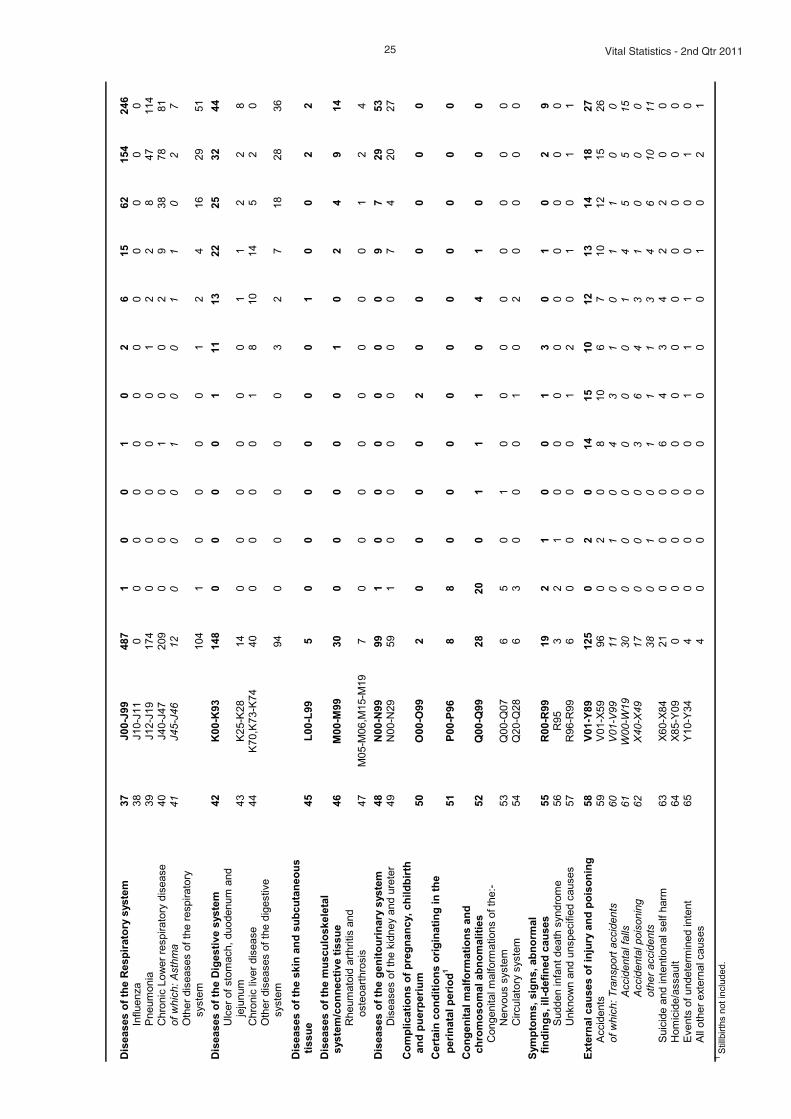
Table 16 Female deaths registered classified by cause and age group 24
Table 17 Infant and neonatal mortality by area of residence of deceased 26
Appendix
Glossary of terms 30
Causes of death Eurostat shortlist (August 1998) 31
Estimated population classified by sex and age group, 2006-2011 32
Background Notes 33
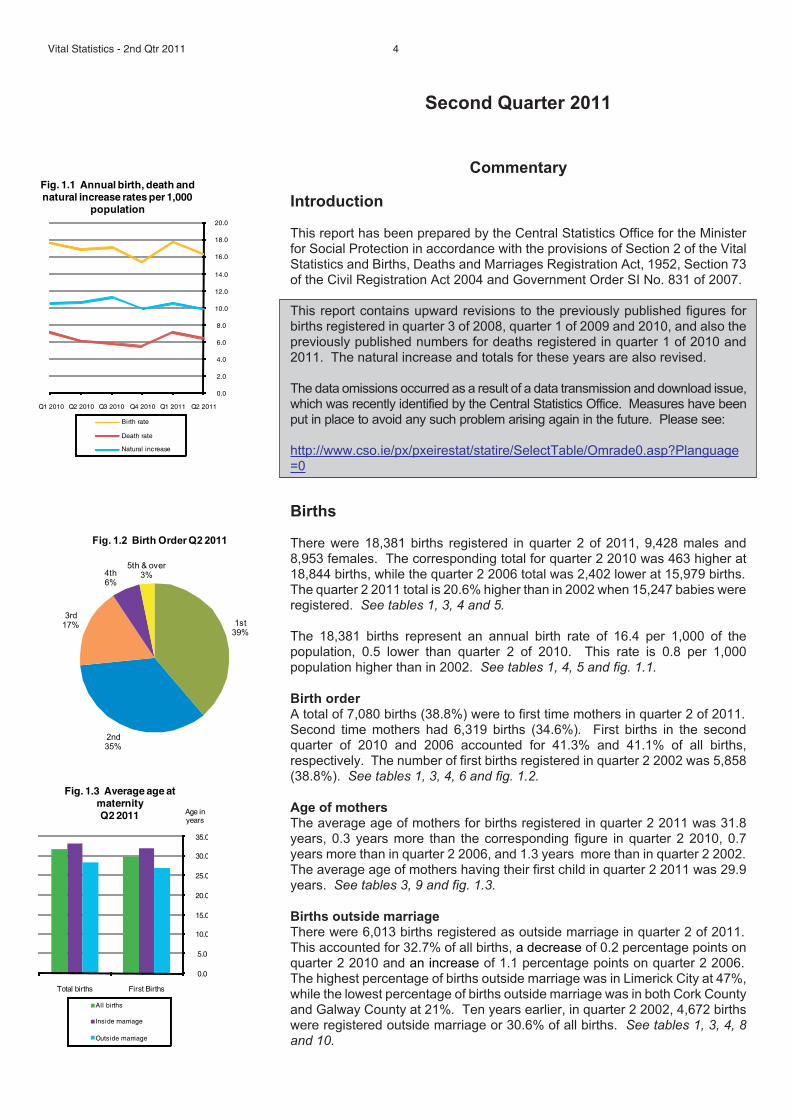
1st39%
2nd35%
3rd17%
4th6%
5th & over3%
Fig. 1.2 Birth Order Q2 2011
0.0
5.0
10.0
15.0
20.0
25.0
30.0
35.0
Total births First Births
Age inyears
Fig. 1.3 Average age atmaternityQ2 2011
All births
Inside marriage
Outside marriage
0.0
2.0
4.0
6.0
8.0
10.0
12.0
14.0
16.0
18.0
20.0
Q1 2010 Q2 2010 Q3 2010 Q4 2010 Q1 2011 Q2 2011
Fig. 1.1 Annual birth, death andnatural increase rates per 1,000
population
Birth rate
Death rate
Natural increase
Second Quarter 2011
Commentary
Introduction
This report has been prepared by the Central Statistics Office for the Ministerfor Social Protection in accordance with the provisions of Section 2 of the VitalStatistics and Births, Deaths and Marriages Registration Act, 1952, Section 73of the Civil Registration Act 2004 and Government Order SI No. 831 of 2007.
This report contains upward revisions to the previously published figures forbirths registered in quarter 3 of 2008, quarter 1 of 2009 and 2010, and also thepreviously published numbers for deaths registered in quarter 1 of 2010 and2011. The natural increase and totals for these years are also revised.
The data omissions occurred as a result of a data transmission and download issue,which was recently identified by the Central Statistics Office. Measures have beenput in place to avoid any such problem arising again in the future. Please see:
http://www.cso.ie/px/pxeirestat/statire/SelectTable/Omrade0.asp?Planguage=0
Births
There were 18,381 births registered in quarter 2 of 2011, 9,428 males and8,953 females. The corresponding total for quarter 2 2010 was 463 higher at18,844 births, while the quarter 2 2006 total was 2,402 lower at 15,979 births.The quarter 2 2011 total is 20.6% higher than in 2002 when 15,247 babies wereregistered. See tables 1, 3, 4 and 5.
The 18,381 births represent an annual birth rate of 16.4 per 1,000 of thepopulation, 0.5 lower than quarter 2 of 2010. This rate is 0.8 per 1,000population higher than in 2002. See tables 1, 4, 5 and fig. 1.1.
Birth orderA total of 7,080 births (38.8%) were to first time mothers in quarter 2 of 2011.Second time mothers had 6,319 births (34.6%). First births in the secondquarter of 2010 and 2006 accounted for 41.3% and 41.1% of all births,respectively. The number of first births registered in quarter 2 2002 was 5,858(38.8%). See tables 1, 3, 4, 6 and fig. 1.2.
Age of mothersThe average age of mothers for births registered in quarter 2 2011 was 31.8years, 0.3 years more than the corresponding figure in quarter 2 2010, 0.7years more than in quarter 2 2006, and 1.3 years more than in quarter 2 2002.The average age of mothers having their first child in quarter 2 2011 was 29.9years. See tables 3, 9 and fig. 1.3.
Births outside marriageThere were 6,013 births registered as outside marriage in quarter 2 of 2011.This accounted for 32.7% of all births, a decrease of 0.2 percentage points onquarter 2 2010 and an increase of 1.1 percentage points on quarter 2 2006.The highest percentage of births outside marriage was in Limerick City at 47%,while the lowest percentage of births outside marriage was in both Cork Countyand Galway County at 21%. Ten years earlier, in quarter 2 2002, 4,672 birthswere registered outside marriage or 30.6% of all births. See tables 1, 3, 4, 8and 10.
Vital Statistics - 2nd Qtr 2011 4
circulatorydiseases
32%
malignantneoplasms
30%
respiratorydiseases
13%
externalcauses
6%
remainder19%
Fig. 1.5 Principal causes of death,Q2 2011
0.0
0.5
1.0
1.5
2.0
2.5
3.0
3.5
4.0
4.5
5.0
Q1 2010 Q2 2010 Q3 2010 Q4 2010 Q1 2011 Q2 2011
Fig. 1.4 Infant and neonatal mortalityrates per 1,000 live births
Infant
Neonatal
5 Vital Statistics - 2nd Qtr 2011
The average age of mothers at maternity outside of marriage, was 28.5 years.This ranged from 30.2 years in Sligo to 27.2 years in Carlow. See table 10.
Deaths
There were 7,277 deaths registered in quarter 2 2011, 3,717 males and 3,560females. This represents an annual death rate of 6.5 per 1,000 population. Thequarter 2 2011 total is 5.0% higher than in 2010 and 4.4% higher than in 2006,when 6,929 and 6,967 deaths were registered. See tables 2, 3, 12 and fig.1.1.
Age at death
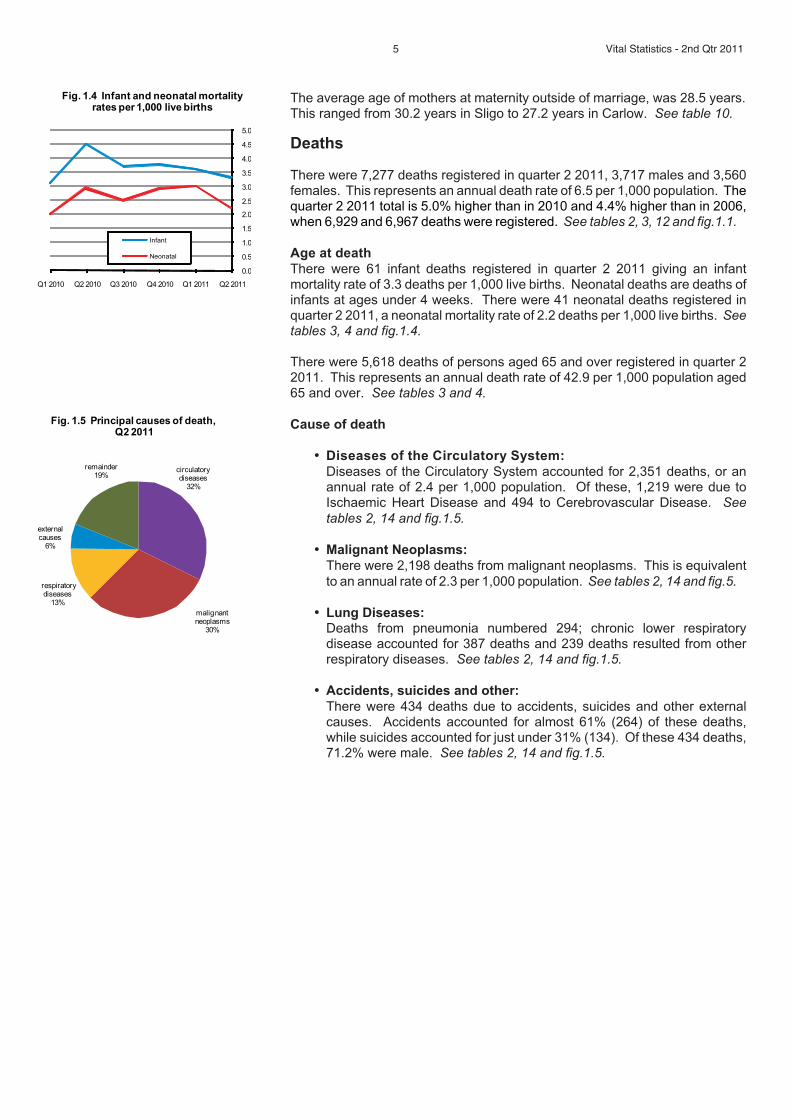
There were 61 infant deaths registered in quarter 2 2011 giving an infantmortality rate of 3.3 deaths per 1,000 live births. Neonatal deaths are deaths ofinfants at ages under 4 weeks. There were 41 neonatal deaths registered inquarter 2 2011, a neonatal mortality rate of 2.2 deaths per 1,000 live births. Seetables 3, 4 and fig.1.4.
There were 5,618 deaths of persons aged 65 and over registered in quarter 22011. This represents an annual death rate of 42.9 per 1,000 population aged65 and over. See tables 3 and 4.
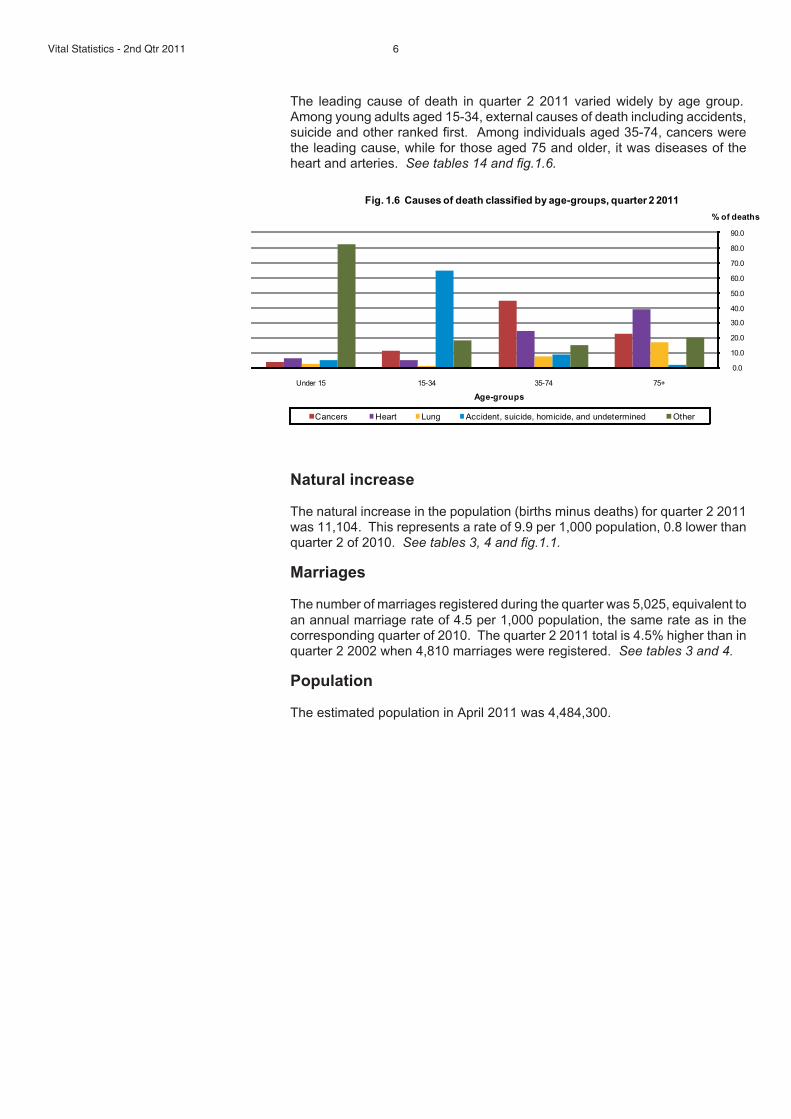
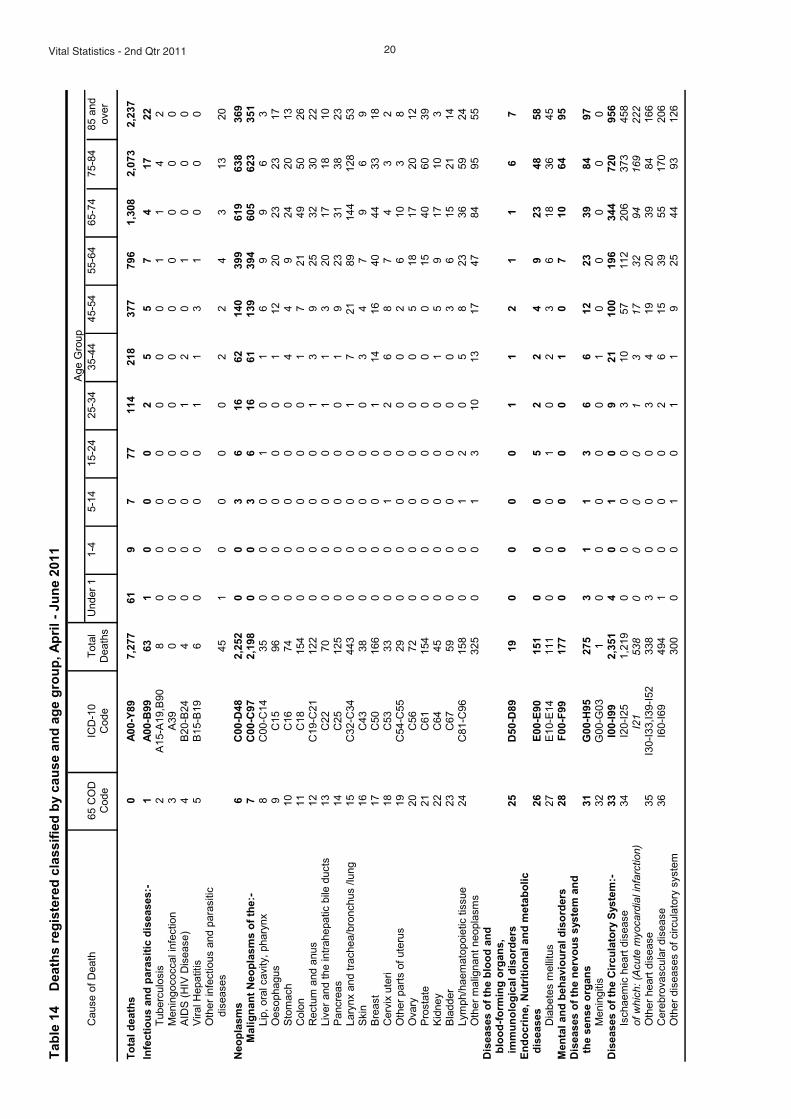
Cause of death
� Diseases of the Circulatory System:
Diseases of the Circulatory System accounted for 2,351 deaths, or anannual rate of 2.4 per 1,000 population. Of these, 1,219 were due toIschaemic Heart Disease and 494 to Cerebrovascular Disease. See
tables 2, 14 and fig.1.5.
� Malignant Neoplasms:
There were 2,198 deaths from malignant neoplasms. This is equivalent
to an annual rate of 2.3 per 1,000 population. See tables 2, 14 and fig.5.
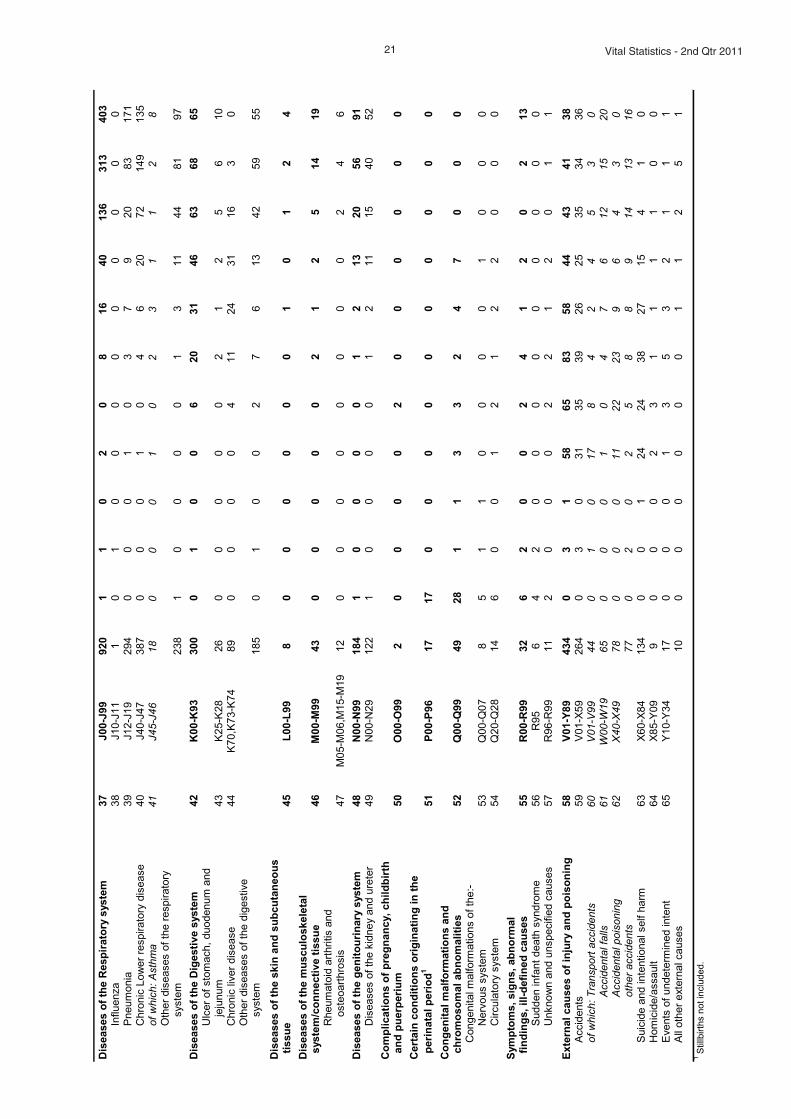
� Lung Diseases:Deaths from pneumonia numbered 294; chronic lower respiratorydisease accounted for 387 deaths and 239 deaths resulted from otherrespiratory diseases. See tables 2, 14 and fig.1.5.
� Accidents, suicides and other:
There were 434 deaths due to accidents, suicides and other externalcauses. Accidents accounted for almost 61% (264) of these deaths,while suicides accounted for just under 31% (134). Of these 434 deaths,71.2% were male. See tables 2, 14 and fig.1.5.
The leading cause of death in quarter 2 2011 varied widely by age group.Among young adults aged 15-34, external causes of death including accidents,suicide and other ranked first. Among individuals aged 35-74, cancers werethe leading cause, while for those aged 75 and older, it was diseases of theheart and arteries. See tables 14 and fig.1.6.
Natural increase
The natural increase in the population (births minus deaths) for quarter 2 2011was 11,104. This represents a rate of 9.9 per 1,000 population, 0.8 lower thanquarter 2 of 2010. See tables 3, 4 and fig.1.1.
Marriages
The number of marriages registered during the quarter was 5,025, equivalent to
an annual marriage rate of 4.5 per 1,000 population, the same rate as in thecorresponding quarter of 2010. The quarter 2 2011 total is 4.5% higher than inquarter 2 2002 when 4,810 marriages were registered. See tables 3 and 4.
Population
The estimated population in April 2011 was 4,484,300.
Vital Statistics - 2nd Qtr 2011 6
0.0
10.0
20.0
30.0
40.0
50.0
60.0
70.0
80.0
90.0
Under 15 15-34 35-74 75+
% of deaths
Age-groups
Fig. 1.6 Causes of death classified by age-groups, quarter 2 2011
Cancers Heart Lung Accident, suicide, homicide, and undetermined Other

Tables
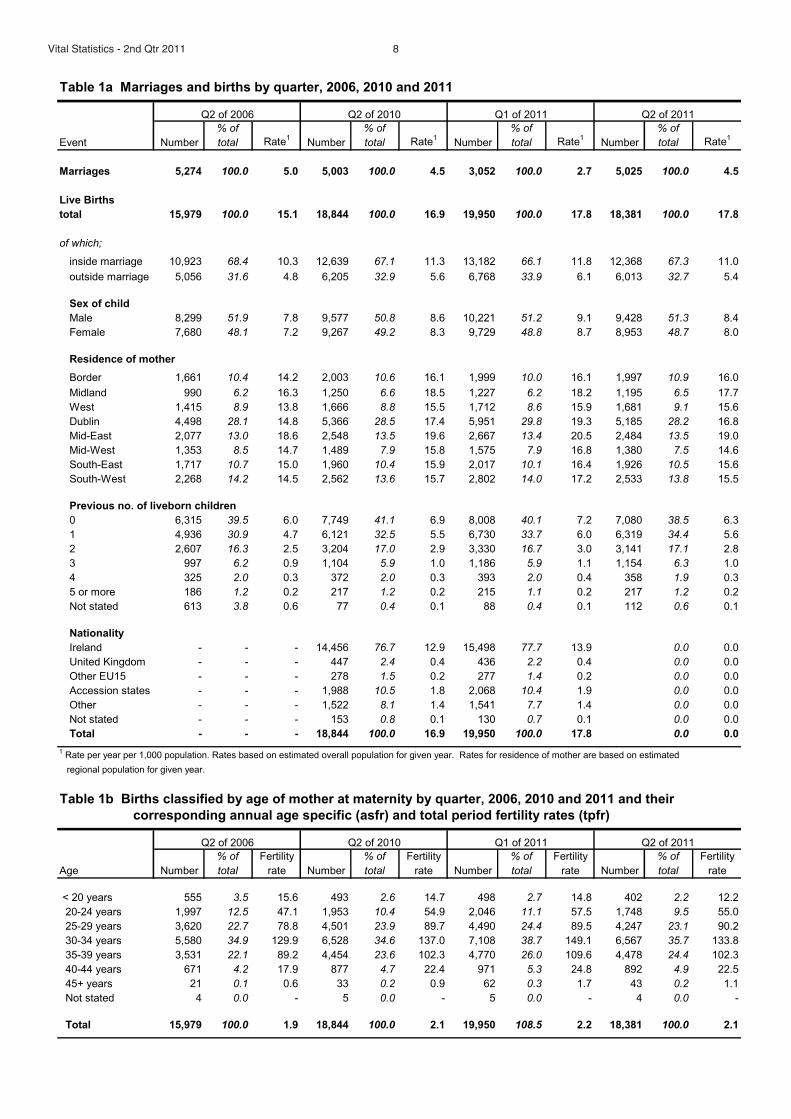
Table 1a Marriages and births by quarter, 2006, 2010 and 2011
% of % of % of % of
Event Number total Rate1
Number total Rate1
Number total Rate1
Number total Rate1
Marriages 5,274 100.0 5.0 5,003 100.0 4.5 3,052 100.0 2.7 5,025 100.0 4.5
Live Births
total 15,979 100.0 15.1 18,844 100.0 16.9 19,950 100.0 17.8 18,381 100.0 17.8
of which;
inside marriage 10,923 68.4 10.3 12,639 67.1 11.3 13,182 66.1 11.8 12,368 67.3 11.0
outside marriage 5,056 31.6 4.8 6,205 32.9 5.6 6,768 33.9 6.1 6,013 32.7 5.4
Sex of child
Male 8,299 51.9 7.8 9,577 50.8 8.6 10,221 51.2 9.1 9,428 51.3 8.4
Female 7,680 48.1 7.2 9,267 49.2 8.3 9,729 48.8 8.7 8,953 48.7 8.0
Residence of mother
Border 1,661 10.4 14.2 2,003 10.6 16.1 1,999 10.0 16.1 1,997 10.9 16.0
Midland 990 6.2 16.3 1,250 6.6 18.5 1,227 6.2 18.2 1,195 6.5 17.7
West 1,415 8.9 13.8 1,666 8.8 15.5 1,712 8.6 15.9 1,681 9.1 15.6
Dublin 4,498 28.1 14.8 5,366 28.5 17.4 5,951 29.8 19.3 5,185 28.2 16.8
Mid-East 2,077 13.0 18.6 2,548 13.5 19.6 2,667 13.4 20.5 2,484 13.5 19.0
Mid-West 1,353 8.5 14.7 1,489 7.9 15.8 1,575 7.9 16.8 1,380 7.5 14.6
South-East 1,717 10.7 15.0 1,960 10.4 15.9 2,017 10.1 16.4 1,926 10.5 15.6
South-West 2,268 14.2 14.5 2,562 13.6 15.7 2,802 14.0 17.2 2,533 13.8 15.5
Previous no. of liveborn children
0 6,315 39.5 6.0 7,749 41.1 6.9 8,008 40.1 7.2 7,080 38.5 6.3
1 4,936 30.9 4.7 6,121 32.5 5.5 6,730 33.7 6.0 6,319 34.4 5.6
2 2,607 16.3 2.5 3,204 17.0 2.9 3,330 16.7 3.0 3,141 17.1 2.8
3 997 6.2 0.9 1,104 5.9 1.0 1,186 5.9 1.1 1,154 6.3 1.0
4 325 2.0 0.3 372 2.0 0.3 393 2.0 0.4 358 1.9 0.3
5 or more 186 1.2 0.2 217 1.2 0.2 215 1.1 0.2 217 1.2 0.2
Not stated 613 3.8 0.6 77 0.4 0.1 88 0.4 0.1 112 0.6 0.1
Nationality
Ireland - - - 14,456 76.7 12.9 15,498 77.7 13.9 0.0 0.0
United Kingdom - - - 447 2.4 0.4 436 2.2 0.4 0.0 0.0
Other EU15 - - - 278 1.5 0.2 277 1.4 0.2 0.0 0.0
Accession states - - - 1,988 10.5 1.8 2,068 10.4 1.9 0.0 0.0
Other - - - 1,522 8.1 1.4 1,541 7.7 1.4 0.0 0.0
Not stated - - - 153 0.8 0.1 130 0.7 0.1 0.0 0.0
Total - - - 18,844 100.0 16.9 19,950 100.0 17.8 0.0 0.0
1Rate per year per 1,000 population. Rates based on estimated overall population for given year. Rates for residence of mother are based on estimated
regional population for given year.
Table 1b Births classified by age of mother at maternity by quarter, 2006, 2010 and 2011 and their
corresponding annual age specific (asfr) and total period fertility rates (tpfr)
% of Fertility % of Fertility % of Fertility % of Fertility
Age Number total rate Number total rate Number total rate Number total rate
< 20 years 555 3.5 15.6 493 2.6 14.7 498 2.7 14.8 402 2.2 12.2
20-24 years 1,997 12.5 47.1 1,953 10.4 54.9 2,046 11.1 57.5 1,748 9.5 55.0
25-29 years 3,620 22.7 78.8 4,501 23.9 89.7 4,490 24.4 89.5 4,247 23.1 90.2
30-34 years 5,580 34.9 129.9 6,528 34.6 137.0 7,108 38.7 149.1 6,567 35.7 133.8
35-39 years 3,531 22.1 89.2 4,454 23.6 102.3 4,770 26.0 109.6 4,478 24.4 102.3
40-44 years 671 4.2 17.9 877 4.7 22.4 971 5.3 24.8 892 4.9 22.5
45+ years 21 0.1 0.6 33 0.2 0.9 62 0.3 1.7 43 0.2 1.1
Not stated 4 0.0 - 5 0.0 - 5 0.0 - 4 0.0 -
Total 15,979 100.0 1.9 18,844 100.0 2.1 19,950 108.5 2.2 18,381 100.0 2.1
Q2 of 2006 Q2 of 2010 Q1 of 2011 Q2 of 2011
Q2 of 2006 Q2 of 2010 Q1 of 2011 Q2 of 2011
Vital Statistics - 2nd Qtr 2011 8
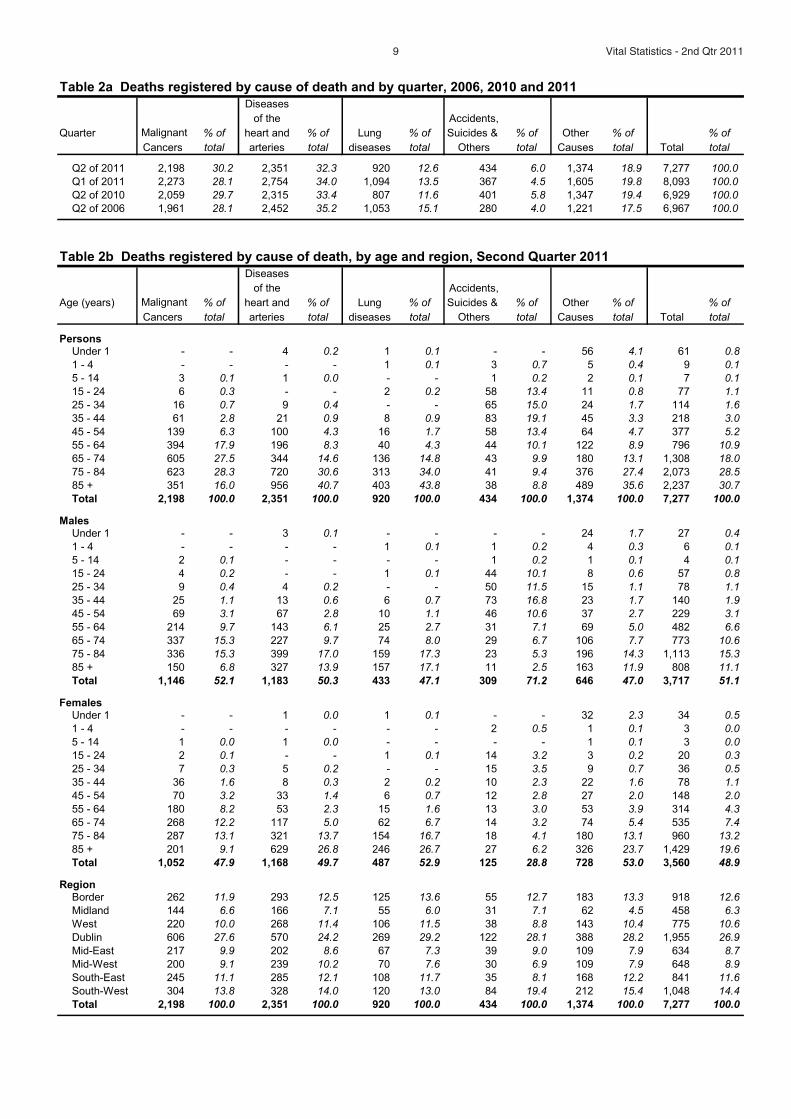
Table 2a Deaths registered by cause of death and by quarter, 2006, 2010 and 2011
Diseases
of the Accidents,
Quarter Malignant % of heart and % of Lung % of Suicides & % of Other % of % of
Cancers total arteries total diseases total Others total Causes total Total total
Q2 of 2011 2,198 30.2 2,351 32.3 920 12.6 434 6.0 1,374 18.9 7,277 100.0
Q1 of 2011 2,273 28.1 2,754 34.0 1,094 13.5 367 4.5 1,605 19.8 8,093 100.0
Q2 of 2010 2,059 29.7 2,315 33.4 807 11.6 401 5.8 1,347 19.4 6,929 100.0
Q2 of 2006 1,961 28.1 2,452 35.2 1,053 15.1 280 4.0 1,221 17.5 6,967 100.0
Table 2b Deaths registered by cause of death, by age and region, Second Quarter 2011
Diseases
of the Accidents,
Age (years) Malignant % of heart and % of Lung % of Suicides & % of Other % of % of
Cancers total arteries total diseases total Others total Causes total Total total
PersonsUnder 1 - - 4 0.2 1 0.1 - - 56 4.1 61 0.8
1 - 4 - - - - 1 0.1 3 0.7 5 0.4 9 0.1
5 - 14 3 0.1 1 0.0 - - 1 0.2 2 0.1 7 0.1
15 - 24 6 0.3 - - 2 0.2 58 13.4 11 0.8 77 1.1
25 - 34 16 0.7 9 0.4 - - 65 15.0 24 1.7 114 1.6
35 - 44 61 2.8 21 0.9 8 0.9 83 19.1 45 3.3 218 3.0
45 - 54 139 6.3 100 4.3 16 1.7 58 13.4 64 4.7 377 5.2
55 - 64 394 17.9 196 8.3 40 4.3 44 10.1 122 8.9 796 10.9
65 - 74 605 27.5 344 14.6 136 14.8 43 9.9 180 13.1 1,308 18.0
75 - 84 623 28.3 720 30.6 313 34.0 41 9.4 376 27.4 2,073 28.5
85 + 351 16.0 956 40.7 403 43.8 38 8.8 489 35.6 2,237 30.7
Total 2,198 100.0 2,351 100.0 920 100.0 434 100.0 1,374 100.0 7,277 100.0
MalesUnder 1 - - 3 0.1 - - - - 24 1.7 27 0.4
1 - 4 - - - - 1 0.1 1 0.2 4 0.3 6 0.1
5 - 14 2 0.1 - - - - 1 0.2 1 0.1 4 0.1
15 - 24 4 0.2 - - 1 0.1 44 10.1 8 0.6 57 0.8
25 - 34 9 0.4 4 0.2 - - 50 11.5 15 1.1 78 1.1
35 - 44 25 1.1 13 0.6 6 0.7 73 16.8 23 1.7 140 1.9
45 - 54 69 3.1 67 2.8 10 1.1 46 10.6 37 2.7 229 3.1
55 - 64 214 9.7 143 6.1 25 2.7 31 7.1 69 5.0 482 6.6
65 - 74 337 15.3 227 9.7 74 8.0 29 6.7 106 7.7 773 10.6
75 - 84 336 15.3 399 17.0 159 17.3 23 5.3 196 14.3 1,113 15.3
85 + 150 6.8 327 13.9 157 17.1 11 2.5 163 11.9 808 11.1
Total 1,146 52.1 1,183 50.3 433 47.1 309 71.2 646 47.0 3,717 51.1
FemalesUnder 1 - - 1 0.0 1 0.1 - - 32 2.3 34 0.5
1 - 4 - - - - - - 2 0.5 1 0.1 3 0.0
5 - 14 1 0.0 1 0.0 - - - - 1 0.1 3 0.0
15 - 24 2 0.1 - - 1 0.1 14 3.2 3 0.2 20 0.3
25 - 34 7 0.3 5 0.2 - - 15 3.5 9 0.7 36 0.5
35 - 44 36 1.6 8 0.3 2 0.2 10 2.3 22 1.6 78 1.1
45 - 54 70 3.2 33 1.4 6 0.7 12 2.8 27 2.0 148 2.0
55 - 64 180 8.2 53 2.3 15 1.6 13 3.0 53 3.9 314 4.3
65 - 74 268 12.2 117 5.0 62 6.7 14 3.2 74 5.4 535 7.4
75 - 84 287 13.1 321 13.7 154 16.7 18 4.1 180 13.1 960 13.2
85 + 201 9.1 629 26.8 246 26.7 27 6.2 326 23.7 1,429 19.6
Total 1,052 47.9 1,168 49.7 487 52.9 125 28.8 728 53.0 3,560 48.9
RegionBorder 262 11.9 293 12.5 125 13.6 55 12.7 183 13.3 918 12.6
Midland 144 6.6 166 7.1 55 6.0 31 7.1 62 4.5 458 6.3
West 220 10.0 268 11.4 106 11.5 38 8.8 143 10.4 775 10.6
Dublin 606 27.6 570 24.2 269 29.2 122 28.1 388 28.2 1,955 26.9
Mid-East 217 9.9 202 8.6 67 7.3 39 9.0 109 7.9 634 8.7
Mid-West 200 9.1 239 10.2 70 7.6 30 6.9 109 7.9 648 8.9
South-East 245 11.1 285 12.1 108 11.7 35 8.1 168 12.2 841 11.6
South-West 304 13.8 328 14.0 120 13.0 84 19.4 212 15.4 1,048 14.4
Total 2,198 100.0 2,351 100.0 920 100.0 434 100.0 1,374 100.0 7,277 100.0
9 Vital Statistics - 2nd Qtr 2011
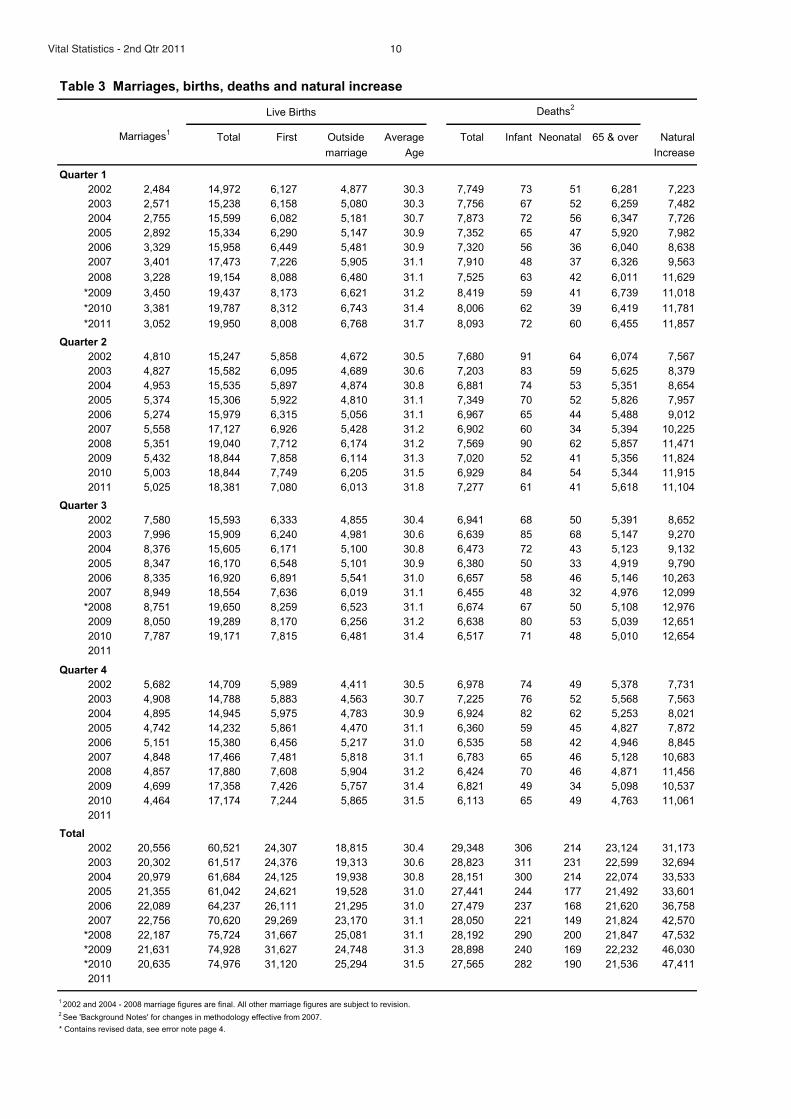
Table 3 Marriages, births, deaths and natural increase
Live Births Deaths2
Marriages1
Total First Outside Average Total Infant Neonatal 65 & over Natural
marriage Age Increase
Quarter 1
2002 2,484 14,972 6,127 4,877 30.3 7,749 73 51 6,281 7,223
2003 2,571 15,238 6,158 5,080 30.3 7,756 67 52 6,259 7,482
2004 2,755 15,599 6,082 5,181 30.7 7,873 72 56 6,347 7,726
2005 2,892 15,334 6,290 5,147 30.9 7,352 65 47 5,920 7,982
2006 3,329 15,958 6,449 5,481 30.9 7,320 56 36 6,040 8,638
2007 3,401 17,473 7,226 5,905 31.1 7,910 48 37 6,326 9,563
2008 3,228 19,154 8,088 6,480 31.1 7,525 63 42 6,011 11,629
*2009 3,450 19,437 8,173 6,621 31.2 8,419 59 41 6,739 11,018
*2010 3,381 19,787 8,312 6,743 31.4 8,006 62 39 6,419 11,781
*2011 3,052 19,950 8,008 6,768 31.7 8,093 72 60 6,455 11,857
Quarter 2
2002 4,810 15,247 5,858 4,672 30.5 7,680 91 64 6,074 7,567
2003 4,827 15,582 6,095 4,689 30.6 7,203 83 59 5,625 8,379
2004 4,953 15,535 5,897 4,874 30.8 6,881 74 53 5,351 8,654
2005 5,374 15,306 5,922 4,810 31.1 7,349 70 52 5,826 7,957
2006 5,274 15,979 6,315 5,056 31.1 6,967 65 44 5,488 9,012
2007 5,558 17,127 6,926 5,428 31.2 6,902 60 34 5,394 10,225
2008 5,351 19,040 7,712 6,174 31.2 7,569 90 62 5,857 11,471
2009 5,432 18,844 7,858 6,114 31.3 7,020 52 41 5,356 11,824
2010 5,003 18,844 7,749 6,205 31.5 6,929 84 54 5,344 11,915
2011 5,025 18,381 7,080 6,013 31.8 7,277 61 41 5,618 11,104
Quarter 3
2002 7,580 15,593 6,333 4,855 30.4 6,941 68 50 5,391 8,652
2003 7,996 15,909 6,240 4,981 30.6 6,639 85 68 5,147 9,270
2004 8,376 15,605 6,171 5,100 30.8 6,473 72 43 5,123 9,132
2005 8,347 16,170 6,548 5,101 30.9 6,380 50 33 4,919 9,790
2006 8,335 16,920 6,891 5,541 31.0 6,657 58 46 5,146 10,263
2007 8,949 18,554 7,636 6,019 31.1 6,455 48 32 4,976 12,099
*2008 8,751 19,650 8,259 6,523 31.1 6,674 67 50 5,108 12,976
2009 8,050 19,289 8,170 6,256 31.2 6,638 80 53 5,039 12,651
2010 7,787 19,171 7,815 6,481 31.4 6,517 71 48 5,010 12,654
2011
Quarter 4
2002 5,682 14,709 5,989 4,411 30.5 6,978 74 49 5,378 7,731
2003 4,908 14,788 5,883 4,563 30.7 7,225 76 52 5,568 7,563
2004 4,895 14,945 5,975 4,783 30.9 6,924 82 62 5,253 8,021
2005 4,742 14,232 5,861 4,470 31.1 6,360 59 45 4,827 7,872
2006 5,151 15,380 6,456 5,217 31.0 6,535 58 42 4,946 8,845
2007 4,848 17,466 7,481 5,818 31.1 6,783 65 46 5,128 10,683
2008 4,857 17,880 7,608 5,904 31.2 6,424 70 46 4,871 11,456
2009 4,699 17,358 7,426 5,757 31.4 6,821 49 34 5,098 10,537
2010 4,464 17,174 7,244 5,865 31.5 6,113 65 49 4,763 11,061
2011
Total
2002 20,556 60,521 24,307 18,815 30.4 29,348 306 214 23,124 31,173
2003 20,302 61,517 24,376 19,313 30.6 28,823 311 231 22,599 32,694
2004 20,979 61,684 24,125 19,938 30.8 28,151 300 214 22,074 33,533
2005 21,355 61,042 24,621 19,528 31.0 27,441 244 177 21,492 33,601
2006 22,089 64,237 26,111 21,295 31.0 27,479 237 168 21,620 36,758
2007 22,756 70,620 29,269 23,170 31.1 28,050 221 149 21,824 42,570
*2008 22,187 75,724 31,667 25,081 31.1 28,192 290 200 21,847 47,532
*2009 21,631 74,928 31,627 24,748 31.3 28,898 240 169 22,232 46,030
*2010 20,635 74,976 31,120 25,294 31.5 27,565 282 190 21,536 47,411
2011
12002 and 2004 - 2008 marriage figures are final. All other marriage figures are subject to revision.
2See 'Background Notes' for changes in methodology effective from 2007.
* Contains revised data, see error note page 4.
Vital Statistics - 2nd Qtr 2011 10
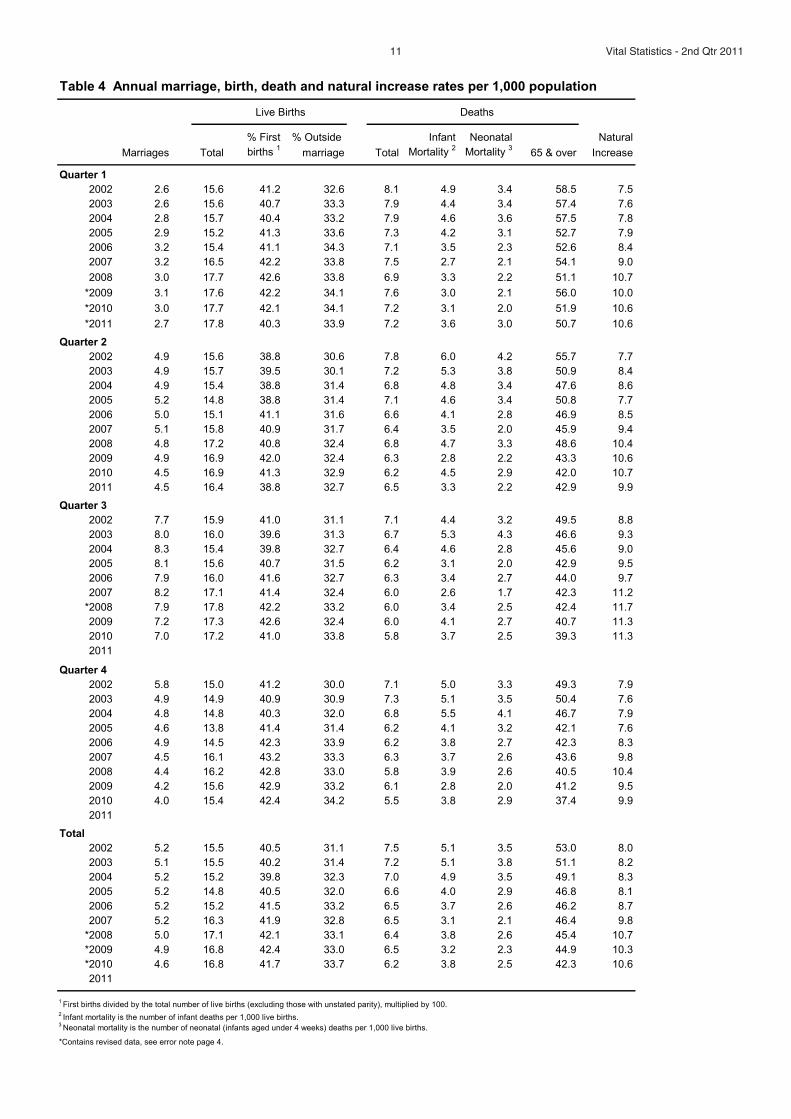
Table 4 Annual marriage, birth, death and natural increase rates per 1,000 population
Live Births Deaths
% First % Outside Infant Neonatal Natural
Marriages Total births1
marriage Total Mortality2
Mortality3
65 & over Increase
Quarter 1
2002 2.6 15.6 41.2 32.6 8.1 4.9 3.4 58.5 7.5
2003 2.6 15.6 40.7 33.3 7.9 4.4 3.4 57.4 7.6
2004 2.8 15.7 40.4 33.2 7.9 4.6 3.6 57.5 7.8
2005 2.9 15.2 41.3 33.6 7.3 4.2 3.1 52.7 7.9
2006 3.2 15.4 41.1 34.3 7.1 3.5 2.3 52.6 8.4
2007 3.2 16.5 42.2 33.8 7.5 2.7 2.1 54.1 9.0
2008 3.0 17.7 42.6 33.8 6.9 3.3 2.2 51.1 10.7
*2009 3.1 17.6 42.2 34.1 7.6 3.0 2.1 56.0 10.0
*2010 3.0 17.7 42.1 34.1 7.2 3.1 2.0 51.9 10.6
*2011 2.7 17.8 40.3 33.9 7.2 3.6 3.0 50.7 10.6
Quarter 2
2002 4.9 15.6 38.8 30.6 7.8 6.0 4.2 55.7 7.7
2003 4.9 15.7 39.5 30.1 7.2 5.3 3.8 50.9 8.4
2004 4.9 15.4 38.8 31.4 6.8 4.8 3.4 47.6 8.6
2005 5.2 14.8 38.8 31.4 7.1 4.6 3.4 50.8 7.7
2006 5.0 15.1 41.1 31.6 6.6 4.1 2.8 46.9 8.5
2007 5.1 15.8 40.9 31.7 6.4 3.5 2.0 45.9 9.4
2008 4.8 17.2 40.8 32.4 6.8 4.7 3.3 48.6 10.4
2009 4.9 16.9 42.0 32.4 6.3 2.8 2.2 43.3 10.6
2010 4.5 16.9 41.3 32.9 6.2 4.5 2.9 42.0 10.7
2011 4.5 16.4 38.8 32.7 6.5 3.3 2.2 42.9 9.9
Quarter 3
2002 7.7 15.9 41.0 31.1 7.1 4.4 3.2 49.5 8.8
2003 8.0 16.0 39.6 31.3 6.7 5.3 4.3 46.6 9.3
2004 8.3 15.4 39.8 32.7 6.4 4.6 2.8 45.6 9.0
2005 8.1 15.6 40.7 31.5 6.2 3.1 2.0 42.9 9.5
2006 7.9 16.0 41.6 32.7 6.3 3.4 2.7 44.0 9.7
2007 8.2 17.1 41.4 32.4 6.0 2.6 1.7 42.3 11.2
*2008 7.9 17.8 42.2 33.2 6.0 3.4 2.5 42.4 11.7
2009 7.2 17.3 42.6 32.4 6.0 4.1 2.7 40.7 11.3
2010 7.0 17.2 41.0 33.8 5.8 3.7 2.5 39.3 11.3
2011
Quarter 4
2002 5.8 15.0 41.2 30.0 7.1 5.0 3.3 49.3 7.9
2003 4.9 14.9 40.9 30.9 7.3 5.1 3.5 50.4 7.6
2004 4.8 14.8 40.3 32.0 6.8 5.5 4.1 46.7 7.9
2005 4.6 13.8 41.4 31.4 6.2 4.1 3.2 42.1 7.6
2006 4.9 14.5 42.3 33.9 6.2 3.8 2.7 42.3 8.3
2007 4.5 16.1 43.2 33.3 6.3 3.7 2.6 43.6 9.8
2008 4.4 16.2 42.8 33.0 5.8 3.9 2.6 40.5 10.4
2009 4.2 15.6 42.9 33.2 6.1 2.8 2.0 41.2 9.5
2010 4.0 15.4 42.4 34.2 5.5 3.8 2.9 37.4 9.9
2011
Total
2002 5.2 15.5 40.5 31.1 7.5 5.1 3.5 53.0 8.0
2003 5.1 15.5 40.2 31.4 7.2 5.1 3.8 51.1 8.2
2004 5.2 15.2 39.8 32.3 7.0 4.9 3.5 49.1 8.3
2005 5.2 14.8 40.5 32.0 6.6 4.0 2.9 46.8 8.1
2006 5.2 15.2 41.5 33.2 6.5 3.7 2.6 46.2 8.7
2007 5.2 16.3 41.9 32.8 6.5 3.1 2.1 46.4 9.8
*2008 5.0 17.1 42.1 33.1 6.4 3.8 2.6 45.4 10.7
*2009 4.9 16.8 42.4 33.0 6.5 3.2 2.3 44.9 10.3
*2010 4.6 16.8 41.7 33.7 6.2 3.8 2.5 42.3 10.6
2011
1First births divided by the total number of live births (excluding those with unstated parity), multiplied by 100.
2Infant mortality is the number of infant deaths per 1,000 live births.
3Neonatal mortality is the number of neonatal (infants aged under 4 weeks) deaths per 1,000 live births.
*Contains revised data, see error note page 4.
11 Vital Statistics - 2nd Qtr 2011
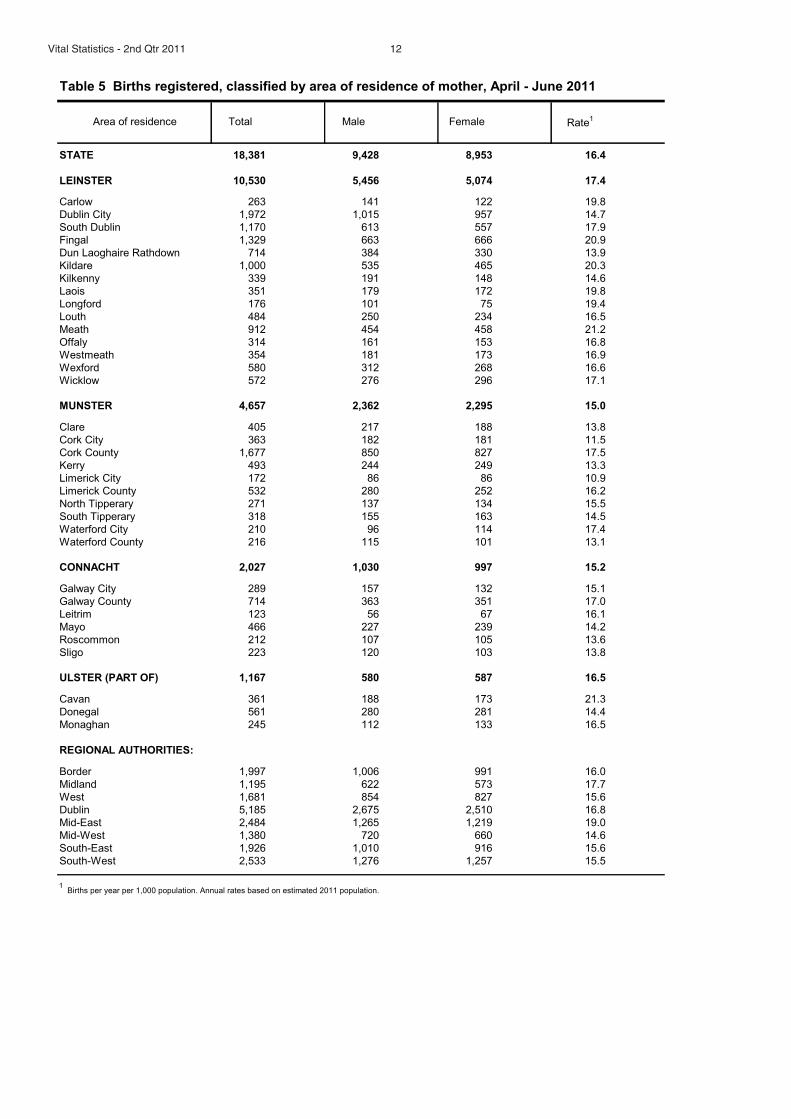
Table 5 Births registered, classified by area of residence of mother, April - June 2011
STATE 18,381 9,428 8,953 16.4
LEINSTER 10,530 5,456 5,074 17.4
Carlow 263 141 122 19.8
Dublin City 1,972 1,015 957 14.7
South Dublin 1,170 613 557 17.9
Fingal 1,329 663 666 20.9
Dun Laoghaire Rathdown 714 384 330 13.9
Kildare 1,000 535 465 20.3
Kilkenny 339 191 148 14.6
Laois 351 179 172 19.8
Longford 176 101 75 19.4
Louth 484 250 234 16.5
Meath 912 454 458 21.2
Offaly 314 161 153 16.8
Westmeath 354 181 173 16.9
Wexford 580 312 268 16.6
Wicklow 572 276 296 17.1
MUNSTER 4,657 2,362 2,295 15.0
Clare 405 217 188 13.8
Cork City 363 182 181 11.5
Cork County 1,677 850 827 17.5
Kerry 493 244 249 13.3
Limerick City 172 86 86 10.9
Limerick County 532 280 252 16.2
North Tipperary 271 137 134 15.5
South Tipperary 318 155 163 14.5
Waterford City 210 96 114 17.4
Waterford County 216 115 101 13.1
CONNACHT 2,027 1,030 997 15.2
Galway City 289 157 132 15.1
Galway County 714 363 351 17.0
Leitrim 123 56 67 16.1
Mayo 466 227 239 14.2
Roscommon 212 107 105 13.6
Sligo 223 120 103 13.8
ULSTER (PART OF) 1,167 580 587 16.5
Cavan 361 188 173 21.3
Donegal 561 280 281 14.4
Monaghan 245 112 133 16.5
REGIONAL AUTHORITIES:
Border 1,997 1,006 991 16.0
Midland 1,195 622 573 17.7
West 1,681 854 827 15.6
Dublin 5,185 2,675 2,510 16.8
Mid-East 2,484 1,265 1,219 19.0
Mid-West 1,380 720 660 14.6
South-East 1,926 1,010 916 15.6
South-West 2,533 1,276 1,257 15.5
1Births per year per 1,000 population. Annual rates based on estimated 2011 population.
Rate1Area of residence Total Male Female
Vital Statistics - 2nd Qtr 2011 12
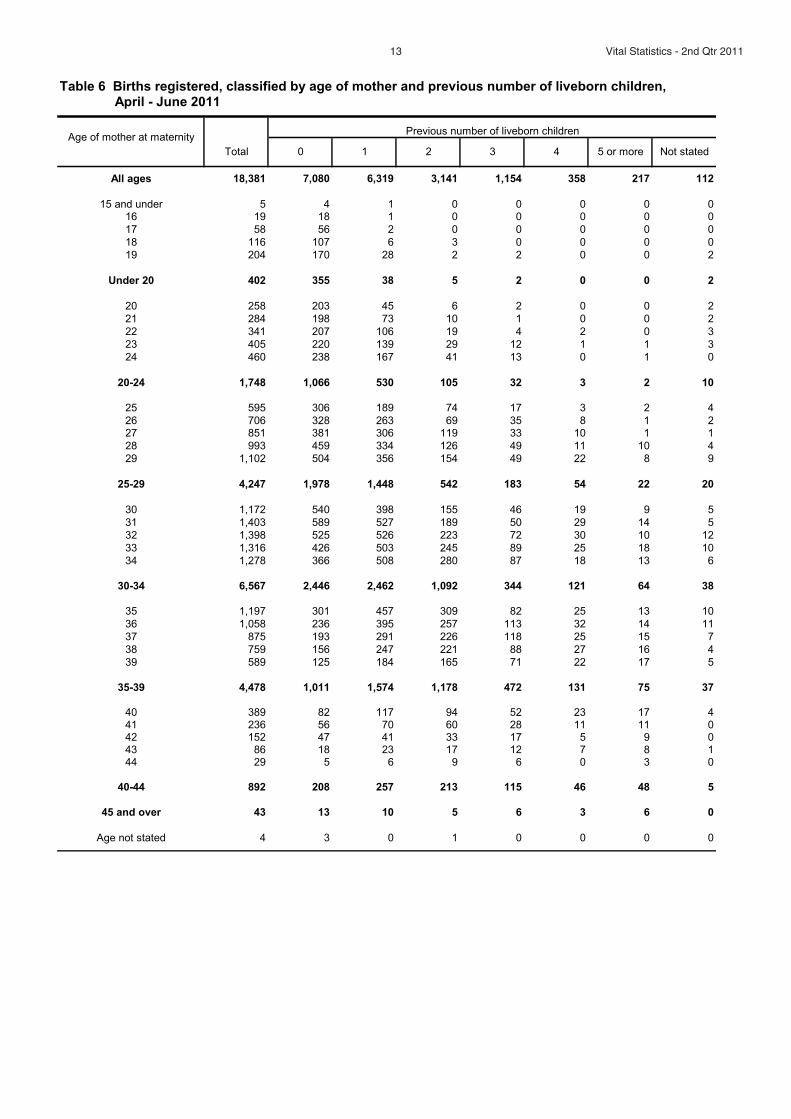
Table 6 Births registered, classified by age of mother and previous number of liveborn children,April - June 2011
All ages 18,381 7,080 6,319 3,141 1,154 358 217 112
15 and under 5 4 1 0 0 0 0 016 19 18 1 0 0 0 0 0
17 58 56 2 0 0 0 0 0
18 116 107 6 3 0 0 0 0
19 204 170 28 2 2 0 0 2
Under 20 402 355 38 5 2 0 0 2
20 258 203 45 6 2 0 0 2
21 284 198 73 10 1 0 0 2
22 341 207 106 19 4 2 0 3
23 405 220 139 29 12 1 1 3
24 460 238 167 41 13 0 1 0
20-24 1,748 1,066 530 105 32 3 2 10
25 595 306 189 74 17 3 2 4
26 706 328 263 69 35 8 1 227 851 381 306 119 33 10 1 1
28 993 459 334 126 49 11 10 4
29 1,102 504 356 154 49 22 8 9
25-29 4,247 1,978 1,448 542 183 54 22 20
30 1,172 540 398 155 46 19 9 5
31 1,403 589 527 189 50 29 14 5
32 1,398 525 526 223 72 30 10 12
33 1,316 426 503 245 89 25 18 10
34 1,278 366 508 280 87 18 13 6
30-34 6,567 2,446 2,462 1,092 344 121 64 38
35 1,197 301 457 309 82 25 13 10
36 1,058 236 395 257 113 32 14 11
37 875 193 291 226 118 25 15 7
38 759 156 247 221 88 27 16 4
39 589 125 184 165 71 22 17 5
35-39 4,478 1,011 1,574 1,178 472 131 75 37
40 389 82 117 94 52 23 17 441 236 56 70 60 28 11 11 042 152 47 41 33 17 5 9 043 86 18 23 17 12 7 8 144 29 5 6 9 6 0 3 0
40-44 892 208 257 213 115 46 48 5
45 and over 43 13 10 5 6 3 6 0
Age not stated 4 3 0 1 0 0 0 0
Age of mother at maternity
0 1 2Total
Previous number of liveborn children
Not stated4 5 or more3
13 Vital Statistics - 2nd Qtr 2011
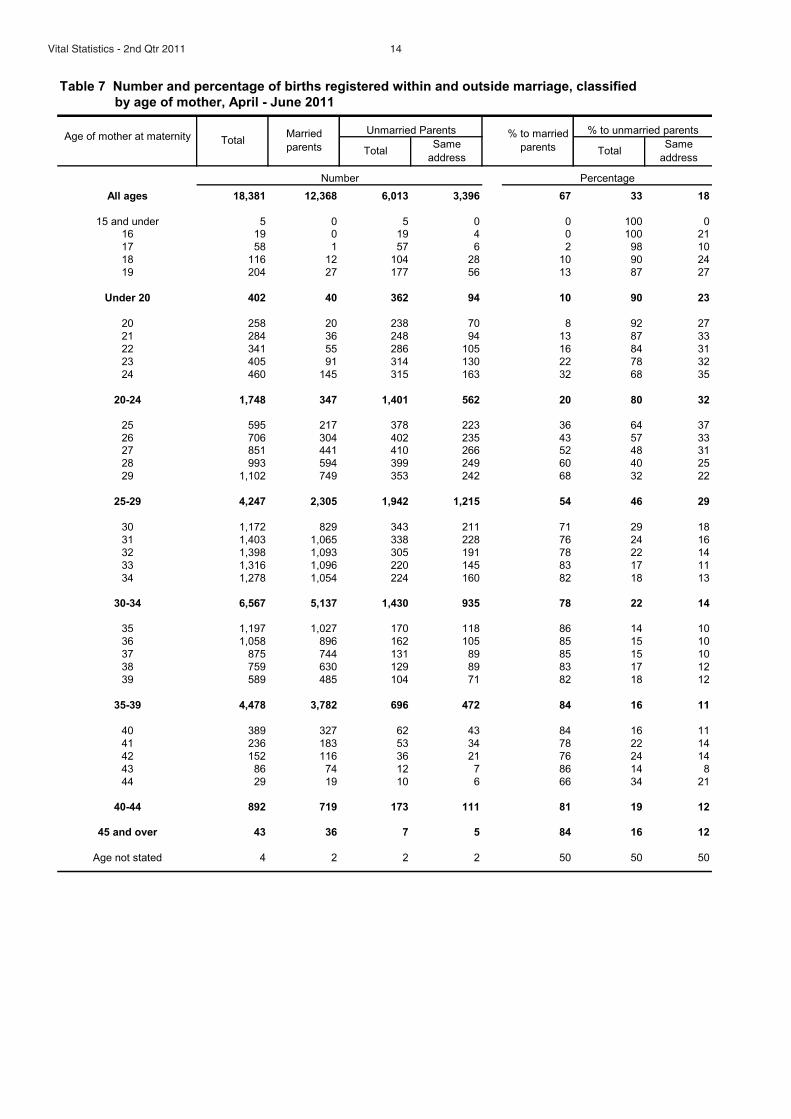
Table 7 Number and percentage of births registered within and outside marriage, classified
All ages 18,381 12,368 6,013 3,396 67 33 18
15 and under 5 0 5 0 0 100 016 19 0 19 4 0 100 21
17 58 1 57 6 2 98 10
18 116 12 104 28 10 90 24
19 204 27 177 56 13 87 27
Under 20 402 40 362 94 10 90 23
20 258 20 238 70 8 92 27
21 284 36 248 94 13 87 33
22 341 55 286 105 16 84 31
23 405 91 314 130 22 78 32
24 460 145 315 163 32 68 35
20-24 1,748 347 1,401 562 20 80 32
25 595 217 378 223 36 64 37
26 706 304 402 235 43 57 3327 851 441 410 266 52 48 31
28 993 594 399 249 60 40 25
29 1,102 749 353 242 68 32 22
25-29 4,247 2,305 1,942 1,215 54 46 29
30 1,172 829 343 211 71 29 18
31 1,403 1,065 338 228 76 24 16
32 1,398 1,093 305 191 78 22 14
33 1,316 1,096 220 145 83 17 11
34 1,278 1,054 224 160 82 18 13
30-34 6,567 5,137 1,430 935 78 22 14
35 1,197 1,027 170 118 86 14 10
36 1,058 896 162 105 85 15 10
37 875 744 131 89 85 15 10
38 759 630 129 89 83 17 12
39 589 485 104 71 82 18 12
35-39 4,478 3,782 696 472 84 16 11
40 389 327 62 43 84 16 11
41 236 183 53 34 78 22 14
42 152 116 36 21 76 24 14
43 86 74 12 7 86 14 8
44 29 19 10 6 66 34 21
40-44 892 719 173 111 81 19 12
45 and over 43 36 7 5 84 16 12
Age not stated 4 2 2 2 50 50 50
Number Percentage
by age of mother, April - June 2011
Age of mother at maternity
Total
Married
parentsTotal
% to unmarried parents
Same
address
Unmarried Parents
Same
address
% to married
parents Total
Vital Statistics - 2nd Qtr 2011 14
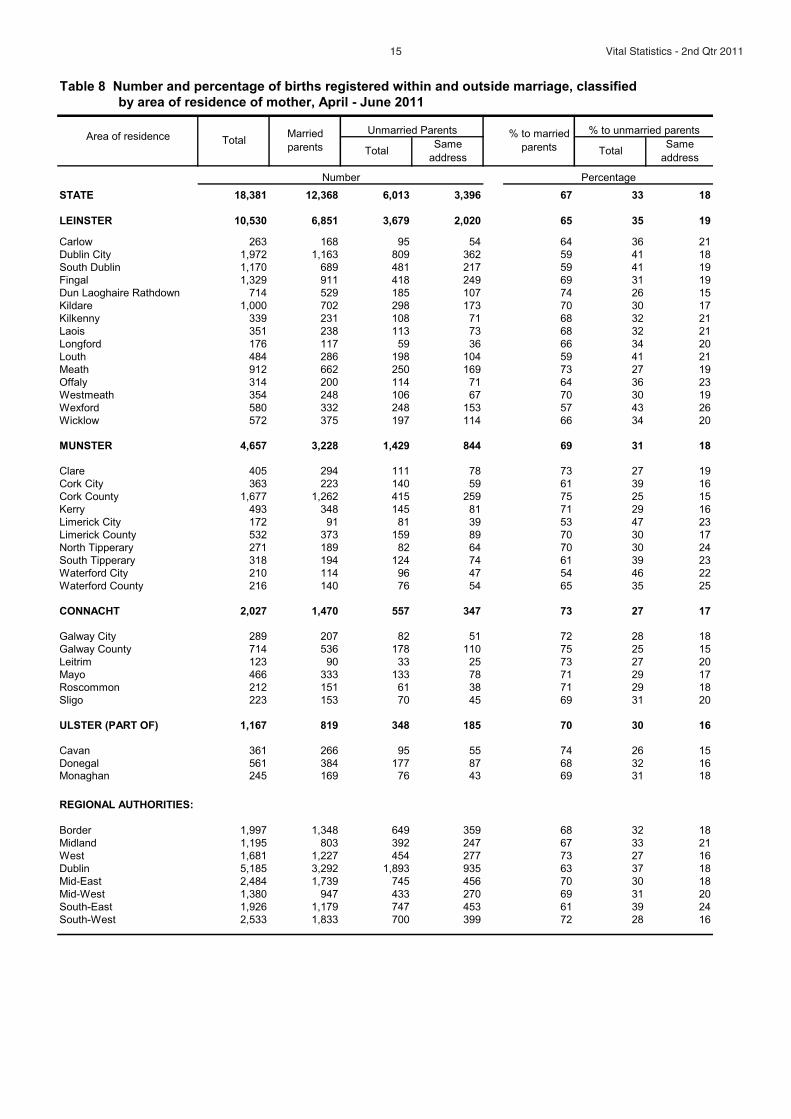
Table 8 Number and percentage of births registered within and outside marriage, classified
STATE 18,381 12,368 6,013 3,396 67 33 18
LEINSTER 10,530 6,851 3,679 2,020 65 35 19
Carlow 263 168 95 54 64 36 21
Dublin City 1,972 1,163 809 362 59 41 18
South Dublin 1,170 689 481 217 59 41 19
Fingal 1,329 911 418 249 69 31 19
Dun Laoghaire Rathdown 714 529 185 107 74 26 15
Kildare 1,000 702 298 173 70 30 17
Kilkenny 339 231 108 71 68 32 21
Laois 351 238 113 73 68 32 21
Longford 176 117 59 36 66 34 20
Louth 484 286 198 104 59 41 21
Meath 912 662 250 169 73 27 19
Offaly 314 200 114 71 64 36 23
Westmeath 354 248 106 67 70 30 19
Wexford 580 332 248 153 57 43 26
Wicklow 572 375 197 114 66 34 20
MUNSTER 4,657 3,228 1,429 844 69 31 18
Clare 405 294 111 78 73 27 19
Cork City 363 223 140 59 61 39 16
Cork County 1,677 1,262 415 259 75 25 15
Kerry 493 348 145 81 71 29 16
Limerick City 172 91 81 39 53 47 23
Limerick County 532 373 159 89 70 30 17
North Tipperary 271 189 82 64 70 30 24
South Tipperary 318 194 124 74 61 39 23
Waterford City 210 114 96 47 54 46 22
Waterford County 216 140 76 54 65 35 25
CONNACHT 2,027 1,470 557 347 73 27 17
Galway City 289 207 82 51 72 28 18
Galway County 714 536 178 110 75 25 15
Leitrim 123 90 33 25 73 27 20
Mayo 466 333 133 78 71 29 17
Roscommon 212 151 61 38 71 29 18
Sligo 223 153 70 45 69 31 20
ULSTER (PART OF) 1,167 819 348 185 70 30 16
Cavan 361 266 95 55 74 26 15
Donegal 561 384 177 87 68 32 16Monaghan 245 169 76 43 69 31 18
REGIONAL AUTHORITIES:
Border 1,997 1,348 649 359 68 32 18
Midland 1,195 803 392 247 67 33 21
West 1,681 1,227 454 277 73 27 16
Dublin 5,185 3,292 1,893 935 63 37 18
Mid-East 2,484 1,739 745 456 70 30 18
Mid-West 1,380 947 433 270 69 31 20
South-East 1,926 1,179 747 453 61 39 24
South-West 2,533 1,833 700 399 72 28 16
Number Percentage
Same
address
% to married
parents Total
by area of residence of mother, April - June 2011
Area of residence
Total
Married
parentsTotal
% to unmarried parents
Same
address
Unmarried Parents
15 Vital Statistics - 2nd Qtr 2011
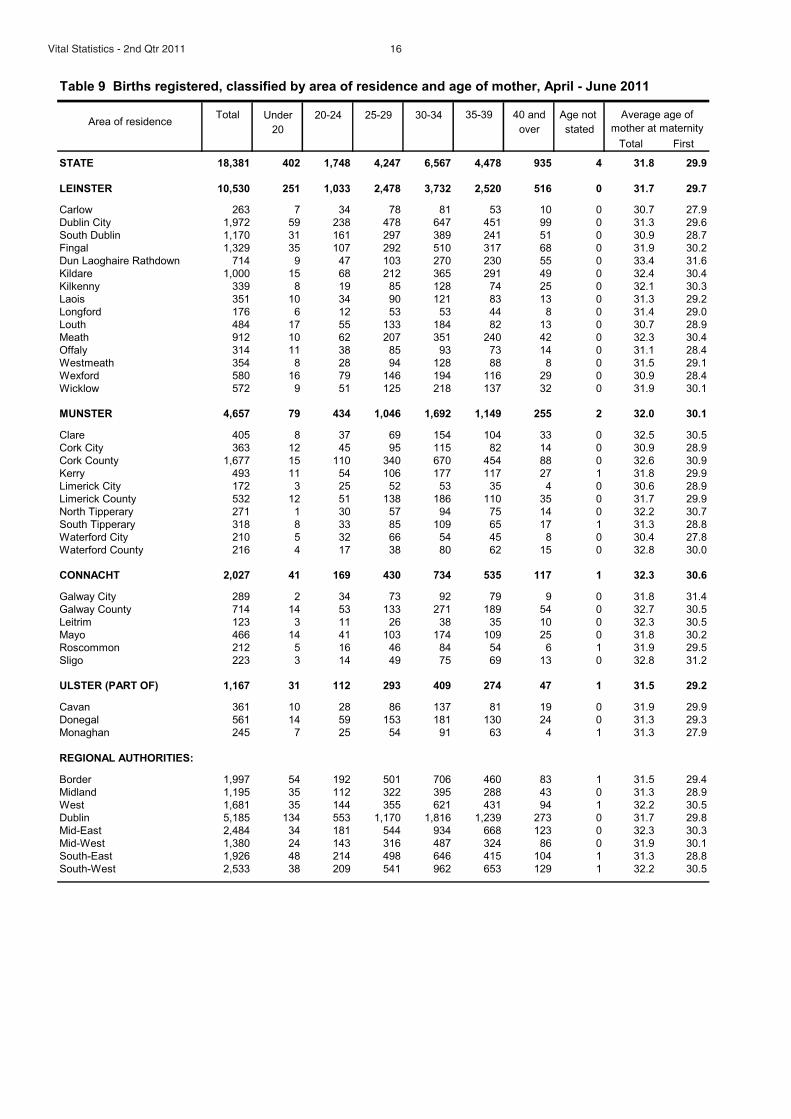
Table 9 Births registered, classified by area of residence and age of mother, April - June 2011
Total Under 20-24 25-29 30-34 35-39 40 and Age not
20 over stated
Total First
STATE 18,381 402 1,748 4,247 6,567 4,478 935 4 31.8 29.9
LEINSTER 10,530 251 1,033 2,478 3,732 2,520 516 0 31.7 29.7
Carlow 263 7 34 78 81 53 10 0 30.7 27.9
Dublin City 1,972 59 238 478 647 451 99 0 31.3 29.6
South Dublin 1,170 31 161 297 389 241 51 0 30.9 28.7
Fingal 1,329 35 107 292 510 317 68 0 31.9 30.2
Dun Laoghaire Rathdown 714 9 47 103 270 230 55 0 33.4 31.6
Kildare 1,000 15 68 212 365 291 49 0 32.4 30.4
Kilkenny 339 8 19 85 128 74 25 0 32.1 30.3
Laois 351 10 34 90 121 83 13 0 31.3 29.2
Longford 176 6 12 53 53 44 8 0 31.4 29.0
Louth 484 17 55 133 184 82 13 0 30.7 28.9
Meath 912 10 62 207 351 240 42 0 32.3 30.4
Offaly 314 11 38 85 93 73 14 0 31.1 28.4
Westmeath 354 8 28 94 128 88 8 0 31.5 29.1
Wexford 580 16 79 146 194 116 29 0 30.9 28.4
Wicklow 572 9 51 125 218 137 32 0 31.9 30.1
MUNSTER 4,657 79 434 1,046 1,692 1,149 255 2 32.0 30.1
Clare 405 8 37 69 154 104 33 0 32.5 30.5
Cork City 363 12 45 95 115 82 14 0 30.9 28.9
Cork County 1,677 15 110 340 670 454 88 0 32.6 30.9
Kerry 493 11 54 106 177 117 27 1 31.8 29.9
Limerick City 172 3 25 52 53 35 4 0 30.6 28.9
Limerick County 532 12 51 138 186 110 35 0 31.7 29.9
North Tipperary 271 1 30 57 94 75 14 0 32.2 30.7
South Tipperary 318 8 33 85 109 65 17 1 31.3 28.8
Waterford City 210 5 32 66 54 45 8 0 30.4 27.8
Waterford County 216 4 17 38 80 62 15 0 32.8 30.0
CONNACHT 2,027 41 169 430 734 535 117 1 32.3 30.6
Galway City 289 2 34 73 92 79 9 0 31.8 31.4
Galway County 714 14 53 133 271 189 54 0 32.7 30.5
Leitrim 123 3 11 26 38 35 10 0 32.3 30.5
Mayo 466 14 41 103 174 109 25 0 31.8 30.2
Roscommon 212 5 16 46 84 54 6 1 31.9 29.5
Sligo 223 3 14 49 75 69 13 0 32.8 31.2
ULSTER (PART OF) 1,167 31 112 293 409 274 47 1 31.5 29.2
Cavan 361 10 28 86 137 81 19 0 31.9 29.9
Donegal 561 14 59 153 181 130 24 0 31.3 29.3
Monaghan 245 7 25 54 91 63 4 1 31.3 27.9
REGIONAL AUTHORITIES:
Border 1,997 54 192 501 706 460 83 1 31.5 29.4
Midland 1,195 35 112 322 395 288 43 0 31.3 28.9
West 1,681 35 144 355 621 431 94 1 32.2 30.5
Dublin 5,185 134 553 1,170 1,816 1,239 273 0 31.7 29.8
Mid-East 2,484 34 181 544 934 668 123 0 32.3 30.3
Mid-West 1,380 24 143 316 487 324 86 0 31.9 30.1
South-East 1,926 48 214 498 646 415 104 1 31.3 28.8
South-West 2,533 38 209 541 962 653 129 1 32.2 30.5
Area of residenceAverage age of
mother at maternity
Vital Statistics - 2nd Qtr 2011 16
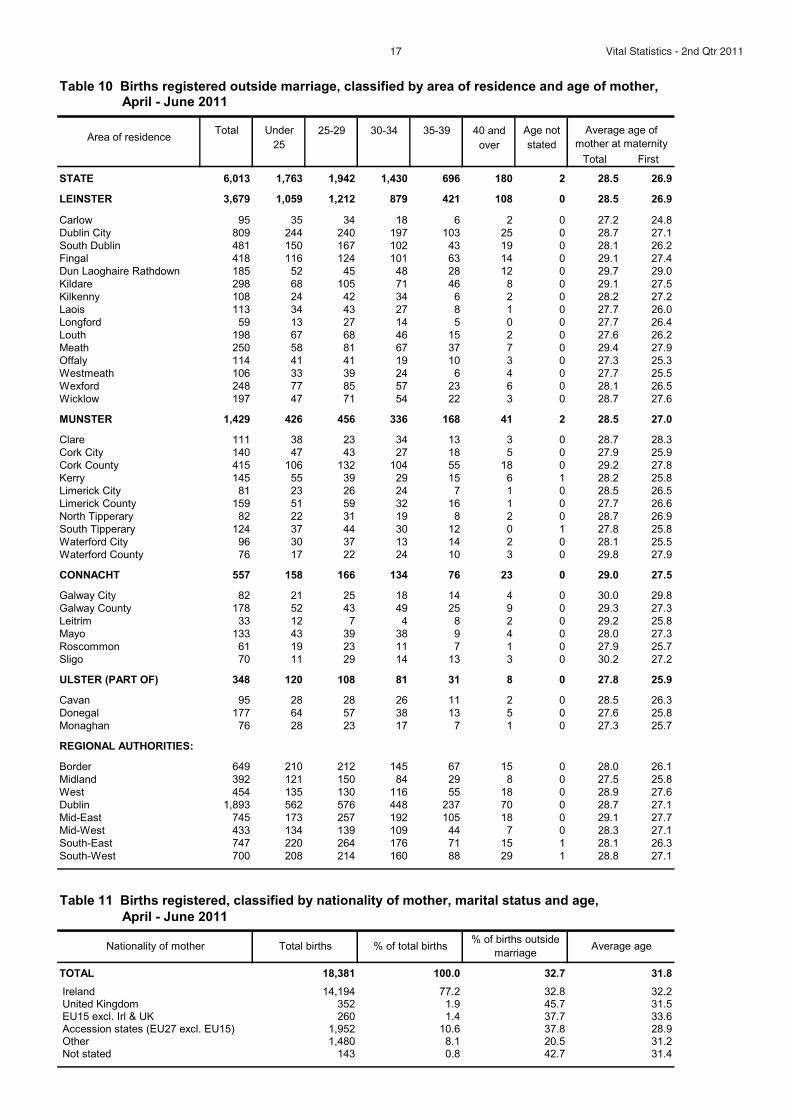
Table 10 Births registered outside marriage, classified by area of residence and age of mother,April - June 2011
Total Under 25-29 30-34 35-39 40 and Age not
25 over stated
Total First
STATE 6,013 1,763 1,942 1,430 696 180 2 28.5 26.9
LEINSTER 3,679 1,059 1,212 879 421 108 0 28.5 26.9
Carlow 95 35 34 18 6 2 0 27.2 24.8
Dublin City 809 244 240 197 103 25 0 28.7 27.1
South Dublin 481 150 167 102 43 19 0 28.1 26.2
Fingal 418 116 124 101 63 14 0 29.1 27.4
Dun Laoghaire Rathdown 185 52 45 48 28 12 0 29.7 29.0
Kildare 298 68 105 71 46 8 0 29.1 27.5
Kilkenny 108 24 42 34 6 2 0 28.2 27.2
Laois 113 34 43 27 8 1 0 27.7 26.0
Longford 59 13 27 14 5 0 0 27.7 26.4
Louth 198 67 68 46 15 2 0 27.6 26.2
Meath 250 58 81 67 37 7 0 29.4 27.9
Offaly 114 41 41 19 10 3 0 27.3 25.3
Westmeath 106 33 39 24 6 4 0 27.7 25.5
Wexford 248 77 85 57 23 6 0 28.1 26.5
Wicklow 197 47 71 54 22 3 0 28.7 27.6
MUNSTER 1,429 426 456 336 168 41 2 28.5 27.0
Clare 111 38 23 34 13 3 0 28.7 28.3
Cork City 140 47 43 27 18 5 0 27.9 25.9
Cork County 415 106 132 104 55 18 0 29.2 27.8
Kerry 145 55 39 29 15 6 1 28.2 25.8
Limerick City 81 23 26 24 7 1 0 28.5 26.5
Limerick County 159 51 59 32 16 1 0 27.7 26.6
North Tipperary 82 22 31 19 8 2 0 28.7 26.9
South Tipperary 124 37 44 30 12 0 1 27.8 25.8
Waterford City 96 30 37 13 14 2 0 28.1 25.5
Waterford County 76 17 22 24 10 3 0 29.8 27.9
CONNACHT 557 158 166 134 76 23 0 29.0 27.5
Galway City 82 21 25 18 14 4 0 30.0 29.8
Galway County 178 52 43 49 25 9 0 29.3 27.3
Leitrim 33 12 7 4 8 2 0 29.2 25.8
Mayo 133 43 39 38 9 4 0 28.0 27.3
Roscommon 61 19 23 11 7 1 0 27.9 25.7
Sligo 70 11 29 14 13 3 0 30.2 27.2
ULSTER (PART OF) 348 120 108 81 31 8 0 27.8 25.9
Cavan 95 28 28 26 11 2 0 28.5 26.3
Donegal 177 64 57 38 13 5 0 27.6 25.8
Monaghan 76 28 23 17 7 1 0 27.3 25.7
REGIONAL AUTHORITIES:
Border 649 210 212 145 67 15 0 28.0 26.1
Midland 392 121 150 84 29 8 0 27.5 25.8
West 454 135 130 116 55 18 0 28.9 27.6
Dublin 1,893 562 576 448 237 70 0 28.7 27.1
Mid-East 745 173 257 192 105 18 0 29.1 27.7
Mid-West 433 134 139 109 44 7 0 28.3 27.1
South-East 747 220 264 176 71 15 1 28.1 26.3
South-West 700 208 214 160 88 29 1 28.8 27.1
April - June 2011
TOTAL 18,381 100.0 32.7 31.8
Ireland 14,194 77.2 32.8 32.2United Kingdom 352 1.9 45.7 31.5EU15 excl. Irl & UK 260 1.4 37.7 33.6Accession states (EU27 excl. EU15) 1,952 10.6 37.8 28.9Other 1,480 8.1 20.5 31.2Not stated 143 0.8 42.7 31.4
Area of residenceAverage age of
mother at maternity
Table 11 Births registered, classified by nationality of mother, marital status and age,
Nationality of mother Total births % of total births% of births outside
marriageAverage age
17 Vital Statistics - 2nd Qtr 2011
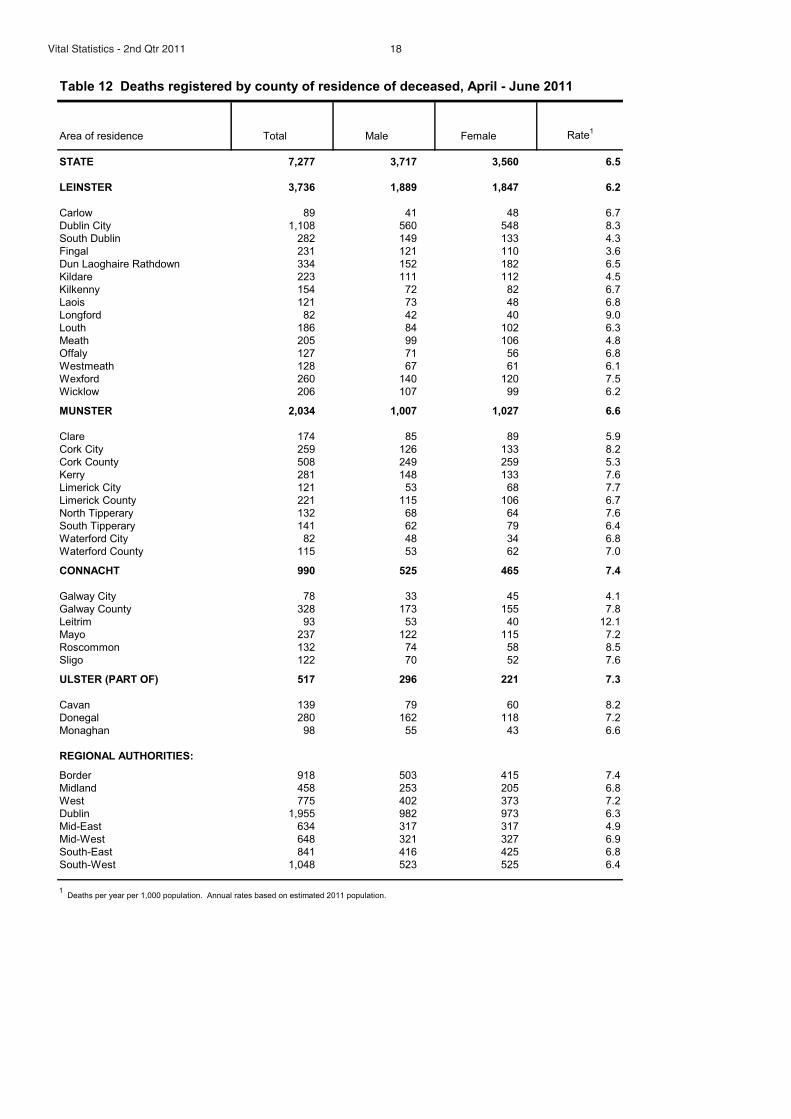
Table 12 Deaths registered by county of residence of deceased, April - June 2011
Area of residence Total Male Female Rate1
STATE 7,277 3,717 3,560 6.5
LEINSTER 3,736 1,889 1,847 6.2
Carlow 89 41 48 6.7
Dublin City 1,108 560 548 8.3
South Dublin 282 149 133 4.3
Fingal 231 121 110 3.6
Dun Laoghaire Rathdown 334 152 182 6.5
Kildare 223 111 112 4.5
Kilkenny 154 72 82 6.7
Laois 121 73 48 6.8
Longford 82 42 40 9.0
Louth 186 84 102 6.3
Meath 205 99 106 4.8
Offaly 127 71 56 6.8
Westmeath 128 67 61 6.1
Wexford 260 140 120 7.5
Wicklow 206 107 99 6.2
MUNSTER 2,034 1,007 1,027 6.6
Clare 174 85 89 5.9
Cork City 259 126 133 8.2
Cork County 508 249 259 5.3
Kerry 281 148 133 7.6
Limerick City 121 53 68 7.7
Limerick County 221 115 106 6.7
North Tipperary 132 68 64 7.6
South Tipperary 141 62 79 6.4
Waterford City 82 48 34 6.8
Waterford County 115 53 62 7.0
CONNACHT 990 525 465 7.4
Galway City 78 33 45 4.1
Galway County 328 173 155 7.8
Leitrim 93 53 40 12.1
Mayo 237 122 115 7.2
Roscommon 132 74 58 8.5
Sligo 122 70 52 7.6
ULSTER (PART OF) 517 296 221 7.3
Cavan 139 79 60 8.2
Donegal 280 162 118 7.2
Monaghan 98 55 43 6.6
REGIONAL AUTHORITIES:
Border 918 503 415 7.4
Midland 458 253 205 6.8
West 775 402 373 7.2
Dublin 1,955 982 973 6.3
Mid-East 634 317 317 4.9
Mid-West 648 321 327 6.9
South-East 841 416 425 6.8
South-West 1,048 523 525 6.4
1Deaths per year per 1,000 population. Annual rates based on estimated 2011 population.
Vital Statistics - 2nd Qtr 2011 18
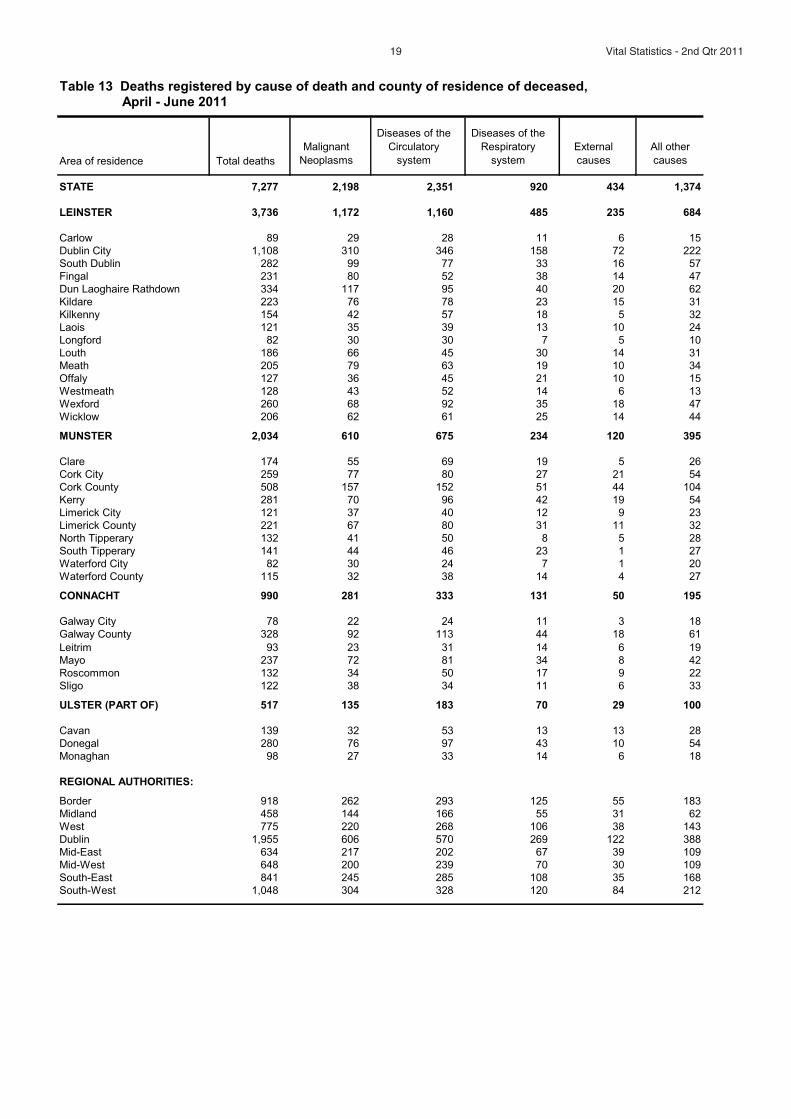
Table 13 Deaths registered by cause of death and county of residence of deceased,April - June 2011
Area of residence Total deaths
Malignant
Neoplasms
Diseases of the
Circulatory
system
Diseases of the
Respiratory
system
External
causes
All other
causes
STATE 7,277 2,198 2,351 920 434 1,374
LEINSTER 3,736 1,172 1,160 485 235 684
Carlow 89 29 28 11 6 15
Dublin City 1,108 310 346 158 72 222
South Dublin 282 99 77 33 16 57
Fingal 231 80 52 38 14 47
Dun Laoghaire Rathdown 334 117 95 40 20 62
Kildare 223 76 78 23 15 31
Kilkenny 154 42 57 18 5 32
Laois 121 35 39 13 10 24
Longford 82 30 30 7 5 10
Louth 186 66 45 30 14 31
Meath 205 79 63 19 10 34
Offaly 127 36 45 21 10 15
Westmeath 128 43 52 14 6 13
Wexford 260 68 92 35 18 47
Wicklow 206 62 61 25 14 44
MUNSTER 2,034 610 675 234 120 395
Clare 174 55 69 19 5 26
Cork City 259 77 80 27 21 54
Cork County 508 157 152 51 44 104
Kerry 281 70 96 42 19 54
Limerick City 121 37 40 12 9 23
Limerick County 221 67 80 31 11 32
North Tipperary 132 41 50 8 5 28
South Tipperary 141 44 46 23 1 27
Waterford City 82 30 24 7 1 20
Waterford County 115 32 38 14 4 27
CONNACHT 990 281 333 131 50 195
Galway City 78 22 24 11 3 18
Galway County 328 92 113 44 18 61
Leitrim 93 23 31 14 6 19
Mayo 237 72 81 34 8 42
Roscommon 132 34 50 17 9 22
Sligo 122 38 34 11 6 33
ULSTER (PART OF) 517 135 183 70 29 100
Cavan 139 32 53 13 13 28
Donegal 280 76 97 43 10 54
Monaghan 98 27 33 14 6 18
REGIONAL AUTHORITIES:
Border 918 262 293 125 55 183
Midland 458 144 166 55 31 62
West 775 220 268 106 38 143
Dublin 1,955 606 570 269 122 388
Mid-East 634 217 202 67 39 109
Mid-West 648 200 239 70 30 109
South-East 841 245 285 108 35 168
South-West 1,048 304 328 120 84 212
19 Vital Statistics - 2nd Qtr 2011
Tab
le14
De
ath
sre
gis
tere
dc
las
sif
ied
by
ca
us
ea
nd
ag
eg
rou
p,A
pri
l-
Ju
ne
20
11
Cause
of
Death
65
CO
DIC
D-1
0T
ota
lU
nder
11-4
5-1
415-2
425-3
435-4
445-5
455-6
465-7
475-8
485
and
Code
Code
Death
sover
To
tal
death
s0
A00-Y
89
7,2
77
61
97
77
114
218
377
796
1,3
08
2,0
73
2,2
37
Infe
cti
ou
san
dp
ara
sit
icd
iseases:-
1A
00-B
99
63
10
00
25
57
417
22
Tuberc
ulo
sis
2A
15-A
19,B
90
80
00
00
00
11
42
Menin
gococcalin
fection
3A
39
00
00
00
00
00
00
AID
S(H
IVD
isease)
4B
20-B
24
40
00
01
20
10
00
ViralH
epatitis
5B
15-B
19
60
00
01
13
10
00
Oth
er
infe
ctious
and
para
sitic
dis
eases
45
10
00
02
24
313
20
Neo
pla
sm
s6
C00-D
48
2,2
52
00
36
16
62
140
399
619
638
369
Mali
gn
an
tN
eo
pla
sm
so
fth
e:-
7C
00-C
97
2,1
98
00
36
16
61
139
394
605
623
351
Lip
,ora
lcavity,
phary
nx
8C
00-C
14
35
00
01
01
69
96
3O
esophagus
9C
15
96
00
00
01
12
20
23
23
17
Sto
mach
10
C16
74
00
00
04
49
24
20
13
Colo
n11
C18
154
00
00
01
721
49
50
26
Rectu
mand
anus
12
C19-C
21
122
00
00
13
925
32
30
22
Liv
er
and
the
intr
ahepatic
bile
ducts
13
C22
70
00
00
11
320
17
18
10
Pancre
as
14
C25
125
00
00
01
923
31
38
23
Lary
nx
and
trachea/b
ronchus
/lung
15
C32-C
34
443
00
00
17
21
89
144
128
53
Skin
16
C43
38
00
00
03
47
96
9B
reast
17
C50
166
00
00
114
16
40
44
33
18
Cerv
ixute
ri18
C53
33
00
10
26
87
43
2O
ther
part
sof
ute
rus
19
C54-C
55
29
00
00
00
26
10
38
Ovary
20
C56
72
00
00
00
518
17
20
12
Pro
sta
te21
C61
154
00
00
00
015
40
60
39
Kid
ney
22
C64
45
00
00
01
59
17
10
3B
ladder
23
C67
59
00
00
00
36
15
21
14
Lym
ph/h
aem
ato
poie
tic
tissue
24
C81-C
96
158
00
12
05
823
36
59
24
Oth
er
malig
nant
neopla
sm
s325
00
13
10
13
17
47
84
95
55
Dis
eases
of
the
blo
od
an
db
loo
d-f
orm
ing
org
an
s,
imm
un
olo
gic
al
dis
ord
ers
25
D5
0-D
89
19
00
00
11
21
16
7E
nd
oc
rin
e,
Nu
trit
ion
al
an
dm
eta
bo
lic
dis
eases
26
E00-E
90
151
00
05
22
49
23
48
58
Dia
bete
sm
elli
tus
27
E10-E
14
111
00
01
02
36
18
36
45
Men
tal
an
db
eh
avio
ura
ld
iso
rders
28
F00-F
99
177
00
00
01
07
10
64
95
Dis
eases
of
the
nerv
ou
ssyste
man
dth
esen
se
org
an
s31
G00-H
95
275
31
13
66
12
23
39
84
97
Menin
gitis
32
G00-G
03
10
00
00
10
00
00
Dis
eases
of
the
Cir
cu
lato
ryS
yste
m:-
33
I00-I
99
2,3
51
40
10
921
100
196
344
720
956
Ischaem
icheart
dis
ease
34
I20-I
25
1,2
19
00
00
310
57
112
206
373
458
of
whic
h:
(Acute
myocard
ialin
farc
tion)
I21
538
00
00
13
17
32
94
169
222
Oth
er
heart
dis
ease
35
I30-I
33,I
39-I
52
338
30
00
34
19
20
39
84
166
Cere
bro
vascula
rdis
ease
36
I60-I
69
494
10
00
26
15
39
55
170
206
Oth
er
dis
eases
of
circula
tory
syste
m300
00
10
11
925
44
93
126
Age
Gro
up
20Vital Statistics - 2nd Qtr 2011
Dis
eases
of
the
Resp
irato
rysyste
m37
J00-J
99
920
11
02
08
16
40
136
313
403
Influenza
38
J10-J
11
10
10
00
00
00
00
Pneum
onia
39
J12-J
19
294
00
01
03
79
20
83
171
Chro
nic
Low
er
respirato
rydis
ease
40
J40-J
47
387
00
01
04
620
72
149
135
of
whic
h:
Asth
ma
41
J45-J
46
18
00
01
02
31
12
8O
ther
dis
eases
of
the
respirato
rysyste
m238
10
00
01
311
44
81
97
Dis
eases
of
the
Dig
esti
ve
syste
m42
K00-K
93
300
01
00
620
31
46
63
68
65
Ulc
er
of
sto
mach,
duodenum
and
jeju
num
43
K25-K
28
26
00
00
02
12
56
10
Chro
nic
liver
dis
ease
44
K70,K
73-K
74
89
00
00
411
24
31
16
30
Oth
er
dis
eases
of
the
dig
estive
syste
m185
01
00
27
613
42
59
55
Dis
eases
of
the
skin
an
dsu
bcu
tan
eo
us
tissu
e45
L00-L
99
80
00
00
01
01
24
Dis
eases
of
the
mu
scu
loskele
tal
syste
m/c
on
necti
ve
tissu
e46
M00-M
99
43
00
00
02
12
514
19
Rheum
ato
idart
hritis
and
oste
oart
hro
sis
47
M05-M
06,M
15-M
19
12
00
00
00
00
24
6
Dis
eases
of
the
gen
ito
uri
nary
syste
m48
N00-N
99
184
10
00
01
213
20
56
91
Dis
eases
of
the
kid
ney
and
ure
ter
49
N00-N
29
122
10
00
01
211
15
40
52
Co
mp
lic
ati
on
so
fp
reg
na
nc
y,
ch
ild
bir
than
dp
uerp
eri
um
50
O00-O
99
20
00
02
00
00
00
Cert
ain
co
nd
itio
ns
ori
gin
ati
ng
inth
e
pe
rin
ata
lp
eri
od
151
P00-P
96
17
17
00
00
00
00
00
Co
ng
en
ita
lm
alf
orm
ati
on
san
dch
rom
oso
mal
ab
no
mali
ties
52
Q00-Q
99
49
28
11
33
24
70
00
Congenitalm
alform
ations
of
the:-
Nerv
ous
syste
m53
Q00-Q
07
85
11
00
00
10
00
Circula
tory
syste
m54
Q20-Q
28
14
60
01
21
22
00
0
Sym
pto
ms,
sig
ns
,ab
no
rmal
fin
din
gs,
ill-
defi
ned
cau
ses
55
R00-R
99
32
62
00
24
12
02
13
Sudden
infa
nt
death
syndro
me
56
R95
64
20
00
00
00
00
Unknow
nand
unspecifie
dcauses
57
R96-R
99
11
20
00
22
12
01
1
Exte
rnal
cau
ses
of
inju
ryan
dp
ois
on
ing
58
V01-Y
89
434
03
158
65
83
58
44
43
41
38
Accid
ents
59
V01-X
59
264
03
031
35
39
26
25
35
34
36
of
whic
h:
Tra
nsport
accid
ents
60
V01-V
99
44
01
017
84
24
53
0A
ccid
enta
lfa
lls61
W00-W
19
65
00
01
04
76
12
15
20
Accid
enta
lpois
onin
g62
X40-X
49
78
00
011
22
23
96
43
0oth
er
accid
ents
77
02
02
58
89
14
13
16
Suic
ide
and
inte
ntionalself
harm
63
X60-X
84
134
00
124
24
38
27
15
41
0H
om
icid
e/a
ssault
64
X85-Y
09
90
00
23
11
11
00
Events
of
undete
rmin
ed
inte
nt
65
Y10-Y
34
17
00
01
35
32
11
1A
lloth
er
exte
rnalcauses
10
00
00
00
11
25
1
1S
tillb
irth
snotin
clu
ded.
21 Vital Statistics - 2nd Qtr 2011
22Vital Statistics - 2nd Qtr 2011T
ab
le15
Male
death
sre
gis
tere
dcla
ssif
ied
by
cau
se
an
dag
eg
rou
p,A
pri
l-
Ju
ne
2011
Cause
of
Death
65
CO
DIC
D-1
0T
ota
lU
nder
11-4
5-1
415-2
425-3
435-4
445-5
455-6
465-7
475-8
485
and
Code
Code
Male
sover
To
tal
Male
Death
s0
A00-Y
89
3,7
17
27
64
57
78
140
229
482
773
1,1
13
808
Infe
cti
ou
san
dp
ara
sit
icd
iseases:-
1A
00-B
99
29
10
00
21
44
28
7T
uberc
ulo
sis
2A
15-A
19,B
90
40
00
00
00
11
11
Menin
gococcalin
fection
3A
39
00
00
00
00
00
00
AID
S(H
IVD
isease)
4B
20-B
24
30
00
01
10
10
00
ViralH
epatitis
5B
15-B
19
30
00
01
02
00
00
Oth
er
infe
ctious
and
para
sitic
dis
eases
19
10
00
00
22
17
6
Neo
pla
sm
s6
C00-D
48
1,1
76
00
24
926
70
219
347
343
156
Mali
gn
an
tN
eo
pla
sm
so
fth
e:-
7C
00-C
97
1,1
46
00
24
925
69
214
337
336
150
Lip
,ora
lcavity,
phary
nx
8C
00-C
14
29
00
01
01
59
74
2O
esophagus
9C
15
60
00
00
01
10
13
15
12
9S
tom
ach
10
C16
44
00
00
04
16
15
12
6C
olo
n11
C18
91
00
00
01
513
34
28
10
Rectu
mand
anus
12
C19-C
21
85
00
00
11
718
25
21
12
Liv
er
and
the
intr
ahepatic
bile
ducts
13
C22
43
00
00
10
312
10
12
5P
ancre
as
14
C25
66
00
00
01
516
18
21
5Lary
nx
and
trachea/b
ronchus
/lung
15
C32-C
34
246
00
00
06
11
55
82
75
17
Skin
16
C43
20
00
00
02
45
32
4B
reast
17
C50
00
00
00
00
00
00
Cerv
ixute
ri18
C53
00
00
00
00
00
00
Oth
er
part
sof
ute
rus
19
C54-C
55
00
00
00
00
00
00
Ovary
20
C56
00
00
00
00
00
00
Pro
sta
te21
C61
154
00
00
00
015
40
60
39
Kid
ney
22
C64
31
00
00
01
18
12
81
Bla
dder
23
C67
35
00
00
00
33
12
11
6Lym
ph/h
aem
ato
poie
tic
tissue
24
C81-C
96
75
00
10
01
412
17
27
13
Oth
er
malig
nant
neopla
sm
s167
00
13
76
10
29
47
43
21
Dis
eases
of
the
blo
od
an
db
loo
d-f
orm
ing
org
an
s,
imm
un
olo
gic
al
dis
ord
ers
25
D50-D
89
10
00
00
11
10
14
2
En
do
cri
ne,
Nu
trit
ion
al
an
dm
eta
bo
lic
dis
eases
26
E00-E
90
75
00
03
11
35
13
30
19
Dia
bete
sm
elli
tus
27
E10-E
14
58
00
01
01
34
11
24
14
Men
tal
an
db
eh
avio
ura
ld
iso
rders
28
F00-F
99
67
00
00
00
06
334
24
Dis
eases
of
the
nerv
ou
ssyste
man
dth
esen
se
org
an
s31
G00-H
95
139
21
13
35
614
24
45
35
Menin
gitis
32
G00-G
03
10
00
00
10
00
00
Dis
eases
of
the
Cir
cu
lato
ryS
yste
m:-
33
I00-I
99
1,1
83
30
00
413
67
143
227
399
327
Ischaem
icheart
dis
ease
34
I20-I
25
686
00
00
17
42
89
149
224
174
of
whic
h:
(Acute
myocard
ialin
farc
tion)
I21
290
00
00
12
12
30
62
102
81
Oth
er
heart
dis
ease
35
I30-I
33,I
39-I
52
139
20
00
22
13
12
18
45
45
Cere
bro
vascula
rdis
ease
36
I60-I
69
222
10
00
14
827
31
88
62
Oth
er
dis
eases
of
circula
tory
syste
m136
00
00
00
415
29
42
46
Age
Gro
up
Dis
eases
of
the
Resp
irato
rysyste
m37
J00-J
99
433
01
01
06
10
25
74
159
157
Influenza
38
J10-J
11
10
10
00
00
00
00
Pneum
onia
39
J12-J
19
120
00
01
02
57
12
36
57
Chro
nic
Low
er
respirato
rydis
ease
40
J40-J
47
178
00
00
04
411
34
71
54
of
whic
h:
Asth
ma
41
J45-J
46
60
00
00
22
01
01
Oth
er
dis
eases
of
the
respirato
rysyste
m134
00
00
00
17
28
52
46
Dis
eases
of
the
Dig
esti
ve
syste
m42
K00-K
93
152
01
00
59
18
24
38
36
21
Ulc
er
of
sto
mach,
duodenum
and
jeju
num
43
K25-K
28
12
00
00
02
01
34
2C
hro
nic
liver
dis
ease
44
K70,K
73-K
74
49
00
00
33
14
17
11
10
Oth
er
dis
eases
of
the
dig
estive
syste
m91
01
00
24
46
24
31
19
Dis
eases
of
the
skin
an
dsu
bcu
tan
eo
us
tissu
e45
L00-L
99
30
00
00
00
01
02
Dis
eases
of
the
mu
scu
loskele
tal
syste
m/c
on
necti
ve
tissu
e46
M00-M
99
13
00
00
01
10
15
5R
heum
ato
idart
hritis
and
oste
oart
hro
sis
47
M05-M
06,M
15-M
19
50
00
00
00
01
22
Dis
eases
of
the
gen
ito
uri
nary
syste
m48
N00-N
99
85
00
00
01
24
13
27
38
Dis
eases
of
the
kid
ney
and
ure
ter
49
N00-N
29
63
00
00
01
24
11
20
25
Co
mp
lic
ati
on
so
fp
reg
na
nc
y,
ch
ild
bir
than
dp
uerp
eri
um
50
O00-O
99
00
00
00
00
00
00
Cert
ain
co
nd
itio
ns
ori
gin
ati
ng
inth
e
pe
rin
ata
lp
eri
od
151
P00-P
96
99
00
00
00
00
00
Co
ng
en
ita
lm
alf
orm
ati
on
san
dch
rom
oso
mal
ab
no
mali
ties
52
Q00-Q
99
21
81
02
22
06
00
0C
ongenitalm
alform
ations
of
the:-
Nerv
ous
syste
m53
Q00-Q
07
20
10
00
00
10
00
Circula
tory
syste
m54
Q20-Q
28
83
00
11
10
20
00
Sym
pto
ms,
sig
ns
.,a
bn
orm
al
fin
din
gs,
ill-
defi
ned
cau
ses
55
R00-R
99
13
41
00
11
11
00
4S
udden
infa
nt
death
syndro
me
56
R95
32
10
00
00
00
00
Unknow
nand
unspecifie
dcauses
57
R96-R
99
52
00
01
01
10
00
Exte
rnal
cau
ses
of
inju
ryan
dp
ois
on
ing
58
V01-Y
89
309
01
144
50
73
46
31
29
23
11
Accid
ents
59
V01-X
59
168
01
023
25
33
19
15
23
19
10
of
whic
h:
Tra
nsport
accid
ents
60
V01-V
99
33
00
013
53
23
43
0A
ccid
enta
lfa
lls61
W00-W
19
35
00
01
04
62
710
5A
ccid
enta
lpois
onin
g62
X40-X
49
61
00
08
16
19
65
43
0oth
er
accid
ents
39
01
01
47
55
83
5S
uic
ide
and
inte
ntionalself
harm
63
X60-X
84
113
00
118
20
35
23
13
21
0H
om
icid
e/a
ssault
64
X85-Y
09
90
00
23
11
11
00
Events
of
undete
rmin
ed
inte
nt
65
Y10-Y
34
13
00
01
24
22
10
1A
lloth
er
exte
rnalcauses
60
00
00
01
02
30
1S
tillb
irth
snotin
clu
ded.
23 Vital Statistics - 2nd Qtr 2011
Tab
le16
Fe
ma
led
ea
ths
reg
iste
red
cla
ss
ifie
db
yc
au
se
an
dag
eg
rou
p,A
pri
l-
Ju
ne
20
11
Cause
of
Death
65
CO
DIC
D-1
0T
ota
lU
nder
11-4
5-1
415-2
425-3
435-4
445-5
455-6
465-7
475-8
485
and
Code
Code
Fem
ale
sover
To
tal
Fem
ale
Death
s0
A00-Y
89
3,5
60
34
33
20
36
78
148
314
535
960
1,4
29
Infe
cti
ou
san
dp
ara
sit
icd
iseases:-
1A
00-B
99
34
00
00
04
13
29
15
Tuberc
ulo
sis
2A
15-A
19,B
90
40
00
00
00
00
31
Menin
gococcalin
fection
3A
39
00
00
00
00
00
00
AID
S(H
IVD
isease)
4B
20-B
24
10
00
00
10
00
00
ViralH
epatitis
5B
15-B
19
30
00
00
11
10
00
Oth
er
infe
ctious
and
para
sitic
dis
eases
26
00
00
02
02
26
14
Neo
pla
sm
s6
C00-D
48
1,0
76
00
12
736
70
180
272
295
213
Mali
gn
an
tN
eo
pla
sm
so
fth
e:-
7C
00-C
97
1,0
52
00
12
736
70
180
268
287
201
Lip
,ora
lcavity,
phary
nx
8C
00-C
14
60
00
00
01
02
21
Oesophagus
9C
15
36
00
00
00
27
811
8S
tom
ach
10
C16
30
00
00
00
33
98
7C
olo
n11
C18
63
00
00
00
28
15
22
16
Rectu
mand
anus
12
C19-C
21
37
00
00
02
27
79
10
Liv
er
and
the
intr
ahepatic
bile
ducts
13
C22
27
00
00
01
08
76
5P
ancre
as
14
C25
59
00
00
00
47
13
17
18
Lary
nx
and
trachea/b
ronchus
/lung
15
C32-C
34
197
00
00
11
10
34
62
53
36
Skin
16
C43
18
00
00
01
02
64
5B
reast
17
C50
166
00
00
114
16
40
44
33
18
Cerv
ixute
ri18
C53
33
00
10
26
87
43
2O
ther
part
sof
ute
rus
19
C54-C
55
29
00
00
00
26
10
38
Ovary
20
C56
72
00
00
00
518
17
20
12
Pro
sta
te21
C61
00
00
00
00
00
00
Kid
ney
22
C64
14
00
00
00
41
52
2B
ladder
23
C67
24
00
00
00
03
310
8Lym
ph/h
aem
ato
poie
tic
tissue
24
C81-C
96
83
00
02
04
411
19
32
11
Oth
er
malig
nant
neopla
sm
s158
00
00
37
718
37
52
34
Dis
eases
of
the
blo
od
an
db
loo
d-f
orm
ing
org
an
s,
imm
un
olo
gic
al
dis
ord
ers
25
D50-D
89
90
00
00
01
10
25
En
do
cri
ne
,N
utr
itio
na
lan
dm
eta
bo
lic
dis
eases
26
E00-E
90
76
00
02
11
14
10
18
39
Dia
bete
sm
elli
tus
27
E10-E
14
53
00
00
01
02
712
31
Men
tal
an
db
eh
avio
ura
ld
iso
rders
28
F00-F
99
110
00
00
01
01
730
71
Dis
eases
of
the
nerv
ou
ssyste
man
dth
esen
se
org
an
s31
G00-H
95
136
10
00
31
69
15
39
62
Menin
gitis
32
G00-G
03
00
00
00
00
00
00
Dis
eases
of
the
Cir
cu
lato
ryS
yste
m:-
33
I00-I
99
1,1
68
10
10
58
33
53
117
321
629
Ischaem
icheart
dis
ease
34
I20-I
25
533
00
00
23
15
23
57
149
284
of
whic
h:
(Acute
myocard
ialin
farc
tion)
I21
248
00
00
01
52
32
67
141
Oth
er
heart
dis
ease
35
I30-I
33,I
39-I
52
199
10
00
12
68
21
39
121
Cere
bro
vascula
rdis
ease
36
I60-I
69
272
00
00
12
712
24
82
144
Oth
er
dis
eases
of
circula
tory
syste
m164
00
10
11
510
15
51
80
Age
Gro
up
24Vital Statistics - 2nd Qtr 2011
Dis
eases
of
the
Resp
irato
rysyste
m37
J00-J
99
487
10
01
02
615
62
154
246
Influenza
38
J10-J
11
00
00
00
00
00
00
Pneum
onia
39
J12-J
19
174
00
00
01
22
847
114
Chro
nic
Low
er
respirato
rydis
ease
40
J40-J
47
209
00
01
00
29
38
78
81
of
whic
h:
Asth
ma
41
J45-J
46
12
00
01
00
11
02
7O
ther
dis
eases
of
the
respirato
rysyste
m104
10
00
01
24
16
29
51
Dis
eases
of
the
Dig
esti
ve
syste
m42
K00-K
93
148
00
00
111
13
22
25
32
44
Ulc
er
of
sto
mach,
duodenum
and
jeju
num
43
K25-K
28
14
00
00
00
11
22
8C
hro
nic
liver
dis
ease
44
K70,K
73-K
74
40
00
00
18
10
14
52
0O
ther
dis
eases
of
the
dig
estive
syste
m94
00
00
03
27
18
28
36
Dis
eases
of
the
skin
an
dsu
bcu
tan
eo
us
tissu
e45
L00-L
99
50
00
00
01
00
22
Dis
eases
of
the
mu
scu
loskele
tal
syste
m/c
on
necti
ve
tissu
e46
M00-M
99
30
00
00
01
02
49
14
Rheum
ato
idart
hritis
and
oste
oart
hro
sis
47
M05-M
06,M
15-M
19
70
00
00
00
01
24
Dis
eases
of
the
gen
ito
uri
nary
syste
m48
N00-N
99
99
10
00
00
09
729
53
Dis
eases
of
the
kid
ney
and
ure
ter
49
N00-N
29
59
10
00
00
07
420
27
Co
mp
lic
ati
on
so
fp
reg
na
nc
y,
ch
ild
bir
than
dp
uerp
eri
um
50
O00-O
99
20
00
02
00
00
00
Cert
ain
co
nd
itio
ns
ori
gin
ati
ng
inth
e
pe
rin
ata
lp
eri
od
151
P00-P
96
88
00
00
00
00
00
Co
ng
en
ital
ma
lfo
rma
tio
ns
an
dch
rom
oso
mal
ab
no
maliti
es
52
Q00-Q
99
28
20
01
11
04
10
00
Congenitalm
alform
ations
of
the:-
Nerv
ous
syste
m53
Q00-Q
07
65
01
00
00
00
00
Circula
tory
syste
m54
Q20-Q
28
63
00
01
02
00
00
Sym
pto
ms,
sig
ns
,ab
no
rmal
fin
din
gs,
ill-
defi
ned
cau
ses
55
R00-R
99
19
21
00
13
01
02
9S
udden
infa
nt
death
syndro
me
56
R95
32
10
00
00
00
00
Unknow
nand
unspecifie
dcauses
57
R96-R
99
60
00
01
20
10
11
Exte
rnal
cau
ses
of
inju
ryan
dp
ois
on
ing
58
V01-Y
89
125
02
014
15
10
12
13
14
18
27
Accid
ents
59
V01-X
59
96
02
08
10
67
10
12
15
26
of
whic
h:
Tra
nsport
accid
ents
60
V01-V
99
11
01
04
31
01
10
0A
ccid
enta
lfa
lls61
W00-W
19
30
00
00
00
14
55
15
Accid
enta
lpois
onin
g62
X40-X
49
17
00
03
64
31
00
0oth
er
accid
ents
38
01
01
11
34
610
11
Suic
ide
and
inte
ntionalself
harm
63
X60-X
84
21
00
06
43
42
20
0H
om
icid
e/a
ssault
64
X85-Y
09
00
00
00
00
00
00
Events
of
undete
rmin
ed
inte
nt
65
Y10-Y
34
40
00
01
11
00
10
All
oth
er
exte
rnalcauses
40
00
00
00
10
21
1S
tillb
irth
snotin
clu
ded.
25 Vital Statistics - 2nd Qtr 2011
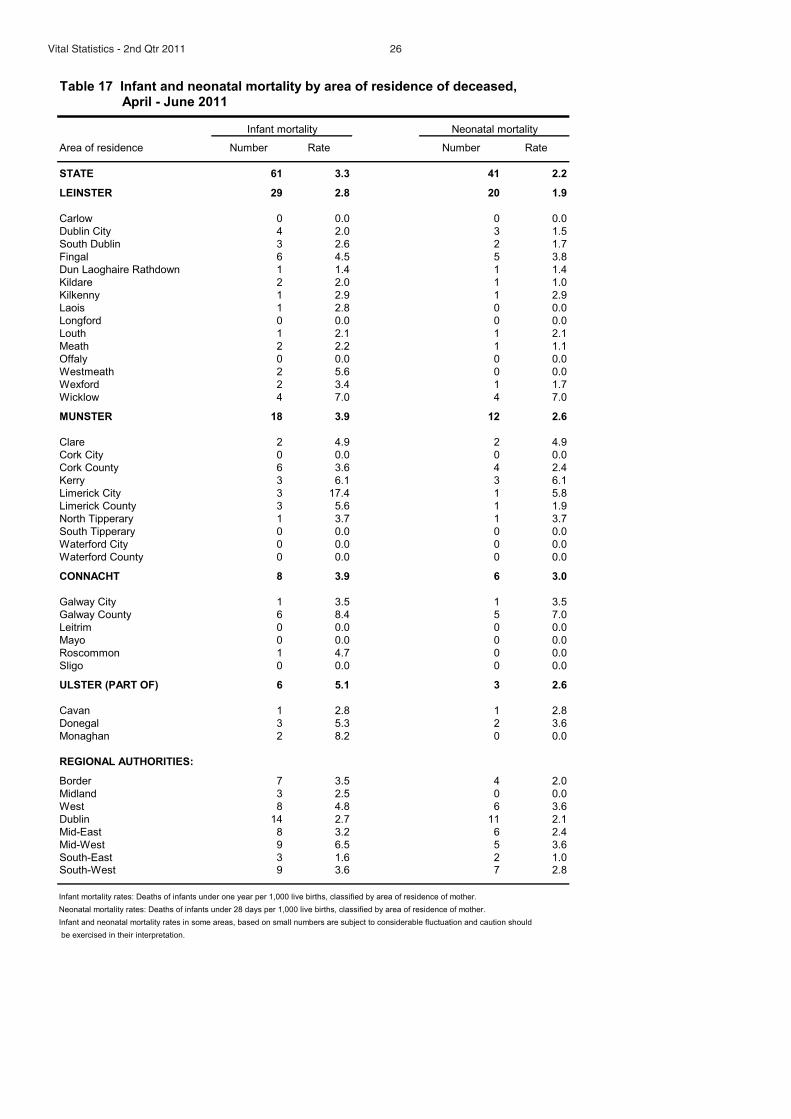
Table 17 Infant and neonatal mortality by area of residence of deceased,April - June 2011
Area of residence Number Rate Number Rate
STATE 61 3.3 41 2.2
LEINSTER 29 2.8 20 1.9
Carlow 0 0.0 0 0.0
Dublin City 4 2.0 3 1.5
South Dublin 3 2.6 2 1.7
Fingal 6 4.5 5 3.8
Dun Laoghaire Rathdown 1 1.4 1 1.4
Kildare 2 2.0 1 1.0
Kilkenny 1 2.9 1 2.9
Laois 1 2.8 0 0.0
Longford 0 0.0 0 0.0
Louth 1 2.1 1 2.1
Meath 2 2.2 1 1.1
Offaly 0 0.0 0 0.0
Westmeath 2 5.6 0 0.0
Wexford 2 3.4 1 1.7
Wicklow 4 7.0 4 7.0
MUNSTER 18 3.9 12 2.6
Clare 2 4.9 2 4.9
Cork City 0 0.0 0 0.0
Cork County 6 3.6 4 2.4
Kerry 3 6.1 3 6.1
Limerick City 3 17.4 1 5.8
Limerick County 3 5.6 1 1.9
North Tipperary 1 3.7 1 3.7
South Tipperary 0 0.0 0 0.0
Waterford City 0 0.0 0 0.0
Waterford County 0 0.0 0 0.0
CONNACHT 8 3.9 6 3.0
Galway City 1 3.5 1 3.5
Galway County 6 8.4 5 7.0
Leitrim 0 0.0 0 0.0
Mayo 0 0.0 0 0.0
Roscommon 1 4.7 0 0.0
Sligo 0 0.0 0 0.0
ULSTER (PART OF) 6 5.1 3 2.6
Cavan 1 2.8 1 2.8
Donegal 3 5.3 2 3.6
Monaghan 2 8.2 0 0.0
REGIONAL AUTHORITIES:
Border 7 3.5 4 2.0
Midland 3 2.5 0 0.0
West 8 4.8 6 3.6
Dublin 14 2.7 11 2.1
Mid-East 8 3.2 6 2.4
Mid-West 9 6.5 5 3.6
South-East 3 1.6 2 1.0South-West 9 3.6 7 2.8
Infant mortality rates: Deaths of infants under one year per 1,000 live births, classified by area of residence of mother.
Neonatal mortality rates: Deaths of infants under 28 days per 1,000 live births, classified by area of residence of mother.
Infant and neonatal mortality rates in some areas, based on small numbers are subject to considerable fluctuation and caution should
be exercised in their interpretation.
Infant mortality Neonatal mortality
Vital Statistics - 2nd Qtr 2011 26
Background Notes
Methodology All figures in this report are classified by quarter of registration. Delay in the registration of some
births, deaths and marriages result in them being included in a later period in these quarterly
reports.
Changes in methodology The extension of the Limerick City boundary, which came into operation on 1st March 2008, has
been taken into account in the compilation of the statistics from the Second Quarter of 2008. As a
result, data for Limerick City and County are not directly comparable with any quarter prior to the
Second Quarter 2008.
This publication continues with the 3 major changes in the methods by which mortality statistics
are compiled. These changes were introduced in the Vital Statistics First Quarter 2007
publication.
1) Underlying Cause of Death is classified according to International Classification of
Diseases, Version 10 (ICD10) instead of to International Classification of Diseases,
Version 9 (ICD9). In addition, this and future publications will incorporate certain
official updates to ICD-10. In particular, mental and behavioural disorders due to
psychoactive substance use (F10-F19), with mention of intestinal infectious diseases
(A00-A09), accidental, intentional self and undetermined intent poisoning by and
exposure to noxious substances (X40-X49, X60-X69, Y10-Y19) or assault by
chemical or noxious substance (X85-X90), are now coded to the latter.
http://www.who.int/classifications/icd/OfficialWHOUpdatesCombined1996-2008VOL
UME2.pdf
2) Deaths where there was not an inquest have been coded using the automated coding
system developed by the U.S National Centre for Health Statistics (NCHS). Previously
the Underlying Cause of Death was chosen manually for all deaths.
3) All deaths registered in the Quarter have been included in the statistics, in some cases with
a provisional cause of death. Previously the practice was not to include deaths in the
quarterly statistics until the cause of death had been definitely established.
Because of these changes, caution should be taken in directly comparing these mortality statistics
with those of previous quarters. Many countries have found that moving to ICD10 does affect
certain specific categories of causes of death. In particular, a significant drop in the number of
deaths attributed to pneumonia and bronchopneumonia has been observed in some countries after
moving to ICD10. These deaths were instead assigned to other conditions included on the death
certificate.
The effect of the third change above has been to increase the number of deaths in our statistics as
compared with previous years. Statistics for deaths due to external causes are particularly
affected by this change. The previous method meant that some deaths were included in a later
quarter of the year from when they had been registered, because of the delay involved in
establishing a definite cause of death.
27 Vital Statistics - 2nd Qtr 2011
Glossary of terms
NUTS III RegionalAuthority areas
Border, Midland, West, Dublin, Mid-East, Mid-West, South-East, South-West
Border: Cavan, Donegal, Leitrim, Louth, Monaghan, Sligo.
Midland: Laois, Longford, Offaly, Westmeath.
West: Galway City, Galway County, Mayo, Roscommon.
Dublin: Dublin City, South Dublin, Fingal, Dun Laoghaire-Rathdown.
Mid-East: Kildare, Meath, Wicklow.
Mid-West: Clare, Limerick City, Limerick County, North Tipperary.
South-East: Carlow, Kilkenny, South Tipperary, Waterford City, Waterford County,Wexford.
South-West: Cork City, Cork County, Kerry.
Vital Statistics - 2nd Qtr 2011 28

Appendix
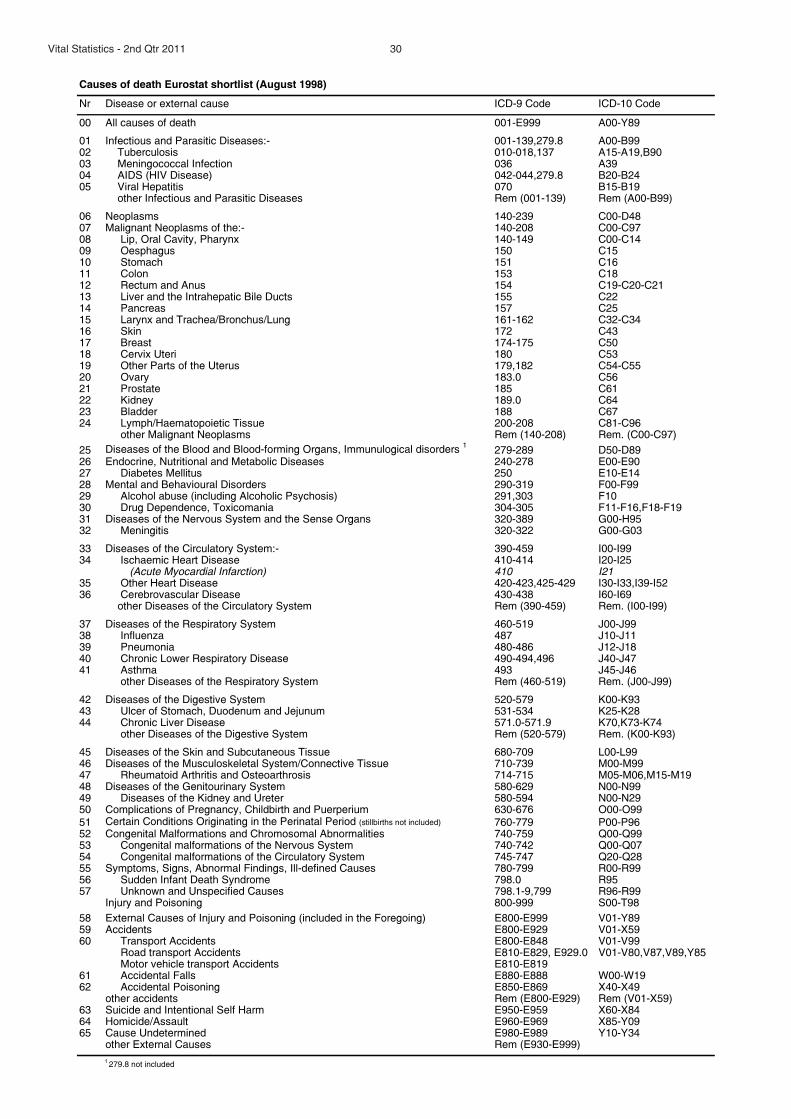
Vital Statistics - 2nd Qtr 2011 30
Causes of death Eurostat shortlist (August 1998)
Nr Disease or external cause ICD-9 Code ICD-10 Code
00 All causes of death 001-E999 A00-Y89
01 Infectious and Parasitic Diseases:- 001-139,279.8 A00-B9902 Tuberculosis 010-018,137 A15-A19,B9003 Meningococcal Infection 036 A3904 AIDS (HIV Disease) 042-044,279.8 B20-B2405 Viral Hepatitis 070 B15-B19
other Infectious and Parasitic Diseases Rem (001-139) Rem (A00-B99)
06 Neoplasms 140-239 C00-D4807 Malignant Neoplasms of the:- 140-208 C00-C9708 Lip, Oral Cavity, Pharynx 140-149 C00-C1409 Oesphagus 150 C1510 Stomach 151 C1611 Colon 153 C1812 Rectum and Anus 154 C19-C20-C2113 Liver and the Intrahepatic Bile Ducts 155 C2214 Pancreas 157 C2515 Larynx and Trachea/Bronchus/Lung 161-162 C32-C3416 Skin 172 C4317 Breast 174-175 C5018 Cervix Uteri 180 C5319 Other Parts of the Uterus 179,182 C54-C5520 Ovary 183.0 C5621 Prostate 185 C6122 Kidney 189.0 C6423 Bladder 188 C6724 Lymph/Haematopoietic Tissue 200-208 C81-C96
other Malignant Neoplasms Rem (140-208) Rem. (C00-C97)
25 Diseases of the Blood and Blood-forming Organs, Immunulogical disorders1
279-289 D50-D8926 Endocrine, Nutritional and Metabolic Diseases 240-278 E00-E9027 Diabetes Mellitus 250 E10-E1428 Mental and Behavioural Disorders 290-319 F00-F9929 Alcohol abuse (including Alcoholic Psychosis) 291,303 F1030 Drug Dependence, Toxicomania 304-305 F11-F16,F18-F1931 Diseases of the Nervous System and the Sense Organs 320-389 G00-H9532 Meningitis 320-322 G00-G03
33 Diseases of the Circulatory System:- 390-459 I00-I9934 Ischaemic Heart Disease 410-414 I20-I25
(Acute Myocardial Infarction) 410 I2135 Other Heart Disease 420-423,425-429 I30-I33,I39-I5236 Cerebrovascular Disease 430-438 I60-I69
other Diseases of the Circulatory System Rem (390-459) Rem. (I00-I99)
37 Diseases of the Respiratory System 460-519 J00-J9938 Influenza 487 J10-J1139 Pneumonia 480-486 J12-J1840 Chronic Lower Respiratory Disease 490-494,496 J40-J4741 Asthma 493 J45-J46
other Diseases of the Respiratory System Rem (460-519) Rem. (J00-J99)
42 Diseases of the Digestive System 520-579 K00-K9343 Ulcer of Stomach, Duodenum and Jejunum 531-534 K25-K2844 Chronic Liver Disease 571.0-571.9 K70,K73-K74
other Diseases of the Digestive System Rem (520-579) Rem. (K00-K93)
45 Diseases of the Skin and Subcutaneous Tissue 680-709 L00-L9946 Diseases of the Musculoskeletal System/Connective Tissue 710-739 M00-M9947 Rheumatoid Arthritis and Osteoarthrosis 714-715 M05-M06,M15-M1948 Diseases of the Genitourinary System 580-629 N00-N9949 Diseases of the Kidney and Ureter 580-594 N00-N2950 Complications of Pregnancy, Childbirth and Puerperium 630-676 O00-O9951 Certain Conditions Originating in the Perinatal Period (stillbirths not included) 760-779 P00-P9652 Congenital Malformations and Chromosomal Abnormalities 740-759 Q00-Q9953 Congenital malformations of the Nervous System 740-742 Q00-Q0754 Congenital malformations of the Circulatory System 745-747 Q20-Q2855 Symptoms, Signs, Abnormal Findings, Ill-defined Causes 780-799 R00-R9956 Sudden Infant Death Syndrome 798.0 R9557 Unknown and Unspecified Causes 798.1-9,799 R96-R99
Injury and Poisoning 800-999 S00-T98
58 External Causes of Injury and Poisoning (included in the Foregoing) E800-E999 V01-Y8959 Accidents E800-E929 V01-X5960 Transport Accidents E800-E848 V01-V99
Road transport Accidents E810-E829, E929.0 V01-V80,V87,V89,Y85Motor vehicle transport Accidents E810-E819
61 Accidental Falls E880-E888 W00-W1962 Accidental Poisoning E850-E869 X40-X49
other accidents Rem (E800-E929) Rem (V01-X59)63 Suicide and Intentional Self Harm E950-E959 X60-X8464 Homicide/Assault E960-E969 X85-Y0965 Cause Undetermined E980-E989 Y10-Y34
other External Causes Rem (E930-E999)
1279.8 not included
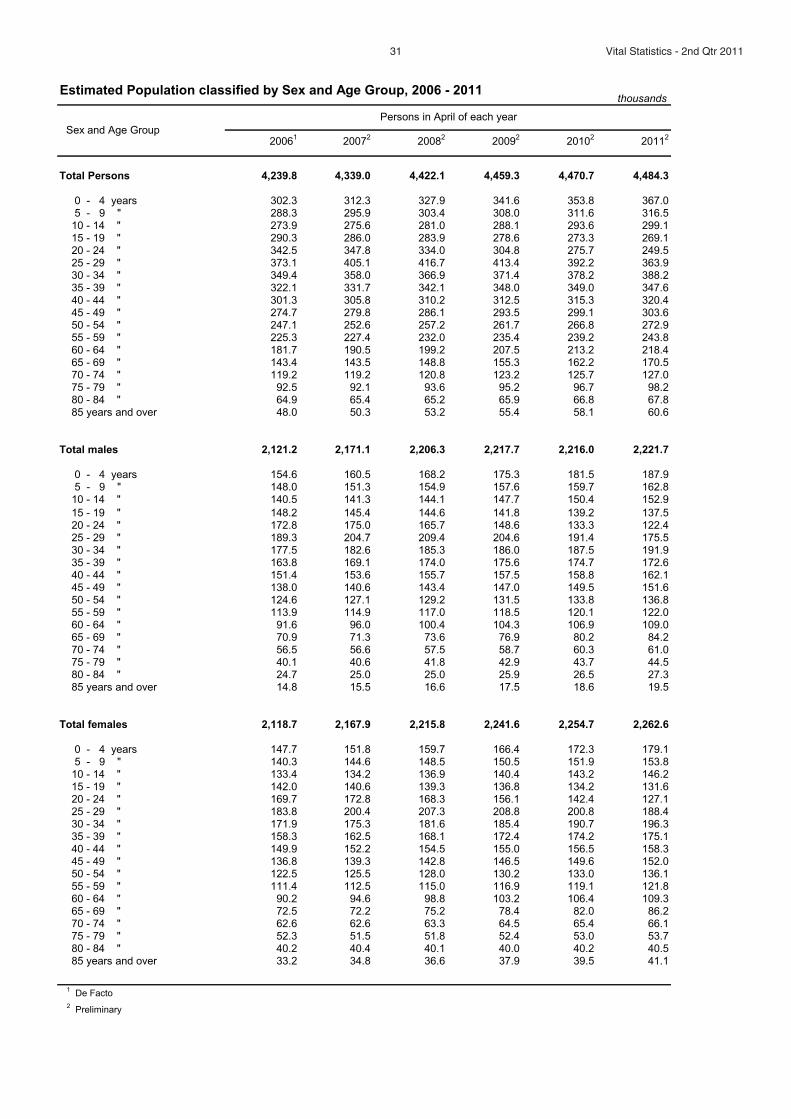
Estimated Population classified by Sex and Age Group, 2006 - 2011
20061
20072
20082
20092
20102
20112
Total Persons 4,239.8 4,339.0 4,422.1 4,459.3 4,470.7 4,484.3
0 - 4 years 302.3 312.3 327.9 341.6 353.8 367.05 - 9 " 288.3 295.9 303.4 308.0 311.6 316.5
10 - 14 " 273.9 275.6 281.0 288.1 293.6 299.115 - 19 " 290.3 286.0 283.9 278.6 273.3 269.120 - 24 " 342.5 347.8 334.0 304.8 275.7 249.525 - 29 " 373.1 405.1 416.7 413.4 392.2 363.930 - 34 " 349.4 358.0 366.9 371.4 378.2 388.235 - 39 " 322.1 331.7 342.1 348.0 349.0 347.640 - 44 " 301.3 305.8 310.2 312.5 315.3 320.445 - 49 " 274.7 279.8 286.1 293.5 299.1 303.650 - 54 " 247.1 252.6 257.2 261.7 266.8 272.955 - 59 " 225.3 227.4 232.0 235.4 239.2 243.860 - 64 " 181.7 190.5 199.2 207.5 213.2 218.465 - 69 " 143.4 143.5 148.8 155.3 162.2 170.570 - 74 " 119.2 119.2 120.8 123.2 125.7 127.075 - 79 " 92.5 92.1 93.6 95.2 96.7 98.280 - 84 " 64.9 65.4 65.2 65.9 66.8 67.885 years and over 48.0 50.3 53.2 55.4 58.1 60.6
Total males 2,121.2 2,171.1 2,206.3 2,217.7 2,216.0 2,221.7
0 - 4 years 154.6 160.5 168.2 175.3 181.5 187.95 - 9 " 148.0 151.3 154.9 157.6 159.7 162.8
10 - 14 " 140.5 141.3 144.1 147.7 150.4 152.9
15 - 19 " 148.2 145.4 144.6 141.8 139.2 137.520 - 24 " 172.8 175.0 165.7 148.6 133.3 122.425 - 29 " 189.3 204.7 209.4 204.6 191.4 175.530 - 34 " 177.5 182.6 185.3 186.0 187.5 191.935 - 39 " 163.8 169.1 174.0 175.6 174.7 172.640 - 44 " 151.4 153.6 155.7 157.5 158.8 162.145 - 49 " 138.0 140.6 143.4 147.0 149.5 151.650 - 54 " 124.6 127.1 129.2 131.5 133.8 136.855 - 59 " 113.9 114.9 117.0 118.5 120.1 122.060 - 64 " 91.6 96.0 100.4 104.3 106.9 109.065 - 69 " 70.9 71.3 73.6 76.9 80.2 84.270 - 74 " 56.5 56.6 57.5 58.7 60.3 61.075 - 79 " 40.1 40.6 41.8 42.9 43.7 44.580 - 84 " 24.7 25.0 25.0 25.9 26.5 27.385 years and over 14.8 15.5 16.6 17.5 18.6 19.5
Total females 2,118.7 2,167.9 2,215.8 2,241.6 2,254.7 2,262.6
0 - 4 years 147.7 151.8 159.7 166.4 172.3 179.15 - 9 " 140.3 144.6 148.5 150.5 151.9 153.8
10 - 14 " 133.4 134.2 136.9 140.4 143.2 146.215 - 19 " 142.0 140.6 139.3 136.8 134.2 131.620 - 24 " 169.7 172.8 168.3 156.1 142.4 127.125 - 29 " 183.8 200.4 207.3 208.8 200.8 188.430 - 34 " 171.9 175.3 181.6 185.4 190.7 196.335 - 39 " 158.3 162.5 168.1 172.4 174.2 175.140 - 44 " 149.9 152.2 154.5 155.0 156.5 158.345 - 49 " 136.8 139.3 142.8 146.5 149.6 152.050 - 54 " 122.5 125.5 128.0 130.2 133.0 136.155 - 59 " 111.4 112.5 115.0 116.9 119.1 121.860 - 64 " 90.2 94.6 98.8 103.2 106.4 109.365 - 69 " 72.5 72.2 75.2 78.4 82.0 86.270 - 74 " 62.6 62.6 63.3 64.5 65.4 66.175 - 79 " 52.3 51.5 51.8 52.4 53.0 53.780 - 84 " 40.2 40.4 40.1 40.0 40.2 40.585 years and over 33.2 34.8 36.6 37.9 39.5 41.1
1De Facto
2Preliminary
Sex and Age Group
thousands
Persons in April of each year
31 Vital Statistics - 2nd Qtr 2011


![IRELAND1].pdfIRELAND National Development Plan 2000-2006 BAILE A´THA CLIATH ARNA FHOILSIU´ AG OIFIG AN tSOLA´THAIR Le ceannach dı´reach o´n OIFIG DHI´OLTA FOILSEACHA´N RIALTAIS,](https://img.pdfslide.net/doc/110x75/5f3bd50005fd8913de797757/1pdf-ireland-national-development-plan-2000-2006-baile-atha-cliath-arna-fhoilsiu.jpg)