Embed Size (px)
Citation preview
1S(smpiattitbbjupfidpcmot
aapaf
550 J. Opt. Soc. Am. B/Vol. 27, No. 3 /March 2010 Alexander M. Heidt
Pulse preserving flat-top supercontinuumgeneration in all-normal dispersion
photonic crystal fibers
Alexander M. Heidt1,2,*1Laser Research Institute, Physics Department, University of Stellenbosch,
Private Bag X1,Matieland 7602, South Africa
2Institute of Photonic Technology, Albert-Einstein-Str. 9, 07745 Jena, Germany*Corresponding author: [email protected]
Received December 15, 2009; accepted December 26, 2009;posted January 12, 2010 (Doc. ID 121318); published February 25, 2010
Supercontinuum (SC) generation in all-normal dispersion photonic crystal fiber under high energy femtosec-ond pumping is numerically investigated. It is shown that coherent octave spanning SC spectra with flatnessof better than �1 dB can be achieved over the entire bandwidth. A single pulse is maintained in the time do-main, which may be externally compressed to the sub-10 fs regime even by simple linear chirp elimination. Thesingle optical cycle limit is approached for full phase compensation, leading to peak power spectral densities ofmultiple kilowatts/nanometer. The generated SC is therefore ideal for applications which require high broad-band spectral power densities as well as a defined pulse profile in the time domain. The properties of the gen-erated SC are shown to be independent of the input pulse duration. © 2010 Optical Society of America
OCIS codes: 320.6629, 060.4005.
apsbptfssmbq
sflSsviastfpDbrflwb
. INTRODUCTIONupercontinuum (SC) generation in photonic crystal fiber
PCF) has become an established tool in a diversity of re-earch fields including metrology, telecommunication, bio-edical research, and spectroscopy [1]. The underlying
hysics of the SC generation under femtosecond pumpings now well understood. An important factor for the char-cteristics of the resulting SC is the relationship betweenhe input pump wavelength and the dispersion profile ofhe PCF. The broadest spectra are generated when pump-ng occurs near the zero dispersion wavelength (ZDW) inhe anomalous dispersion regime of the fiber [2]. Theroadening mechanism is in this case strongly influencedy soliton dynamics, in particular the breakup of the in-ected pulse due to soliton fission [3]. Consequently, theseltrabroad SCs are characterized by a complex temporalrofile as well as considerable intensity variations andne structure over their bandwidth [4]. Additionally, it isifficult to generate highly coherent SC spectra withump pulses of more than 100 fs duration if pumping oc-urs in the anomalous dispersion regime [2,5], becauseodulation instability then plays a key role in the onset
f the SC generation process and significantly amplifieshe input pulse noise [6].
Many applications however require the conservation ofsingle ultrashort pulse in the time domain while a flat
nd coherent SC spectrum with a uniformly high spectralower density is generated. This is critical especially forpplications in which the generated SC spectrum is usedor time-resolved measurements; parts of the SC pulse
0740-3224/10/030550-10/$15.00 © 2
re amplified in parametric processes or for few-cycleulse generation. One approach to achieve spectra withuch properties has been the suppression of soliton fissiony using a PCF with a convex and flattened dispersionrofile exhibiting two closely spaced ZDWs centered nearhe pump. The resulting stable and coherent SC spectrumeatures two distinct spectral peaks on the normal disper-ion side of each ZDW [7–9]. This type of SC has founduccessful application, e.g., in coherent anti-Stokes Ra-an spectroscopy [10], but the missing spectral content in
etween the two ZDWs is not ideal for applications re-uiring continuous broadband spectra.In a further development of this concept, improved
pectral flatness has been achieved by using dispersion-attened dispersion-decreasing fibers (DF-DDFs) [11,12].tarting with a profile with two ZDWs, the convex disper-ion longitudinally decreases from anomalous to normalalues in the vicinity of the pump. This leads to a decreas-ng separation of ZDWs until the dispersion is normal atll wavelengths. In this way one takes advantage of thetrong spectral broadening associated with pumping inhe anomalous dispersion regime, while the spectrum isurther stabilized and smoothened in the all-normal dis-ersion (ANDi) section of the DF-DDF. Applications ofF-DDFs have been found in telecommunications [11],ut the concept has also been extended to the wavelengthegime around 800 nm by tapering of a dispersion-attened PCF with two ZDWs [13]. In both cases, pulsesith a relatively low peak power of around 1 kW haveeen used to ensure high coherence properties of the gen-
010 Optical Society of America
ese
voeb1pids(ptsp1ttttattwSd
tdiTefiSi(sbp
2IoprflAfseirsiiS
wtepnastmAbtsa=fifotRdtsbuGatts
w
wtscrnto
Ad2tsd
Alexander M. Heidt Vol. 27, No. 3 /March 2010/J. Opt. Soc. Am. B 551
rated spectrum so that the initial anomalous dispersionection was required to achieve sufficient spectral broad-ning.
Tremendous progress has been made recently in the de-elopment of ultrashort pulse fiber lasers, and femtosec-nd pulse energies well above 10 nJ and peak powers inxcess of 200 kW are now readily available from ytter-ium doped fiber oscillators emitting in the vicinity of080 nm [14–17]. With such high peak power pumpulses available, the initial anomalous dispersion sectionn the DF-DDF is no longer necessary and can in fact beetrimental for the coherence properties of the generatedpectrum. Instead, fibers with ANDi-flattened profileswhich remain constant during propagation) seem to beromising candidates to achieve single-pulse ultraflat oc-ave spanning SC generation. This has been demon-trated in first experiments using only moderate peakowers, e.g., with a highly nonlinear fiber pumped at890 nm as well as with an ANDi PCF at telecommunica-ion wavelengths [18,19]. The transfer of this concept tohe wavelength region around 1080 nm and the integra-ion with the recently developed high power fiber oscilla-ors could therefore enable the development of novelll-fiber SC sources for applications such as broadbandime-resolved pump-probe spectroscopy, nonlinear spec-roscopy, or nonlinear optical parametric amplification,hich requires high spectral power densities over a broadC bandwidth as well as a single short pulse in the timeomain.This work focuses therefore on the numerical investiga-
ion of the SC generation in the ANDi PCF withispersion-flattened profiles near 1080 nm and consider-ng femtosecond pulses with peak powers of up to 270 kW.he influence of the fiber design and input pulse param-ters on the generated spectrum and resulting pulse pro-le is examined in detail with the aim of optimizing theC generation process in such a way that (i) a single pulse
s maintained during the propagation through the fiber;ii) this pulse is recompressible, ideally by simple meansuch as a grating or a prism pair; and (iii) a sufficientlyroad, stable, and flat-top spectrum with a high spectralower density over the entire bandwidth is achieved.
. NUMERICAL MODELn this study, PCFs with solid core and hexagonal latticef air holes are considered, with the geometrical designarameter pitch � and a relative hole size d /� in theanges �=1.45–1.70 �m and d /�=0.3–0.43, leading toattened dispersion profiles in the vicinity of 1080 nm.dditionally, all fibers in this study fulfill the condition
or endlessly single-mode propagation [20]. The disper-ion and effective area of the investigated PCF were gen-rated with the analytical method devised in [21], afterts validity over the investigated geometrical parameterange was confirmed by a numerical multipole modeolver [22]. Pulse propagation in the PCF is simulated us-ng the Runge–Kutta in the interaction picture (RK4IP)ntegration method to solve the generalized nonlinearchrödinger equation (GNLSE) [23]
�A
�z= −
�
2A + �
k�2
ik+1
k!�k
�kA
�Tk + i��1 + i�shock
�
�T��A�z,t�
��−
+
R�T���A�z,T − T���2dT� + i�R�z,T�� , �1�
here A�z ,T� is the complex field envelope at a propaga-ion distance z in a retarded reference time frame T trav-ling at the envelope group velocity. Since only shortieces of the PCF will be considered, loss in the fiber iseglected ��=0�. The dispersion coefficients �k are associ-ted with the Taylor expansion of the propagation con-tant ���� around the center frequency �0. In this work,he dispersion operator is calculated in the frequency do-ain by multiplying the complex spectral envelope
˜ �z ,�� with the operator ����−�1�−�0, which is obtainedy the PCF dispersion simulation. The time derivative inhe nonlinear operator includes the effects of self-teepening and optical shock formation, which are char-cterized on a time scale of �shock=1/�0. ����n2�0 /cAeff��� is the frequency dependent nonlinear coef-cient, with n2310−20 m2/W being the nonlinear re-
ractive index of the silica glass, c being the vacuum speedf light, and Aeff��� being the frequency dependent effec-ive mode field area of the fiber. The response function�t�= �1− fR� �t�+ fRhR�t� contains both instantaneous andelayed Raman contributions, with fR=0.18 representinghe fractional contribution of the delayed Raman re-ponse. For the Raman response function of the silica fi-er, hR�t�, the analytical expression introduced in [24] issed in this paper. The entire nonlinear part of theNLSE is evaluated in the frequency domain, because in-ccuracies due to numerical derivatives are avoided andhe frequency dependence of Aeff���, which is obtained byhe simulation of the PCF properties, can be included in atraightforward manner.
�R models the effect of spontaneous Raman scatteringith the frequency domain correlations given by [2]
��R��,z��R� ���,z��� =
2fR��0
��Im hR����� nth�����
+ U�− ��� �z − z�� �� − ���, �2�
ith �=�−�0, nth���= exp��� /kBT�−1�−1 being thehermal Bose distribution, and U��� being the Heavisidetep function. The input pulse shot noise is modeled semi-lassically by the addition of one photon per mode withandom phase on each spectral discretization bin. Theoise sensitivity of the generated spectra is then charac-erized by calculating the modulus of the complex degreef first-order coherence at each wavelength,
�g12�1���,t1 − t2�� = � �E1
���,t1�E2��,t2��
���E1��,t1��2���E2��,t2��2�� . �3�
ngular brackets indicate an ensemble average over in-ependently generated pairs of SC spectra obtained from0 simulations and t is the time measured at the scale ofhe temporal resolution of the spectrometer used to re-olve these spectra. In order to focus on the wavelengthependence of the coherence, �g�1�� at t − t =0 is used in
12 1 2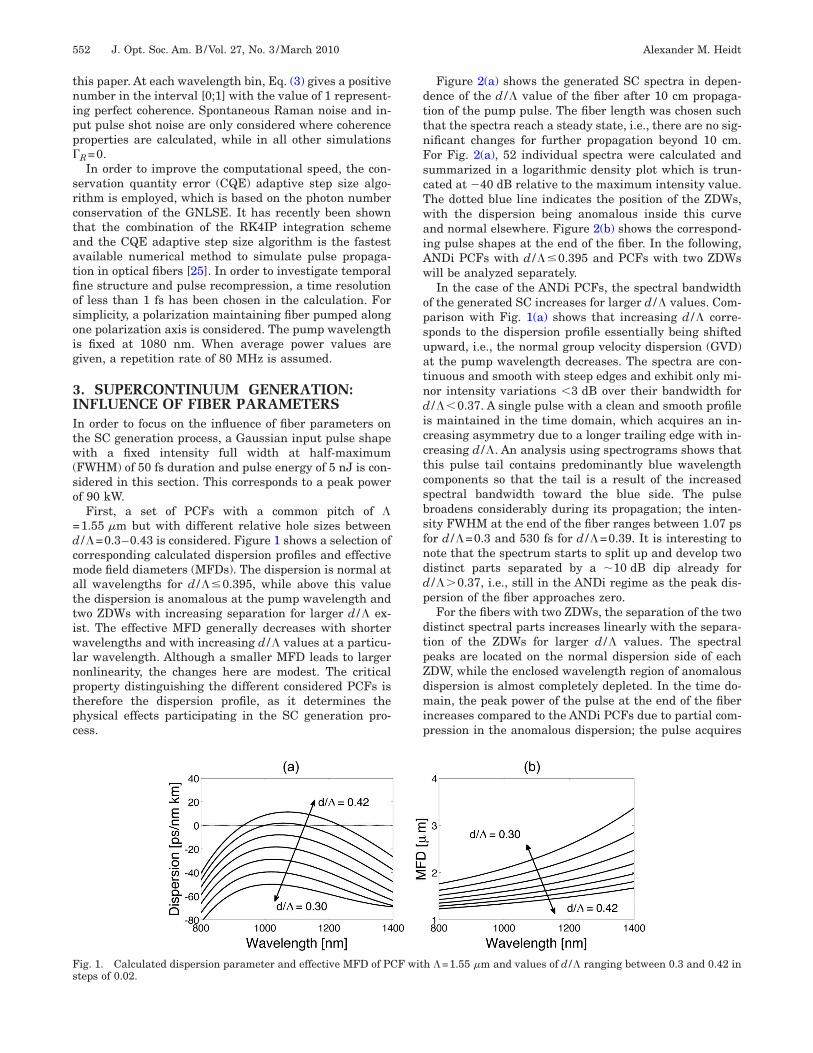
tnipp�
srctaatfiosoig
3IItw(so
=dcmattiwlnptpc
dttnFscTwaiAw
opsuatndicctcsbsfnddp
dtpZdmi
Fs
552 J. Opt. Soc. Am. B/Vol. 27, No. 3 /March 2010 Alexander M. Heidt
his paper. At each wavelength bin, Eq. (3) gives a positiveumber in the interval [0;1] with the value of 1 represent-
ng perfect coherence. Spontaneous Raman noise and in-ut pulse shot noise are only considered where coherenceroperties are calculated, while in all other simulationsR=0.In order to improve the computational speed, the con-
ervation quantity error (CQE) adaptive step size algo-ithm is employed, which is based on the photon numberonservation of the GNLSE. It has recently been shownhat the combination of the RK4IP integration schemend the CQE adaptive step size algorithm is the fastestvailable numerical method to simulate pulse propaga-ion in optical fibers [25]. In order to investigate temporalne structure and pulse recompression, a time resolutionf less than 1 fs has been chosen in the calculation. Forimplicity, a polarization maintaining fiber pumped alongne polarization axis is considered. The pump wavelengths fixed at 1080 nm. When average power values areiven, a repetition rate of 80 MHz is assumed.
. SUPERCONTINUUM GENERATION:NFLUENCE OF FIBER PARAMETERSn order to focus on the influence of fiber parameters onhe SC generation process, a Gaussian input pulse shapeith a fixed intensity full width at half-maximum
FWHM) of 50 fs duration and pulse energy of 5 nJ is con-idered in this section. This corresponds to a peak powerf 90 kW.
First, a set of PCFs with a common pitch of �1.55 �m but with different relative hole sizes between/�=0.3–0.43 is considered. Figure 1 shows a selection oforresponding calculated dispersion profiles and effectiveode field diameters (MFDs). The dispersion is normal at
ll wavelengths for d /��0.395, while above this valuehe dispersion is anomalous at the pump wavelength andwo ZDWs with increasing separation for larger d /� ex-st. The effective MFD generally decreases with shorteravelengths and with increasing d /� values at a particu-
ar wavelength. Although a smaller MFD leads to largeronlinearity, the changes here are modest. The criticalroperty distinguishing the different considered PCFs isherefore the dispersion profile, as it determines thehysical effects participating in the SC generation pro-
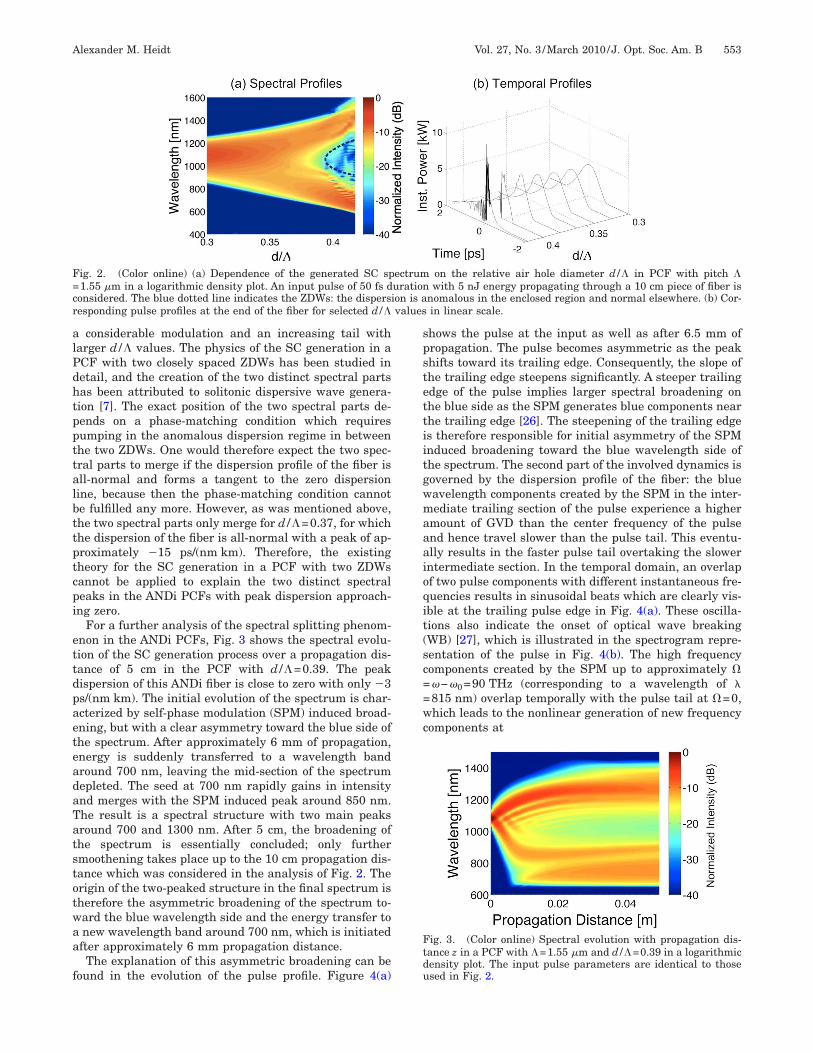
ess. pFigure 2(a) shows the generated SC spectra in depen-ence of the d /� value of the fiber after 10 cm propaga-ion of the pump pulse. The fiber length was chosen suchhat the spectra reach a steady state, i.e., there are no sig-ificant changes for further propagation beyond 10 cm.or Fig. 2(a), 52 individual spectra were calculated andummarized in a logarithmic density plot which is trun-ated at �40 dB relative to the maximum intensity value.he dotted blue line indicates the position of the ZDWs,ith the dispersion being anomalous inside this curvend normal elsewhere. Figure 2(b) shows the correspond-ng pulse shapes at the end of the fiber. In the following,NDi PCFs with d /��0.395 and PCFs with two ZDWsill be analyzed separately.In the case of the ANDi PCFs, the spectral bandwidth
f the generated SC increases for larger d /� values. Com-arison with Fig. 1(a) shows that increasing d /� corre-ponds to the dispersion profile essentially being shiftedpward, i.e., the normal group velocity dispersion (GVD)t the pump wavelength decreases. The spectra are con-inuous and smooth with steep edges and exhibit only mi-or intensity variations �3 dB over their bandwidth for/��0.37. A single pulse with a clean and smooth profile
s maintained in the time domain, which acquires an in-reasing asymmetry due to a longer trailing edge with in-reasing d /�. An analysis using spectrograms shows thathis pulse tail contains predominantly blue wavelengthomponents so that the tail is a result of the increasedpectral bandwidth toward the blue side. The pulseroadens considerably during its propagation; the inten-ity FWHM at the end of the fiber ranges between 1.07 psor d /�=0.3 and 530 fs for d /�=0.39. It is interesting toote that the spectrum starts to split up and develop twoistinct parts separated by a �10 dB dip already for/��0.37, i.e., still in the ANDi regime as the peak dis-ersion of the fiber approaches zero.For the fibers with two ZDWs, the separation of the two
istinct spectral parts increases linearly with the separa-ion of the ZDWs for larger d /� values. The spectraleaks are located on the normal dispersion side of eachDW, while the enclosed wavelength region of anomalousispersion is almost completely depleted. In the time do-ain, the peak power of the pulse at the end of the fiber
ncreases compared to the ANDi PCFs due to partial com-
ression in the anomalous dispersion; the pulse acquiresig. 1. Calculated dispersion parameter and effective MFD of PCF with �=1.55 �m and values of d /� ranging between 0.3 and 0.42 inteps of 0.02.
alPdhtppttalbttptcpi
ettdpaeteadaTatstotwaa
f
spstettiitgwmaaaioqit(sc==wc
Ftdu
F=cr
Alexander M. Heidt Vol. 27, No. 3 /March 2010/J. Opt. Soc. Am. B 553
considerable modulation and an increasing tail witharger d /� values. The physics of the SC generation in aCF with two closely spaced ZDWs has been studied inetail, and the creation of the two distinct spectral partsas been attributed to solitonic dispersive wave genera-ion [7]. The exact position of the two spectral parts de-ends on a phase-matching condition which requiresumping in the anomalous dispersion regime in betweenhe two ZDWs. One would therefore expect the two spec-ral parts to merge if the dispersion profile of the fiber isll-normal and forms a tangent to the zero dispersionine, because then the phase-matching condition cannote fulfilled any more. However, as was mentioned above,he two spectral parts only merge for d /�=0.37, for whichhe dispersion of the fiber is all-normal with a peak of ap-roximately �15 ps/(nm km). Therefore, the existingheory for the SC generation in a PCF with two ZDWsannot be applied to explain the two distinct spectraleaks in the ANDi PCFs with peak dispersion approach-ng zero.
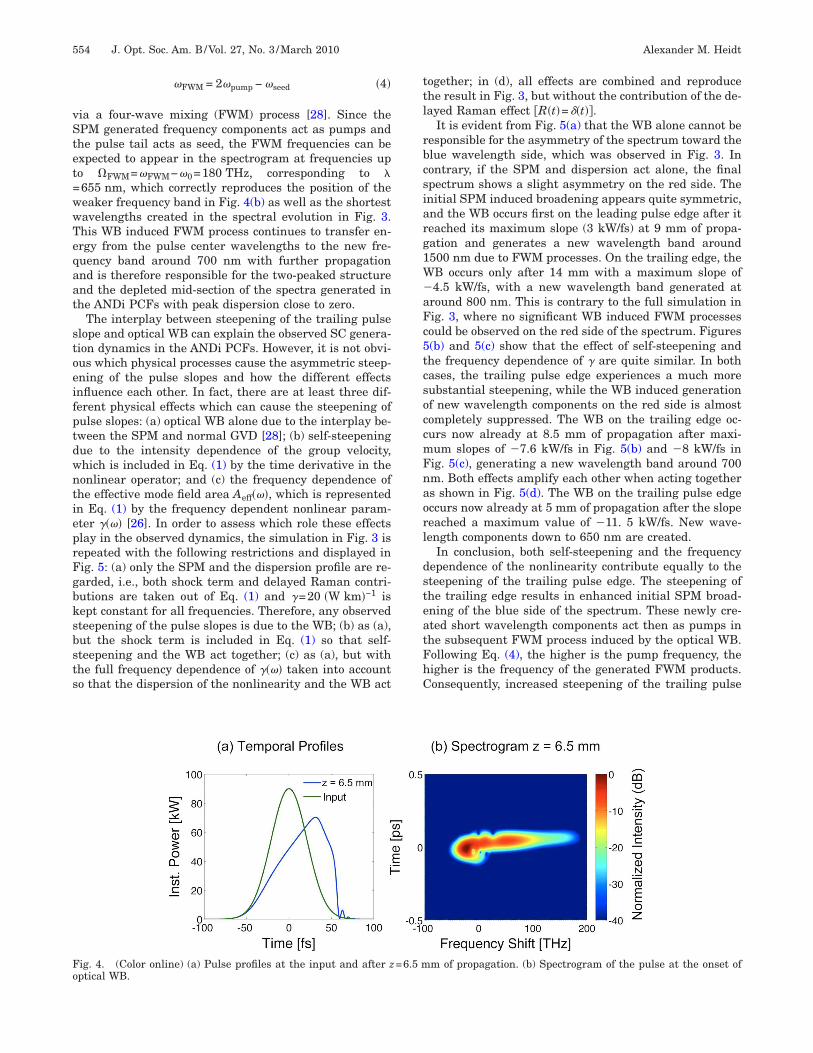
For a further analysis of the spectral splitting phenom-non in the ANDi PCFs, Fig. 3 shows the spectral evolu-ion of the SC generation process over a propagation dis-ance of 5 cm in the PCF with d /�=0.39. The peakispersion of this ANDi fiber is close to zero with only �3s/(nm km). The initial evolution of the spectrum is char-cterized by self-phase modulation (SPM) induced broad-ning, but with a clear asymmetry toward the blue side ofhe spectrum. After approximately 6 mm of propagation,nergy is suddenly transferred to a wavelength bandround 700 nm, leaving the mid-section of the spectrumepleted. The seed at 700 nm rapidly gains in intensitynd merges with the SPM induced peak around 850 nm.he result is a spectral structure with two main peaksround 700 and 1300 nm. After 5 cm, the broadening ofhe spectrum is essentially concluded; only furthermoothening takes place up to the 10 cm propagation dis-ance which was considered in the analysis of Fig. 2. Therigin of the two-peaked structure in the final spectrum isherefore the asymmetric broadening of the spectrum to-ard the blue wavelength side and the energy transfer tonew wavelength band around 700 nm, which is initiatedfter approximately 6 mm propagation distance.The explanation of this asymmetric broadening can be
ound in the evolution of the pulse profile. Figure 4(a)
ig. 2. (Color online) (a) Dependence of the generated SC sp1.55 �m in a logarithmic density plot. An input pulse of 50 fs donsidered. The blue dotted line indicates the ZDWs: the dispersesponding pulse profiles at the end of the fiber for selected d /�
hows the pulse at the input as well as after 6.5 mm ofropagation. The pulse becomes asymmetric as the peakhifts toward its trailing edge. Consequently, the slope ofhe trailing edge steepens significantly. A steeper trailingdge of the pulse implies larger spectral broadening onhe blue side as the SPM generates blue components nearhe trailing edge [26]. The steepening of the trailing edges therefore responsible for initial asymmetry of the SPMnduced broadening toward the blue wavelength side ofhe spectrum. The second part of the involved dynamics isoverned by the dispersion profile of the fiber: the blueavelength components created by the SPM in the inter-ediate trailing section of the pulse experience a higher
mount of GVD than the center frequency of the pulsend hence travel slower than the pulse tail. This eventu-lly results in the faster pulse tail overtaking the slowerntermediate section. In the temporal domain, an overlapf two pulse components with different instantaneous fre-uencies results in sinusoidal beats which are clearly vis-ble at the trailing pulse edge in Fig. 4(a). These oscilla-ions also indicate the onset of optical wave breakingWB) [27], which is illustrated in the spectrogram repre-entation of the pulse in Fig. 4(b). The high frequencyomponents created by the SPM up to approximately ��−�0=90 THz (corresponding to a wavelength of �815 nm) overlap temporally with the pulse tail at �=0,hich leads to the nonlinear generation of new frequency
omponents at
ig. 3. (Color online) Spectral evolution with propagation dis-ance z in a PCF with �=1.55 �m and d /�=0.39 in a logarithmicensity plot. The input pulse parameters are identical to thosesed in Fig. 2.
on the relative air hole diameter d /� in PCF with pitch �with 5 nJ energy propagating through a 10 cm piece of fiber is
nomalous in the enclosed region and normal elsewhere. (b) Cor-in linear scale.
ectrumurationion is avalues
vStet=wwTeqaat
stoeifptdwntieprFgbksbsts
ttl
rbcsiarg1W�aFc5tcsoccmFnaorl
dsteatFh
Fo
554 J. Opt. Soc. Am. B/Vol. 27, No. 3 /March 2010 Alexander M. Heidt
�FWM = 2�pump − �seed �4�
ia a four-wave mixing (FWM) process [28]. Since thePM generated frequency components act as pumps andhe pulse tail acts as seed, the FWM frequencies can bexpected to appear in the spectrogram at frequencies upo �FWM=�FWM−�0=180 THz, corresponding to �655 nm, which correctly reproduces the position of theeaker frequency band in Fig. 4(b) as well as the shortestavelengths created in the spectral evolution in Fig. 3.his WB induced FWM process continues to transfer en-rgy from the pulse center wavelengths to the new fre-uency band around 700 nm with further propagationnd is therefore responsible for the two-peaked structurend the depleted mid-section of the spectra generated inhe ANDi PCFs with peak dispersion close to zero.
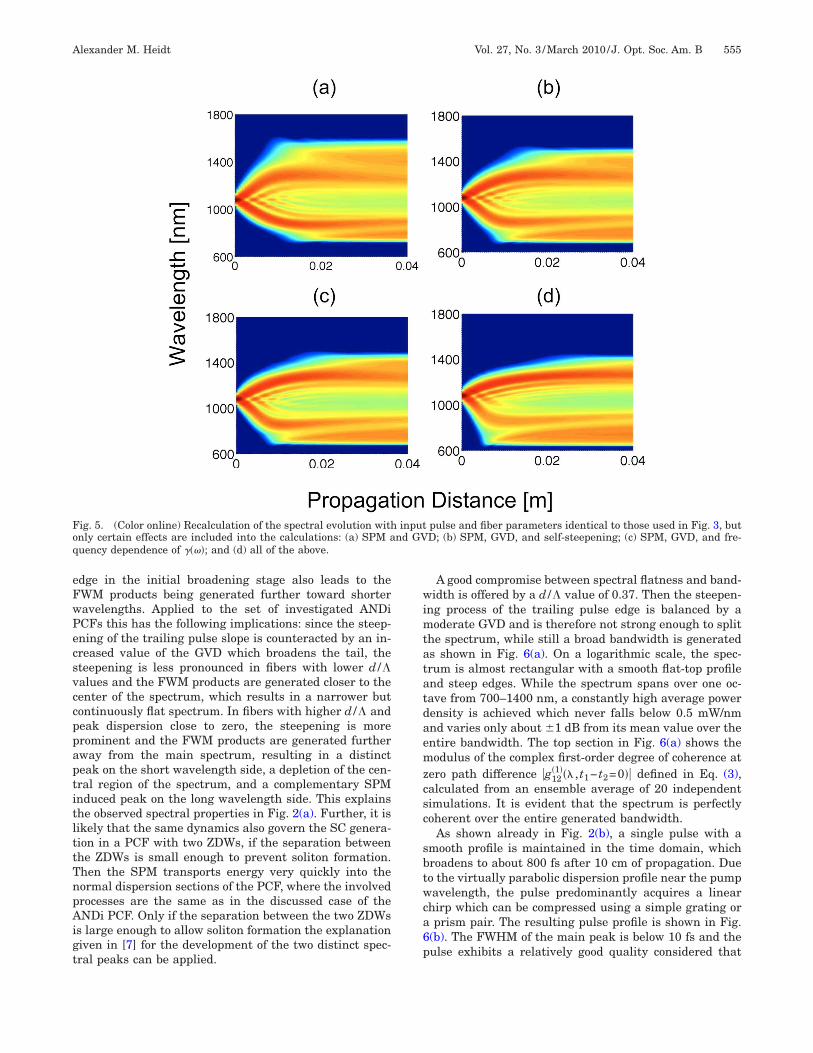
The interplay between steepening of the trailing pulselope and optical WB can explain the observed SC genera-ion dynamics in the ANDi PCFs. However, it is not obvi-us which physical processes cause the asymmetric steep-ning of the pulse slopes and how the different effectsnfluence each other. In fact, there are at least three dif-erent physical effects which can cause the steepening ofulse slopes: (a) optical WB alone due to the interplay be-ween the SPM and normal GVD [28]; (b) self-steepeningue to the intensity dependence of the group velocity,hich is included in Eq. (1) by the time derivative in theonlinear operator; and (c) the frequency dependence ofhe effective mode field area Aeff���, which is representedn Eq. (1) by the frequency dependent nonlinear param-ter ���� [26]. In order to assess which role these effectslay in the observed dynamics, the simulation in Fig. 3 isepeated with the following restrictions and displayed inig. 5: (a) only the SPM and the dispersion profile are re-arded, i.e., both shock term and delayed Raman contri-utions are taken out of Eq. (1) and �=20 �W km�−1 isept constant for all frequencies. Therefore, any observedteepening of the pulse slopes is due to the WB; (b) as (a),ut the shock term is included in Eq. (1) so that self-teepening and the WB act together; (c) as (a), but withhe full frequency dependence of ���� taken into account
o that the dispersion of the nonlinearity and the WB act Cogether; in (d), all effects are combined and reproducehe result in Fig. 3, but without the contribution of the de-ayed Raman effect R�t�= �t��.
It is evident from Fig. 5(a) that the WB alone cannot beesponsible for the asymmetry of the spectrum toward thelue wavelength side, which was observed in Fig. 3. Inontrary, if the SPM and dispersion act alone, the finalpectrum shows a slight asymmetry on the red side. Thenitial SPM induced broadening appears quite symmetric,nd the WB occurs first on the leading pulse edge after iteached its maximum slope (3 kW/fs) at 9 mm of propa-ation and generates a new wavelength band around500 nm due to FWM processes. On the trailing edge, theB occurs only after 14 mm with a maximum slope of4.5 kW/fs, with a new wavelength band generated atround 800 nm. This is contrary to the full simulation inig. 3, where no significant WB induced FWM processesould be observed on the red side of the spectrum. Figures(b) and 5(c) show that the effect of self-steepening andhe frequency dependence of � are quite similar. In bothases, the trailing pulse edge experiences a much moreubstantial steepening, while the WB induced generationf new wavelength components on the red side is almostompletely suppressed. The WB on the trailing edge oc-urs now already at 8.5 mm of propagation after maxi-um slopes of �7.6 kW/fs in Fig. 5(b) and �8 kW/fs inig. 5(c), generating a new wavelength band around 700m. Both effects amplify each other when acting togethers shown in Fig. 5(d). The WB on the trailing pulse edgeccurs now already at 5 mm of propagation after the slopeeached a maximum value of �11. 5 kW/fs. New wave-ength components down to 650 nm are created.
In conclusion, both self-steepening and the frequencyependence of the nonlinearity contribute equally to theteepening of the trailing pulse edge. The steepening ofhe trailing edge results in enhanced initial SPM broad-ning of the blue side of the spectrum. These newly cre-ted short wavelength components act then as pumps inhe subsequent FWM process induced by the optical WB.ollowing Eq. (4), the higher is the pump frequency, theigher is the frequency of the generated FWM products.
onsequently, increased steepening of the trailing pulseig. 4. (Color online) (a) Pulse profiles at the input and after z=6.5 mm of propagation. (b) Spectrogram of the pulse at the onset ofptical WB.
eFwPecsvccppaptitlttTnpAigt
wimtatatdaemzcsc
sbtwca6p
Foq
Alexander M. Heidt Vol. 27, No. 3 /March 2010/J. Opt. Soc. Am. B 555
dge in the initial broadening stage also leads to theWM products being generated further toward shorteravelengths. Applied to the set of investigated ANDiCFs this has the following implications: since the steep-ning of the trailing pulse slope is counteracted by an in-reased value of the GVD which broadens the tail, theteepening is less pronounced in fibers with lower d /�alues and the FWM products are generated closer to theenter of the spectrum, which results in a narrower butontinuously flat spectrum. In fibers with higher d /� andeak dispersion close to zero, the steepening is morerominent and the FWM products are generated furtherway from the main spectrum, resulting in a distincteak on the short wavelength side, a depletion of the cen-ral region of the spectrum, and a complementary SPMnduced peak on the long wavelength side. This explainshe observed spectral properties in Fig. 2(a). Further, it isikely that the same dynamics also govern the SC genera-ion in a PCF with two ZDWs, if the separation betweenhe ZDWs is small enough to prevent soliton formation.hen the SPM transports energy very quickly into theormal dispersion sections of the PCF, where the involvedrocesses are the same as in the discussed case of theNDi PCF. Only if the separation between the two ZDWs
s large enough to allow soliton formation the explanationiven in [7] for the development of the two distinct spec-ral peaks can be applied.
ig. 5. (Color online) Recalculation of the spectral evolution withnly certain effects are included into the calculations: (a) SPM auency dependence of ����; and (d) all of the above.
A good compromise between spectral flatness and band-idth is offered by a d /� value of 0.37. Then the steepen-
ng process of the trailing pulse edge is balanced by aoderate GVD and is therefore not strong enough to split
he spectrum, while still a broad bandwidth is generateds shown in Fig. 6(a). On a logarithmic scale, the spec-rum is almost rectangular with a smooth flat-top profilend steep edges. While the spectrum spans over one oc-ave from 700–1400 nm, a constantly high average powerensity is achieved which never falls below 0.5 mW/nmnd varies only about �1 dB from its mean value over thentire bandwidth. The top section in Fig. 6(a) shows theodulus of the complex first-order degree of coherence at
ero path difference �g12�1��� , t1− t2=0�� defined in Eq. (3),
alculated from an ensemble average of 20 independentimulations. It is evident that the spectrum is perfectlyoherent over the entire generated bandwidth.
As shown already in Fig. 2(b), a single pulse with amooth profile is maintained in the time domain, whichroadens to about 800 fs after 10 cm of propagation. Dueo the virtually parabolic dispersion profile near the pumpavelength, the pulse predominantly acquires a linear
hirp which can be compressed using a simple grating orprism pair. The resulting pulse profile is shown in Fig.
(b). The FWHM of the main peak is below 10 fs and theulse exhibits a relatively good quality considered that
pulse and fiber parameters identical to those used in Fig. 3, butD; (b) SPM, GVD, and self-steepening; (c) SPM, GVD, and fre-
inputnd GV
ospaomlocpetoet
ciiisr
ops1=sfd
F= ensati
F1e
556 J. Opt. Soc. Am. B/Vol. 27, No. 3 /March 2010 Alexander M. Heidt
nly simple linear compression is applied here. Due to thehape of the dispersion profile, the blue wavelength com-onents experience a higher amount of nonlinear chirpnd are contained in a low level pedestal which spreadsver about 1 ps. Using more sophisticated compressionethods, the pulse may be compressed to its bandwidth
imited pulse duration of 5 fs, corresponding to only 1.5ptical cycles and 730 kW peak power. Since all spectralomponents are contained in the compressed pulse, aeak power spectral density may be defined as the ratio ofnergy contained in a spectral slice and the pulse dura-ion. This yields continuous peak power spectral densitiesf up to 2 kW/nm which are sufficient to induce nonlinearffects in materials over the entire bandwidth of the spec-rum with immediate applications in nonlinear spectros-
ig. 6. (a) Spectrum and corresponding degree of coherence1.55 �m and d /�=0.37. (b) Pulse profiles after full phase comp
ig. 7. (Color online) (a) Calculated dispersion parameter of.75 �m in 0.05 �m steps. (b) Dependence of the generated SC spters are identical to Fig. 2. The blue dotted line indicates the po
opy. The above discussion for the PCF with d /�=0.37 isn general also valid for the fibers with lower d /� valuesf the reduced spectral bandwidth in Fig. 2(a) is takennto account. The compressibility of the pulses is alwaysimilar to Fig. 5(b), but the bandwidth limited pulse du-ation increases with lower d /�.
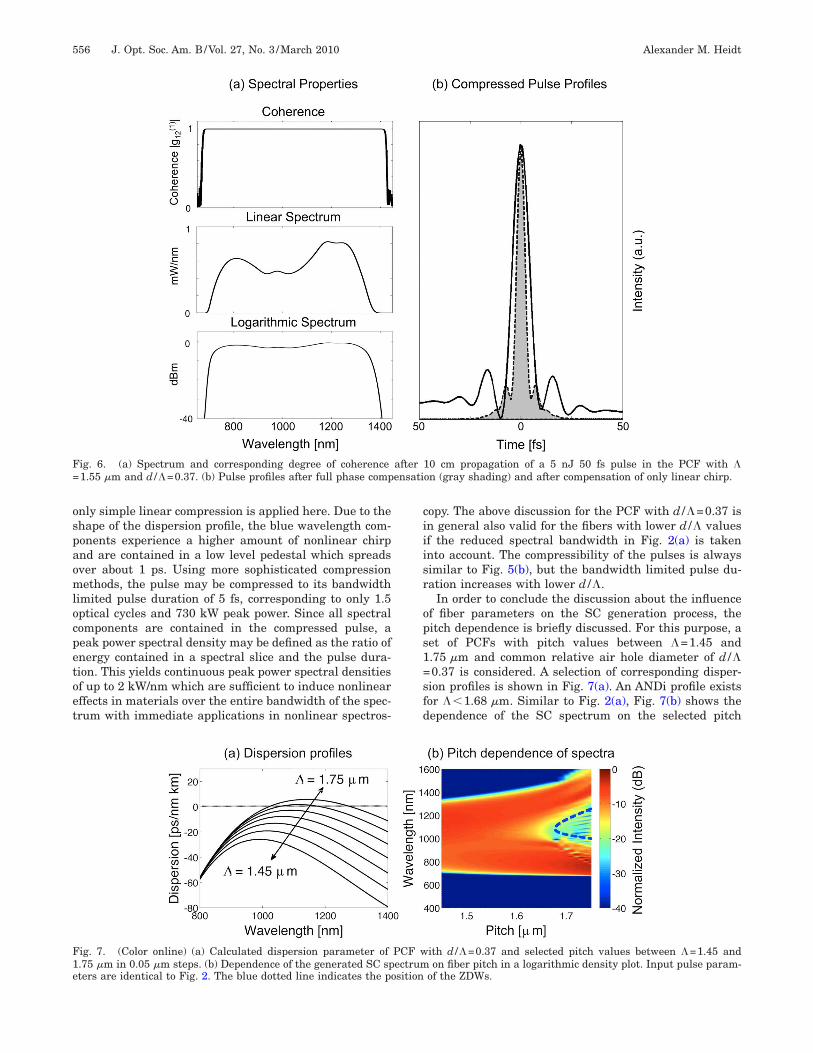
In order to conclude the discussion about the influencef fiber parameters on the SC generation process, theitch dependence is briefly discussed. For this purpose, aet of PCFs with pitch values between �=1.45 and.75 �m and common relative air hole diameter of d /�0.37 is considered. A selection of corresponding disper-ion profiles is shown in Fig. 7(a). An ANDi profile existsor ��1.68 �m. Similar to Fig. 2(a), Fig. 7(b) shows theependence of the SC spectrum on the selected pitch
10 cm propagation of a 5 nJ 50 fs pulse in the PCF with �on (gray shading) and after compensation of only linear chirp.
ith d /�=0.37 and selected pitch values between �=1.45 andon fiber pitch in a logarithmic density plot. Input pulse param-
of the ZDWs.
after
PCF wectrumsition
vvsbbttFsetsdr
4IIpv=cctateppag
isibtaowtepu
isgibeebt3SgitsqowThdwp
p9ddfdrstclcfitnn5topw
Fgu
Alexander M. Heidt Vol. 27, No. 3 /March 2010/J. Opt. Soc. Am. B 557
alue in a logarithmic density plot, summarizing 31 indi-idual spectra. Again it is evident that the splitting of thepectrum into two distinct parts commences already in fi-ers with ANDi profiles and cannot therefore be explainedy solitonic dispersive wave generation. By the analysis ofhe pulse profile evolution, the steepening process of therailing pulse edge followed by subsequent WB inducedWM can be identified here again as the origin of thepectral splitting. Smooth and continuous flat-top spectraxist for ��1.6 �m, and in this region it is apparent thathe pitch of the fiber has only negligible influence on thepectral shape and bandwidth. The case of �=1.55 �miscussed above is therefore representative for a largerange of fibers with similar pitch values.
. SUPERCONTINUUM GENERATION:NFLUENCE OF PUMP PULSE PARAMETERSn this section, the influence of a variation of input pulsearameters on the properties of the generated SC is in-estigated. The ANDi PCF with �=1.55 �m and d /�0.37 will be used for the simulations in this section, be-ause it has been already identified for offering a goodompromise between spectral flatness and bandwidth ofhe generated SC. Input pulses with Gaussian shape aregain used in this section. It should be mentioned herehat using input pulses with hyperbolic secant shape gen-rally leads to similar results. Although the Gaussian in-ut pulse shape results in a slightly smoother spectrum,roperties such as spectral bandwidth, general shape,nd coherence of the generated SC spectra are only mar-inally affected by the shape of the input pulse.
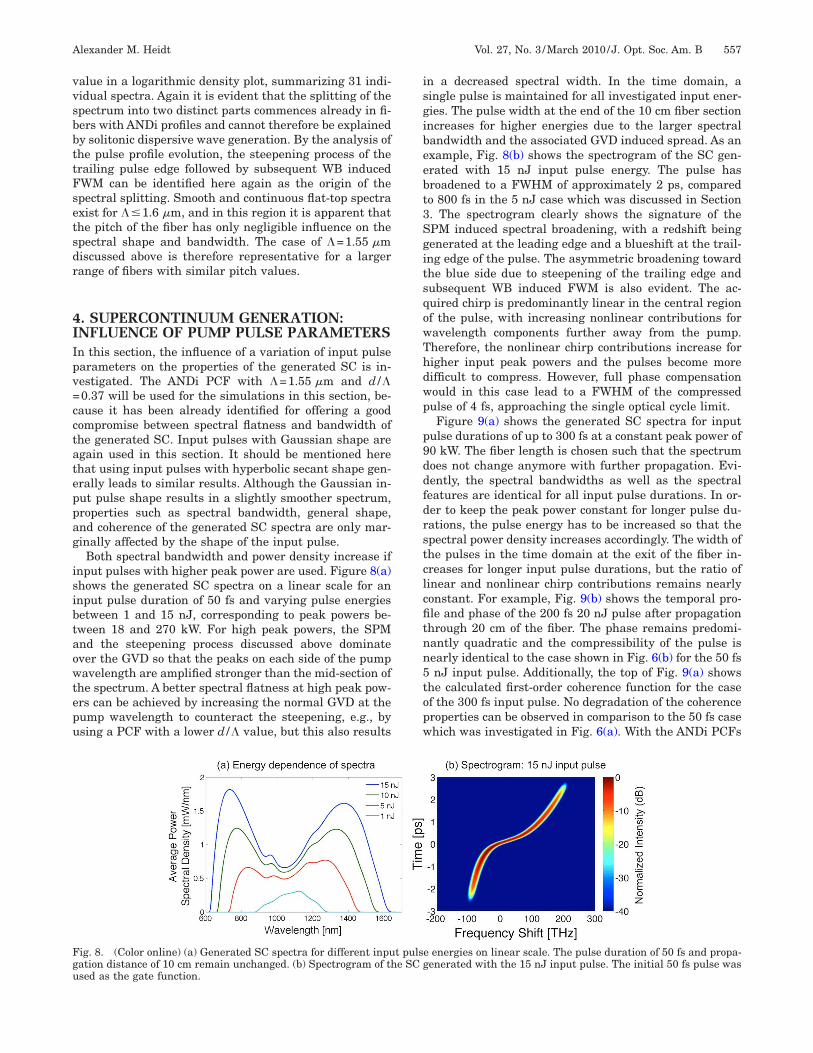
Both spectral bandwidth and power density increase ifnput pulses with higher peak power are used. Figure 8(a)hows the generated SC spectra on a linear scale for annput pulse duration of 50 fs and varying pulse energiesetween 1 and 15 nJ, corresponding to peak powers be-ween 18 and 270 kW. For high peak powers, the SPMnd the steepening process discussed above dominatever the GVD so that the peaks on each side of the pumpavelength are amplified stronger than the mid-section of
he spectrum. A better spectral flatness at high peak pow-rs can be achieved by increasing the normal GVD at theump wavelength to counteract the steepening, e.g., bysing a PCF with a lower d /� value, but this also results
ig. 8. (Color online) (a) Generated SC spectra for different inpuation distance of 10 cm remain unchanged. (b) Spectrogram of thsed as the gate function.
n a decreased spectral width. In the time domain, aingle pulse is maintained for all investigated input ener-ies. The pulse width at the end of the 10 cm fiber sectionncreases for higher energies due to the larger spectralandwidth and the associated GVD induced spread. As anxample, Fig. 8(b) shows the spectrogram of the SC gen-rated with 15 nJ input pulse energy. The pulse hasroadened to a FWHM of approximately 2 ps, comparedo 800 fs in the 5 nJ case which was discussed in Section. The spectrogram clearly shows the signature of thePM induced spectral broadening, with a redshift beingenerated at the leading edge and a blueshift at the trail-ng edge of the pulse. The asymmetric broadening towardhe blue side due to steepening of the trailing edge andubsequent WB induced FWM is also evident. The ac-uired chirp is predominantly linear in the central regionf the pulse, with increasing nonlinear contributions foravelength components further away from the pump.herefore, the nonlinear chirp contributions increase forigher input peak powers and the pulses become moreifficult to compress. However, full phase compensationould in this case lead to a FWHM of the compressedulse of 4 fs, approaching the single optical cycle limit.Figure 9(a) shows the generated SC spectra for input
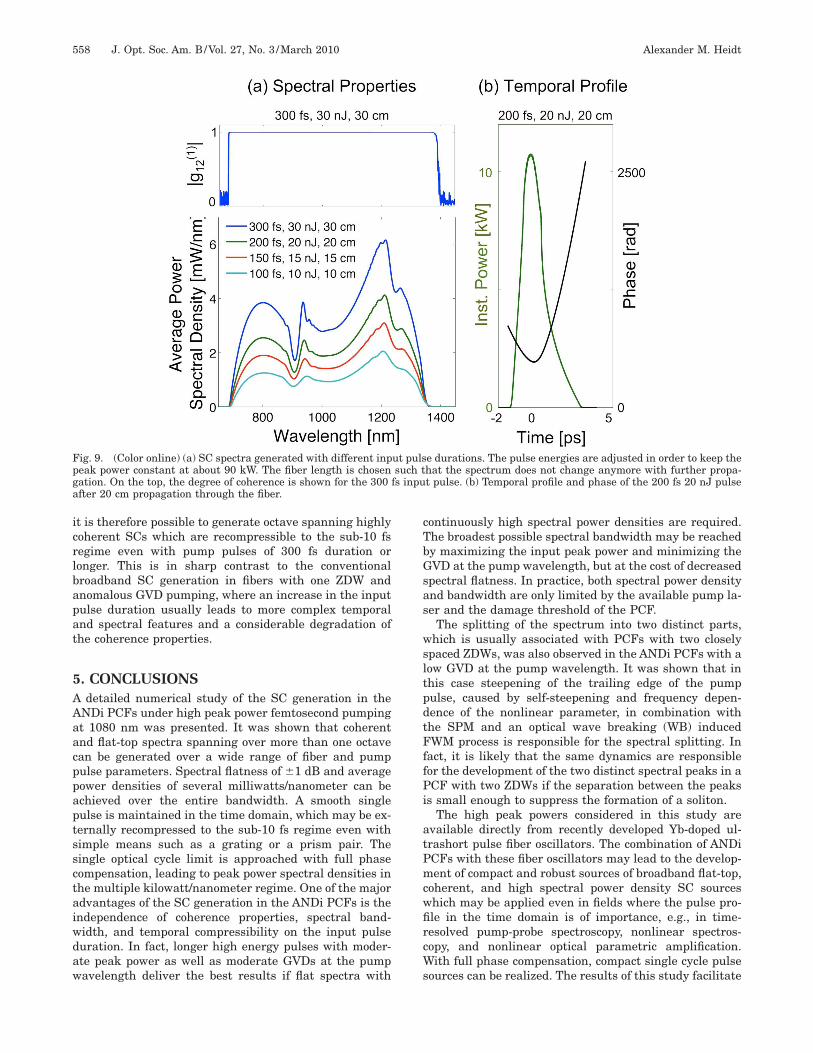
ulse durations of up to 300 fs at a constant peak power of0 kW. The fiber length is chosen such that the spectrumoes not change anymore with further propagation. Evi-ently, the spectral bandwidths as well as the spectraleatures are identical for all input pulse durations. In or-er to keep the peak power constant for longer pulse du-ations, the pulse energy has to be increased so that thepectral power density increases accordingly. The width ofhe pulses in the time domain at the exit of the fiber in-reases for longer input pulse durations, but the ratio ofinear and nonlinear chirp contributions remains nearlyonstant. For example, Fig. 9(b) shows the temporal pro-le and phase of the 200 fs 20 nJ pulse after propagationhrough 20 cm of the fiber. The phase remains predomi-antly quadratic and the compressibility of the pulse isearly identical to the case shown in Fig. 6(b) for the 50 fsnJ input pulse. Additionally, the top of Fig. 9(a) shows
he calculated first-order coherence function for the casef the 300 fs input pulse. No degradation of the coherenceroperties can be observed in comparison to the 50 fs casehich was investigated in Fig. 6(a). With the ANDi PCFs
e energies on linear scale. The pulse duration of 50 fs and propa-generated with the 15 nJ input pulse. The initial 50 fs pulse was
t pulse SC
icrlbapat
5AAaacppaptssctaiwdaw
cTbGsas
wsltpdtFffPi
atPmcwfircWs
Fpga
558 J. Opt. Soc. Am. B/Vol. 27, No. 3 /March 2010 Alexander M. Heidt
t is therefore possible to generate octave spanning highlyoherent SCs which are recompressible to the sub-10 fsegime even with pump pulses of 300 fs duration oronger. This is in sharp contrast to the conventionalroadband SC generation in fibers with one ZDW andnomalous GVD pumping, where an increase in the inputulse duration usually leads to more complex temporalnd spectral features and a considerable degradation ofhe coherence properties.
. CONCLUSIONSdetailed numerical study of the SC generation in the
NDi PCFs under high peak power femtosecond pumpingt 1080 nm was presented. It was shown that coherentnd flat-top spectra spanning over more than one octavean be generated over a wide range of fiber and pumpulse parameters. Spectral flatness of �1 dB and averageower densities of several milliwatts/nanometer can bechieved over the entire bandwidth. A smooth singleulse is maintained in the time domain, which may be ex-ernally recompressed to the sub-10 fs regime even withimple means such as a grating or a prism pair. Theingle optical cycle limit is approached with full phaseompensation, leading to peak power spectral densities inhe multiple kilowatt/nanometer regime. One of the majordvantages of the SC generation in the ANDi PCFs is thendependence of coherence properties, spectral band-idth, and temporal compressibility on the input pulseuration. In fact, longer high energy pulses with moder-te peak power as well as moderate GVDs at the pumpavelength deliver the best results if flat spectra with
ig. 9. (Color online) (a) SC spectra generated with different inpeak power constant at about 90 kW. The fiber length is chosenation. On the top, the degree of coherence is shown for the 300fter 20 cm propagation through the fiber.
ontinuously high spectral power densities are required.he broadest possible spectral bandwidth may be reachedy maximizing the input peak power and minimizing theVD at the pump wavelength, but at the cost of decreased
pectral flatness. In practice, both spectral power densitynd bandwidth are only limited by the available pump la-er and the damage threshold of the PCF.
The splitting of the spectrum into two distinct parts,hich is usually associated with PCFs with two closely
paced ZDWs, was also observed in the ANDi PCFs with aow GVD at the pump wavelength. It was shown that inhis case steepening of the trailing edge of the pumpulse, caused by self-steepening and frequency depen-ence of the nonlinear parameter, in combination withhe SPM and an optical wave breaking (WB) inducedWM process is responsible for the spectral splitting. In
act, it is likely that the same dynamics are responsibleor the development of the two distinct spectral peaks in aCF with two ZDWs if the separation between the peaks
s small enough to suppress the formation of a soliton.The high peak powers considered in this study are
vailable directly from recently developed Yb-doped ul-rashort pulse fiber oscillators. The combination of ANDiCFs with these fiber oscillators may lead to the develop-ent of compact and robust sources of broadband flat-top,
oherent, and high spectral power density SC sourceshich may be applied even in fields where the pulse pro-le in the time domain is of importance, e.g., in time-esolved pump-probe spectroscopy, nonlinear spectros-opy, and nonlinear optical parametric amplification.ith full phase compensation, compact single cycle pulse
ources can be realized. The results of this study facilitate
e durations. The pulse energies are adjusted in order to keep thehat the spectrum does not change anymore with further propa-t pulse. (b) Temporal profile and phase of the 200 fs 20 nJ pulse
ut pulssuch t
fs inpu
tn
ATGRm
R
1
1
1
1
1
1
1
1
1
1
2
2
2
2
2
2
2
2
2
Alexander M. Heidt Vol. 27, No. 3 /March 2010/J. Opt. Soc. Am. B 559
he tailoring of the PCF and pump pulse properties to theeeds of the specific application.
CKNOWLEDGMENTShe author acknowledges the financial support of theerman Academic Exchange Service (DAAD) as well as E.ohwer and H. Bartelt for insightful comments on thisanuscript.
EFERENCES1. R. R. Alfano, The Supercontinuum Laser Source (Springer,
2006).2. J. M. Dudley, G. Genty, and S. Coen, “Supercontinuum
generation in photonic crystal fiber,” Rev. Mod. Phys. 78,1135–1184 (2006).
3. J. Herrmann, U. Griebner, N. Zhavoronkov, A. Husakou,D. Nickel, J. Knight, W. Wadsworth, P. S. J. Russell, and G.Korn, “Experimental evidence for supercontinuumgeneration by fission of higher-order solitons in photoniccrystal fibers,” Phys. Rev. Lett. 88, 173901 (2002).
4. X. Gu, L. Xu, M. Kimmel, E. Zeek, P. O’Shea, A. P.Shreenath, R. Trebino, and R. S. Windeler, “Frequency-resolved optical gating and single-shot spectralmeasurements reveal fine structure in microstructure-fibercontinuum,” Opt. Lett. 27, 1174–1176 (2002).
5. X. Gu, M. Kimmel, A. Shreenath, R. Trebino, J. Dudley, S.Coen, and R. Windeler, “Experimental studies of thecoherence of microstructure-fiber supercontinuum,” Opt.Express 11, 2697–2703 (2003).
6. K. L. Corwin, N. R. Newbury, J. M. Dudley, S. Coen, S. A.Diddams, K. Weber, and R. S. Windeler, “Fundamentalnoise limitations to supercontinuum generation inmicrostructure fiber,” Phys. Rev. Lett. 90, 113904 (2003).
7. M. Frosz, P. Falk, and O. Bang, “The role of the secondzero-dispersion wavelength in generation of supercontinuaand bright-bright soliton-pairs across the zero-dispersionwavelength,” Opt. Express 13, 6181–6192 (2005).
8. K. M. Hilligsøe, T. Andersen, H. Paulsen, C. Nielsen, K.Mølmer, S. Keiding, R. Kristiansen, K. Hansen, and J.Larsen, “Supercontinuum generation in a photonic crystalfiber with two zero dispersion wavelengths,” Opt. Express12, 1045–1054 (2004).
9. M.-L. V. Tse, P. Horak, F. Poletti, N. G. Broderick, J. H.Price, J. R. Hayes, and D. J. Richardson, “Supercontinuumgeneration at 1.06 �m in holey fibers with dispersionflattened profiles,” Opt. Express 14, 4445–4451 (2006).
0. E. R. Andresen, H. N. Paulsen, V. Birkedal, J. Thøgersen,and S. R. Keiding, “Broadband multiplex coherent anti-Stokes Raman scattering microscopy employing photonic-crystal fiber,” J. Opt. Soc. Am. B 22, 1934–1938 (2005).
1. G. Genty, S. Coen, and J. M. Dudley, “Fibersupercontinuum sources (Invited),” J. Opt. Soc. Am. B 24,1771–1785 (2007).
2. K. Mori, H. Takara, S. Kawanishi, M. Saruwatari, and T.Morioka, “Flatly broadened supercontinuum spectrum
generated in a dispersion decreasing fibre with convexdispersion profile,” Electron. Lett. 33, 1806–1808 (1997).
3. P. Falk, M. H. Frosz, and O. Bang, “Supercontinuumgeneration in a photonic crystal fiber with two zero-dispersion wavelengths tapered to normal dispersion at allwavelengths,” Opt. Express 13, 7535–7540 (2005).
4. A. M. Heidt, J. P. Burger, J.-N. Maran, and N. Traynor,“High power and high energy ultrashort pulse generationwith a frequency shifted feedback fiber laser,” Opt. Express15, 15892–15897 (2007).
5. K. Kieu, W. H. Renninger, A. Chong, and F. W. Wise,“Sub-100 fs pulses at watt-level powers from a dissipative-soliton fiber laser,” Opt. Lett. 34, 593–595 (2009).
6. B. Ortaç, M. Baumgartl, J. Limpert, and A. Tünnermann,“Approaching microjoule-level pulse energy with mode-locked femtosecond fiber lasers,” Opt. Lett. 34, 1585–1587(2009).
7. A. M. Heidt, G. Bosman, M. Becker, M. Rothhardt, K.Schuster, J. Kobelke, and H. Bartelt, “Prospects of highenergy ultrashort pulse generation with frequency shiftedfeedback fiber oscillators,” in European Conference onLasers and Electro-Optics 2009 and the European QuantumElectronics Conference (IEEE, 2009), paper CJ.P. 37.
8. N. Nishizawa and J. Takayanagi, “Octave spanning high-quality supercontinuum generation in all-fiber system,” J.Opt. Soc. Am. B 24, 1786–1792 (2007).
9. K. Chow, Y. Takushima, C. Lin, C. Shu, and A. Bjarklev,“Flat super-continuum generation based on normaldispersion nonlinear photonic crystal fibre,” Electron. Lett.42, 989–991 (2006).
0. M. Koshiba and K. Saitoh, “Applicability of classical opticalfiber theories to holey fibers,” Opt. Lett. 29, 1739–1741(2004).
1. K. Saitoh and M. Koshiba, “Empirical relations for simpledesign of photonic crystal fibers,” Opt. Express 13, 267–274(2005).
2. T. P. White, B. T. Kuhlmey, R. C. McPhedran, D. Maystre,G. Renversez, C. M. de Sterke, and L. C. Botten, “Multipolemethod for microstructured optical fibers. I. Formulation,”J. Opt. Soc. Am. B 19, 2322–2330 (2002).
3. J. Hult, “A fourth-order Runge-Kutta in the interactionpicture method for simulating supercontinuum generationin optical fibers,” J. Lightwave Technol. 25, 3770–3775(2007).
4. R. H. Stolen, J. P. Gordon, W. J. Tomlinson, and H. A. Haus,“Raman response function of silica-core fibers,” J. Opt. Soc.Am. B 6, 1159–1166 (1989).
5. A. M. Heidt, “Efficient adaptive step size method for thesimulation of supercontinuum generation in optical fibers,”J. Lightwave Technol. 27, 3984–3991 (2009).
6. G. P. Agrawal, Nonlinear Fiber Optics, 3rd ed. (Academic,2001).
7. D. Anderson, M. Desaix, M. Lisak, and M. L. Quiroga-Teixeiro, “Wave-breaking in nonlinear optical fibers,” J.Opt. Soc. Am. B 9, 1358–1361 (1992).
8. C. Finot, B. Kibler, L. Provost, and S. Wabnitz, “Beneficialimpact of wave-breaking or coherent continuum formationin normally dispersive nonlinear fibers,” J. Opt. Soc. Am. B25, 1938–1948 (2008).