Embed Size (px)
Citation preview
Drinks
Welcome to the Pulse Q1 2013 edition for Drinks. We hope you find it
useful. Please do not hesitate to contact us if you have any questions
or comments at [email protected]
www.IRIworldwide.eu

2
Drinks – IRI Pulse Q1 2013
About the Report
• This Drinks report is one of 10 super category reports designed to show high-level comparison and analysis for retail markets across major countries inEurope.
• This report contains data gathered from around Europe. This market was splitinto the following categories: Soft Drinks, Juices Squashes & Syrups, MineralWater, Coffee, Tea, Cocoa.
• The report highlights key metrics such as total sales figures, market trends,category shares, winners and losers for Europe and for individual countries.
• The data has been sourced from Symphony IRI retail databases and Eurostat– the statistical branch of administration for the European Commission.
• The countries included in the report are: France, Germany, Italy, Netherlands,Spain and the UK.
• The market channels used for each country in this report are as follows:
• For analytical purposes the data sourced from available retail databases hasbeen consolidated to provide consistent results. However, for some countries ithas not been possible to source data pertaining to certain categories. When thishas occurred it has been documented in the Notes section found at the end ofthe report.
Country Channels used
UK Hypermarkets, Supermarkets, Drugstores and Impulse Outlets
ESHypermarkets, Supermarkets, Hard Discounters, Drugstores and includes the Canary Islands
DEHypermarkets, Supermarkets, Hard Discounters, Drugstores and Beverages Specialty Stores
NL Hypermarkets, Supermarkets, Hard Discounters and Drugstores
IT Hypermarkets, Supermarkets, Small Self Service, Hard Discounters and Drugstores
FR Hypermarkets and Supermarkets

3
Drinks – IRI Pulse Q1 2013
In the Radar
“”
Economic figures influencing consumer behaviour
Some Drinks categories suffer from the cold weather in the beginning of 2013 but the value growth for the Drinks market in Europe is going on – also due to further price increases.
Contact: Björn [email protected]
Source: Eurostats, March 2013
Population in Millions Unemployment (%)
Average 12 Months Inflation
Rate GDP in Millions (€)
January 2011
January2012
Feb. 2013
Average 2012
Mar. 2013
Average 2012
2012 (Estimate)
2013 (Estimate)
France 65.0 65.3 10.8 10.2 +1.9 +2.5 2,032,297 2,059,358
Germany 81.7 81.8 5.4 5.5 +2.0 +2.4 2,644,200 2,694,499
Italy 60.6 59.3 11.9 10.7 +2.9 +3.5 1,565,916 1,568,388
Netherlands 16.6 16.7 6.2 5.3 +2.9 +2.8 600,638 604,459
Spain 46.1 46.1 26.6 25.0 +2.7 +2.3 1,049,525 1,051,076
United Kingdom 62.4 63.2 7.7 7.9 +2.7 +3.7 1901001.4 1,854,920
4
Drinks – IRI Pulse Q1 2013
1,528 1,841 1,994 2,106 1,938 1,867
976965 1,053 1,146 986 953
477472 505 507
481 4701,461
1,4661,663 1,825
1,447 1,431
4,091 4,0944,272
4,296
4,135 4,049
1,751 1,783
1,9422,027
1,771 1,717
0
2,000
4,000
6,000
8,000
10,000
12,000
14,000
01-Jan-12 02-A pr-12 01-Jul-12 01-Oct-12 30-D ec-12 31-M ar-13P erio d Ending
France
Germany
Italy
Netherlands
Spain
UK
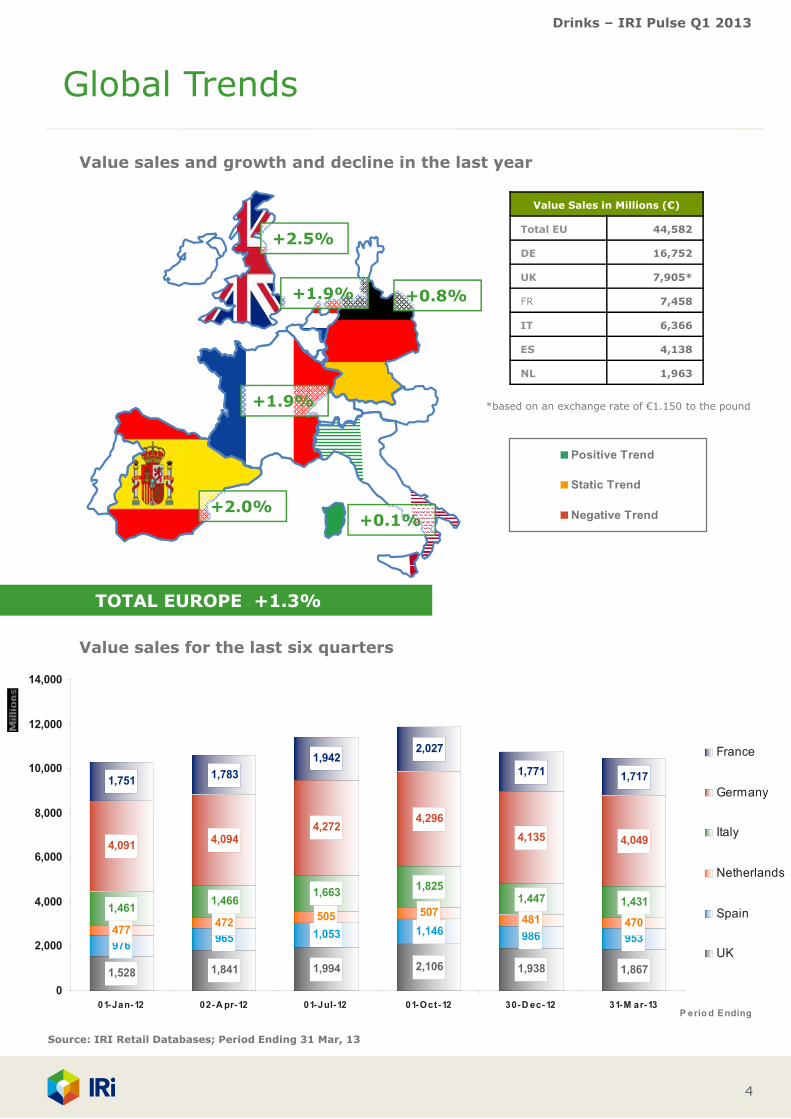
Global Trends
+1.9%
+0.8%
+2.5%
TOTAL EUROPE +1.3%
Value Sales in Millions (€)
Total EU 44,582
DE 16,752
UK 7,905*
FR 7,458
IT 6,366
ES 4,138
NL 1,963
*based on an exchange rate of €1.150 to the pound
+1.9%
+0.1%
Value sales and growth and decline in the last year
Value sales for the last six quarters
+2.0%
Positive Trend
Static Trend
Negative Trend
Source: IRI Retail Databases; Period Ending 31 Mar, 13

5
Drinks – IRI Pulse Q1 2013
17,802.35
5,985.79
2,154.15
8,448.21
9,321.26
1.0 0.70.61.6 3.1
Soft Drinks Coffee MineralWater
Juices,Squashes& Syrups
Tea
Mill
ion
s
Total € Sales % € vs. YA
Top 5 Categories Evolution
39.9%
20.9%
18.9%
13.4%
4.8%
2.0%
Soft Drinks CoffeeMineral Water Juices, Squashes & SyrupsTea Cocoa
Europe
Value Sales (€) and % Change vs. Yr Ago
17,802
9,3218,448
5,986
2,154870
0
2,000
4,000
6,000
8,000
10,000
12,000
14,000
16,000
18,000
20,000
Mill
ions
Eur
os
Category Value Sales and Share of Value in the Last Year
Key Trends
•In the first quarter of 2013 inflationin Europe slowed a little bit comparedto 2012. This is true for France,Germany, Italy and the UK whereasthe Netherlands and Spain experiencehigher consumer prices.
•It seems that the increasing rawmaterial costs and increasingpromotions are also were a featureduring Q1 2013. This has resulted inall Drinks categories in Europeshowing value growth in Q1.
•Besides this, the weather of coursehas effected the Drinks categories inEurope. Water is negativelyinfluenced in Q1 2013 whereas thiscategory grew in the last half year of2012 due to a warm summer.
Europe includes: France, Germany, Italy, Netherlands, Spain and United KingdomSource: IRI Retail Databases; Period Ending 31 Mar, 13

6
Drinks – IRI Pulse Q1 2013
Europe
Top 5 Losers: Value Sales chg vs. Yr Ago (€)
Top 5 Winners: Value Sales chg vs. Yr Ago (€)
285.9
95.8
64.6
54.3
44.7
0 100 200 300 400
Soft Drinks
Coffee
Tea
Mineral Water
Cocoa
Millions
0 0 0 0 0 0 0
Millions
Category Insights
•Like in 2012 Soft Drinks (+€285.9m) and Coffee (+€95.8m) are the drivers of theEuropean Drinks Market versus the year ago. The increase in Soft Drinks comes fromall countries - mainly Germany and UK and with the exception of Spain. Coffee on theother hand is the biggest growing category in Spain and is in slight decline in Germanyand the Netherlands.
•There are several factors leading to the increase in Soft Drink Value sales despite thedesperate weather conditions in the first quarter, including price increases andpromotion activities.
•The Coffee market is very diverse in the way it is developing in each of the singlemarkets. There is strong growth in Value in the UK and Spain. On the other hand thereis a decline in the Netherlands and Germany. Overall, Coffee in Europe is growing. Thedrivers for this development are launches and innovations in Spain and a shift to highlypriced variants in UK.
•In Total Europe the Juices, Squashes & Syrups category have the lowest increase invalue sales. This is mainly due to a decline in volume as a reaction to price increases.However, due to the growth mainly in France and the Netherlands the category ispositive for Europe in total.
•The Mineral Water category growth of 0.6% is below the last growth rates. This ismainly due to a cold first quarter in 2013.
Europe includes: France, Germany, Italy, Netherlands, Spain and United KingdomSource: IRI Retail Databases; Period Ending 31 Mar, 13

7
Drinks – IRI Pulse Q1 2013
France
Value Sales (€) and % Change vs. Yr Ago
Top 5 Categories Evolution
Mill
ions
Eur
os
Category Value Sales and Share of Value in the Last Year
2.245,99
1.382,52
348,76
1.598,29
1.735,98
-1,3 0,74,23,3 3,7
Soft Drinks MineralWater
Juices,Squashes& Syrups
Coffee Tea
Mill
ion
s
Total € Sales % € vs. YA
30,1%
23,3%
21,4%
18,5%
4,7%
2,0%
Soft Drinks Mineral WaterJuices, Squashes & Syrups CoffeeTea Cocoa
2.246
1.7361.598
1.383
349
146
0
500
1.000
1.500
2.000
2.500
Europe includes: France, Germany, Italy, Netherlands, Spain and United KingdomSource: IRI Retail Databases; Period Ending 31 Mar, 13
Key Trends
•In the French drinks market, there is anoticeable difference between valueand volume trends.
•The soft drinks category continues todecline in volume, except the EnergyDrinks but is in good value growth.
•Waters continue to increase in volumebut the values sales is on the decline
•Syrups are in growth thanks to gainsin the Sodastream segment

8
Drinks – IRI Pulse Q1 2013
France
Top 5 Losers: Value Sales chg vs. Yr Ago (€)
Top 5 Winners: Value Sales chg vs. Yr Ago (€)
Category Insights
•On Waters more promotion has led to devaluing of the category. National Brandcontinue to increase the promotional activity and Cristaline (low pricing) continues togrow.
•There is a difference on soft drinks between Still and Carbonated : Still remain ingrowth and CSD is declining in volume.
•Syrup : The development of the Soda Machine trend in France has driven thedevelopment on Syrup. Moreover, during the financial crisis, syrup remain thecheapest drink.
•In the coffee market, pods continue to grow well, while other coffees are in decline :Only Lavazza has seen an increase in sales.
•Tea Market : Foods international is driving the growth of the category (with PrivateLabel).
71,0
64,0
12,4
9,3
6,2
0 20 40 60 80
Soft Drinks
Juices,Squashes &
Syrups
Tea
Coffee
Cocoa
Millions
-22,3
-25 -20 -15 -10 -5 0
Mineral Water
Millions
Europe includes: France, Germany, Italy, Netherlands, Spain and United KingdomSource: IRI Retail Databases; Period Ending 31 Mar, 13

9
Drinks – IRI Pulse Q1 2013
Germany
Value Sales (€) and % Change vs. Yr Ago
Top 5 Categories Evolution
Mill
ions
Eur
os
Category Value Sales and Share of Value in the Last Year
5,834
2,725
674
3,397
3,950
-1.3 -1.1 0.92.5 6.0
Soft Drinks Coffee MineralWater
Juices,Squashes& Syrups
Tea
Mill
ion
s
Total € Sales % € vs. YA
34.8%
23.6%
20.3%
16.3%
4.0%
1.0%
Soft Drinks CoffeeMineral Water Juices, Squashes & SyrupsTea Cocoa
5,834
3,9503,397
2,725
674173
0
1,000
2,000
3,000
4,000
5,000
6,000
7,000
Source: IRI Retail Databases; Period Ending 31 Mar, 13
Key Trends
•Once more the German Drinkscategories are still affected by risingconsumer prices, caused by the costincreases for raw materials andenergy in the latest year. The averageconsumer price for non-alcoholicbeverages (without hot drinks, likecoffee) went up 2.6%. Especially SoftDrinks (+6.0%) and Fruit BasedDrinks (+4.8%) keep driving thisdevelopment.
•Volume and value development fortotal non-alcoholic beverages in thelast year are opposite. In value non-alcoholic beverages is growing 1.1%whereas volume sales declined by -1.5%.
•In this quarter strong pricedevelopment is beginning to slowdown. Especially Soft Drinks whichexperienced just 1.9% growth inprices. On the other hand Fruit BasedDrinks Prices keep growing at a highlevel (+5,0%).

10
Drinks – IRI Pulse Q1 2013
Germany
Top 5 Losers: Value Sales chg vs. Yr Ago (€)
Top 5 Winners: Value Sales chg vs. Yr Ago (€)
Category Insights
• For Q1 2013, total cost increases and rising prices remain a big issues in the German Drinksmarket.
• Soft Drinks could further gain value sales and is once again one of the top growingsegments in Germany. After Coca-Cola entered Aldi in Germany in October 2012 Coca-Colais growing in the total market. There is only just a little cannibalization with the Aldi PL Brand.Furthermore other Drink categories at Aldi are also growing which could be a result of avitalisation impact from Coca-Cola. Further growth comes from Energy Drinks andFassbrause. In the middle of last year a few big Breweries entered the Fassbrause market,thus we will see their growth in the next quarter as well.
• The development of Juices in Q1 2013 continues to be driven by price increases.Consumers reacted by a lower level of consumption which exceeded the impact of priceincreases. Thus the value sales are declining in Q1 2013.
• Meanwhile Coffee’s value sales are declining. The prices of the biggest segment RoastedCoffee was at a high level last year when volume sales started to declined. This is whenshelf prices were reduced but consumers didn’t react to this change and so while volumescontinued to decline the reduced prices led to value sales loss as well. This is driven throughGround Coffee which is the biggest sub segment in the Roasted Coffee segment. Other subsegments particularly Coffee Beans (ungrounded) are growing but cannot compensate thelosses.
140.9
38.1
29.3
10.0
0 50 100 150
Soft Drinks
Tea
Mineral Water
Cocoa
Millions
-31.6
-50.9
-60 -50 -40 -30 -20 -10 0
Juices, Squashes &Syrups
Coffee
Millions
Europe includes: France, Germany, Italy, Netherlands, Spain and United KingdomSource: IRI Retail Databases; Period Ending 31 Mar, 13

11
Drinks – IRI Pulse Q1 2013
29,0%
28,9%
22,4%
14,5%
3,9%
1,2%
Mineral Water Soft DrinksCoffee Juices, Squashes & SyrupsTea Cocoa
1.847 1.843
1.427
921
251
76
0
200
400
600
800
1.000
1.200
1.400
1.600
1.800
2.000
Italy
Value Sales (€) and % Change vs. Yr Ago
Top 5 Categories Evolution
Mill
ions
Eur
os
Category Value Sales and Share of Value in the Last Year
1.847
921
251
1.427
1.843
-1,2 -2,1 1,50,9 3,8
MineralWater
Soft Drinks Coffee Juices,Squashes& Syrups
Tea
Mill
ion
s
Total € Sales % € vs. YA
Europe includes: France, Germany, Italy, Netherlands, Spain and United KingdomSource: IRI Retail Databases; Period Ending 31 Mar, 13
Key Trends
• Year Ending Q1 2013 shows a positive trend for Water, Coffee and
Tea, but a decline in Soft Drinks and Juices.
• The trends have been impacted by temperatures: high season 2012
(June, July, August) records were higher temperatures than 2011,
but April, May and September 2012 and the beginning of 2013
(particularly March) were all colder than the previous year: the
contribution attributed to climate effects is slightly above zero.
• Price rises have affected all categories, due mainly to price increase
of petrol (cost of transport, packaging PET…) and row materials
(coffee and sugar). This trend has driven value growth only in Coffee
and Tea; in other categories we have observed a real choice of
convenience by consumers that has caused negative trends in
volume and value.
• At the same time volumes in last period are positive only for Water:
the key success factors were the warm temperatures of the 2012
summer season and the use of promotional activities.
• Soft Drinks have a negative trends in volume and value, due to
difficulties of the Colas market.
• In general, the Drinks Market in Q4 2012 and Q1 2013 was impacted
by a weakness in consumer demand in CPG due to the economic
crisis. CSD’s are suffering but Water is benefiting from the “trading
down” phenomena, being a low priced category.

12
Drinks – IRI Pulse Q1 2013
Italy
Top 5 Losers: Value Sales chg vs. Yr Ago (€)
Top 5 Winners: Value Sales chg vs. Yr Ago (€)
20,5
16,2
9,2
0,5
0 5 10 15 20 25
Coffee
Mineral Water
Tea
Cocoa
Millions
-19,3
-22,7
-23 -22 -21 -20 -19 -18 -17
Juices, Squashes &Syrups
Soft Drinks
Millions
Source: IRI Retail Databases; Period Ending 31 Mar, 13
Category Insights
•During 2012 and early 2013, some phenomena continue to influence categories trends:
• Weakness of consumer demand due to the economic crisis
• Increase of inflation rate (particularly driven by price increase of several raw materiale.g. coffee) and petrol that impacts the cost of transport and packaging (e.g. PET)
• Retailers are transferring these rising costs to the shelf prices
• In Q4 2012 and Q1 2013 these phenomena (decrease of consumer demand and increase ofinflation rate) were accentuated further and have come to plague virtually all food categories.
•Coffee is the category most influenced from price increase of raw materials. In the last year thevalue growth has been thanks to the continuous positive trend of capsules super premiumsegment, consumers increase “at home consumption“ instead of “out of home“, and moreexpensive pricing. However the volumes of the market are decreasing, due to difficulties in normalground coffee.
• In the last year ending volumes of the Soft Drinks market have been affected by price increaseand “Trading down” consumer behavior. Mineral Water with the lowest price per litre, is the onlycategory that has shown an increase in volumes in the latest year ending.
• Ice Tea is very sensitive to climate effects and its performance benefited from the very hottemperatures during the high season 2012 (June, July, August). The growth in value has beendriven by premium brands, and the category has been positively impacted by NPD with premiumpositioning.

13
Drinks – IRI Pulse Q1 2013
46,0%34,4%
8,0%
6,8%4,2%
0,6%
Soft Drinks CoffeeJuices, Squashes & Syrups TeaMineral Water Cocoa
902
676
158 13481
110
100
200
300
400
500
600
700
800
900
1.000
Netherlands
Value Sales (€) and % Change vs. Yr Ago
Top 5 Categories Evolution
Mill
ions
Eur
os
Category Value Sales and Share of Value in the Last Year
902
13481
676
158
10,22,1
12,14,4
-1,6
Soft Drinks Coffee Juices,Squashes& Syrups
Tea MineralWater
Mill
ion
s
Total € Sales % € vs. YA
Source: IRI Retail Databases; Period Ending 31 Mar, 13
Key Trends
• Although Total Drinks is showingvalue growth in the Netherlands, itdoesn’t meet the growth of the totalmarket. So drinks are losing sharewithin total supermarket turnover (infavour of mainly fresh food).
• The value growth in drinks is drivenby price increases (as is the totalsupermarket turnover). Theseincreases are impacting volumeshowever, as volumes are downdespite more promotions.
• Within total drinks (as in the totalmarket), discounters are gainingmarket share of full servicesupermarkets. One of the driversbehind this trend is the recent listingof Coca Cola in Aldi. This has lead toa higher market share for Aldi withinsoft drinks, mainly value drivenbecause of the higher price of CocaCola compared to the Aldi own label.

14
Drinks – IRI Pulse Q1 2013
Netherlands
Top 5 Losers: Value Sales chg vs. Yr Ago (€)
Top 5 Winners: Value Sales chg vs. Yr Ago (€)
Category Insights
• In absolute terms, soft drinks is the biggest contributor to value growth, thanks to price increases. Howeverprice increases are leading to a downturn in volume, as in soft drinks is the biggest contributor to volumeloss. Next to price increases, volume sales are also impacted by the relatively cold spring season in theNetherlands. Ice Tea and Flavoured Waters are the exceptions as these two segments keep winning volume inthe declining market.
• The strong growth in Juices, squashes and syrups is driven by the last segment: squashes and syrups. Thiscategory has been brought to life again by the main A-brand manufacturer Heinz, and in the latest year hasbeen winning ‘share of throat’ at the cost of other Liquid Intake categories.
• Also within the Mineral Water segment prices have increased significantly. For the leading A-brand withinMineral Water: SPA, who announced a 15% price increase last year, this lead to a 10 month boycott of theirproducts at one of the major accounts, at a big loss of market share. Within Mineral Water the price increasedid not lead to a volume decline, as volumes also showed growth figures of almost 6%. A major segmentpromotion at market leader Albert Heijn, including all mineral waters can be attributed for almost half thisvolume growth.
• All hot drinks (coffee, chocolate and tea) are declining in volume. Although premium coffee methods (cups,beans) are still winning volume share this trend is not big enough to bring value growth to the wholecategory. This is happening despite deep discounted promotions (leading to an average price decrease; butnot to a volume increase) for the more traditional grounded coffee and coffee pads.
• Within Tea strong price increases in black and fruit flavoured tea have lead to a volume loss, that cannot becompensated by the volume growth of smaller segments of herbal and green teas (where prices increasedless). Recently new innovative tea ranges have been introduced by leading A-brand: Pickwick, that shouldturn this negative trend around.
18,7
17,0
7,5
5,6
0 5 10 15 20
Soft Drinks
Juices,Squashes &
Syrups
Mineral Water
Tea
Millions
-1,0
-11,2
-12 -10 -8 -6 -4 -2 0
Cocoa
Coffee
Millions
Source: IRI Retail Databases; Period Ending 31 Mar, 13
15
Drinks – IRI Pulse Q1 2013
Spain
Value Sales (€) and % Change vs. Yr Ago
Top 5 Categories Evolution
Mill
ions
Eur
os
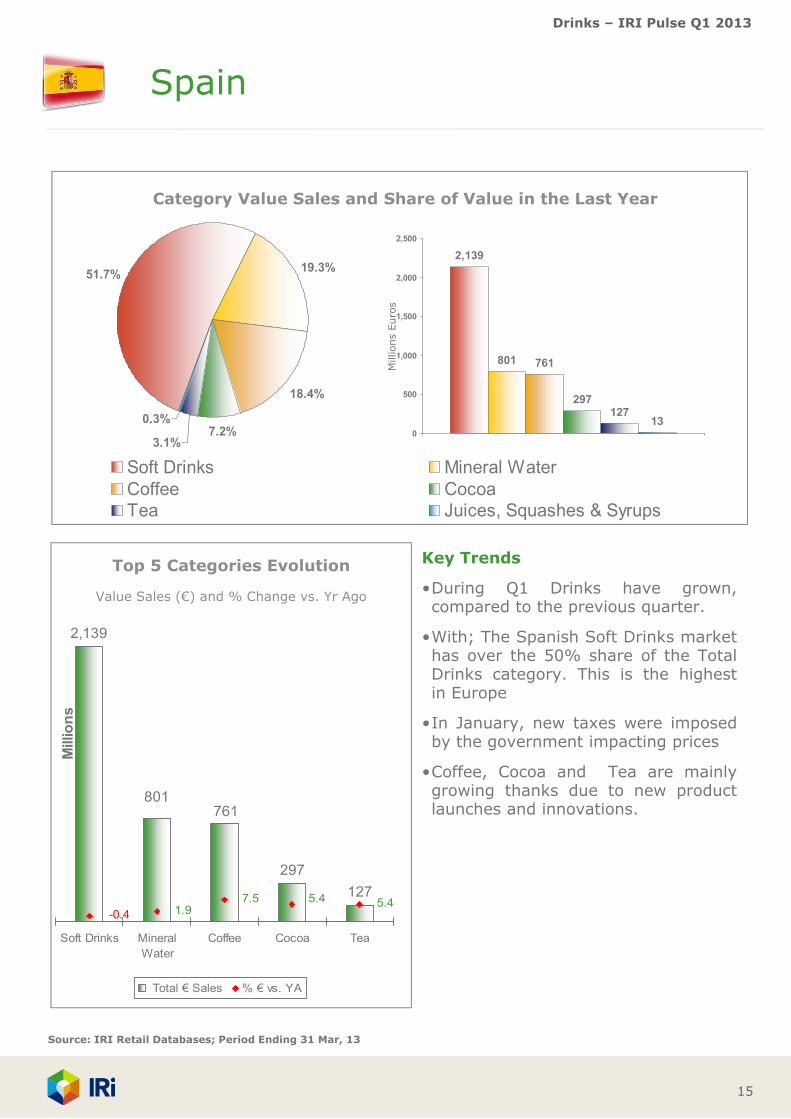
Category Value Sales and Share of Value in the Last Year
2,139
297
127
761801
1.95.47.5
-0.4 5.4
Soft Drinks MineralWater
Coffee Cocoa Tea
Mill
ion
s
Total € Sales % € vs. YA
51.7% 19.3%
18.4%
7.2%3.1%
0.3%
Soft Drinks Mineral WaterCoffee CocoaTea Juices, Squashes & Syrups
2,139
801 761
297127
130
500
1,000
1,500
2,000
2,500
Source: IRI Retail Databases; Period Ending 31 Mar, 13
Key Trends
•During Q1 Drinks have grown,compared to the previous quarter.
•With; The Spanish Soft Drinks markethas over the 50% share of the TotalDrinks category. This is the highestin Europe
•In January, new taxes were imposedby the government impacting prices
•Coffee, Cocoa and Tea are mainlygrowing thanks due to new productlaunches and innovations.

16
Drinks – IRI Pulse Q1 2013
Spain
Top 5 Losers: Value Sales chg vs. Yr Ago (€)
Top 5 Winners: Value Sales chg vs. Yr Ago (€)
Category Insights
Sales in Tonic have gone up steadily in soft drinks (+16% volume) thanks to thegrowing Gin & Tonic Market.
Coca Cola Co sales increased slightly last MAT driven by Coca Cola Zero (Colas).However, Private Label has shown a significant growth in volume (+10%) and value(+15%) due to increased promotional volumes and regular price indicating thatconsumers are still very price weary.
The most important contributor to the growth of coffee segment is the new coffeecapsules (+154% vs. MAT last Year).
For Total Drinks the positive trend is due to growth in Supermarket (>1001 m2).
52.8
15.1
14.6
6.5
0.5
0 10 20 30 40 50 60
Coffee
Cocoa
Mineral Water
Tea
Juices,Squashes &
Syrups
Millions
-9.6
-12 -10 -8 -6 -4 -2 0
Soft Drinks
Millions
Source: IRI Retail Databases; Period Ending 31 Mar, 13

17
Drinks – IRI Pulse Q1 2013
United Kingdom
Value Sales (€) and % Change vs. Yr Ago
Top 5 Categories Evolution
Mill
ions
Eur
os
Category Value Sales and Share of Value in the Last Year
4,838
586 572619
1,124
7.2 1.6-1.2 1.8 2.2
Soft Drinks Coffee Tea MineralWater
Juices,Squashes& Syrups
Mill
ion
s
Total € Sales % € vs. YA
61.2%
14.2%
7.8%
7.4%7.2%2.1%
Soft Drinks CoffeeTea Mineral WaterJuices, Squashes & Syrups Cocoa
4,838
1,124
619 586 572166
0
1,000
2,000
3,000
4,000
5,000
6,000
Source: IRI Retail Databases; Period Ending 31 Mar, 13
Key Trends
All sectors in the UK are experiencingvalue growth with the exception ofTea which is seeing a slight decline (-1.2% yoy). Price rises have been thedriving factor behind this valuegrowth as most categories are seeingdeclines in volume
The Coffee sector is seeing verystrong value growth, due to theinnovation of high priced premiumsector, and a consumer trend of more‘drinking at home’ due torecessionary pressures.
Bucking the trend of volume decline isMineral Water. Value growth for thecategory has been driven by a strongvolume increase (+4%) while averagevolume prices have actually slightlydeclined

18
Drinks – IRI Pulse Q1 2013
United Kingdom
Top 5 Losers: Value Sales chg vs. Yr Ago (€)
Top 5 Winners: Value Sales chg vs. Yr Ago (€)
75.2
13.9
12.1
9.0
0 20 40 60 80
Coffee
Cocoa
Juices,Squashes &
Syrups
Mineral Water
Millions
-7.2
-8 -7 -6 -5 -4 -3 -2 -1 0
Tea
Millions
Source: IRI Retail Databases; Period Ending 31 Mar, 13
Category Insights
•The cold weather in the UK did not let up with the finish of winter at the end ofFebruary. It was the coldest March in 50years and as a result we saw an impact onbuying behaviour as retailers saw the colder weather lead to a an abnormal rise inHot Chocolate/Cocoa sales.
•Tea is still in long term decline due to Normal Black Tea declining heavily in volume.These declines have not been offset by very strong value growth from Non BlackTea sectors of Fruit & Herbal, Speciality and Green. These sectors have been in mildvolume growth and the main players in these sectors have been driving valuegrowth through price increases of over 10%
•In Coffee premium priced variants are driving the sector. Instant coffee contributednearly 2/3rds of the category value growth, particularly that of innovative microground variants. Ground Coffee is however growing nearly twice as fast as instantdriven by innovation in Pods.
•Strongest volume growth in Water was from Flavoured Still and FlavouredSparkling. Flavoured Sparkling also drove the value growth of the category.
•Soft drink category growth has been pushed by growth in cola and lemonade, onceagain through price rises outweighing the volume decline. Sports Energy drinks inparticular have not fared well with a sharp fall in volume causing large value declinenot regained through increased prices.

19
Drinks – IRI Pulse Q1 2013
Resources
To gain insight into opportunities across specific categories, segments, channelsor retailers, contact your IRI client service representative regarding customanalyses leveraging the following resources:
• InfoScan Census ® is a syndicated retail tracking service that enablesmanufacturers and retailers to acquire industry insights used to make betterbusiness decisions. InfoScan Census utilizes the data that IRI collects fromgrocery, drug, and mass merchandise retailers to provide the mostcomprehensive and accurate syndicated data offering in the Fast MovingConsumer Goods (FMCG) sector. With access to accurate, granular detail bycategory, geography, measure, and time period, clients have the tools needed todevelop marketing and sales strategies based on product performance,distribution, and promotion responsiveness. All data about frozen foods arecoming from InfoScan Census®.
• IRI Consulting provide strategic insights and advice leveraging a variety ofdata sources, predictive analytics, enabling technologies, and business analysesto help CPG manufacturers and retailers address significant sales and marketingissues effectively.
Contact: IRI, [email protected], Tel: +33 1 30 06 23 62
About IRI IRI is a leader in delivering powerful market and shopper information, predictiveanalysis and the foresight that leads to action. We go beyond the data to igniteextraordinary growth for our clients in the CPG, retail and over-the-counterhealthcare industries by pinpointing what matters and illuminating how it can impacttheir businesses across sales and marketing. Move your business forward atIRIworldwide.eu
© Copyright 2013 Information Resources Inc, All rights reserved.