Embed Size (px)
Citation preview

Pupil registration practices
October 2019
estyn.llyw.cymruestyn.gov.wales
The purpose of Estyn is to inspect quality and standards in education and training in Wales. Estyn is responsible for inspecting:
nursery schools and settings that are maintained by, or receive funding from, local authorities
primary schools secondary schools special schools pupil referral units all-age schools independent schools further education independent specialist colleges adult community learning local authority education services for children and young people teacher education and training Welsh for adults work-based learning learning in the justice sector
Estyn also:
provides advice on quality and standards in education and training in Wales to the National Assembly for Wales and others
makes public good practice based on inspection evidence
Every possible care has been taken to ensure that the information in this document is accurate at the time of going to press. Any enquiries or comments regarding this document/publication should be addressed to: Publication Section Estyn Anchor Court Keen Road Cardiff CF24 5JW or by email to [email protected] This and other Estyn publications are available on our website: www.estyn.gov.wales
© Crown Copyright 2019: This report may be re-used free of charge in any format or medium provided that it is re-used accurately and not used in a misleading context. The material must be acknowledged as Crown copyright and the title of the document/publication specified.

Contents Page
Introduction 1 Background 2 Main findings 5 Recommendations 7 Pupils who do not progress from Year 10 to Year 11 8 Characteristics of pupils who do not progress to Year 11 12 Characteristics of schools who have high rates of pupils who do not progress from Year 10 to Year 11
16
Pupils who repeat Year 10 21 The growth in the number of pupils who do not progress to Year 11 and follow EOTAS as main provision
25
Pupils who are educated at home 30 Appendix 1: Evidence base 31 Appendix 2: Questions to support governing body monitoring and evaluation
32
Appendix 3: Methodology for data analysis 33 Appendix 4: Further data analysis 35 Appendix 5: Analysis of data based on pupils who were in Year 10 in 2016-2017
37
Glossary 43 References 45

1
Pupil registration practices
Introduction
This report is written in response to a request for advice from the Welsh Government in the Minister’s annual remit letter to Estyn for 2018-2019. The report examines pupil registration practices in Wales, and in particular:
• a school taking a pupil off its roll completely without the use of a formal permanent exclusion (‘off-rolling’)
• a school changing the registration status of a pupil between the January of Year 10 and the January of Year 11 so that the pupil’s outcomes are not included in the school’s key stage 4 performance data
The reasons for these practices are not explored fully in this report, but may include schools attempting to improve reported Year 11 outcomes data or avoiding permanently excluding a pupil. Inspectors carried out visits to local authorities to explore their monitoring of registration practices and considered a wide range of data to identify patterns and trends in school practices. These are explored in detail in the report. For more information on the evidence base, see Appendix 1.
The report is intended for the Welsh Government, headteachers and staff in schools, governors, local authorities and regional consortia. This report is intended to support local authorities and schools to reflect on their current registration practices. The report also includes questions to support school leaders and governing bodies to evaluate their practice.

2
Pupil registration practices
Background
In January of each year, the Welsh Government collects data on the population of each school through its Pupil Level Annual School Census (PLASC). This data is then validated and subsequently published in the July of that year. Key performance data for schools is based on the cohort of pupils who are in Year 11 on the January PLASC date. At a national level, pupil movement can only therefore be tracked on an annual basis.
Over the last 20 years, there has been an increase in the availability and use of data by schools, and in the last 10 years the use of data for accountability purposes has also increased. In 2009, the Welsh Government introduced the All Wales Core Data Sets (AWCDS). These data sets enabled schools to compare their performance at the end of key stage 4 with national averages, local averages and that of schools with similar levels of deprivation as measured by the percentage of pupils who are eligible for free school meals.
The following timeline shows how the availability of data has increased during the last 20 years:
Increasing amounts of data are available for schools to evaluate their performance – for example local authority comparators, national averages, data from the Welsh
Examinations Database and value added measures, which show how well pupils perform compared to expected levels, based on prior attainment at key stage 2 and key stage 3. These sources provide an indication of how well pupils have progressed in subject areas from one key stage to another. Schools also use national averages and data provided by their local authority and data provided on the RE2 data forms to evaluate outcomes at the end of key stages. At this time, this is information not co-ordinated nationally with schools relying mainly on information provided by local authorities. Therefore, there is variability in the data provided by local authorities and the way that schools use this information to evaluate and plan for improvement. Over time, schools increasingly use this data to evaluate how well pupils are performing at the end of key stage 4. The Welsh Government, schools and middle tier organisations also start to use this data for accountability purposes.
The Welsh Government launches the All Wales Core Data Sets (AWCDS), providing schools with comparative data that took into account the context of the school. This allows schools to compare
their performance with that of ‘similar schools’. The AWCDS also includes questions to support schools with the evaluation of their performance data.
The Welsh Government introduces school banding – a system where schools are placed into one of five bands according to their performance at key stage 4 and attendance data.
3
Pupil registration practices
Schools’ key performance data is published on the ‘My Local School’ website School categorisation is launched, replacing the school banding system. Schools are placed into colour coded support categories, green, yellow, amber or red according to two criteria:
• Step 1 – analysis of the school’s performance at key stage 4 • Step 2 – evaluation of a school’s capacity to self-improve
The colour of the support category would define the level of support that regional consortia would provide and local authorities would agree with the school. Schools categorised as Green tend to have a strong track record of driving improvement and, therefore, need only minimal support whereas schools categorised as red are those that have been performing poorly and have shown that they need greater levels of support in order to improve.
Change in methodology to calculate key stage 4 performance measures – using the Year 11 cohort rather than pupils aged 15 at the start of the academic year
Step 1 of categorisation removed The Welsh Government decides that foundation phase, key stage 2 and key stage 3 data is no longer included in core data packs or available on My Local School. This data is based on teacher
assessment, and in recent years there has been an inflation in pupils’ National Curriculum levels that is making this information increasingly of questionable worth.
These developments supported school self-evaluation and improvement planning by providing a more robust evidence base to identify strengths and priorities for improvement. However, some schools have become too reliant on this information at the expense of other first-hand evidence such as evaluations of pupils’ standards and progress through lesson observations and scrutiny of pupils’ work. Over time, unintended consequences of using a narrow range of data sets have become clear. Some of these consequences include schools feeling undue pressure to perform well in their key stage 4 examinations, sometimes at the expense of providing worthwhile learning experiences in key stage 3 and key stage 4. Another possible consequence is that schools focus too much on examination techniques rather than developing pupils’ skills, knowledge and understanding across a wider curriculum, for example schools entering pupils multiple times for examinations, even when they were not ready or had not finished studying all of the course. These developments have also led to a stronger focus on core subjects, with sometimes less attention placed on other curriculum subjects.

4
Pupil registration practices
The increased availability of comparative data led to school leaders seeing data as a key element of ‘high stakes’ accountability. This led to schools feeling greater pressure to ensure that pupils performed well at the end of key stage 4 as well as using a variety of strategies, some of which were not sustainable to ensure marginal gains. These included the use of revision sessions, multiple entries, collapsed timetables before examinations, increased curricular time for core subjects and target groups to ensure that pupils gained a grade C or above in key subjects areas, particularly mathematics and English/Welsh.
In some schools, these strategies also included entering pupils for qualifications that could potentially boost the school’s performance but not necessarily meet the needs or aspirations of individual pupils. For example, pupils were entered for high tariff equivalent qualifications that make a strong contribution to the school’s performance but did not necessarily match pupils’ interests or ability.
Over the last three years, increasing evidence has come to light that schools may also be using off-rolling or other inappropriate registration practices to improve their performance data at the end of key stage 4. For example, the Welsh Government (2018a) report ‘An analysis of local authority Pupil Registration Practices for learners accessing PRU and EOTAS provision’ reviewed the registration practices of pupils who leave school to be educated other than at school (EOTAS). This report highlighted how some schools were taking advantage of the current regulations regarding dual-registration of pupils to improve their key stage 4 performance data.
5
Pupil registration practices
Main findings
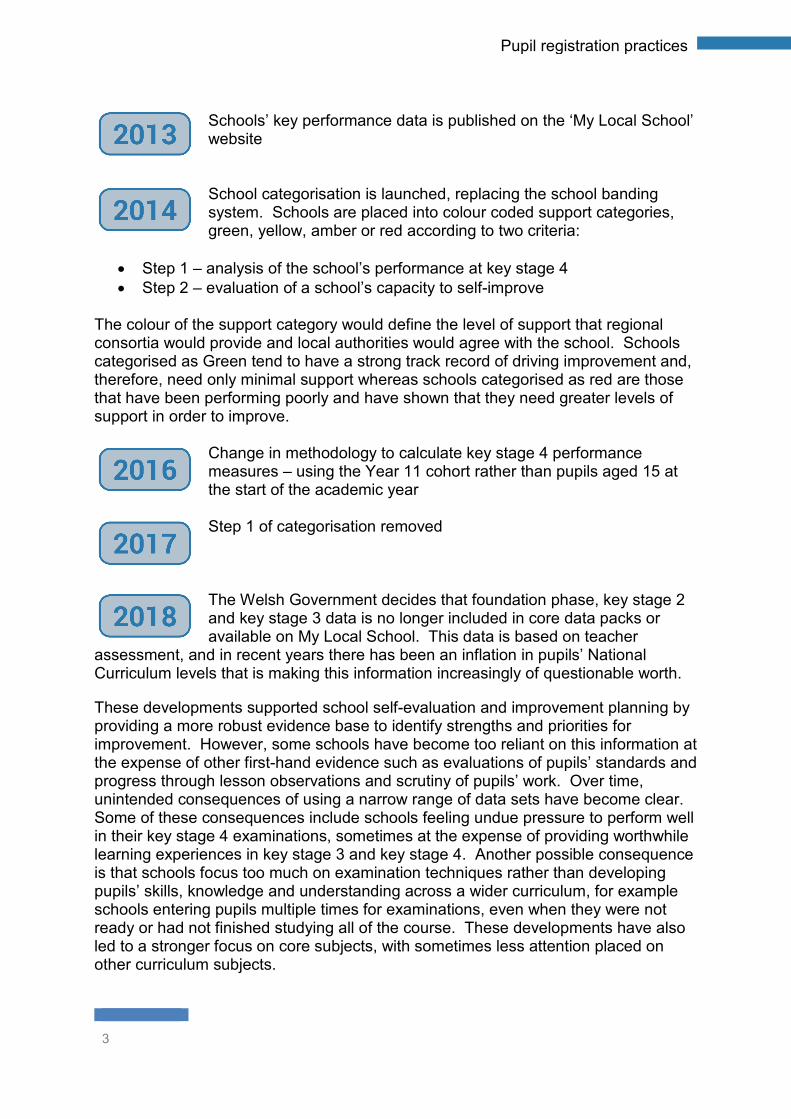
1 During the last six years, the percentage of Year 10 pupils on roll at maintained secondary and all-age schools who do not progress to Year 11 has nearly doubled. During the same period, the percentages of pupils who do not progress between other school years have only risen slightly. In 2017-2018, the percentage of Year 10 pupils who repeated Year 10 is six times greater than the rate seen in 2013-2014. In many instances, pupils that repeat Year 10 do not then progress to Year 11 to finish their key stage 4 studies, but leave school after two years in Year 10. In 2018-2019, there was a reduction in the percentage of pupils repeating Year 10. This change may have been influenced by the introduction of more stringent validation checks when schools submit their PLASC data. However, this rate is still over three times higher than the rate in 2013-2014. This data suggests that a few schools may be enrolling pupils to repeat Year 10 or other school years as a way of moving pupils so that they are not included in the school’s key stage 4 performance data.
2 Over the last six years, the percentage of pupils who are enrolled at a mainstream school in the January of Year 10 who then move to education other than at school (EOTAS) as main provider before the January of Year 11 has nearly doubled. Over the last six years, the total number of pupils (of all ages) who are following EOTAS provision has decreased slightly, but the percentage of these pupils who follow EOTAS provision while remaining ‘dual-main registered’ at a maintained school has more than halved. The percentage of pupils following EOTAS provision with ‘dual-subsidiary registration’ status at a maintained school has tripled in the same period. These latter pupils’ outcomes are not included in the school’s key stage 4 performance data. This data suggests that a few schools may be registering EOTAS pupils as dual-subsidiary so that their data is not included in the school’s performance data. During the last six years, there has also been an increase in the number of pupils in Wales who are being educated at home.
3 Pupils who are eligible for free schools meals, and those that have a statement of special educational needs or access school action plus provision are far more likely not to progress from Year 10 to Year 11 than their peers. For the cohort of pupils who were in Year 10 in 2017-2018, those eligible for free school meals are over three times more likely as those not eligible to not progress directly to Year 11 at a mainstream school. Year 10 pupils who have special educational needs are over four times more likely than those without special educational needs not to progress directly to Year 11 at a mainstream school. Schools that have high levels of pupils who are eligible for free school meals or with special educational needs tend to have higher rates of pupils who do not progress from Year 10 to Year 11.
4 The unintended consequence of the current regulations around the dual registration of EOTAS pupils may be disincentivising schools from being inclusive. There is scope for some schools to exploit loopholes in these regulations in order to improve their key stage 4 performance data. There are also inconsistencies in how well local authorities monitor and challenge off-rolling and other inappropriate registration practices. The frequency of the PLASC data collection and the lack of details

6
Pupil registration practices
regarding the destinations of pupils who leave schools between school years make it difficult to track pupil movement at a national level.

7
Pupil registration practices
Recommendations
Schools and governing bodies should:
R1 ensure that pupils repeat Year 10 only under exceptional circumstances
R2 routinely review registration practices and pupil movements as part of the school’s evaluation and improvement arrangements
R3 ensure that governors monitor pupil movements between Years 10 and 11
Local authorities should:
R4 monitor the registration practices of schools to provide assurance that schools are always acting in the best interests of individual pupils
R5 ensure that both local authorities and schools have clear criteria and protocols for allowing schools to register pupils as repeating Year 10
R6 monitor and investigate any instances where pupils are repeating Year 10 or progressing from Year 10 into a school year other than Year 10 or Year 11
The Welsh Government should:
R7 review the registration of EOTAS pupils and consider using destination data to measure the effectiveness of EOTAS provision
R8 work with local authorities to set up databases of compulsory age pupils in their area
R9 review arrangements for PLASC to ensure greater transparency of pupil movement

8
Pupil registration practices
Pupils who do not progress from Year 10 to Year 11
5 To support this report, data analysis has been carried out using the methodology outlined in Appendix 3.
Analysis of data for progression of pupils between Year 10 and Year 11
6 During the last six years, there has been an increase in the percentage of pupils who do not progress directly from Year 10 to Year 11 to complete their education at a maintained school in Wales (Figure 1). In 2013-2014, there were 780 pupils who had not progressed from Year 10 to Year 11. This represented 2.3% of the previous year’s Year 10 cohort. By 2017-2018, the number of pupils who had not progressed to Year 11 had increased to 1,352, equivalent to 4.4% of the previous year’s Year 10 cohort and nearly double the percentage in 2013-2014. In 2018-2019, there was a slight decrease in the number of pupils to 1,298, which represents 4.2% of the previous year’s Year 10 cohort.
Figure 1: Percentage of pupils not progressing from Year 10 to Year 11, 2013-2014 to 2018-2019
Source: Pupil Level Annual School Census (PLASC)
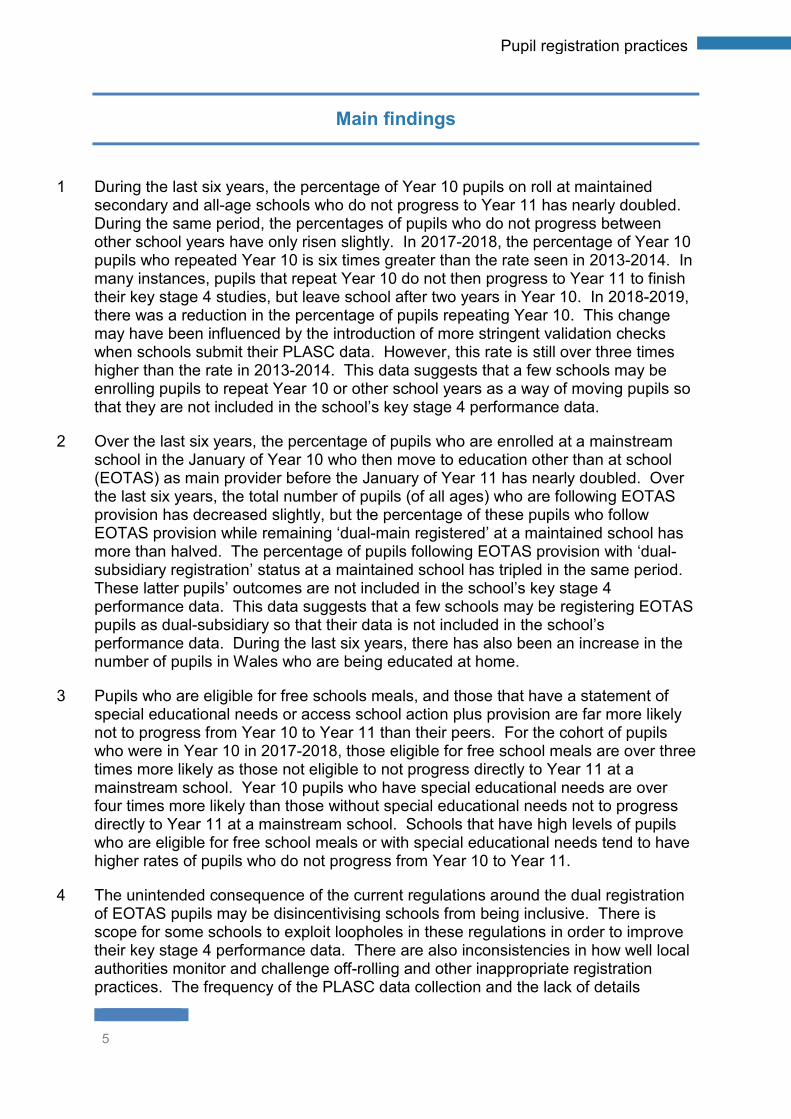
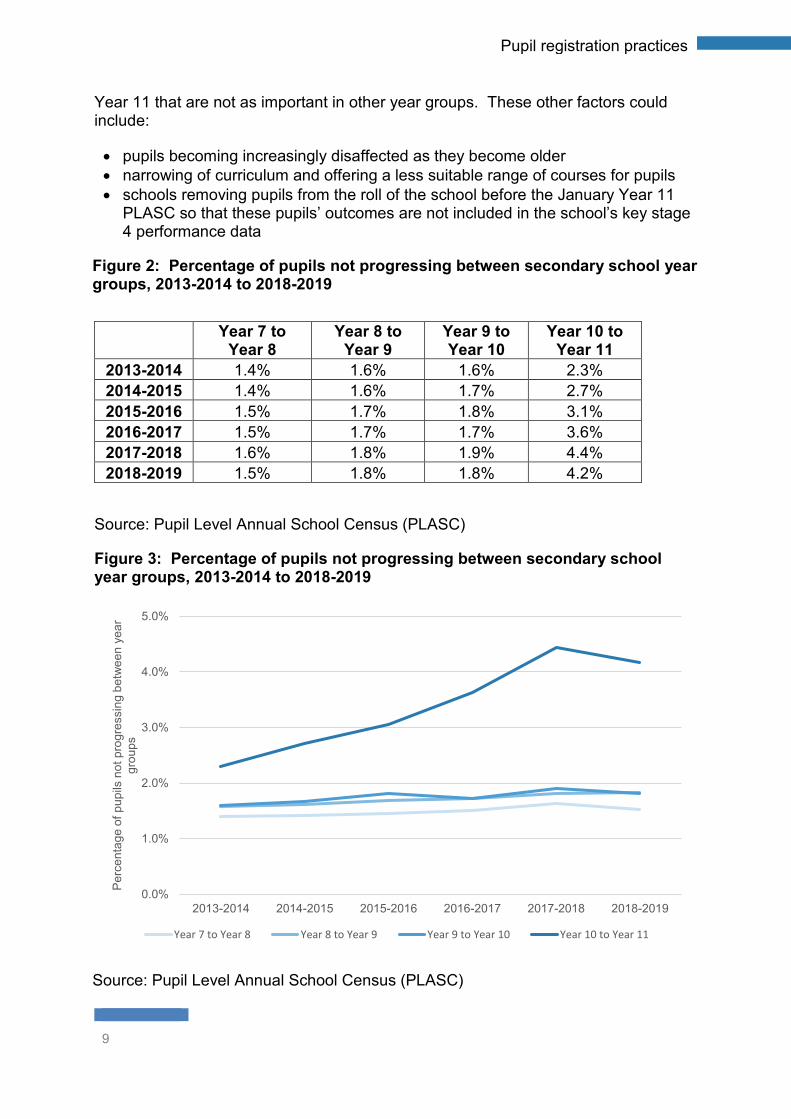
7 Figures 2 and 3 show that when the progression rates across a number of school years are compared, the trend seen in progression rates between Year 10 and Year 11 is not consistent with that between other school years. There has been a slight rise in the levels of pupils who do not progress to the next school year for each of Year 7 to Year 8, Year 8 to Year 9 and Year 9 to Year 10. Given that levels of pupils who do not progress into the next school year are lower in other school years, this suggests that there are factors that impact on pupil progression between Year 10 and
2.3%
2.7%3.1%
3.6%
4.4%4.2%
0.0%
0.5%
1.0%
1.5%
2.0%
2.5%
3.0%
3.5%
4.0%
4.5%
5.0%
2013-2014 2014-2015 2015-2016 2016-2017 2017-2018 2018-2019
Perc
enta
ge o
f pup
ils n
ot p
rogr
essin
g fr
om
Year
10
to Y
ear 1
1
9
Pupil registration practices
Year 11 that are not as important in other year groups. These other factors could include:
• pupils becoming increasingly disaffected as they become older • narrowing of curriculum and offering a less suitable range of courses for pupils • schools removing pupils from the roll of the school before the January Year 11
PLASC so that these pupils’ outcomes are not included in the school’s key stage 4 performance data
Figure 2: Percentage of pupils not progressing between secondary school year groups, 2013-2014 to 2018-2019
Source: Pupil Level Annual School Census (PLASC)
Figure 3: Percentage of pupils not progressing between secondary school year groups, 2013-2014 to 2018-2019
Source: Pupil Level Annual School Census (PLASC)
0.0%
1.0%
2.0%
3.0%
4.0%
5.0%
2013-2014 2014-2015 2015-2016 2016-2017 2017-2018 2018-2019
Perc
enta
ge o
f pup
ils n
ot p
rogr
essi
ng b
etw
een
year
gr
oups
Year 7 to Year 8 Year 8 to Year 9 Year 9 to Year 10 Year 10 to Year 11
Year 7 to
Year 8 Year 8 to
Year 9 Year 9 to Year 10
Year 10 to Year 11
2013-2014 1.4% 1.6% 1.6% 2.3% 2014-2015 1.4% 1.6% 1.7% 2.7% 2015-2016 1.5% 1.7% 1.8% 3.1% 2016-2017 1.5% 1.7% 1.7% 3.6% 2017-2018 1.6% 1.8% 1.9% 4.4% 2018-2019 1.5% 1.8% 1.8% 4.2%

10
Pupil registration practices
Analysis of pupil progression between Year 10 and Year 11 by category
8 For the purpose of this report, the destinations of the pupils who do not progress from Year 10 to Year 11 have been grouped according to the categories defined in Appendix 3.
9 Figures 4 and 5 show that the percentage of pupils who repeat Year 10 has increased over the last five years. In 2017-2018, this figure is six times the corresponding figure for 2013-2014. In 2013-2014, 31 pupils repeated Year 10. By 2017-2018, this figure had increased to 168 pupils. In 2018-2019, this figure fell to 91 pupils, representing 0.29% of the previous Year’s Year 10 cohort. This may have been influenced by the introduction by the Welsh Government of more stringent validation checks when schools submit their PLASC data. This group of pupils will be looked at in detail in the section ‘Pupils who repeat Year 10’.
10 The proportion of pupils who move to EOTAS as their main education provision has also increased. This proportion has nearly doubled since 2013-2014. This group of pupils will be looked at in detail in the section ‘The growth in the number of pupils who do not progress to Year 11 and follow EOTAS as their main provision’.
Figure 4: Destinations of pupils after Year 10, 2013-2014 to 2018-2019
Source: Pupil Level Annual School Census (PLASC) and EOTAS Pupil Census
Percentage of pupils who:
Academic Year
Year 10 cohort
(previous year)
Progressed to Year 11
Repeated Year 10
Were placed
in a year
group other
than 10 or 11
Moved to EOTAS as Main
provision
Could not be
matched to a
destination
Did not progress to Year 11 (all
destinations)
2013-2014 34,028 97.71% 0.09% 0.05% 0.88% 1.27% 2.29% 2014-2015 32,932 97.29% 0.07% 0.05% 1.14% 1.45% 2.71% 2015-2016 31,851 96.94% 0.30% 0.06% 1.35% 1.34% 3.06% 2016-2017 31,334 96.38% 0.50% 0.07% 1.18% 1.87% 3.62% 2017-2018 30,407 95.55% 0.55% 0.12% 1.56% 2.21% 4.45% 2018-2019 31,183 95.84% 0.29% 0.06% 1.66% 2.15% 4.16%

11
Pupil registration practices
Figure 5: Destinations of pupils after Year 10 who did not progress to Year 11 at a mainstream school, 2013-2014 to 2018-2019
Source: Pupil Level Annual School Census (PLASC) and EOTAS Pupil Census
11 Figure 4 shows that there has also been an increase in the percentage of pupils who cannot be matched to a destination. This may include:
• pupils who have moved abroad • pupils who have moved elsewhere in the United Kingdom • pupils who have passed away • pupils who have stopped attending school and despite the efforts of the school
and local authority to find their destination; this is still unknown • pupils whose parents or carers have elected to home educate their child
12 Of the 669 pupils who could not be matched to a destination in 2018-2019, 120 had repeated Year 10 in the previous year. The data suggests that these pupils subsequently left the school after repeating Year 10, rather than staying on at school to complete Year 11. As a result, these pupils may not complete their courses of study or gain an appropriate range of qualifications to enable them to progress on to further study, training or employment. This group of pupils accounts for just under one fifth of Year 10 pupils who could not be matched to a destination.
0.0%
0.5%
1.0%
1.5%
2.0%
2.5%
2013-2014 2014-2015 2015-2016 2016-2017 2017-2018 2018-2019
Perc
enta
ge o
f pup
ils
Repeated Year 10 Were placed in a year group other than 10 or 11
Moved to EOTAS as Main provision Could not be matched to a destination

12
Pupil registration practices
Characteristics of pupils who do not progress to Year 11
13 In this section, we identify possible links between the characteristics of pupils and levels of progression between Year 10 and Year 11. Of those pupils who were in Year 10 in maintained secondary and all-age schools at the time of the January 2017 PLASC collection, 4.4% did not appear in Year 11 at the January 2018 PLASC collection. The corresponding figure for those in Year 10 in 2018 was 4.2%. Analysis of data based on pupils who were in Year 10 in 2016-2017 is available in Appendix 5.
Gender
14 Figure 6a shows that, in 2018-2019, the percentage of boys who did not progress from Year 10 to Year 11 was higher than the corresponding proportion for girls. This is especially true for pupils who leave school to follow EOTAS provision, where the proportion of boys was 1.6 times higher than that of girls in 2018-2019 and 1.8 times higher in 2017-2018.
Figure 6a: Destinations of pupils after Year 10, by gender, 2018-2019
Source: Pupil Level Annual School Census (PLASC) and EOTAS Pupil Census
Pupils eligible for free school meals (eFSM)
15 Over the last five years, there has been an increase in the percentage of pupils who are eligible for free school meals that do not progress to Year 11 at a mainstream school (Figure 7). In 2017-2018, the percentage of Year 10 pupils eligible for free school meals who did not progress to Year 11 was double the rate seen in 2013-2014 and, while this rate fell in 2018-2019, it was still nearly double the rate seen in 2013-2014.
16 During the same period, outcomes for pupils who are eligible for free school meals have improved generally at a national level. Up until 2016, the outcomes of pupils eligible for free school meals were part of the criteria for categorisation of schools. Outcomes for pupils eligible for free school meals have improved at a school level over recent years, although the data in Figure 7 suggests that in some instances this may be because these pupils are not progressing to Year 11 and therefore not included in the school’s key stage 4 performance data.
Percentage in 2019 who
Year 10 Cohort
(previous year)
Repeated Year 10 or were placed in a year group other
than 10 or 11
Moved to EOTAS as
main provision
Could not be matched
to a destination
Did not progress to Year 11 ( All destinations)
All pupils 31,183 0.36% 1.66% 2.15% 4.16% Girls 15,292 0.39% 1.29% 2.12% 3.79% Boys 15,891 0.33% 2.02% 2.17% 4.52%

13
Pupil registration practices
Figure 7: Destinations of pupils eligible for free school meals after Year 10, 2013-2014 to 2018-2019
Source: Pupil Level Annual School Census (PLASC) and EOTAS Pupil Census
17 Around 10% of pupils who were in Year 10 in both 2016-2017 and 2017-2018 and were eligible for free school meals did not progress directly to Year 11 at a mainstream school in Wales (Figure 7). Figures 8a and 8b (see Appendix 5) show that pupils eligible for free school meals were over three times more likely not to progress to Year 11 than their peers. The same group of pupils are also nearly three times more likely than their peers to leave the school with their destination being unknown or to repeat Year 10 or be placed in a a year group other than 10 or 11. Pupils eligible for free school meals are also around three and a half times more likely than their peers to transfer to EOTAS as their main provision between Year 10 and Year 11.
Figure 8a: Destinations of pupils after Year 10, by free school meal eligibility, 2018-2019
Source: Pupil Level Annual School Census (PLASC) and EOTAS Pupil Census
Percentage of Year 10 pupils eligible
for free school meals (eFSM) who
Academic Year
Year 10 Cohort
(previous year)
Year 10 Cohort
(previous year) - FSM
eligible
Repeated Year 10 or
were placed in a year
group other than 10 or 11
Moved to EOTAS as
main provision
Could not be matched
to a destination
Did not progress to Year 11 (All
destinations)
2013-2014 34,028 5,721 0.23% 2.36% 2.62% 5.21% 2014-2015 32,932 5,460 0.16% 3.02% 3.19% 6.37% 2015-2016 31,851 5,309 0.87% 3.58% 2.60% 7.04% 2016-2017 31,334 5,220 1.84% 2.76% 3.72% 8.31% 2017-2018 30,407 5,042 1.61% 4.20% 4.88% 10.69% 2018-2019 31,183 4,890 0.74% 4.25% 4.64% 9.63%
Percentage in 2019 who
Year 10 Cohort
(previousyear)
Repeated Year 10 or were placed in a year group other
than 10 or 11
Moved to EOTAS as
main provision
Could not be matched
to a destination
Did not progress to Year 11 (All destinations)
All pupils 31,183 0.36% 1.66% 2.15% 4.16% Not eligible for FSM 26,293 0.29% 1.18% 1.68% 3.15%
Eligible for FSM 4,890 0.74% 4.25% 4.64% 9.63%

14
Pupil registration practices
Pupils who have special educational needs
18 Figure 9a shows that around 10% of pupils with special educational needs who were in Year 10 in 2017-2018 did not progress directly to Year 11 at a mainstream school in Wales. Pupils with special educational needs are over four times more likely than their peers not to remain in mainstream education between Year 10 and Year 11. Pupils with special educational needs are over three times more likely to repeat Year 10 or be placed in a year group other than Year 10 or Year 11, and over seven times more likely to leave school to be educated other than at school than those pupils without special educational needs.
Figure 9a: Destinations of pupils after Year 10, by special educational needs, 2018-2019
Source: Pupil Level Annual School Census (PLASC) and EOTAS Pupil Census
Links between attendance and rates of pupils who do not progress from Year 10 to Year 11
19 The data in figure 10a shows that, although there is a tenuous link between high rates of attendance and likelihood of progression to Year 11, a substantial proportion of pupils whose attendance was better than the persistent absence threshold did not progress to Year 11. The same conclusion can be drawn from the data for 2016-2017 (see figure 10b in Appendix 5).
20 One reason that pupils repeat Year 10 is that they missed a large proportion of their Year 10 studies the first time. The attendance of the 91 pupils that repeated Year 10 in 2018-2019 shows that only 25 (27.5%) of these pupils had less than 70% attendance in 2017-2018, and only a few of these pupils were absent for more than half of the school year. This suggests that, although regular attendance is a factor, there are likely to be other more influential factors impacting on decisions taken for pupils to repeat Year 10.
Percentage in 2019 who
Year 10 Cohort
(previous year)
Repeated Year 10 or were in a year group other than
10 or 11
Moved to EOTAS as
main provision
Could not be matched
to a destination
Did not progress to Year 11 (All
destinations) All pupils 31,183 0.36% 1.66% 2.15% 4.16% Pupils with no SEN 23,640 0.23% 0.65% 1.47% 2.34%
Pupils with SEN 7,543 0.76% 4.84% 4.27% 9.86%

15
Pupil registration practices
Figure 10a: Attendance rates for the 2017-2018 academic year of pupils not progressing from Year 10 to Year 11 in 2018-2019
Source: Pupil Level Annual School Census (PLASC), EOTAS Pupil Census and Pupils’ Attendance Record
0%
10%
20%
30%
40%
50%
60%
70%
80%
90%
100%
Over 50%attendance
Over 70%attendance
Over 80%attendance
Over 90%attendance
100%attendance
Perc
enta
ge o
f pup
ils in
eac
h at
tend
ance
cat
egor
y no
t pro
gres
sing
from
Yea
r 10
to Y
ear 1
1
Pupils repeating Year 10 All pupils not progressing to Year 11
16
Pupil registration practices
Characteristics of schools with high rates of pupils not progressing from Year 10 to Year 11
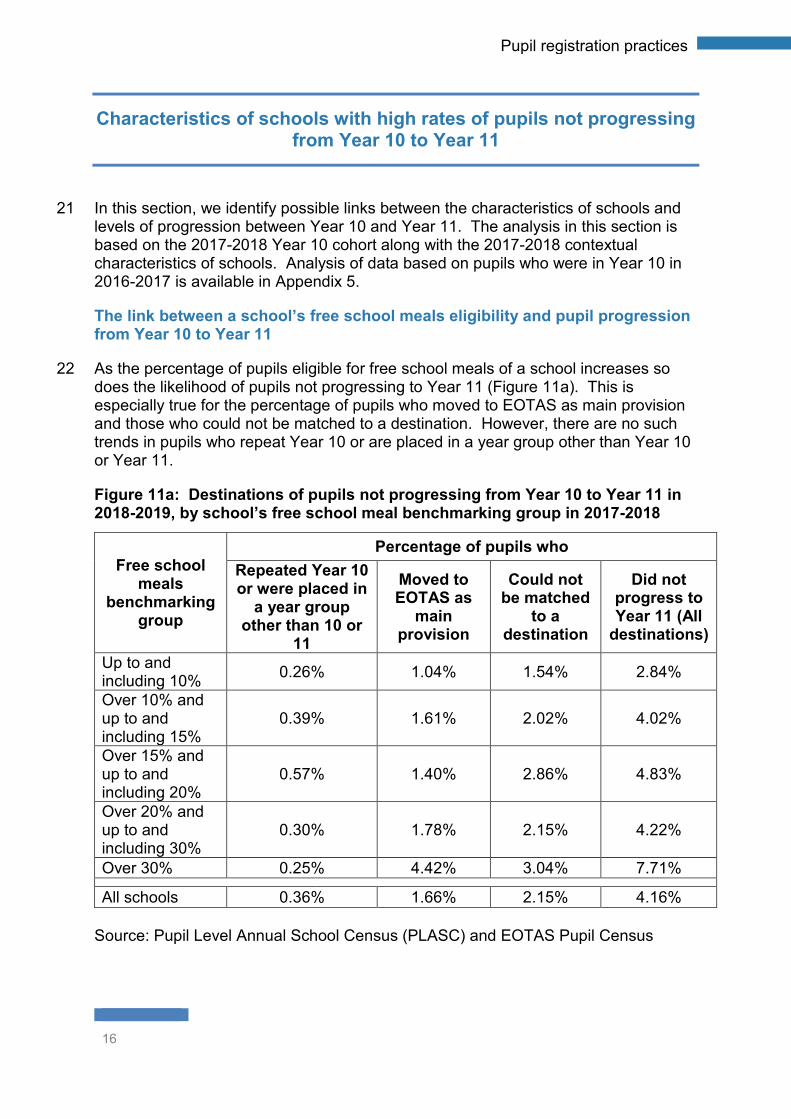
21 In this section, we identify possible links between the characteristics of schools and levels of progression between Year 10 and Year 11. The analysis in this section is based on the 2017-2018 Year 10 cohort along with the 2017-2018 contextual characteristics of schools. Analysis of data based on pupils who were in Year 10 in 2016-2017 is available in Appendix 5.
The link between a school’s free school meals eligibility and pupil progression from Year 10 to Year 11
22 As the percentage of pupils eligible for free school meals of a school increases so does the likelihood of pupils not progressing to Year 11 (Figure 11a). This is especially true for the percentage of pupils who moved to EOTAS as main provision and those who could not be matched to a destination. However, there are no such trends in pupils who repeat Year 10 or are placed in a year group other than Year 10 or Year 11.
Figure 11a: Destinations of pupils not progressing from Year 10 to Year 11 in 2018-2019, by school’s free school meal benchmarking group in 2017-2018
Source: Pupil Level Annual School Census (PLASC) and EOTAS Pupil Census
Free school meals
benchmarking group
Percentage of pupils who Repeated Year 10 or were placed in
a year group other than 10 or
11
Moved to EOTAS as
main provision
Could not be matched
to a destination
Did not progress to Year 11 (All
destinations) Up to and including 10% 0.26% 1.04% 1.54% 2.84%
Over 10% and up to and including 15%
0.39% 1.61% 2.02% 4.02%
Over 15% and up to and including 20%
0.57% 1.40% 2.86% 4.83%
Over 20% and up to and including 30%
0.30% 1.78% 2.15% 4.22%
Over 30% 0.25% 4.42% 3.04% 7.71% All schools 0.36% 1.66% 2.15% 4.16%
17
Pupil registration practices
The link between the proportion of pupils with special educational needs and levels of progression from Year 10 to Year 11
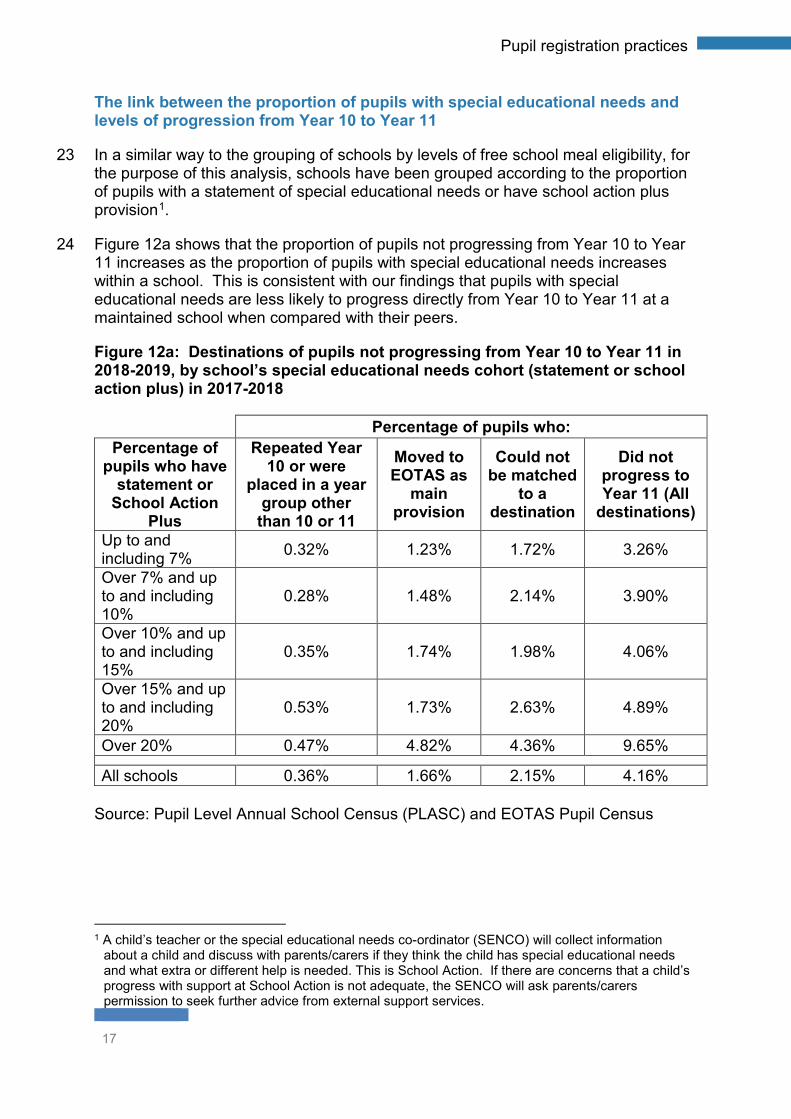
23 In a similar way to the grouping of schools by levels of free school meal eligibility, for the purpose of this analysis, schools have been grouped according to the proportion of pupils with a statement of special educational needs or have school action plus provision1.
24 Figure 12a shows that the proportion of pupils not progressing from Year 10 to Year 11 increases as the proportion of pupils with special educational needs increases within a school. This is consistent with our findings that pupils with special educational needs are less likely to progress directly from Year 10 to Year 11 at a maintained school when compared with their peers.
Figure 12a: Destinations of pupils not progressing from Year 10 to Year 11 in 2018-2019, by school’s special educational needs cohort (statement or school action plus) in 2017-2018
Source: Pupil Level Annual School Census (PLASC) and EOTAS Pupil Census
1 A child’s teacher or the special educational needs co-ordinator (SENCO) will collect information
about a child and discuss with parents/carers if they think the child has special educational needs and what extra or different help is needed. This is School Action. If there are concerns that a child’s progress with support at School Action is not adequate, the SENCO will ask parents/carers permission to seek further advice from external support services.
Percentage of pupils who: Percentage of
pupils who have statement or
School Action Plus
Repeated Year 10 or were
placed in a year group other
than 10 or 11
Moved to EOTAS as
main provision
Could not be matched
to a destination
Did not progress to Year 11 (All
destinations) Up to and including 7% 0.32% 1.23% 1.72% 3.26%
Over 7% and up to and including 10%
0.28% 1.48% 2.14% 3.90%
Over 10% and up to and including 15%
0.35% 1.74% 1.98% 4.06%
Over 15% and up to and including 20%
0.53% 1.73% 2.63% 4.89%
Over 20% 0.47% 4.82% 4.36% 9.65% All schools 0.36% 1.66% 2.15% 4.16%

18
Pupil registration practices
The link between the language medium of the school and levels of progression from Year 10 to Year 11
25 For the purpose of this analysis, schools have been categorised by language medium according to the criteria outlined in Appendix 3.
26 Levels of pupils not progressing from Year 10 to Year 11 are lowest in schools where the provision is predominantly Welsh-medium (Figure 13a). This is especially true for the rate of pupils who transfer to EOTAS as main provision. In these schools, 97.6% of Year 10 pupils continued their education in Year 11 at a mainstream school. This trend could be explained by the fact that these schools generally have lower levels of free school meals eligibility and lower levels of pupils with special educational needs.
Figure 13a: Destinations of pupils not progressing from Year 10 to Year 11 in 2018-2019, by school’s language medium in 2017-2018
Source: Pupil Level Annual School Census (PLASC) and EOTAS Pupil Census
27 In Estyn’s (2016, p.4) thematic report on education other than at school we noted that there are
‘extremely limited opportunities to continue their learning in Welsh when they start EOTAS’.
28 This may also be a contributory factor to the fact that fewer pupils leave those schools that are predominantly Welsh-medium between Year 10 and Year 11. As there is more limited EOTAS provision available through the medium of Welsh, these schools have no choice other than to ensure that there is suitable provision available at the school.
29 Rates of pupils not progressing from Year 10 to Year 11 are highest in bilingual schools. This group of schools is small and this trend may not be statistically significant.
Percentage of pupils who:
Repeated Year 10 or were
placed in a year group other
than 10 or 11
Moved to EOTAS as
main provision
Could not be
matched to a
destination
Did not progress to Year 11 (All
destinations) Predominantly Welsh-medium (39 schools)
0.43% 0.87% 1.13% 2.43%
Bilingual (24 schools) 0.87% 1.37% 3.61% 5.85%
Predominantly English-medium (145 schools)
0.27% 1.84% 2.13% 4.24%
All schools 0.36% 1.66% 2.15% 4.16%

19
Pupil registration practices
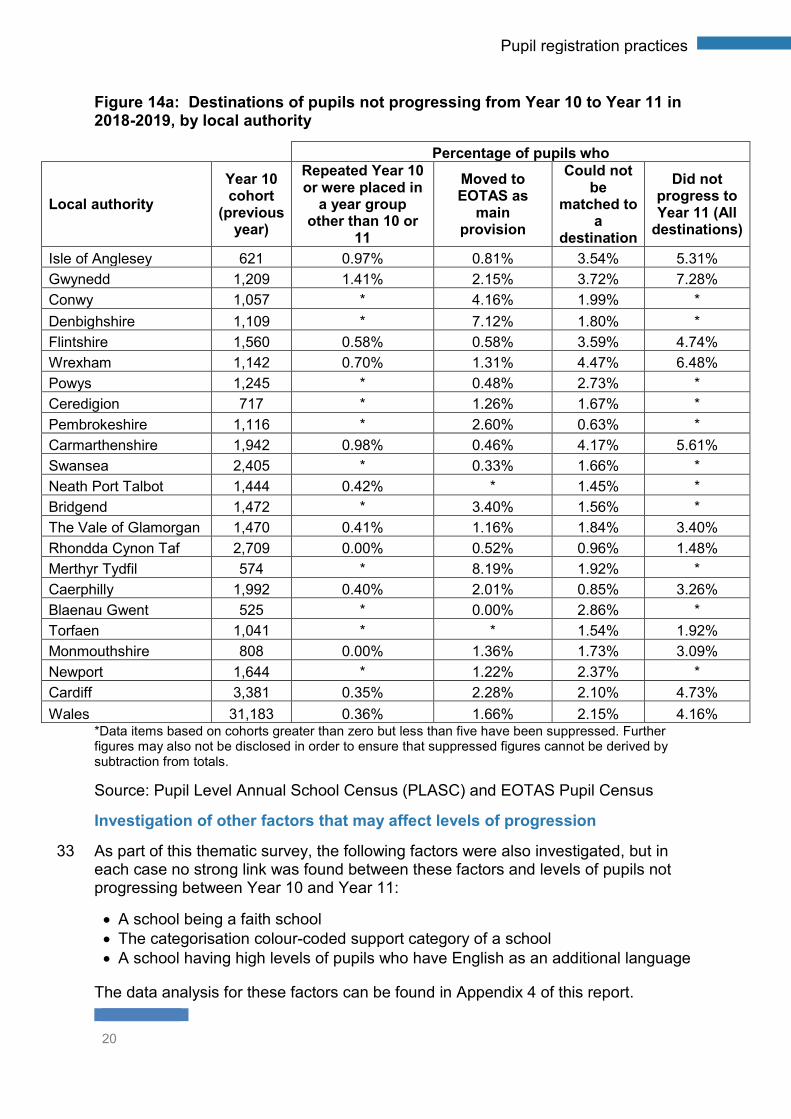
Geographical patterns
30 When the progression data is considered in the three categories outlined in figure 14a (and figure 14b in Appendix 5) there is a geographical trend. Of the pupils who repeated Year 10 or were placed in a year group other than 10 or 11, around half were in a few local authorities. Overall, arrangements to monitor pupil movement in a few local authorities have not been robust enough.
31 Of the pupils who move to EOTAS as their main provider, nearly half of the local authorities had less than 1% of their Year 10 pupils moving to EOTAS as main provider in 2018-2019. A few local authorities had over 3% of their Year 10 pupils transferring to EOTAS as main provision. The rates at these local authorities are more than double the national average of 1.7%. A very few authorities had over 7% of their pupils transferring to EOTAS.
32 Analysis of pupils who could not be matched to a destination did not identify any clear trends based on a local authority basis. Rates in urban local authorities, where the population is more transient, are no higher than those at other local authorities. However, at a school level, rates of pupils who could not be matched to a destination were higher than the national average in a number of schools located closer to the border with England, where pupils could have moved to a school in England to complete their education.
20
Pupil registration practices
Figure 14a: Destinations of pupils not progressing from Year 10 to Year 11 in 2018-2019, by local authority
Percentage of pupils who
Local authority Year 10 cohort
(previous year)
Repeated Year 10 or were placed in
a year group other than 10 or
11
Moved to EOTAS as
main provision
Could not be
matched to a
destination
Did not progress to Year 11 (All
destinations)
Isle of Anglesey 621 0.97% 0.81% 3.54% 5.31% Gwynedd 1,209 1.41% 2.15% 3.72% 7.28% Conwy 1,057 * 4.16% 1.99% * Denbighshire 1,109 * 7.12% 1.80% * Flintshire 1,560 0.58% 0.58% 3.59% 4.74% Wrexham 1,142 0.70% 1.31% 4.47% 6.48% Powys 1,245 * 0.48% 2.73% * Ceredigion 717 * 1.26% 1.67% * Pembrokeshire 1,116 * 2.60% 0.63% * Carmarthenshire 1,942 0.98% 0.46% 4.17% 5.61% Swansea 2,405 * 0.33% 1.66% * Neath Port Talbot 1,444 0.42% * 1.45% * Bridgend 1,472 * 3.40% 1.56% * The Vale of Glamorgan 1,470 0.41% 1.16% 1.84% 3.40% Rhondda Cynon Taf 2,709 0.00% 0.52% 0.96% 1.48% Merthyr Tydfil 574 * 8.19% 1.92% * Caerphilly 1,992 0.40% 2.01% 0.85% 3.26% Blaenau Gwent 525 * 0.00% 2.86% * Torfaen 1,041 * * 1.54% 1.92% Monmouthshire 808 0.00% 1.36% 1.73% 3.09% Newport 1,644 * 1.22% 2.37% * Cardiff 3,381 0.35% 2.28% 2.10% 4.73% Wales 31,183 0.36% 1.66% 2.15% 4.16%
*Data items based on cohorts greater than zero but less than five have been suppressed. Further figures may also not be disclosed in order to ensure that suppressed figures cannot be derived by subtraction from totals.
Source: Pupil Level Annual School Census (PLASC) and EOTAS Pupil Census
Investigation of other factors that may affect levels of progression
33 As part of this thematic survey, the following factors were also investigated, but in each case no strong link was found between these factors and levels of pupils not progressing between Year 10 and Year 11:
• A school being a faith school • The categorisation colour-coded support category of a school • A school having high levels of pupils who have English as an additional language
The data analysis for these factors can be found in Appendix 4 of this report.
21
Pupil registration practices
Pupils who repeat Year 10
34 Until 2014-2015, all key stage 4 performance measures were based on the cohort of pupils who were 15 years old on the 1 September of that school year. Since 2015-2016, performance data calculations reference the Year 11 cohort collected during the January PLASC return. This change was made to reflect the fact that some pupils who were 15 years old on September 1 were not in Year 11 for genuine reasons. These reasons include:
• pupils who were born late during the summer or pupils with special educational needs who spent an extra year in their primary school
• pupils who had been absent due to medical or other grounds and moved back a school year to support their learning
• pupils who came from abroad and stayed behind a year to improve their language skills
Findings from data analysis
35 Figures 4 and 5 show that, up until 2014-2015, the number of pupils who repeated Year 10 was very small. However, between 2015-2016 and 2017-2018, there was a growth in the number of pupils who repeat Year 10. The increase in these rates has coincided with the change to the cohort of pupils used to calculate school data and suggests that some schools are registering a very few pupils as repeating Year 10 (or placing them in another school year) to exclude their outcomes from the school’s reported data. In 2017-2018, the percentage of pupils who repeated Year 10 was six times greater than the rate seen in 2013-2014. In 2018-2019, the percentage of pupils repeating Year 10 fell. This may have been influenced by the introduction of more stringent validation checks when schools submit their PLASC data. However, this rate is still over three times higher than the rate in 2013-2014.
36 Of the 91 pupils that repeated Year 10 in 2018-2019, over half of these pupils were at a very few schools. Of the pupils who were placed in an year group other than Year 10 or 11, all of these pupils were in a very few schools.
37 In general, many pupils who repeat Year 10 do not progress to Year 11 to complete their education. Out of the 168 pupils who appeared on the 2018 PLASC as having repeated Year 10 in 2017-2018, only 38 of these pupils appeared on the 2019 PLASC as having progressed to Year 11. Seventy-seven per cent of the pupils who repeated Year 10 did not progress to Year 11. As a result, pupils may not complete their courses of study or gain an appropriate range of qualifications to enable them to progress on to further study, training or employment.
Patterns in GCSE entries for pupils who repeat Year 10
38 In 2018, the rules for multiple entries were changed to consider a pupil’s first sitting of any qualification when calculating a school’s key stage 4 performance measures. The cohort of Year 11 pupils who will finish their compulsory education in June of 2019 is the first cohort of pupils to be affected by this change. Figure 15 shows that

22
Pupil registration practices
the total number of summer GCSE entries for pupils who were Year 10 or younger decreased by 77.4% from 63,310 to 14,290. For all Year 10 pupils in Wales in 2019, the average number of GCSE entries per pupil was less than half a GCSE.
Figure 15: Total number of summer GCSE entries by age, 2014 - 2019
2014 2015 2016 2017 2018 2019(p) Total GCSE Entries 317,980 309,190 303,620 334,100 290,640 303,635 Year 10 or younger 46,500 46,710 44,900 63,310 14,290 14,865 Number of pupils (Year 10) a 33,570 32,527 31,967 31,085 31,914 32,231 Average number of GCSE Entries 1.4 1.4 1.4 2.0 0.4 0.5
(p) - Provisional
aYear 10 cohorts presented here differ from those presented in this report as they include pupils in maintained special schools and EOTAS pupils. Year 10 pupils in independent schools are not included.
Source: Qualifications Wales (2019a, 2019b, p.7)
39 Analysis of data suggests that the majority of the pupils who were repeating Year 10 were not doing so for genuine reasons. Analysis of the 168 pupils who repeated Year 10 in 2017-2018 shows that 108 of these pupils were entered for GCSEs at the end of the repeated Year 10. The average number of entries for these 108 pupils was 4.3. This figure is considerably higher than 0.4, which was the number of entries for the average Year 10 pupil in 2018. This analysis suggests that some schools are using this as a mechanism where some pupils follow a Year 11 timetable, but are registered in Year 10 so that their outcomes do not contribute to the school’s key performance measures.
Local authority monitoring arrangements of pupils repeating Year 10
40 All of the local authorities visited as part of this thematic report had suitable policies and protocols to review and monitor pupil movement. These included guidance that states clearly the circumstances where schools are permitted to place a pupil in a year group that did not corresponded with their year of birth. All local authority policies allowed headteachers to move pupils to another year group where there were genuine reasons to do so. However, there are inconsistencies in how well local authorities monitor this practice.
41 A minority of the local authorities visited had rigorous monitoring arrangements and gave examples of where they had identified pupils who were repeating Year 10, and had explored with individual schools the reasons for this. The investigation process often included analysis of the pupil’s attendance and scrutiny of the pupil’s school timetable. In the few local authorities who monitor diligently schools’ registration practices, there has been a positive impact on decisions related to pupils repeating Year 10. In 2017-2018, these local authorities had low levels of pupils who were repeating Year 10, and the number of examination entries for these pupils was also low, suggesting that the pupils who were repeating Year 10 were doing so for genuine reasons and that intervention by the local authority had impacted on practices.

23
Pupil registration practices
Case study 1: City and County of Swansea Council
Information about the provider
The City and County of Swansea Council serves the urban area of Swansea, the neighbouring villages and the Gower peninsula. The education department is responsible for overseeing the education of around 36,000 pupils and the number of pupil movements each year runs into thousands. Nineteen point five per cent of secondary school pupils are eligible for free school meals, which is higher than the national average of 16.6%.
Context and background to the practice
There are effective arrangements in place to monitor pupil movement at The City and County of Swansea.
Description of activity/strategy
The local authority uses data regarding attendance, exclusions, additional learning needs, numeracy, reading, FSM, Welsh Index of Multiple Deprivation, looked after child, English as an additional language (EAL) stage of English acquisition and school moves in the last two years to create a Vulnerable Assessment Profile (VAP). This register is updated annually and is used to monitor the progress of these pupils from year to year.
The authority works with the school and governor unit to review applications for transfers between schools. It has protocols that make clear to schools the requirement to transfer pupil-level information when a pupil transfers to another education provider. Over several years, the authority has ensured that this happens effectively and efficiently. Consequently, new providers are fully aware of a pupil’s circumstances, and pupils moving between schools can settle quickly into their new setting.
The authority’s data systems are updated daily from school-level systems. Pupils’ attendance records and timetables are analysed to ensure that schools are not off-rolling pupils. Schools are asked to state their reasons for changing the school year of a pupil. Where the local authority is satisfied that this practice is in the best interest of pupils, a note is put on the system so that this matter does not need to be re-investigated when the school submits its PLASC. Where the authority is not satisfied, it liaises with schools to ensure that they register pupils in the correct school year.
The authority has robust measures in place to monitor schools’ PLASC submissions. This involves pre-PLASC system checks and three checking stages after submission that ensure that schools are always reporting accurate information.
Where pupils are dual-registered, they are registered dual-main with the
24
Pupil registration practices
provider where pupils receive the majority of their education. Attendance records are scrutinised to ensure that the registration of these pupils is accurate.
Impact on provision and standards
Although Swansea local authority has the sixth highest free school meals percentage of the 22 authorities in Wales, over the last three years Swansea has achieved the fifth highest capped points score and the fifth highest percentage of pupils who achieve the level 2 including Welsh or English and mathematics threshold.
In 2019, Swansea’s schools have very low numbers of pupils who repeated Year 10, and very low rates of Year 10 pupils who transfer to EOTAS as the main provider during their key stage 4 studies.
42 In a few local authorities, processes for monitoring instances where pupils are not in the school year that corresponds with their year of birth are not rigorous enough. As a result, schools in these local authorities have higher than average numbers of pupils who are not in the school year that corresponded to their year of birth.

25
Pupil registration practices
The growth in the number of pupils who do not progress to Year 11 and follow EOTAS as main provision
43 Pupils who receive their education other than at school (EOTAS) can be single registered with the EOTAS provider and not registered at any school, or they are dual registered with both the EOTAS provider and the school. Where pupils are dual registered with two providers, one will register the pupil as dual-main registration and the other will register the pupil as dual-subsidiary. Where pupils are single registration or dual-main registration, the pupils’ outcomes count towards the provider’s key stage 4 performance data. Where a pupil is dual-subsidiary registration with a school (and dual-main registration with the EOTAS provider), the pupil’s data does not count towards the school’s key stage 4 performance data.
44 Estyn’s (2016, p.4) thematic report on education other than at school stated that:
For many pupils, EOTAS provides them with a second chance to succeed. Many pupils’ attendance improves and they are more motivated to learn because they have interesting learning experiences.
Many pupils who receive EOTAS study vocational courses. These experiences often motivate pupils to do well. They learn the skills needed to access further training or work. They gain qualifications that are relevant to the area of work they wish to pursue.
45 However, the same report, states that:
EOTAS provision does not give pupils the same access to their education entitlements as their peers …Pupils receiving EOTAS do not usually have access to a broad and balanced curriculum that enables them to gain qualifications that meet their needs and potential …
Pupils receiving EOTAS do not always receive the full-time education (usually 25 hours a week) to which they are entitled (Estyn, 2016, p.4).
Changes in registration practices for EOTAS pupils
46 Since 2013-2014, there has been an increase in the number of pupils who leave mainstream education during key stage 4 to follow EOTAS provision as their main education provider. Figures 4 and 5 show that the percentage of pupils who leave mainstream education to follow EOTAS provision as their main provider between January of Year 10 and January of Year 11 has nearly doubled since 2013-2014. Figure 16 shows that the total number of pupils who follow EOTAS provision (single registration, dual-main or dual-subsidiary) has fallen slightly over the same period. This suggests that while the number of pupils transferring to EOTAS has not changed dramatically, fewer pupils are now transferring to EOTAS and staying dual-main registered with the school. More pupils are transferring to being dual-main registered with the EOTAS provider and their outcomes therefore do not count towards the school’s key performance data.

26
Pupil registration practices
47 For the cohort of pupils in Year 10 in January 2017-2018 who had transferred to EOTAS as main provider by the January PLASC of Year 11, the majority of these pupils were in a few schools.
48 The guidance on dual registration of pupils is outlined in Annex 1 of the ‘Technical completion notes for local authorities and schools on Attendance data collection’ and states that:
Where pupils are dually registered between a mainstream school and pupil referral unit or special school, both establishments should maintain a pupil record for the pupil. One establishment should record the pupil’s registration status as Main and the other as Subsidiary.
In deciding which establishment is ‘Main’ or ‘Subsidiary’ a school should consider at which location the pupil is likely to spend the majority of their time during the academic year. For example:
• if a pupil spends a day a week at a special school or PRU then this should be their Subsidiary establishment
• if a pupil is to attend a PRU full time for a limited period of perhaps a few weeks then return to the mainstream school the PRU would be the Subsidiary establishment.
• If a pupil is intended to spend over half of the academic year at the special school or PRU then records should show the special school or PRU as the Main establishment (Welsh Government, 2018b, pp.15-16).
49 While the guidance is straightforward, there is an unintended consequence that schools can improve their reported key stage 4 performance data by ensuring that any pupil who transfers to EOTAS is either single registered with the EOTAS provider, or dual-main registered with the EOTAS provider and dual subsidiary registered with the school. Where a pupil is registered as dual main with the EOTAS provider and dual-subsidiary at the school, there is no incentive for the school to work in partnership with the EOTAS provider to ensure a smooth transition and the best possible provision for that pupil.
50 Data on the registration status of pupils who follow EOTAS provision is not published for separate school year groups. The following analysis is therefore for all EOTAS pupils. Over the last five years, there has been a change in how EOTAS pupils are registered (Figure 16). Between 2013-2014 and 2017-2018, there has been a growth in the percentage of pupils who are not on roll at a mainstream school. There has also been a substantial increase in the number of pupils who are registered as dual-subsidiary with the school. The proportion of pupils who follow EOTAS provision but retain dual-main registration with a maintained school has fallen since 2013-2014. This percentage has nearly halved. This is consistent with our findings that the percentage of Year 10 pupils who leave school during key stage 4 to follow EOTAS provision as their main provider has nearly doubled. It may be the case that the total number of pupils who transfer to EOTAS provision between Year 10 and Year 11 has not changed significantly but that more are now being registered as dual-main with the EOTAS provider.

27
Pupil registration practices
Figure 16: Number of pupils who are registered (single registration, dual-main or dual-subsidiary) with EOTAS, 2013-2014 to 2018-2019
Source: (Welsh Government, 2019b, p.4)
The monitoring of pupil movement by local authorities
51 All local authorities visited during this thematic survey had suitable arrangements for monitoring pupil movement. These included clear protocols for schools to follow when a pupil moved off the roll of the school and arrangements for investigating scenarios where pupils went missing from education. These included appropriate use of partnerships with other departments such as local health boards and Social Service departments. A few local authorities are involved in a useful pilot partnership with HMRC whereby children who are missing education are tracked using earnings records of their families.
52 All local authorities had suitable arrangements in place to support schools with managed moves of pupils. A minority had very recently reviewed their protocols in response to the recent Estyn (2018) report on Managed Moves.
53 All local authorities have suitable systems for tracking pupils, including those pupils that are dual-registered and who are therefore educated at more than one establishment.
54 In the local authorities surveyed, there are inconsistencies in the application of the guidance for dual registration of pupils. In the majority of local authorities surveyed, there were a mixture of registration practices, depending on the status of the EOTAS provider and how well pupils were engaging with the EOTAS provision. In 2015, Estyn (2015, p.25) published its thematic report ‘Education other than at school: a good practice survey’ in which it states:
0
500
1,000
1,500
2,000
2,500
2013-2014 2014-2015 2015-2016 2016-2017 2017-2018 2018-2019
Num
ber o
f pup
ils
All pupils receiving EOTAS provision
EOTAS pupils who are not on roll at a maintained school
EOTAS pupils who have main or current enrolment status at a maintained school
EOTAS pupils who have subsidiary enrolment status at a maintained school

28
Pupil registration practices
Where there is good practice, schools retain close links with their pupils and pupils stay on the school roll.
55 The data in Figure 16 and the comments of a minority of local authority officers surveyed suggests that there is less of this good practice happening, and schools are trying to make sure that they no longer have responsibility for the pupils who transfer to EOTAS. Once the pupil is registered dual-subsidiary at the school, there may be little incentive for the school to work in partnership with the EOTAS provider.
56 A minority of local authority officers surveyed said that schools were eager to have EOTAS pupils registered as dual main with the EOTAS provider so that the pupil’s outcomes would not then be counted in the school’s key stage 4 performance data. It is seen by schools as an easy way for a school to improve its performance data. In addition, one of the main findings of Estyn’s (2016, p.5) thematic report on EOTAS was that:
In most local authorities, these [referral] processes do not make sure that assessment and other information is transferred promptly from school to the EOTAS provider.
57 Where pupils are being transferred to EOTAS as main provider, there is little incentive to the school to ensure that they work in partnership with the EOTAS provider and transfer pupils’ information promptly.
58 In a few local authorities, all EOTAS pupils except those who attend pupil referral units are dual-main registered with the school. The rationale behind this policy is that the school has a moral obligation to support its pupils and it should therefore retain overall responsibility for each pupil. In this local authority, enforcing this policy has resulted in schools only referring pupils to EOTAS where this is in the best interest of the pupil. Where pupil’s outcomes are included in the school’s performance data, there is also a greater incentive for the school to monitor the pupil’s progress and work in partnership with the EOTAS provider. The officer we met at this local authority stated that schools were asking for pupils to be registered dual-subsidiary at the school, but the local authority had refused these requests.
59 Analysis of data suggests that there are inconsistencies in the registration of EOTAS pupils in the other local authorities that were not visited. The percentage of pupils who leave school between January of Year 10 and January of Year 11 to follow EOTAS as main provider varies greatly between local authorities in Wales. These proportions range from 0% to 8.2%.
60 A minority of local authorities are working in collaboration with local further education colleges and other agencies to introduce alternative provision for key stage 4 pupils. This is in response to Estyn’s (2016, p.4) thematic report on EOTAS in 2016, which highlighted some of the main strengths of this approach as:
• For many pupils, EOTAS provides them with a second chance to succeed. Many pupils’ attendance improves and they are more motivated to learn because they have interesting learning experiences.
• Many pupils who receive EOTAS study vocational courses. These experiences often motivate pupils to do well. They learn the skills needed to access further training or work. They gain qualifications that are relevant to the area of work they wish to pursue.

29
Pupil registration practices
61 However, there are inconsistencies in the registration practices of these pupils. In some local authorities, these pupils stay as dual-main registration with the school, while in others these pupils are dual-subsidiary registration with the school. Where a pupil is dual-main registered with the EOTAS provider (and will not be included in the school’s data), schools in general do not monitor the progress of these pupils well enough.
62 While these arrangements were successful in ensuring that more vulnerable learners were able to follow more suitable learning pathways, these pupils are not achieving the level 1 and level 2 thresholds. This is mainly due to the vocational cap on these thresholds, where only two of the five qualifications included can be vocational qualifications. The current performance measures do not reflect how well schools provide pathways for pupils to follow after their compulsory education.

30
Pupil registration practices
Pupils in Wales who are educated at home
63 Some of the pupils who are categorised ‘cannot be matched to a destination’ will have moved off the roll of a school between the PLASC of Year 10 and Year 11 to be educated at home. Within the scope of this report, we only investigated broad themes and reviewed the monitoring arrangements of the local authorities that we visited. As part of the PLASC, some data on home educated pupils is collected. However, this data is not collected from local authorities at a pupil level. This is because pupils who have always been home educated and have never attended a school would not have a unique pupil number (UPN). Pupil level data cannot therefore be collected. The data available does not therefore enable us to know how many Year 10 pupils who did not progress to Year 11 moved to be educated at home for the remainder of their compulsory education.
64 Since 2013-2014, there has been a steady increase in the rate of pupils who are educated at home (Figure 17).
Figure 17: Rate (per 1,000 pupils) of pupils of compulsory school age educated at home, 2013-2014 to 2018-2019
Source: Welsh Government (2019b, p.14)
65 All local authorities surveyed had clear protocols that schools should follow when a parent requests to remove their child from the school roll in order to educate their child at home. As some of these pupils have never attended a school, not all of these pupils have and Unique Pupil Number (UPN) and it is therefore difficult for the Welsh Government and local authorities to track and monitor these pupils.
3.43.8
4.64.9
5.5
6.6
0.0
1.0
2.0
3.0
4.0
5.0
6.0
7.0
2013-2014 2014-2015 2015-2016 2016-2017 2017-2018 2018-2019
Rat
e pe
r 1,0
00 p
uils
31
Pupil registration practices
Appendix 1: Evidence base
This report took account of previous Estyn thematic reports, inspection findings and data taken from:
• The Pupil Level Annual School Census (PLASC) • The EOTAS Pupil Census • The Welsh Examinations Database (WED).
The report considered a number of statistical publications by Welsh Government.
Inspectors visited a sample of five local authorities.
The local authorities visited as part of this study were:
Cardiff Council Carmarthenshire County Council City and County of Swansea Merthyr Tydfil County Borough Council Caerphilly County Council
In addition, consideration was given to evidence gathered during the inspection of secondary schools, all-age schools and local authorities over the last two years.
32
Pupil registration practices
Appendix 2: Questions to support governing body monitoring and evaluation
The following are possible questions to support governing body monitoring and evaluation of pupil progression following the completion of the Pupil Level Annual School Census (PLASC)
1 How many pupils who were in the Year 10 cohort in the previous year’s PLASC are not in the current Year 11 cohort? How many pupils who were in the Year 9 cohort in the previous year’s PLASC are not in the current Year 10 cohort?
2 What are the destinations of these pupils? When were they taken off roll? What was the rationale for taking these pupils off the roll of the school?
3 How many pupils from the previous year’s Year 10 cohort are repeating Year 10? What are the reasons for these pupils repeating year 10?
4 How many pupils from the previous year’s Year 10 cohort are following EOTAS provision? Why did these pupils move to EOTAS? How many of these are registered as dual-main with the school? How many are registered dual-subsidiary? What is the rationale behind the registration of each pupil? How does this fit in with the school’s inclusivity policies and protocols?
5 For pupils who have moved to EOTAS provision: Is the school working in partnership with the EOTAS provider to ensure that the pupil is being supported well to complete their key stage 4 studies and find a suitable pathway at the end of compulsory education? Is the governing body receiving regular updates on the progress of pupils in EOTAS provision?
6 How many pupils have left the school roll to be educated at home, and what are the reasons for parents electing to remove their child and have them home-educated?
7 How confident is the governing body that all pupil movements between year groups and to outside provision is meeting the needs of individual pupils?
8 What were the Year 11 outcomes of pupils who were taken off-roll? Has the school considered what would the school’s key stage 4 outcomes be were these pupils’ results included in the data?

33
Pupil registration practices
Appendix 3: Methodology for data analysis
Methodology for data analysis
To support this thematic report, data analysis has been carried out in the following way:
• Start with the cohort of pupils in Year 10 in each secondary and all age school on the January PLASC in 2017-2018 (we also repeated the analysis for the 2016-2017 cohort – this data can be found in Appendix 5).
• Use the data in the following year’s January PLASC to identify how many of these pupils have progressed to Year 11 at the school or at another maintained school (including special schools) in Wales. These pupils will be those who have progressed to Year 11.
• Use the data in the available in the second year’s January PLASC to look at the destinations of the pupils who have not progressed to Year 11. The destinations of these pupils have been split into four categories:
Pupils who repeat Year 10.
Pupils who have been placed in a year group other than Year 10 or 11.
Pupils who have moved to EOTAS as their main provider.
Pupils who could not be matched to a destination. These are the pupils who have moved off school rolls between Year 10 and Year 11, but have not reappeared in another school year or at another education provider in Wales.
Some of the analysis presents the destinations of Year 10 cohorts by contextual factors associated with the school at the time of the pupils being in Year 10. For most of this analysis categories ‘a’ and ‘b’ (above) have been combined in order to avoid issues around potentially disclosive data where cohorts are very small.
With the exception of figures 15, 16 and 17, the analysis contained in this report is based on unpublished data collected by Welsh Government with calculations completed by Estyn.
Categorisation of Schools by language medium
For the purpose of this analysis, schools have been categorised according to language medium in the following way:
• Predominantly Welsh-medium – schools where at least 80% of subjects (excluding Welsh and English) are taught through the medium of Welsh to all pupils. These are Welsh-medium and bilingual category 2A schools according to Welsh Assembly Government (2007) definitions.

34
Pupil registration practices
• Bilingual schools – for the purpose of this analysis, these are schools where between 20% and 80% of subjects (excluding Welsh and English) are taught through the medium of Welsh, but are also taught through the medium of English. This is an amalgamation of the following categories of schools:
o bilingual category 2B o bilingual category 2C o predominantly English medium with significant use of Welsh
according to Welsh Assembly Government (2007) definitions.
• Predominantly English medium – pupils are mainly taught through the medium of English. Welsh is taught as a second language up to key stage 4. One or two subjects (which would include Welsh first language) may be taught as an option through the medium of Welsh or using both languages.

35
Pupil registration practices
Appendix 4: Further data analysis
Figure 18a: Destinations of pupils not progressing from Year 10 to Year 11 in faith schools, 2018-2019
Source: Pupil Level Annual School Census (PLASC) and EOTAS Pupil Census
Figure 19a: Percentage of pupils not progressing from Year 10 to Year 11 in 2018-2019, by 2018 categorisation of schools
Source: Pupil Level Annual School Census (PLASC) and EOTAS Pupil Census and Welsh Government (2019a)
When schools are inspected, they may be adjudged to be in need of follow-up visits. There are three categories of Estyn follow up activity, Estyn review, significant improvement, and special measures. In order to investigate whether being in Estyn follow up is a factor in the levels of progression, rates have been analysed for those schools that were in Estyn follow up at some time between January 2016 and January 2018, that is before completion of the 2018 January PLASC collection. Where schools have been in more than one category of Estyn follow up, for the purpose of this analysis, they have been included in the category that involves the greater level of monitoring.
0%
1%
2%
3%
4%
5%
6%
7%
All schools Green Yellow Amber Red
Perc
enta
ge o
f pup
ils n
ot
prog
ress
ing
from
Yea
r 10
to
Year
11
National School Catgegorisation - 2018 Support Category
Percentage of pupils who:
Repeated Year 10 or were placed in
a year group other than 10 or
11
Moved to EOTAS as main
provision
Could not be matched
to a destination
Did not progress to Year 11 (All
destinations) All schools (208 schools) 0.36% 1.66% 2.15% 4.16%
Faith schools (18 schools) 0.26% 1.28% 2.11% 3.64%
36
Pupil registration practices
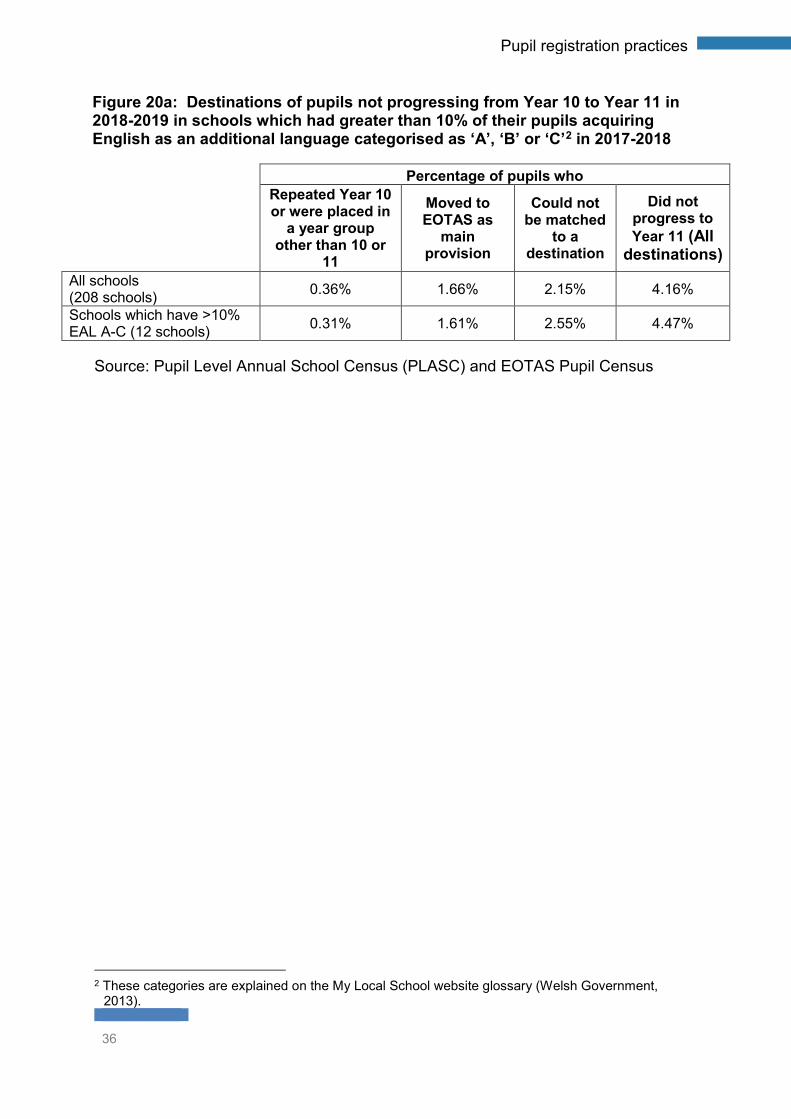
Figure 20a: Destinations of pupils not progressing from Year 10 to Year 11 in 2018-2019 in schools which had greater than 10% of their pupils acquiring English as an additional language categorised as ‘A’, ‘B’ or ‘C’2 in 2017-2018
Percentage of pupils who
Repeated Year 10 or were placed in
a year group other than 10 or
11
Moved to EOTAS as
main provision
Could not be matched
to a destination
Did not progress to Year 11 (All
destinations) All schools (208 schools) 0.36% 1.66% 2.15% 4.16%
Schools which have >10% EAL A-C (12 schools) 0.31% 1.61% 2.55% 4.47%
Source: Pupil Level Annual School Census (PLASC) and EOTAS Pupil Census
2 These categories are explained on the My Local School website glossary (Welsh Government,
2013).

37
Pupil registration practices
Appendix 5: Analysis of data for those pupils who were in Year 10 in 2016-2017
Figure 6b: Destinations of pupils after Year 10, by gender, 2017-2018
Source: Pupil Level Annual School Census (PLASC) and EOTAS Pupil Census
Figure 8b: Destinations of pupils after Year 10, by free school meal eligibility, 2017-2018
Source: Pupil Level Annual School Census (PLASC) and EOTAS Pupil Census
Figure 9b: destinations of pupils after Year 10, by special educational needs, 2017-2018
Source: Pupil Level Annual School Census (PLASC) and EOTAS Pupil Census
Percentage in 2018 who
Year 10 Cohort
(previous year)
Repeated Year 10 or were placed in a year group other
than 10 or 11
Moved to EOTAS as
main provision
Could not be matched
to a destination
Did not progress to Year 11 ( All destinations)
All pupils 30,407 0.67% 1.56% 2.21% 4.45% Girls 14,818 0.75% 1.11% 2.01% 3.87% Boys 15,589 0.60% 1.99% 2.40% 5.00%
Percentage in 2018 who
Year 10 Cohort
(previousyear)
Repeated Year 10 or were
placed in a year group other
than 10 or 11
Moved to EOTAS as
main provision
Could not be matched to a destination
Did not progress to Year 11 (All destinations)
All pupils 30,407 0.67% 1.56% 2.21% 4.45% Not eligible for FSM 25,365 0.49% 1.04% 1.68% 3.21%
Eligible for FSM 5,042 1.61% 4.20% 4.88% 10.69%
Percentage in 2018 who
Year 10 Cohort
(previous year)
Repeated Year 10 or were in a year group other than
10 or 11
Moved to EOTAS as
main provision
Could not be matched
to a destination
Did not progress to Year 11 (All
destinations) All pupils 30,407 0.67% 1.56% 2.21% 4.45% Pupils with no SEN 23,180 0.42% 0.64% 1.51% 2.57%
Pupils with SEN 7,227 1.48% 4.52% 4.47% 10.47%

38
Pupil registration practices
Figure 10b: Attendance rates for the 2016-2017 academic year of pupils not progressing from Year 10 to Year 11 in 2017-2018
Note that the bar representing the percentage of pupils repeating Year 10 with 100% attendance is not shown as it is based on a cohort of greater than zero but less than five.
Source: Pupil Level Annual School Census (PLASC), EOTAS Pupil Census and Pupils’ Attendance Record
Figure 11b: Destinations of pupils not progressing from Year 10 to Year 11 in 2017-2018, by school’s free school meal benchmarking group in 2016-2017
Source: Pupil Level Annual School Census (PLASC) and EOTAS Pupil Census
0%
10%
20%
30%
40%
50%
60%
70%
80%
90%
100%
Over 50%attendance
Over 70%attendance
Over 80%attendance
Over 90%attendance
100% attendance
Perc
enta
ge o
f pup
ils in
eac
h at
tend
ance
ca
tego
ry n
ot p
rogr
essi
ng fr
om Y
ear 1
0 to
Ye
ar 1
1
Pupils repeating Year 10 All pupils not progressing to Year 11
Free school meals
benchmarking group
Percentage of pupils who Repeated Year 10 or were placed in
a year group other than 10 or
11
Moved to EOTAS as
main provision
Could not be matched
to a destination
Did not progress to Year 11 (All
destinations) Up to and
including 10% 0.52% 0.97% 1.35% 2.84%
Over 10% and up to and
including 15% 0.64% 1.27% 2.15% 4.06%
Over 15% and up to and
including 20% 1.18% 1.69% 2.76% 5.64%
Over 20% and up to and
including 30% 0.46% 1.86% 2.15% 4.48%
Over 30% 0.73% 3.08% 3.78% 7.59% All schools 0.67% 1.56% 2.21% 4.45%

39
Pupil registration practices
Figure 12b: Destinations of pupils not progressing from Year 10 to Year 11 in 2017-2018, by school’s special educational needs cohort (statement or school action plus) in 2016-2017
Source: Pupil Level Annual School Census (PLASC) and EOTAS Pupil Census
Figure 13b: Destinations of pupils not progressing from Year 10 to Year 11 in 2017-2018, by school’s language medium in 2016-2017
Source: Pupil Level Annual School Census (PLASC) and EOTAS Pupil Census
Percentage of pupils who:
Percentage of pupils who have
statement or School Action Plus
Repeated Year 10 or were
placed in a year group other
than 10 or 11
Moved to EOTAS as
main provision
Could not be matched
to a destination
Did not progress to Year 11 (All
destinations) Up to and including 7% 0.68% 0.97% 1.76% 3.41%
Over 7% and up to and including 10% 0.39% 1.17% 2.35% 3.91%
Over 10% and up to and including 15% 0.77% 2.03% 2.03% 4.83%
Over 15% and up to and including 20% 0.70% 1.71% 2.07% 4.49%
Over 20% 1.27% 4.44% 6.75% 12.46% All schools 0.67% 1.56% 2.21% 4.45%
Percentage of pupils who:
Repeated Year 10 or were placed in
a year group other than 10 or
11
Moved to EOTAS as
main provision
Could not be matched to a destination
Did not progress to Year 11 (All
destinations) Predominantly Welsh-medium (38 schools)
0.42% 0.94% 1.11% 2.47%
Bilingual (24 schools) 1.63% 1.30% 3.95% 6.88%
Predominantly English-medium (147 schools)
0.58% 1.71% 2.16% 4.45%
All schools 0.67% 1.56% 2.21% 4.45%

40
Pupil registration practices
Figure 14b: Destinations of pupils not progressing from Year 10 to Year 11 in 2017-2018, by local authority
Percentage of pupils who
Local authority Year 10 cohort
(previous year)
Repeated Year 10 or were
placed in a year group other than 10 or 11
Moved to EOTAS as
main provision
Could not be matched
to a destination
Did not progress to Year 11 (All
destinations)
Isle of Anglesey 661 2.57% 3.03% 1.82% 7.41% Gwynedd 1,161 1.21% 1.46% 3.36% 6.03% Conwy 1,059 * 4.34% 2.55% * Denbighshire 1,094 * 7.40% 2.56% * Flintshire 1,618 2.22% 0.37% 3.71% 6.30% Wrexham 1,126 2.75% 1.24% 3.29% 7.28% Powys 1,226 * * 2.37% 2.94% Ceredigion 644 * 0.93% 2.48% * Pembrokeshire 1,100 * 1.91% 2.36% * Carmarthenshire 1,924 1.72% 0.36% 4.73% 6.81% Swansea 2,315 * 0.60% 0.99% * Neath Port Talbot 1,460 * * 1.92% 2.26% Bridgend 1,445 * 2.42% 2.56% * The Vale of Glamorgan 1,386 0.51% 1.30% 1.80% 3.61% Rhondda Cynon Taf 2,433 * 0.62% 1.03% * Merthyr Tydfil 565 0.88% 6.19% 1.77% 8.85% Caerphilly 1,906 0.42% 2.31% 1.36% 4.09% Blaenau Gwent 571 0.00% 0.00% 1.58% 1.58% Torfaen 1,076 * 0.56% 2.14% * Monmouthshire 757 0.00% 2.25% 0.79% 3.04% Newport 1,644 * 0.85% 2.49% * Cardiff 3,236 0.68% 1.64% 1.67% 3.99% Wales 30,407 0.67% 1.56% 2.21% 4.45%
*Data items based on cohorts greater than zero but less than five have been suppressed. Further figures may also not be disclosed in order to ensure that suppressed figures cannot be derived by subtraction from totals.
Source: Pupil Level Annual School Census (PLASC) and EOTAS Pupil Census

41
Pupil registration practices
Figure 18b: Destinations of pupils not progressing from Year 10 to Year 11 in faith schools, 2017-2018
Source: Pupil Level Annual School Census (PLASC) and EOTAS Pupil Census
Figure 19b: Percentage of pupils not progressing from Year 10 to Year 11 in 2017-2018, by 2017 categorisation of schools
Source: Pupil Level Annual School Census (PLASC), EOTAS Pupil Census and National School Categorisation
0%
1%
2%
3%
4%
5%
6%
All schools Green Yellow Amber Red
Perc
enta
ge o
f pup
ils n
ot p
rogr
essi
ng fr
om
Year
10
to Y
ear 1
1
National School Catgegorisation - 2017 Support Category
Percentage of pupils who:
Repeated Year 10 or were placed in
a year group other than 10 or
11
Moved to EOTAS as
main provision
Could not be matched
to a destination
Did not progress to Year 11 (All
destinations) All schools (209 schools) 0.67% 1.56% 2.21% 4.45%
Faith schools (18 schools) 0.66% 1.29% 1.84% 3.79%
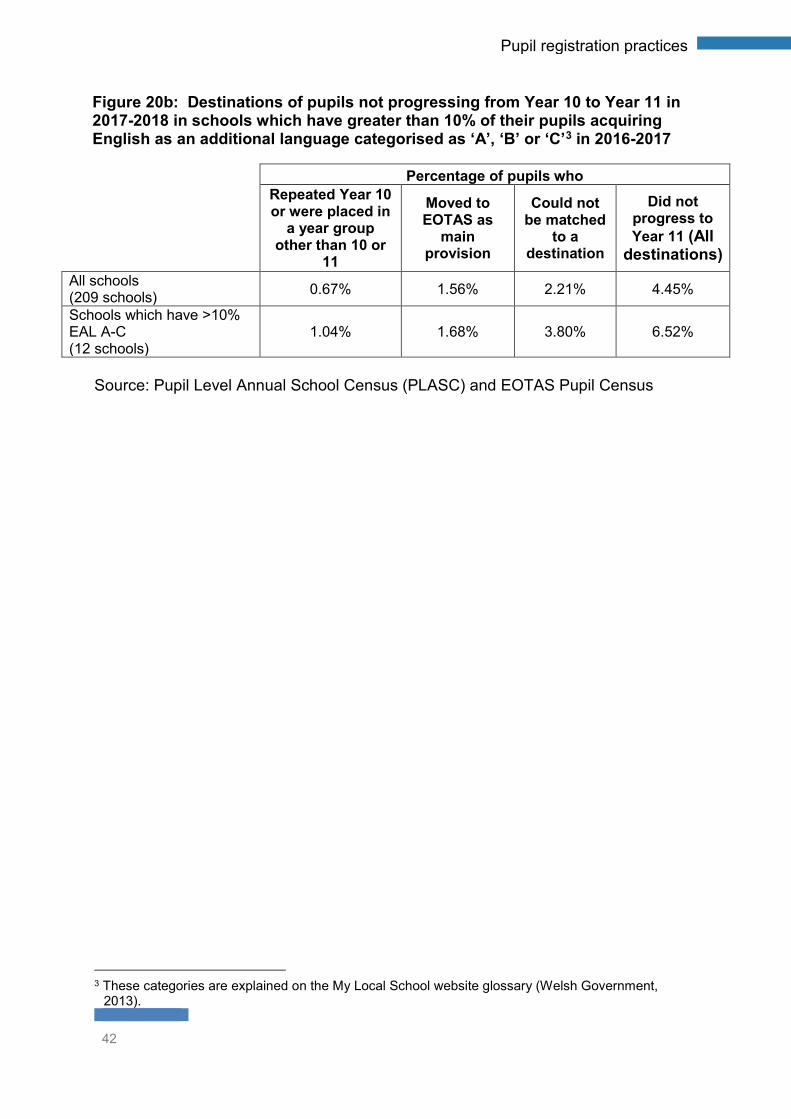
42
Pupil registration practices
Figure 20b: Destinations of pupils not progressing from Year 10 to Year 11 in 2017-2018 in schools which have greater than 10% of their pupils acquiring English as an additional language categorised as ‘A’, ‘B’ or ‘C’3 in 2016-2017
Percentage of pupils who
Repeated Year 10 or were placed in
a year group other than 10 or
11
Moved to EOTAS as
main provision
Could not be matched
to a destination
Did not progress to Year 11 (All
destinations) All schools (209 schools) 0.67% 1.56% 2.21% 4.45%
Schools which have >10% EAL A-C (12 schools)
1.04% 1.68% 3.80% 6.52%
Source: Pupil Level Annual School Census (PLASC) and EOTAS Pupil Census
3 These categories are explained on the My Local School website glossary (Welsh Government,
2013).
43
Pupil registration practices
Glossary
All Wales Core Data Sets
A dataset that is provided annually to schools showing their performance relative to schools that have a similar context
Categorisation A system introduced by the Welsh Government whereby schools are placed in one of four categories according to their perceived capacity to self-improve
Dual – main registration
Where a pupil is dual registered, this is the main education provider. Any key stage 4 outcomes at the end of Year 11 for a pupil who has dual-main registration will count towards this provider’s performance data.
Dual – subsidiary registration
Where a pupil is dual registered, this is the other education provider. Any key stage 4 outcomes at the end of Year 11 for a pupil who has dual-subsidiary registration will not count towards this provider’s performance data.
Dual registration This is where the education of a pupil is shared by more than one provider.
EOTAS – educated other than at school
This is where pupils receive their education at an alternative provider. The pupil may be still be registered with the school or they may be registered with the provider of alternative provision. For the purpose of this thematic survey, we will only be looking at those pupils who are no longer registered as mainly at the school.
Middle Tier Those establishments that work in education in between the Welsh Government and schools and other direct providers of education. The middle tier would include regional consortia, local authorities, examination boards and Estyn amongst others.
Not progressing into year 11
This is where a pupil is identified as being in Year 10 at the school in the previous year’s PLASC but has not progressed, as would be expected into Year 11 in the current year’s PLASC at any mainstream school in Wales.
Off-rolling This is where a school removes a pupil from its school roll without a formal, permanent exclusion.

44
Pupil registration practices
Permanent exclusion
A permanent exclusion is for very serious offences or breaches of the school behaviour policy when a wide range of strategies have been tried and failed. A pupil will not be accepted back in the school unless the governing body appeals panel or independent appeal panel overturns the decision. The pupil will have to continue his or her education elsewhere.
PLASC – Pupil Level Annual School Census
In January, schools in Wales are required to fill in an annual census to provide the Welsh Government with data on all pupils enrolled with the school. This data informs funding and the outcomes of all Year 11 pupils registered as single or dual–main are included in the school’s attendance and performance data.
RE2 forms Data forms provided to schools in the late 2000s showing their validated key stage 4 performance. The forerunner to the Summary of Secondary School Performance data.
School Banding A system introduced by the Welsh Assembly Government whereby schools were placed in one of five bands according to their attendance and key stage 4 performance data.
Single registration This is where a pupil is educated by a single provider.
Value Added A figure that shows whether a pupil’s progress between key stages is above or below expectation. The ‘expectation’ is based on the progress of pupils of similar ability and background. Value added figures for pupils may be collected to arrive at a figure for an educational provider, showing whether the provider’s pupils made better than expected (or worse than expected) progress between key stages.
Welsh Examination Database
A database of educational outcomes for providers in Wales
Numbers – quantities and proportions
nearly all = with very few exceptions most = 90% or more many = 70% or more a majority = over 60% half = 50% around half = close to 50% a minority = below 40% few = below 20% very few = less than 10%
45
Pupil registration practices
References
Estyn (2015) Education other than at school: a good practice survey. Cardiff: Estyn. [Online]. Available from: https://www.estyn.gov.wales/sites/default/files/documents/Education_other_than_at_school_a_good_practice_survey_-_June_2015.pdf [Accessed 15 March 2019]
Estyn (2016) Education other than at school. Cardiff: Estyn. [Online]. Available from:https://www.estyn.gov.wales/sites/default/files/documents/EOTAS%20remit%20report.pdf [Accessed 28 February 2019]
Estyn (2018) Managed moves: Effective use of managed moves by local authorities and schools. Cardiff: Estyn. [Online]. Available from:https://www.estyn.gov.wales/sites/default/files/documents/Managed%20moves%20-%20how%20used%20by%20LAs%20and%20schools%20report%20%28003%29.pdf [Accessed 27 March 2019]
Qualifications Wales (2019a) Provisional Entries for Summer 2019 GCSEs, AS, A levels, Skills Challenge Certificate, and Level 1/Level 2 Certificates for Wales: Data Tables. Newport: Qualifications Wales. [Online]. Available from: https://www.qualificationswales.org/english/publications/provisional-data-on-entries-for-summer-may-2019/ [Accessed 18 September 2019]
Qualifications Wales (2019b) Review of the summer 2018 exam series. Newport: Qualifications Wales. [Online]. Available from: https://www.qualificationswales.org/english/publications/review-of-the-summer-2018-exam-series/ [Accessed 23 February 2019]
Welsh Assembly Government (2007) Defining schools according to Welsh medium provision. Cardiff: Welsh Assembly Government.[Online]. Available from: https://gov.wales/sites/default/files/publications/2018-02/defining-schools-according-to-welsh-medium-provision.pdf [Accessed 22 March 2019]
Welsh Government (2018a) An analysis of local authority Pupil Registration Practices for learners accessing PRU and EOTAS provision. Cardiff: Welsh Government. [Online]. Available from: https://gov.wales/sites/default/files/publications/2018-10/an-analysis-of-local-authority-pupil-registration-practices-for-learners-accessing-pru-and-eotas-provision.pdf [Accessed 8 March 2019]
Welsh Government (2018b) Technical completion notes for local authorities and schools: Attendance data collection - May 2018. Cardiff: Welsh Government. [Online]. Available from: https://gov.wales/sites/default/files/publications/2018-04/180323-attendance-collection-secondary-2018-en-v2.pdf [Accessed 3 April 2019]
Welsh Government (2019a) National school categorisation system: support categories. Cardiff: Welsh Government. [Online]. Available from:
46
Pupil registration practices
https://gov.wales/national-school-categorisation-system-support-categories [Accessed 18 September 2019]
Welsh Government (2019b) Statistical First Release 2018/19 – Pupils educated other than at school. Cardiff: Welsh Government. [Online]. Available from: https://gov.wales/sites/default/files/statistics-and-research/2019-07/pupils-educated-other-school-september-2018-august-2019-644.pdf [Accessed 18 September 2019]