Embed Size (px)
Citation preview
¦ 2014 � vol. 10 � no. 2
TTTThe QQQQuantitative MMMMethods for PPPPsychology
T
Q
M
P
179
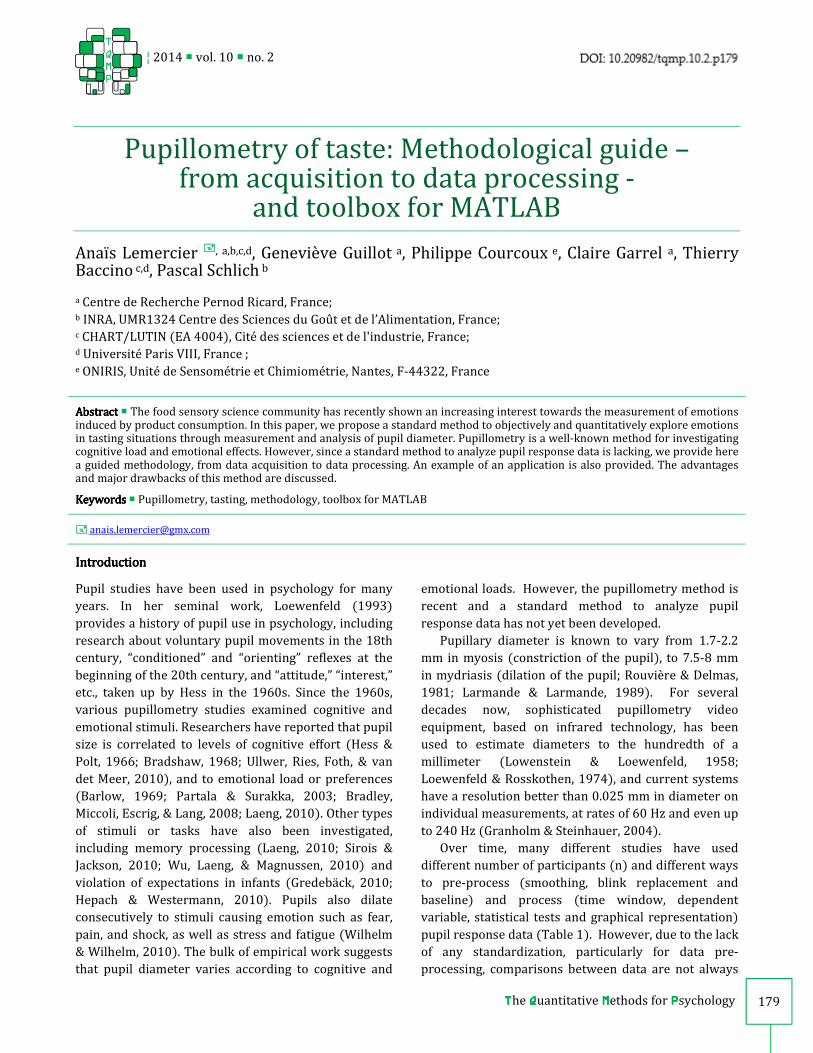
Pupillometry of taste: Methodological guide – from acquisition to data processing -
and toolbox for MATLAB
Anaïs Lemercier ����, a,b,c,d, Geneviève Guillot a, Philippe Courcoux e, Claire Garrel a, Thierry Baccino c,d, Pascal Schlich b
a Centre de Recherche Pernod Ricard, France; b INRA, UMR1324 Centre des Sciences du Goût et de l’Alimentation, France; c CHART/LUTIN (EA 4004), Cité des sciences et de l'industrie, France; d Université Paris VIII, France ; e ONIRIS, Unité de Sensométrie et Chimiométrie, Nantes, F-44322, France
AbstractAbstractAbstractAbstract � The food sensory science community has recently shown an increasing interest towards the measurement of emotions induced by product consumption. In this paper, we propose a standard method to objectively and quantitatively explore emotions in tasting situations through measurement and analysis of pupil diameter. Pupillometry is a well-known method for investigating cognitive load and emotional effects. However, since a standard method to analyze pupil response data is lacking, we provide here a guided methodology, from data acquisition to data processing. An example of an application is also provided. The advantages and major drawbacks of this method are discussed.
Keywords Keywords Keywords Keywords � Pupillometry, tasting, methodology, toolbox for MATLAB
���� [email protected]
IntroductionIntroductionIntroductionIntroduction
Pupil studies have been used in psychology for many years. In her seminal work, Loewenfeld (1993)
provides a history of pupil use in psychology, including
research about voluntary pupil movements in the 18th century, “conditioned” and “orienting” reflexes at the
beginning of the 20th century, and “attitude,” “interest,”
etc., taken up by Hess in the 1960s. Since the 1960s, various pupillometry studies examined cognitive and
emotional stimuli. Researchers have reported that pupil
size is correlated to levels of cognitive effort (Hess & Polt, 1966; Bradshaw, 1968; Ullwer, Ries, Foth, & van
det Meer, 2010), and to emotional load or preferences
(Barlow, 1969; Partala & Surakka, 2003; Bradley, Miccoli, Escrig, & Lang, 2008; Laeng, 2010). Other types
of stimuli or tasks have also been investigated, including memory processing (Laeng, 2010; Sirois & Jackson, 2010; Wu, Laeng, & Magnussen, 2010) and
violation of expectations in infants (Gredebäck, 2010;
Hepach & Westermann, 2010). Pupils also dilate consecutively to stimuli causing emotion such as fear,
pain, and shock, as well as stress and fatigue (Wilhelm & Wilhelm, 2010). The bulk of empirical work suggests
that pupil diameter varies according to cognitive and
emotional loads. However, the pupillometry method is recent and a standard method to analyze pupil
response data has not yet been developed.
Pupillary diameter is known to vary from 1.7-2.2 mm in myosis (constriction of the pupil), to 7.5-8 mm
in mydriasis (dilation of the pupil; Rouvière & Delmas,
1981; Larmande & Larmande, 1989). For several decades now, sophisticated pupillometry video
equipment, based on infrared technology, has been
used to estimate diameters to the hundredth of a
millimeter (Lowenstein & Loewenfeld, 1958;
Loewenfeld & Rosskothen, 1974), and current systems
have a resolution better than 0.025 mm in diameter on individual measurements, at rates of 60 Hz and even up
to 240 Hz (Granholm & Steinhauer, 2004).
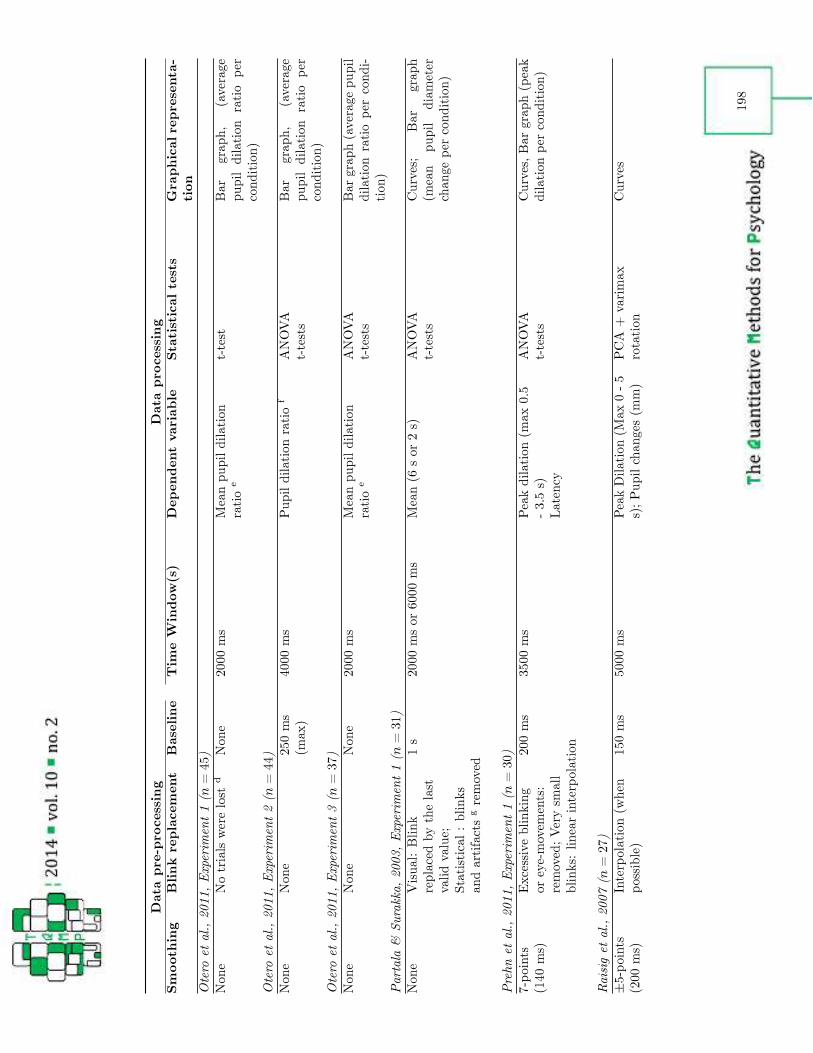
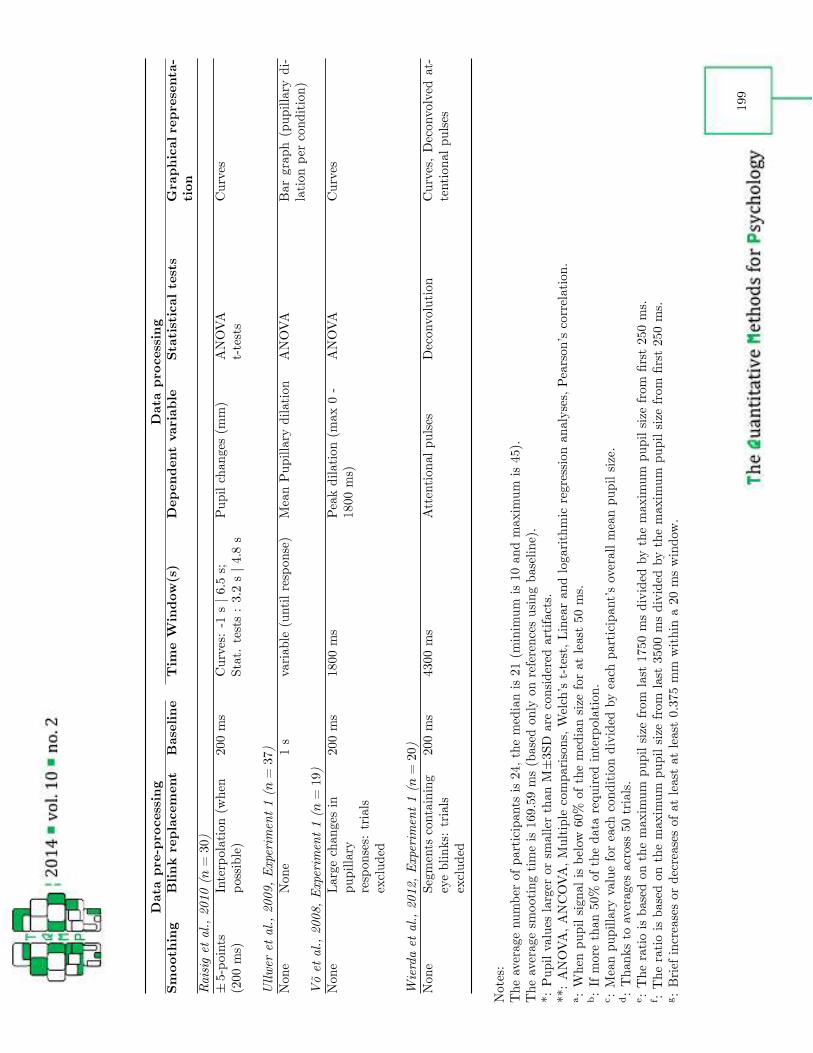
Over time, many different studies have used different number of participants (n) and different ways
to pre-process (smoothing, blink replacement and
baseline) and process (time window, dependent
variable, statistical tests and graphical representation)
pupil response data (Table 1). However, due to the lack of any standardization, particularly for data pre-
processing, comparisons between data are not always
¦ 2014 � vol. 10 � no. 2
TTTThe QQQQuantitative MMMMethods for PPPPsychology
T
Q
M
P
180
possible and meta-analyses are not advisable.
The sensory community has recently shown
increased interest towards the measurement of emotions induced by product consumption or usage.
Since emotions affect food preferences and choices, this
community has an interest in evaluating emotions
related to products. Until now, emotions have been
mainly measured by questionnaires or assessment
scales such as the EsSense ProfileTM of King, Meiselman, and Carr (2010). This questionnaire consists of 39
feeling items for a subject to rate from “Not at all” (1) to
“Extremely” (5). Other questionnaires have been used for perfumes or, more widely, for odors (Chrea et al.,
2009; Porcherot, 2010; 2012; Ng, Chaya, & Hort, 2013).
This type of questionnaire, especially when used for food products, must be adapted to each product and
must provide a subjective measurement of emotions,
which may lead to additional large between- and
within-subject variations.
Since human pupil size is directly affected by
emotional stimuli, pupil size changes due to product responses could be used as an objective and unbiased
(it is involuntary) measure of emotions provoked by tasting a product. However, although human pupil size
is directly affected by emotional stimuli, almost no data
exists about the effect of olfactory, gustatory and trigeminal stimuli on pupil dilation or constriction. To
our knowledge, only two papers about this type of
stimuli have been published. Hess and Polt (1966) showed that changes in pupil size could be a measure of
taste difference. More than 40 years later, Schneider
and colleagues (2009) showed that changes in pupil diameter indicated differences between the modalities
and the strength of odor stimuli, but were not related to
the hedonic value of odors.
Through this paper, we aim to propose a standard
method to objectively and quantitatively explore
emotions in tasting situations through the
measurement of pupil dilation. The hypothesis is that
when humans feel emotions while tasting a product,
their pupils will dilate. We thus provide a procedure of
data acquisition, data pre-processing, and data
processing, and then conclude with an example of an
application. We have also attached three MATLAB
routines to this paper that we used to help us carry out
these analyses.
Data AcquisitionData AcquisitionData AcquisitionData Acquisition
Participants
In previous work, the number of participants in
pupillometry studies has greatly varied. A sample of 20 references (Table 1 at the end of the article) revealed a
minimum of ten, a maximum of 45, an average of 24,
and a median of 21 participants. Based on this
observation, samples of 20 to 24 participants seemed to
be optimal for effect sizes associated with pupil
diameter. Moreover, based on our mean observations,
to obtain a test power of 90% with α = 0.05, an average
sample size of 23 participants would be required for
detecting significant pupil dilation of approximately
0.09 mm, corresponding to a percentage change of
2.4%. To conclude, a minimum of 23 participants is
recommended.
Experimental setup
We used a Tobii T60 eye tracker (60 Hz sampling rate) for our purposes. This device is designed for tracking
eye movements as well as assessing pupil diameter. We
propose guidelines for conducting a pupillometry study, some of which are specific to the product tasting
situation when using an on-screen eye tracker. First, it
is necessary to control the brightness to avoid bias due to the light. For this, we recommend using an artificial
light as uniformly as possible in the testing room, and to keep it constant between participants. Second, the
participant’s movements (head, arms) must be
controlled. In fact, movements can disrupt the signal (disturbance of IR beams) or provoke dilation or
contraction if the room is not uniformly lighted.
Consequently, the subject must consume the product without any head movement. For example, when working with a liquid product, the container must be
filled almost to the top, allowing the subject to take a sip without moving his or her head. Use of a straw could further help when it is appropriate.
Task, Stimulus Material and Procedure
Task.
The task can be divided into three periods for each
stimulation.
Rest periodRest periodRest periodRest period. The rest period consists of measuring the pupil diameter while the subject is not receiving any
stimulus. This measurement serves as the baseline.
Measurement periodMeasurement periodMeasurement periodMeasurement period: The measurement period consists of measuring the specific reaction of the pupil to a
¦ 2014 � vol. 10 � no. 2
TTTThe QQQQuantitative MMMMethods for PPPPsychology
T
Q
M
P
181
stimulus, or the natural pupil variation if there is no
stimulus.
RinsiRinsiRinsiRinsing periodng periodng periodng period: The rinsing period is a rest period for the subject’s eyes, during which the subject has only to
rinse his or her mouth with water without watching the
screen.
Stimulus material & room test.
To determine the best room lighting conditions and the
display to be used, we conducted an experiment to test
these two factors (light and screen), each with two
modalities (ceiling light (100-lux)-spotlight (50-lux)
and gray screen (30 cd/m²)-black screen (0.30 cd/m²),
respectively).1 Illuminance for both light conditions
was measured at the approximate position of the participant’s eyes when facing the monitor. Results
showed a percentage of missing values that were higher
for the black screen (M=12.6, SD=2.3) than for the gray screen (M=4.6, SD=1.0) [F(1,160)=10.63, p=0.001 , ŋ²
=0.04], and higher for the spotlight (M=11.9, SD=2.3) than for ceiling light (M=6.1, SD=1.1) [F(1,160)=7.20,
p=0.008, ŋ² =0.03]. A significant interaction between
light and screen [F(1,160)=3.89, p=0.050 , ŋ² =0.02] showed that for the light effect depending on the screen, the percentage of missing values is lower for
ceiling light with the black screen alone, whereas the percentage of missing values is equivalent for both light
conditions with a gray screen. In conclusion, the best
conditions among those tested were ceiling light (100-lux) and a gray screen (30 cd/m²). It is recommended
that the experimenter carry out a similar pilot test in
order to validate his/her experimental conditions.
Displays are presented for each period using Tobii Studio experimental control software. The displays
differ depending on the period. For the rest and
measurement periods of the main test, the displays
have to be identical and neutral. We recommend using
a gray screen on which a black cross appears to
facilitate the subject’s concentration on the screen. A
1 15 participants were recruited for this experiment. Each participant realized three trials in each condition. Each trial consisted of three phases. Firstly, a gray or black fixation cross appeared respectively on the black or gray screen for 2 s to adapt the participant to the experimental conditions, the subject was not receiving any stimulus. Then, the subject took a sip of water while the same fixation cross appeared for 3 s. Then, participants had 20 s to rest before the next trial starts. The percentage of missing values was collected during the second phase.
gray screen was preferable to a black screen because of
the results reported above. The cross displayed on the
screen must be fixed to avoid the influence of gaze position on pupil size measurement (Gagl, Hawelka and
Hutzler, 2011). The display for the rinsing period is
clear since no measurement is made during this period. However, it is also recommended to use a gray screen
to avoid an excessive change of luminance. We
recommend limiting the rest periods to 1 s and the
measurement periods to 3 s. A model of a Tobii Studio
project is available on the journal’s web site to this
paper (Pupillometry Test_example.nas).
Procedure.
The subject sits on a chair in such a way that his or her
face is 60 cm from the screen. The procedure is
conducted in four steps:
1. Explanation of the test session and statement of instructions by the experimenter
We recommend that the experimenter give the
instructions to the subject orally rather than having the subject read them on the screen. The instructions have
to be identical for all subjects.
2. Calibration of the eye tracker The calibration phase, for which the apparatus
provides a specific procedure, aims to adapt
parameters of the eye gaze and pupil estimation
algorithms to the idiosyncratic properties of each
participant’s eyes. The calibration has to be carried out at the beginning of each session. If it does not work, the
data cannot be recorded and the participant has to be
excluded. 3. Trial runs
The third step consists of running several training
trials to verify that the subject understands the instructions. 4. Measurement(s)
The experimenter notes each time the subject takes a mouthful or a sip of the product in order to capture
the initial time of the stimulus exposure.
Participant pre-selection.
The participants can be pre-selected before the
experiment begins, keeping certain conditions in mind. Some people cannot participate in a pupillometry test
because of their pupil size (either too large or too
small), because they have strabismus, have had laser surgery, etc. To establish the pre-selection method, we
determined what an unusual percentage of missing
values is on the basis of our last observations of 25
¦ 2014 � vol. 10 � no. 2
TTTThe QQQQuantitative MMMMethods for PPPPsychology
T
Q
M
P
182
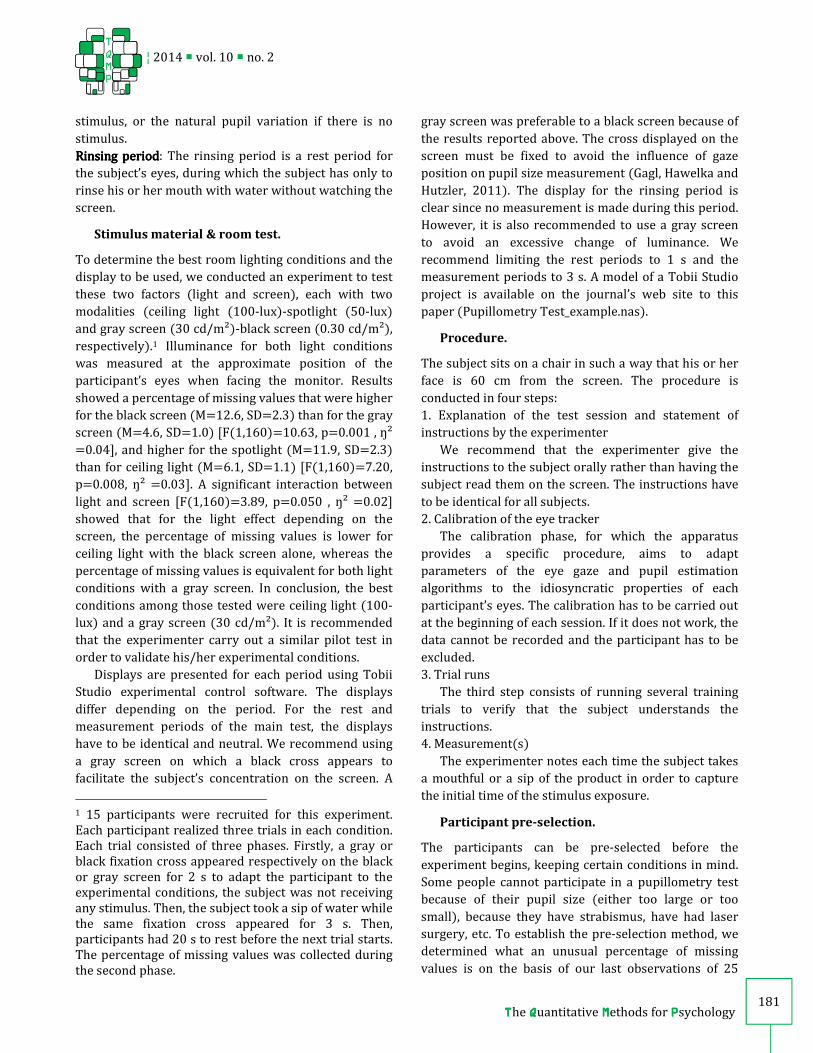
participants, with light optimized conditions (ceiling light (100-lux) and a gray screen (30 cd/m²)). Twenty-
eight trials were done per participant (25 participants *
28 trials = 700 trials). First, the average percentage of missing values was calculated per trial, with an average
over trials of approximately 5.90% (SD = 0.50). The
percentage of trials under successive fixed thresholds
of missing values from 0 to 100% was then observed
(by the calculation step by step of the percentage of
trials with less than 1%, 2%, 3%, until 100% of missing
values ) (Figure. 1). An inflection point observed at 18% seems to transcribe the border between the usual
(standard) and the unusual percentage of missing
values with more than 91% of trials with less than 18% of missing values. Based on these observations, we
chose to fix a threshold of 18% of missing values
beyond which the value could be considered as
unusual. Experimenters could choose to use the same
threshold or to determine it by carrying out a similar
pilot test in order to determine the usual percentage of missing values in their fixed experimental conditions.
For the pre-selection, each participant’s pupil diameter
has to be measured during a short test. The percentage of missing values is then calculated. We recommend not
selecting participants with a higher percentage of
missing values than the fixed threshold. A MATLAB
routine, available on the journal’s web site, is proposed
to identify the percentage of missing values in the data
in order to help make the decision (DataPreSelect.m).
Data PreData PreData PreData Pre----processing processing processing processing
Data Extraction
From the raw data, which is a continuous stream of
pupil size estimates, the size of which being a function
of sampling rate and task duration, specific pupil
responses need to be retrieved for each stimulus. The variables of interest are time, left and right pupil sizes,
and event. Depending on the device, a validity index of
each measurement or equivalent could also be
retrieved (these reflect the estimated validity of
individual samples). Given that the latency of pupillary
reaction is 200-250 milliseconds (Rougier & Riss, 2000) and, on the basis of our observations, the ending
time of a specific reaction is one to two seconds, we
recommend observing the results over a period of 2.5 seconds from stimulus onset. Finally, data are retrieved
as well for up to one second before stimulus onset, for
baseline correction (explained later).
Cleaning Data
Regardless of the eye tracking device used, gaze-loss
samples are unavoidable (i.e., from eye blinks).
Depending on the device, each missing value is arbitrarily recorded as a default value or deleted by the
experimental control software, and then estimated by
regression or interpolation. However, too many missing values could affect the signal quality. We recommend
keeping only recordings with less than 18% of missing
Figure 1Figure 1Figure 1Figure 1 � Percentage of trials under successive fixed thresholds of missing values from 0 to 100%
60
65
70
75
80
85
90
95
100
0 5 10 15 20 25 30 35 40 45 50 55 60 65 70 75 80 85 90 95 100
Pe
rce
nta
ge
of
tria
ls u
nd
er
thre
sho
ld
Missing values threshold (%)
¦ 2014 � vol. 10 � no. 2
TTTThe QQQQuantitative MMMMethods for PPPPsychology
T
Q
M
P
183
values to ensure reliable results, as already suggested
for participant pre-selection. According to Jackson and Sirois (2009), missing
values from breaks should first be estimated before
running analyses. If a missing value occurs on one eye only, the sample could be estimated by the value of the
other eye since there is a high correlation (> .9)
between left and right pupil diameters. Otherwise, a linear interpolation could be drawn from the average of
the last three values before and the first three values
after the break in samples. Jackson and Sirois (2009) developed a MATLAB function to interpolate missing
samples, which we have available on the journal’s web
site (DataCleanLR.m). This function first filters the data
to prevent an increase in variability using a low-pass
digital filter. We chose a 10-point average filter (166.67 ms) to be near the average of our observations, based
on values found in the literature (average =169.59 ms -
Table 1). Data are then interpolated. Finally, pupil data from both eyes at each sample time are averaged. This
data cleaning is carried out on data as of 1 s before the
stimulus and up to 2.5 s after the stimulus.
Baseline Correction
To allow the elimination of inter-subject variability in terms of pupil size, as well as the elimination of a
residue of previous pupillary reaction, data were
corrected by removing a baseline from each data point.
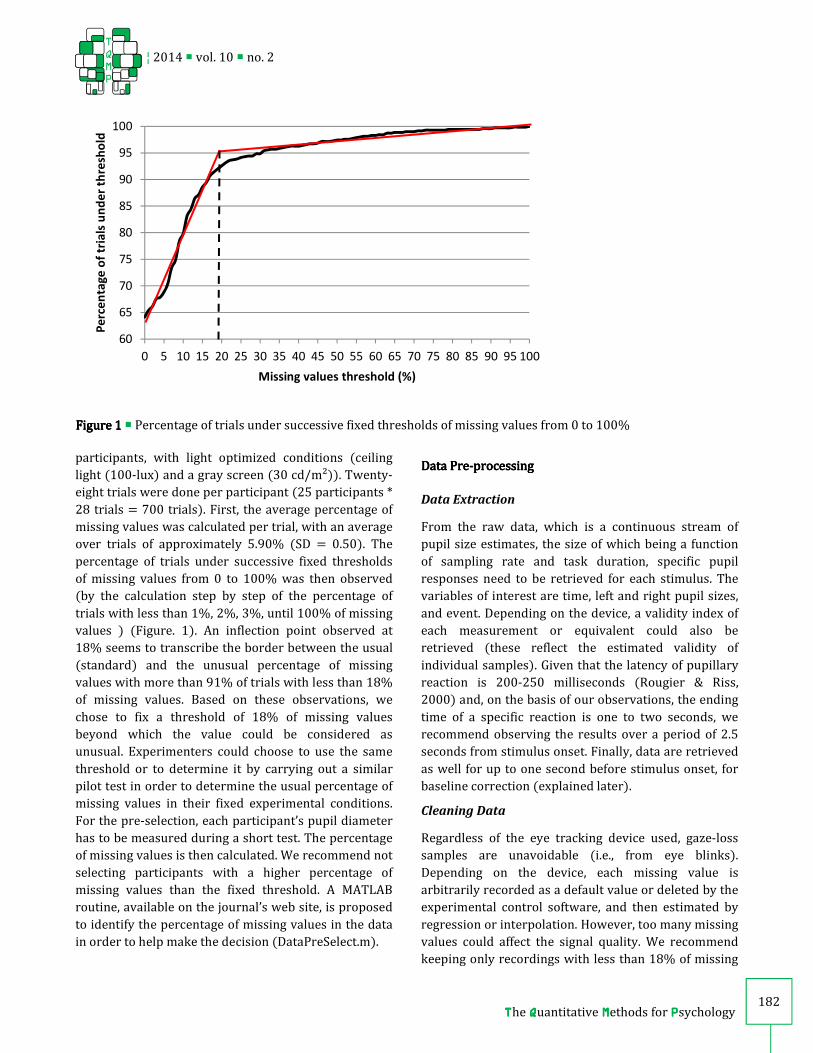
Figure 2Figure 2Figure 2Figure 2 � Mean pupillary responses after ingestion of spread and during clean palette
¦ 2014 � vol. 10 � no. 2
TTTThe QQQQuantitative MMMMethods for PPPPsychology
T
Q
M
P
184
The baseline was defined as the average pupil size of
the interval from -200 ms to 0 ms to stream onset, in
keeping with values commonly found in the literature (Kuchinke et al., 2007; Võ et al., 2008; Borneman et al.,
2010; Raisig et al., 2010; Kuchinke et al., 2011; Prehn et
al., 2011; Wierda et al., 2012). This reference value represents the pupil size at time t0. The results could be
expressed in two ways: (i) baseline-corrected pupil
diameter in mm using the following equation: X]^_`ab = Xc_d_ – baseline; and (ii) percentage change
of pupil diameter using the following equation:
.
We recommend expressing the results of both of these
formulas to make it possible to compare data with those from previous studies. However, in the case of
statistical tests, it is recommended to use only the
percentage change of pupil diameter, which allows for the elimination of additional inter-individual variability.
A MATLAB routine for selecting, cleaning, and correcting data is available on the journal’s web site
(DataPreprocess.m) (for more details, see the
document referred to as “#Readme”, attached to the routine).
Data Processing Data Processing Data Processing Data Processing
All of the data processing methods presented below have one of the following two objectives: (i) comparing
a product to a control situation in order to know if
there is a significant dilation of the pupil; (ii) comparing
two or more products in order to know if there is a difference between them in terms of pupil dilation.
Curve
The curve method of analysis can respond to the two
objectives, and consists of representing pupil diameter
evolution over time. A confidence interval (CI) can be added to the curves to make them more informative,
highlighting periods when there seems to be a significant difference. We used a 90% CI. It is less
rigorous than the usual value of 95%, and may be
justified by the variability in the measurement of pupil response. These CIs are used for a first visual
interpretation. Two pupil responses to stimuli are
considered to be equivalent when the CI curves overlap. Conversely, when the two CI curves do not overlap, the
two responses are different, and the direction of this
difference can be seen on the plot. If a large number of stimuli are plotted on the same graph, it is not
recommended to draw CI boundaries; a complementary
method, described later, will clarify the significance of differences from one time to the next.
Peak Dilation
The peak dilation method can be used to compare two
or more products. Peak dilation is computed as the
maximum percentage of pupil diameter change. This peak dilation is submitted to a two-way ANOVA with stimulus and subject as factors.
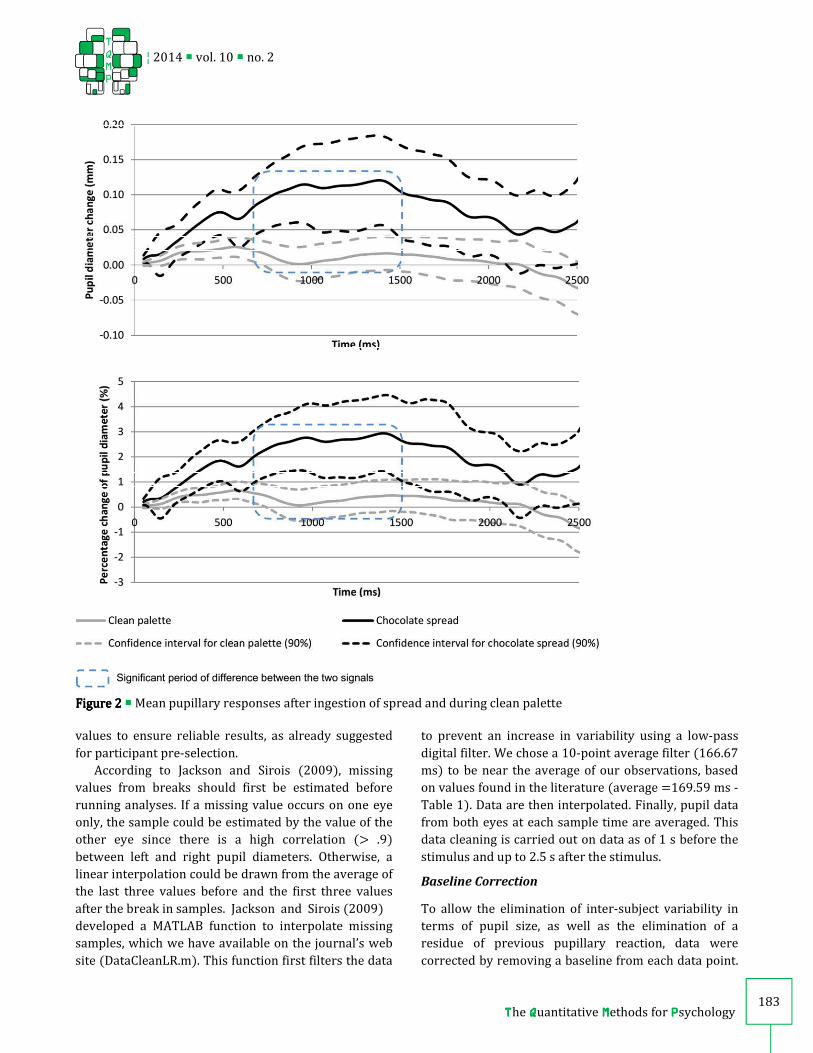
FigFigFigFigure 3ure 3ure 3ure 3 � F value for condition variable over time
0
2
4
6
8
10
12
14
0 500 1000 1500 2000 2500
F
Time (ms)
Condition effect Significance threshold (α = 5%)
¦ 2014 � vol. 10 � no. 2
TTTThe QQQQuantitative MMMMethods for PPPPsychology
T
Q
M
P
185
Comparison of stimuli by Mobile Average over time
This consists of comparing the mean pupil diameter in
successive time windows. Moving averages over 200 ms of the percentage change from the baseline are computed. These averages are compared between
stimuli by performing a two-way ANOVA with stimulus and subject as factors. To visualize the differences
between stimuli, the statistic F of the stimulus factor is
plotted over time. A significance threshold is added to
the curve, corresponding to a significance level of 0.05.
Principal Component Analysis
This last method consists of carrying out a covariance Principal Component Analysis (PCA) where subjects’
exposures to a stimulus are the observations, and
percentage changes of pupil diameter over significant times are the variables (see Schlens, 2005, for a brief
introduction). In order to determine the number of
components to be retained to obtain a sufficiently
accurate summary of the information in the initial data,
the elbow criterion is used. The elbow criterion is
based on the observation of an eigenvalue plot
observation of a sharp decrease of the function’s slope.
Factor loadings of the retained components are then
plotted. Like Kuchinke et al. (2007), only factor
loadings with an absolute value greater than 0.4 will be
considered for interpretation. The interpretation
consists in identifying parameters that transcribe
components (e.g., mean pupil diameter over time). The
defined parameters are then calculated, and
correlations between components and parameters are
observed to validate the interpretation. Finally, a two-
way ANOVA with stimulus and subject as factors on the
coordinates of each component is computed.
The curve, peak dilation, comparison over time, and
PCA methods can be undertaken using MATLAB
routines that are also available on the journal’s web site
(DataProcess.m, Results_Curves.m,
Results_PeakDilation, Results_TimesComparison and
Results_PCA) (for more details, see the document
referred to as “#Readme”, attached to the routine).
Example of Application Example of Application Example of Application Example of Application
Material and Method
Data acquisition, data pre-processing and data
processing were realized by following the guidelines previously enunciated.
Data collected from twenty-two participants were
used for analysis: 15 men and seven women, with a
mean age of 45 years (SD = 2.9). They were financially
compensated for their participation. All of them had a
normal or corrected-to-normal vision and were at least
occasional consumers of the product tested.
The product tested was a chocolate spread.
Results
Curves. The average baseline-corrected pupil diameter
and percentage change of pupil diameter evolutions
over time for the chocolate spread and the control
situation (clean palette) are represented on Figure 2
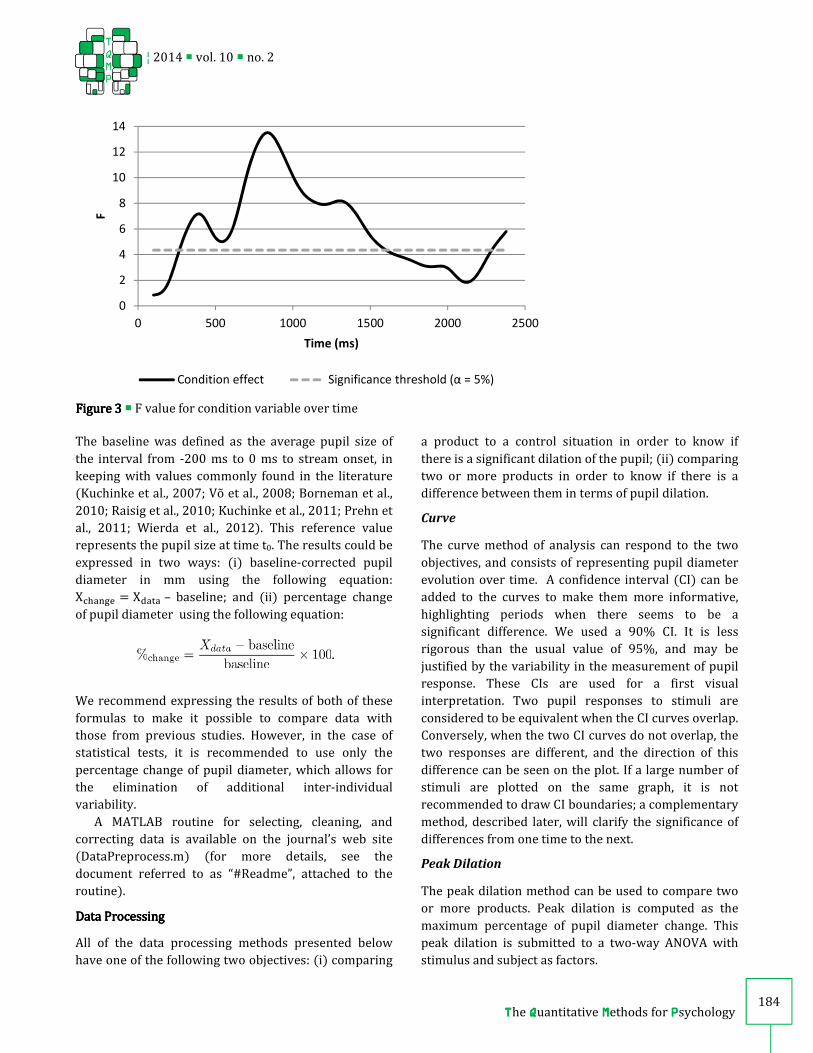
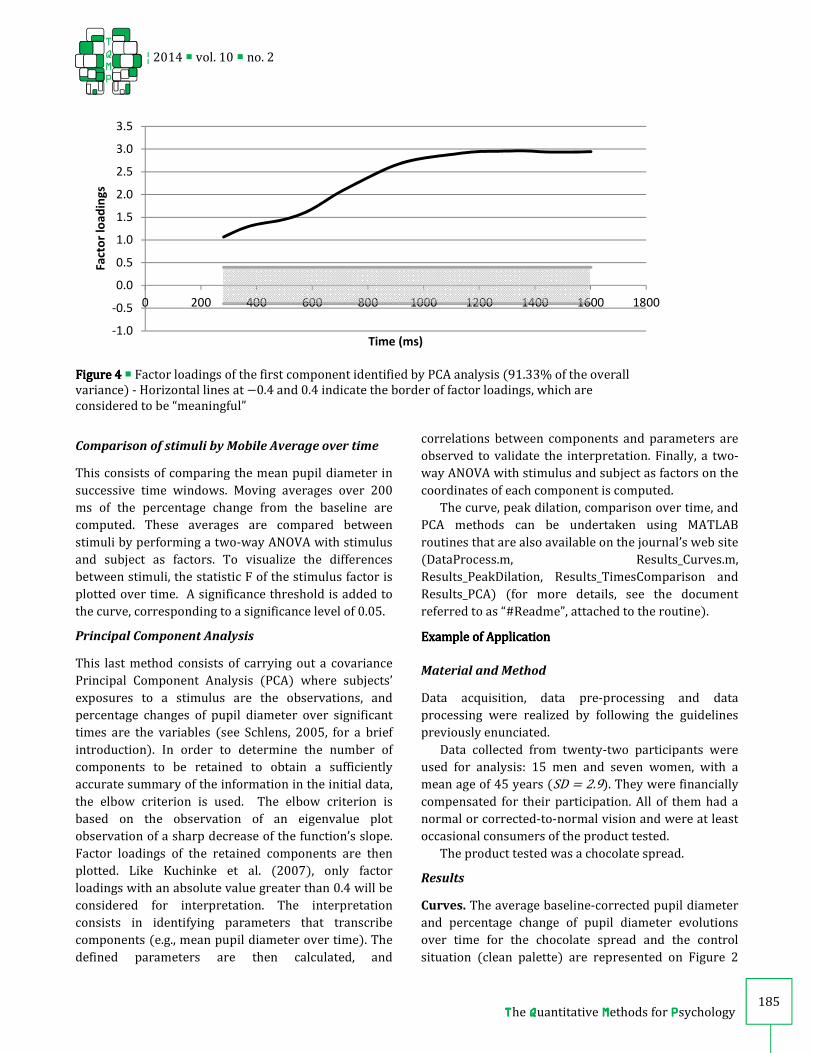
Figure 4Figure 4Figure 4Figure 4 � Factor loadings of the first component identified by PCA analysis (91.33% of the overall variance) - Horizontal lines at f0.4 and 0.4 indicate the border of factor loadings, which are considered to be “meaningful”
-1.0
-0.5
0.0
0.5
1.0
1.5
2.0
2.5
3.0
3.5
0 200 400 600 800 1000 1200 1400 1600 1800
Fa
cto
r lo
ad
ing
s
Time (ms)
¦ 2014 � vol. 10 � no. 2
TTTThe QQQQuantitative MMMMethods for PPPPsychology
T
Q
M
P
186
with confidence intervals of 90%. The curves of the
evolution of the pupil showed pupil dilation for the
chocolate spread with a larger pupil diameter than during the natural variations of the pupil diameter from
300 ms to 1600 ms. The pupil dilation for the chocolate
spread was approximately 0.12 mm, corresponding to a
variation of 3% of the pupil diameter at rest.
Comparison over timeComparison over timeComparison over timeComparison over time. We compared moving averages (200 ms) between the spread and the control by performing a two-way ANOVA with stimuli and subjects
as factors. The F statistic of the stimulus factor is plotted over time on Figure 3. The product signal was
significantly different from the natural variations of
pupil diameter, ranging from 280 ms to 1600 ms. PCAPCAPCAPCA. Computing a covariance PCA where subject x condition (chocolate spread or clean palette) are the
observations and where the pupil diameter for the significant times (280 ms-1600 ms) are the variables,
we identified one principal component (PC) to retain
according to the elbow criterion. This PC accounted for
91.33% of the overall variance. A plot of the factor
loadings is illustrated in Figure 4. The retained
component represents the average signal. We chose
the parameter of the average over time to transcribe
this component. The calculation of correlations
between PC and the average pupil diameter over time
showed significant correlation, R =0.999 (p<0.001), confirming our interpretation. Finally, we computed a
two-way ANOVA of this component with condition and
subject as factors. The ANOVA showed a significant
main effect of condition (p<0.01). In contrast, the
component was not affected by the subject variable (p=
0.53). This result means that the clean palette and chocolate spread do not lead to identical mean pupil
diameters.
Conclusion of the test
The results showed significant pupil dilation for the chocolate spread compared to the natural variations of
pupil diameter with the clean palette. The pupil dilation
with the chocolate spread was approximately 0.12 mm, corresponding to a variation of 3% of the pupil
diameter at rest. This result was further supported by
means of a principal component analysis. This suggests that the chocolate spread provoked emotions for the
subjects and that the pupils reflected these emotions.
However, the measurement of emotions caused by a
food product on the basis of pupil diameter has not
been studied in great detail as of this time. Applications
on others food products are necessary to ensure that it
is a measure of emotions and not just of arousal.
ConclusiConclusiConclusiConclusionsonsonsons
The methodology guide presented in this paper was
developed with the aim of helping anyone interested in
conducting a pupillometry test in a tasting situation.
The method described here covers data acquisition to
data processing. It is obviously not the only way to conduct a pupillometry test and can be improved or
adapted.
Pupillometry tests in tasting situations allow researchers to measure pupil response to products, but
within certain limits. First, the tasting conditions
presented are not natural. Tasting is done in a test room, and the subject must concentrate on a screen
while limiting his or her movements. To make the
conditions more natural, a head-mounted or other type of wearable eye tracker could be used. The subject
would be freer to move. However, this would make it
necessary to deal with light variations and to constantly make measurements with a light meter to eliminate
pupil variations due to the light (pupil light reflex)
(Watson & Yellott, 2012). Another limit is that
emotions cannot be qualified with pupillometry alone.
To qualify these emotions, a questionnaire could be
administered in which the subject could rate certain
emotions. For example, an existing emotions
questionnaire could be used, but it would have to be
short and simple since it would have to be repeated for
each test. The only thing that we can be sure of in pupil response is that we measure arousal (Partala et al.,
2003; Bradley, 2008). Also, to have more consistent
results, the measurement of pupil size could be coupled with another physiological measure (such as electro-
dermal activity or heart rate). To correlate other
quantitative data with pupil data, the coordinates of the PCA components, which reflect pupil response, could be
used.
In terms of material, to limit the subject’s movement, the researcher could consider using a chin
rest or a straw/flexible tube. However, a chin rest is not
suitable for tasting, especially for liquid products, and a straw is not adaptable to all food products, for example,
solid foods or liquid products like whisky. The objective
of the methodology is to be able to adapt it to all food products. Specific solutions cannot be proposed, but the
experimenter is free to adapt the procedure to his/her
products to facilitate consumption without excessive head movement.
The MATLAB routines available on the journal’s web
¦ 2014 � vol. 10 � no. 2
TTTThe QQQQuantitative MMMMethods for PPPPsychology
T
Q
M
P
187
site could be improved. For example, the development
of an interface could be considered, but this requires
time and, often, a change in the software version or operating system could make the interface unusable.
Finally, to take this analysis a step further, other
multivariate analyses could be tested, including
Independent Component Analysis, as suggested by
Jainta & Baccino (2010, see Langlois, Chartier, and
Gosselin, 2010, for an introduction), or Discriminant
Analysis, and more precisely, Partial Least Squares-
Discriminant Analysis (PLS-DA; Barker & Rayens, 2003).
In conclusion, in this paper, we aimed to
demonstrate that pupil dilation that could transcribe emotions can be assessed during a tasting situation, but
within certain limits. Among those limits are the lack of
terms to interpret the measured emotions that require coupling pupil data with a qualitative questionnaire, the
non-natural conditions of tasting, and, finally, the
difficulty of controlling the other sources of variations
in pupil diameter (stress, fatigue, lighting, etc.).
Ultimately, concerning the assessment of emotions
during a tasting situation, it would be interesting to
apply this method to several other studies with
different types of food stimuli. Moreover, it is
important to observe that recent results suggest that
the pupil size is related to arousal measures (Partala, 2033; Bradley, 2008). Therefore, an examination of this
measurement cannot be used to draw definitive
conclusions regarding differences in valence judgments.
Authors’ notes and acknowledgments Authors’ notes and acknowledgments Authors’ notes and acknowledgments Authors’ notes and acknowledgments
The authors wish to thank Sylvain Sirois and Iain
Jackson for making their MATLAB routines available to
us, Sylvain Sirois for his precious help in proof-reading
of this paper and Gail Wagman for her precious help in revising the English.
ReferencesReferencesReferencesReferences
Barker, M., & Rayens, W. (2003). Partial least squares
for discrimination. Journal of Chemometrics, 17(3), 166–173. doi:10.1002/cem.785
Barlow, J. D. (1969). Pupillary size as an index of
preference in political candidates. Perceptual and Motor Skills, 28, 587–590.
Bayer, M., Sommer, W., & Schacht, A. (2011). Emotional
words impact the mind but not the body: Evidence
from pupillary responses. Psychophysiology,
48(11), 1553–61. doi:10.1111/j.1469-8986.2011.
01219.x
Beatty, J. & Lucero-Wagoner, B., (2000). The Pupillary
System. In: J. T. Cacioppo, L. G. Tassinary, & G. G.
Berntson (Eds.). Handbook of Psychophysiology (2nd ed.) (pp. 142-162). New York: Cambridge
University Press.
Bernhardt, P. C., Dabbs, J. M., & Riad, J. K. (1996). Pupillometry system for use in social psychology.
Behavior Research Methods, Instruments, &
Computers, 28(1), 61–66. doi:10.3758/BF03203637
Bernick, N., Kling, A., & Borowitz, G. (1971). Physiologic
Differentiation of Sexual Arousal and Anxiety. Psychosomatic medicine, 33(4), 341–52.
Bitsios, P., Szabadi, E., & Bradshaw, C. (2004). The fear-
inhibited light reflex: Importance of the anticipation
of an aversive event. International Journal of Psychophysiology : Official Journal of the International Organization of Psychophysiology, 52(1), 87-95. doi:10.1016/j.ijpsycho.2003.12.006
Bornemann, B., Foth, M., Horn, J., Ries, J., Warmuth, E.,
Wartenburger, I., & Meer, E. (2010). Mathematical
cognition: Individual differences in resource
allocation. Zdm Mathematics Education, 42(6), 555–
567. doi:10.1007/s11858-010-0253-x Bradley, M., Miccoli, L., Escrig, M., & Lang, P. (2008). The
pupil as a measure of emotional arousal and
autonomic activation. Psychophysiology, 45(4), 602–607. doi:10.1111/j.1469-8986.2008.00654.x
Bradshaw, J. L. (1968). Pupil size and problem solving.
Quarterly Journal of Experimental Psychology, 20(2), 116–122.
Causse, M., Sénard, J.M., Démonet, J. F., & Pastor, J.
(2010). Monitoring cognitive and emotional processes through pupil and cardiac response during dynamic versus logical task. Applied psychophysiology and biofeedback, 35(2), 115–123. doi:10.1007/s10484-009-9115-0
Chrea, C., Grandjean, D., Delplanque, S., Cayeux, I., Le
Calvé, B., Aymard, L., . . . Scherer, K. R. (2009). Mapping the semantic space for the subjective experience of emotional responses to odors.
Chemical Senses, 34, 49–62. doi:10.1093/ chemse/bjn052
Conway, C. A., Jones, B. C., Debruine, L. M., Little, A. C., &
Sahraie, A. (2008). Transient pupil constrictions to faces are sensitive to orientation and species.
Journal of Vision, 8, 1–11. doi:10.1167/8.3.17
Coquin, J., Tafer, N., Mazerolles, M., Pouquet, O., Pfeiff, R., Richebé, P., & Janvier, G. (2009). Monitorage de la
dilatation pupillaire dans l’évaluation d’une
tolérance aiguë au rémifentanil en chirurgie

¦ 2014 � vol. 10 � no. 2
TTTThe QQQQuantitative MMMMethods for PPPPsychology
T
Q
M
P
188
cardiaque. Annales françaises d’anesthèsie et de rèanimation, 28(11), 930–935. doi:10.1016/
j.annfar.2009.07.073 Dietz, J., Bradley, M. M., Okun, M. S., & Bowers, D.
(2011). Emotion and ocular responses in
Parkinson’s disease. Neuropsychologia, 49, 3247–53. doi:10.1016/j.neuropsychologia.2011.07.029
Dufresne, A., Prom Tep, S., Senechal, S., &
Courtemanche, F. (2010). Physiological Measures,
Eye Tracking and Task Analysis to Track User
Reactions in User Generated Content. Proceedings of Measuring Behavior, (August 24-27), 218–22.
Einhäuser, W., Stout, J., Koch, C., & Carter, O. (2008).
Pupil dilation reflects perceptual selection and
predicts subsequent stability in perceptual rivalry. Proceedings of the National Academy of Sciences of the United States of America, 105(5), 1704–9.
doi:10.1073/pnas.0707727105 Espeseth, T., van de Pavert, S. H. P., Jynge, S., Sneve, M.
H., & Laeng, B. (2010). The pupil dilates as a
function of attentional effort in multiple object
tracking. In EyeTrackConf. Uppsala.
Gabay, S., Pertzov, Y., & Henik, A. (2011). Orienting of attention, pupil size, and the norepinephrine system.
Attention, Perception & Psychophysics, 73(1), 123–
129. doi:10.3758/s13414-010-0015-4 Gagl, B., Hawelka, S., & Hutzler, F. (2011). Systematic
influence of gaze position on pupil size
measurement: Analysis and correction. Behavior Research Methods, 43(4), 1171–81. doi:10.3758/
s13428-011-0109-5
Geangu, E., Hauf, P., Bhardwaj, R., & Bentz, W. (2011). Infant pupil diameter changes in response to others’
positive and negative emotions. PloS One, 6(11), 1–
10. doi:10.1371/journal.pone.0027132 Goldinger, S. D., & Papesh, M. H. (2012). Pupil Dilation
Reflects the Creation and Retrieval of Memories.
Current Directions in Psychological Science, 21, 90–5. doi:10.1177/0963721412436811
Granholm, E., & Steinhauer, S. R. (2004). Pupillometric
measures of cognitive and emotional processes. International Journal of Psychophysiology, 52, 1–6.
doi:10.1016/j.ijpsycho.2003.12.001
Gredebäck, G. (2010). Pupil dilation and social cognition in infancy. In EyeTrackConf. Uppsala.
Heitz, R. P., Schrock, J. C., Payne, T. W., & Engle, R. W.
(2008). Effects of incentive on working memory capacity: behavioral and pupillometric data.
Psychophysiology, 45, 119–29. doi:10.1111/j.1469-
8986.2007.00605.x
Hepach, R., & Westermann, G. (2010). Deriving
meaning from infants’ pupillary responses to emotional stimuli. In EyeTrackConf. Uppsala.
Hess, E. H. (1960). Pupil size as related to interest value
of visual stimuli. Science, 132, 349–50.
Hess, E. H. (1975). The role of pupil size in communication. Scientific American, 233(5), 116–9.
Hess, E. H, & Polt, J. M. (1966). Changes in pupil size as a
measure of taste difference. Perceptual and Motor Skills, 23, 451–455.
Höfle, M., Kenntner-Mabiala, R., Pauli, P., & Alpers, G.
(2008). You can see pain in the eye: Pupillometry as an index of pain intensity under different luminance
conditions. International journal of psychophysiology: Official journal of the International Organization of Psychophysiology,
70(3), 171–175. doi:10.1016/j.ijpsycho.2008.06.008
Honma, M., Tanaka, Y., Osada, Y., & Kuriyama, K. (2012). Perceptual and not physical eye contact elicits
pupillary dilation. Biological Psychology, 89, 112–6. doi:10.1016/j.biopsycho.2011.09.015
Hyönä, J., Tommola, J., & Alaja, A. M. (1995). Pupil
dilation as a measure of processing load in simultaneous interpretation and other language tasks. The Quarterly Journal of Experimental Psychology, 48A(3), 598–612.
Iqbal, S. T., Zheng, X. S., & Bailey, B. P. (2004). Task-
evoked pupillary response to mental workload in
human-computer interaction. In Conference on Human factors and computing systems - CHI. Vienna, Austria: ACM Press.
doi:10.1145/985921.986094 Jackson, I., & Sirois, S. (2009). Infant cognition: Going
full factorial with pupil dilation. Developmental Science, 12(4), 670–679. doi:10.1111/j.1467-7687.2008.00805.x
Jainta, S., & Baccino, T. (2010). Analyzing the pupil
response due to increased cognitive demand: An independent component analysis study.
International Journal of Psychophysiology, 77(1), 1–
7. doi:10.1016/j.ijpsycho.2010.03.008 Johansson, R., Holmqvist, K., Mossberg, F., & Lindgren,
M. (2011). Eye movements and reading
comprehension while listening to preferred and non-preferred study music. Psychology of Music,
40(3), 339–56. doi:10.1177/0305735610387777
King, S. C., Meiselman, H. L., & Carr, T. B. (2010). Measuring emotions associated with foods in consumer testing. Food Quality and Preference, 21,
1114–16. doi:10.1016/j.foodqual.2010.08.004

¦ 2014 � vol. 10 � no. 2
TTTThe QQQQuantitative MMMMethods for PPPPsychology
T
Q
M
P
189
Klingner, J., Kumar, R., & Hanrahan, P. (2008).
Measuring the task-evoked pupillary response with
a remote eye tracker. In Eye Tracking Research & Applications - ETRA. Savannah, Georgia.
Kuchinke, L., Võ, M. L.-H., Hofmann, M., & Jacobs, A. M.
(2007). Pupillary responses during lexical decisions vary with word frequency but not emotional
valence. International Journal of Psychophysiology,
65(2), 132–40. doi:10.1016/j.ijpsycho.2007.04.004
Kuchinke, L., Schneider, D., Kotz, S. a, & Jacobs, A. M.
(2011). Spontaneous but not explicit processing of
positive sentences impaired in Asperger’s
syndrome: pupillometric evidence.
Neuropsychologia, 49(3), 331–8. doi:10.1016/
j.neuropsychologia.2010.12.026 Kuchinsky, S. E., Dubno, J. R., Humes, L. E., Ahlstrom, J.
B., Cute, S. L., & Eckert, M. A. (2011). Evaluation of
pupil size as an indicator of listening effort. Talk presented at the MUSC Hearing Science Interest
Group Meeting. Kuchinsky, S. E., Ahlstrom, J. B., Vaden, K. I., Cute, S. L.,
Humes, L. E., Dubno, J. R., & Eckert, M. a. (2013).
Pupil size varies with word listening and response selection difficulty in older adults with hearing loss. Psychophysiology, 50(1), 23–34. doi:10.1111/
j.1469-8986.2012.01477.x Laeng, B., & Falkenberg, L. (2007). Women’s pupillary
responses to sexually significant others during the
hormonal cycle. Hormones and Behavior, 52(4), 520–530. doi:10.1016/j.yhbeh.2007.07.013
Laeng, B. (2010). Eyes Wide Open - The Pupillometry of
Desire. EyeTrackConf. Uppsala. Larmande, P. & Larmande, A. (1989). Neuro-
ophtalomologie. Paris: Masson.
Langlois, D., Chartier, S., & Gosselin, D. (2010) An Introduction to Independent Component Analysis: InfoMax and FastICA algorithms , Tutorials in Quantitative Methods for Psychology, 6, 31-38.
Loewenfeld, I. E., & Rosskothen, H. D. (1974). Infrared
pupil camera: A new method for mass screening and
clinical use. Am J Ophthalmol, 78, 304. Loewenfeld, I. E. (1993). The Pupil: Anatomy,
Physiology, and Clinical Applications. Ames: Iowa
State University Press. Chapter 13 (pp. 648–78). Lowenstein O, Loewenfeld I.E. (1958). Electronic
pupillography: A new instrument and some clinical
applications. Arch Ophthalmol, 59:352, 63. Ng, M., Chaya, C., & Hort, J. (2013). Beyond liking:
Comparing the measurement of emotional response
using EsSense Profile and consumer defined check-
all-that-apply methodologies. Food Quality and Preference, 28, 193–205.
doi:10.1016/j.foodqual.2012.08.012 Otero, S. C., Weekes, B. S., & Hutton, S. B. (2011). Pupil
size changes during recognition memory. Psychophysiology, 48, 1346–53. doi:10.1111/ j.1469-8986.2011.01217.x
Palinko, O., Kun, A. L., Shyrokov, A., & Heeman, P.
(2010). Estimating cognitive load using remote eye tracking in a driving simulator. Proceedings of the 2010 Symposium on Eye-Tracking Research & Applications - ETRA ’10, 141-144. doi:10.1145/ 1743666.1743701
Partala, T., & Surakka, V. (2003). Pupil size variation as
an indication of affective processing. International Journal of Human-Computer Studies, 59(1-2), 185–
198. doi:10.1016/S1071-5819(03)00017-X Piquado, T., Isaacowitz, D., & Wingfield, A. (2010).
Pupillometry as a measure of cognitive effort in
younger and older adults. Psychophysiology, 47(3), 560–69. doi:10.1111/j.1469-8986.2009.00947.x.
Pupillometry
Porcherot, C., Delplanque, S., Planchais, A., Gaudreau, N., Accolla, R., & Cayeux, I. (2012). Influence of food
odorant names on the verbal measurement of
emotions. Food Quality and Preference, 23, 125–133. doi:10.1016/j.foodqual.2011.07.006
Porcherot, C., Delplanque, S., Raviot-Derrien, S., Le
Calvé, B., Chrea, C., Gaudreau, N., & Cayeux, I. (2010). How do you feel when you smell this? Optimization
of a verbal measurement of odor-elicited emotions.
Food Quality and Preference, 21(8), 938–947. doi:10.1016/j.foodqual.2010.03.012
Prehn, K., Heekeren, H. R., & van der Meer, E. (2011).
Influence of affective significance on different levels of processing using pupil dilation in an analogical
reasoning task. International Journal of Psychophysiology, 79, 236–43. doi:10.1016/ j.ijpsycho.2010.10.014
Raisig, S., Welke, T., Hagendorf, H., & van der Meer, E.
(2007). Investigating dimensional organization in
scripts using the pupillary response. Psychophysiology, 44(6), 864–73. doi:10.1111/
j.1469-8986.2007.00592.x Raisig, S., Welke, T., Hagendorf, H., & van der Meer, E.
(2010). I spy with my little eye: detection of
temporal violations in event sequences and the pupillary response. International Journal of Psychophysiology : Official Journal of the International Organization of Psychophysiology,

¦ 2014 � vol. 10 � no. 2
TTTThe QQQQuantitative MMMMethods for PPPPsychology
T
Q
M
P
190
76(1), 1–8. doi:10.1016/j.ijpsycho.2010.01.006
Rieger, G., & Savin-Williams, R. C. (2012). The eyes have
it: Sex and sexual orientation differences in pupil dilation patterns. PloS One, 7(8), 1–10.
doi:10.1371/journal.pone.0040256
Rougier, M., & Riss, I. (2000). Motricité pupillaire. Encyclopédie Médico-chirurgicale, Neurologie.
Rouvière, H., & Delmas A. (1981). Anatomie humaine
descriptive, topographique et fonctionnelle. 11ème éd. Tome 1. Tête et cou. Paris: Masson.
Schneider, C., Ziemssen, T., Schuster, B., Seo, H.,
Haehner, A., & Hummel, T. (2009). Pupillary responses to intranasal trigeminal and olfactory
stimulation. Journal of Neural Transmission, 116(7),
885–889. doi:10.1007/s00702-009-0244-7 Siegle, G. J., Granholm, E., Ingram, R. E., & Matt, G. E.
(2001). Pupillary and reaction time measures of
sustained processing of negative information in
depression. Biological Psychiatry, 49, 624–36.
Retrieved from http://www.ncbi.nlm.nih.gov/
pubmed/11297720
Siegle, G. J., Steinhauer, S. R., Carter, C. S., Ramel, W., &
Thase, M. E. (2003). Do the seconds turn into hours? relationships between sustained pupil dilation in
response to emotional information and self-
reported rumination. Cognitive Therapy and Research, 27(3), 365–382.
Sirois, S., & Jackson, I. (2010). Pupil dilation, goal
attribution, and object identity in infants. EyeTrackConf. Uppsala.
Shlens, J. (2005) A Tutorial on Principal Component
Analysis. Retrieved from http://www. brainmapping.org/NITP/PNA/Readings/pca.pdf.
Stone, B., Lee, M., Dennis, S., & Nettelbeck, T. (2003).
Pupil Size and Mental Load. 1st Adelaide Mental Life Conference, Adelaide, S.A
Tombs, S., & Silverman, I. (2004). Pupillometry: A
sexual selection approach. Evolution and Human Behavior, 25, 221–228. doi:10.1016/
j.evolhumbehav.2004.05.001
Ullwer, D., Bornemann, B., Ries, J., Horn, J., Foth, M.,
Preusse, F., & van der Meer, E. (2009). Resource
allocation and problem solving strategies during a
geometric analogy task in individuals differing in
fluid intelligence. Paper for the 2nd Analogy Conference, NBU Press: Sofia
Ullwer, D., Ries, J., Foth, M., & van det Meer, E. (2010). Resource allocation and learning in individuals
differing in cognitive abilities - insights from
pupillometry and eye - movement analysis. In EyeTrackConf. Uppsala.
Urry, H. L., van Reekum, C. M., Johnstone, T., &
Davidson, R. J. (2009). Individual differences in
some (but not all) medial prefrontal regions reflect
cognitive demand while regulating unpleasant
emotion. NeuroImage, 47(3), 852–63. doi:10.1016/ j.neuroimage.2009.05.069
Verney, S. P., Granholm, E., & Dionisio, D. P. (2001). Pupillary responses and processing resources on the
visual backward masking task. Psychophysiology,
38, 76–83. Retrieved from http://www.ncbi.nlm. nih.gov/pubmed/11321622
Võ, M., Jacobs, A. M., Kuchinke, L., Hofmann, M., Conrad,
M., Schacht, A., & Hutzler, F. (2008). The coupling of emotion and cognition in the eye: Introducing the
pupil old/new effect. Psychophysiology, 45(1), 130–
140. doi:10.1111/j.1469-8986.2007.00606.x Watson, A. B., & Yellott, J. I. (2012). A unified formula
for light-adapted pupil size. Journal of Vision,
12(10), 1–16. doi:10.1167/12.10.12. Wierda, S. M., Rijn, H. Van, Taatgen, N. A., & Martens, S.
(2012). Pupil dilation deconvolution reveals the
dynamics of attention at high temporal resolution. doi:10.1073/pnas.1201858109/-/DCSupplemental. www.pnas.org/cgi/doi/10.1073/pnas.1201858109
Wilhelm, H., & Wilhelm, B. (2010). View onto alertness – objective assessment of central nervous activation
level by pupillography.pdf. EyeTrackConf. Uppsala.
Winter, D. A. (1990). Biomechanics and motors control of human movement. New York: Wiley-Interscience.
Wu, E., Laeng, B., & Magnussen, S. (2010). Through the
eyes of the own-race bias. EyeTrackConf. Uppsala.
Appendix: Appendix: Appendix: Appendix: GUIDELINES FOR USING MATLAB ROUTINESGUIDELINES FOR USING MATLAB ROUTINESGUIDELINES FOR USING MATLAB ROUTINESGUIDELINES FOR USING MATLAB ROUTINES
Three MATLAB routines (some of them adapted from programs and using a function written by Jackson & Sirois
(2009)) are available on the journal’s web site. They were written for the data files of the Tobii Studio. For other
types of data files, they will probably need to be adapted. They were written with the objective of comparing a product and a control situation or products between themselves. They have to be adapted if there are factors other
than subject and product. Nota bene: stimuli = conditions
Note to programmers: These programs can be improved, adapted and/or modified; feel free to rewrite them.
¦ 2014 � vol. 10 � no. 2
TTTThe QQQQuantitative MMMMethods for PPPPsychology
T
Q
M
P
191
Prerequisite: Test Design
To be able to retrieve pupil response data specific to a stimulus, a file with a specific name must be added per
stimulus as media in the Tobii test (see Tobii Studio Manual). We recommend calling it ‘StimulationX’ for each
stimulation and adding it as an image in jpg format. In fact, the naming convention ‘StimulationX.jpg’ is the default value in our MATLAB routines (attention: it is the file that must be named ‘StimulationX’, not the media element). In
that way, the variable ‘StimuliName’ in the raw data will provide information about the stimulation presented at
each moment of the recording. A model of a Tobii Studio project is attached to this paper (PupillometryTest_Example.nas).
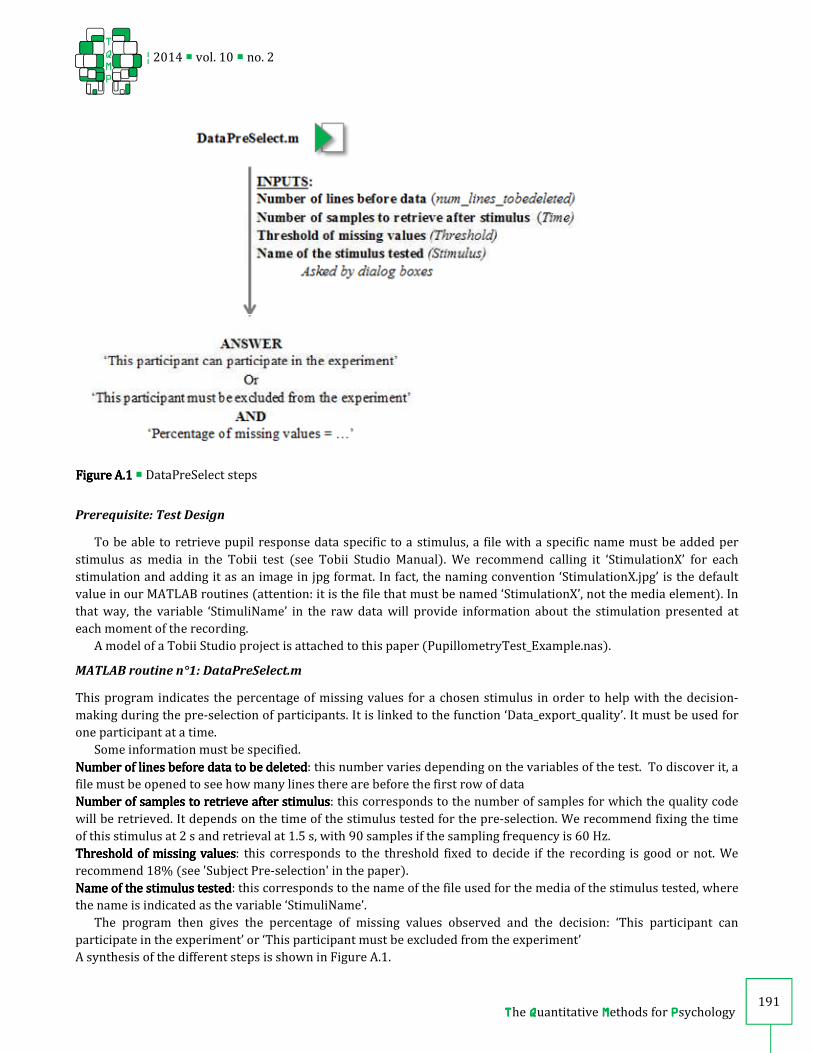
MATLAB routine n°1: DataPreSelect.m
This program indicates the percentage of missing values for a chosen stimulus in order to help with the decision-
making during the pre-selection of participants. It is linked to the function ‘Data_export_quality’. It must be used for
one participant at a time. Some information must be specified.
Number of lines before data to be deleNumber of lines before data to be deleNumber of lines before data to be deleNumber of lines before data to be deletedtedtedted: this number varies depending on the variables of the test. To discover it, a
file must be opened to see how many lines there are before the first row of data Number of samples to retrieve after stimulusNumber of samples to retrieve after stimulusNumber of samples to retrieve after stimulusNumber of samples to retrieve after stimulus: this corresponds to the number of samples for which the quality code
will be retrieved. It depends on the time of the stimulus tested for the pre-selection. We recommend fixing the time
of this stimulus at 2 s and retrieval at 1.5 s, with 90 samples if the sampling frequency is 60 Hz. Threshold ofThreshold ofThreshold ofThreshold of missing valuesmissing valuesmissing valuesmissing values: this corresponds to the threshold fixed to decide if the recording is good or not. We
recommend 18% (see 'Subject Pre-selection' in the paper). Name of the stimulus Name of the stimulus Name of the stimulus Name of the stimulus testedtestedtestedtested: this corresponds to the name of the file used for the media of the stimulus tested, where
the name is indicated as the variable ‘StimuliName’.
The program then gives the percentage of missing values observed and the decision: ‘This participant can participate in the experiment’ or ‘This participant must be excluded from the experiment’
A synthesis of the different steps is shown in Figure A.1.
FigFigFigFigure ure ure ure A.1A.1A.1A.1 � DataPreSelect steps

¦ 2014 � vol. 10 � no. 2
TTTThe QQQQuantitative MMMMethods for PPPPsychology
T
Q
M
P
192
MATLAB routine n°2: DataPreProcess.m
This program allows the three steps of data pre-processing, extraction, cleaning and baseline correction to be
undertaken. It is linked to the functions ‘Data_export_data’ and ‘DataCleanLR’ for cleaning. Any use of this last
function must recognize and cite the source (Jackson & Sirois, 2009). In chronological order, this program:
Selects data as of 1 s before each stimulus to 2.5 s after each stimulus (60 and 150 samples, respectively, with a
sampling frequency of 60 Hertz; it will need to be adjusted for other sampling frequencies) Cleans data
Corrects data
To execute the program, some information needs to be specified: Number of stimulationsNumber of stimulationsNumber of stimulationsNumber of stimulations: this corresponds to the number of stimulations in the study where the pupil response is in
the raw data file, including repetitions (e.g., if three products are repeated twice each, and one control situation
repeated twice, all of which are studied in the same session, ‘8’ must be indicated). Names of stimulationsNames of stimulationsNames of stimulationsNames of stimulations: this corresponds to the names of the stimulations presented during the measurement period,
Figure A.2Figure A.2Figure A.2Figure A.2 � DataPreprocess steps
¦ 2014 � vol. 10 � no. 2
TTTThe QQQQuantitative MMMMethods for PPPPsychology
T
Q
M
P
193
including repetitions. The default values are ‘StimulationX.jpg’ in the MATLAB program. Attention: if a stimulus is
repeated, all repetitions of this stimulus must be grouped or the program must be modified.
NumberNumberNumberNumber of lines before dataof lines before dataof lines before dataof lines before data: as for the MATLAB routine n°1, this corresponds to the number of lines to delete before the first data.
A synthesis of the different steps is shown in Figure A.2.
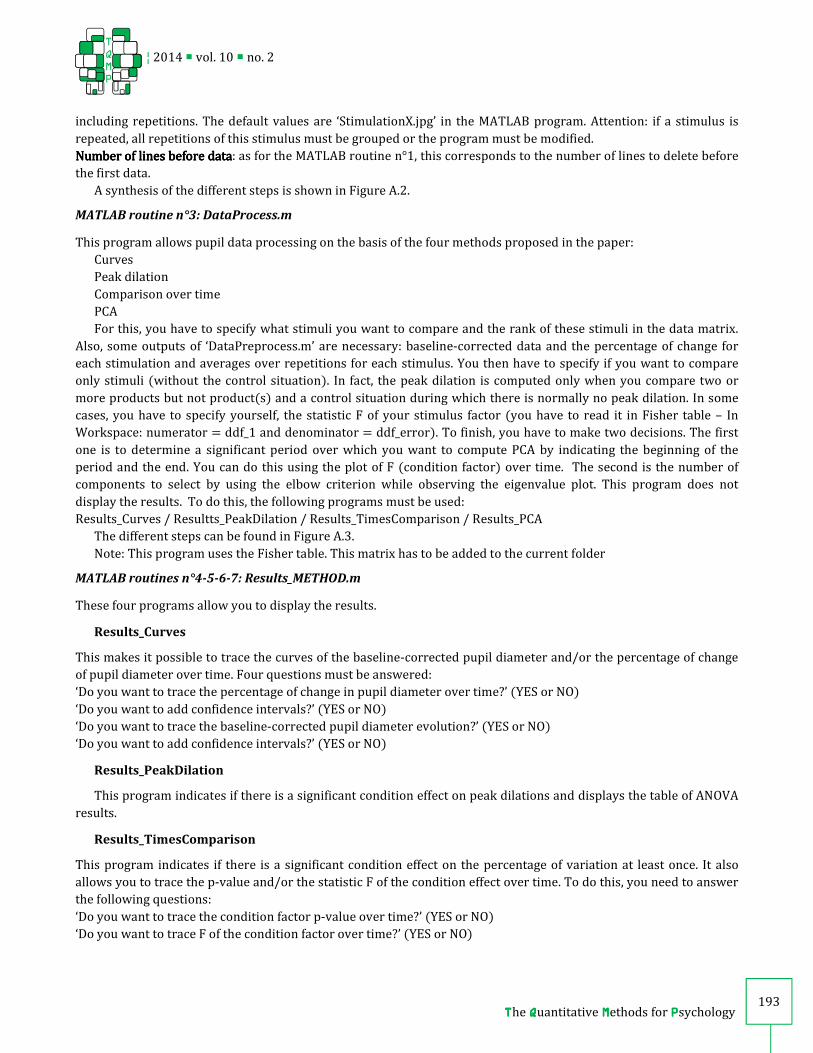
MATLAB routine n°3: DataProcess.m
This program allows pupil data processing on the basis of the four methods proposed in the paper:
Curves
Peak dilation
Comparison over time
PCA
For this, you have to specify what stimuli you want to compare and the rank of these stimuli in the data matrix.
Also, some outputs of ‘DataPreprocess.m’ are necessary: baseline-corrected data and the percentage of change for
each stimulation and averages over repetitions for each stimulus. You then have to specify if you want to compare
only stimuli (without the control situation). In fact, the peak dilation is computed only when you compare two or
more products but not product(s) and a control situation during which there is normally no peak dilation. In some
cases, you have to specify yourself, the statistic F of your stimulus factor (you have to read it in Fisher table – In
Workspace: numerator = ddf_1 and denominator = ddf_error). To finish, you have to make two decisions. The first
one is to determine a significant period over which you want to compute PCA by indicating the beginning of the
period and the end. You can do this using the plot of F (condition factor) over time. The second is the number of components to select by using the elbow criterion while observing the eigenvalue plot. This program does not
display the results. To do this, the following programs must be used:
Results_Curves / Resultts_PeakDilation / Results_TimesComparison / Results_PCA The different steps can be found in Figure A.3.
Note: This program uses the Fisher table. This matrix has to be added to the current folder
MATLAB routines n°4-5-6-7: Results_METHOD.m
These four programs allow you to display the results.
Results_Curves
This makes it possible to trace the curves of the baseline-corrected pupil diameter and/or the percentage of change
of pupil diameter over time. Four questions must be answered: ‘Do you want to trace the percentage of change in pupil diameter over time?’ (YES or NO)
‘Do you want to add confidence intervals?’ (YES or NO)
‘Do you want to trace the baseline-corrected pupil diameter evolution?’ (YES or NO) ‘Do you want to add confidence intervals?’ (YES or NO)
Results_PeakDilation
This program indicates if there is a significant condition effect on peak dilations and displays the table of ANOVA
results.
Results_TimesComparison
This program indicates if there is a significant condition effect on the percentage of variation at least once. It also allows you to trace the p-value and/or the statistic F of the condition effect over time. To do this, you need to answer
the following questions:
‘Do you want to trace the condition factor p-value over time?’ (YES or NO) ‘Do you want to trace F of the condition factor over time?’ (YES or NO)
¦ 2014 � vol. 10 � no. 2
TTTThe QQQQuantitative MMMMethods for PPPPsychology
T
Q
M
P
194
Results_PCA
This last program indicates if there is a meaningful component(s) that discriminate(s) against the conditions and
that traces the factor loadings over time to allow the interpretation of the components.
Figure A.3Figure A.3Figure A.3Figure A.3 � DataProcess steps
¦ 2014 � vol. 10 � no. 2
TTTThe QQQQuantitative MMMMethods for PPPPsychology
T
Q
M
P
195
CitationCitationCitationCitation
Lemercier, A., Guillot, G., Courcoux, P., Garrel, C., Baccino , P., & Schlich, P. (2014). Pupillometry of taste: Methodological guide – from acquisition to data processing - and toolbox for MATLAB. The Quantitative Methods for Psychology, 10 (2), 179-195.
Copyright © 2014 Lemercier, Guillot, Courcoux, Garrel, Baccino, Schlich. This is an open-access article distributed under the terms of the Creative Commons Attribution
License (CC BY). The use, distribution or reproduction in other forums is permitted, provided the original author(s) or licensor are credited and that the original
publication in this journal is cited, in accordance with accepted academic practice. No use, distribution or reproduction is permitted which does not comply with these
terms.
Received: 15/05/14 ~ Accepted: 16/06/14
Table 1 follows…
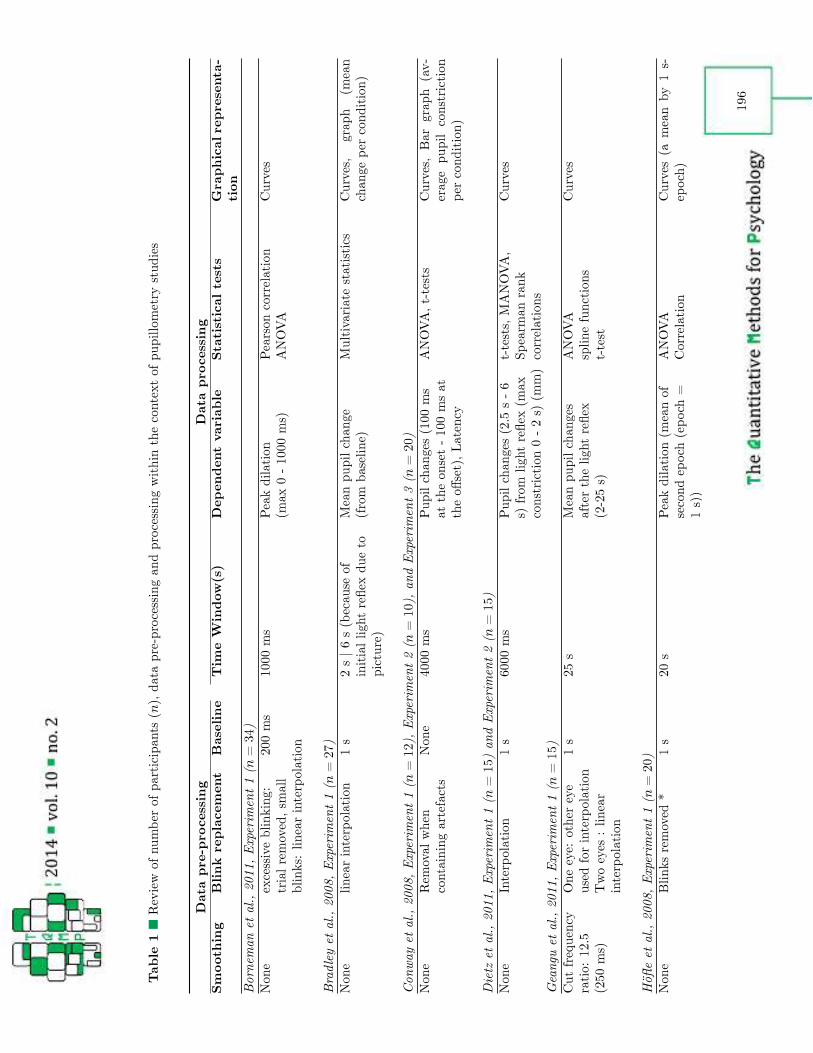
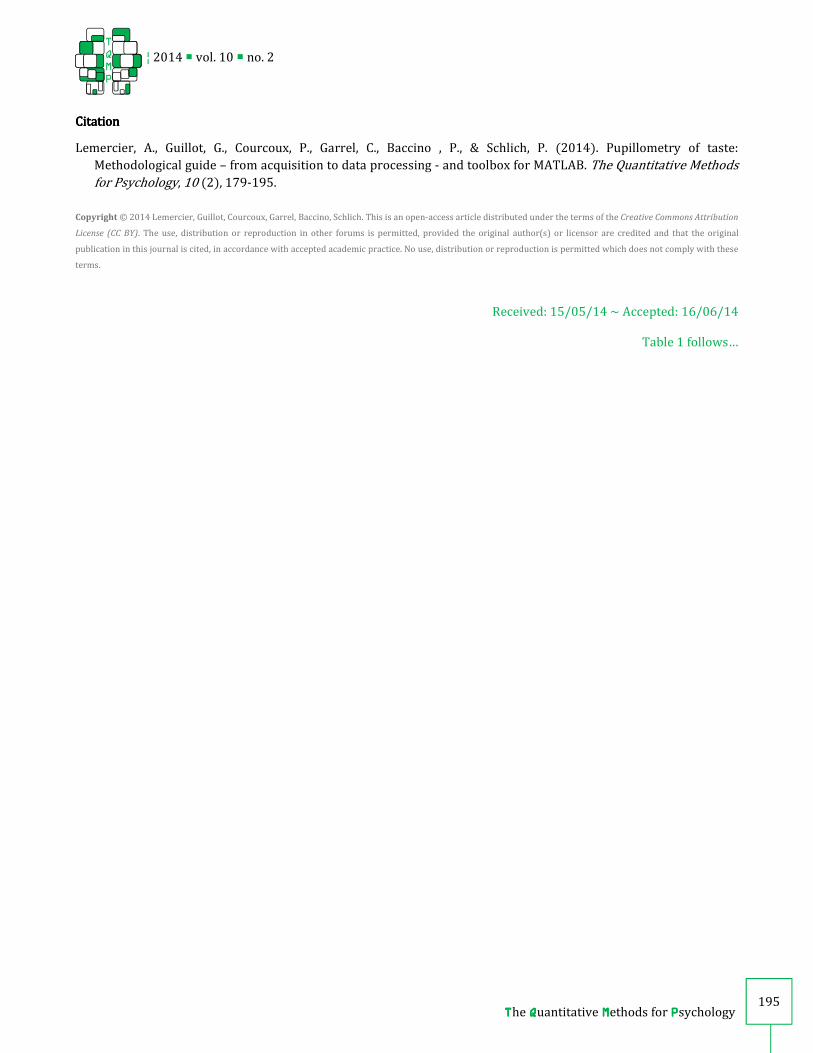
������������ ������� ������������������������������������������������������� �� ���!!�����"������ #�$�%&�'%&()�**+,-#�$�%&()�**+,- ./(($0+,-1�+,2&�%��)�/�,$1�*��+,��+/�3+,4(56*7#�%�,4�,$8�&+����.$�$+*$+)��$�*$*9&�%0+)��&�%&�*�,$�' $+(, :;<=>?@=>A@BCDEFGGDHIJ><K?>=AGL�MNOP Q���� ������!�R��S ���!����������!! �!�R�S!����������!����TUU��VUUU��W��R�!���� ��� U�VUUU���W�����������!���� XQYZX[���� :<@\B>]>A@BCDEFFDHIJ><K?>=AGL�MT_P Q���!����������!����V�T�a���������� ���!!�����b� ����� �������c������!������ � �������!���c�!��������������[��������������� ����������������� d;=e@]>A@BCDEFFDHIJ><K?>=AGL�MVTPDHIJ><K?>=AEL�MVUPD@=\HIJ><K?>=AfL�MTUP Q��������!���� ������������ ����Q���OUUU��W��!��������VUU�� �����������VUU���� ����g�����h�����"XQYZX��������[�����i���������� ��������!���������� ����������� jK>Ak>A@BCDEFGGDHIJ><K?>=AGL�MVlP@=\HIJ><K?>=AEL�MVlP Q���m������!����V�aUUU��W��!��������Tnl��a �� ���!�����b� ��� ����������U�T��������������cXQYZX� o����������R �����!�����[���� p>@=qr>A@BCDEFGGDHIJ><K?>=AGL�MVlP [�� ��s����" ����SVTnl �TlU���Y���"�S������"� ���� ��������!���� t���"��S!���� ������!����V�Tl�c������!������� � ������!�����b� �T�Tl��XQYZX ��!�� ������� ������[���� uv;w>>A@BCDEFFDHIJ><K?>=AGL�MTUP Q���i!�R�������xV�TU�W��R�!���������� �����������������M V���XQYZX [����!����[�����������"V�� ������ Vya

�������������������������� ������������������������������������������������������ ���������������������������� ��� ���� !" #$%&'(&%)*+!,-�!�"(./0123 45674567289:::;8<7=5>7?9::: ;8@=A7>BCDEFGH@6I78J@6KAKD78LLM@>I>@DHNGH@6I78E6 AH7DCDEFF@>KOE@;7A7>8 D7>G56OEAE56P Q RST��UV-,�-T%&''W%)*+!,-�!�"(./0213 XCA=>7YC76GK >@AE5Z92[\ N2\:;8P]677K7Z5AH7>7K7 C87O=5>E6A7>D5F@AE56 _57K78ZFE67@>E6A7>D5F@AE564567218J7@6DCDEFOE@;7A7>8 57>AE;7 B7@aOEF@AE56bC6GAE56@FO@A@@6@FK8E8 M?8DFE67 c4]dceA?A78A8eX5>>7F@AE56XC>78 Q -�" Uf RR-��%&'('%)*+!,-�!�"(./09:3 4567>E@F7gGFCO7OE=7g? G788E7<FE6a8h NijP 5>FE67@>E6A7>D5F@AE56c7>@I7 5=A>E@F\:::;8c7>@I7DCDEF8Ek7 J7@6DCDEFOE@;7A7> 57>AE;7c4]dceA?A78A8eBXce lXcXC>78eM@>I>@DHN;7@6 DCDEFF@>KGH@6I7D7>G56? OEAE56P mnRo-�S!!" #$%&''p%)*+!,-�!�"(./02q3 r?D5E6A8 N99q[qr;8PJ@s5><FE6a8Z A>E@F8OE8G@>O7O t;@FF7>@>AE=@GA8Z FE67@>E6A7>D5F@AE562::;89\::;8B7@aOEF@AE56N;@g5= A>E@FP>;c4]dc BXcu>;c4]dcXC>78 mnRo-�S!!" #$%&'((%)*+!,-�!�"(./09v3 �w)*+!,-�!�"&./0293 r?D5E6A8 N99q[qr;8Pl6A7>D5F@AE56N_H76 D588E<F7P2::;8j\::;8J7@6DCDEFOE@;7A7>e c>7@C6O7>AH7GC>7c4]dceA?A78A8 X5687GCAE7c4]dc8 =5>7@GH\:;8AE;7XC>78 mnRo-�TSx!" #$%&'(y./09v3 \?D5E6A8 Nzj[j\;8Pl6A7>D5F@AE565> {gGFC8E56|9:::;89zzj[r9;8 9\::;8J7@6DCDEFOE@;7A7>e c;DFEACO78e}@A76GE78~>5_AHGC>7@6@FK8E8 N~XcPec4]dce X5>>7F@AE56XC>78 � !��U� #S!��!,�%&''p%)*+!,-�!�"(./0913 4567456745679:8J7@6DCDEFF@>KGH@6I7� c4]dc~>@DHN;7@6DCDEFF@>K GH@6I7D7>G56OEAE56P 9vr
�������������������������� ������������������������������������������������������ ���������������������������� ��� ���� ��!"#$%&''$()*��+,�-�'./0123 45674589:;<=>797<5=8? 4567@AAAB=C7;6DED:<F:<;8:56 9;8:5G8H87=8I;9J9;DKLM;N79;J7 DED:<F:<;8:569;8:5D79 O56F:8:56P ���� ��!"#$%&''$()*��+,�-�%./0113 45674567@2AB= MB;QP1AAAB=RED:<F:<;8:569;8:5S T4UVT 8H87=8=I;9J9;DKLM;N79;J7 DED:<F:<;8:569;8:5D79 O56F:8:56P ���� ��!"#$%&''$()*��+,�-�W./0XY3 456745674567@AAAB=C7;6DED:<F:<;8:56 9;8:5GT4UVT 8H87=8=I;9J9;DKM;N79;J7DED:< F:<;8:569;8:5D79O56F:H 8:56P Z!��!"![\]�!!$%&&W$()*��+,�-�'./0X_3 4567V:=E;<I<:6a 97D<;O7Fbc8K7<;=8 N;<:FN;<E7d e8;8:=8:O;<b<:6a= ;6F;98:f;O8=g 97B5N7F_=@AAAB=59hAAAB=C7;6Mh=59@=PT4UVT 8H87=8=iE9N7=dI;9J9;DK MB7;6DED:<F:;B7879 OK;6J7D79O56F:8:56P Z��j-��!"#$%&''$()*��+,�-�'./0XA3 YHD5:68= M_1AB=PkQO7==:N7b<:6a:6J 597c7HB5N7B768= 97B5N7FdV79c=B;<< b<:6a=<:67;9:6879D5<;8:56@AAB=X2AAB=R7;aF:<;8:56MB;QAl2 HXl2=P m;876OcT4UVT 8H87=8=iE9N7=LI;9J9;DKMD7;a F:<;8:56D79O56F:8:56P n!+o+p��!"#$%&&q./0@Y3 r2HD5:68= M@AAB=Ps6879D5<;8:56M>K76 D5==:b<7P_2AB=2AAAB=R7;at:<;8:56MC;QAH2 =PdRED:<OK;6J7=MBBPRiTuN;9:B;Q 958;8:56iE9N7= _vw
�������������������������� ������������������������������������������������������ ���������������������������� ��� ����� !"�#$%&'(')*+,-. /01234567 89--:7;<56=>23?@64358AB=5 23774C?=;9--:7DE>F=7G1H7IJK07L M6@6K6=767G,K97INKO7PE24?QB@5R=78::;STUVS 616=767DE>F=7 W##X!Y!"�#$%&''Z%[\]!Y�!_"()*+,. T35=T35=H7F@>4@C?=8E564?>=72357=;a=@5PE24??@>bc4?@6435STUVSd@>R>@2B82E24??@>bc41 ?@64352=>Q35c46435; efg!"�#$%&''h%[\]!Y�!_"()*+Hi. T35=j@>R=QB@5R=745 2E24??@>b >=72357=7G6>4@?7 =kQ?Ec=c9--:7HO--:7P=@lc4?@64358:@k-1 HO--:7;STUVSDE>F=7 m�!Yn�!"�#$%&'(&%[\]!Y�!_"()*+9-. T35=M=R:=567Q356@4545R =b=C?45l7G6>4@?7 =kQ?Ec=c9--:7N,--:7S66=56435@?2E?7=7o=Q35F3?E6435DE>F=7po=Q35F3?F=c@61 6=56435@?2E?7=7 T36=7G qB=@F=>@R=5E:C=>3r2@>64Q42@567479Np6B=:=c4@5479H8:454:E:47H-@5c:@k4:E:47N0;K qB=@F=>@R=7:33645R64:=47HJiK0i:78C@7=c35?b35>=r=>=5Q=7E745RC@7=?45=;K sGPE24?F@?E=7?@>R=>3>7:@??=>6B@5a/,Mo@>=Q3574c=>=c@>64r@Q67K ssGSTUVSpSTDUVSpaE?642?=Q3:2@>47357pt=?QBu7616=76pj45=@>@5c?3R@>46B:4Q>=R>=77435@5@?b7=7pP=@>735u7Q3>>=?@6435K v GtB=52E24?74R5@?47C=?3AJ-w3r6B=:=c4@574x=r3>@6?=@760-:7K y G<r:3>=6B@50-w3r6B=c@6@>=zE4>=c456=>23?@6435K { Ga=@52E24??@>bF@?E=r3>=@QBQ35c46435c4F4c=cCb=@QB2@>64Q42@56u73F=>@??:=@52E24?74x=K | GqB@5l763@F=>@R=7@Q>3770-6>4@?7K } GqB=>@64347C@7=c356B=:@k4:E:2E24?74x=r>3:?@76H0-:7c4F4c=cCb6B=:@k4:E:2E24?74x=r>3:~>7690-:7K � GqB=>@64347C@7=c356B=:@k4:E:2E24?74x=r>3:?@76,0--:7c4F4c=cCb6B=:@k4:E:2E24?74x=r>3:~>7690-:7K � Gd>4=r45Q>=@7=73>c=Q>=@7=73r@6?=@76@6?=@76-K,0::A46B45@9-:7A45c3AK Hii