Embed Size (px)
Citation preview
Pure & Appl Chem., Vol. 49, pp. 941 — 962. Pergamon Press, 1977. Printed in Great Britain.
ADVANCES IN METHODS O LIGHT-SCATTERING SPECTROSCOPY
B. Chu
Department of Chemistry, State University of New York
at Stony Brook, Stony Brook, New York 11791i, lISA
Abstract - We present here a survey on the progress of techniques and in-struments of light-s cattering spectroscopy in recent years . Emphasis ison advances nade in photon correlation since l97L. A brief review on re-lated fields, such as perturbed anguar correlation measurements in nu-clear physic3, digital correlation in radio science, arid laser Doppler
velocimetry, is presented.
I. IN2RODUCTION
Light-scattering spectroscopy has made tremendous adv&ices since the onset of laser. In abroader perspective, we can include Raznai, Brillouin and Rayleigh scattering as well as new-er developments of nonlinear optic effects. However, in its applications to macromolecules,only two branches of light-scattering spectroscopy, namely Reman and Rayleigh scattering,have become important tools. Yet, the field ias grown so much that there is no consensxseven among the experts concerning the scope of light-scattering spectroscopy. In this lec-ture, I shall limit my attention to areas which are related to mainly Rayleigh scatteringand review the recent advances on high-resolution spectroscopic techiiques, such as photon-correlation spectroscopy and Fabry-Perot interferometry. Furthermore, I shall emphasize onthe practice of light-scattering spectroscopy.
The literature on Rayleigh-Brillouin scattering has grown to be enoxous. There have beennumerous reviews and monographs. Fleury and Boon (1) have listedover 500 references intheir review article. Comparable number of references has appeared in my recent book on"Laser Light Scattering" (2). Aside from those references listed in (1) and (2), therehave been at least six reviews (3-8),three books (2,9,10) and one conference proceedings(11) since 19714. The extent of such feverish activities also suggests that I should limitthe present discussion to the more recent advances on light-scattering spectroscopy whichare of interest to nacromolecular science. Specifically, we shall be dealing with improve-ments on the methods of light scattering as well as advances made by scientists in otherrelated disciplines, such as by. engineers on laser Doppler velocimetry and by radio astron-omers on digital correlation techniques. Due to an obiious lack of communication in suchseemingly diversified fields, I have encountered on more than one occasion accomplishmentsclaimed by one discipline while they have been published facts in another. Finally, it ismy subjective viepoint that the digital computer is a natural signal controller and pro-cessor for the type of information we seek in light-scattering spectroscopy. Consequently,there are many advantages in economy and versatility by utilizing one central processor.which permits various types of light-scattering measurements.
In reviewing the advances on the methods of light-scattering spectroscopy, I have included(II) light-scattering photometry becanse of its traditional importance in molecular weight,size and shape determinations of macromolecules in solution,(iii) Raxnan spectrometry for its more established role in pol3jmer science and computer-controlled instrumentation,(ri) Fabry-Perot interferotnetry because of its bridging effect in linking the frequencyranges of grating monochronometers and photon correlation,(v) photon correlation which plays the major role on recent advances in macromolecular-motion studies by means of light-scattering spectroscopy, arid finally(vi) laser Doppler velocimetry which is closely related to electrophoretic light scattering.Furthermore, the main discussions are on advances made since 19714 (2).
II. ADVANCES IN LIGIrT-SCATTERING PHOTOMETRY
Photon counting has become a fairly standard technique (2). UsingECL pulses and 100 MHzcounters, it has a good dynamic range whereby no analog signals need to be considered. Inlight-scattering photometry, we deal with the more classical aspects of light scatteringwhich includes measurements of angular distribution of scattered intensity and depolarization
941
942 B. CHU
ratios. It is a very powerful technique which can often give us information on molecular
weight, size (radius of gyratioi) , shape, intramolecular aM intermolecilar interactions ofmacromolecules in solution and represents the entire scope of what used to be known as lightscattering. The method hassometimes been overlooked by those who practice the present—daylight-scattering spectroscopy. It is possible to design an instrument which can measure theangular distribution of scattered intensity, depolarization ratios, and the spectral dis-tribution of scattered intensity as a ftinction of scattering angle without changing themechanical elements of the setup. With an additional calibration standard, extrapolated
zero-scattering angle zero-concentration integrated scattered intensity shoild yield infor-mation on the molecular weight.
Two aspects o recent develonents in light-scattering photometry deserves our attention.One deals with scattering-intensity measurements at small scattering angles and the otherconcerns with the precision of angular intensity-ratio measurements.
II 1. Small-angle light scattering intensity measurementsMeasurements of scattered interility at small scattering angles (e.z3O°) require us to con-sider careftilly (a) the divergence of the incident beam, (b) the divergence of the scatteredbeam (c) surface reflection and refraction effects and (d) dust in the scattering medium.Condition (d) often becomes the limiting factor since it is most difficult to remove thedust particles from solutions. Small-angle light scattering of polymer solutions becomeessential whenever very large macromolecules, such as DN&, are being characterized. There,in order to obtain the proper extrapolated zero-anile scattered intensity and the limitingslope in reciprocal scattered intensity versus K' plot, we need to make measurements downto 95-lO . K[=(l4ii/X)sin(9/2)) is the magnitude of the momentum transfer vector with be-ing the wavelength of light in the medium. Small-angle scattering intensity measurementstogether with simultaneous intensity values obtained at a large scattering angle (saj,e>8o ) have been used in real-time particle sizing (l3-l1-). The same optical geometry isapplicable in electric-field light scattering of macromolecular solutions or colloidal sus-pensions when Doppler-shift measurements at small-scattering angles are desirable.
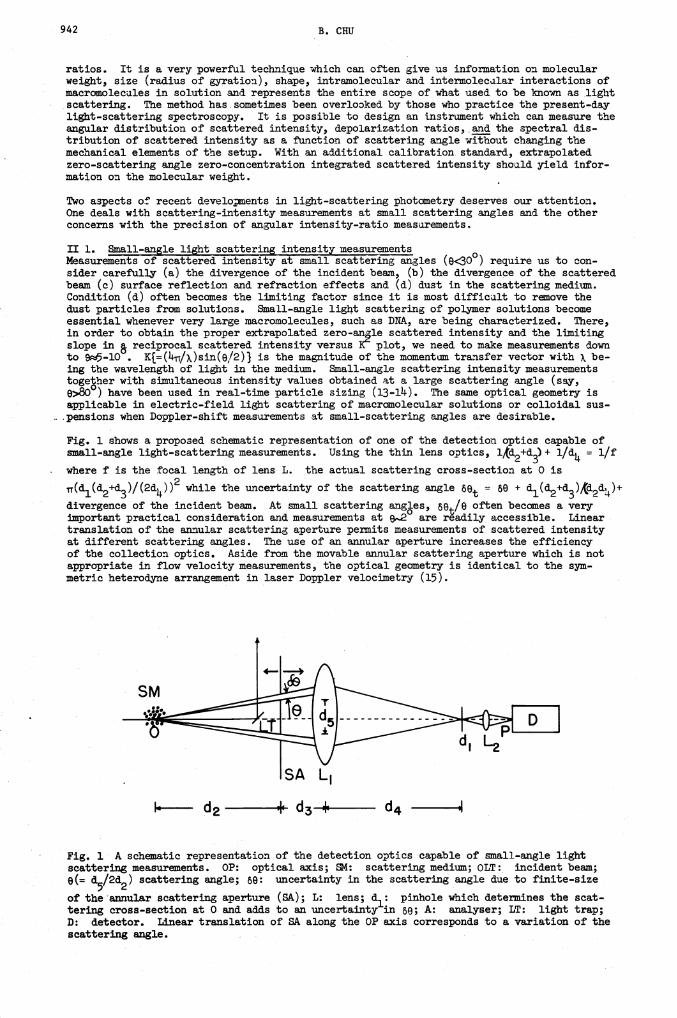
Fig. 1 shows a proposed schematic representation of one of the detection optics capable ofsmall-angle light-scattering measurements. Using the thin lens optics, ld2+d3) + l/d = 1/fwhere f is the focal length of lens L. the actual scattering cross-section at 0 is
while the uncertainty of the scattering angle 68 = 69 ÷
divergence of the incident beam. At small scattering anges, 8e/e often becomes a veryimportant practical consideration and measurements at 9.2 are readily accessible. Linear.translation of the annular scattering aperture permits measurements of scattered intensityat different scattering angles. The use of an annular aperture increases the efficiencyof the collection optics. Aside from the movable annular scattering aperture which is notappropriate in flow velocity measurements, the optical geometry is identical to the syin-metric heterodyne arrangement in laser Doppler velocimetry (15).
Fig. 1 A schematic representation of the detection optics capable of small-angle lightscattering measurements. OP: optical axis; 1: scattering medium; OLT: incident beam;
e(= d5/2d2) scattering angle; 69: uncertainty in the scattering angle due to finite-sizeof the annular scattering aperture (SA); L: lens; d1: pinhole which determines the scat-tering cross-section at 0 and adds to an uncertainty in oe; A: analyser; LT: light trap;D: detector. Linear translation of SA along the OP axis corresponds to a variation of thescattering angle.
SM
d2 *d3+ d4 '1
Advances in methods of light—scattering spectroscopy 943
II 2. Angular intensityratio measurementsA precise determiriition of angular distribution of scattered intensity to about ÷0i% us-ing an incident wavelength of L88.o nm at scattering angles approaching 15 and 170 repre-sents a resolution of about 5 in the correlation length. Such an instrument should beuseful in determining the radius of gyration of many biological macromolecules, such asproteins, and should compliment the small-anle X..ray scattering technique. For macro-molecules with sizes in the range of say 50 A, the solution-clarification procedure in factbecomes somewhat siinpler as much more strigent measures., such as centrifugation of solutionat very high speeds, can be utilized. Nevertheless, the dust problem remains a limitingfactor in all such studies.
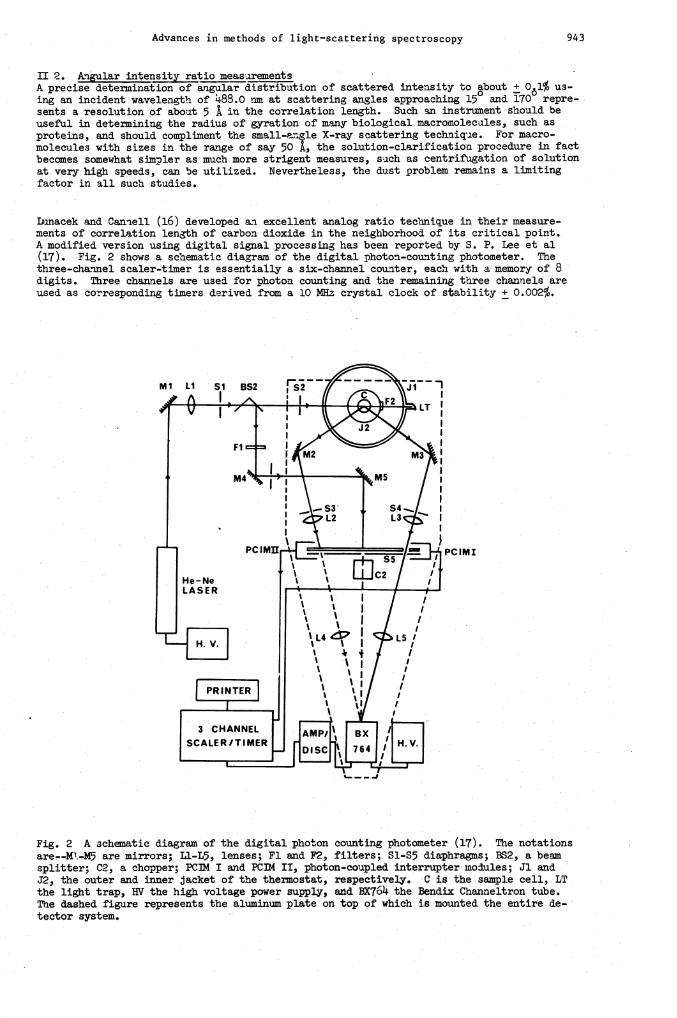
Lunacek and Catriell (16) developed an excellent analog ratio technique in their measure-ments of correlation length of carbon dioxide in the neighborhood of its critical point.A modified version using digital signal processing has been reported by S. P. Lee et al(17). Fig. 2 shows a schematic diagram of the digital photon-counting photometer. Thethree-ch&'inel scaler-timer is essentially a six-channel counter, each with a memory of 8digits. Three channels are used for photon counting and the remaining three channels areused as corresponding timers derived from a 10 MFIz crystal clock of stability ± 0.002%.
PCIMI
Fig. 2 A schematic diagram of the digital photon counting photometer (17). The notations
are--M-M5 are mirrors; Ll-L5, lenses; Fl and P2, filters; 51-55 diaphragms; BS2, a beamsplitter; C2, a chopper; PC]}I I and PCIM II, photon-coupled interrupter modales; Jl andJ2, the outer and inner jacket of the thermostat, respectively. C is the sample cell, LT
the light trap, 1W the high voltage power supply, arid BX76I the Bendix Chanrieltron tube.The dashed figure represents the aluminum plate on top of which is mounted the entire de-
tector system.
944 B. CHU
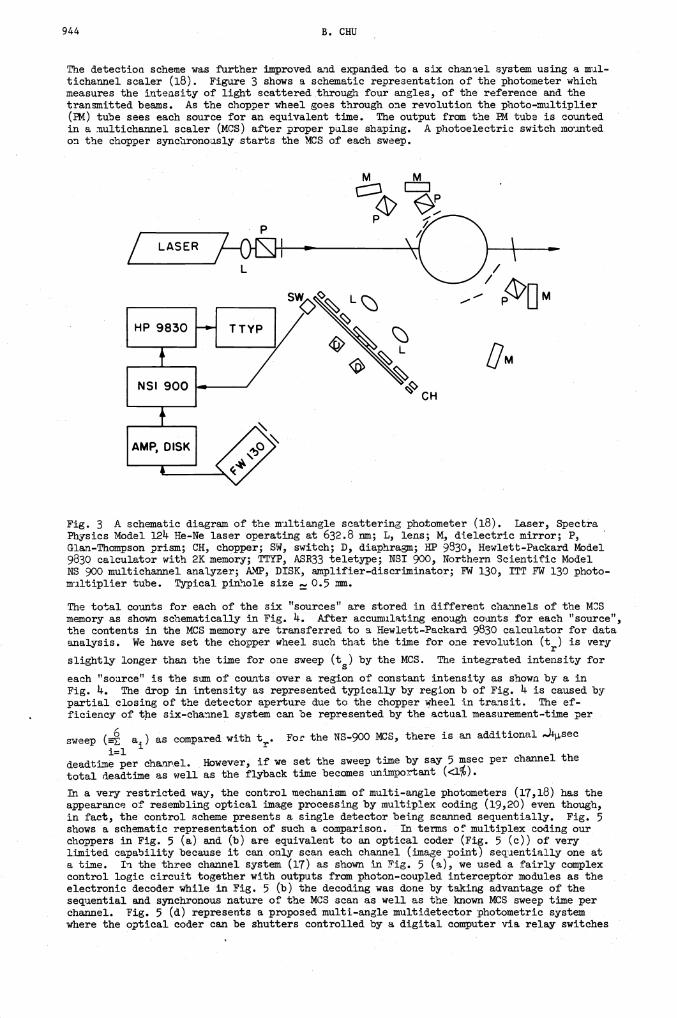
The etectioa scheme was further improved and expaned to a six chatriel system using a rxril-tichannel scaler (18) . Figure 3 shows a schematic representation of the photometer whichmeasures the inte.asity of light scatteredthrough four angles, of the reference and. thetransmitted beams. As the chopper wheel goes through one revolution the photo-multiplier(vi) tube sees each source for an equivalent time. The output from the 4 tube is countedin a multichannel scaler (MCS) after proper pulse shaping. A photoelectric switch mountedon the chopper synchronously starts the MCS of each sweep.
M M
t::c:P
'U1___.._, UM
CM
CH
Fig. 3 A schematic diagram of the multiangle scatterin photometer (18). Laser, SpectraPhysics Model 1214 He-Ne laser operating at 632.8 rim; L, lens; M, dielectric mirror; P,Glan-Thompson prism; CH, chopper; SW, switch; D, diaphran; HP 9830, Hewlett-Packard Model9830 calculator with 2K memory; TTYP, ASR33 teletype; NSI 900, Northern Scientific ModelKS 900 multichannel analyzer; AMP, DISK, amplifier-discriminator; FW 130, ITT F 130 photo-multiplier tube. Typical pinhole size 0.5 imn.
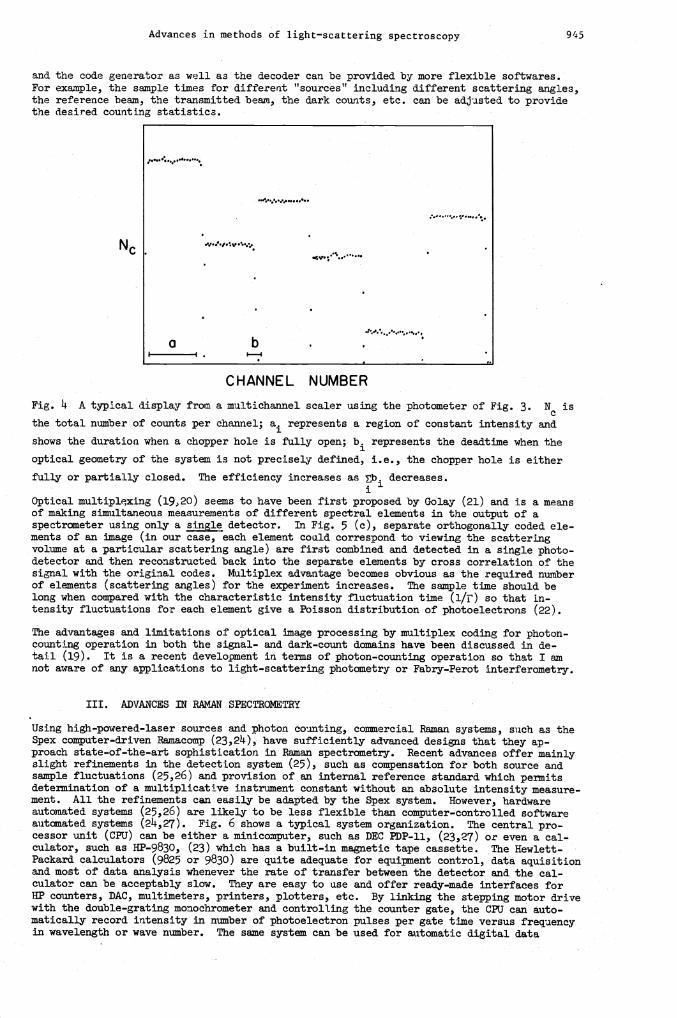
The total counts for each of the six "sources" are stored in different channels of the MSmemory as shown schematically in Fig. 14 After accumulating enough counts for each "source",the contents in the MCS memory are transferred to a Hewlett-Packard 9830 calculator for dataanalysis. We have set the chopper wheel such that the time for one revolution (tr) is very
slightly longer than the time for one sweep (t5) by the MCS. The integrated intensity for
each "source" is the sum of counts over a region of constant intensity as shown by a in
Fig. . The drop in intensity as represented typically by region b of Fig. L is caused bypartial closing of the detector aperture due to the chopper wheel in transit. The ef-ficiency- of the six-channel system can be represented by the actual measurement-time per
sweep ( a) as compared with t,. Foi the NS-900 MCS, there is an additional 4sec
deadtimé per channel. However, if we set the sweep time by say 5 msec per channel the
total deadtime as well as the flyback time becomes unimportant (<i%).
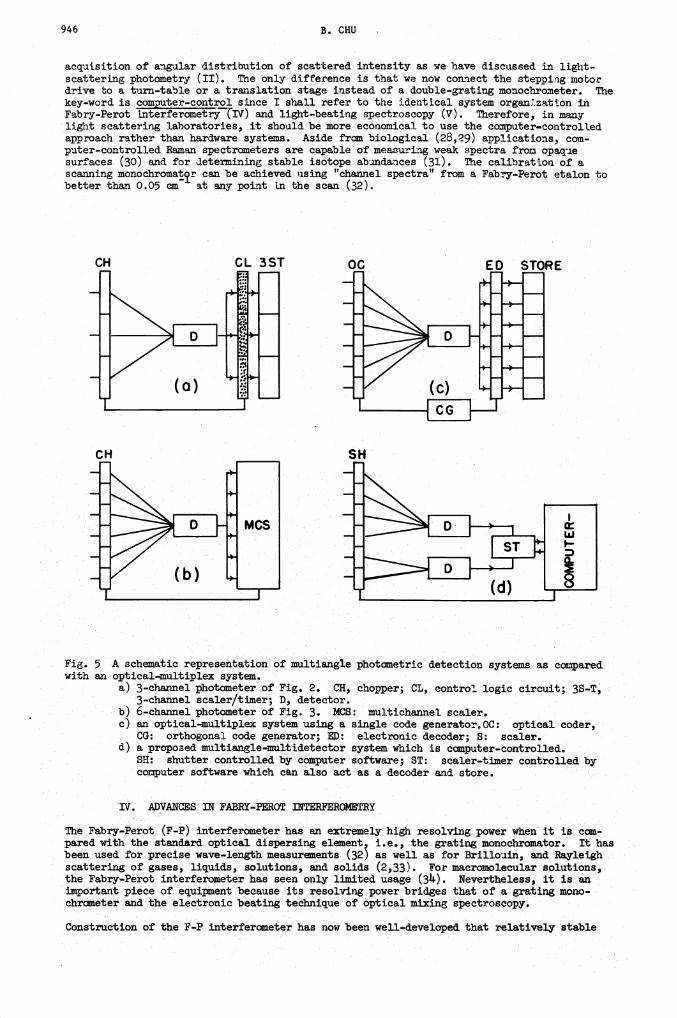
In a very restricted way, the control mechanism of multi-angle photometers (17,18) has the
appearance of resembling optical image processing by multiplex coding (19,20) even though,in fact, the control scheme presents a single detector being scanned sequentially. Fig. 5shows a schematic representation of such a comparison. In terms of multiplex coding ourchoppers in Fig. 5 (a) and (b) are equivalent to an optical coder (Fig. 5 (c)) of verylimited capability because it can only scan each channel (image point) sequentially one ata time. In the three channel system (17) as shown in Fig. 5 (a), we used a fairly complexcontrol logic circuit together with outputs from photon-coupled interceptor modules as theelectronic decoder while :j Fig. 5 (b) the decoding was done by taking advantage of thesequential and synchronous nature of the MCS scan as well as the known MCS sweep time perchannel. Fig. 5 (d) represents a proposed multi-angle multidetector photometric systemwhere the optical coder can be shutters controlled by a digital computer via relay switches
L
Advances in methods of light—scattering spectroscopy 945
and the code generator as well aa the decoder can be provided by more flexible softwares.For example, the sample times for different "sources" including different scattering angles,the reference beam, the transmitted bean, the dark counts, etc. canbe adjusted to providethe desired counting statistics.
Nc .
a b .I I. 1 .
CHANNEL NUMBER
Fig. 1 A trpica1 display from a multichannel scaler using the photometer of Fig. 3. Nc is
the total number of counts per channel; a1 represents a region of constant intensity and
shows the duration when a chopper hole is fully open; b1 represents the deadtime when the
optical geosietry of the system is not precisely defined, i.e., the chopper hole is either
fully or parbially closed. The efficiency increases as Eb. decreases.i
Optical multiplexing (l92O) seems to have been first proposed by Golay (21) and is a meansof making simultaneous measurements of different spectral elements in the output of aspectrometer using only a sine detector. In Fig. 5 (c), separate orthogonally coded ele-ments of an image (in our case, each element could correspond to viewing the scatteringvolume at a particular scattering angle) are first coxibined and detected in a single photo-detector and then reconstructed back into the separate elements by cross correlation of thesignal with the original codes. Multiplex advantage becomes obvious as the required numberof elements (scattering angles) for the experiment increases. The sample time should belong when compared with the characteristic intensity fluctuation time (1/I') so that in-tensity fluctuations for each element give a Poisson distribution of photoelectrons (22).
The advantages and limitations of optical image processing by multiplex coding for photon-counting operation in both the signal- and dark-count domains have been discussed in de-tail (19). It is a recent development in terms of photon-counting operation so that I amnot aware of any applications to light-scattering photometry or Fabry-Perot interferometry.
III. A])VANCES IN RAMAN SPECTROZ€TRY
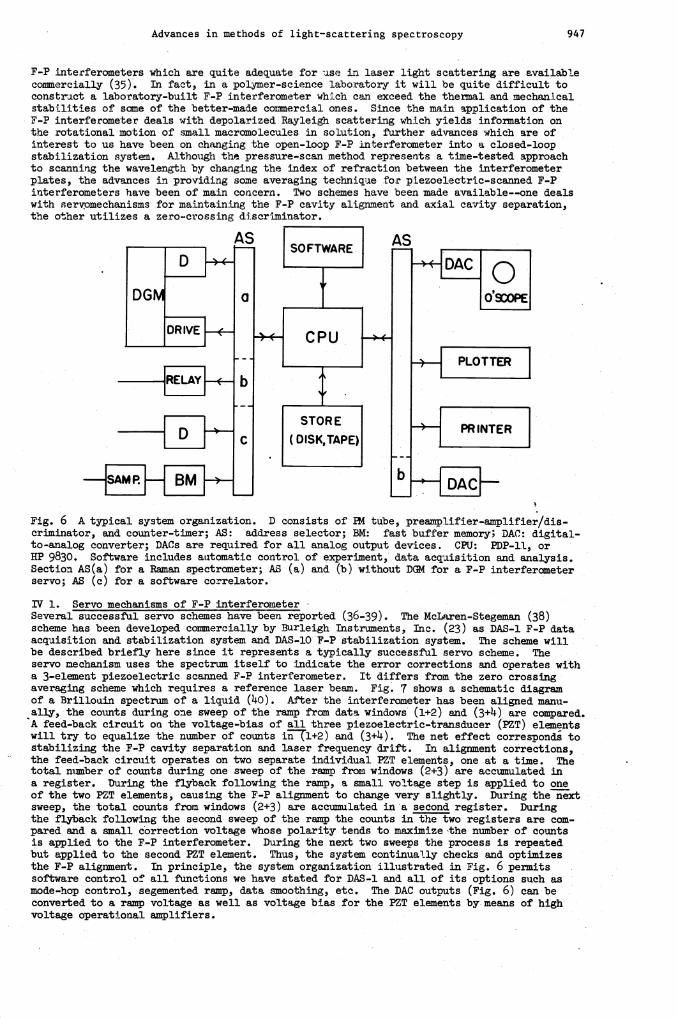
Using high-powered-laser sources and photon counting, connercial Remansystems, such as theSpex computer-driven Rainacomp (23,21k), have sufficiently advanced designs that they ap-proach state-of-the-art sophistication in Raman spectrometry. Recent advances offer mainlyslight refinements in the detection system (25), such as compensation for both source andsample fluctuations (25,26) and provision of an internal reference standard which permitsdetermination of a multiplicative instrument constant without an absolute intensity measure-ment. All the refinements can easily be adapted by the Spex system. However, hardwareautomated systems (25,26) are likely to be less flexible than computer-controlled softwareautomated systems (2L,27). Fig. 6 shows a typical system organization. The central pro-cessor unit (CPU) can be either a minicomputer, such as DEC PDP-ll, (23,27) or even a cal-culator, such as HP-9830, (23) which has a built-in magnetic tape cassette. The Hewlett-Packard calculators (9825 or 9830) are quite adequate for equipment control, data aquisitionand most of data analysis whenever the rate of transfer between the detector and the cal-culator can be acceptably slow. They are easy to use and offer ready-made interfaces for
HP counters, DAC, multimeters, printers, plotters, etc. By linking the stepping motor drivewith the double-grating monochrometer and controlling the counter gate, the CR1 can auto-matically record intensity in number of photoelectron pulses per gate time versus frequencyin wavelength or wave number. The same system can be used for automatic digital data
946 B. CHU
• acquisition of angular distribution of scattered intensity as we have discussed in light-scattering photometry (II). The only difference is that we now connect the stepping motordrive to a turn-table or a translation stage instead of a.double-rating monochrometer. The
key-word is puter-contro1 since I shall refer to the identical system 'organ:.zation in
Fabry-Perot i.nterferometry (Iv) and light-beating spectroscopy (v). Therefore, in manylight scattering laboratories, it should be more econOmical to use the computer-controlledapproach rather than hardware systems. Aside from biological (28,29) applications, com-puter-controlled Reman spectrometers are capable of measuring weak ipectra from opaquesurfaces (30) and for determining stable isotope abnidances (31). The calibration of a
scanning monochromat1r can be achieved using "channel spectra" froma Fabry-Perot etalon tobetter than 0.05 cm at any point 1n the scan (32).
Fig 5 A schematic representation of multiangle photometric detection systems as comparedwith an optical-multiplex system.
a) 3-channel photometer of Fig 2 CH, chopper, CL, control logic circuit, 35-T,•
3-channel scaler/timer; D, detector.b) 6-channel photometer of Fig 3 MCS multichannel scalerc) an optical-multiplex system using a single code generator OC optical coder,
CG: orthogonal code generator; ): electronic decoder; B: scaler.d) a proposed multiangle-multidetector system which is computer-controlled.
• SH: shutter controlled by computer software; ST: scaler-timer controlled bycomputer software which can also act as a decoder and store
•
IV. ADVANCES IN FABRY-PBROT INTERFEROMETRY
The Fabry-Perot (F-P) interferometer has an extremely high resolving power when it is com-pared with the standard optical dispersIng element, i.e., the grating rnonocbromator. It hasbeen used for precise wave-length measurements (32) as well as for Brilloiin, and Rayleigh
scattering of gases, liquids, solutions, and solids (2,33). For macromolecular solutions,the Fabry-Perot interferometer has seen only limited usage (31k) Nevertheless, it is an
important piece of equipuent because its resolving power bridges that of a grating mono-chrometer and the electronic beating technique of• optical mixing spectroscopy.
Construction of the F-P interferometer has now been wefl-developed that relatively stable
CH CL 3ST Op
LIF
ED STORE
HL-
4-p.
(c)
MCS
—J 1• (d)
Advances in methods of light—scattering spectroscopy 947
F-P interferometers which are quite adequate for use in laser light scattering are availablecommercially (35). In fact, in a polymer-science laboratory it will be quite difficult toconstrict a laboratory-built F-P interferometer which can exceed the thermal and mechanicalstabilities of some of the better-made commercial ones. Since the main application of theF-P interferometer deals with depolarized Rayleigh scattering which yields infoiation onthe rotational motion of small macromolecules in solution, further advances which are ofinterest to us have been on changing the open-loop F-P Interferometer into a closed-loopstabilization system. Although the pressure-scan method represents a time-tested approachto scanning the wavelength br changing the index of refraction between the interferometerplates, the advances in providing some averaging tecbnijie for piezoelectric-scarmed F-Pinterferometers have been of main concern. Two schemes have been made available--one dealswith servpmechanisms for maintaining the F-P cavity alignment and axial cavity separation,the other utilizes a zero-crossing discriminator.
SOFTWARE
Fig. 6 A typical system organization. D consists of tube, preanipiifier-amplifier/dis-criminator, and counter-timer; AS: address selector; BM: fast buffer manory DAC: digital-to-analog converter; DACs are required for all analog output devices. CPU: PDP-li, orHP 9830. Software includes automatic control of experiment,, data acquisition and analysis.Section AS(a) far a Reman spectrometer; AS (a) and (b) without DCI for a F-P interferometerservo; AS (c) for a software correlator.
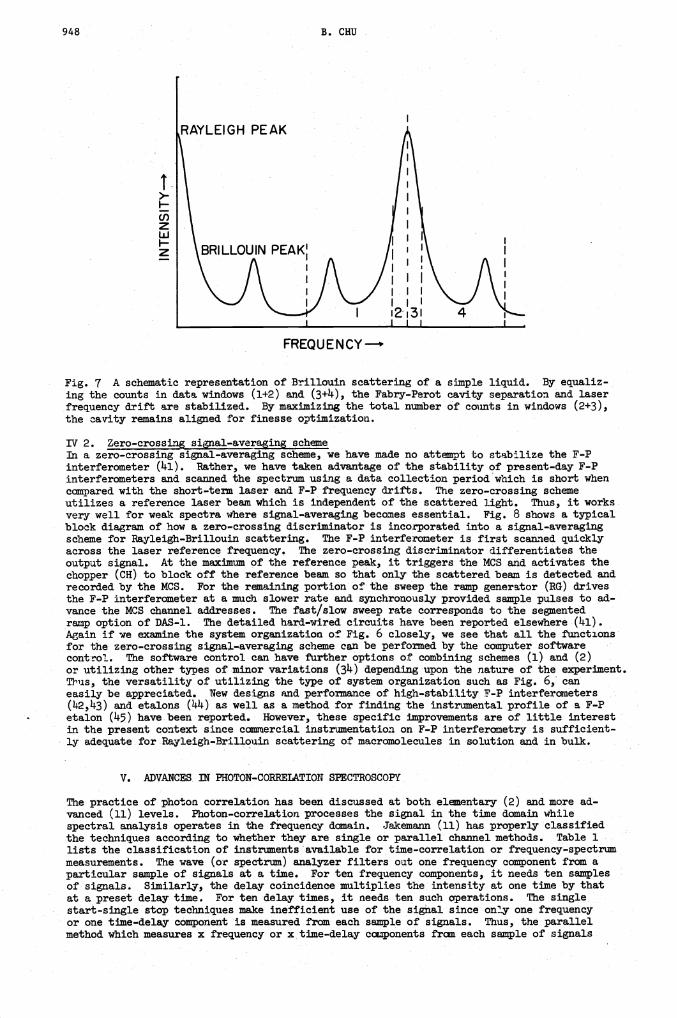
1ST 1. Servo mechanisms of F-P interferometerSeveral successful servo schemes have been reported (36-39). The McLaren-Stegeman (38)scheme has been developed commercially by Burleigh Instruments, Inc. (23) as DAS-l F-P dataacquisition and stabilization system and DAS-lO' F-P stabilization system. The scheme willbe described briefly here since it represents a typically successful servo scheme. Theservo mechanism uses the spectrum itself to indicate the error corrections and operates witha 3-element piezoelectric scanned F-P interferometer. It differs from the zero crossingaveraging scheme which requires a reference laser beam. Fig. 7 shows a schematic diagramof a Brillouin spectrum of a liquid (lO). After the interferometer has been aligned manu-ally, the counts during one sweep of the ramp from data windows' (1+2) and (3+1k) are compared.A feed-back circuit on the voltage-bias of all three piezoelectrlc-transducer (PZT) elementswill try to equalize the number of counts il+2) and (3÷1k). The net effect corresponds toStabilizing the F..P cavity separation and laser frequency drift. In alignment corrections,the feed-back circuit operates on two separate individual PZT elements, one at a time. Thetotal number of counts during one sweep of the ramp from windows (2+3) are accumulated ina register. During the flyback following the ramp, a small voltage step is applied to oneof the two PZT elements, causing the F-P alignment to change very slightly. During the nextsweep, the total counts from windows (2+3) are accumulated in 'a second register. Duringthe flyback following the second sweep of the ramp the counts in the two registers are com-pared and a small correction voltage whose polarity tends to maximize the number of countsis applied to the F.-P interferometer. During the next two sweeps the process is repeatedbut applied to the second PZT element. Thus, the system continually checks and optimizesthe F-P alignment. In principle, the system organization illustrated in Fig. 6 permitssoftware control of all functions we have stated for DAS-l and all of its options such asmode-hop control, segemented ramp, data smoothing, etc. The DAC outputs (Fig. 6) can beconverted to a ramp voltage as well as voltage bias for the PZT elements by. means of highvoltage operational amplifiers.
948 B. CHU
. FREQUENCY—
Fig. 7 A schematic representation of Brillouln scattering of a simple liquid. By equaliz-ing the counts in data windows (1+2) and (3+I), the Fabry.-Perot cavity separation and laserfrequency drift are stabilized. By maximizing the total rnnnber of counts in windows (2+3),the cavity remains aligned for finesse optimization.
1ST 2 . Zero-crossinsignal-avera4ing schneIn a zero—crossing signal-averaging scheme, we have made no attempt to stabilize the F-Pinterferometer (I'l) . Rather, we have taken advantage of the stability of present-day F-Pinterferometers and scanned the spectrum using a data collection period which is short whencompared with the short-term laser and F-P frequency drifts. The zero-crossing schemeutilize3 a reference laser beam which is independent of the scattered light. Thus, it worksvery well for weak spectra where signal-averaging becomes essential. Fig. 8 shows a typicalblock diagram of how a zero-crossing discriminator is incorporated into a signal-averagingscheme for Rayleigh-Brillouin scattering. The F-P interferozieter is first scanned quicklyacross the laser reference frequency. The zero-crossing discriminator differentiates theoutput signal. At the maximum of the reference peak, it triggers the MCS and activates thechopper (cH) to block off the reference besan so that only the scattered beam is detected andrecorded by the MCS. For the remaining portion of the sweep the ramp generator (RG) drivesthe F-P interferometer at a much. slower rate and. synchronously provided sample pulses to ad-vance the MCS channel addresses. The fast/slow sweep rate corresponds to the segmentedramp option of DAS-l. The detailed hard-wired circuits have been reported elsewhere (If 1).Again if we examine the system organization of Fig. 6 closely, we see that all the functionsfor the zero-crossing signal-averaging scheme can be performed by the computer softwarecontrol. The software control can have f\irther options of combining schemes (1) and (2)or utilizing other types of minor variations (3If) depending upon the nature of the experiment.Thus, the versatility of utilizing the type of system organization such as Fig. 6, can
easily be appreciated. New designs and performance of high-stability F-P interferometers(1f2,If3) and etalons (l4f) as well as a method for finding the instrumental profile of a F-P
etalon (1f5) have been reported. However, these specific improvements . are of little interestin the present context since commercial instrumentation on F-P interferonietry is sufficient-
ly adequate for .Rayleigh-Brillouin scattering of macromolecules in solution and in bulk.
V. ADVANCES IN PHOTON-CORRELATION SPECTROSCOPY
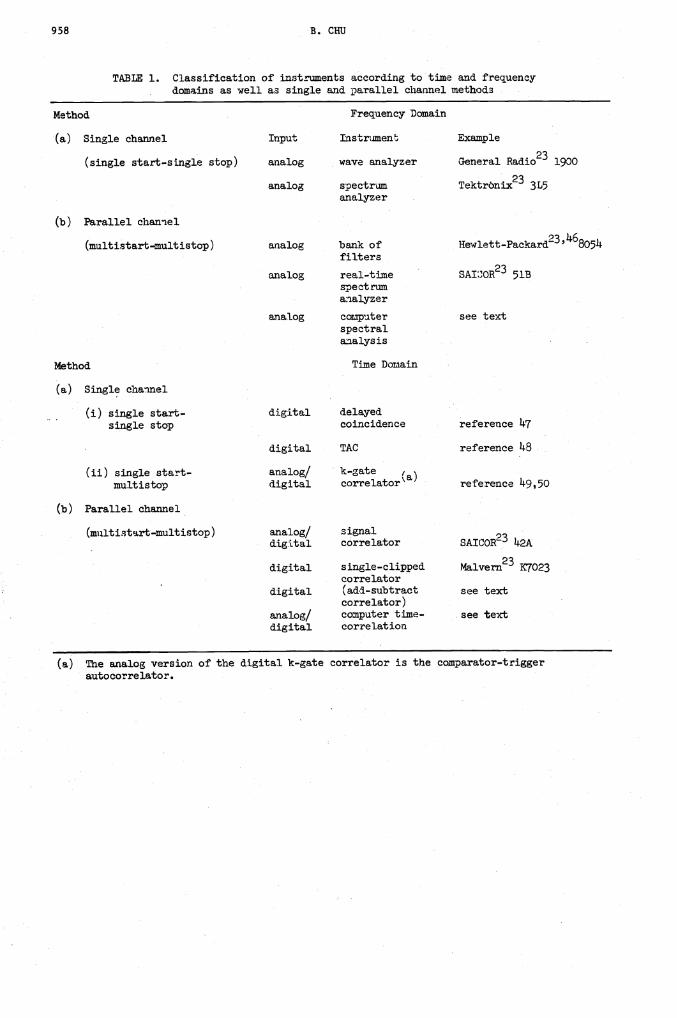
The practice of photon correlation has been discussed at both elementary (2) and more ad-vanced (11) levels. Photon-correlation processes the signal in the time domain whilespectral analysis operates in the frequency domain. Jake.mann (11) has properly classified.the techniques according to whether they are single or parallel channel methods. Table 1lists the classification of instruments available for, time-correlation or frequency-spectrummeasurements. The wave (or spectrum) analyzer filters out one frequency component from aparticular sample of signals at a time. For ten frequency components, it needs ten samplesof signals. Similarly, the delay coincidence multiplies the, intensity at one time by thatat a preset delay time. For ten delay times, .it needs ten such operations. The single.start-single stop techniques make inefficient use of the signal since on_y one frequencyor one time-delay cOmponent is measured from each sample of signals. Thus, the parallelmethod which measures x frequency or xtime-delay components from each sample of signals
LEIGH PEAK
1.>-I-C')2wI-2
Advances in methods of light—scattering spectroscopy 949
].ncieases the efficiency of measurement time by a factoc of x and improves the signal-to-noise ratio. A compromise for the single-channel instrument would be to record (51) thesaij'1e of signals and analyze the same sample at each frequency or time-delay component.Such a procedure can reduce the experiment time comparable to the parallel Tnethod but in-creases the analysis time by a factor of at least x. The computer approach in light-scattering spectroscopy essentially utilizes this advantage. All coimnerciallr availablehardware wave- and spectrum-analyzers accept mainly analog signals . The inherent digitalnature of photoelectron pulses should give an edge to those instruments which accept a digi-tal input and carry out the analysis digitally. Consequently, we shall be concerned mainlywith photon correlation.
•In this section, I shall concentrate on two aspects of photon correlation. One measuresthe arrival times of photoelectron pulses; the other cOncers with measurements of number ofphotoelectron pulses per sple tine which is short when compared with the characteristtctime of the signal of interest. Most corsmercial correlators have capabilities to make
probability density function or photoelectric counting distribution (52) measurements. Theconstruct'ion of a' sinrple analog device for such measurements has also been reported (53).However, our main nterest in studying dynamical properties of mac:rcmolecules in solutionis based on a more direct measure of the tine-correlation fuiction.
V 1. otoelectronThere have been no recent advances in hardware instrunientatton on detennning intensity cor-relation i\incttons using arriral times of photoelectric pulnes. The techn.que seems to have
originated in 2!r and has been popular in perturbed angular correlation (PAc)measurements which, for exunple, can be related to magnetic moments of short-lived excitediuciear states (51_56) . ' It is capable of measurements at very short delay times , ' e.g. , 1'isec per channel which is about 50 times shorter than the fastest co;rnnercial Malvern cor-
relator (23), is continuously being refined (57) and routinely used (58) by nuclear physi-cists. An interesting observation is that neither discipline, i.e., the laser physicistsand the nuclear physicists, seems to be very much aware of the athrances made by the otherdiscipline since there are few cross references. For example, a long-period time-to-pulseheight converter (59) was developed for half-lives in the range of sec to sec while tcould be quite possibly better to use a digital correlator which has already been developedat the time. '
' ' '
The use of a time-to-amplitude converter (TPC) together with a pulse-height analyzer (PHA)for phobon time-of-.arrival measurements has been explored (60-62 ). The method has severaladvantages because the TAC processes individial photoelectron pilses ind therefore is ibleto make correlation meastrements on very weak optical fields. Secondly, as we have alreadystated, it is capable of making photon correlation measurements of very short delay times.In this respect, the range is appropriate for making measurements on the rotational motionof small macromolecules in solution. Unfortunately, all previous reviews and books (1-fl)have neglected this method with few listed references (2).
Davidson and Mandel (61) has presented a detailed mathematical analysis of the operation ofthe TAC. Davidson (62) developed a procedure for the measurement of second-order<:I(x,t)I(x,t+,-):> and third order <:I(x,t)I(x,t+'r, )I(x,t+r0):> intensity correlation func-tions with the use, of a TAC. "The essential features are 'summarized as follows.
In a stationary optical field, the two-fold joint probability function p (x1,t ;x,),t+r) that
a photoelectron pulse from a photodetector located at x1 appears in the 'start' channel at
time within t and t+ 6t and another photoelectron pulse from a second photodetectorlocated at x2 appears in the 'stop' channel at a time within t+'r + i- depends only on i- and
is given by (63,6I)
p(x1,t; x2,t+r) = 1cy2C2S1895t6'r <I(x1,t) I(x2,t+.r)> (1)
where I(x1,t) and I(x2,t) are 'the light intensities located at x1 and x2 from photodetectorsexpressed in units of photons per unit volume,S1 and 2 are the surface areas and and
are the dimensionless quantum efficiencies of the two photod.etectors. C is. a proportion-ality constant, the bracket represents a time (or ensemble) average and the expression
is a cross-correlation function. In order for the TAC to register a time
interval , it is necessary not only that a 'stop' pulse appears r seconds following the'start' pulse, but also that no other 'stop' pulses occur within . The modified two-fold
joint probability function '(x1,t;x2,t+.r: 'all other intervals) for a start pulse at x1and t, a stop pulse at x2 and t+.r, and no stop pulses at intervals t with i=l,2,(=r/&r), is given by
950 B. CHU
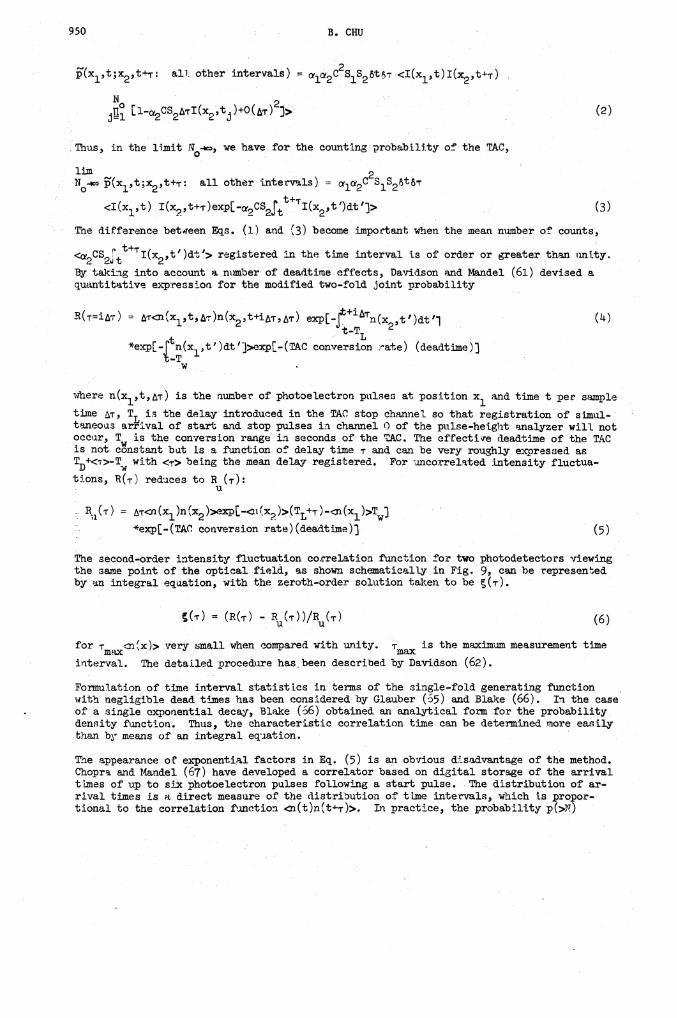
(x1,t;x2,t+T: all. other intervals) 12C2S1S28tT <I(1,t)I(x2,t--1)
J £12cs2TIX2t+O2J> (2)
Thus , in the itmit -' we have for the counting probability of the TAC,
urn 2.. N-,c (x,,t;x2,t+'r: all other intervals) = y12C S1S2t5r
<I(x1,t) ()
:. • The difference between Eqs. (1) and (3) become impottant when the mean number of counts,
rt+T , I . - . .<2CS2 I(x2,t )d > registered in the time interval is of order or greater than unity.
By taking into account a number of deadtime effects, Davidson and Mandel (6i) devised aquantitative expression for the modified two-fold joint probability
R(TiAT) = AT.n(x1,t,AT)n(x2,t+it'r,T) exp[_fTn(x2,t1)dt11(Lv)
.t_TL*exp[tfl(xtI)dtI]>xpi..(C conversion :ate) (deadtime)J
where n(x1,t,ti-) is the number of photoelectron pulses at position x1 and time t per sample
time Ar, TL is the delay introduced in the TAC stop channel so that registration of simul-taneous arrival of start and stop pulses in channel 0 of the pulse-height analyzer will not
occur, T is the conversion range in seconds of the TAC. The effectire deadtime of the TACis not constant but is a function of delay time i and can be very roughly expresued asTD+<r>_T with <-> being the mean delay registered. For uncorrelated intensity fluctua-tions, R(T) reduces to R ('r):
U
R.1(T) =
*exp(TAC conversion rate) (deadtime)] (5)
The second-order intensity fluctuation correlation function for two photodetectors viewingthe same point of the optical field, as shown schematically in Fig. 9, can be represented
by an integral equation, with the zeroth-order solution taken to be r).
= (R() - R())/R('r) (6)
for Tmax<n(X)> very small when compared with unity. Tmax is the maximum measurement timeinterval. The detailed procedure has been described by Davidson (62).
Formulation of time interval statist Lcs in terms of the single-fold generating functionwith negligible dead times has been considered by Glauber (65) and Blake (66). in the caseof a single exponential decay, Blake (66) obtained an analytical form for the probability.density function. Thus, the characteristic correlation time can he determined more easilythan b? means of an integral equation.
The appearance or exponential factors in Eq. (5) is an obvious disadvantage of the method.Chopra and Mandel (67) have developed a correlator based on digital storage of the arrivaltimes of up to six photoelectron pulses following a start pulse. The distribution of ar-rival times is a direct measure of the distribution of time intervals, which is propor-tional to the correlation function i(t)n(t-'r)>. In practice, the probability p(>jT)
that more than N counts are received in the given measurneut interval Tm must be keptvery small. In the absence of intensity correlationt,
p(>N) = ((t)r)N e 1(t)>Tmax (1 ±. N! N±l
2
+ (4(t)>Tna,) ÷ . . . ) .iTCTThen, p(>6)<103 for n(t)> In a N0-cbatTlel pulse-hetght analyzer, ¶m=Nr. ?or
a -charmnl time—to.digital converter (68), we get p(>) <2xlO3 when .ri(t)>'r .O.5. Thuswhen compared with the TAC technique we can tolerate apprectably higher countR rates witheven only consequetive arrival times.
V 2. italcorrelatorsItt surveying the advances in photon-correlation spectroscopy, I have come across interest-ing contributions made by radio ant ronomers who have been using the one-bit correlationtechnique to meas ire the spectra of radio astronomy signals for more than ten years (69.-7l).
Although their emphasis is piite difTerent from studying inacromolecular dynamics, it isworthwhile to briefly review their work as their contributions have been neglected virtuallycompletely by previous reviews and monographs. In this section, I shall (a) briefly si.mi-marize the contributions made by radio astronomers, and discuss recent advances in (b) hard-
ware correlators and (c) computer-controlled systems.
V 2(a). Brief survey of diitai-correlationtechniqies inradio-astrononiI. The one-bt orpolarity coincidence correlation method has become a widely accepted technique in radio as-trophysical spectral line measurements. It was first tsed by Goldstein (71) in 1961 tostudy characteristics of radar echoes from Venus. Aspects of digital correlation tech-niques as applied to radio astronomical signals have been discussed by a nber ofauthors (70-76). Although the one-bit correlation method (70,72,77-79) entails a theo-retical loss of sensitivity, its simplicity and stability have made the technique more pop-ular than multibit systems (73). Lately, however, more sophisticated designs such as a10214-channel digital correlator (80) and multipulse correlators (Bl-83), have been reported.Hagen and Parley (81k) have presented an excellent review on "Digital-correlation techniquesin radio science."
In real-time signal processing the rates at which the products must be formed and storedfor the correlation function estimate are far beyond the speed of present-day general pur-
pose computers. Two general techniques, used either separately or together, have been ap-plied to overcome this difficulty. One is to use hardware special purpose correlators andthe other is to use coarse quarttization of signals so as to simplify the required multi-
plications. Hagen and Parley (8L) have discussed ten different schemes in comparison withfull correlation, all of which have been listed in their Table 1.
Advances in methods of light—scattering spectroscopy 951
(7)
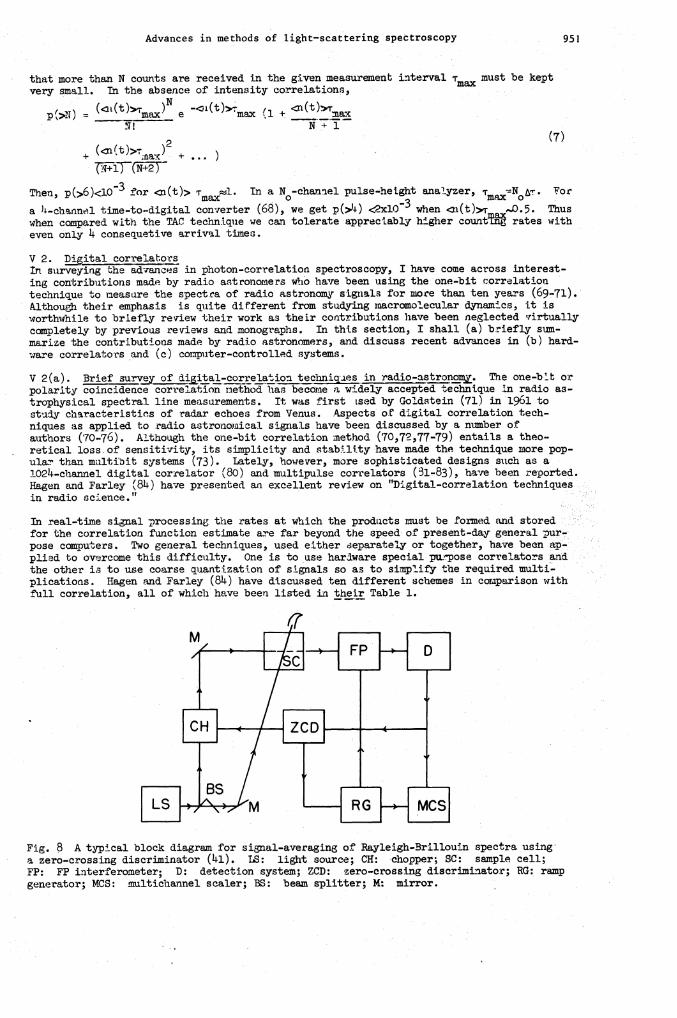
RJHFig. A typical block diagram for signal-averaging of Rayleigh-Brillouin spectra usinga zero-crossing discriminator (4l). LS: light source; Cli: chopper; SC: sample cell;FP: PP interferometer; D: detection system; ZCD: zero-crossing discriminator; RG: rampgenerator; MCS: multichannel scaler; BS: beam splitter; M: mirror.
952 B. CHU
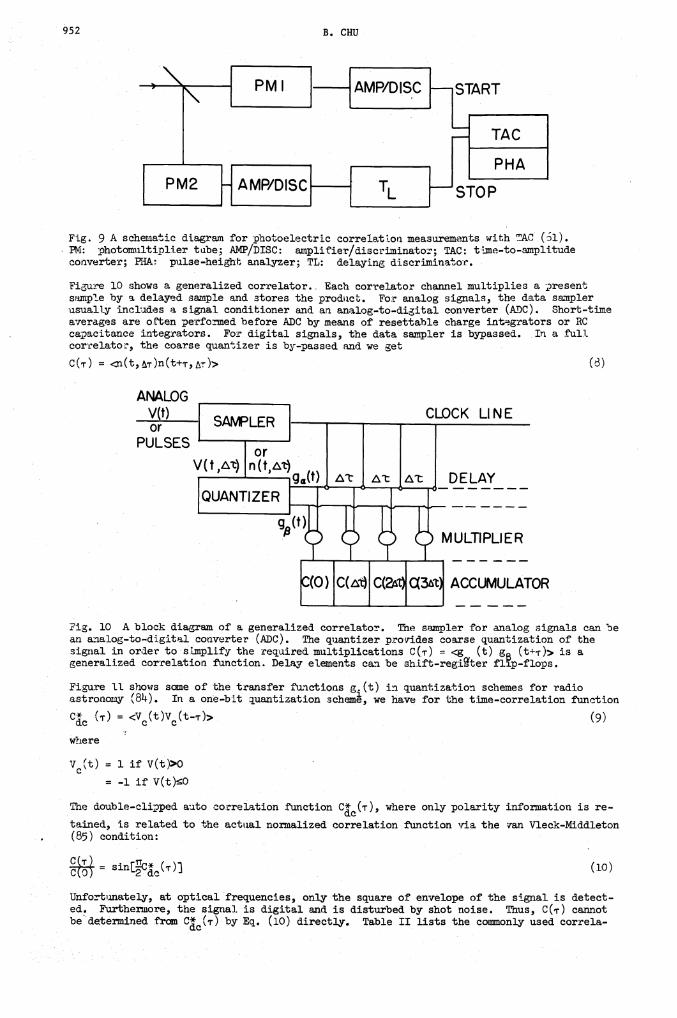
Fig. 9 A schematic diagram for photoelectric correlatori measurements with TAC (si).PI: photomultiplier tube; AI/DISC: amplifier/discriminator; TAC: time-to-amplitudeconverter; PHA: pulse-height analyzer; TL: delaying discriminator.
Figure 10 shows a generalized correlator. Each correlator channel multiplies a presentsample by a delayed sample and stores the product. For analog signals, the data samplerusually includes a signal conditioner and an analog-to-digital converter (ADC). Short-timeaverages are often performed before ADC bymeans of resettable charge intgrators or RCcapacitance integrators. For digital signals, the data sampler is bypassed. In a full.
correlator, the coarse quantizer is by-passed and we get
C(T) = .n(t,T)n(t+T,-)> ()
ANALOG _________
t) L SAMPLER —PULSES
orV(f,it) n(t,tt)
LQUANTIZER
MULTIPLIER
ACCUMULATOR
Fig. 10 A block diagram of a generalized. correlator. The sampler for analog signals can bean analog-to-digital converter (ADC). The quantizer provides coarse quantization of thesignal in order to stmplify the required multiplications C(T) = g (t) g (t+'r)> is ageneralized correlation function. Delay elements can be shift-register f]3p-flops.
Figure 11 shows some of the transfer functions g.(t) in quantization schemes for radioastronomy (81k). In a one-bit uantization schem, we have for the time-correlation function
= Vc(t)Vc(t_1)> (9)
where
v (t) = 1 if v(t)>oc
= -l if v(t)�oThe double-clipped auto correlation function Cc(1) where only polarity information is re-
tained, is related to the actual normalized correlation function via the van Vleck-Middleton(85) condition:
= Sifl[C(T)) (10)
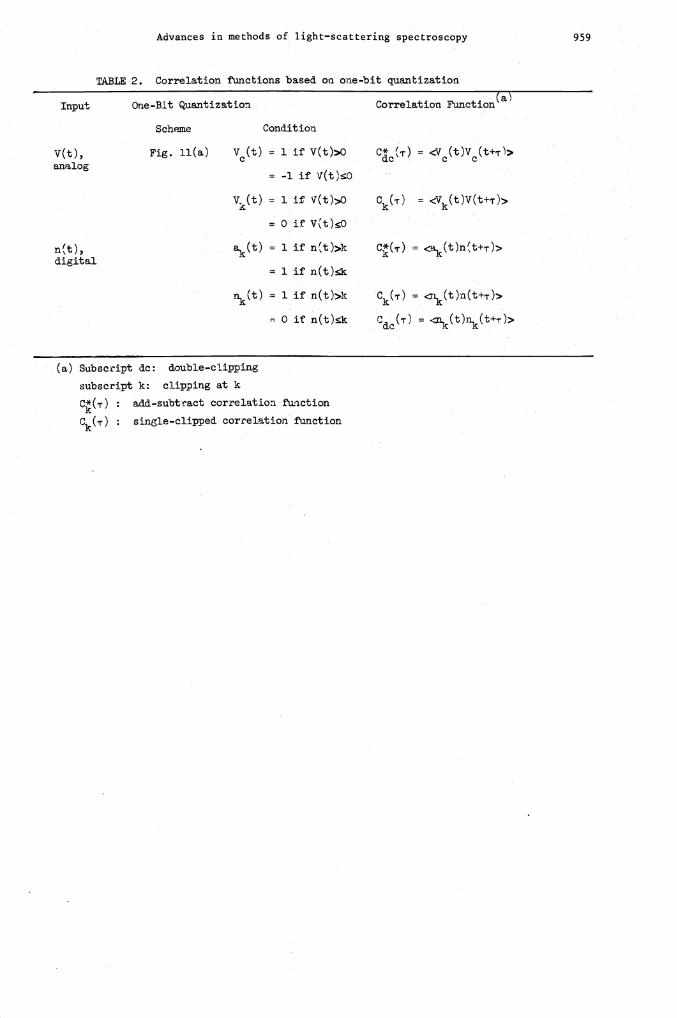
Unfortunately, at optical frequencies, only the square of envelope of the signal is detect-ed. Furthermore, the signal is digital and is disturbed by shot noise. Thus, C('r) cannotbe determined from C(T) by Eq. (io) directly. Table II lists the coasnonly used correla-
CLOCK LINE
DELAY
1—
Advances in methods of light—scattering spectroscopy 953
tion functions based on the one-bit coarse quantization scheme. The three-level and two-bitquantization schemes have not been used in macromolecular-dynamics studies.
V 2(b). Pdvances in hardware correlators. The hardware correlators as listed in Table IEhave basically the following type of capabilities:
(i) ideal correlaor (86) which measures
= (t)n(t+T)> = nn'p(n,n';'r) (8a)n=O n'=O
with p(n,n' ; ) being the joint probability distribution,
(ii) add-subtract correlator (50,87,88) which neasures
C(r) <a(t)n(t+T)> (11)
= iip(n,n';'r) - np(n,n';i-)n0 n'=k+l n=0 nT=0
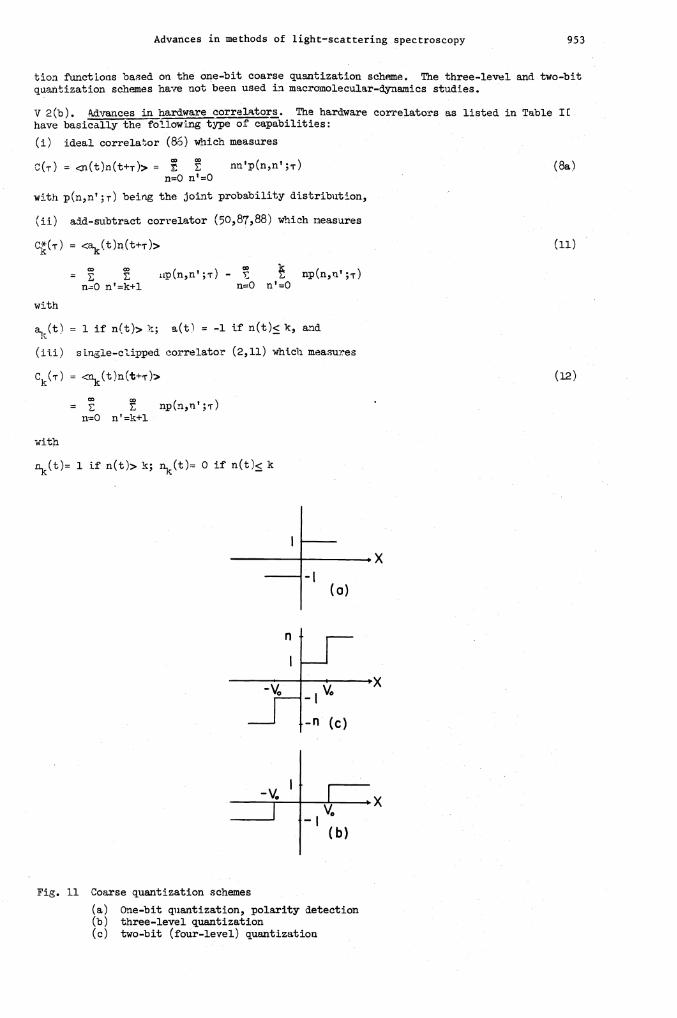
Fig. 11 Coarse quantization schemes
(a) One—bit quantization, polarity detection(b) three-level quantization(c) two-bit (four-level) quantization
with
a,(t)= 1 if n(t)> i; a(t) = -l if n(t)< k, and
(iii) single-clipped correlator (2,11) which measures
Ck(T) <a(t)n(t+'r)> (12)
= E E np(n,n';T)n=0 n'=k+l
with
1 if n(t)> k; nk(t)= 0 if n(t)< k
(a)
A—V0
-V.
-'V0
-n (c)
'V0(b)
954 B. CHU
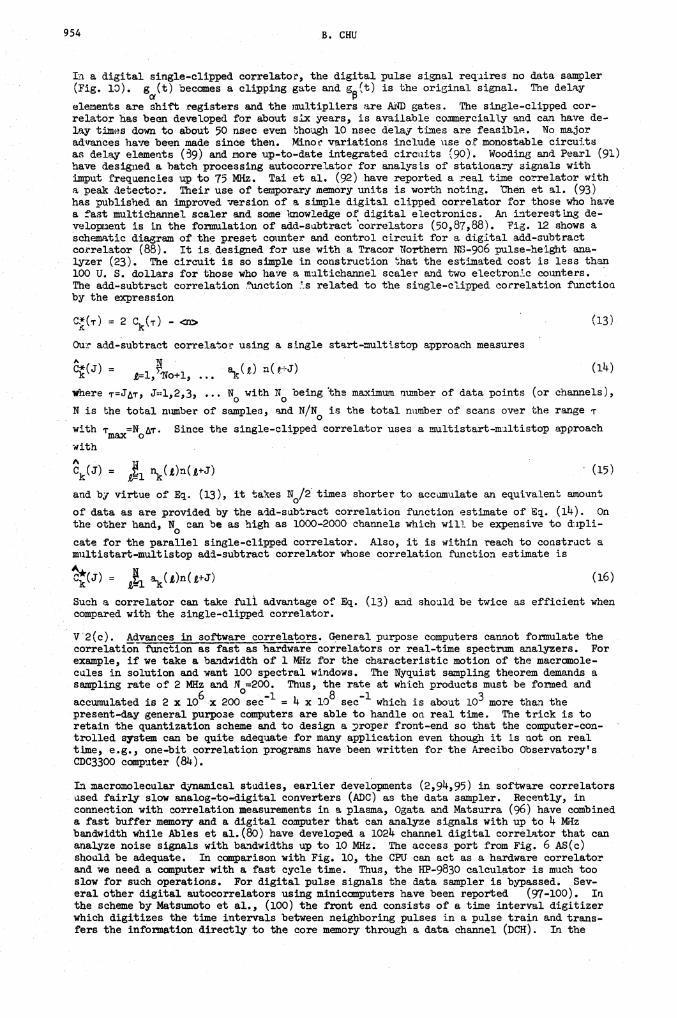
In a digital sing1ec1ipped corre1ato, the digital pulse sina1 reciires no data sampler.
(Fig. 13). g(t) becomes a clipping gate and g(t) is the original signal. The delay
eler.ients are shift registers and. the multipliers are AiD gates. The single-clipped cor-relator has been deieloped for about six years, is available conmercially and can have de—lay times down to about 50 nsec even though 10 nsec delay times are feas ible . No majoradcrances have been made since then. Minoc variations include use of monostable circu.tsas delay elements (9) and more up-to-date integrated circuits (90) . Wooding and Pearl (91)have designed a hatch processing autocorrelator for analysts of stationary signals with
imput frequencies up to 75 MHz. Tai et al. (92) have reported a real time correlator witha peak detector. Their use of temporary miory units is worth noting. then et al. (93)has published an improved version of a simple digital clipped correlator for those who havea at multichannel scaler and some knowledge of digital electronics. Art interestliig de-veloprient is Ln the forrtrulation of add-subtract correl.ators (50, 87, 88) . Fig. 12 shows aschematic diagram of the preset counter and control circuit for a digital add—subtractcorrelator (88). It is. designed for use with a Tracor Northern NS-906 pulse-height ama—
.
lyzer (23). The circuit is so simple in construction that the estimated cost is less than100 U. S. dollars for those who have a mi1tichanne1 scaler and two electronic counters.The add-subtract correlation .'wiction s related to the single-clipped correlation functioc
by the expression
C(T) 2 Ck(.r) - fl> . (13)
Our add-subtract correiaor using a single start-multstop approach measures
(J) =£=1,No+1, ...
n(p.÷J) (il#)
where T:=JT, J=1,2,3, ... N0witth N0 being he maximum nunber of data points (or channels),
N is the total number of samples, and N/N0 is the total number of scans over the range 'r
with Since the single—clipped correlator uses a multistart-nultistop approachwith .
Ck(J)= A %(L)n(LfJ)
.
(15)
and by virtue of Eq (13), it takes N0/2 times shorter to accumulate an equivalent amount
of data as are provided by the add-subtract correlation function estimate of (l1) . On
the other hand, N0 can be as high as 1000-2000 channels which will be expensive to thipli-cate for the parallel single-clipped correlator. Also, it is iithin reach to construct amultistart-multistop add-subtract correlator whose correlation function estimate is
= A ak(L)n(+J) (16)
Such a correlator can take ftilI advantage of Eq. (13) end should be twice as efficient whencompared with the single-clipped correlator.
V2(c). Advances inso±'tware correlators. General purpose computers cannot formulate thecorrelation function as fast as hardware correlators or real-time spectrum analyzers. Forexample, if we take a bandwidth of 1 MHz for the characteristic motion of the macromole-cules in solution and want 100 spectral windows. The Nyquist sampling theorem demands asampling rate of 2 MHz and N0=200. Thus, the rate at which products must be formed and
6 -1 8 -l . . 3accumulated is 2 x 10 x 200 sec = x 10 sec which is about 10 more than thepresent-day general purpose computers are able to handle on real time. The trick is toretain the quantization scheme and to design a proper front-end so that the computer-con-trolled system can be quite adequate for many application even though it is not on realtime, e.g., one-bit correlation programs have been written for the Arecibo Observatory'sCDC3300 computer (81).
In macromolecular dynamical studies, earlier developments (2,9I,95) in software correlatorsused fairly slow analog-to-digital converters (DC) as the data sampler. Recently, inconnection with correlation measurements in a plasma, Ogata and Matsurra (96) have combineda fast buffer memory and a digital computer that can analyze signals with up to MHzbandwidth while Ables et al.(80) have developed a l021 channel digital correlator that cananalyze noise signals with bandwidths up to 10 MHz. The access port from Fig. 6 AS(c)should be adequate. In comparison with Fig. 10, the CPU can act as a hardware correlatorand we need a computer with a fast cycle time. Thus, the HP-9830 calculator is much tooslow for such operations. For digital pulse signals the data sampler is bypassed. Sev-eral other digital autocorrelators using minicomputers have been reported (97-100). Inthe scheme by Matsumoto et al., (100) the front end consists of a time interval digitizerwhich digitizes the time intervals between neighboring pulses in a pulse train and trans-fers the information directly to the core memory through a data channel (DCH). In the
Advances in methodsof light—scattering spectroscopy 955
digitizing unit, clock pulses from a 32 '!-iz crystal oscillator are used to determine pulseintervals ranging from 31.25 nsec to 2.1 sec. Thus, the software correlator is capable of
coinputin p (n , n ' , i ) as well as all fois of correlation function with an efTect lye delaytime comparable to the fastest • hardware correlators , even though it is not truly a real-time system at all delay times. It is, nevertheless, a much more flexible system and of-fers a greater potential for ftiture development. For example, the method of improving
light-beating experiments by dust discrimination (131) requires linking up a hardware cor-relator with a minicomputer while for the software correlator it becomes merely a subroutine
of the software program. Signal conditionimg, power spectral analysis, coarse quantization,and batc1. processing, (102) etc. are many options which many improve the time required forobtaining the correlation function estimate at a preset signal-to-noise ratio. In experi-ments 'zhere real-time operation is not absolutely essential, we can see that a great dealof potential lies with software correlators or firm-ware microprocessors which are lessflexible but much cheaper.
BCD complement outputmaximum k-setting = 7999
IIPRESET SWIT1.
To MCS.enables add or subtract
Fig. 12 A block diagram of the preset counter and control circuit for the digital add-subtract correlator (88).
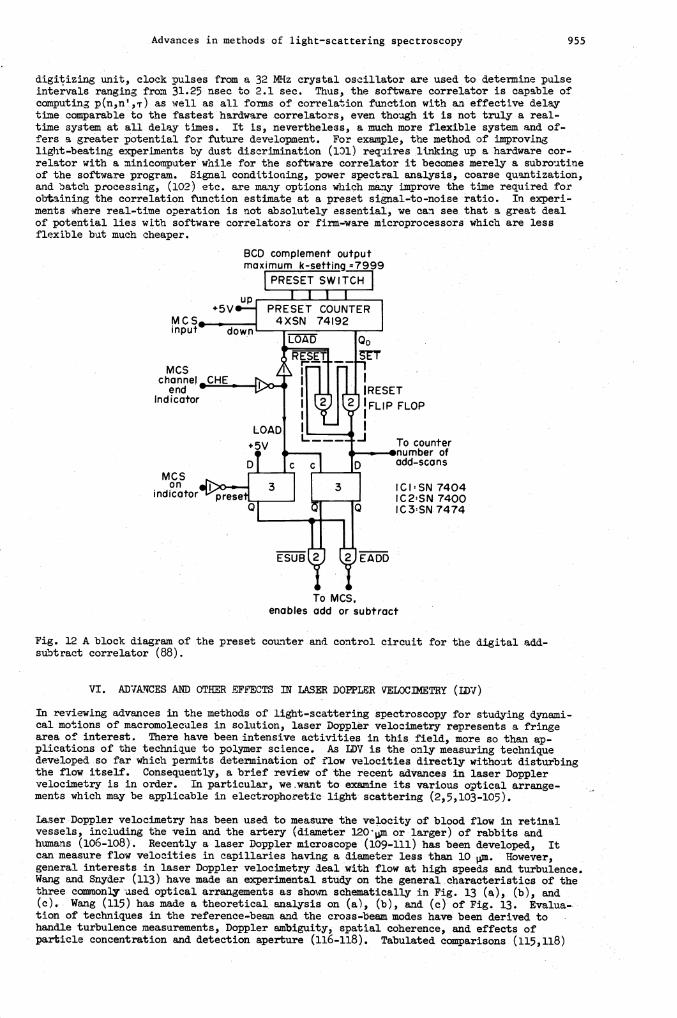
VI. ADVMCES AND OTHER EFFECTS I LASER DOPPLER viocmgmy (wv)In reviewing advances in the methods of light-scattering spectroscopy for studying dynami-cal motions of macromolecules in solution, laser Doppler velocimetry represents a fringearea of interest. There have been intensive activities in this, field, more so than ap-plications of the technique to polymer science. As LDV is the only measuring techniquedeveloped so far which permits determination of flow velocities directly without 'disturbingthe flow itself. Consequently, a brief review 'of "the recent advances in laser Dopplervelocimetry is ,in order. In particular, we want to examine its various optical arrange-
ments which may be applicable in electrophoretic light' scattering (2,5,103-105).
Laser Doppler velocimetry 'has been used to measure the velocity of blood flow in retinalvessels, including the vein and the artery (diameter l2Om or larger) of rabbits andhumans (106-108). Recently a laser Doppler microscope, '(109-ill) has been developed, Itcan measure flow velocities in capillaries having a diameter less' than 10 . 'However,general interests in laser Doppler velociinetry deal with flow at high speeds and turbulence.Wang and Snyder (113) have made an experimental study on the general characteristics of thethree commonly used optical arrangements as' shown schematically in Fig. 13 (a), (b), and(c). Wang (115)' has made a theoretical analysis on (a), (b), arid (c) of Fig. 13. Evalua-.tion of techniques in the reference-beam and the cross-beam modes have been derived tohandle turbulence measurements, Doppler ambiguity, spatial coherence, and effects ofparticle concentration and detection aperture (ii6-ii8). Tabulated comparisons (115,118)
M C S...[XSN792input down
MCSon
indicator' CI SN 74041C2SN 7400lC3SN,7474
EADD
956 B. CHU
for different modes of operation reveal the advantages and disadirantaes under differentexperimental conditions. Effects of particle number •Lensity on signal-to-noise ratio werealso extended to a white light fringe image velocimeter (119). As laser Doppler veloci-metry has been more coicerned with high.-speed flows, such. as in a plasma (120), of large
particles (..aoo j;i diem) (121), and in high current arc discharges (122), the standard dig-ital correlator may not necessarily be the best tool. OftensignaL conditioning and otherignal processing approaches or opti.cal arrangements , such as interferometry (122 , 123),"superheterodyne" spectrum analysis (l2t), sampling spectrum analysis (125, 126) , threshold-discriminato,-TAC method (127), ar4 count cross-correlation as shown in Fig. 13 (d) are moreappropriate. Applicatons of laser anemometry in transo.aic and supersonIc gaseous flowshave been reviewed (128). Aside from standard optical arrangements such as fringe anemo-metry (cross-beam mode), there is a dual spot technique (129,130) which is particularlysuited for observation of back scattered light. it should also be noted that the detectorD in Fig. 13 (a), (b), (o) can be a Fabey-Perot Interferometer together with the photo-detector instead of a light-.beating spectrometer.
The more useful aspects of LDV which may be applicable to biological macromolecules in so-lution are techniques which can tell us additional information on the dynamics of the sys-tem. By shift ng the incident laser frequency of one of the two beams in Fig. 13 (b) byan acousto.-optical method such as the Debye-Sears effect, the LOST candetermine the sign ofthe velocity component (131).
(a) (b)
LASER ,t LASER2¼"
—+ —p FLOW
[DI j_4v _{ D2J[bELAYj—jCORRELATOR I
Fig. 13 Schematics of optical arrangements for laser Doppler veloci.metry (113, ll1).0: photodetector; L: lens.
(a) Local-oscillator heterodyne (reference-beam mode). Beam I(Bl) is the weak reference beam; beam 2 (B2) is the illuminating beam;
1B2>>IBlwith I being the intensity.
(b) Differential heterodyne (cross-beam mode) 'l'B2 Photodetector placedalong any direction other than the two main beams.The method measures the beating (mixing) of two scattered beams.
(c) Symmetric heterodyne. One incident beam only.(d) Dual-channel configuration for cross-correlation analysis (uA).
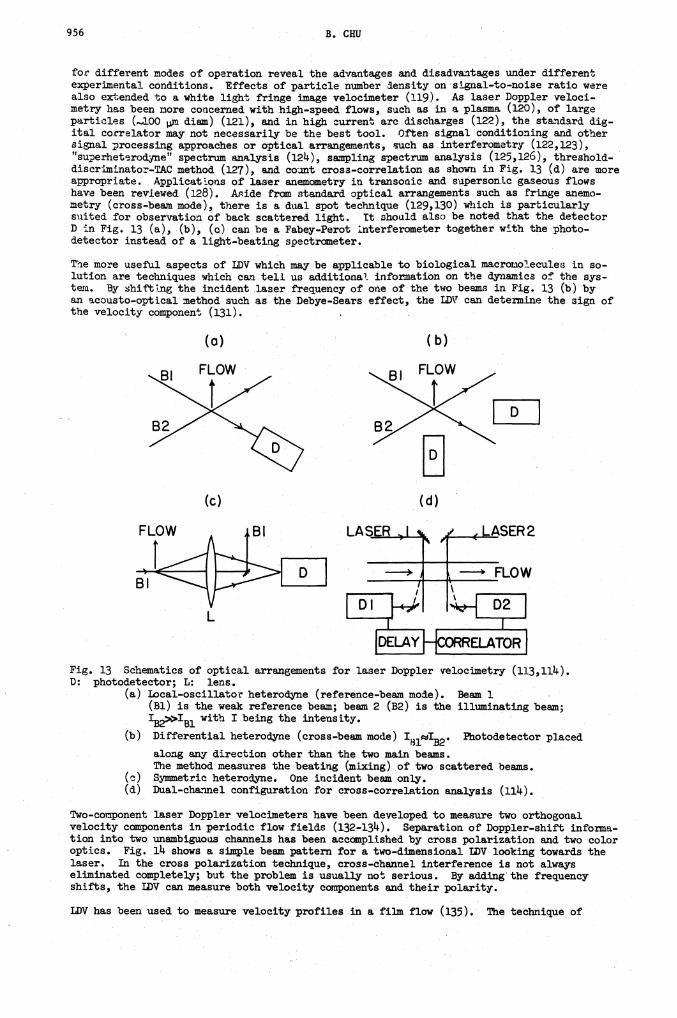
Two-component laser Doppler velocimeters have been developed to measure two orthogonalvelocity components in periodic flow fields (l32..l31). Separation of Doppler-shift infom-tion into two unambiguous channels has been accomplished by cross polarization and two coloroptics. Fig. i1 shows a simple beam pattern for a two-dimensional IDV looking towards thelaser. In the cross polarization teôhnique, cross-channel interference is not alwayseliminated completely; but the problem is usually not serious. By adding the frequencyshifts, the WV can measure both velocity components and their polarity.LDV has been used to measure velocity profiles in a film flow. (135). The technique of
FLOW FLOW
(c) (d)
L
Advances in methods of light—scattering spectroscopy 957
tracking (136,137) can be use\i1 for macromolecular fluid flow (138 aM aerosol flowstudies (139). Finally-, fiber optics has been used as a light-scatterin probe (lLC).
Y
II t2-1 —_- I
Fig . l4 Beam pattern for a two-dimensional LDV looking towards the laser (132) . Arrowsindicate the direction of polarization. Beams 1 and 2 measure the X-coniponent and beams3 and 4 measure the Y-conrponent of flow velocity.
In the field of laser Doppler velocimetry and light-scattering spectroscopy, the engineersagain se to be less aware of the work already published by physicists. For example, alaser anenoineter based on an adaptation of the Mach-Zebner interferometer has been de—veloped (iLi). The author did not realize that the same optical arrangement was used al-most ten years earlier (l2). Similarly, in a publicatioi of the use of laser-inducedfluorescence in a laser Doppler velocimeter (l1-3), the authors never mentioned the studyof react ion kinetics by fluorescence correlation spectroscopy (lti ) . Thus, some improve -ments in communications between various disciplines that are related to light-scattering
spectroscopy may be very helpful to all concerned.
VII. SU4ARY OF ADVANCES
We bave seen that great advances have been ma'e in the methods o light-scattering spectros-copy. The initial development on instrumentation is more or less over. By means of photon-counting and photon correlation, we can have fairly easy access to
(i) measurements of angular distribution of scattered intensity with a resolution about5-1OA,(ii) computer-controlled Reman spectroueters(iii) servo mechanisms or zero-cross averaging schemes for the normally stabilized Fabry-
Perot interferometers with resolving powers of about 108_lO9,(iv) commercially available hardware correlators which are quite adequate for most dynami-cal macromolecular studies or instructions for laboratory-built digital autocorrelators,and(v) flexible computer-controlled software systems which use the same processor (cpu) for(i), (ii) and (iii) as well as photon correlation and spectral analysis. With options foranalog input, other forms of probes (l15) may be utilized. Furthermore, developments suchas a differential techniqe (i16) can easily be adapted. The very diverse nature of thefield suggests that we should pay some attention to the advances made by other 'related"disciplines.
We now have the basic instrumentation for Rayleigh, Brillouin and Reman scettering. Furtherimprovements are likely in the direction of specific optical arrangements, signal process-ing and data analysis. In photon correlation, the fitting of superpositions of exponen-tials by means of least-squares procedur€s is more difficult and has more pitfalls that itseems to appear. Here, we have very precise experimental data which require further studiesin the theory of polymer d3jnamics. For example, the time-correlation function of DNP can-not be interpreted satisfactorily using simple theories (l17). There are much to be donein both theory and method of light-scattering spectroscopy.
Acknowledgments
I gratefully acknowledge support of my research work by the National Science Founda-tion, the National Institute of General Medical Sciences, the U. S. Army Research Office,the Food and Drug Administration, and the Petroleum Research Fund administered by the
american Chemical Society.
958 B. CHU
TABLE 1. Classification of instruments according to time and frequencydomains as well as single and parallel channel methods
Method Frequency Domain
(a) Single channel Input Instrument Example
(single start-single stop) analog wave analyzer General Radio23 1930
analog spectrum TektrOnix23 3L5analyzer
(b) Parallel chatriel
(multistart-multistop) analog bank of Hew1ett_Packard23680514filters
analog real-time SAL0R23 51Bspectrumaialyzer
analog computer see textspectralanalysis
Method Time Domain
(a) Single chaflnel
(i) single start- digital delayed
single stop coincidence reference I7
digital TAC reference I8
(ii) single start- analog/ k-gate'a)
multistop digital correlator' reference I9,50
(b) Parallel channel
(mu1tistrt-multistop) analog/ signaldigital côrrelator SAIC0R3 l2A
digital single-clipped Malvern23 K7023correlator
digital (add-subtract see textcorrelator)
analog/ computer time- see textdigital correlation
(a) The analog version of the digital k-gate correlator is the comparator-triggerautocorrelator.
Advances in methods of light—scattering spectroscopy 959
TABLE 2. Correlation f'unceions based on one-bit quantization
Input One-Bit uantization Correlation
Scheme Condition
v(t), Fig. 11(a) V(t) = 1 if v(t)>o C(i-) =
analog= -1 if v(t)�o
Vk(t) = 1 if v(t)>o Ck(T)=
= 0 if v(t)�o
n(t), a(t)= 1 if n(t)>k C*(.1.) =
digital= 1 if n(t)�k
%(t) = 1 if n(t)>k Ck(i) =
0 if n(t)�k Cd(1•) =
(a) Subscript dc: double-clipping
subscript k: clipping at k
C(r) : add-subtract correlation function
Ck(1)single-clipped correlation ftnction
•E; 10A (96I 'zre'a.suzv 'o PUIIOH t.JOfl ') •P3) Jc:I-tLIaED P '-a '-ettdiv Ui. 'uOjJ3S W •I pTX8 zapToJuatl% H
. •t3 (t96l 'ricsw '.00 PWLIOH t2ON 'uqqs •x ptr '8'8TtTW •a 'uossz • 'p9)
1'BUOTT3LIOD iTtt2uy p3q'IU.'X311 UT 'SZ92OU 'ci 'r ptr 3.SU3O '[ 1 ' (i1L6i) '1 ' •;—•i 'O3UOQ 'd
(oL6i) 199 '9- 'SZi!tZO33Ta vrn '2 2I '-E3PT.reI •rI I3ZT3N 'ci ' —. (iiL6i) P6 C . •ir ' ptr tr ' 'E '(L6i) 69 '9i 'uIn,Ista 'A3U "13tt3 '0 PT1 31OT.T 'a 'H "i •Z 'O
(6961) i9 'I •UWIO3 •O 'j TX'6 U3t 'H S 6t
— — '(L6i) toi ' 'V 'ac.ia 'r 'L-tI3H '3 'H •911
'(9961) I. 'i ci.i ia 'I?i '2xnqpo i pu Jc3BrId 'N cI L — — —
'(oL6i) ' •aAj 'W9T.3 '2 T.3) ') '9t '(tL6i) O1l 'L 'a 'sJcq 'f 'tu3A-['e 'j 'y pu 'A 'A3OS N 'a
'(iiL6Tl '2 'XiifF 'Tzeppos '2 ':I PU 'ti-ç 'f 'V'e3U
. (L6i) tti '9 'a • ' sa .2 '!'°a 'ni •, pu 'treuuo 'y 'j '3)txE3 'U H '2 ' ' (L6fl 6L 'j 'vxrLiq.$tii •TS 'JLI 'JJJtX[ 'N 'I 33tU ' '3 't ' (9L61) 9Eii 'L* 'uxncsuj 'iDs •A3U tWJ 'a Pu 'U3OT.3 'a 'a 'ovi H ' 'itt •UoT3TutuJmtoo 3AT2d 'oui 'SU3UtrLISL&I t.-ç3I1nE Cj 'Jc'J( • TIITLt '011
' (tiL6T) 22 'L ' f U'9p'839 'f 'k89j ' 'ITH 'U ' 6 ' (L6i) 96-E ' '4T dd 'uus 'v ' i ' pu u-jo 'y 'j ' ' (oL6i) L ' 'TrnuE1103 • d0 '3O3,I3pTX8S '1 '2 'L 'oi-6i dd '(6961 'OA '°K{ pTr9 ut 'I'I3A"Z9UT'IdS) 'pa Cqq •çj • Cp.q
Jo ID3cI U13O 2çI UT 3 'SS3t1tItIt10 'f '9UU3S '0 cT3ssni .2 't-ca 'i 'a 'oATT0 '2 '0 'S 'S3U0f •H 'UOStU[O2 'V 'i 'JBIt 'S '9
'SIflS3I o3'8JT IVP () 33tIOI3J,I3tZT a-ui AuI-13dnS 0I'ThI TIT3I'U p3Sfl pTxe 3At 3tt '3TCIU9X9 1O ' '(iL6i) ': •',tTd 'T13t43 '2 't3p3U3 ' •D P 'tXT3 'y ' 'txqwj ' 'S '1
'(9961) (tio 'ttflU3Id '8961 'Tswz) M03S0J4 (q.t[8-r j UTI3.3S El33ION 'ptTrE3q ' 'I ' '(6961) ss3q1j; 'ct'TId ',I3pU3Ii3 'H 'I
'(L6T) LL ' 'a 'siq ' 'Tdoi ' pu uozp 'y 'rj ' '(9L6-E) 119 ' ' Oiq. OAOu'e[ '1 'l PT.I 'tLZH '0 ' 'ULOOt 'a 's 'i '(L6i) 110I 'TI 'UflUILtIO3 po 'popsfl_'S PU ST.Z8A! '2 'ci 'Q
(L6T) L111 'L. '3rT(3O 'S'8IOOT3d 'rI ii '6 '(L6i) 6c ' 'i cr '-ocj tathIo f 'Tt30N •rI '2 '9
_______________ (1iL6I) 6L11
'l 'UE '105 'A9I 'SUAa 'I 'V P 'P"t 'H 'M 'Z3pIA 'a ' 'poctsfl 'S 'L '(L6T) '05 'JL3j 'sOa 'f ' )U tOS3ptT.I05 "1 'I '9 '(L6T) LloT '911 utrusui '5'A3 OTX[ c1 ' PU 3tLlH '0 'j ' '(liL6T) 't(E 23t3'S xad '3,OOW ' 'r '11
'9TqTns oq ut tj sa3tTq.O jo UOçStrpXe 9t O ,xou qonpoid 3t O UO A[dUrE 0U S90p 3U9U onpo,id 10 JX8CIUIO0 i O 30U31333U ' '(66i) 'L'-ü 'oo,.t 'ptrE ' ' '(L1161) '6 'w 'oö ' Iô'r 'wto 'a '2 ' '(9L61) 6 ' '15 '1R53 't3ATI0 '2 '0 'o
'(11L61) 9i '.i '9V 'na 'i ' ,I3AITO 'r '0 '6i '6flj6L ' 'iLj u 5j 'rq 'a pu Txiro 'a '91
'(cL6i) 9LT '9i 'sul 'lOS '1I '1M3 ' 132tU8t[OS 'M '3'I 'd 'S 'Li '(1L61) 1119 'L '4I 'A3H'S7 '113111180 'S 'a PU t30tIflci 'H '2 '91
'(o) i '1 'IC 30U3I3J31 JO (I uç £''Oi 'H1I 'ct '(L61) 1T '9t'UIfllSUI'T0S ''3H 'Saitni0o 'H ' '111
'(L6i) 99L1 'ti '4do 'TdV 'U0 M 'd PLt 3tiS 'A '0 '1 'L6i w L 'SPrPuS 30 n3jn T8UOTN 'su3w9tnsow ioso,iy 110 30113,1331103 3T JO SU1p9300.td '3UITJ I3H I1 'I4WI JO 1101; 1J301t1,3 3uq 10; 8Ot3 u13q05 VT[ '4AD '0 '0 ' '(11L61) 'IO t't3 'SS3,1 WrtU3Ia 1&O0BO103d5 u18a t2TnI pt uoTi3'I'Io0 uoo ('sP3) tTd 'H 'a U8 uTno '2 'H '11
'(L61) tOA 3M '30U30S13q.U-J3Tf4 S0TSJ11a P118 &O1O 'LtSlW3T.i0 Oq. suOTol1ddV 1.IcTA uT'I3;oS tivi o1uruJci ''Io03d 'H P 3tLI3E 'r 'a 'oi
'(L6i) 1JOA !k3 'SS1 oTu13pov 1'tVI p3'l3q405 O S31.13dO1j '0T0q23 'j4 p118 'o,.toata'a '1LUT$O10 'a '6 '(9L61) fI 'i'5 'EU '$A3H '11111 '1O03d 'H 118 TX8UXL81E 'I '2 13t 'H 'ci '9
'(cL6i) i9-6 ' 'io 's'tä 'utrj pTx8uI9r[r1 a Pu duj '1 'i 'ii 'L '(L6i) 119'l ' '23°Ta 'E.iOTa ' '11o81x80 'ci ' 9
'(11L61) trt(1 '11 'c'Iaui 'p101103 üKp ''IM 'H '5 '(k) go1- 'ia 'o 'tp 'qq3 ' '11
'(11L61) ' '11131.10 'sTq'sA3 uuy 3U'I35 '2 '5 p118 'H ' '(11L61) i'IoA b31I '883.1.d 0TUP0V 'uW3q405 .t1T'I 'uiio 'a ' '(L6i) 6-I ' 'qa 'uo 'ai 'uooa 'a 'r pu'e Lino1 'y 'a 'i
flH0 ' 096
Advances in methods of light—scattering spectroscopy 961
56. E. Mathias and D. A. Shirley, NucI. Instrum.Methods 15, 309 (1966).57. R. W. Zunnuhle, P. F. Thnrichsen, C. M. Fou, C. R. Gould, and G. P.
Anastassiou, Nuc1.Instrum.Meth94!: ii, 311 (1969).58. ii. H. Rinneberg and D . A. Shirley, Phrs. Rev. B. II, 2l8 (1975).59 . J. Glatz, Nuci. Instrum.Methods 79, 27760. D. B. Scar1, :_Re1. 175, ii7i968).61. F. Davidson and L. Mandel, J. Ajp1. ts. 39, 62 (1968).62. F. Davidson, Rev. i856 19b9).63. R. J. Glauber, 130, 2529 (1963).61k. L. Mandel and E. Wolf, Rev. Mod. Thrs. 37, 231 (195),65. R. J. Glauber, in in Satistica1 Mechanics II,
(ed.. E. G. D. Cohen, North Holland, Pmsterari, 1968) pp. 1AO-187.66. J. G. Blake, l?Topjs in Photoelectron Counttng Statistics," Ph.i). Thesis,
Harvard University (1973).67. S. Chopra and L. Mandel, ReV.SC1._Thatrum. 13, 1189 (1972).68. For example, model 226A of LCroy Resea'ch Systems (23).69. S. Weinreb, Proc. IE, 1#9, 1099 (1961)70. S. Weinreb, "A digital spectral aia1ysis tecbnique and. its application to
radio astronomy," M. I. T. Res. Lb. of Electronics, Report L12 (1963), 119 pp.71. R. M. Goldstein, "A technicp.ie for the measui'exaent of power spectra of very
weak signals," IHE Trans. Space Electron Telemetry, 8, 2 (1961).72. R. D. D. Davies, .1. E. B. Ponsonby, L. Pointon, aM G. DeJager, Nature 222,
933 (1969).73. 13. F. C. Cooper, kist.J._s. 23, 521 (1970).7). . M. Moran, Proc . IEEE Ei, 1236 T1973).75. B. G. Clark, PrOc.DE 1, l212 (1973).76. F. K. Bowers,D.A.Wh.te, T. C. Landecker, and R. J. Klingler, Proc. ]EEE 61,
1339 (l973..
77 . A. M. Shailoway, IEEE NEREM Record 6, 98 (l96L).78. C. Bare, B. G. Clark, K. I.Kelleiiann, M. H. Cohen, and. D. L. Jauncey,
189 (1967).79. W.. R. Burns arid S. S. Yao, Radi9_ScJ. 14 1431 (1969).80. J. G. Ables, B. F. C. Cooper, A. J.Hunt, G. G. Moorey and J. W. Brooks,
Rev. Sci . Instrum. 1#6, 28 (1975).81. D.liyioci. 7, 661 (1972).32. C. L. Rino, M. J. Baron, G. H. Burch, and 0. de la Beaujardiere,
Radio Sd. 9, 1117 (l971).83. C. J. Zanlutti and D. T. Farley, Radio Sci. 10, 573 (1975).8I. J. B. Hagen and D. T. Farley, Radio Sci. 7(5 (1973).
85. J. H. van Vleck and D. Middleton, Proc. IEEE 514., 2 (1966).86. R. Asch and N. C. Ford, Rev. Sci. Instr, 506 (1973).87. P. P. Crooker and J. Hoorer, Private Comriunication (to be published).88. 5. Jen, J. Shook and B. Chi, Rev. Sci. Instruxn. (in press).
89. K. Ohbayashi and T. Igarashi, Ja. J. A '1?, 1606 (1973). See alsoK. Ohbayashi ibid, 13, 1219 (197 where shift registers were used.
90. . A. Mole and E. Geissler, J. Phys. E. 8, i4.17 (1975).91. E. R. Wooding and P R. PrT, JPhys.E. 7, 5l (l97L).92. 1. Tai, K. Hasegawa and A. Sekiguchi, J. Pnys.E. 8, 206 (1975).93. S. H. Chen, W. B. Veldkamp and C. C. Lai, Rev. Sd. Instrum. 145, 1356 (1975).914. J. M Schurr and K. S. Schnitz, Biopoers, 12, 1021 (i3)95. 5. A. Shaya, C. CC. Han, and H Yu, Rev. Sd. Instruin. L1.5, 280 (l97I).96. A. Ogata and K. Matsurra, Rev. Sci. Instrum. 145, 1077 (1975).97. F. R. Hallett, A. L. Gray, A. Rybakowski, J. L. Hunt and J. R Stevens,
Can.Js. 50, 2368 (1972).98. A. L. Gray, F. R. Hallett and A. Rae, J. Phys. E. 8, 501 (1975).99. R. W. Wijnaendts van Resandt, Rev. Sci. Instrum. 1507 (197i).100. G. Matsuinoto, H. Shimizu, and J. Shimada, Rev. Sci. Instrum. in press.101. Y. Alon and A. Hochberg, Rev. Sd. Instruin. 6,3T197T102. A. Knox and T. A. King, Rev. Sd. Instrum. 1# 16L (975).103. E. E. Uzgiris Rev. Sd. Instr 1j7714 (lTh).1014. E. E. Uzgiris and J. H. Kaplan, Rev. Sci. Instrum. l45, 120 (1971).
105. 3. Josefoicz and F. R. Hallett, p2l.ptics 730 (1975).106. C. Riva, B. Ross, and G. B. Benedek, Divest. hthaol. 11, 936 (1972).107. T. Tanaka, I. Ben-Sira, and C. Riva, Science 186, 830 (l97).108. T. Tanaka and G. B. Benedek, (1975).109. H. Mishina, T. Asakura and S. Nagai, çt. Conmiun. 11, 99 (i9714.).
110. H. Mishina, and T. Asakura, Appl. Thys. 5, 3Fl975).111. H. Mishina, S. Tokui, T. Ushizaka, T. Asakura, and S. Nagai, t.
3. Appl. Phys. l1ll, 323 (1975).112. H. Mishina, T. Koyama, and T. Asakura,. pl. Optics, lii, 2326 (1975).113. C. P. Wang and D. Snyder, Appl. 0ptis 13, 9W(l7l).1114. T. S. t)urrani and C. A. Greated, p pics 114, 778 (1975).115. C. P. Wang, J. Phys. E. 5, 763 (1972).
962 B. CHU
ii6 C Y She, Appi Opt 12, 2I15 (1973)117. R. V. Edwards, J. C. Angus, and J. W. Dunning Jr., Opto-Electron.tcs 5, 119 (1973).118. C. Y. She an L. S. Wall, J. Soc. Amer. 65, 69 (1975).
119. J. H. C. Chan and H. A. Ballik, , 1839 (1975).120. G. Gouesbet, C. R.Acad. Sc. Paris, t. 280 S.erie B. 597 (1975).121. A. .1. Russo,
122. M. R. Barrault, G. R. Jones and T. R. Blackburn, J. -s.E. 7, 663 (l97L).123. M. Kamegai, pptics, 13, 1997 (l97I).
J. Leblond and Hi. S. Ei Badawy itics 114, 902 (1975).125. R. L. Simpson and P. W. Barr, Rev. Sci. Instrum. 145,• 835 (1975).126. G. Gouesbèt an1M. Trinite, J. Phys. H. 19l (14); ReedePysique
ppiiec 9, 571 (l974).127. J. A. Maynard and T K. Gaylord, Rev. Sci. Irtstrum. 146, 11469 (1975).128. H. J. Pfeifer, J. Phys. H. 8, 2145
129. D. H. Thompson, H. 1, 929 (1968).130. H. Weyer and R. Schod17"ecture Series on Experimental Techniques in
Turbomachinery," (Milan: Politechnico) (1973).131. LP.Jernqvist and T. Johansson, J. s.E. 7, 2146 (19714).
132. J. P. Sullivan and S. Ezekiel, J.Phy.E. 7, 2714 (19714).
133. M. K. Denhan, P. Briard, and M. A. Patrick, J. Phys. E. 8, 681 (1975).
1314. R. J. Adrian, J. Ph1E. 8, 723 (1975).135. J. 0ldengarm A. H. van Krieken and H. W. van der Klooster,
J.P1yS.E. 8, 203 (1975).136. T. H. Wilmshurst and J. H. Rizzo, .1. Phys.E. 7, 9214 (19714).137. W. R. Tox.ipkiis, R. Monti, and M. Intaglietta, Rev. Sci. Instrun. 145, 6147 (19714).
138. R. V. Mustacich and B. H. Ware, Rev. Sci. instrum1ff, io8 ç1976).139. M. K. Mazumder and K. J. Kirsch, p,_Otics f!i7 89 (1975).1140. B. T. Yang and R. N. Merorxey, Rev. Sci. Instrum. 145, 210 (19714).
1141. J. H. Rizzo, J. H. 8, 1475T11#2. J. B. Lastovkae.ndG.B. Benedek, Phy. Rev. Lett., 17, 1339 (1966).1143. W. H. Stevenson, R. dos Santos, and S. C. Mettier, pp1. Ph. Lett., 27, 395 (1975).11414. D. Magde, E. Elsori, andW. W. Webb, Rev. Lett., 29, 7O5(T7);
Bieri3, 29 (19714).
1145. G. Feher and M. Weissm&'i; Proc. Nat. Aca. Set. USA 70, 870 (1973).1146. D. S. Cannell and S. B. Dubln, Rev. Sci. instrmC16, 706 (1975).1147. F. C. Chen, A. Yeh, and B. Chu, J.Chexn$., in press.