Embed Size (px)
Citation preview

Chemistry 102
_____________________________________________________________________________________________
EXPERIMENT 3
EQUILIBRIUM GAMES
Fall 2015 www./proffenyes.com 1
PURPOSE:
1. To use model physical systems to illustrate the approach to chemical equilibrium.
2. To understand how the concentration of reactants and products change with time as
equilibrium is achieved.
PRINCIPLES:
In the previous experiment, it has been demonstrated that reaction rates increase with increasing
concentration of reactants and decrease with decreasing concentration of reactants.
Consider the reaction in which reactant A changes into product B:
A B Forward Reaction
In this reaction, as the concentration of B gradually increases and the concentration of A
gradually decreases, B can change back into A.
A B Reverse Reaction
A reaction that can proceed in both direction is referred to as a reversible reaction.
As the concentration of A gradually decreases, the rate of the forward reaction decreases as well.
As the concentration of B gradually increases, the rate of the reverse reaction increases.
At some point, the rate of the reverse reaction becomes equal to the rate of the forward reaction
and a dynamic equilibrium is reached.
Dynamic: Implies that both reactions (forward and reverse) are still proceeding.
Equilibrium: Implies that:
The rate of the forward reaction equals the rate of the reverse reaction
The concentrations of A and B remain constant. This, however does NOT mean that the concentrations of A and B are
necessarily equal to each other.
To sum up:
Dynamic equilibrium for a chemical reaction is the condition in which the rate of the
forward reaction equals the rate of the reverse reaction and the concentration of the
reactants and products no longer change.
Chemistry 102
_____________________________________________________________________________________________
EXPERIMENT 3
EQUILIBRIUM GAMES
Fall 2015 www./proffenyes.com 2
A stepwise view showing how a reversible reaction reaches equilibrium is illustrated below:
Forward Reaction
A B Reverse Reaction
STEP 1
A B
Fast
A B
No Reaction
STEP 2
A B
Forward Reaction slows down
A B
Reverse Reaction starts slowly
STEP 3
A B
Forward Reaction slows down further
A B
Reverse Reaction speeds up
STEP 4
A B
Forward Reaction slows down further
A B
Reverse Reaction speeds up further
A B
Rate of Forward Reaction = Rate of Reverse Reaction
The concentrations of A and B no longer change
Dynamic Equilibrium has been reached

Chemistry 102
_____________________________________________________________________________________________
EXPERIMENT 3
EQUILIBRIUM GAMES
Fall 2015 www./proffenyes.com 3
PROCEDURE:
1. Working in pairs:
Label a 25 mL graduated cylinder “A” and,
Label a second 25 mL cylinder “B” 2. Fill the graduated cylinder “A” with 25 mL of water
3. Leave the graduated cylinder “B” empty
4. Obtain two glass tubes with different diameters.
Three different physical models of Chemical Equilibrium will be illustrated:
MODEL 1
A. Insert the wider diameter tube in graduated cylinder “A”
B. Insert the narrower diameter tube in graduated cylinder “B”
C. Simultaneously with your partner:
Lower the wider diameter tube in cylinder “A” (contains 25 mL of water)
without blocking the open end of the tube.
Lower the narrower diameter tube in cylinder “B” (empty)
D. After the tubes reach the bottom of the cylinders, place your index finger over the top end of
the glass tubes and hold down tightly.
E. Carefully transfer the contents of the two tubes to the other cylinder and allow the water (if
any) to drain.
F. Read the volumes in the cylinder (nearest 0.1 mL) only after both transfer tubes have drained
completely.
G. Record the total volume in each cylinder (A and B) after every transfer in your Laboratory
Notebook. Expect about 20-30 rows of entries.
H. Repeat steps A through G five more times after equilibrium has been reached.
If you are not sure when equilibrium has been reached, consult your instructor.
MODEL 2
A. Insert the narrower diameter tube in graduated cylinder A”
B. Insert the wider diameter tube in graduated cylinder “B”
Follow steps C through H, as it was done for MODEL 1
MODEL 3
A. Insert a wider diameter tube in graduated cylinder “A”
B. Insert an identical wide diameter tube in cylinder “B”
Follow steps C through H, as it was done for MODEL 1 & 2
Chemistry 102
_____________________________________________________________________________________________
EXPERIMENT 3
EQUILIBRIUM GAMES
Fall 2015 www./proffenyes.com 4
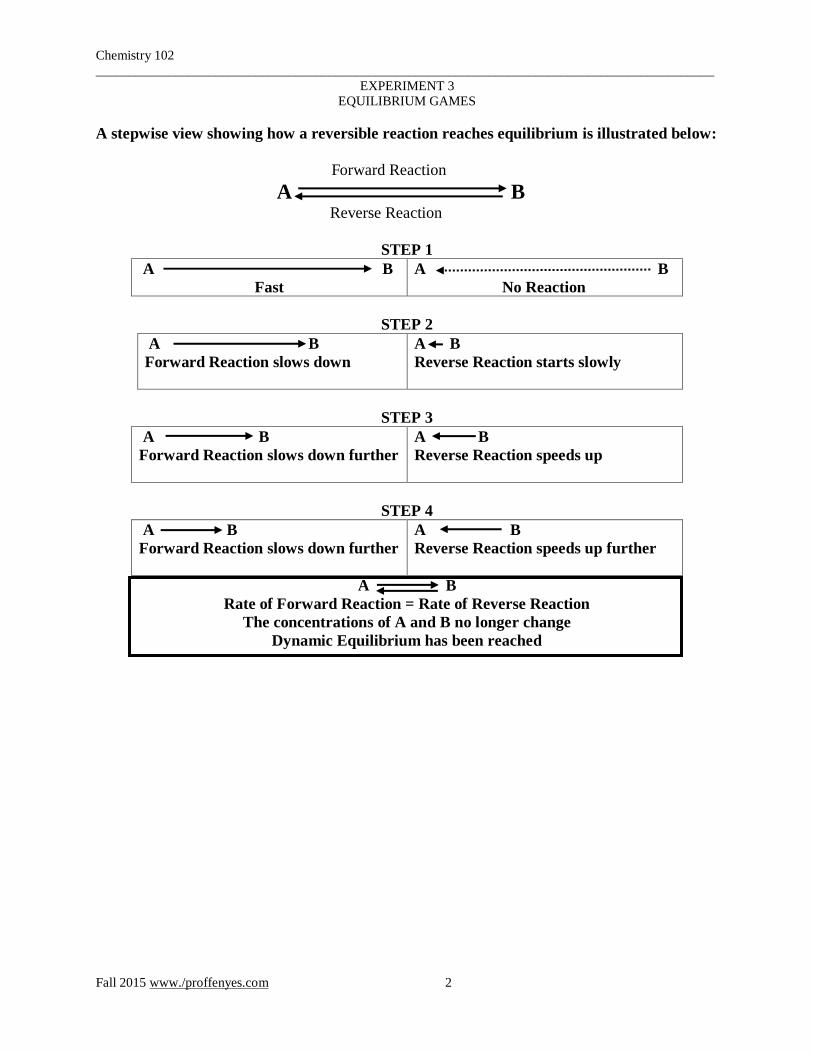
ANALYSIS: The analysis of these three physical models of chemical equilibrium uses the following
analogies:
Physical Model Analogous to
Volume in Cylinder “A”
Concentration of Reactants
Volume in Cylinder “B”
Concentration of Products
Change in volume (ΔVA) in cylinder “A”
Change in concentration (ΔCR) of Reactant
Change in volume (ΔVB) in cylinder “B”
Change in concentration (ΔCP) of Product
Number of Transfers
Time
ΔVA or ΔVB )
Δ# transfers
(The slope of the plot of any given transfer)
ΔCREACTANT or ΔCPRODUCT
Δ time
Volume of water in cylinder B
Volume of water in cylinder A
at the point the system reached equilibrium
The Equilibrium Constant., K
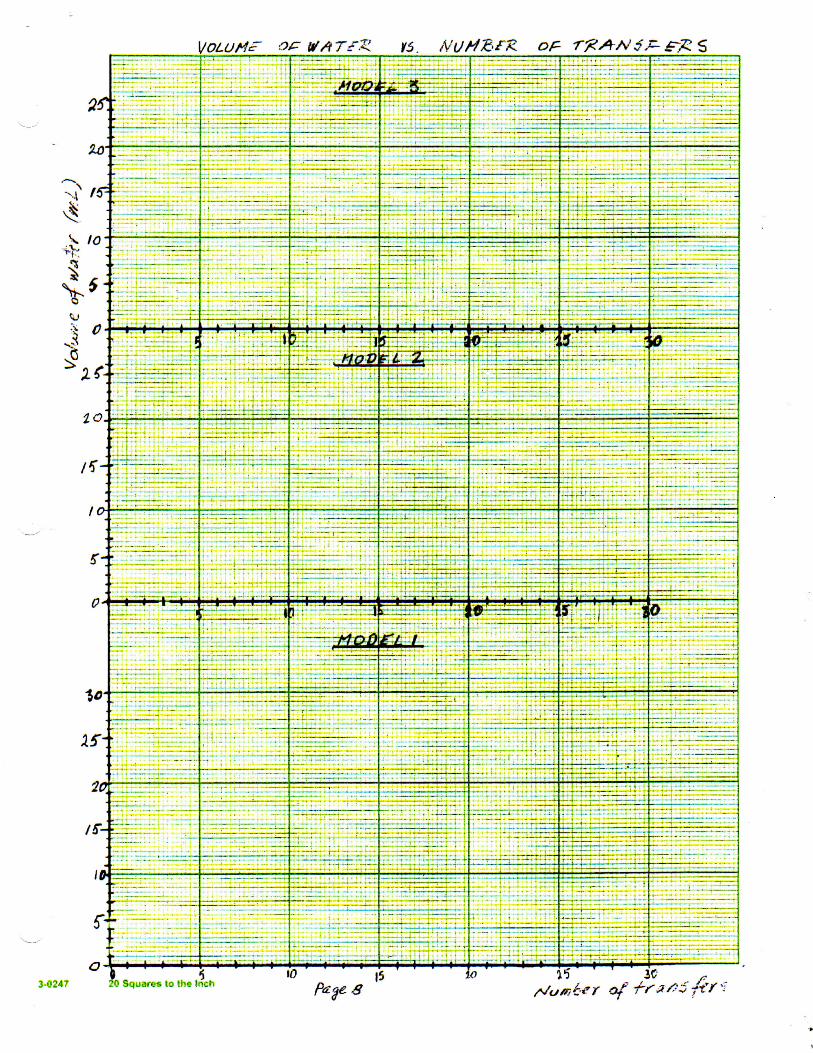
1. Construct three graphs (for the three different models) by recording the data for both
cylinders on each graph (sample graph included on page 8)
Plot the “Volume of Water” on the Y axis versus the “Number of Transfers” on the X axis.
Label each axis
Join each set of points with a smooth curve.
Label all six smooth curves (two for each model) “A” and “B” respectively Attach the graph to your Report Form (page 8 – page before the last)
2. Complete Data Tables 1, 2 and 3 in your Report Form with your recorded data.
3. Answer the questions in Table 4.

Chemistry 102
_____________________________________________________________________________________________
EXPERIMENT 3
EQUILIBRIUM GAMES
Fall 2015 www./proffenyes.com 5
REPORT FORM
Name: ______________________ Date: _____________ Partner: ______________________
DATA TABLE 1
MODEL 1
Number
of
Transfers
Volume
in A
(mL)
ΔV(A)
(mL)
Volume
in B
(mL)
ΔV(B)
(mL)
0 25.0 0 0.0 0
1
2
3
4
5
6
7
8
9
10
11
12
13
14
15
16
17
18
19
20
21
22
23
24
25
26
27
28
29
30

Chemistry 102
_____________________________________________________________________________________________
EXPERIMENT 3
EQUILIBRIUM GAMES
Fall 2015 www./proffenyes.com 6
DATA TABLE 2
MODEL 2
Number
of
Transfers
Volume
in A
(mL)
ΔV(A)
(mL)
Volume
in B
(mL)
ΔV(B)
(mL)
0 25.0 0.0 0.0 0.0
1
2
3
4
5
6
7
8
9
10
11
12
13
14
15
16
17
18
19
20
21
22
23
24
25
26
27
28
29
30
Chemistry 102
_____________________________________________________________________________________________
EXPERIMENT 3
EQUILIBRIUM GAMES
Fall 2015 www./proffenyes.com 7
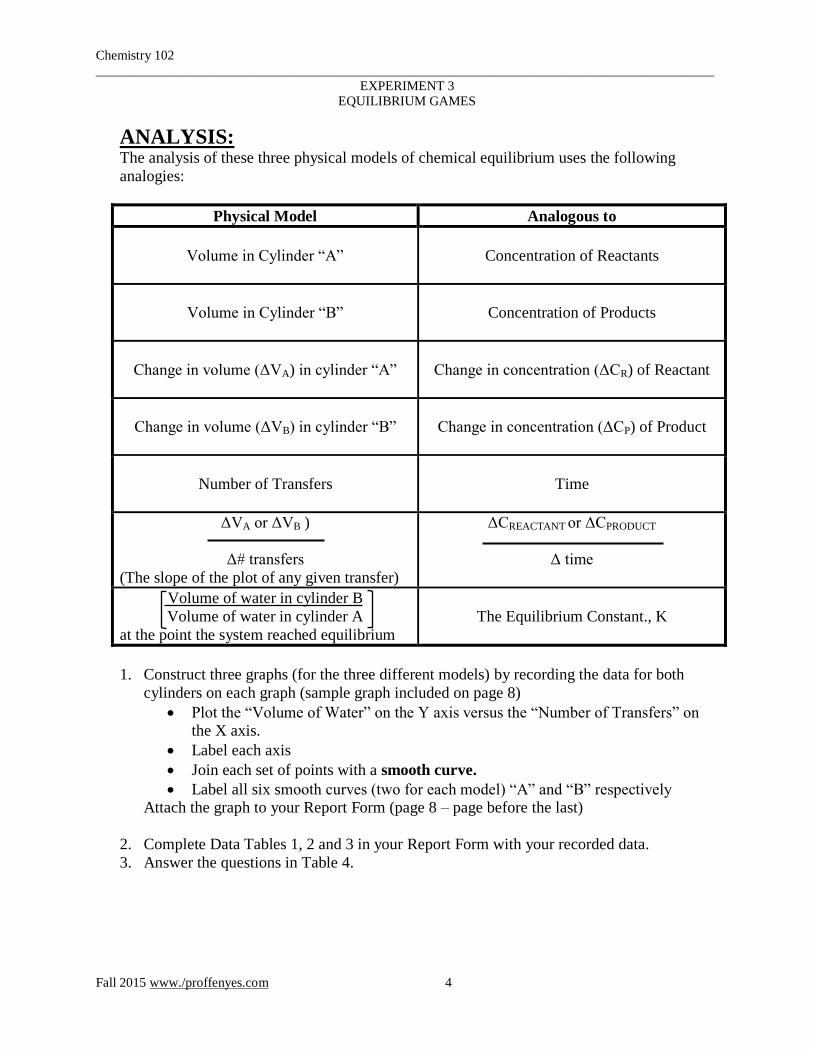
DATA TABLE 3
MODEL 3
Number
of
Transfers
Volume
in A
(mL)
ΔV(A)
(mL)
Volume
in B
(mL)
ΔV(B)
(mL)
0 25.0 0.0 0.0 0.0
1
2
3
4
5
6
7
8
9
10
11
12
13
14
15
16
17
18
19
20
21
22
23
24
25
26
27
28
29
30
Chemistry 102
_____________________________________________________________________________________________
EXPERIMENT 3
EQUILIBRIUM GAMES
Fall 2015 www./proffenyes.com 9
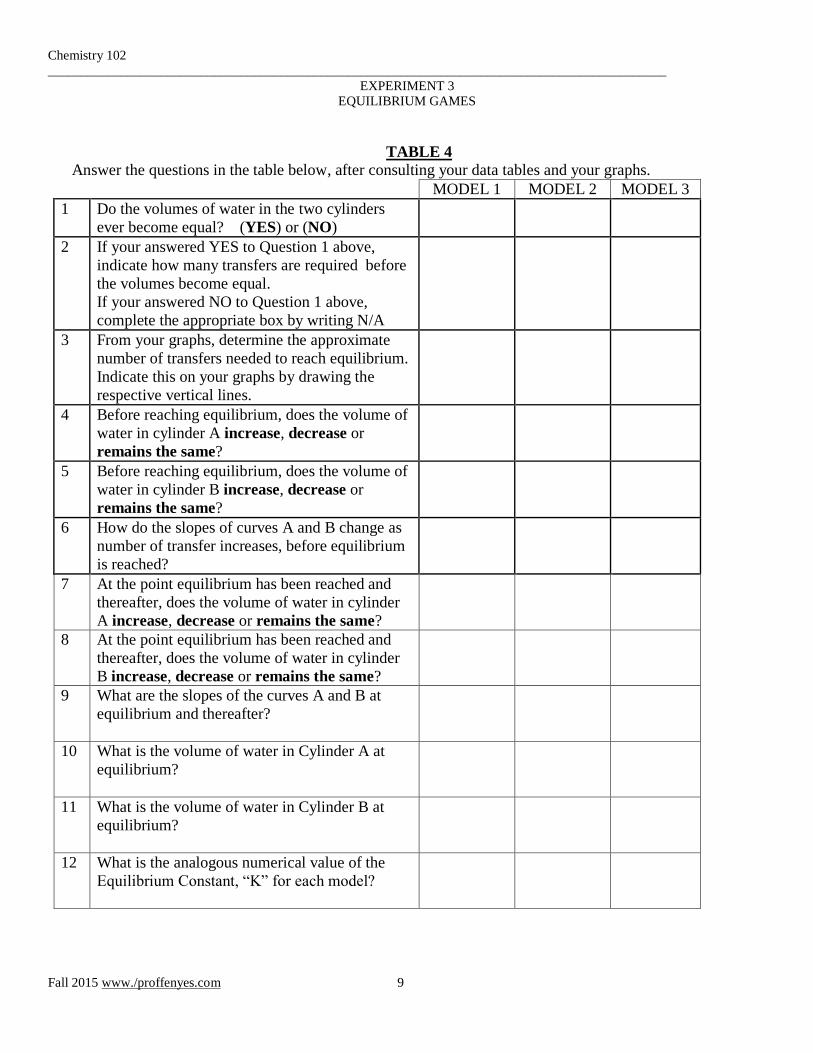
TABLE 4
Answer the questions in the table below, after consulting your data tables and your graphs.
MODEL 1 MODEL 2 MODEL 3
1 Do the volumes of water in the two cylinders
ever become equal? (YES) or (NO)
2 If your answered YES to Question 1 above,
indicate how many transfers are required before
the volumes become equal.
If your answered NO to Question 1 above,
complete the appropriate box by writing N/A
3 From your graphs, determine the approximate
number of transfers needed to reach equilibrium.
Indicate this on your graphs by drawing the
respective vertical lines.
4 Before reaching equilibrium, does the volume of
water in cylinder A increase, decrease or
remains the same?
5 Before reaching equilibrium, does the volume of
water in cylinder B increase, decrease or
remains the same?
6 How do the slopes of curves A and B change as
number of transfer increases, before equilibrium
is reached?
7 At the point equilibrium has been reached and
thereafter, does the volume of water in cylinder
A increase, decrease or remains the same?
8 At the point equilibrium has been reached and
thereafter, does the volume of water in cylinder
B increase, decrease or remains the same?
9 What are the slopes of the curves A and B at
equilibrium and thereafter?
10 What is the volume of water in Cylinder A at
equilibrium?
11 What is the volume of water in Cylinder B at
equilibrium?
12 What is the analogous numerical value of the
Equilibrium Constant, “K” for each model?