Embed Size (px)
Citation preview
Meltwater Webinar:PUTTING THE KEY BACK IN KPI METRICS
Adil EhsanFrieslandCampina Middle East
2
About the Speaker
Adil EhsanFrieslandCampina Middle East
Cheese Marketing & Innovation Manager, Middle East
Putting the Key back in KPIAdil EhsanFrieslandcampina Middle EastJuly 2017
Background
• Key Performance Indicators are the signposts to success….or failure
• The modern-day problem however is often not ‘Not Measuring’ but ‘Knowing What To Measure’
• The objective of this webinar is to spark a discussion/thought process of a system to do this
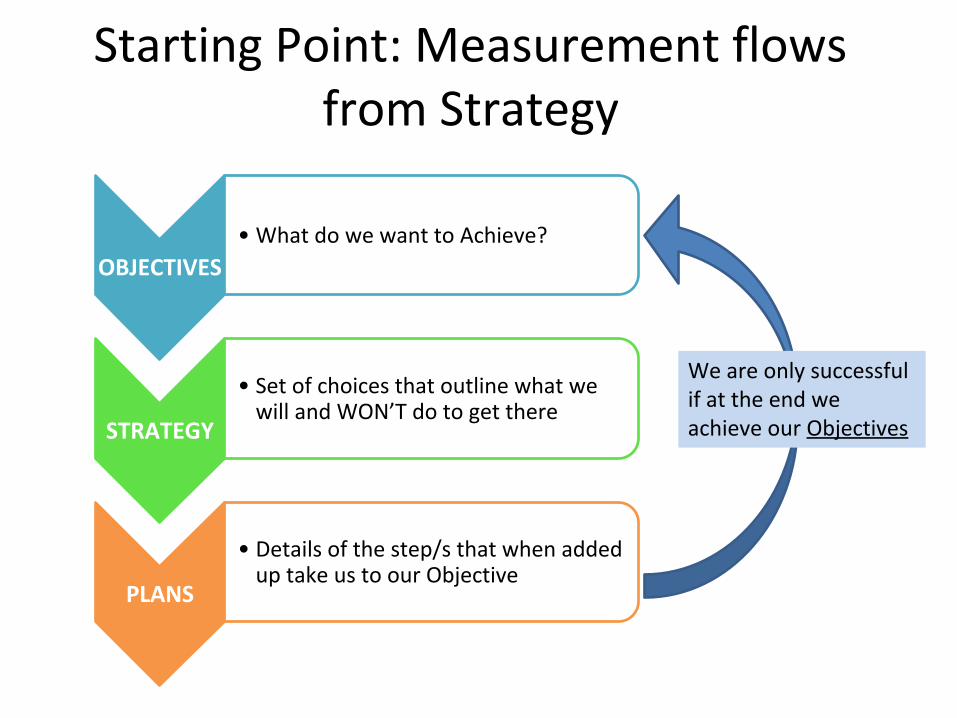
Starting Point: Measurement flows from Strategy
OBJECTIVES• What do we want to Achieve?
STRATEGY
• Set of choices that outline what we will and WON’T do to get there
PLANS
• Details of the step/s that when added up take us to our Objective
We are only successful if at the end we achieve our Objectives
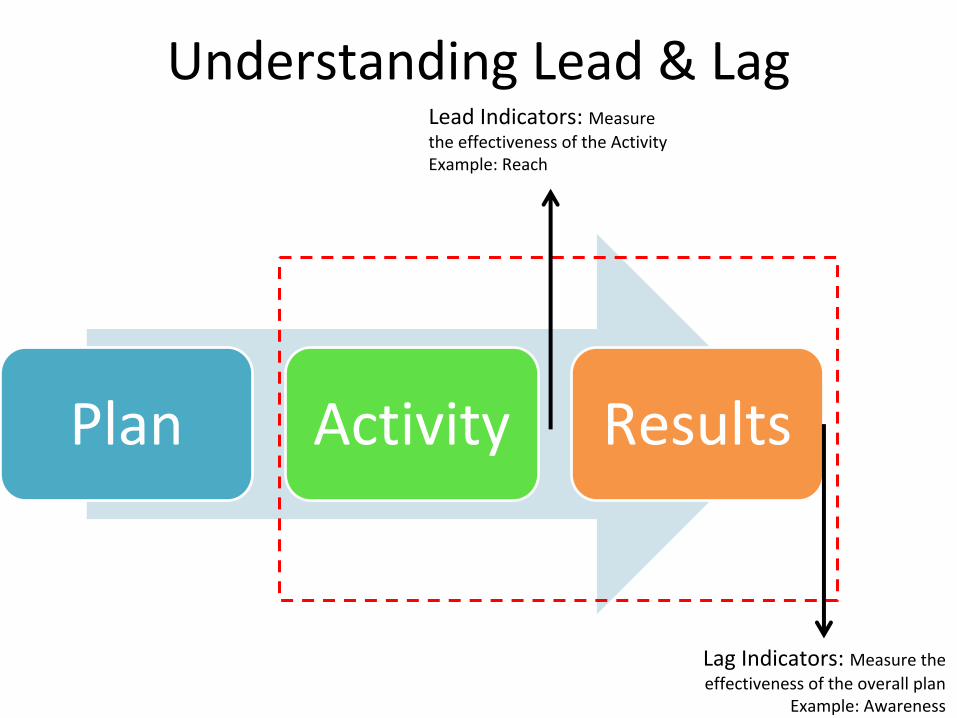
Understanding Lead & Lag
Plan Activity Results
Lead Indicators: Measure the effectiveness of the ActivityExample: Reach
Lag Indicators: Measure the effectiveness of the overall plan
Example: Awareness
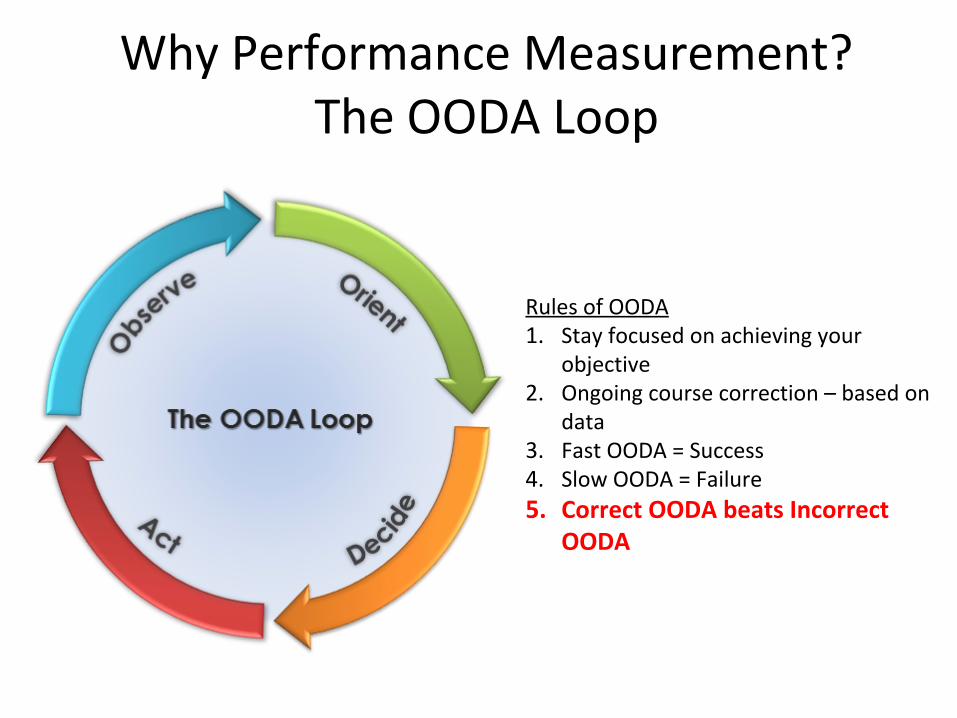
Why Performance Measurement? The OODA Loop
Rules of OODA1. Stay focused on achieving your
objective2. Ongoing course correction – based on
data3. Fast OODA = Success4. Slow OODA = Failure5. Correct OODA beats Incorrect
OODA
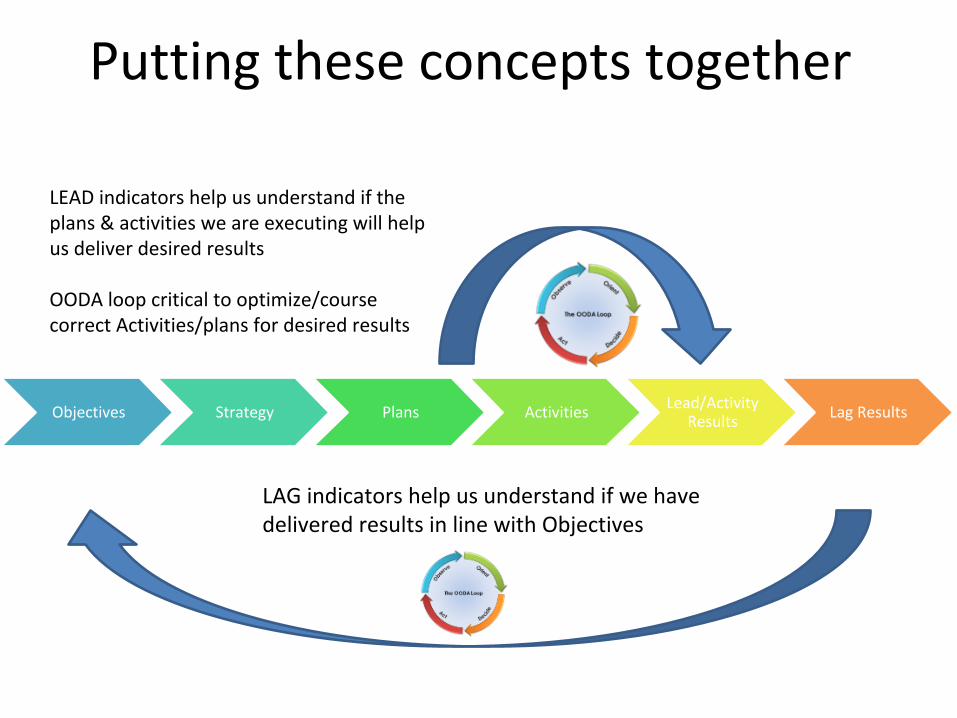
Putting these concepts together
Objectives Strategy Plans Activities Lead/Activity Results Lag Results
LAG indicators help us understand if we have delivered results in line with Objectives
LEAD indicators help us understand if the plans & activities we are executing will help us deliver desired results
OODA loop critical to optimize/course correct Activities/plans for desired results
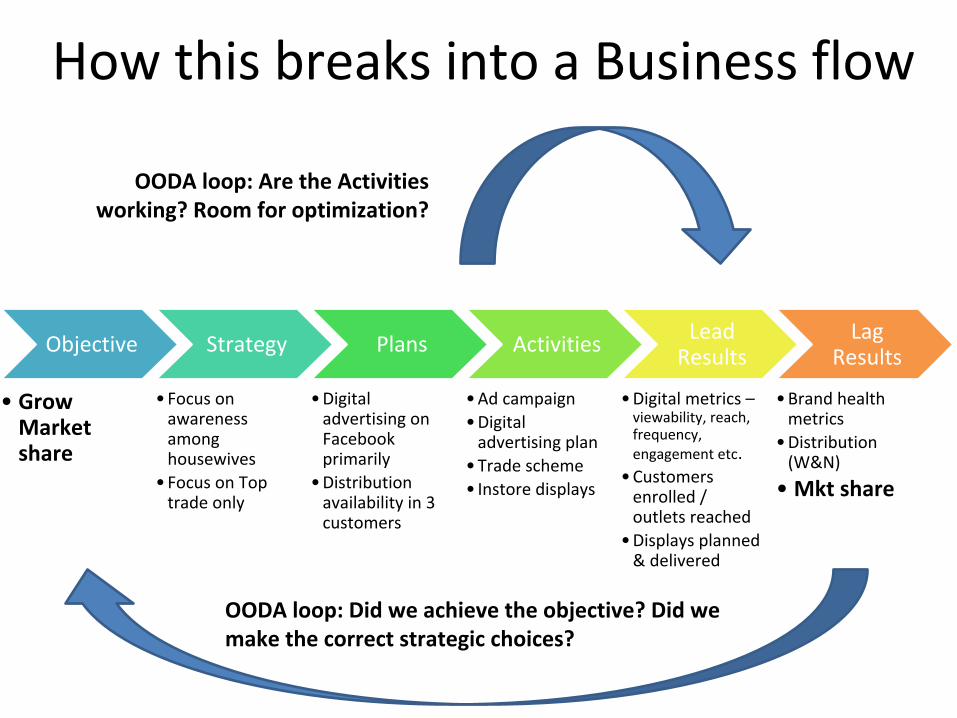
How this breaks into a Business flow
Objective
• Grow Market share
Strategy
• Focus on awareness among housewives
• Focus on Top trade only
Plans
• Digital advertising on Facebook primarily
• Distribution availability in 3 customers
Activities
• Ad campaign• Digital
advertising plan• Trade scheme• Instore displays
Lead Results
• Digital metrics – viewability, reach, frequency, engagement etc.
• Customers enrolled / outlets reached
• Displays planned & delivered
Lag Results
• Brand health metrics
• Distribution (W&N)
• Mkt share
OODA loop: Did we achieve the objective? Did we make the correct strategic choices?
OODA loop: Are the Activities working? Room for optimization?
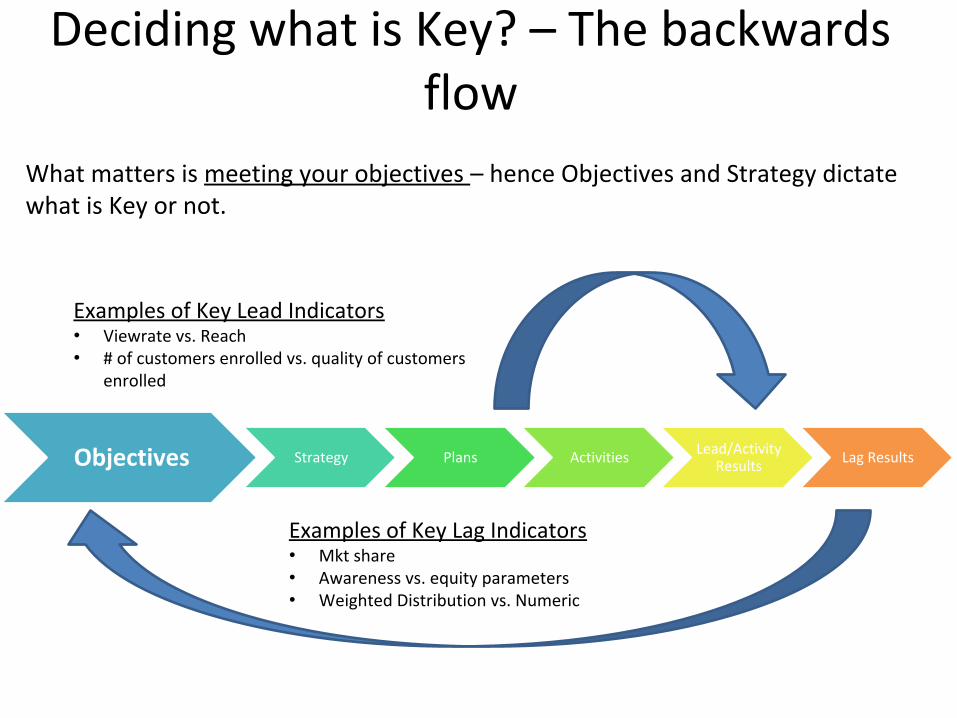
Deciding what is Key? – The backwards flow
Objectives Strategy Plans Activities Lead/Activity Results Lag Results
What matters is meeting your objectives – hence Objectives and Strategy dictate what is Key or not.
Examples of Key Lead Indicators• Viewrate vs. Reach • # of customers enrolled vs. quality of customers
enrolled
Examples of Key Lag Indicators• Mkt share• Awareness vs. equity parameters• Weighted Distribution vs. Numeric
Avoiding the temptation of measuring everything
• An especially digital temptation
• Not everything is worth focusing on– Good to know– Need to know– Don’t care
• Key is a flow from Objectives and what creates an effective OODA– E.g. How important is CPV or CPC?
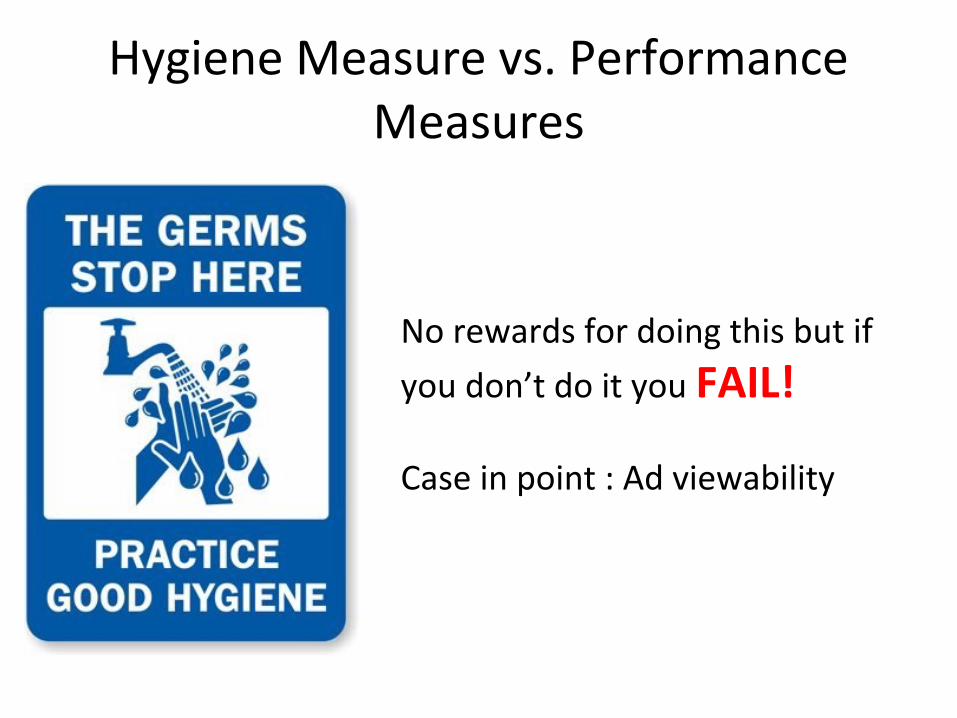
Hygiene Measure vs. Performance Measures
No rewards for doing this but if you don’t do it you FAIL!
Case in point : Ad viewability
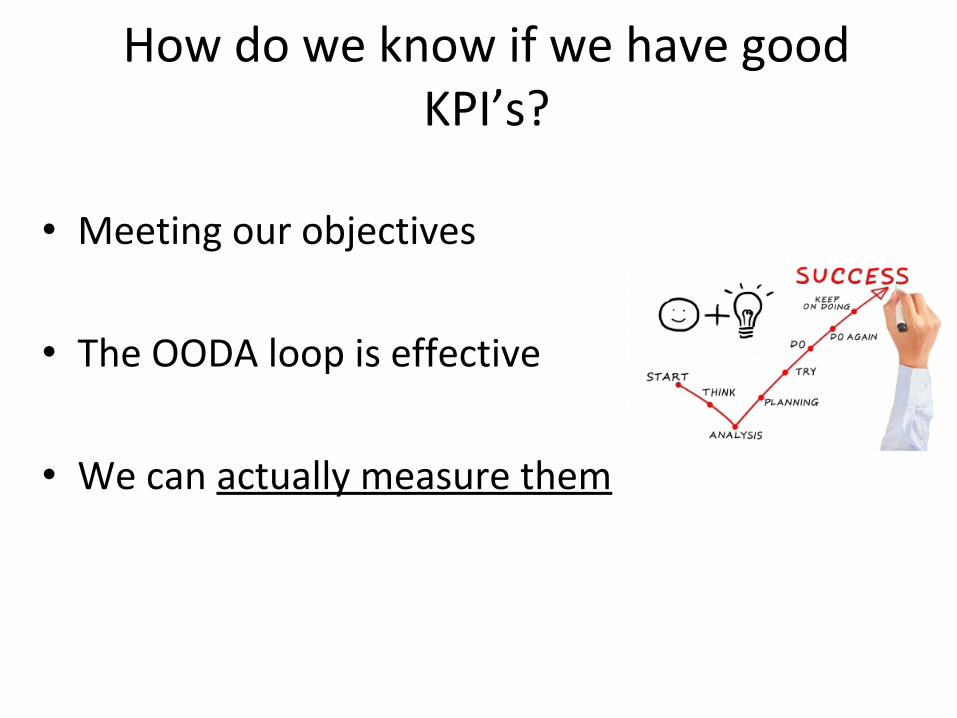
How do we know if we have good KPI’s?
• Meeting our objectives
• The OODA loop is effective
• We can actually measure them
Q&A
Follow us @Meltwater #OutsideInsight


![[Ortega2001]Putting Energy Back in Control](https://img.pdfslide.net/doc/110x75/577cd9301a28ab9e78a2f13e/ortega2001putting-energy-back-in-control.jpg)