Embed Size (px)
Citation preview
25th April 2018
Q1 2018 PRESENTATION
Leif Gustafsson, CEO
Aku Rumpunen, CFO
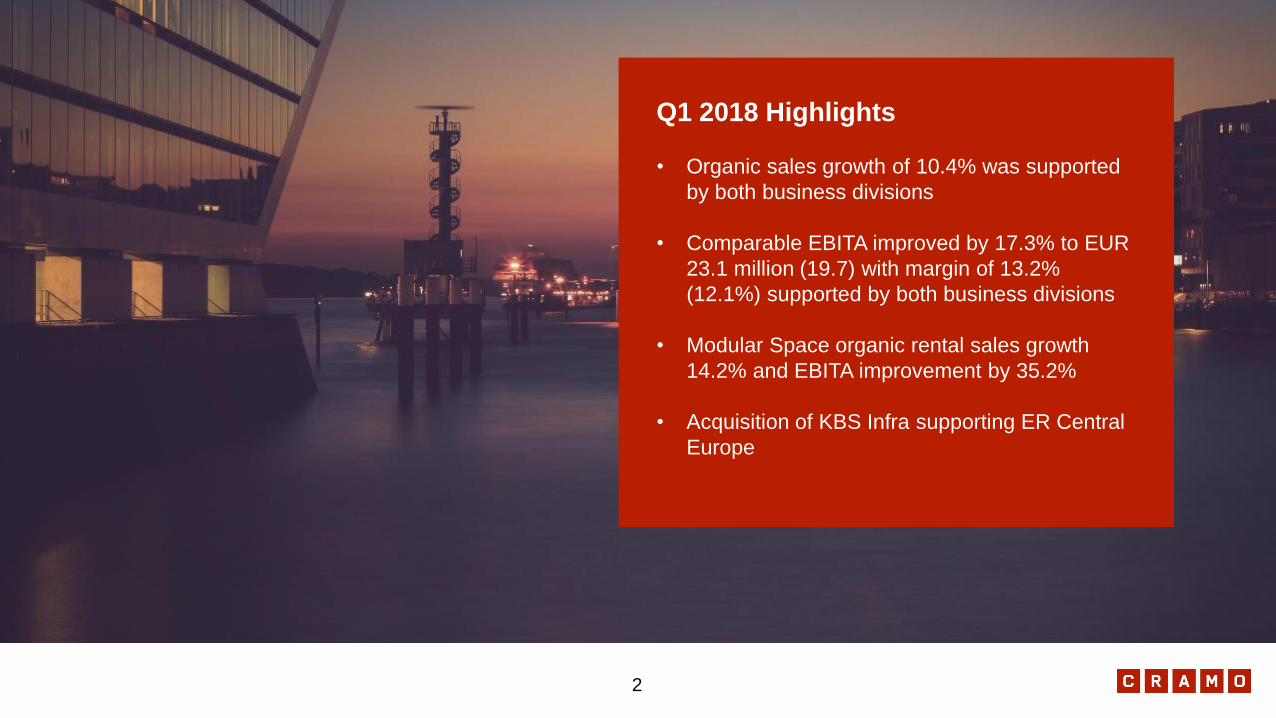
Q1 2018 Highlights
• Organic sales growth of 10.4% was supported
by both business divisions
• Comparable EBITA improved by 17.3% to EUR
23.1 million (19.7) with margin of 13.2%
(12.1%) supported by both business divisions
• Modular Space organic rental sales growth
14.2% and EBITA improvement by 35.2%
• Acquisition of KBS Infra supporting ER Central
Europe
2
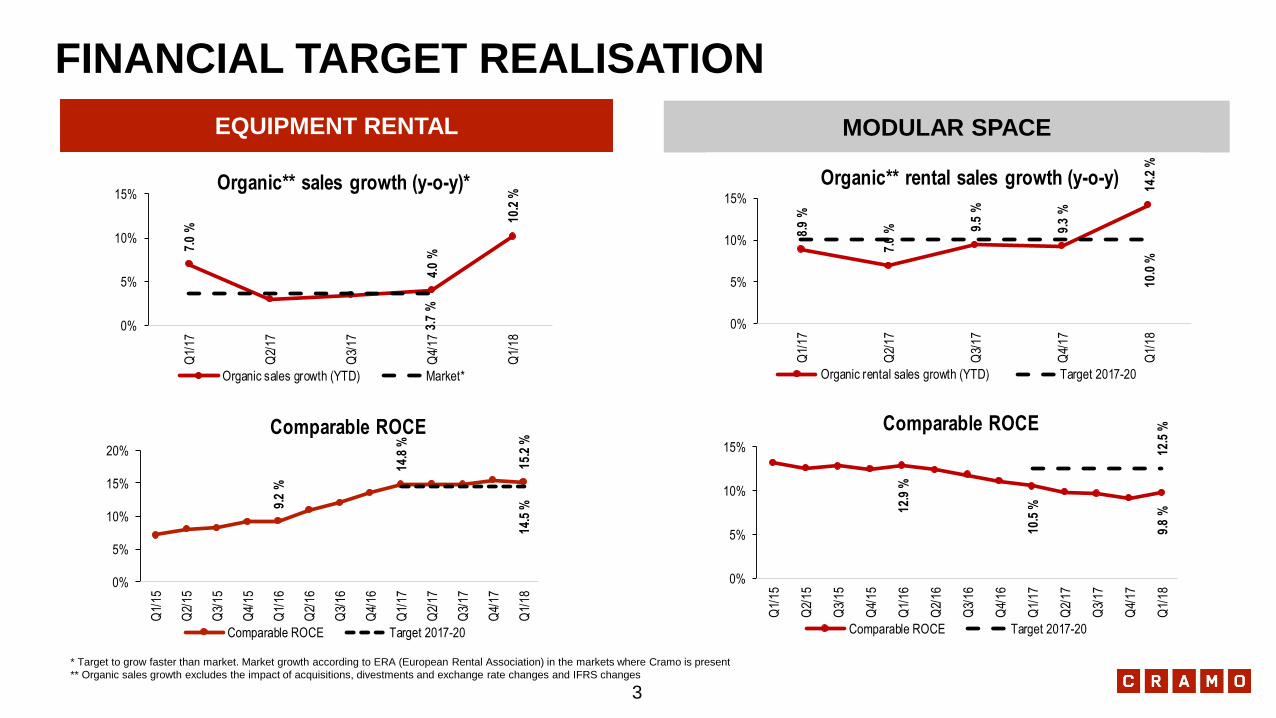
FINANCIAL TARGET REALISATION
EQUIPMENT RENTAL MODULAR SPACE
* Target to grow faster than market. Market growth according to ERA (European Rental Association) in the markets where Cramo is present
** Organic sales growth excludes the impact of acquisitions, divestments and exchange rate changes and IFRS changes
3
9.2
%
14.8
%
15.2
%14
.5 %
0%
5%
10%
15%
20%
Q1/
15
Q2/
15
Q3/
15
Q4/
15
Q1/
16
Q2/
16
Q3/
16
Q4/
16
Q1/
17
Q2/
17
Q3/
17
Q4/
17
Q1/
18
Comparable ROCE
Comparable ROCE Target 2017-20
12.9
%
10.5
%
9.8
%12
.5 %
0%
5%
10%
15%
Q1/
15
Q2/
15
Q3/
15
Q4/
15
Q1/
16
Q2/
16
Q3/
16
Q4/
16
Q1/
17
Q2/
17
Q3/
17
Q4/
17
Q1/
18
Comparable ROCE
Comparable ROCE Target 2017-20
7.0
%
4.0
%
10.2
%
3.7
%
0%
5%
10%
15%Q
1/17
Q2/
17
Q3/
17
Q4/
17
Q1/
18
Organic** sales growth (y-o-y)*
Organic sales growth (YTD) Market*
8.9
%
7.0
% 9.5
%
9.3
%
14.2
%10
.0 %
0%
5%
10%
15%
Q1/
17
Q2/
17
Q3/
17
Q4/
17
Q1/
18
Organic** rental sales growth (y-o-y)
Organic rental sales growth (YTD) Target 2017-20
4
BUSINESS
SEGMENTS
4
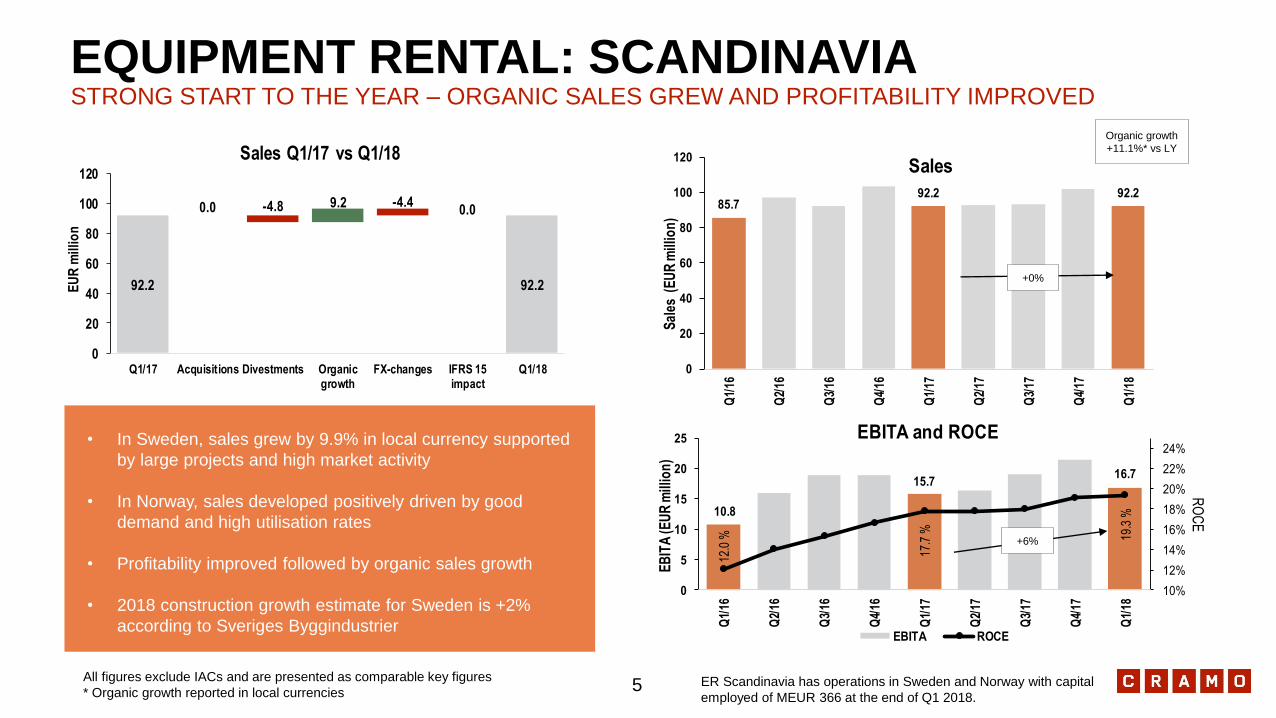
85.792.2 92.2
0
20
40
60
80
100
120
Q1/
16
Q2/
16
Q3/
16
Q4/
16
Q1/
17
Q2/
17
Q3/
17
Q4/
17
Q1/
18
Sal
es (
EU
R m
illio
n)
Sales
10.8
15.716.7
12.0
%
17.7
% 19.3
%
10%
12%
14%
16%
18%
20%
22%
24%
0
5
10
15
20
25
Q1/
16
Q2/
16
Q3/
16
Q4/
16
Q1/
17
Q2/
17
Q3/
17
Q4/
17
Q1/
18
RO
CE
EB
ITA
(EU
R m
illio
n)
EBITA and ROCE
EBITA ROCE
• In Sweden, sales grew by 9.9% in local currency supported
by large projects and high market activity
• In Norway, sales developed positively driven by good
demand and high utilisation rates
• Profitability improved followed by organic sales growth
• 2018 construction growth estimate for Sweden is +2%
according to Sveriges Byggindustrier
EQUIPMENT RENTAL: SCANDINAVIASTRONG START TO THE YEAR – ORGANIC SALES GREW AND PROFITABILITY IMPROVED
+6%
Organic growth
+11.1%* vs LY
ER Scandinavia has operations in Sweden and Norway with capital
employed of MEUR 366 at the end of Q1 2018.
+0%
All figures exclude IACs and are presented as comparable key figures
* Organic growth reported in local currencies
92.2 92.2
0.0 -4.8 9.2 -4.40.0
0
20
40
60
80
100
120
Q1/17 Acquisitions Divestments Organicgrowth
FX-changes IFRS 15impact
Q1/18
EU
R m
illio
n
Sales Q1/17 vs Q1/18
5
28.130.7
32.3
0
5
10
15
20
25
30
35
40
45
Q1/
16
Q2/
16
Q3/
16
Q4/
16
Q1/
17
Q2/
17
Q3/
17
Q4/
17
Q1/
18
Sal
es (
EU
R m
illio
n)
Sales
-0.5
2.2 2.4
8.2
%
13.4
%
13.4
%
0%
5%
10%
15%
20%
-2
0
2
4
6
8
10
12
Q1/
16
Q2/
16
Q3/
16
Q4/
16
Q1/
17
Q2/
17
Q3/
17
Q4/
17
Q1/
18
RO
CE
EB
ITA
(EU
R m
illio
n)
EBITA and ROCE
EBITA ROCE
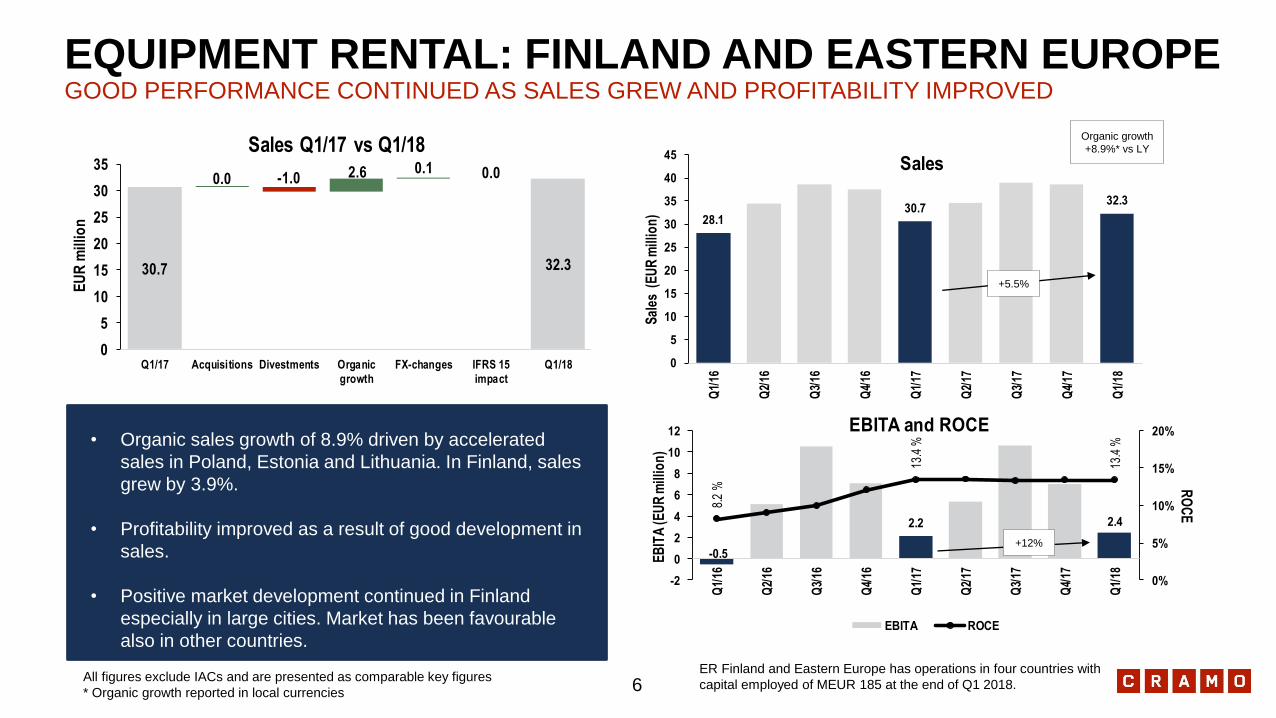
EQUIPMENT RENTAL: FINLAND AND EASTERN EUROPEGOOD PERFORMANCE CONTINUED AS SALES GREW AND PROFITABILITY IMPROVED
+12%
Organic growth
+8.9%* vs LY
+5.5%
• Organic sales growth of 8.9% driven by accelerated
sales in Poland, Estonia and Lithuania. In Finland, sales
grew by 3.9%.
• Profitability improved as a result of good development in
sales.
• Positive market development continued in Finland
especially in large cities. Market has been favourable
also in other countries.
ER Finland and Eastern Europe has operations in four countries with
capital employed of MEUR 185 at the end of Q1 2018.All figures exclude IACs and are presented as comparable key figures
* Organic growth reported in local currencies
30.7 32.3
0.0 -1.0 2.6 0.1 0.0
0
5
10
15
20
25
30
35
Q1/17 Acquisitions Divestments Organic
growth
FX-changes IFRS 15
impact
Q1/18
EU
R m
illio
n
Sales Q1/17 vs Q1/18
6
13.814.5
18.7
0
5
10
15
20
25
Q1/
16
Q2/
16
Q3/
16
Q4/
16
Q1/
17
Q2/
17
Q3/
17
Q4/
17
Q1/
18
Sa
les
(E
UR
mil
lio
n)
Sales
-3.4-2.5
-1.8
-1.5
%
5.1
%
4.4
%
-3%
-1%
1%
3%
5%
7%
-4
-3
-2
-1
0
1
2
3
4
5
Q1/
16
Q2/
16
Q3/
16
Q4/
16
Q1/
17
Q2/
17
Q3/
17
Q4/
17
Q1/
18
RO
CE
EB
ITA
(E
UR
mil
lio
n)
EBITA and ROCE
EBITA ROCE
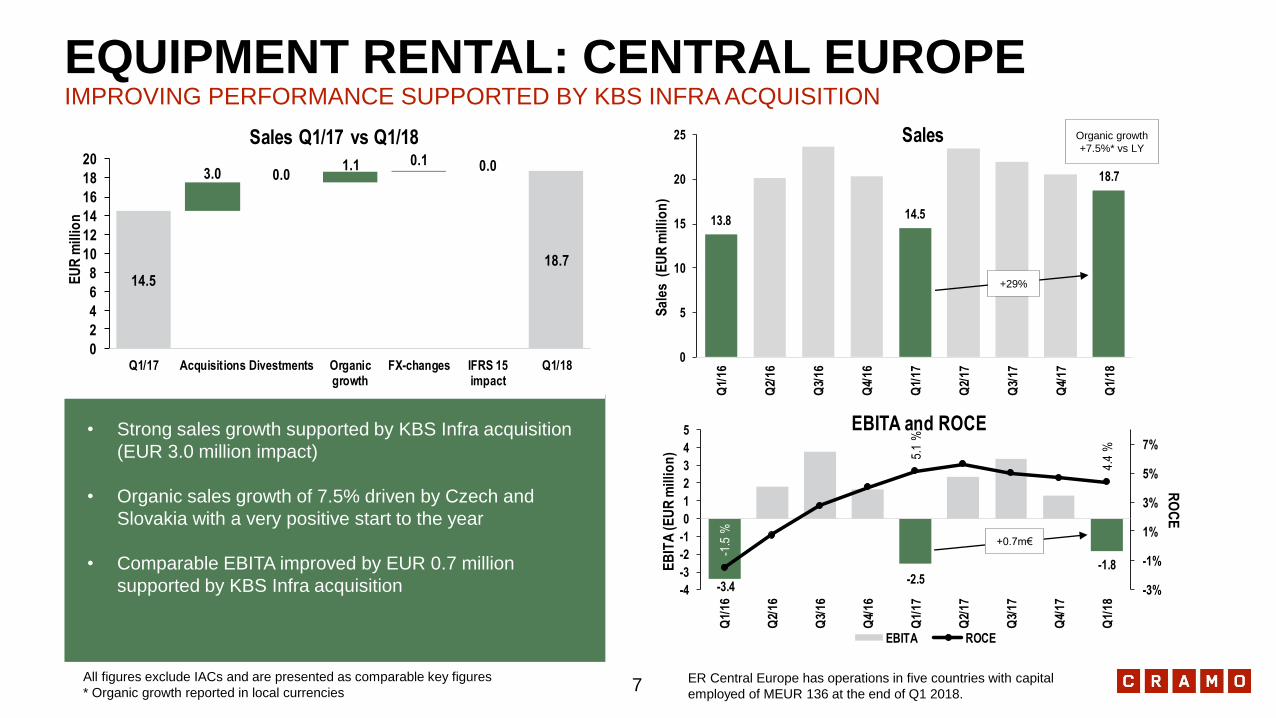
EQUIPMENT RENTAL: CENTRAL EUROPEIMPROVING PERFORMANCE SUPPORTED BY KBS INFRA ACQUISITION
Organic growth
+7.5%* vs LY
ER Central Europe has operations in five countries with capital
employed of MEUR 136 at the end of Q1 2018.
• Strong sales growth supported by KBS Infra acquisition
(EUR 3.0 million impact)
• Organic sales growth of 7.5% driven by Czech and
Slovakia with a very positive start to the year
• Comparable EBITA improved by EUR 0.7 million
supported by KBS Infra acquisition
All figures exclude IACs and are presented as comparable key figures
* Organic growth reported in local currencies
14.5
18.7
3.0 0.01.1 0.1 0.0
0
2
4
6
8
10
12
14
16
18
20
Q1/17 Acquisitions Divestments Organicgrowth
FX-changes IFRS 15impact
Q1/18
EU
R m
illio
n
Sales Q1/17 vs Q1/18
+0.7m€
+29%
7
7.9
6.3
8.5
12.9
%
10.5
%
9.8
%
5%
7%
9%
11%
13%
15%
17%
19%
0
1
2
3
4
5
6
7
8
9
Q1/
16
Q2/
16
Q3/
16
Q4/
16
Q1/
17
Q2/
17
Q3/
17
Q4/
17
Q1/
18
RO
CE
EB
ITA
(EU
R m
illio
n)
EBITA and ROCE
EBITA ROCE
18.4 20.022.6
9.6 5.7
9.5
28.025.7
32.1
0
5
10
15
20
25
30
35
40
Q1/
16
Q2/
16
Q3/
16
Q4/
16
Q1/
17
Q2/
17
Q3/
17
Q4/
17
Q1/
18
Sal
es (
EU
R m
illio
n)
Sales
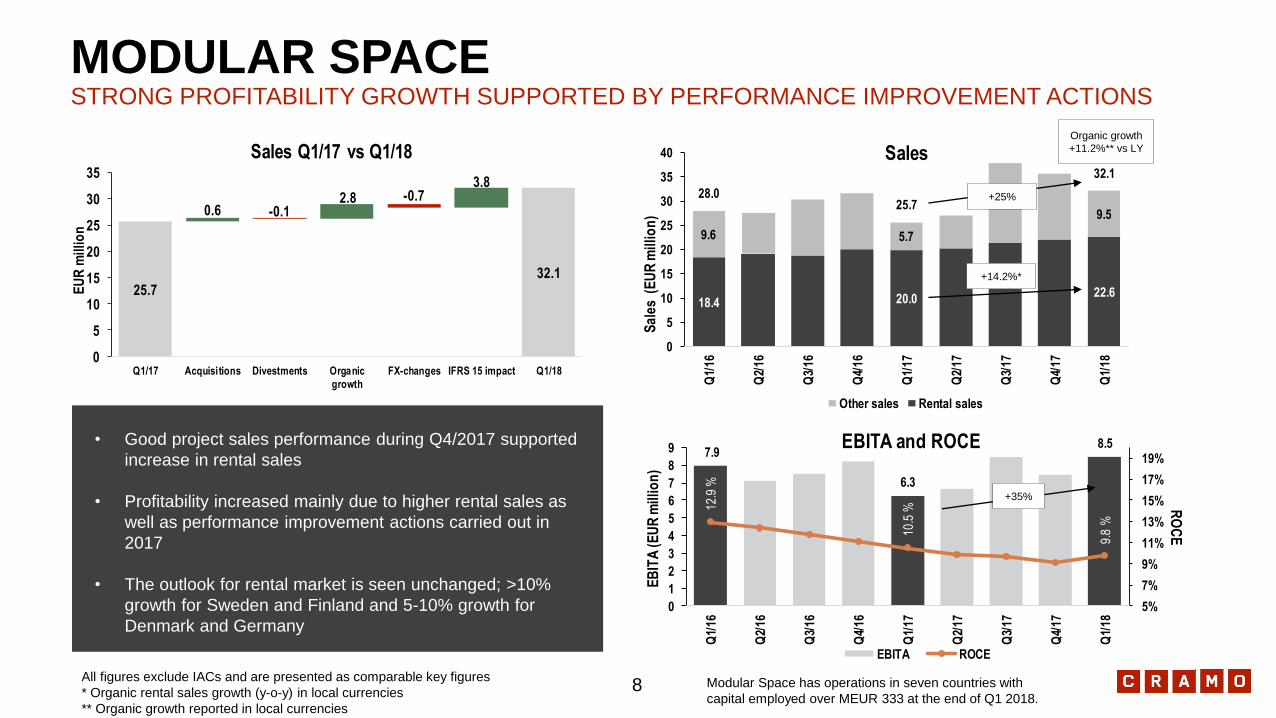
Other sales Rental sales Sales
• Good project sales performance during Q4/2017 supported
increase in rental sales
• Profitability increased mainly due to higher rental sales as
well as performance improvement actions carried out in
2017
• The outlook for rental market is seen unchanged; >10%
growth for Sweden and Finland and 5-10% growth for
Denmark and Germany
MODULAR SPACESTRONG PROFITABILITY GROWTH SUPPORTED BY PERFORMANCE IMPROVEMENT ACTIONS
Modular Space has operations in seven countries with
capital employed over MEUR 333 at the end of Q1 2018.
+35%
Organic growth
+11.2%** vs LY
+14.2%*+25%
All figures exclude IACs and are presented as comparable key figures
* Organic rental sales growth (y-o-y) in local currencies
** Organic growth reported in local currencies
+25%
25.732.1
0.6 -0.12.8 -0.7
3.8
0
5
10
15
20
25
30
35
Q1/17 Acquisitions Divestments Organic
growth
FX-changes IFRS 15 impact Q1/18
EU
R m
illi
on
Sales Q1/17 vs Q1/18
8
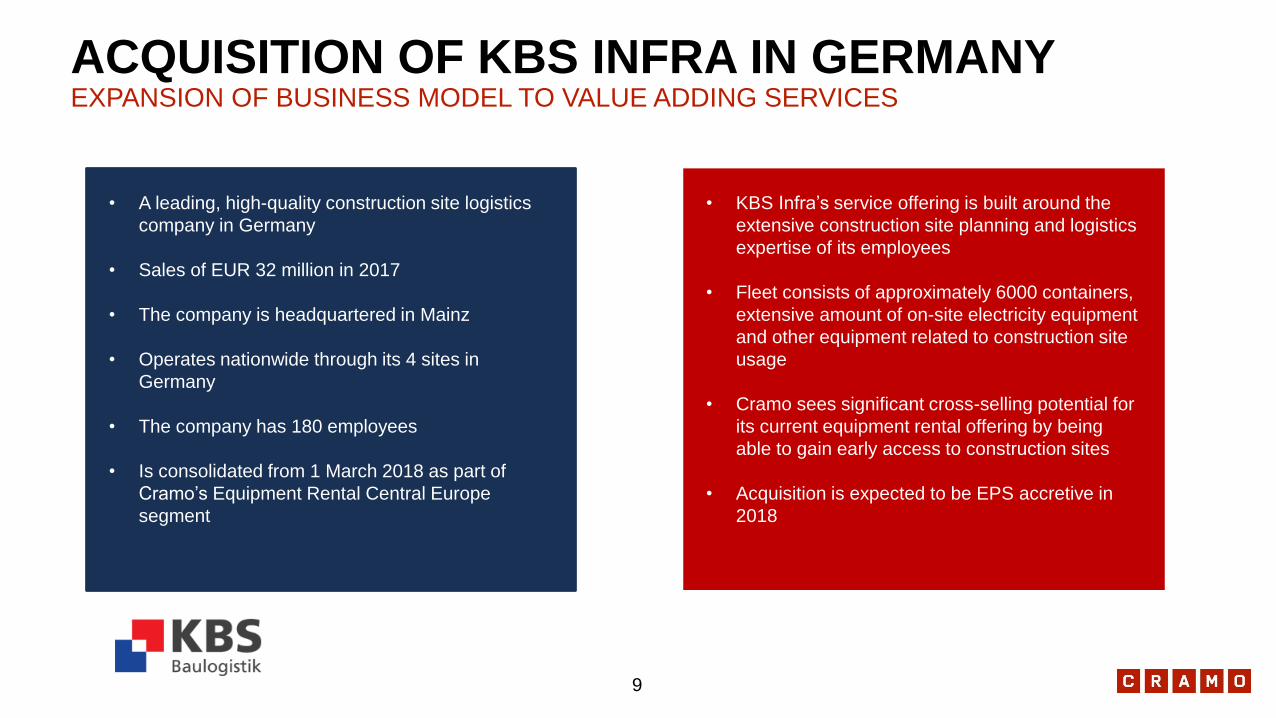
ACQUISITION OF KBS INFRA IN GERMANYEXPANSION OF BUSINESS MODEL TO VALUE ADDING SERVICES
• A leading, high-quality construction site logistics
company in Germany
• Sales of EUR 32 million in 2017
• The company is headquartered in Mainz
• Operates nationwide through its 4 sites in
Germany
• The company has 180 employees
• Is consolidated from 1 March 2018 as part of
Cramo’s Equipment Rental Central Europe
segment
• KBS Infra’s service offering is built around the
extensive construction site planning and logistics
expertise of its employees
• Fleet consists of approximately 6000 containers,
extensive amount of on-site electricity equipment
and other equipment related to construction site
usage
• Cramo sees significant cross-selling potential for
its current equipment rental offering by being
able to gain early access to construction sites
• Acquisition is expected to be EPS accretive in
2018
9
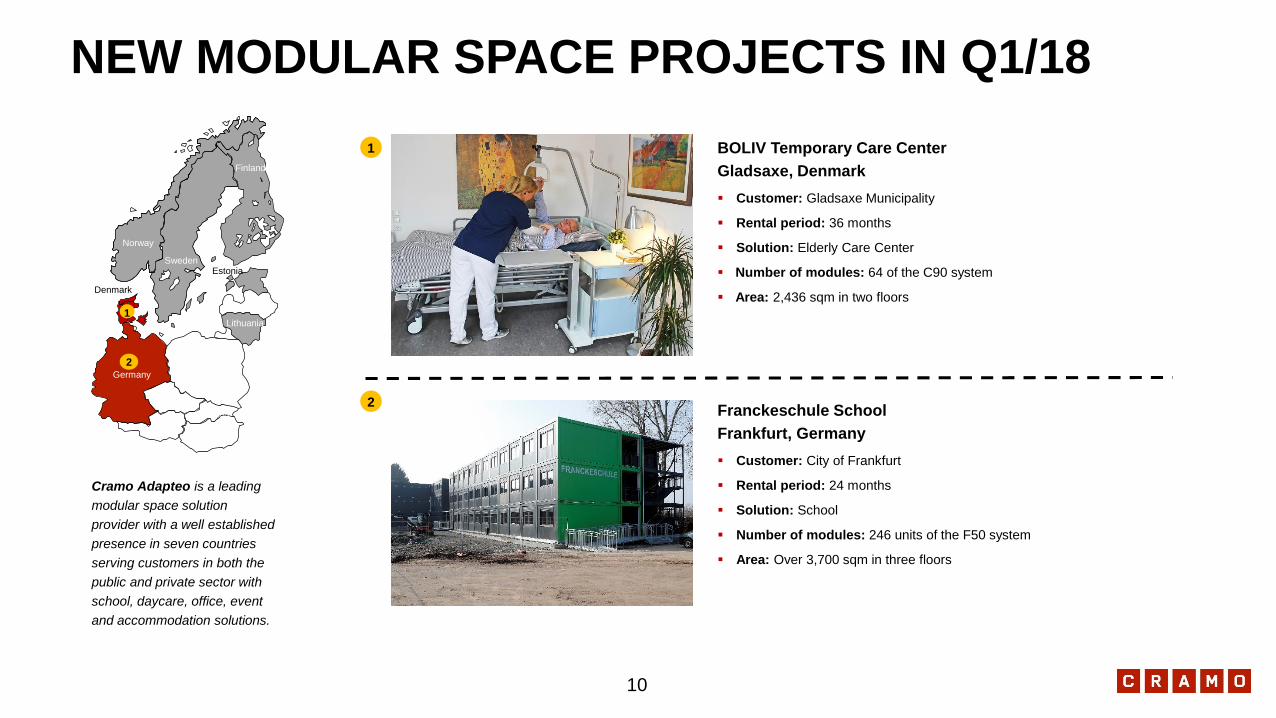
NEW MODULAR SPACE PROJECTS IN Q1/18
BOLIV Temporary Care Center
Gladsaxe, Denmark
▪ Customer: Gladsaxe Municipality
▪ Rental period: 36 months
▪ Solution: Elderly Care Center
▪ Number of modules: 64 of the C90 system
▪ Area: 2,436 sqm in two floors
Franckeschule School
Frankfurt, Germany
▪ Customer: City of Frankfurt
▪ Rental period: 24 months
▪ Solution: School
▪ Number of modules: 246 units of the F50 system
▪ Area: Over 3,700 sqm in three floors
Denmark
Germany
Slovakia
Lithuania
Estonia
Norway
Sweden
Finland
1
1
2
2
Cramo Adapteo is a leading
modular space solution
provider with a well established
presence in seven countries
serving customers in both the
public and private sector with
school, daycare, office, event
and accommodation solutions.
10
GROUP
PERFORMANCE
Q1 2018
11
147
161
172
187
155
179185
193
163
178
192197
175
-2%
0%
2%
4%
6%
8%
10%
12%
0
50
100
150
200
250
Q1/
15
Q2/
15
Q3/
15
Q4/
15
Q1/
16
Q2/
16
Q3/
16
Q4/
16
Q1/
17
Q2/
17
Q3/
17
Q4/
17
Q1/
18
Sa
les g
row
th (%
, y-o-y)S
ales
(EU
R m
illio
n)
659 660 661
668
676
694
707
712
720 719
726730
742
0%
1%
2%
3%
4%
5%
6%
7%
8%
600
620
640
660
680
700
720
740
760
Q1/
15
Q2/
15
Q3/
15
Q4/
15
Q1/
16
Q2/
16
Q3/
16
Q4/
16
Q1/
17
Q2/
17
Q3/
17
Q4/
17
Q1/
18
R1
2M
sale
s gro
wth
(%, y-o
-y)
R1
2M
sa
les
(EU
R m
illio
n)
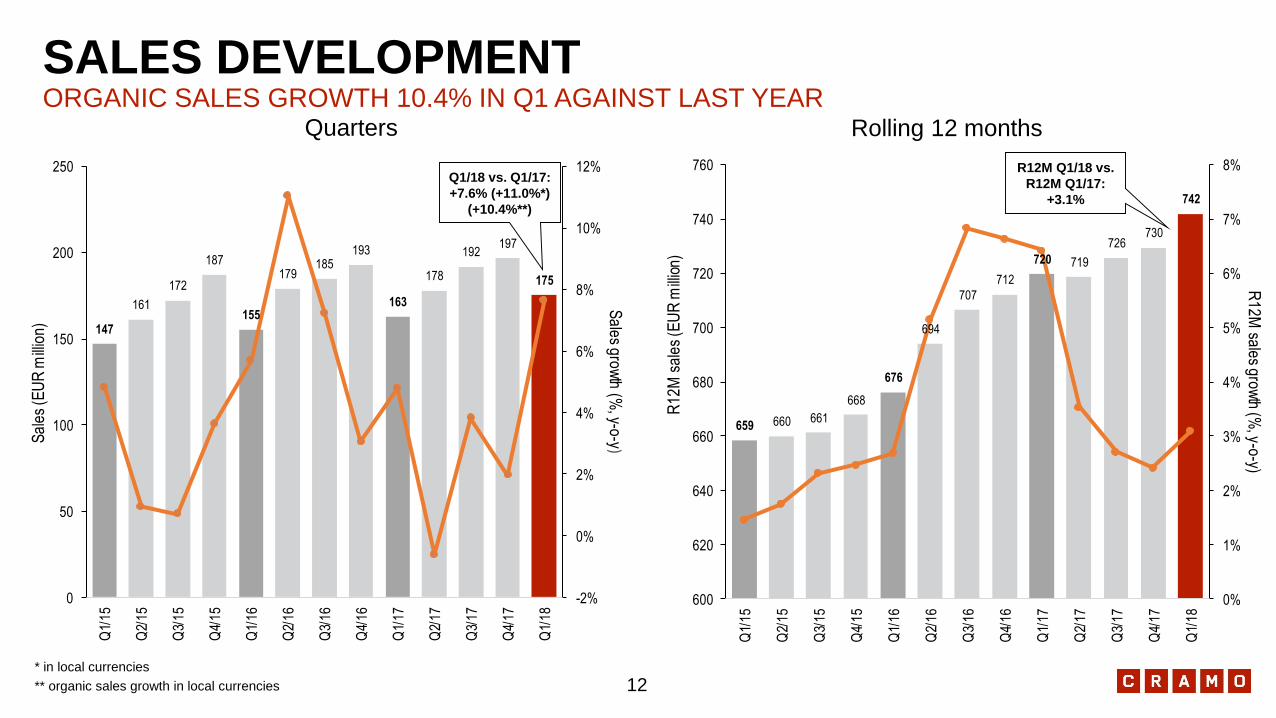
SALES DEVELOPMENTORGANIC SALES GROWTH 10.4% IN Q1 AGAINST LAST YEAR
* in local currencies
** organic sales growth in local currencies
Quarters Rolling 12 months
R12M Q1/18 vs.
R12M Q1/17:
+3.1%
Q1/18 vs. Q1/17:
+7.6% (+11.0%*)
(+10.4%**)
12
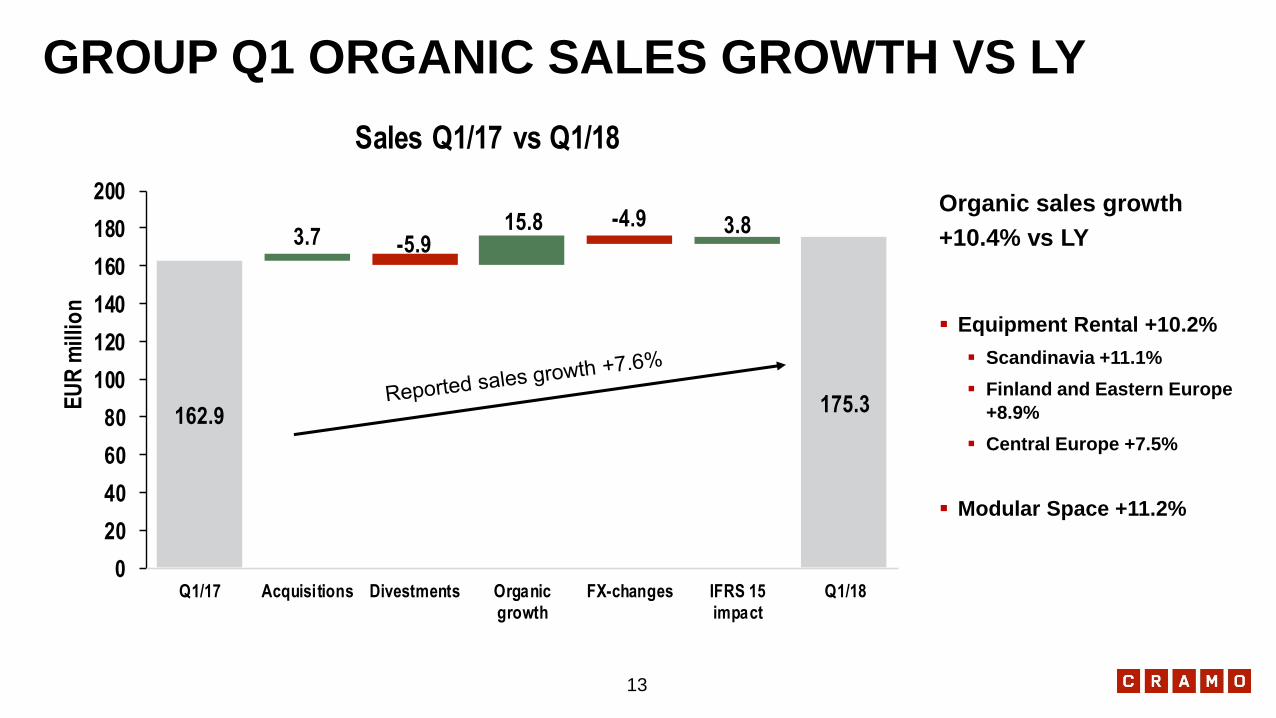
162.9175.3
3.7 -5.915.8 -4.9 3.8
0
20
40
60
80
100
120
140
160
180
200
Q1/17 Acquisitions Divestments Organic
growth
FX-changes IFRS 15
impact
Q1/18
EU
R m
illio
n
Sales Q1/17 vs Q1/18
GROUP Q1 ORGANIC SALES GROWTH VS LY
Organic sales growth
+10.4% vs LY
▪ Equipment Rental +10.2%
▪ Scandinavia +11.1%
▪ Finland and Eastern Europe
+8.9%
▪ Central Europe +7.5%
▪ Modular Space +11.2%
13
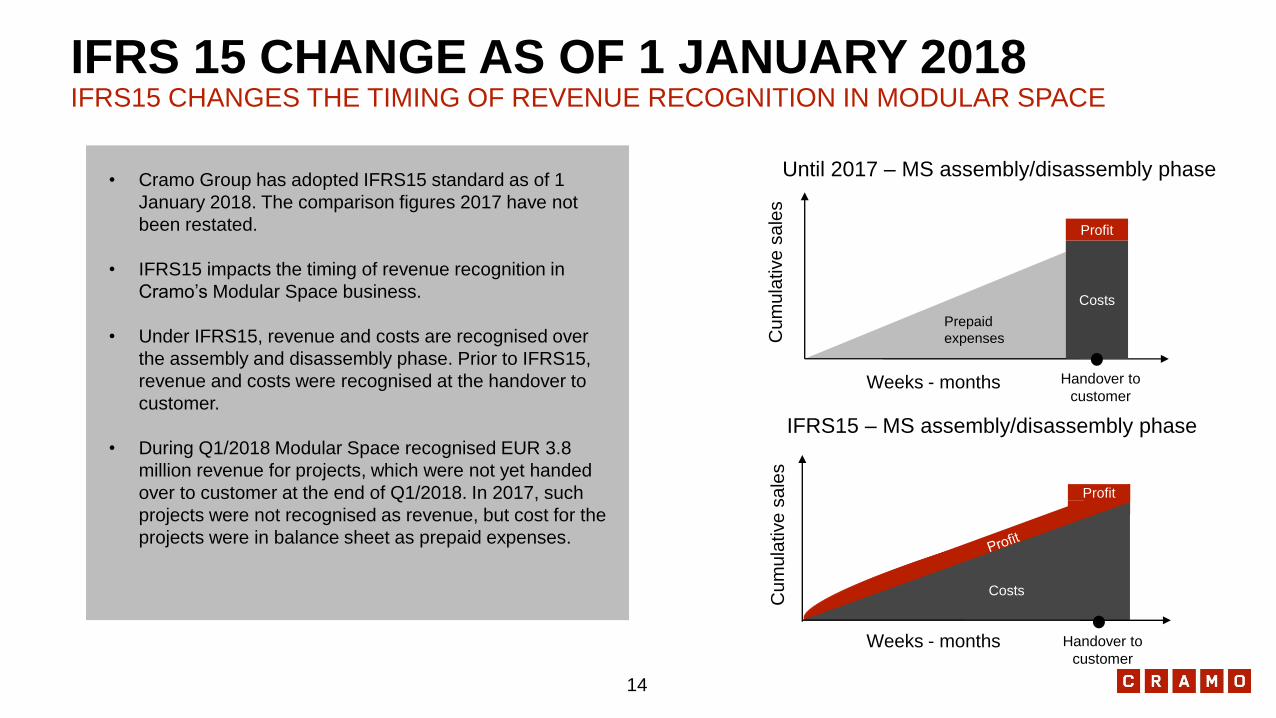
IFRS 15 CHANGE AS OF 1 JANUARY 2018IFRS15 CHANGES THE TIMING OF REVENUE RECOGNITION IN MODULAR SPACE
• Cramo Group has adopted IFRS15 standard as of 1
January 2018. The comparison figures 2017 have not
been restated.
• IFRS15 impacts the timing of revenue recognition in
Cramo’s Modular Space business.
• Under IFRS15, revenue and costs are recognised over
the assembly and disassembly phase. Prior to IFRS15,
revenue and costs were recognised at the handover to
customer.
• During Q1/2018 Modular Space recognised EUR 3.8
million revenue for projects, which were not yet handed
over to customer at the end of Q1/2018. In 2017, such
projects were not recognised as revenue, but cost for the
projects were in balance sheet as prepaid expenses.
Cu
mu
lative
sa
les
Costs
Profit
Prepaid
expenses
Until 2017 – MS assembly/disassembly phase
Handover to
customer
Cu
mu
lative
sa
les
Costs
IFRS15 – MS assembly/disassembly phase
Handover to
customer
Weeks - months
Weeks - months
Profit
14
10.1
18.4
31.4
27.0
13.0
26.6
38.9
32.6
19.7
27.8
40.2
32.4
23.1
6.9 %
8.3 %
12.1 %
13.2 %
5%
7%
9%
11%
13%
15%
17%
19%
21%
23%
0
5
10
15
20
25
30
35
40
45
Q1/
15
Q2/
15
Q3/
15
Q4/
15
Q1/
16
Q2/
16
Q3/
16
Q4/
16
Q1/
17
Q2/
17
Q3/
17
Q4/
17
Q1/
18
EB
ITA
ma
rgin
(%, lin
e g
rap
h)
EB
ITA
(E
UR
mill
ion
)
79
85 86 8790
98
105
111
118 119 120 120123
12.0 %
13.3 %
16.4 %
16.6 %
5%
7%
9%
11%
13%
15%
17%
19%
0
20
40
60
80
100
120
140
Q1/
15
Q2/
15
Q3/
15
Q4/
15
Q1/
16
Q2/
16
Q3/
16
Q4/
16
Q1/
17
Q2/
17
Q3/
17
Q4/
17
Q1/
18
R1
2M
EB
ITA
ma
rgin (%
, line
gra
ph)
R1
2M
EB
ITA
(E
UR
mill
ion
)
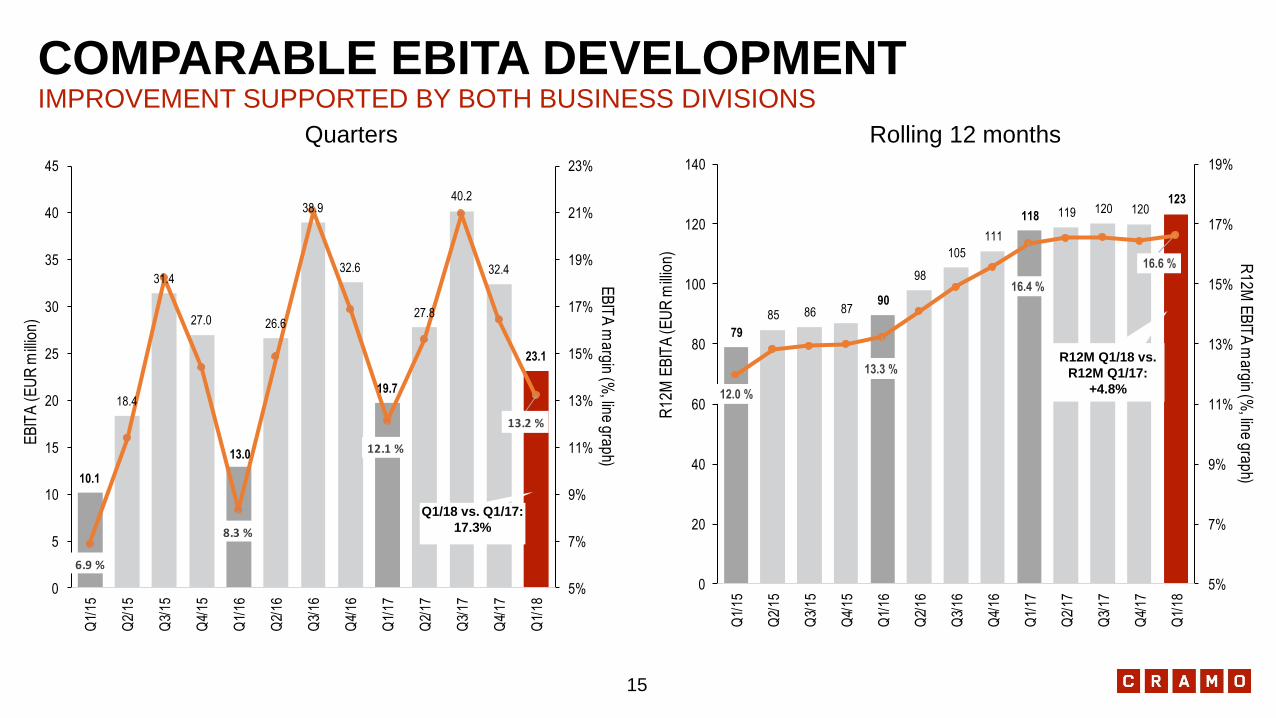
COMPARABLE EBITA DEVELOPMENTIMPROVEMENT SUPPORTED BY BOTH BUSINESS DIVISIONS
Quarters Rolling 12 months
Q1/18 vs. Q1/17:
17.3%
R12M Q1/18 vs.
R12M Q1/17:
+4.8%
15
23
9.4
24
0.4
65
.5
67
.9
59
.8 64
.2
59
.3
56
.9
54
.8
51
.4 59
.1
33
.6 %
33
.0 %
34
.0 %
34
.5 %
32
.3 %
33
.5 %
33
.1 %
31
.9 %
35
.3 %
31
.5 % 3
3.7
%
0
50
100
150
200
250
300
0.0 %
5.0 %
10.0 %
15.0 %
20.0 %
25.0 %
30.0 %
35.0 %
40.0 %
2016 2017 2018 2016 2017 2018 2016 2017 2018 2016 2017 2018 2016 2017 2018
Jan-Dec Q4 Q3 Q2 Q1
Dire
ct cost (E
UR
millio
n)D
ire
ct c
ost
ra
tio
Direct costs (right axis) Direct cost ratio (left axis)
27
2.9
27
6.3
73
.8
72
.8
63
.6
63
.6 70
.4
70
.7
65
.1
69
.2
69
.3
38
.3 %
37
.9 %
38
.2 %
37
.0 %
34
.4 %
33
.1 %
39
.3 %
39
.7 % 4
1.9
%
42
.5 %
39
.5 %
0
50
100
150
200
250
300
350
400
0.0 %
5.0 %
10.0 %
15.0 %
20.0 %
25.0 %
30.0 %
35.0 %
40.0 %
45.0 %
50.0 %
2016 2017 2018 2016 2017 2018 2016 2017 2018 2016 2017 2018 2016 2017 2018
Jan-Dec Q4 Q3 Q2 Q1
Ind
irect co
st (EU
R m
illion
)Ind
ire
ct c
ost
ra
tio
Indirect costs (right axis) Indirect cost ratio (left axis)
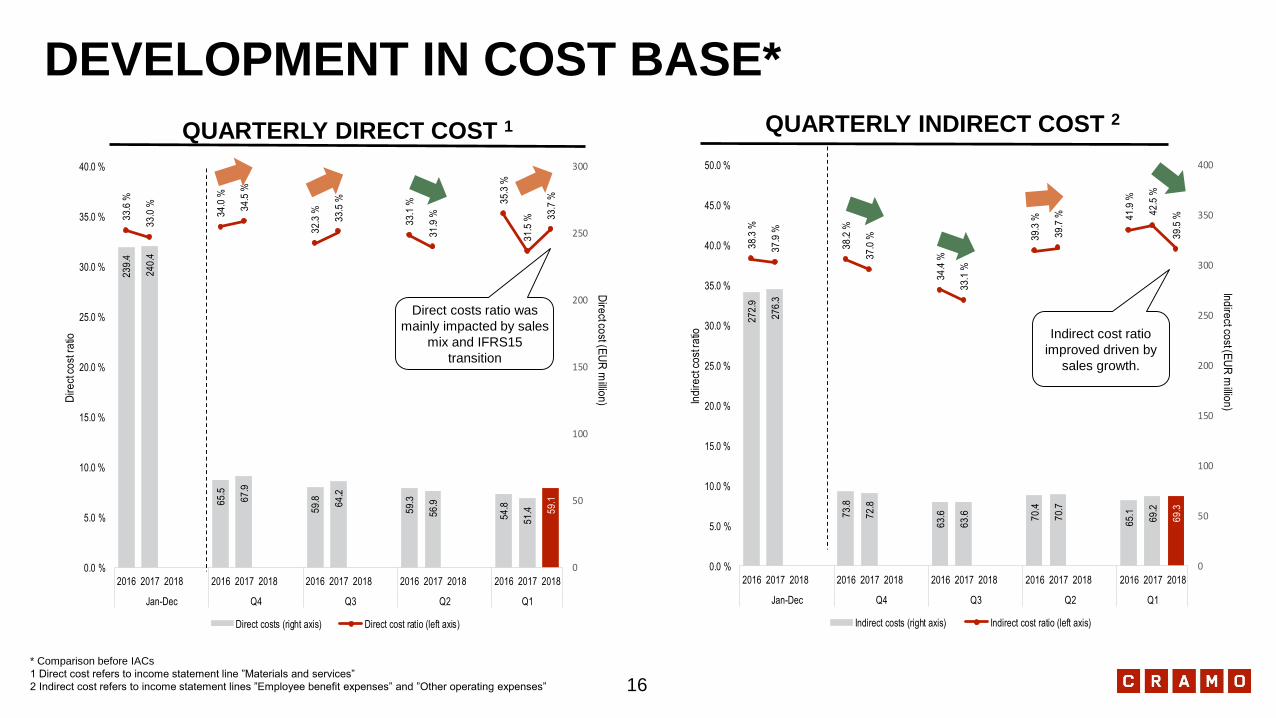
* Comparison before IACs
1 Direct cost refers to income statement line ”Materials and services”
2 Indirect cost refers to income statement lines ”Employee benefit expenses” and ”Other operating expenses”
QUARTERLY INDIRECT COST 2QUARTERLY DIRECT COST 1
DEVELOPMENT IN COST BASE*
16
Direct costs ratio was
mainly impacted by sales
mix and IFRS15
transition
Indirect cost ratio
improved driven by
sales growth.
19.7
23.1
19.7
1.0 0.3 0.7
2.2 -0.81.9
2.2-0.7
0
5
10
15
20
25
30
Q1/2017 ER Scandinavia ER EasternEurope
ER CentralEurope
MS Non-allocated Q1/2018 ER MS Non-allocated Q1/2017
Development against LY Development against LY
Com
para
ble
EBIT
A (E
UR
milli
on)
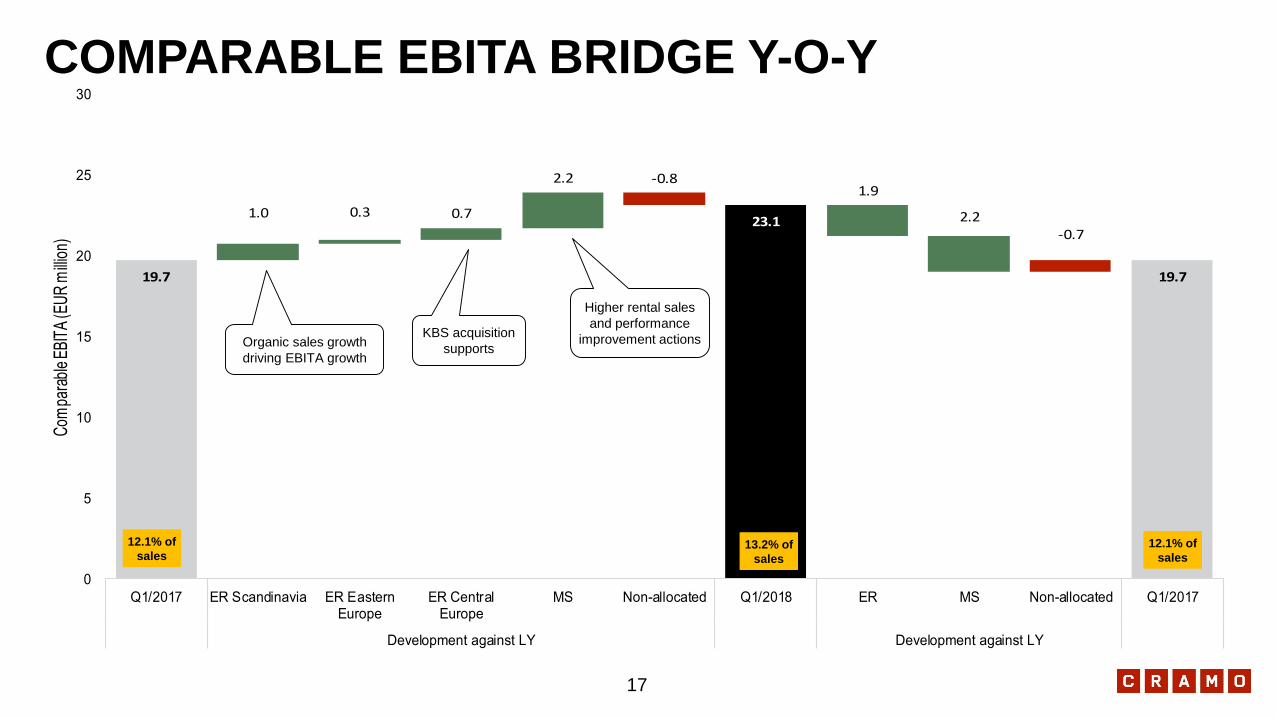
COMPARABLE EBITA BRIDGE Y-O-Y
12.1% of
sales13.2% of
sales
12.1% of
sales
17
Organic sales growth
driving EBITA growth
KBS acquisition
supports
Higher rental sales
and performance
improvement actions
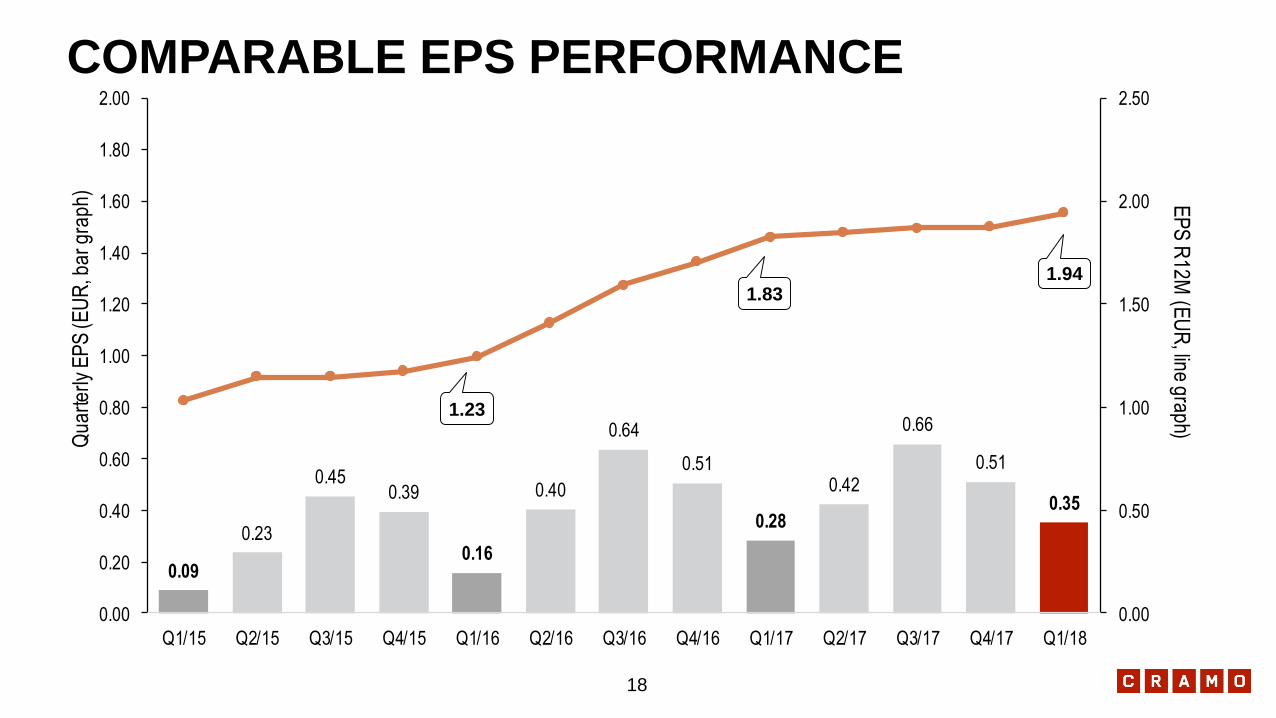
0.09
0.23
0.450.39
0.16
0.40
0.64
0.51
0.28
0.42
0.66
0.51
0.35
0.00
0.50
1.00
1.50
2.00
2.50
0.00
0.20
0.40
0.60
0.80
1.00
1.20
1.40
1.60
1.80
2.00
Q1/15 Q2/15 Q3/15 Q4/15 Q1/16 Q2/16 Q3/16 Q4/16 Q1/17 Q2/17 Q3/17 Q4/17 Q1/18
EP
S R
12M (E
UR
, line graph)Q
ua
rte
rly
EP
S (
EU
R, b
ar
gra
ph
)COMPARABLE EPS PERFORMANCE
1.831.94
1.23
18
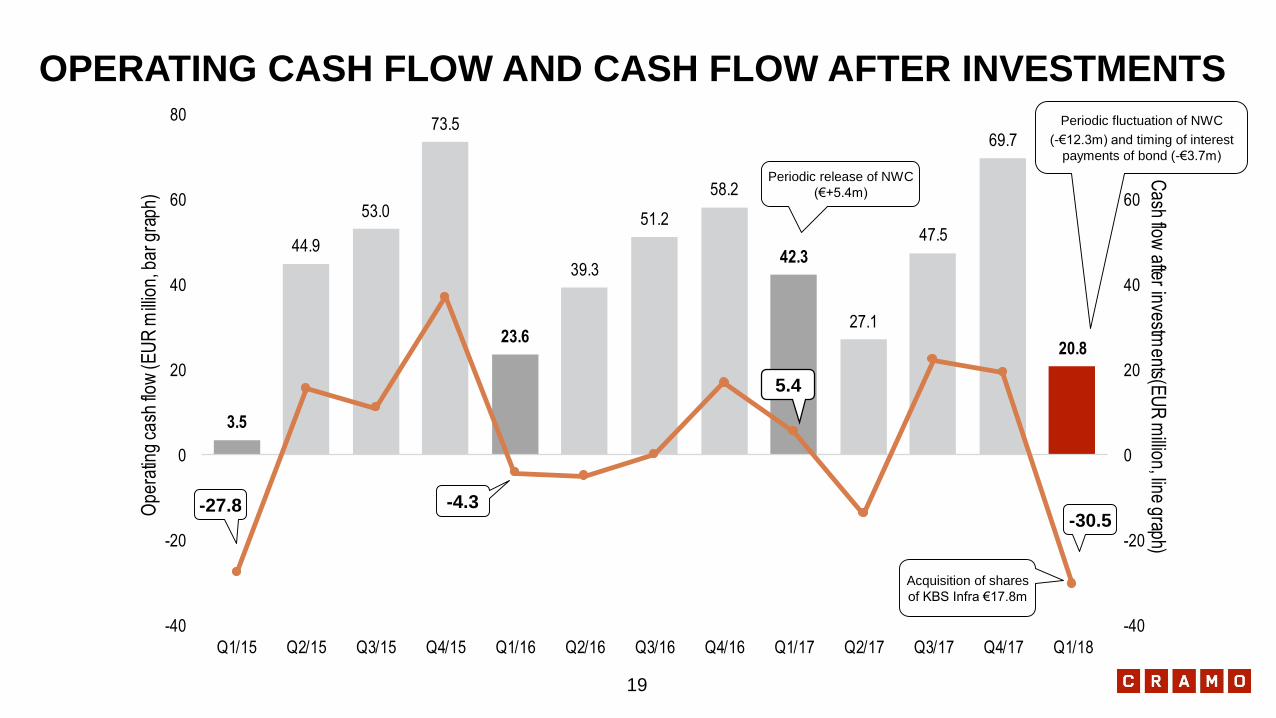
3.5
44.9
53.0
73.5
23.6
39.3
51.2
58.2
42.3
27.1
47.5
69.7
20.8
-40
-20
0
20
40
60
80
-40
-20
0
20
40
60
80
Q1/15 Q2/15 Q3/15 Q4/15 Q1/16 Q2/16 Q3/16 Q4/16 Q1/17 Q2/17 Q3/17 Q4/17 Q1/18
Cash flow
after investments(E
UR
million, line graph)
Ope
ratin
g ca
sh fl
ow (
EU
R m
illio
n, b
ar g
raph
)
OPERATING CASH FLOW AND CASH FLOW AFTER INVESTMENTS
5.4
-4.3-30.5
Acquisition of shares
of KBS Infra €17.8m
19
Periodic fluctuation of NWC
(-€12.3m) and timing of interest
payments of bond (-€3.7m)
Periodic release of NWC
(€+5.4m)
-27.8
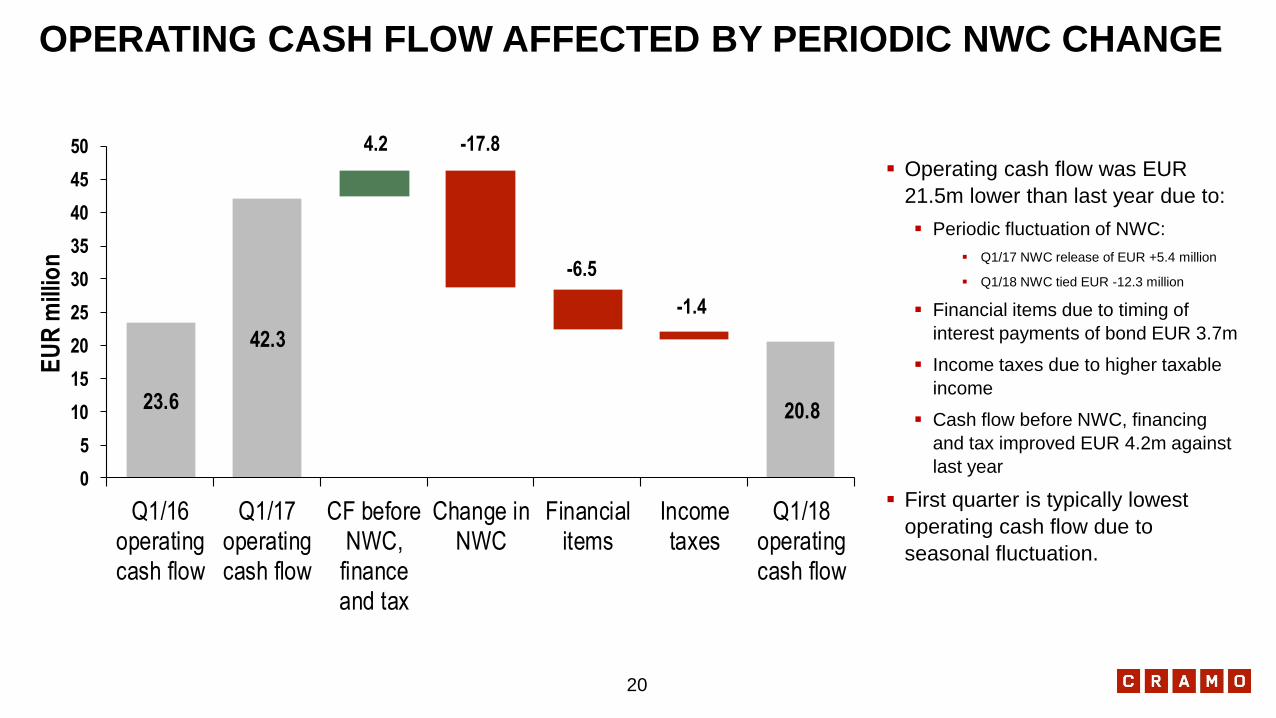
23.6
42.3
20.8
0
5
10
15
20
25
30
35
40
45
50
Q1/16operatingcash flow
Q1/17operatingcash flow
CF beforeNWC,
financeand tax
Change inNWC
Financialitems
Incometaxes
Q1/18operatingcash flow
EU
R m
illio
nOPERATING CASH FLOW AFFECTED BY PERIODIC NWC CHANGE
20
4.2 -17.8
-6.5
-1.4
▪ Operating cash flow was EUR
21.5m lower than last year due to:
▪ Periodic fluctuation of NWC:
▪ Q1/17 NWC release of EUR +5.4 million
▪ Q1/18 NWC tied EUR -12.3 million
▪ Financial items due to timing of
interest payments of bond EUR 3.7m
▪ Income taxes due to higher taxable
income
▪ Cash flow before NWC, financing
and tax improved EUR 4.2m against
last year
▪ First quarter is typically lowest
operating cash flow due to
seasonal fluctuation.
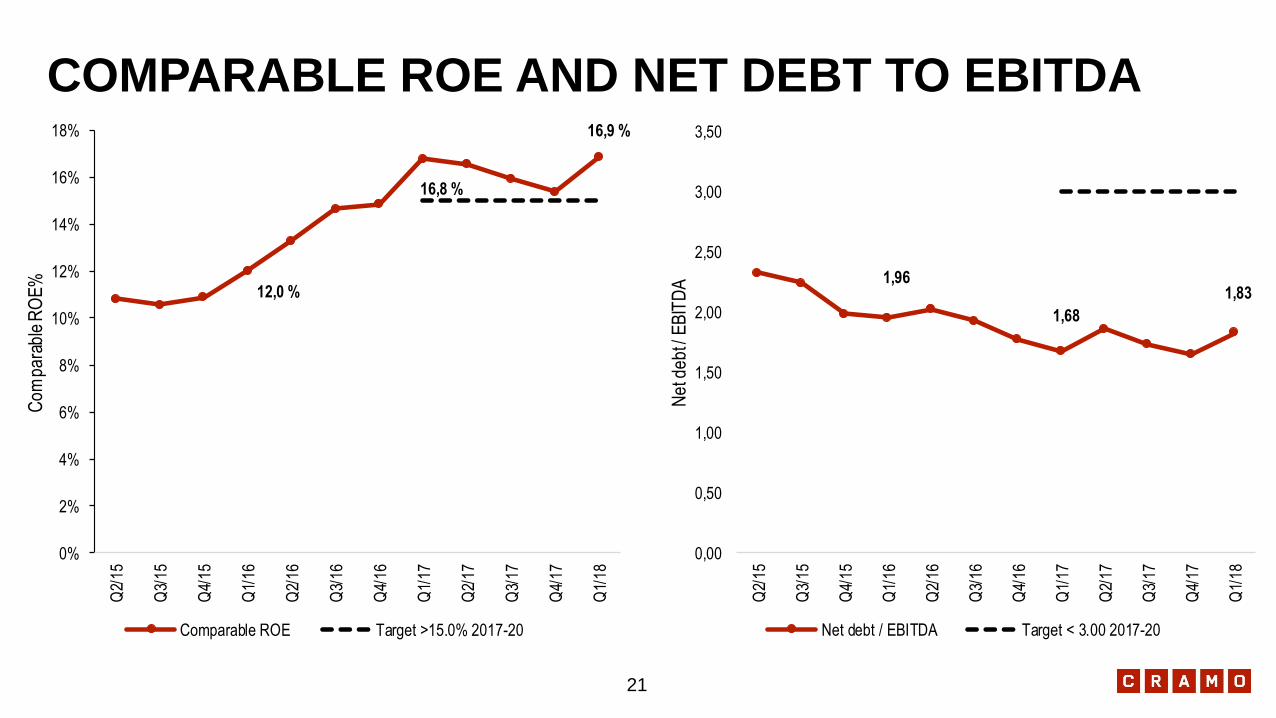
COMPARABLE ROE AND NET DEBT TO EBITDA
12,0 %
16,8 %
16,9 %
0%
2%
4%
6%
8%
10%
12%
14%
16%
18%Q
2/15
Q3/
15
Q4/
15
Q1/
16
Q2/
16
Q3/
16
Q4/
16
Q1/
17
Q2/
17
Q3/
17
Q4/
17
Q1/
18
Co
mp
ara
ble
RO
E%
Comparable ROE Target >15.0% 2017-20
1,96
1,68
1,83
0,00
0,50
1,00
1,50
2,00
2,50
3,00
3,50
Q2/
15
Q3/
15
Q4/
15
Q1/
16
Q2/
16
Q3/
16
Q4/
16
Q1/
17
Q2/
17
Q3/
17
Q4/
17
Q1/
18
Ne
t de
bt /
EB
ITD
A
Net debt / EBITDA Target < 3.00 2017-20
21

CONCLUSION
AND OUTLOOK
2018
22
CONCLUSION & OUTLOOK 2018
SHAPE
AND
SHARE
Q1 2018• Organic sales growth 10.4% against last year
supported by both business divisions
• EBITA growth 17.3% against last year supported by
both business divisions
• Perfomance improvement actions in Modular Space
bearing fruit as EBITA grew 35% against last year
• KBS Infra acquisition consolidated since March
Outlook• Rental market is expected to grow also in 2018, but
at a slower pace than in 2017
• In Modular Space division positive effects of the
organisational restructuring and improved project
management are expected to follow in 2018
• We constantly monitor our investment levels in order
to adapt to changes in demand
23


![stream.kkr.mlit.go.jp[131] [1381 [138] [13.8] [lag] [18.7] Iga] [11 n 159] 029 009 [19.6] [195] [ [158] [16.1] [16.3] [162] [16.6] a. 49 [162 t1à,91 [13 [la 3] [13](https://img.pdfslide.net/doc/110x75/5e6d7c3cbb75887523501471/131-1381-138-138-lag-187-iga-11-n-159-029-009-196-195-158.jpg)