Embed Size (px)
DESCRIPTION
Â
Citation preview

1st
quarter 2008 Conference Call
May, 15

11Q ’08 Conference Call May, 15 2008
Disclaimer
Save where otherwise indicated, the Company is the source of the
content of this Presentation. Care has been taken to ensure that the facts stated in this Presentation are accurate, and that the opinions expressed are fair and reasonable. However, no representation or warranty, express or implied, is made or given by or on behalf of the Company, or the management or employees of Company as to the accuracy, completeness or fairness of the information or opinions contained in this Presentation. None of the Company, shall have any liability whatsoever (in negligence or otherwise) for any loss whatsoever arising from any use of this Presentation or
its contents or otherwise arising in connection therewith.This Presentation is not intended for potential investors and does not constitute or form part of, and should not be construed as, any offer for sale or subscription of, or solicitation of any offer to purchase or subscribe for, any securities of the Company, nor should it or any part of it or the fact of its distribution form the basis of, or be relied on in connection with, any contract or commitment whatsoever. This Presentation does not constitute a recommendation regarding the securities of the Company. This Presentation contains various forward-looking statements that reflect the Company’s management’s current views with respect to future events and financial and operational performance. The words “believe”, “expect”, “anticipate”, “intend”, “may”, “plan”, “estimate”, “should”, “could”, “aim”, “target”, “might”, or, in each case, their negative, or similar expressions identify certain of these forward-looking statements. Others can be identified from the context in
which the statements are made. These forward-looking statements involve known and unknown risks, uncertainties and other factors, which are in some cases beyond the Company’s control and may cause actual results or performance to differ materially from those expressed or implied from such forward-looking statements. These risks include, but are not limited to, the Company’s ability to, operate profitably, maintain its competitive position, the Company’s ability to promote and improve its reputation and the awareness of the brands in its portfolio, the Company’s ability to operate its growth strategy successfully, the impact of changes in pricing policies, political and regulatory developments in the markets in which the Company operates, and other risks.

21Q ’08 Conference Call May, 15 2008
Q1 Results: income statementmillions € Q1 2008 Q1 2007 Δ
as reportedNet Revenues 56.6 49.9 +13.5%Gross profit 36.6 32.0 +14.4%Margin 64.6% 64.1%
G&A (6.4) (5.4)R&D (3.1) (2.6)S&M (11.3) (10.4)
Other operating Income/(Expenses) (0.2) (1.7)Ebit 15.7 11.9 +31.5%Margin 27.7% 23.9%Ebit ex exceptional items* 15.7 13.3 +17.8%Margin 27.7% 26.7%
Net Financial expense 0.6 (0.8)Tax (6.1) (4.4)
Net Result 10.1 6.8 +49.9%Ebitda 19.2 15.4 +24.6%Margin 33.9% 30.9%Ebitda ex exceptional items* 19.2 16.8 +14.3%Margin 33.9% 33.7%
* In Q107 € 1.4MM of not recurring expenditure due to IPO process

31Q ’08 Conference Call May, 15 2008
Solid revenues growthRevenues increase by 13.5% despite of exchange rate effects (+17.8%
at comparable fx), improving growth rate from 2007 quarter results, thanks to:
●
Steady enlargement of Liaison installed base, grown from around 2070 (31/12/07) to around 2160 (31/03/08)
●
Leverage of the Liaison installed base
●
Enriched specialty assay portfolio offer: since 2006 until end of 2007 13 new assays received CE mark, out of which 10 specialties, and 7 new assays received FDA approval, all specialties.
●
US and EU drove sales growth

41Q ’08 Conference Call May, 15 2008
Revenues break down: by technology
RIA10.2%
ELISA21.8%
CLIA56.6%
Instruments 11.4%
Q1 07 Q1 08
CLIA sales still trigger revenues growth
CLIA sales keep growing at higher rate than other technologies+34.2% Q1 08 vs. Q1 07
Revenues mix by technology improved towards CLIA kits, from 47.9% in Q1 07 to 56.6% in Q1 08 of total sales
RIA12.4%
ELISA30.0%
CLIA47.9%
Instruments 9.7%

51Q ’08 Conference Call May, 15 2008
Revenues break down: by geography
●
In Europe, increased market share in consolidated as well as in developing markets:Italy +17.6% Q1 08 vs. Q1 07Belgium +17.1% Q1 08 vs. Q1 07UK +21.7% Q1 08 vs. Q1 07Nordic +75.2% Q1 08 vs. Q1 07Russia (distributor) 0,5 MM €
in Q1 08, any sales in Q1 07
●
In North America, accelerating growth although affected by exchange rate trend:+ 23.2% Q1 08 vs. Q1 07 as reported+ 40.7% Q1 08 vs. Q1 07 at comparable foreign exchange rate
●
In Rest of the World, positive trends in recent initiatives and distributors’
markets (Australia) offset by delay in Brazilian tender and Q4 07 bulk deliveries to China
millions € 1st Quarter
2008 2007 Δ%
Europe 34.6 30.2 14.3%
North America 12.7 10.3 23.2%
Rest of the World 9.4 9.3 0.4%
Total 56.6 49.9 13.5%

61Q ’08 Conference Call May, 15 2008
Continuous improvement in profitability
Profitability continuously improved:
Gross Margins +14.4% Q1 08 vs. Q1 07
from 64.1% to 64.6% of tot sales
EBITDA +24.6% Q1 08 vs. Q1 07
from 30.9% to 33.9% of tot salesEBIT +31.5% Q1 08 vs. Q1 07
from 23.9% to 27.7% of tot sales
EBITDA restated +14.3% Q1 08 vs. Q1 07
from 33.7% to 33.9% of tot salesEBIT restated +17.8% Q1 08 vs. Q1 07
from 26.7% to 27.7% of tot sales
Thanks to:●
Improved technology mix: CLIA revenues represents 56.6% in Q1 08
vs. 47.9% in Q1 07; the positive effect is mitigated by higher weight of instrument sales with lower margin during Q1 08 and higher royalties (retroactive)
●
Lower incidence of instrument depreciation on total sales
71Q ’08 Conference Call May, 15 2008
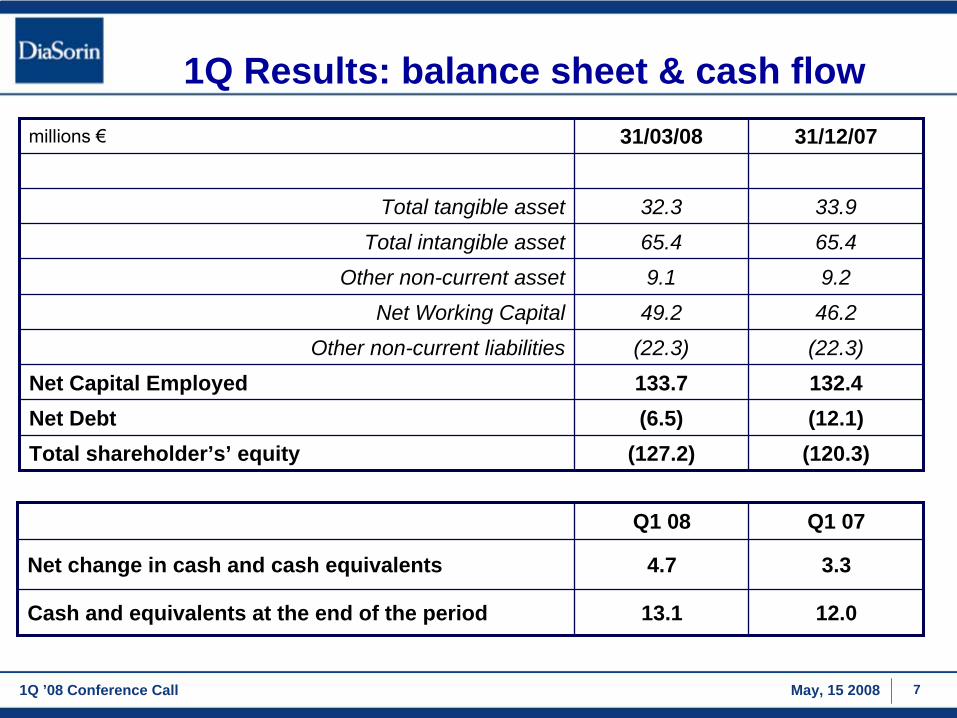
1Q Results: balance sheet & cash flow
Q1 08 Q1 07
Net change in cash and cash equivalents 4.7 3.3
Cash and equivalents at the end of the period 13.1 12.0
millions € 31/03/08 31/12/07
Total tangible asset 32.3 33.9
Total intangible asset 65.4 65.4
Other non-current asset 9.1 9.2Net Working Capital 49.2 46.2
Other non-current liabilities (22.3) (22.3)
Net Capital Employed 133.7 132.4Net Debt (6.5) (12.1)Total shareholder’s’ equity (127.2) (120.3)

81Q ’08 Conference Call May, 15 2008
Healthy financial structure
●
Operating cash flow € 8.2 MM in Q1 08 vs. € 7.5 MM in Q1 07
●
Net debt of € 6.5 MM in Q1 08 vs. € 12.1 MM at the end of 2007
●
Cash and equivalents at the end of the period amount to € 13.1 MM.

91Q ’08 Conference Call May, 15 2008
Forthcoming events
June 5 – 6 EUROPEAN MID CAP FORUM
New York
August 8th 2008 Half Year report
September 3 – 4Goldman Sachs 5th Annual European Medtech and Healthcare Services
ConferenceLondra