Embed Size (px)
Citation preview

Q1’17 EARNINGS DECKMay 3, 2017

Safe Harbor StatementThis presentation contains forward-looking statements, within the meaning of the Private Securities Litigation Reform Act of 1995, that involve risks and uncertainties, including
statements regarding our financial outlook for the second quarter 2017 and the full year of 2017, our ability to increase engagement among our community of users through
software applications, reductions in channel inventory, trends in sell-in versus sell through revenue, expected trends in operating margins and free cash flow, our investments in
lease hold improvements, lab and testing equipment and tooling, our anticipated tax liability, our investments in research and development, sales and marketing, and general
and administrative and the impact of those investments. These forward-looking statements are only predictions and may differ materially from actual results due to a variety of
factors including: the effects of the highly competitive market in which we operate, including competition from much larger technology companies; our ability to anticipate and
satisfy consumer preferences in a timely manner, our ability to successfully develop and timely introduce new products and services or enhance existing products and services;
any inability to accurately forecast consumer demand and adequately manage our inventory; our ability to ship products on the timelines we anticipate and unexpected delays;
quarterly and seasonal fluctuations; our reliance on third-party suppliers, contract manufacturers, and logistics providers, and our limited control over such parties; delays in
procuring components and product from these third parties; product liability issues, security breaches or other defects, which may adversely affect product performance, our
reputation and brand awareness and overall market acceptance of our products and services; warranty claims; the fact that the market for connected health and fitness devices
is relatively new and unproven; the ability of our channel partners to sell our products; litigation and related costs; privacy; other general market, political, economic and
business conditions.
Additional risks and uncertainties that could affect our financial results are included under the caption “Risk Factors” in our Annual Report on Form 10-K for the full year ended
December 31, 2016, which are available on our Investor Relations website at investor.fitbit.com and on the SEC website at www.sec.gov. All forward-looking statements
contained herein are based on information available to us as of the date hereof and we do not assume any obligation to update these statements as a result of new information
or future events. We may not actually achieve the plans, intentions, or expectations disclosed in our forward-looking statements and you should not place undue reliance on our
forward-looking statements. Our forward-looking statements do not reflect the potential impact of any future acquisitions, mergers, dispositions, joint ventures, or investments
we may make.
This presentation also includes certain financial measures that are not calculated in accordance with U.S. generally accepted accounting principles, or GAAP. These non-GAAP
financial measures are in addition to, and not as a substitute for or superior to measures of financial performance prepared in accordance with GAAP. There are a number of
limitations related to the use of these non-GAAP financial measures versus their nearest GAAP equivalents. For example, other companies may calculate non-GAAP financial
measures differently or may use other measures to evaluate their performance, all of which could reduce the usefulness of our non-GAAP financial measures as tools for
comparison. We have provided a reconciliation of those measures to the most directly comparable GAAP measures, which is available in the appendix.
Trademarks: Fitbit and the Fitbit logo are trademarks or registered trademarks of Fitbit, Inc. in the United States and other countries. Additional Fitbit trademarks can be found at
www.fitbit.com/legal/trademark-list. Third-party trademarks are the property of their respective owners.
2

©2017 Fitbit, Inc. All rights reserved. Proprietary & Confidential.
Fitbit helps people lead
healthier, more active lives by
empowering them with data,
inspiration, and guidance to
reach their goals.
3

Q1 2017 Highlights
• 3.0 million devices sold, leader in wearable devices and connected heath with the #1 selling connected health and fitness device, Charge 2.
• Launched new product Fitbit Alta HR, the world’s slimmest continuous heart rate wristband with a customizable form factor and an approximate 25% improvement in battery life to 7 days.
• Launched new Community section in the Fitbit app organized around Friends, Groups, and a social feed and designed to increase engagement of our community of users.
• Revenue of $299 million, generated $21 million in non-GAAP free cash flow, non–GAAP EPS of ($0.15) per share.
• $726 million in cash, cash equivalents, and marketable securities on the balance sheet as of the quarter end.
4

Growing User Community & Brand Relevancy
• Leader in connected health and fitness with 63.5
million devices sold since inception.
• Fitbit devices secured the highest average score on
the recent Springbuk Enterprise analytic study.
• Fitbit Blaze ranked the highest of the 21 devices
reviewed for use in Corporate Wellness.
• More than 5.2 million users have utilized the feed
section of the Fitbit app generating ~345 million
views since March launch and greater than 1
million users have joined a Group.
60
0
10
20
30
40
50
60
70
Q1 Q2 Q3 Q4 Q1 Q2 Q3 Q4 Q1 Q2 Q3 Q4 Q1
Total Devices Sold
(Units in millions)
63.5
2014 2015 2016 2017
5

$505.4
$298.9
Q1 2016 Q1 2017
Revenue
- 41%
(Units in millions)
• Devices sold declined (39%) y/y:
- Underlying consumer demand better than
reported results.
- Worked down North America channel inventory
30% q/q.
• Average selling price declined 4% y/y to $96.45.
• Accessory and other sales added an additional
$4.70 in revenue per device.
• New products introduced over the past 12 months
represented 84% of the revenue.
• Repeat consumers represented 36% of activations
in the quarter, with 40% of these repeat purchases
coming from reactivations.
6

Non-GAAP Gross Margin and Operating Expenses
46.6%
40.0%
Q1 2016 Q1 2017
Non-GAAP Gross Margin
• Down 660 basis points y/y; favorably impacted by new
product introductions and Fitbit.com growth, but offset by
product mix, greater promotions/seller allowances, and
excess component materials & manufacturing capacity.
$198.4
$181.6
Q1 2016 Q1 2017
Non-GAAP OpEx
-8%
($ in millions)
• Exhibiting expense discipline, on-track to achieve full
year $850m operating expense target.
• Including restructuring activity, headcount declined by
120 since year-end to 1631 people. 7

Non-GAAP Operating Expenses Detail
$104.5
$85.9
0
25
50
75
100
125
Q1 2016 Q1 2017
S&M
$61.9$70.7
$0
$25
$50
$75
$100
$125
Q1 2016 Q1 2017
R&D
$32.1$25.1
0
25
50
75
100
125
Q1 2016 Q1 2017
G&A
• Up y/y driven by headcount.
• Investing to drive innovation.
+14%
• Optimizing S&M spend, rolled out 1
product vs. 2 products last year.
• Benefit from expense timing,
shifted to Q2.
• Up marginally excluding Jawbone
expenses which were included in
Q1 ’16 ($9.1m). Jawbone
expense down significantly Q1’17,
net of insurance settlement, credit
of $.1m.
($ in millions)
-22%
-18%
8
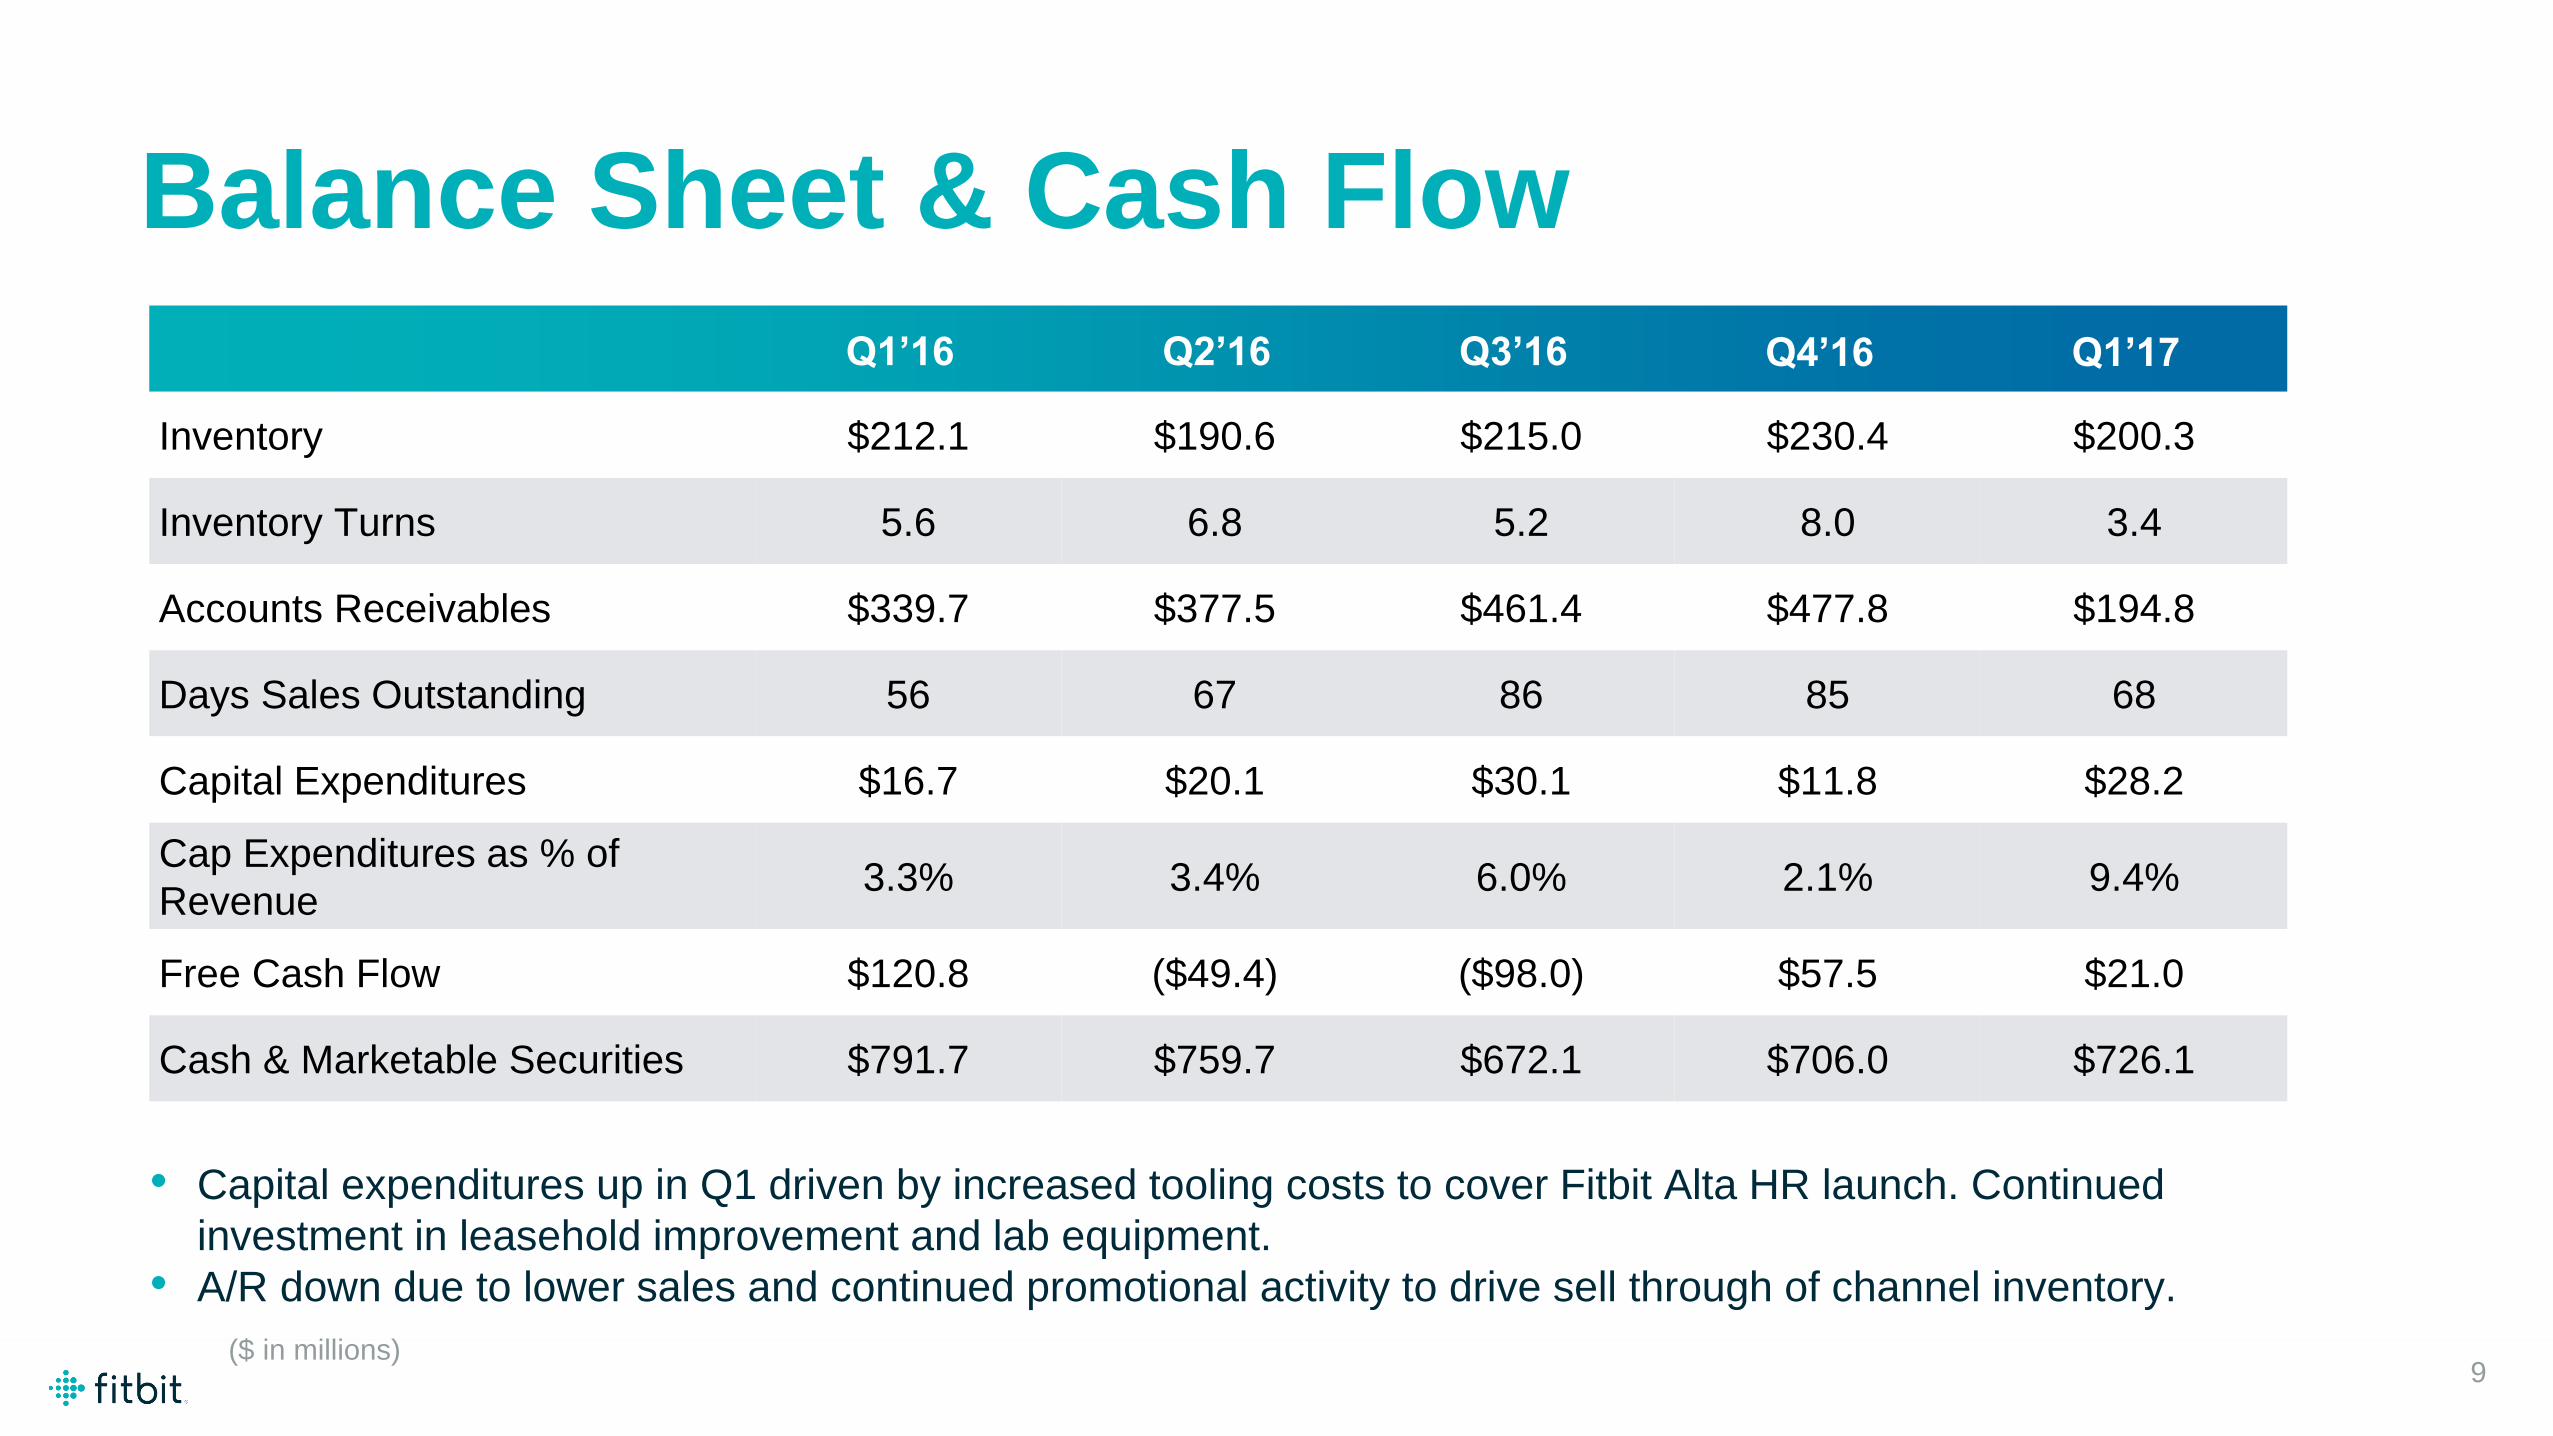
Balance Sheet & Cash Flow
Inventory $212.1 $190.6 $215.0 $230.4 $200.3
Inventory Turns 5.6 6.8 5.2 8.0 3.4
Accounts Receivables $339.7 $377.5 $461.4 $477.8 $194.8
Days Sales Outstanding 56 67 86 85 68
Capital Expenditures $16.7 $20.1 $30.1 $11.8 $28.2
Cap Expenditures as % of
Revenue3.3% 3.4% 6.0% 2.1% 9.4%
Free Cash Flow $120.8 ($49.4) ($98.0) $57.5 $21.0
Cash & Marketable Securities $791.7 $759.7 $672.1 $706.0 $726.1
• Capital expenditures up in Q1 driven by increased tooling costs to cover Fitbit Alta HR launch. Continued
investment in leasehold improvement and lab equipment.
• A/R down due to lower sales and continued promotional activity to drive sell through of channel inventory.
Q1’16 Q2’16 Q3’16 Q4’16 Q1’17
($ in millions)9

($ in millions, except percentages and per share amounts)
Low High
2Q’17 Guidance
Revenue $330 $350
y/y decline (44%) (40%)
Non-GAAP EPS ($0.17) ($0.14)
Non-GAAP tax rate ~43%
Stock-based compensation $24 $26
Non-GAAP share count ~228
Guidance Context:
• Continued disconnect between sell-in revenue and sell-
through sales as we work to reduce channel inventory.
• Traditionally media spend correlated with new product roll-
outs. Some media spend shifted to Q2, when Alta HR
became fully available at retail.
Low High
10

FY ’17 Guidance
($ in millions, except percentages and per share amounts)
FY’17 Guidance
Revenue $1,500 $1,700
y/y decline (31%) (22%)
Non-GAAP gross margin 42.5% 44%
Non-GAAP free cash flow ($100) ($50)
Non-GAAP EPS ($0.44) ($0.22)
Non-GAAP tax rate ~43%
Stock-based compensation $100 $110
Non-GAAP share count ~228
Guidance Context:• Continued reduction in channel inventory
• Expect op. margins trough in H1. Expect free cash flow to
trend towards lower end due to increased working capital
needs.
• Continued investment in lease hold improvements, lab &
testing equipment, tooling
• Tax rate declined from prior guidance of ~50% to ~43%
because geographic mix of income, lower loss in the U.S.
and less R&D credit.
Low High
11

GAAP to Non-GAAP Reconciliation(In thousands, except percentages and per share amounts)
GAAP gross profit
12

GAAP to Non-GAAP Reconciliation(In thousands, except percentages and per share amounts)
13

GAAP to Non-GAAP Reconciliation(In thousands, except percentages and per share amounts)
14

GAAP to Non-GAAP Reconciliation(In thousands, except percentages and per share amounts)
15

GAAP to Non-GAAP Reconciliation(In thousands, except percentages and per share amounts)
16

GAAP to Non-GAAP Reconciliation(In thousands, except percentages and per share amounts)
17

GAAP to Non-GAAP Reconciliation(In thousands, except percentages and per share amounts)
18

GAAP to Non-GAAP Reconciliation(In thousands, except percentages and per share amounts)
To supplement our consolidated financial statements, which are prepared and presented in accordance with GAAP, we use the following non-GAAP
financial measures in this presentation: non-GAAP gross profit, non-GAAP gross margin; non-GAAP operating expenses, non-GAAP operating income
(loss); non-GAAP net income (loss), non-GAAP diluted net income or loss per share, adjusted EBITDA, revenue on a constant currency basis, and non-
GAAP free cash flow. The presentation of these financial measures is not intended to be considered in isolation or as a substitute for, or superior to,
financial information prepared and presented in accordance with GAAP.
We use non-GAAP measures to internally evaluate and analyze financial results. We believe these non-GAAP financial measures provide investors with
useful supplemental information about the financial performance of our business, enable comparison of financial results between periods where certain
items may vary independent of business performance, and enable comparison of our financial results with other public companies, many of which present
similar non-GAAP financial measures.
There are limitations associated with the use of non-GAAP financial measures as an analytical tool. In particular, many of the adjustments to our GAAP
financial measures reflect the exclusion of items, specifically stock-based compensation expense, amortization of intangible assets, and the related
income tax effects of the aforementioned exclusions, that are recurring and will be reflected in our financial results for the foreseeable future. In addition,
these measures may be different from non-GAAP financial measures used by other companies, limiting their usefulness for comparison purposes. A
reconciliation of our non-GAAP financial measures to their most directly comparable GAAP measures has been provided in the financial statement tables
included in this presentation, and investors are encouraged to review the reconciliation.
Guidance for non-GAAP financial measures excludes Jawbone litigation costs, stock-based compensation, amortization of acquired intangible assets, and
tax effects associated with these items. We have not reconciled guidance for non-GAAP financial measures to their most directly comparable GAAP
measures because certain items that impact these measures are uncertain, out of our control and/or cannot be reasonably predicted. Accordingly, a
reconciliation of the non-GAAP financial measure guidance to the corresponding GAAP measures is not available without unreasonable effort.
19

GAAP to Non-GAAP Reconciliation(In thousands, except percentages and per share amounts)
The following are explanations of the adjustments that are reflected in one or more of our non-GAAP financial measures:
• Stock-based compensation expense relates to equity awards granted primarily to our employees. We exclude stock-based
compensation expense because we believe that the non-GAAP financial measures excluding this item provide meaningful
supplemental information regarding operational performance. In particular, companies calculate stock-based compensation
expense using a variety of valuation methodologies and subjective assumptions.
• In January 2017, the Company conducted a reorganization of its business, including a reduction in workforce. The restructuring
costs impacted our results for the first quarter of 2017. Restructuring costs primarily included severance-related costs. We
believe that excluding the is expenses provides great visibility to the underlying performance of our business operations,
facilitates comparison of our results with other periods, and may also facilitate comparison with the results of other companies in
our industry.
• Litigation expense relates to legal costs incurred due to litigation with Aliphcom, Inc. d/b/a Jawbone. We exclude these
expenses because we do not believe these expenses have a direct correlation to the operations of our business and because of
the singular nature of the claims underlying the Jawbone litigation matters. We began excluding Jawbone litigation costs in the
second quarter of 2016 as these costs significantly in 2016, and may continue to be material for the remainder of 2017.
Although not excluded in reporting for the first quarter of 2016, these litigation expenses were $9.1 million in that quarter.
20

GAAP to Non-GAAP Reconciliation(In thousands, except percentages and per share amounts)
The following are explanations of the adjustments that are reflected in one or more of our non-GAAP financial
measures:
• In March 2014, we recalled the Fitbit Force after some of our users experienced allergic reactions to adhesives in
the wristband. This recall primarily impacted our results for the fourth quarter of 2013, the first quarter of 2014 and
the fourth quarter of 2015.
• Amortization of intangible assets relates to our acquisitions of FitStar, Pebble and Vector. We exclude these
amortization expenses because we do not believe these expenses have a direct correlation to the operation of our
business.
• Income tax effect of non-GAAP adjustments relates to the tax effect of the adjustments that we incorporate into
non-GAAP financial measures in order to provide a more meaningful measure of non-GAAP net income.
• Purchase of property and equipment is deducted from net cash provided by (used in) operating activities to arrive
at non-GAAP free cash flow, which reflects the amount of cash generated that is available to be used for
investments in the business.
• We translated revenue from non-US dollar based transactions for the three months ended April 1, 2017 using the
exchange rates that were effective in the comparable prior year period to calculate revenue to exclude the effect
of changes in foreign exchange rates.
21

THANK YOU