Embed Size (px)
Citation preview
Office Market ReportWest Michigan Q1 2015
100 Grandville Ave SW Suite 100Grand Rapids, MI 49503616. 776. 0100 www.naiwwm.com
Wisinski ofWest Michigan
Office • Industrial • Retail • Multi-Family

Downtown Grand Rapids is booming - With growth comes housing and office demand.During the first quarter of 2015 the office market continued to show signs of improvement. Overall, the office market ended the first quarter with a vacancy rate of 9.4%, which is lower than the previous four quarters. Rental rates continue to increase as well. Landlords are giving less in rate reductions and free rent. Tenants are signing longer term leases which is allowing landlords to give more in tenant improvements.
The area of highest demand continues to be the downtown office market. With several landlords renovating buildings and investing in common area amenities, we are seeing more and more tenants desiring to locate in the Central Business District, as well as the outskirts of downtown. One appeal to locating in the CBD is to retain and attract new talent. All of this is leading to an increase in rental rates, which with the added cost of parking, is not deterring tenants from locating in the CBD.
The suburban, especially the SE submarket, will be seeing some new construction with the expansion of Heritage Pointe. The demand is still strong for office within this corridor, however there appears to be a lack of supply for Class A office space. Rental rates have remained flat, but should start to increase if new buildings are added.
* The information contained herein has been given to us by sources we deem reliable. We have no reason to doubt its accuracy, however, we do not make any guarantees. All information should be verified before relying thereon.
* Source: NAIWisinskiofWestMI, CoStar Property®, & U.S. Bureau of Labor Statistics
“We are starting to see some new construction in the office market. With Arena Place downtown and with the expansion of Heritage Pointe in the SE submarket, NAI Wisinski anticipates seeing continued demand for office space in both the suburban and downtown markets throughout 2015.”
GRAND RAPIDS, MI
The Market
- Mary-Anne Wisinski-Rosely, CCIM,SIOR Principal | NAI Member

Total Employment GrowthHighlight Total Number of Jobs Added per Year
Office Square Footage per Employee By Industry- Based Upon All Tenants
Net Absorption for the overall West MI office market was 201,062
The unemplopyment rate in Grand Rapids is down 2.2% from March 2014
Recent Lease Transactions, January - March 2015Address Size (SF) Tenant Lease Type 1000 East Paris Ave, Suite 246 2,415 The Men’s Clinic New99 Monroe, Suite 400 18,118 KPMG New678 Front Ave. NW 8,200 Western Land Services New3300 Eagle Run 5,830 WMM, PLLC New601 5th St. NW 13,087 Mindscape New
Recent Sales Transactions, January - March 2015Address Size (SF) Final Sale Price Price PSF Sale Date5378 Plainfield Ave NE 5,039 $540,000 $107.16 3/20/20153275 Walker Ave 6,766 $675,000 $99.76 3/18/20152886 3 Mile Rd NW 8,538 S $325,000 $38.06 2/2/20151310 East Beltline 31,776 $1,900,000 $59.79 3/6/20152849 Michigan St. NE 8,340 $890,000 $106.71 1/27/2015
Economic TrendsOffice vacancy rate in West MI decreased to 9.4% from 9.7% in theprevious quarter
0 50 100 150 200 250 300 350 400
Law Firms
Agri-Mining/Utl
Retailers/Wholes
Services
Transportation
Communications
Business-Service
Engineers/Archit
Government
Accountants
Manufacturing
Finance/Insure
Medical

West MichiganOffice Submarket StatisticsMethodology: The office market report includes office buildings within each of the defined submarkets. Excluded are government buildings and institutional properties.
Office Space Statistical Changes Year-over-Year and Quarter-over-Quarter
CONSTRUCTION
CONSTRUCTION
ASKING RATES
ASKING RATES
VACANCY RATE
VACANCY RATE
NET ABSORPTION
NET ABSORPTION
4Q14 vs. 1Q15
1Q14 vs. 1Q15
Q1 Snapshot Submarket Total RBA Total
Available SFVacancy
RateTotal AverageRate ($/SF/Yr)
Total Net Absorption (SF)
Total Under Construction SF
DowntownClass A 1,366,022 80,204 5.9% $20.37/SF - 188,562Class B & C 8,055,957 812,354 10.1% $14.32/SF -9,178 -Total 942,1979 892,558 9.4% $17.34/SF -9,178 188,562NortheastClass A 294,197 33,605 9.6% $16.13/fs - -Class B & C 3,129,084 247,706 7.7% $12.91/fs 20,369 -Total 3,423,281 281,311 8.2% $14.52/fs 20,369 -NorthwestClass B & C 2,161,818 204,310 9.5% $10.71/fs 9,742 -SoutheastClass A 1,065,736 80,021 7.5% $18.63/fs 14,017 4,000Class B & C 9,686,731 1,275,844 13.1% $9.71/fs 33,094 -Total 10,752,467 1,355,865 12.6% $14.17/fs 47,111 -SouthwestClass B & C 2,892,784 309,468 10.7% $9.66/fs 13,137 -

Kent County StatisticsTotal Market Report
0.00%
5.00%
10.00%
15.00%
2013Q1 2013Q2 2013Q3 2013Q4 2014Q1 2014Q2 2014Q3 2014Q4 2015Q1
Vacancy Rate s
Vacancy Rates Class A Vacancy Rates Class BC
-50,00 0
0
50,000
100,00 0
150,00 0
2013Q1 2013Q2 2013Q3 2013Q4 2014Q1 2014Q2 2014Q3 2014Q4 2015Q1
Absorp on & Delivery
Total Net Absorp on Class A Total Net Absorp on Class BC RBA Delivered Class A RBA Delivered Class BC
$1.00
$5.00
$25.00
2013Q1 2013Q2 2013Q3 2013Q4 2014Q1 2014Q2 2014Q3 2014Q4 2015Q1
Total Rental Rates
Rental Rates Class A Rental Rates Class BC
0
50000
100000
150000
200000
2013Q1 2013Q2 2013Q3 2013Q4 2014Q1 2014Q2 2014Q32 014Q4 2015Q1
Class B & C
Class B & C Class B & C
Class B & C
Total Rental Rate
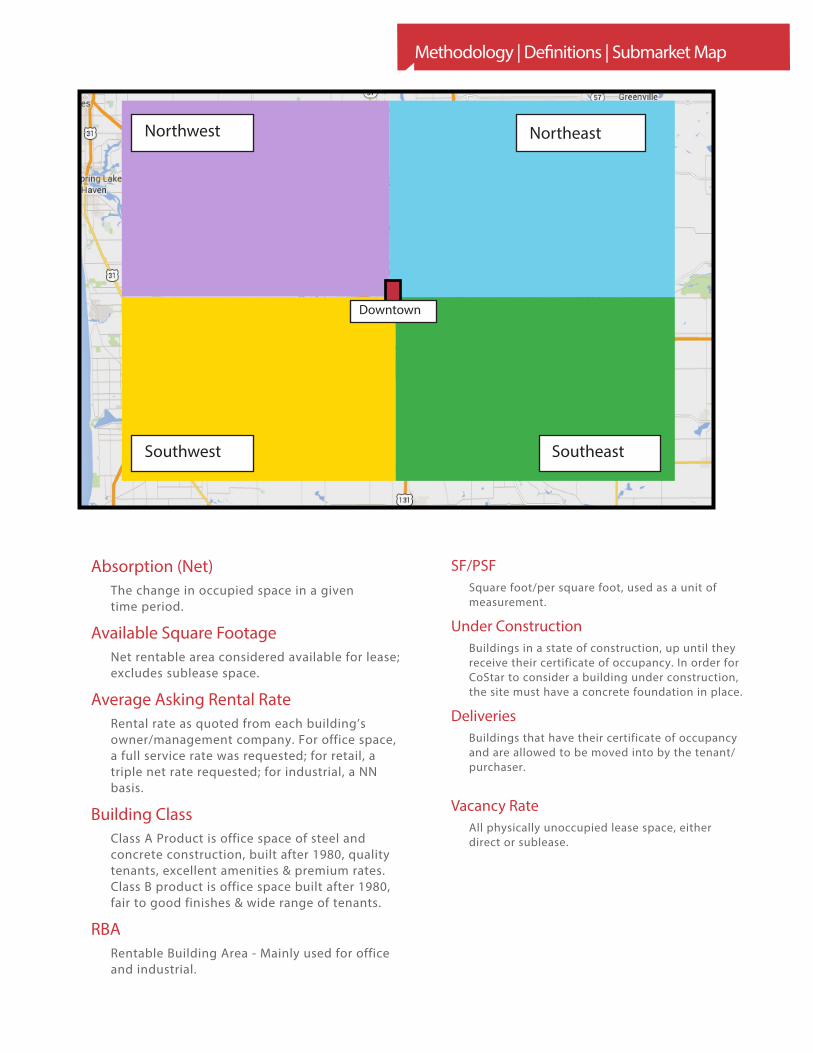
Methodology | Definitions | Submarket Map
SF/PSFSquare foot/per square foot, used as a unit of measurement.
Under ConstructionBuildings in a state of construction, up until they receive their certificate of occupancy. In order for CoStar to consider a building under construction, the site must have a concrete foundation in place.
DeliveriesBuildings that have their certificate of occupancy and are allowed to be moved into by the tenant/purchaser.
Vacancy RateAll physically unoccupied lease space, either direct or sublease.
Absorption (Net)The change in occupied space in a given time period.
Available Square FootageNet rentable area considered available for lease; excludes sublease space.
Average Asking Rental RateRental rate as quoted from each building’s owner/management company. For office space, a full service rate was requested; for retail, a triple net rate requested; for industrial, a NN basis.
Building ClassClass A Product is office space of steel and concrete construction, built after 1980, quality tenants, excellent amenities & premium rates. Class B product is office space built after 1980, fair to good finishes & wide range of tenants.
RBARentable Building Area - Mainly used for office and industrial.
NortheastNorthwest
SoutheastSouthwest
Downtown

In the spring of 2011, two successful and reputable companies, The Wisinski Group and NAI West Michigan merged. The merger represents collaboration, rich traditions, innovative technologies, unique cultures and diversity of skills and specialties which ultimately benefit our clients. We’re going back to our fundamentals, strengthening our core and becoming stronger in the services we provide our clients. Our focus is simple - building client relationships for life by offering market appropriate advice and then executing. Our success is a direct result of its unwavering commitment to providing the best possible service to each and every client. Our Brokers, with their 562 plus years of combined experience (20.1 years average), possess the knowledge and expertise to manage the most complex transactions in industrial, office, retail and Multi-Family specialities throughout West Michigan.
Achieve More.
Doug TaatjesCCIM, SIOR616 292 [email protected]
Marc TourangeauMBA269 207 [email protected]
Jeremy Veenstra616 242 [email protected]
Kara Schroer269 459 [email protected]
Mary Anne Wisinski-RoselyCCIM, SIOR616 575 [email protected]
Stanley J. Wisinski, IIICCIM, SIOR616 575 [email protected]
Russ Bono616 242 [email protected]
Meet Our Team
Office SpecialistsRod Alderink616 242 [email protected]
Jason Makowski616 575 [email protected]
Hillary Taatjes Woznick616 242 [email protected]
Local Knowledge. Global Reach.
Through our affiliation with NAI Global, we can also assist you with your commercial real estate needs throughout the US & globally right here from West Michigan.

100 Grandville Ave SW Suite 100Grand Rapids, MI 49503616. 776. 0100 www.naiwwm.com
facebook.com/naiwwm
@naiwwm
nai-wisinski-of-west-michigan
Wisinski ofWest Michigan
Office • Industrial • Retail • Multi-Family


