Embed Size (px)
Citation preview
Mindtree Limited (NSE: MINDTREE, BSE: 532819)
Earnings release
Third quarter ended December 31, 2016
January 19, 2017
© Mindtree 2016 Page 2 of 13
Contents
1. Press Release 3
2. Key Financial Metrics 6
3. Key Ratios 6
4. Key Revenue Metrics 7
5. Effort and Utilization 8
6. Key Client Metrics 8
7. Key Employee Metrics 9
8. Infrastructure 9
9. Statutory Financials 10
Earnings Conference Call for Analysts / Investors
January 19, 2017 (5:30 PM IST)
Primary Number: +91 22 3938 1087
(The number listed above is universally accessible from all networks and all countries)
Local Access Number: 3940 3977 Available in - Ahmedabad, Bangalore, Chandigarh, Chennai, Gurgaon (NCR), Hyderabad, Kochi/Cochin, Kolkata, Lucknow, Pune Accessible from all carriers.
Toll free numbers:
Singapore: 800 101 2045
Hong Kong: 800 964 448
UK: 0 808 101 1573
US: 1 866 746 2133
Replay of conference call available until January 31, 2017
+91 22 3065 2322 (Playback id: 230712#)
Webcast – Participants have the option to attend the conference call by logging in to the online webcast, please note participants in webcast would be in listen-only mode. The webcast link is as below.
Mindtree Q3 FY17 Webcast Link
Diamond Pass - Link
DiamondPass™ is a Premium Service that enables you to connect to your conference call without having to wait for an operator. If you have a DiamondPass™ click the above link to associate your pin and receive the access details for this conference, if you do not have a DiamondPass™ please register through the link and you will receive your DiamondPass™ for this conference.
Transcript will be available on www.mindtree.com after January 31, 2017
© Mindtree 2016 Page 3 of 13
Mindtree reports constant currency revenue growth of 0.4% q-o-q in dollar terms; Earns first $100 million client
Bangalore (India) and Warren (NJ), January 19, 2017: Mindtree, a global technology services company,
announced its consolidated results today for the third quarter ended December 31, 2016, as approved by its
Board of Directors.
Key financial highlights:
Quarter ended December 31, 2016
In USD terms:
o Revenue at $192.2 million (decline of 0.4% q-o-q* / growth of 4.7% y-o-y)
o Net profit at $15.3 million (growth of 8.1% q-o-q / decline of 28.3% y-o-y)
*constant currency growth of 0.4%
In Rupee terms:
o Revenue at ₹ 12,953 million (decline of 0.01% q-o-q / growth of 7.1% y-o-y)
o Net profit at ₹ 1,031 million (growth of of 8.8% q-o-q / decline of 26.7% y-o-y)
Other highlights:
Clients:
o 348 active clients as of December 31, 2016
o First client added to $100 million category
o $10+ million clients grew by 1 to 17
People:
o 16,099 Mindtree Minds as of December 31, 2016
o Trailing 12 months attrition is 16.1%
“Strong deal closures in this quarter are testimony to our expertise-led transformation
capabilities. We continue to be seen as a primary partner for both the “run the business” and
“change the business” technology initiatives of our clients.” said Rostow Ravanan, CEO &
Managing Director, Mindtree. “We are confident that these competencies and our distinctive
culture keep us well positioned to succeed in the current dynamic environment.”
© Mindtree 2016 Page 4 of 13
Multi-year and multi-million dollar wins with leading global clients:
o A diverse financial services company: Mindtree will provide application maintenance via a
managed services model along with supporting distribution, digital, mobility and data applications
o A global IT services company: Mindtree chosen as a strategic partner for system integration,
digital and infrastructure services
o A leading consumer credit reporting agency: Mindtree chosen as a preferred partner for
application development and infrastructure support services
o A world leader in lawful monitoring and intelligence solutions: Mindtree chosen as strategic
partner for product development, analytics and digital initiatives
o A leading publishing and events company: Mindtree will provide application support and
maintenance services for their ERP platform
o A leading beauty care company. Mindtree will provide digital services to build a large and complex
platform support their corporate marketing transformation
o A leading international tobacco group: Our subsidiary, Bluefin Solutions, will provide system
integration services for SAP Business Planning & Consolidation and Data Warehouse on SAP
HANA
Awards and recognition:
o Named as a leader for Application Outsourcing Capabilities among Midsize Offshore Vendors by
Forrester Research
o Positioned in the leadership zone for product engineering and embedded systems by Zinnov in the
Zinnov Zones 2016 Product Engineering Services report
o Recognized by the Institute of Company Secretaries of India (ICSI) for excellence in corporate
governance
Announcements
o The Board of Directors, at its meeting held on January 19, 2017
o Recommended an interim dividend of 20% (₹ 2 per equity share of par value ₹ 10 each) for
the quarter ended December 31, 2016
o Approved the extension of Mr. Krishnakumar Natarajan’s tenure as Executive Chairman to
June 30, 2020
Note: The financial results above are in accordance with Ind AS for the quarter and nine months ended
December 31, 2016. Accordingly the figures for previous periods have been restated in accordance with Ind
AS.
© Mindtree 2016 Page 5 of 13
About Mindtree
Mindtree [NSE: MINDTREE] delivers digital transformation and technology services from ideation to
execution, enabling Global 2000 clients to outperform the competition. “Born digital,” Mindtree takes an agile,
collaborative approach to creating customized solutions across the digital value chain. At the same time, our
deep expertise in infrastructure and applications management helps optimize your IT into a strategic asset.
Whether you need to differentiate your company, reinvent business functions or accelerate revenue growth,
we can get you there. Visit www.mindtree.com to learn more.
Safe harbour
Certain statements in this release concerning our future growth prospects are forward-looking statements,
which involve a number of risks, and uncertainties that could cause our actual results to differ materially from
those in such forward-looking statements. We do not undertake to update any forward-looking statement that
may be made from time to time by us or on our behalf.
Visit us at www.mindtree.com. For more information, contact:
INDIA UNITED STATES
Debi Senapati Andrea Dunbeck
Mindtree Matter Communications
+91 99805 56784 978-518-4555
[email protected] [email protected]
EUROPE
Imogen Nation
Hotwire
+4420 7608 4675
Mindtree Limited, Global Village, RVCE Post, Mysore Road, Bangalore-560059;
CIN: L72200KA1999PLC025564; Phone: + 91 80 6706 4000; Fax: +91 80 6706 4100;
E-mail: [email protected]/[email protected];Website: www.mindtree.com
© Mindtree 2016 Page 6 of 13
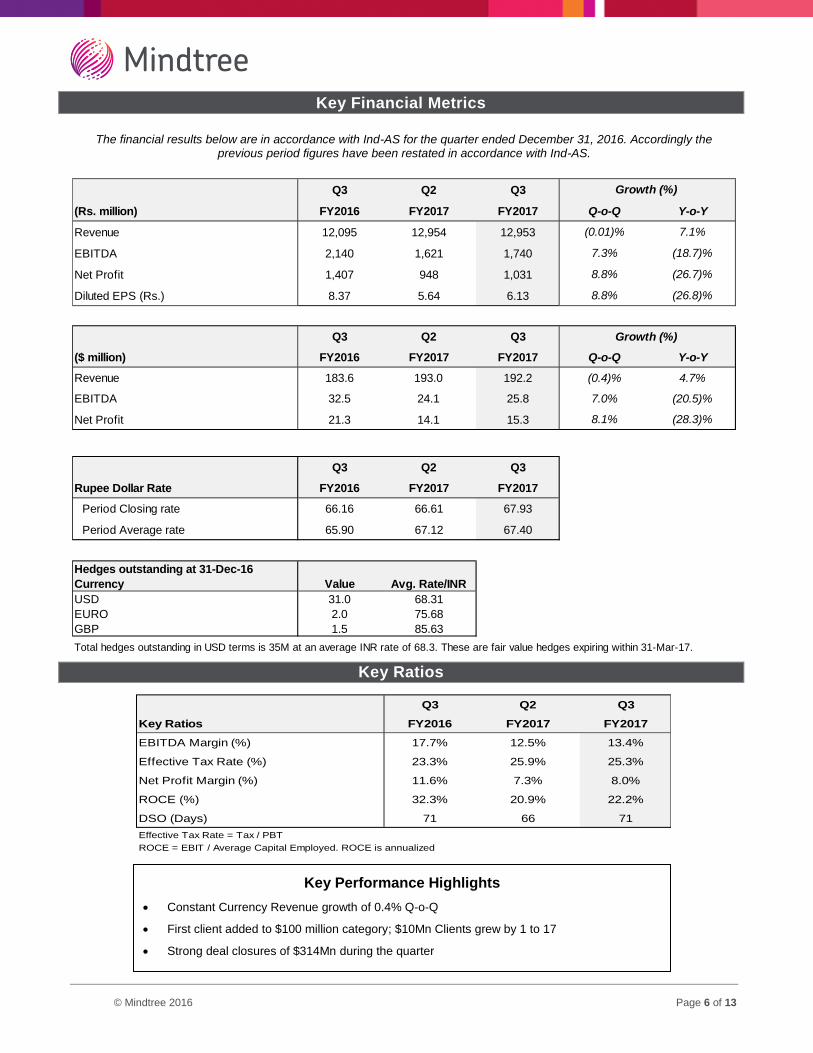
Key Financial Metrics
The financial results below are in accordance with Ind-AS for the quarter ended December 31, 2016. Accordingly the previous period figures have been restated in accordance with Ind-AS.
Q3 Q2 Q3
(Rs. million) FY2016 FY2017 FY2017 Q-o-Q Y-o-Y
Revenue 12,095 12,954 12,953 (0.01)% 7.1%
EBITDA 2,140 1,621 1,740 7.3% (18.7)%
Net Profit 1,407 948 1,031 8.8% (26.7)%
Diluted EPS (Rs.) 8.37 5.64 6.13 8.8% (26.8)%
Q3 Q2 Q3
($ million) FY2016 FY2017 FY2017 Q-o-Q Y-o-Y
Revenue 183.6 193.0 192.2 (0.4)% 4.7%
EBITDA 32.5 24.1 25.8 7.0% (20.5)%
Net Profit 21.3 14.1 15.3 8.1% (28.3)%
Q3 Q2 Q3
Rupee Dollar Rate FY2016 FY2017 FY2017
Period Closing rate 66.16 66.61 67.93
Period Average rate 65.90 67.12 67.40
Hedges outstanding at 31-Dec-16
Currency Value Avg. Rate/INR
USD 31.0 68.31
EURO 2.0 75.68
GBP 1.5 85.63
Total hedges outstanding in USD terms is 35M at an average INR rate of 68.3. These are fair value hedges expiring within 31-Mar-17.
Growth (%)
Growth (%)
Key Ratios
Q3 Q2 Q3
Key Ratios FY2016 FY2017 FY2017
EBITDA Margin (%) 17.7% 12.5% 13.4%
Effective Tax Rate (%) 23.3% 25.9% 25.3%
Net Profit Margin (%) 11.6% 7.3% 8.0%
ROCE (%) 32.3% 20.9% 22.2%
DSO (Days) 71 66 71
Effective Tax Rate = Tax / PBT
ROCE = EBIT / Average Capital Employed. ROCE is annualized
Key Performance Highlights
Constant Currency Revenue growth of 0.4% Q-o-Q
First client added to $100 million category; $10Mn Clients grew by 1 to 17
Strong deal closures of $314Mn during the quarter
© Mindtree 2016 Page 7 of 13
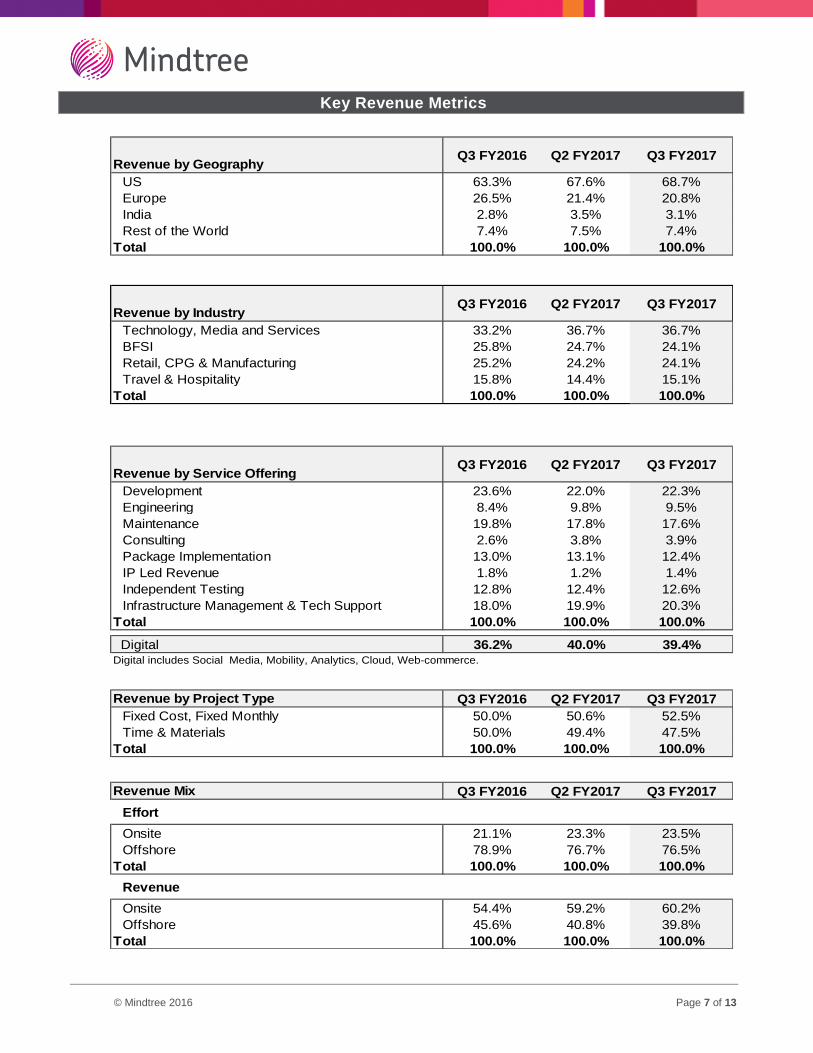
Key Revenue Metrics
Revenue by Geography Q3 FY2016 Q2 FY2017 Q3 FY2017
US 63.3% 67.6% 68.7%
Europe 26.5% 21.4% 20.8%
India 2.8% 3.5% 3.1%
Rest of the World 7.4% 7.5% 7.4%
Total 100.0% 100.0% 100.0%
Revenue by Industry Q3 FY2016 Q2 FY2017 Q3 FY2017
Technology, Media and Services 33.2% 36.7% 36.7%
BFSI 25.8% 24.7% 24.1%
Retail, CPG & Manufacturing 25.2% 24.2% 24.1%
Travel & Hospitality 15.8% 14.4% 15.1%
Total 100.0% 100.0% 100.0%
Revenue by Service Offering Q3 FY2016 Q2 FY2017 Q3 FY2017
Development 23.6% 22.0% 22.3%
Engineering 8.4% 9.8% 9.5%
Maintenance 19.8% 17.8% 17.6%
Consulting 2.6% 3.8% 3.9%
Package Implementation 13.0% 13.1% 12.4%
IP Led Revenue 1.8% 1.2% 1.4%
Independent Testing 12.8% 12.4% 12.6%
Infrastructure Management & Tech Support 18.0% 19.9% 20.3%
Total 100.0% 100.0% 100.0%
Digital 36.2% 40.0% 39.4%Digital includes Social Media, Mobility, Analytics, Cloud, Web-commerce.
Revenue by Project Type Q3 FY2016 Q2 FY2017 Q3 FY2017
Fixed Cost, Fixed Monthly 50.0% 50.6% 52.5%
Time & Materials 50.0% 49.4% 47.5%
Total 100.0% 100.0% 100.0%
Revenue Mix Q3 FY2016 Q2 FY2017 Q3 FY2017
Effort
Onsite 21.1% 23.3% 23.5%
Offshore 78.9% 76.7% 76.5%
Total 100.0% 100.0% 100.0%
Revenue
Onsite 54.4% 59.2% 60.2%
Offshore 45.6% 40.8% 39.8%
Total 100.0% 100.0% 100.0%
© Mindtree 2016 Page 8 of 13
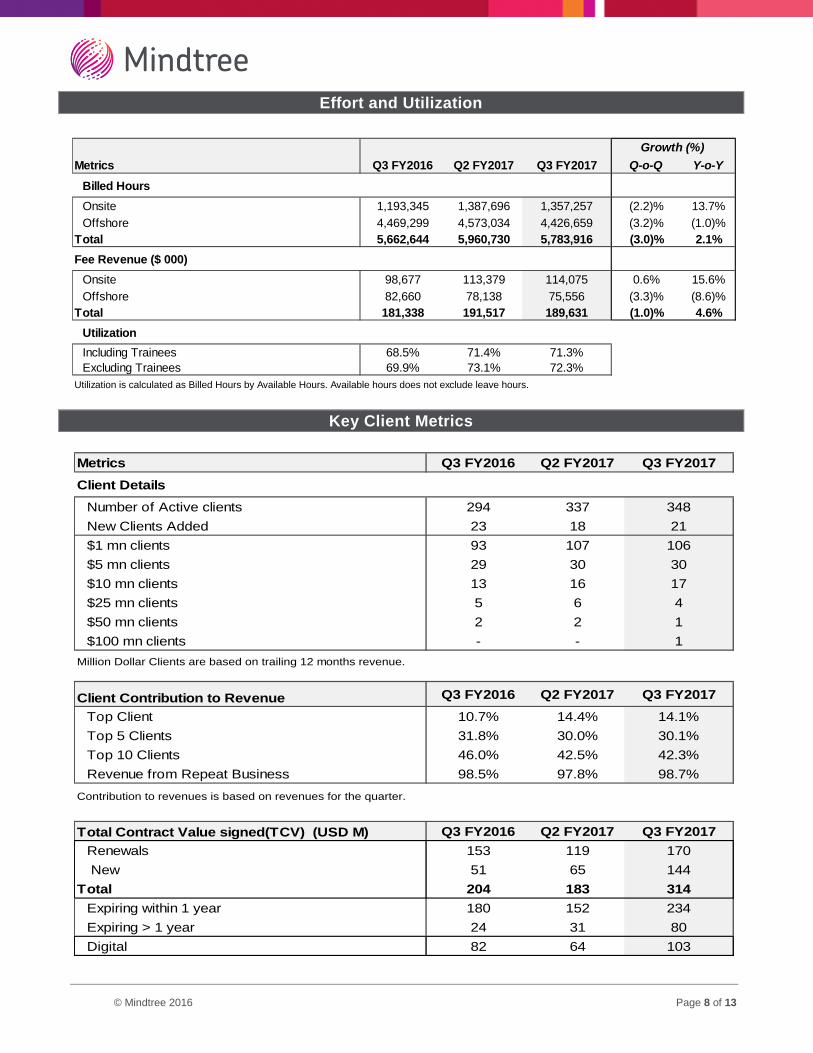
Effort and Utilization
Metrics Q3 FY2016 Q2 FY2017 Q3 FY2017 Q-o-Q Y-o-Y
Billed Hours
Onsite 1,193,345 1,387,696 1,357,257 (2.2)% 13.7%
Offshore 4,469,299 4,573,034 4,426,659 (3.2)% (1.0)%
Total 5,662,644 5,960,730 5,783,916 (3.0)% 2.1%
Fee Revenue ($ 000)
Onsite 98,677 113,379 114,075 0.6% 15.6%
Offshore 82,660 78,138 75,556 (3.3)% (8.6)%
Total 181,338 191,517 189,631 (1.0)% 4.6%
Utilization
Including Trainees 68.5% 71.4% 71.3%
Excluding Trainees 69.9% 73.1% 72.3%
Utilization is calculated as Billed Hours by Available Hours. Available hours does not exclude leave hours.
Growth (%)
Key Client Metrics
Metrics Q3 FY2016 Q2 FY2017 Q3 FY2017
Client Details
Number of Active clients 294 337 348
New Clients Added 23 18 21
$1 mn clients 93 107 106
$5 mn clients 29 30 30
$10 mn clients 13 16 17
$25 mn clients 5 6 4
$50 mn clients 2 2 1
$100 mn clients - - 1
Million Dollar Clients are based on trailing 12 months revenue.
Client Contribution to Revenue Q3 FY2016 Q2 FY2017 Q3 FY2017
Top Client 10.7% 14.4% 14.1%
Top 5 Clients 31.8% 30.0% 30.1%
Top 10 Clients 46.0% 42.5% 42.3%
Revenue from Repeat Business 98.5% 97.8% 98.7%
Contribution to revenues is based on revenues for the quarter.
Total Contract Value signed(TCV) (USD M) Q3 FY2016 Q2 FY2017 Q3 FY2017
Renewals 153 119 170
New 51 65 144
Total 204 183 314
Expiring within 1 year 180 152 234
Expiring > 1 year 24 31 80
Digital 82 64 103
© Mindtree 2016 Page 9 of 13
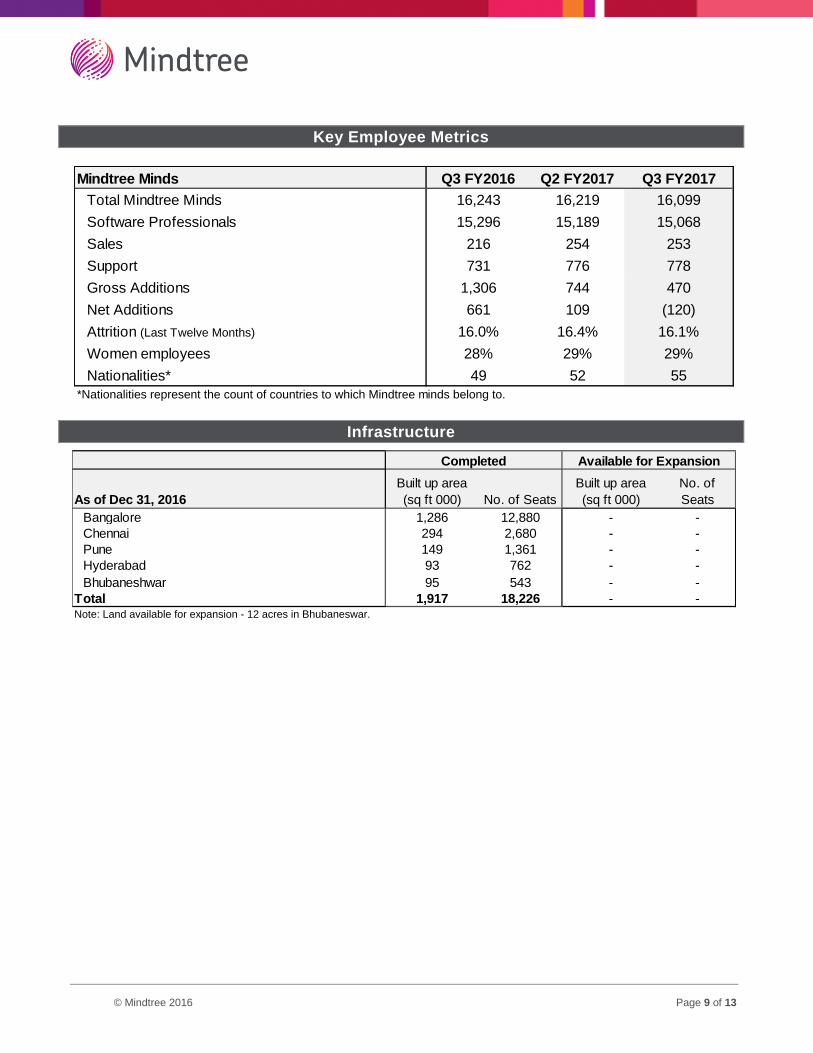
Key Employee Metrics
Mindtree Minds Q3 FY2016 Q2 FY2017 Q3 FY2017
Total Mindtree Minds 16,243 16,219 16,099
Software Professionals 15,296 15,189 15,068
Sales 216 254 253
Support 731 776 778
Gross Additions 1,306 744 470
Net Additions 661 109 (120)
Attrition (Last Twelve Months) 16.0% 16.4% 16.1%
Women employees 28% 29% 29%
Nationalities* 49 52 55
*Nationalities represent the count of countries to which Mindtree minds belong to.
Infrastructure
As of Dec 31, 2016
Built up area
(sq ft 000) No. of Seats
Built up area
(sq ft 000)
No. of
Seats
Bangalore 1,286 12,880 - -
Chennai 294 2,680 - -
Pune 149 1,361 - -
Hyderabad 93 762 - -
Bhubaneshwar 95 543 - -
Total 1,917 18,226 - -Note: Land available for expansion - 12 acres in Bhubaneswar.
Completed Available for Expansion
© Mindtree 2016 Page 10 of 13
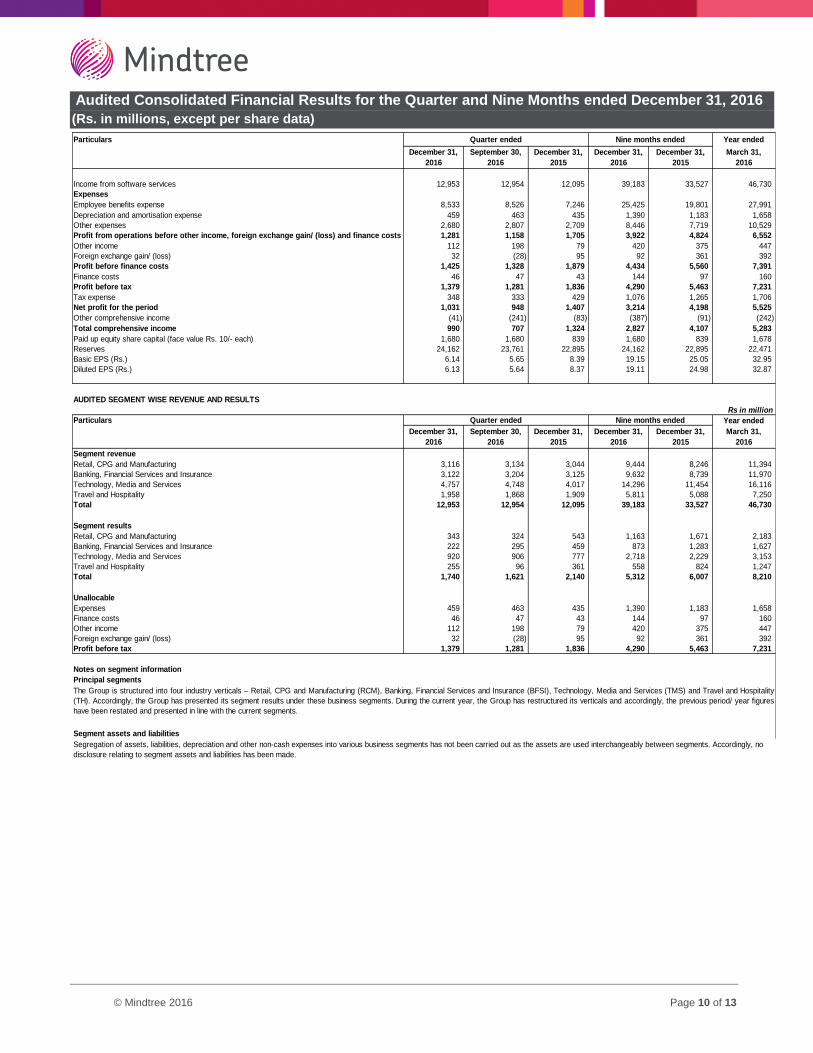
Audited Consolidated Financial Results for the Quarter and Nine Months ended December 31, 2016
(Rs. in millions, except per share data)
Particulars Year ended
December 31,
2016
September 30,
2016
December 31,
2015
December 31,
2016
December 31,
2015
March 31,
2016
Income from software services 12,953 12,954 12,095 39,183 33,527 46,730
Expenses
Employee benefits expense 8,533 8,526 7,246 25,425 19,801 27,991
Depreciation and amortisation expense 459 463 435 1,390 1,183 1,658
Other expenses 2,680 2,807 2,709 8,446 7,719 10,529
Profit from operations before other income, foreign exchange gain/ (loss) and finance costs 1,281 1,158 1,705 3,922 4,824 6,552
Other income 112 198 79 420 375 447
Foreign exchange gain/ (loss) 32 (28) 95 92 361 392
Profit before finance costs 1,425 1,328 1,879 4,434 5,560 7,391
Finance costs 46 47 43 144 97 160
Profit before tax 1,379 1,281 1,836 4,290 5,463 7,231
Tax expense 348 333 429 1,076 1,265 1,706
Net profit for the period 1,031 948 1,407 3,214 4,198 5,525
Other comprehensive income (41) (241) (83) (387) (91) (242)
Total comprehensive income 990 707 1,324 2,827 4,107 5,283
Paid up equity share capital (face value Rs. 10/- each) 1,680 1,680 839 1,680 839 1,678
Reserves 24,162 23,761 22,895 24,162 22,895 22,471
Basic EPS (Rs.) 6.14 5.65 8.39 19.15 25.05 32.95
Diluted EPS (Rs.) 6.13 5.64 8.37 19.11 24.98 32.87
AUDITED SEGMENT WISE REVENUE AND RESULTS
Rs in million
Particulars Year ended
December 31,
2016
September 30,
2016
December 31,
2015
December 31,
2016
December 31,
2015
March 31,
2016
Segment revenue
Retail, CPG and Manufacturing 3,116 3,134 3,044 9,444 8,246 11,394
Banking, Financial Services and Insurance 3,122 3,204 3,125 9,632 8,739 11,970
Technology, Media and Services 4,757 4,748 4,017 14,296 11,454 16,116
Travel and Hospitality 1,958 1,868 1,909 5,811 5,088 7,250
Total 12,953 12,954 12,095 39,183 33,527 46,730
Segment results
Retail, CPG and Manufacturing 343 324 543 1,163 1,671 2,183
Banking, Financial Services and Insurance 222 295 459 873 1,283 1,627
Technology, Media and Services 920 906 777 2,718 2,229 3,153
Travel and Hospitality 255 96 361 558 824 1,247
Total 1,740 1,621 2,140 5,312 6,007 8,210
Unallocable
Expenses 459 463 435 1,390 1,183 1,658
Finance costs 46 47 43 144 97 160
Other income 112 198 79 420 375 447
Foreign exchange gain/ (loss) 32 (28) 95 92 361 392
Profit before tax 1,379 1,281 1,836 4,290 5,463 7,231
Notes on segment information
Principal segments
Segment assets and liabilities
Quarter ended
The Group is structured into four industry verticals – Retail, CPG and Manufacturing (RCM), Banking, Financial Services and Insurance (BFSI), Technology, Media and Services (TMS) and Travel and Hospitality
(TH). Accordingly, the Group has presented its segment results under these business segments. During the current year, the Group has restructured its verticals and accordingly, the previous period/ year figures
have been restated and presented in line with the current segments.
Segregation of assets, liabilities, depreciation and other non-cash expenses into various business segments has not been carried out as the assets are used interchangeably between segments. Accordingly, no
disclosure relating to segment assets and liabilities has been made.
Quarter ended Nine months ended
Nine months ended
© Mindtree 2016 Page 11 of 13
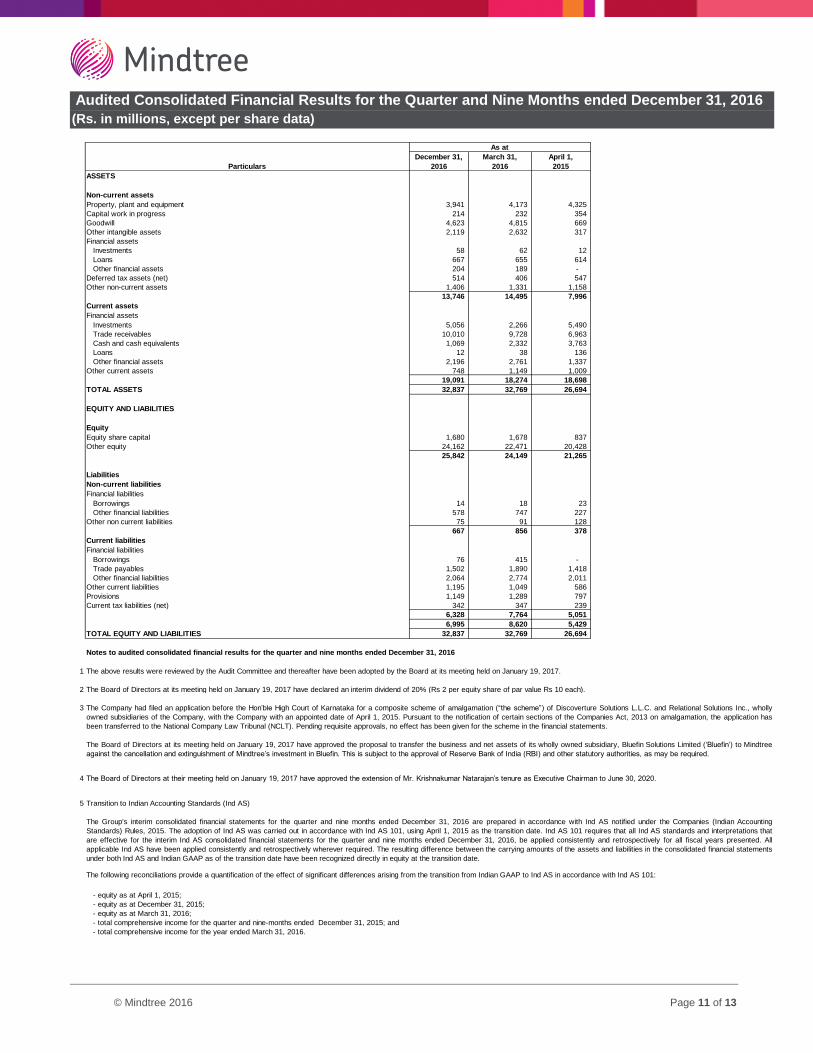
Audited Consolidated Financial Results for the Quarter and Nine Months ended December 31, 2016
(Rs. in millions, except per share data)
December 31,
2016
March 31,
2016
April 1,
2015
ASSETS
Non-current assets
Property, plant and equipment 3,941 4,173 4,325
Capital work in progress 214 232 354
Goodwill 4,623 4,815 669
Other intangible assets 2,119 2,632 317
Financial assets
Investments 58 62 12
Loans 667 655 614
Other financial assets 204 189 -
Deferred tax assets (net) 514 406 547
Other non-current assets 1,406 1,331 1,158
13,746 14,495 7,996
Current assets
Financial assets
Investments 5,056 2,266 5,490
Trade receivables 10,010 9,728 6,963
Cash and cash equivalents 1,069 2,332 3,763
Loans 12 38 136
Other financial assets 2,196 2,761 1,337
Other current assets 748 1,149 1,009
19,091 18,274 18,698
TOTAL ASSETS 32,837 32,769 26,694
EQUITY AND LIABILITIES
Equity
Equity share capital 1,680 1,678 837
Other equity 24,162 22,471 20,428
25,842 24,149 21,265
Liabilities
Non-current liabilities
Financial liabilities
Borrowings 14 18 23
Other financial liabilities 578 747 227
Other non current liabilities 75 91 128
667 856 378
Current liabilities
Financial liabilities
Borrowings 76 415 -
Trade payables 1,502 1,890 1,418
Other financial liabilities 2,064 2,774 2,011
Other current liabilities 1,195 1,049 586
Provisions 1,149 1,289 797
Current tax liabilities (net) 342 347 239
6,328 7,764 5,051
6,995 8,620 5,429
TOTAL EQUITY AND LIABILITIES 32,837 32,769 26,694
Notes to audited consolidated financial results for the quarter and nine months ended December 31, 2016
1
2
3
4
5 Transition to Indian Accounting Standards (Ind AS)
- equity as at April 1, 2015;
- equity as at December 31, 2015;
- equity as at March 31, 2016;
- total comprehensive income for the quarter and nine-months ended December 31, 2015; and
- total comprehensive income for the year ended March 31, 2016.
The Board of Directors at its meeting held on January 19, 2017 have declared an interim dividend of 20% (Rs 2 per equity share of par value Rs 10 each).
The above results were reviewed by the Audit Committee and thereafter have been adopted by the Board at its meeting held on January 19, 2017.
The following reconciliations provide a quantification of the effect of significant differences arising from the transition from Indian GAAP to Ind AS in accordance with Ind AS 101:
As at
Particulars
The Company had filed an application before the Hon’ble High Court of Karnataka for a composite scheme of amalgamation (“the scheme”) of Discoverture Solutions L.L.C. and Relational Solutions Inc., wholly
owned subsidiaries of the Company, with the Company with an appointed date of April 1, 2015. Pursuant to the notification of certain sections of the Companies Act, 2013 on amalgamation, the application has
been transferred to the National Company Law Tribunal (NCLT). Pending requisite approvals, no effect has been given for the scheme in the financial statements.
The Board of Directors at its meeting held on January 19, 2017 have approved the proposal to transfer the business and net assets of its wholly owned subsidiary, Bluefin Solutions Limited (‘Bluefin’) to Mindtree
against the cancellation and extinguishment of Mindtree’s investment in Bluefin. This is subject to the approval of Reserve Bank of India (RBI) and other statutory authorities, as may be required.
The Group's interim consolidated financial statements for the quarter and nine months ended December 31, 2016 are prepared in accordance with Ind AS notified under the Companies (Indian Accounting
Standards) Rules, 2015. The adoption of Ind AS was carried out in accordance with Ind AS 101, using April 1, 2015 as the transition date. Ind AS 101 requires that all Ind AS standards and interpretations that
are effective for the interim Ind AS consolidated financial statements for the quarter and nine months ended December 31, 2016, be applied consistently and retrospectively for all fiscal years presented. All
applicable Ind AS have been applied consistently and retrospectively wherever required. The resulting difference between the carrying amounts of the assets and liabilities in the consolidated financial statements
under both Ind AS and Indian GAAP as of the transition date have been recognized directly in equity at the transition date.
The Board of Directors at their meeting held on January 19, 2017 have approved the extension of Mr. Krishnakumar Natarajan’s tenure as Executive Chairman to June 30, 2020.
© Mindtree 2016 Page 12 of 13
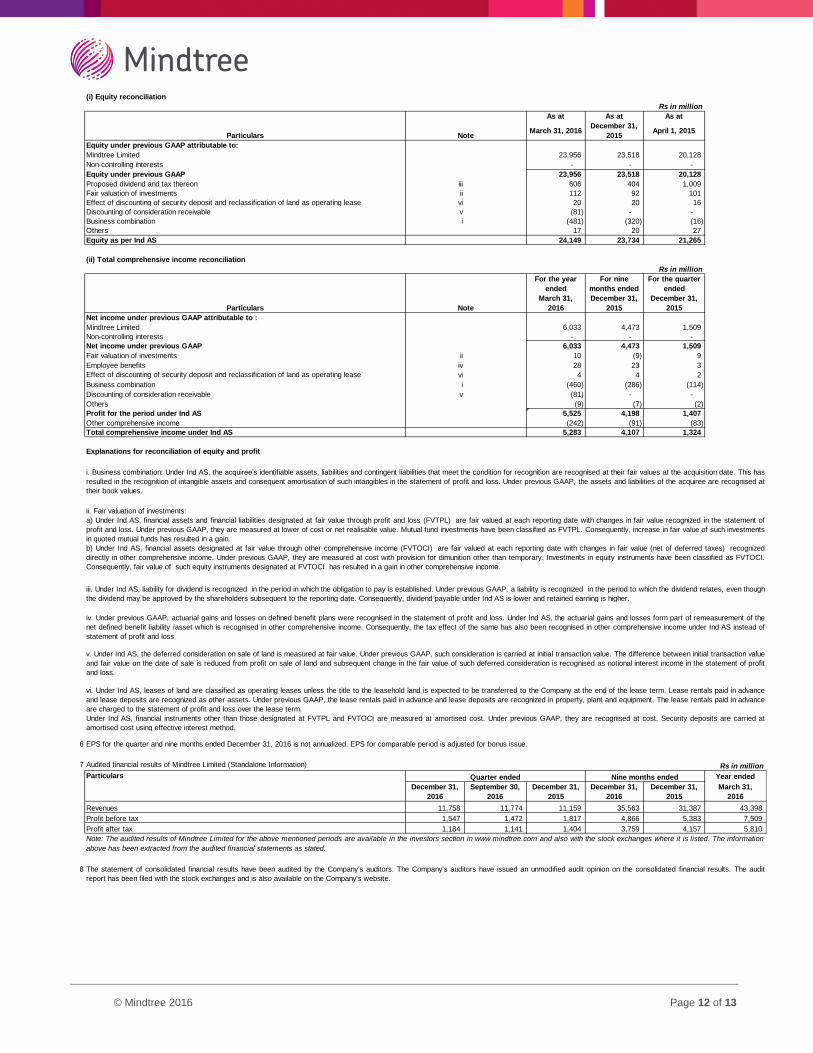
(i) Equity reconciliation
Rs in million
As at As at As at
March 31, 2016December 31,
2015April 1, 2015
Equity under previous GAAP attributable to:
Mindtree Limited 23,956 23,518 20,128
Non-controlling interests - - -
Equity under previous GAAP 23,956 23,518 20,128
Proposed dividend and tax thereon iii 606 404 1,009
Fair valuation of investments ii 112 92 101
Effect of discounting of security deposit and reclassification of land as operating lease vi 20 20 16
Discounting of consideration receivable v (81) - -
Business combination i (481) (320) (16)
Others 17 20 27
Equity as per Ind AS 24,149 23,734 21,265
(ii) Total comprehensive income reconciliation
Rs in million
For the year
ended
For nine
months ended
For the quarter
ended
March 31,
2016
December 31,
2015
December 31,
2015
Net income under previous GAAP attributable to :
Mindtree Limited 6,033 4,473 1,509
Non-controlling interests - - -
Net income under previous GAAP 6,033 4,473 1,509
Fair valuation of investments ii 10 (9) 9
Employee benefits iv 28 23 3
Effect of discounting of security deposit and reclassification of land as operating lease vi 4 4 2
Business combination i (460) (286) (114)
Discounting of consideration receivable v (81) - -
Others (9) (7) (2)
Profit for the period under Ind AS 5,525 4,198 1,407
Other comprehensive income (242) (91) (83)
Total comprehensive income under Ind AS 5,283 4,107 1,324
6 EPS for the quarter and nine months ended December 31, 2016 is not annualized. EPS for comparable period is adjusted for bonus issue.
7 Audited financial results of Mindtree Limited (Standalone Information) Rs in million
Particulars Year ended
December 31,
2016
September 30,
2016
December 31,
2015
December 31,
2016
December 31,
2015
March 31,
2016
Revenues 11,758 11,774 11,159 35,563 31,387 43,398
Profit before tax 1,547 1,472 1,817 4,866 5,383 7,509
Profit after tax 1,184 1,141 1,404 3,759 4,157 5,810
8
Quarter ended
Explanations for reconciliation of equity and profit
Particulars
Particulars
Note
Note
i. Business combination: Under Ind AS, the acquiree’s identifiable assets, liabilities and contingent liabilities that meet the condition for recognition are recognised at their fair values at the acquisition date. This has
resulted in the recognition of intangible assets and consequent amortisation of such intangibles in the statement of profit and loss. Under previous GAAP, the assets and liabilities of the acquiree are recognised at
their book values.
The statement of consolidated financial results have been audited by the Company's auditors. The Company's auditors have issued an unmodified audit opinion on the consolidated financial results. The audit
report has been filed with the stock exchanges and is also available on the Company's website.
Nine months ended
Note: The audited results of Mindtree Limited for the above mentioned periods are available in the investors section in www.mindtree.com and also with the stock exchanges where it is listed. The information
above has been extracted from the audited financial statements as stated.
vi. Under Ind AS, leases of land are classified as operating leases unless the title to the leasehold land is expected to be transferred to the Company at the end of the lease term. Lease rentals paid in advance
and lease deposits are recognized as other assets. Under previous GAAP, the lease rentals paid in advance and lease deposits are recognized in property, plant and equipment. The lease rentals paid in advance
are charged to the statement of profit and loss over the lease term.
Under Ind AS, financial instruments other than those designated at FVTPL and FVTOCI are measured at amortised cost. Under previous GAAP, they are recognised at cost. Security deposits are carried at
amortised cost using effective interest method.
v. Under Ind AS, the deferred consideration on sale of land is measured at fair value. Under previous GAAP, such consideration is carried at initial transaction value. The difference between initial transaction value
and fair value on the date of sale is reduced from profit on sale of land and subsequent change in the fair value of such deferred consideration is recognised as notional interest income in the statement of profit
and loss.
iv. Under previous GAAP, actuarial gains and losses on defined benefit plans were recognised in the statement of profit and loss. Under Ind AS, the actuarial gains and losses form part of remeasurement of the
net defined benefit liability /asset which is recognised in other comprehensive income. Consequently, the tax effect of the same has also been recognised in other comprehensive income under Ind AS instead of
statement of profit and loss.
iii. Under Ind AS, liability for dividend is recognized in the period in which the obligation to pay is established. Under previous GAAP, a liability is recognized in the period to which the dividend relates, even though
the dividend may be approved by the shareholders subsequent to the reporting date. Consequently, dividend payable under Ind AS is lower and retained earning is higher.
ii. Fair valuation of investments:
a) Under Ind AS, financial assets and financial liabilities designated at fair value through profit and loss (FVTPL) are fair valued at each reporting date with changes in fair value recognized in the statement of
profit and loss. Under previous GAAP, they are measured at lower of cost or net realisable value. Mutual fund investments have been classified as FVTPL. Consequently, increase in fair value of such investments
in quoted mutual funds has resulted in a gain.
b) Under Ind AS, financial assets designated at fair value through other comprehensive income (FVTOCI) are fair valued at each reporting date with changes in fair value (net of deferred taxes) recognized
directly in other comprehensive income. Under previous GAAP, they are measured at cost with provision for dimunition other than temporary. Investments in equity instruments have been classified as FVTOCI.
Consequently, fair value of such equity instruments designated at FVTOCI has resulted in a gain in other comprehensive income.
For more information please contact:
Sushanth Pai
Mindtree Limited
Safe Harbor:
Certain statements in this release concerning our future growth prospects are forward-looking statements, which involve
a number of risks, and uncertainties that could cause our actual results to differ materially from those in such forward-
looking statements. We do not undertake to update any forward-looking statement that may be made from time to time by
us or on our behalf.