Embed Size (px)
Citation preview
amadeus.com
Management Review January-September 2017
November 3, 2017
Page 2 of 40 amadeus.com
© 2
01
7 A
mad
eus
IT G
rou
p a
nd
its
affi
liate
s an
d s
ub
sid
iari
es
Index
1 Summary ........................................................................................................... 3
1.1 Introduction ................................................................................................... 4
1.2 Summary of operating and financial information ....................................... 6
2 Operating Review ............................................................................................. 7
2.1 Key recent business highlights ..................................................................... 8
2.2 Key ongoing R&D projects .......................................................................... 11
3 Presentation of financial information ........................................................... 13
3.1 2016 corporate transactions ...................................................................... 15
3.2 2017 corporate transactions ...................................................................... 15
4 Main financial risks and hedging policy ........................................................ 16
4.1 Foreign exchange rate risk ......................................................................... 17
4.2 Interest rate risk .......................................................................................... 18
4.3 Own shares price evolution risk ................................................................. 18
5 Consolidated financial statements ................................................................ 19
5.1 Revenue ....................................................................................................... 20
5.2 Group operating costs ................................................................................ 25
5.3 EBITDA and Operating income ................................................................... 27
5.4 Net financial expense .................................................................................. 27
5.5 Income taxes ............................................................................................... 28
5.6 Profit for the period. Adjusted profit ......................................................... 28
5.7 Statement of financial position (condensed) ............................................ 30
5.8 Group Cash Flow ......................................................................................... 32
6 Investor information ...................................................................................... 35
6.1 Capital stock. Share ownership structure .................................................. 36
6.2 Share price performance in 2017............................................................... 36
6.3 Dividend payments ..................................................................................... 37
7 Key terms ........................................................................................................ 38
Page 3 of 40 amadeus.com
© 2
01
7 A
mad
eus
IT G
rou
p a
nd
its
affi
liate
s an
d s
ub
sid
iari
es
1 Summary
Page 4 of 40 amadeus.com
© 2
01
7 A
mad
eus
IT G
rou
p a
nd
its
affi
liate
s an
d s
ub
sid
iari
es
1.1 Introduction Highlights for the first nine months, ended September 30, 2017
_ In Distribution, our travel agency air bookings grew 6.0%, to 434.4 million
_ In IT Solutions, our passengers boarded increased 19.4%1, to 1,228.1 million
_ Revenue expanded by 8.9%, to €3,686.6 million
_ EBITDA increased by 10.1%, to €1,466.3 million
_ Adjusted profit2 grew 14.7%, to €846.7 million
_ Free Cash Flow amounted to €788.6 million, representing growth of 14.5%
_ Covenant net financial debt was €1,691.1 million at September 30, 2017 (0.92 times last-twelve-month covenant EBITDA)
Amadeus continued to expand profitably through the first nine months of 2017. Revenue, EBITDA and Adjusted Profit increased by 8.9%, 10.1% and 14.7%, respectively. This positive evolution through to September 30, 2017 resulted from strong operating performances in Distribution and IT Solutions, a Navitaire consolidation effect (acquired late January 2016) and a small year-to-date positive foreign exchange impact on revenues and EBITDA.
In Distribution, we signed or renewed content agreements with 8 carriers in the quarter, including Air Canada and Avianca Argentina, representing a total of 29 to date in 2017. Our air volumes outpaced the market growing 6.0% in the first nine months of the year, supported by a 0.6 p.p. enhancement of our competitive position3. Latin America and Asia and Pacific continued to be our fastest-growing regions, increasing at a double-digit growth rate. Average revenue per booking expansion also contributed to a 7.3% Distribution Revenue increase.
In the first nine months of 2017, c.70% of air bookings processed through Amadeus could carry an attached ancillary service. As of September 30, 2017, 136 airlines had contracted Amadeus Airline Ancillary Services for the indirect channel, including Hawaiian Airlines. Additionally, Amadeus Fare Families had 62 contracted customers at the end of the first nine months of 2017.
IT Solutions revenue grew 11.8% in the first nine months of 2017. This expansion was driven by (i) underlying growth in Airline IT solutions, (ii) the consolidation of Navitaire and (iii) continued expansion in our new businesses. During the first nine months of the year, we experienced 19.4% Passengers Boarded growth in Airline IT, from (i) organic Passengers Boarded growth of 7.8%, (ii) the latest migrations we have undertaken in 2017 and in 2016, and (iii) the full year impact from Navitaire’s Passengers Boarded (since late January 2016).
In the third quarter of 2017, Air Canada, MIAT Mongolian Airlines and Avianca Argentina contracted for the full Amadeus Altéa Suite.
1. Navitaire New Skies passengers boarded for the first half of 2016 were restated retroactively in our September YTD 2016 results, adding 6.3 million passengers boarded in H1 2016 (no impact on revenue).
2. Excluding after-tax impact of the following items: (i) accounting effects derived from PPA exercises and impairment losses, (ii) non-operating exchange gains (losses) and (iii) other non-recurring items.
3. Competitive position as defined in section 3.
Page 5 of 40 amadeus.com
© 2
01
7 A
mad
eus
IT G
rou
p a
nd
its
affi
liate
s an
d s
ub
sid
iari
es
We were pleased to announce what we see as a landmark technology partnership, where Air Canada has contracted for Altéa and a range of other airline IT and payments solutions (Amadeus Anytime Merchandising, Customer Experience Management, Revenue Integrity, Group Management, Passenger Recovery and Payments). It represents one of our most comprehensive airline agreements to date, through which we aim to support Air Canada in its digital transformation and in its customer experience strategy delivery. For Amadeus it represents a new significant milestone in North America.
In the quarter, we also migrated Boliviana de Aviación and SmartWings to the Amadeus Altéa Suite, as well as flyadeal (Saudi Arabian Airlines’ new low-cost carrier) to the Navitaire New Skies PSS. Swoop, a newly created ultra-low-cost carrier backed by WestJet, announced in October it had selected New Skies as its reservation system.
We continued to advance well in our new businesses. Amadeus accomplished an important milestone in Hospitality IT. We were pleased to announce Premier Inn has contracted for two key modules of the Amadeus Hospitality Platform – the Central Reservation System (CRS) and the Property Management System (PMS). Premier Inn will roll-out the combined Amadeus’ CRS and PMS across its 765 properties. Together, the natively integrated and cloud-based CRS-PMS will offer Premier Inn a 360 degree, real-time view of its properties and guests around the world, supporting Premier Inn’s digital marketing transformation program. Additionally, Premier Inn will adopt the Amadeus Payments platform, enabling more efficient customer payment processing, allowing for an improved customer experience.
We also continued to advance with InterContinental Hotels Group and together we have initiated the planned Guest Reservation System roll-out in the fourth quarter of 2017, with full deployment expected by late 2018 / early 2019.
Our Airport IT business also continued to expand with a number of successful announcements during the third quarter. We had six airports (Hong Kong International Airport in Greater China, Heydar Aliyev International Airport in Azerbaijan, and Calgary International Airport, Pittsburgh International Airport, Louis Armstrong New Orleans International Airport and Fort Lauderdale-Hollywood International Airport in North America) contract a range of solutions from our Airport IT portfolio.
Over the years, Amadeus has actively contributed to evolving IATA NDC. We believe IATA NDC has now reached a level of maturity that allows for its industrialisation. Amadeus has the expertise and capabilities to do this and it is our aim to deploy NDC at industrial scale assuming the industry follows the IATA NDC and its standard implementation to ensure efficiencies for all parties. In the short term, Amadeus will become Level 3 certified as aggregator in 2018. However, Amadeus’ ambition is to continue beyond NDC to deliver unique and advanced capabilities that will benefit travel providers and sellers alike.
A consistent and focused investment in technology has been key to our success. Our investment in R&D represented 14.8% of revenue in the nine months of 2017. It was dedicated to support mid to long-term growth through product evolution, portfolio expansion, new customer implementations and the full decommissioning of our TPF-based operating systems
Page 6 of 40 amadeus.com
© 2
01
7 A
mad
eus
IT G
rou
p a
nd
its
affi
liate
s an
d s
ub
sid
iari
es
and continued shift to next-generation technologies and cloud services, as well as system performance optimisation.
Our Free Cash Flow grew 14.5% over the first nine months of 2017, to €788.6 million and our consolidated covenant net financial debt stood at €1,691.1 million at third quarter-end, representing 0.92 times last-twelve-month covenant EBITDA.
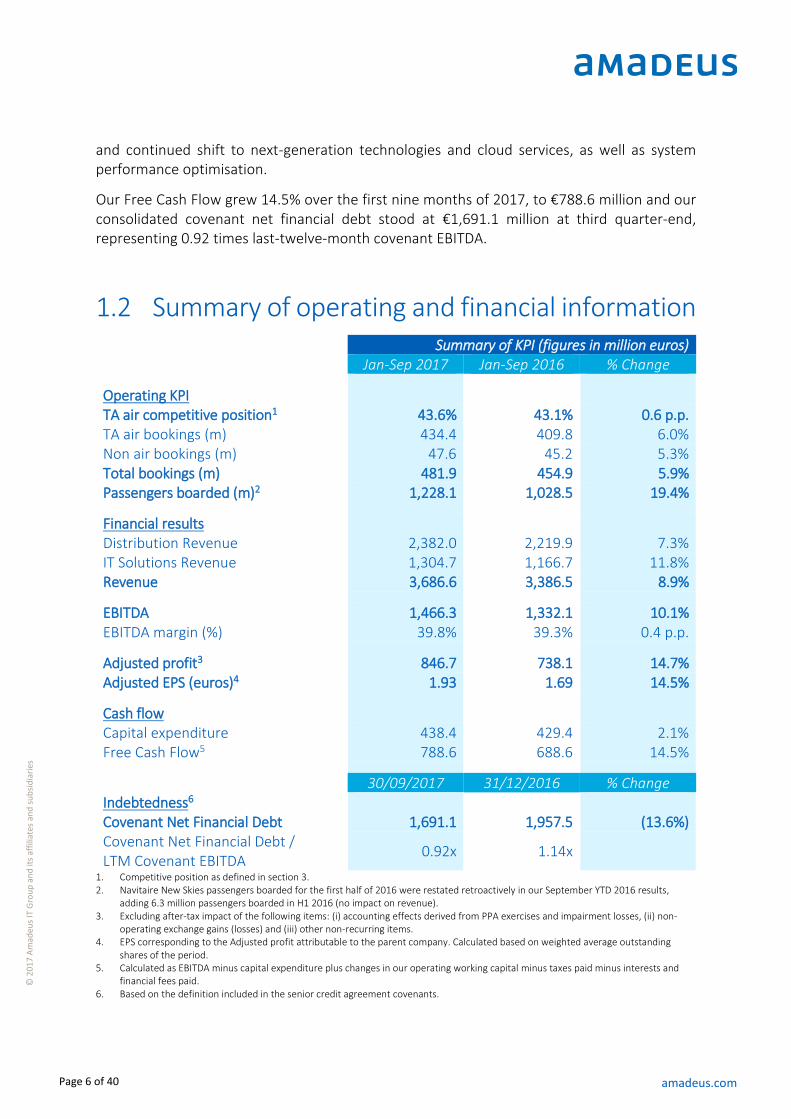
1.2 Summary of operating and financial information Summary of KPI (figures in million euros) Jan-Sep 2017 Jan-Sep 2016 % Change
Operating KPI TA air competitive position1 43.6% 43.1% 0.6 p.p. TA air bookings (m) 434.4 409.8 6.0% Non air bookings (m) 47.6 45.2 5.3% Total bookings (m) 481.9 454.9 5.9% Passengers boarded (m)2 1,228.1 1,028.5 19.4%
Financial results Distribution Revenue 2,382.0 2,219.9 7.3% IT Solutions Revenue 1,304.7 1,166.7 11.8% Revenue 3,686.6 3,386.5 8.9%
EBITDA 1,466.3 1,332.1 10.1% EBITDA margin (%) 39.8% 39.3% 0.4 p.p.
Adjusted profit3 846.7 738.1 14.7% Adjusted EPS (euros)4 1.93 1.69 14.5%
Cash flow Capital expenditure 438.4 429.4 2.1% Free Cash Flow5 788.6 688.6 14.5%
30/09/2017 31/12/2016 % Change Indebtedness6 Covenant Net Financial Debt 1,691.1 1,957.5 (13.6%) Covenant Net Financial Debt / LTM Covenant EBITDA
0.92x 1.14x
1. Competitive position as defined in section 3. 2. Navitaire New Skies passengers boarded for the first half of 2016 were restated retroactively in our September YTD 2016 results,
adding 6.3 million passengers boarded in H1 2016 (no impact on revenue). 3. Excluding after-tax impact of the following items: (i) accounting effects derived from PPA exercises and impairment losses, (ii) non-
operating exchange gains (losses) and (iii) other non-recurring items. 4. EPS corresponding to the Adjusted profit attributable to the parent company. Calculated based on weighted average outstanding
shares of the period. 5. Calculated as EBITDA minus capital expenditure plus changes in our operating working capital minus taxes paid minus interests and
financial fees paid. 6. Based on the definition included in the senior credit agreement covenants.
Page 7 of 40 amadeus.com
© 2
01
7 A
mad
eus
IT G
rou
p a
nd
its
affi
liate
s an
d s
ub
sid
iari
es
2 Operating Review
Page 8 of 40 amadeus.com
© 2
01
7 A
mad
eus
IT G
rou
p a
nd
its
affi
liate
s an
d s
ub
sid
iari
es
2.1 Key recent business highlights Airline Distribution
_ During the third quarter of 2017, we signed 8 new contracts or renewals of content agreements with airlines, reaching a total of 29 for the first nine months of the year. Air Canada and Avianca Argentina were among the carriers that signed or renewed content agreements in the third quarter.
_ Subscribers to Amadeus’ inventory can now access over 100 low cost carriers (LCC) and hybrid carriers’ content worldwide. LCC and hybrid carriers’ bookings grew 9% in the first nine months of 2017 vs. prior year (growth in this period was highly impacted by a specific airline undergoing restructuring).
_ Eurowings signed up for Amadeus Light Ticketing in September. Thanks to this XML connectivity, travel agents connected to the Amadeus system can now book all published Eurowings fares, from the most affordable Basic Fare, through to the premium BEST fare. Travel agents will also be able to add seats, bags and other ancillaries to the booking. Amadeus is the only distribution platform to offer this wide range of Eurowings content to its travel agency users.
_ Our customers’ interest in our merchandising solutions continued during the third quarter. At the end of September, 136 airlines had signed up to Amadeus Airline Ancillary Services for the indirect channel, including Hawaiian Airlines and Air Tahiti Nui, with 104 of them already implemented. Also, 62 airlines had contracted Amadeus Fare Families, which allows airlines to distribute branded fares. 48 of those airlines had implemented the solution. In the first nine months of 2017, c.70% of the global air bookings processed through the Amadeus GDS system were eligible to carry an attached ancillary service.
_ In October, we achieved New Distribution Capability (NDC) Level 1 certification4 as an aggregator from IATA. This certification follows on from Amadeus becoming one of the first technology companies to receive NDC Level 3 certification as an IT provider in June 2016, the highest level of certification. Our aim is to become NDC Level 3 certified as an aggregator in 2018.
_ In October, we also announced we will pilot IATA’s new One Order standard with British Airways. This industry-led standard replaces the multiple booking, ticketing, delivery, and accounting methods with one single order management process. The standard will result in the gradual disappearance of multiple legacy records that will be replaced by just one travel document.
Airline IT
_ At the close of September, 201 customers had contracted either of the Amadeus Passenger Service Systems (Altéa or New Skies) and 192 had implemented either of them.
_ Air Canada contracted the full Amadeus Altéa Suite, including reservations, inventory, and departure control solutions. In addition to these, the airline also signed up for a range of other Amadeus airline IT and payments solutions such as Anytime Merchandising,
4 See section 7 Key terms for further information on NDC certification levels.
Page 9 of 40 amadeus.com
© 2
01
7 A
mad
eus
IT G
rou
p a
nd
its
affi
liate
s an
d s
ub
sid
iari
es
Customer Experience Management, Payments, Revenue Integrity, Group Management and Passenger Recovery. All these Amadeus solutions will help Air Canada to enhance customer experience and improve profitability and operational performance in support of its growing international network.
_ MIAT Mongolian Airlines signed up for the full Amadeus Altéa Suite, as well as for Amadeus Altéa Revenue Management and Amadeus Loyalty Management. Avianca Argentina contracted the full Altéa Suite and e-commerce solutions.
_ Boliviana de Aviación implemented the Reservation and Inventory modules of the Altéa Suite, contracted during the first quarter of 2017. SmartWings also implemented Altéa, as well as Amadeus Flex Pricer, during the quarter. NextJet and Adria Airways implemented Amadeus Altéa Revenue Management.
_ flyadeal, Saudia Airlines’ new low cost subsidiary, implemented New Skies as well as Navitaire’s Revenue Accounting solution. Swoop, WestJet’s new ultra-low cost carrier, announced in October it had selected New Skies as its reservation system.
_ Existing Altéa customers continued to show their confidence in our airline IT portfolio. Middle East Airlines, already a customer of our Revenue Integrity solution, contracted Amadeus Revenue Management, Amadeus Payments Platform and Amadeus Reservation Desktop in September. Thanks to these solutions, the airline will be better positioned to deliver a seamless passenger experience in a more cost-effective manner. Fiji Airways signed up for Revenue Integrity.
_ Finnair contracted Amadeus Digital API to make its booking process easier and more flexible. Amadeus’ innovative Digital API empowers Finnair with enhanced retailing capabilities to deliver booking experiences according to customer requirements, without the need to follow the common airline booking sequence, where you will always start with the flight. Travellers will be able to start the booking with car rental, for example, or by the date they want to travel on. Also, the Digital API will allow for shopping carts and sessions to remain open for several months, meaning that travellers can start shopping for flights, close their session anytime, and pick up where they left off to finish their booking.
Hospitality
_ In November, Premier Inn announced that it had signed up for two key capabilities of our Hospitality Platform: the Central Reservation System (CRS) and the Property Management
System (PMS). Together, these two capabilities will offer Premier Inn a 360 view of its 765 properties and will allow the hotel chain to better personalise its offering. The CRS and PMS will also work as the foundation for Premier Inn’s digital marketing transformation program. In addition, Premier Inn will be the first hotel chain to adopt the Amadeus Payment solutions to streamline payment processes.
Airport IT
_ During the third quarter of 2017, Amadeus’ Airport IT business continued to expand its international footprint. Heydar Aliyev International Airport (Azerbaijan) signed up for the Amadeus’ full suite of airport solutions, including Amadeus Common Use Service (ACUS), Baggage Reconciliation System (BRS) and Flight Information Display System (FIDS), among others. The Baku-based airport will have the region’s first fully automated cloud-based
Page 10 of 40 amadeus.com
© 2
01
7 A
mad
eus
IT G
rou
p a
nd
its
affi
liate
s an
d s
ub
sid
iari
es
airport management system. Some key benefits include baggage peace-of-mind and on-time and reliable flight data and automation of key airport resources.
_ Hong Kong International Airport and Amadeus announced an agreement to deploy the world’s first hot-swappable battery powered movable check-in kiosks with both a self-service and full-service mode, reinventing the entire check-in experience. The versatile kiosks are powered by Amadeus’ common use technology and can be rapidly deployed and relocated for use by the traveller to check-in themselves or by the airport staff to provide full-service operations. This will allow the airport to reduce passenger process times, save airlines resources and free up space in the terminal while gaining greater freedom and flexibility to better serve passengers throughout their journey to and around the airport.
_ Both Calgary International Airport and Pittsburgh International Airport contracted our Airport Operational Database (AODB) and Resource Management System (RMS) solutions. Together, these solutions allow airports to manage and optimise all flight activity as well as plan and allocate any immobile resource, including gates, ticket counters, baggage carousels and security checkpoints.
_ Louis Armstrong New Orleans International Airport signed up for the Extended Airline System Environment (EASE). This solution helps airports optimise gates and ticket counter resources by facilitating the sharing of resources between multiple airlines.
_ In September, we also announced a partnership with Off Airport Check-In Solutions (OACIS) to launch the world’s first 'pop up' check-in service. Using Amadeus’ Airport Common Use Service (ACUS) cloud technology, OACIS can provide travellers with an off-airport, fully mobile check-in service that can be set up at any location. OACIS checks-in the traveller and their luggage, securely transports their bags to the airport and injects them directly into the airport baggage system. Virgin Australia is the first airline to adopt the service and has already piloted it at the Sydney overseas passenger terminal for cruise ships and ocean liners.
_ Fort Lauderdale-Hollywood International Airport signed up for the Amadeus’ Virtual Ramp Control. Thanks to almost 50 closed-circuit, high-definition video and infrared cameras placed around the tarmacs and taxiways, controllers will be able to see the aircraft at all times, in any kind of weather, day and night, with no blind spots. This will allow the airport to direct aircraft to and from airport gates more efficiently and safely, while also reducing delays.
Additional news
_ In September, for the sixth consecutive year, Amadeus was included in the Dow Jones Sustainability Indexes (both the DJSI World and the DJSI Europe). This year, Amadeus was recognised as global leader in the Software & Services industry space.
_ In October, Amadeus launched the whitepaper “Blockchain: harnessing its potential in travel”, identifying four potential use cases for blockchain in travel including simplified and more secure passenger identification, improved baggage tracking, more user-friendly loyalty schemes and simplified payments between travel agencies and airlines. Amadeus also launched the Innovation Partnership Programme, which will support growth stage companies working across six core transformational themes (including blockchain and others) to help them pilot their ideas and potentially bring them to market faster.
Page 11 of 40 amadeus.com
© 2
01
7 A
mad
eus
IT G
rou
p a
nd
its
affi
liate
s an
d s
ub
sid
iari
es
_ Amadeus also released two other whitepapers in the third quarter of 2017. “Managing Every Mile”, commissioned to the London School of Economics, explores how corporations can get a better understanding of their Travel & Expense programmes, unlocking a greater return on investment. The study "Voyage of discovery. Working towards inclusive and accessible travel for all" outlines how greater personalisation, universal standards in the provision of services, more effective communication and increased collaboration between public and private sectors can drive a more accessible travel industry of the future.
2.2 Key ongoing R&D projects As a leading technology provider for the travel industry, Amadeus undertakes significant R&D activities. In the first nine months of 2017, Amadeus devoted 14.8% of its Group revenue to R&D, focused on:
_ Product evolution and portfolio expansion:
Investment on merchandising solutions (including Amadeus Anytime Merchandising, Customer Experience Management, Amadeus Ancillary Services and Amadeus Fare Families), as well as enhanced shopping and booking solutions.
For airlines: solutions related to cloud availability, NDC compliant XML connectivity, our revenue optimisation and financial suites, as well as disruption management solutions.
For travel agencies, meta-search engines and corporations: efforts linked to our cloud-based new-generation selling platform, search engines and our self-booking and travel expense management tool.
For the hospitality industry: investment to develop and implement our new-generation Central Reservation System and developments related to our new-generation Property Management System.
Continued development and evolution of our Airport IT, Payments, Travel Intelligence and Rail IT portfolios.
Resources devoted to enhance distribution capabilities for Hospitality and Rail.
_ Customer implementations and services:
Implementation efforts related to recently completed or future PSS implementations (including Southwest Airlines, Japan Airlines and Malaysia Airlines on Altéa), as well as to our upselling activity (such as Revenue Management, Revenue Accounting, Anytime Merchandising, Passenger Recovery or e-Commerce, amongst others).
Implementation of Distribution solutions for airlines, travel agencies, and corporations, including the expansion of our customer base in merchandising solutions and the migration of corporations to our self-booking and travel expense management tools.
Page 12 of 40 amadeus.com
© 2
01
7 A
mad
eus
IT G
rou
p a
nd
its
affi
liate
s an
d s
ub
sid
iari
es
Works to advance with InterContinental Hotels Group. Together we have initiated the planned Guest Reservation System roll-out in the fourth quarter of 2017, with full deployment expected by late 2018 / early 2019.
Implementation of customers to our Airport IT, Payments and Travel Intelligence portfolio of solutions.
_ Cross-area technology investment:
The completion of the full decommissioning of our TPF-based operating systems and continued shift to next-generation technologies and cloud services, which provides a flexible and powerful framework for massive deployment and distributed operations of very large transactional and data traffic.
The application of new technologies, such as artificial intelligence and machine learning, to our product portfolio.
System performance projects to deliver the highest possible reliability, availability, as well as service and security levels to our customer base.
Projects related to our overall infrastructure and processes to improve efficiency and flexibility.
Page 13 of 40 amadeus.com
© 2
01
7 A
mad
eus
IT G
rou
p a
nd
its
affi
liate
s an
d s
ub
sid
iari
es
3 Presentation of financial information
Page 14 of 40 amadeus.com
© 2
01
7 A
mad
eus
IT G
rou
p a
nd
its
affi
liate
s an
d s
ub
sid
iari
es
The consolidated financial information included in this document has been prepared in accordance with International Financial Reporting Standards (IFRS) and has not been audited.
Certain amounts and figures included in this report have been subject to rounding adjustments. Any discrepancies in any tables between the totals and the sums of the amounts listed are due to rounding.
This document includes unaudited Alternative Performance Measures such as EBITDA, operating income, covenant net financial debt and Adjusted profit, and its corresponding ratios. These Alternative Performance Measures have been prepared in accordance with the Guidelines issued by the European Securities and Markets Authority for regulated information published on or after July 3, 2016.
_ EBITDA corresponds to the operating income less D&A expense. A reconciliation to the financial statements is included in section 5.3.
_ The definition and reconciliation of the operating income is included in the Group income statement in section 5.
_ Covenant net financial debt is defined as current and non-current debt, less cash and cash equivalents, adjusted for non-debt items (such as deferred financing fees, accrued interest and fair value adjustments to an EIB loan). A reconciliation to the financial statements is included in section 5.7.1.
_ Adjusted profit corresponds to reported Profit for the period, after adjusting for: (i) accounting effects derived from PPA exercises and impairment losses, (ii) non-operating exchange gains (losses), and (iii) other non-recurring items, as detailed in section 5.6.1.
We believe that these measures provide useful and relevant information to facilitate a better understanding of the performance of Amadeus and its economic position. These measures are not standard and therefore may not be comparable to those presented by other companies.
When we refer to our competitive position, we take into account our TA air bookings in relation to the TA air booking industry, defined as the total volume of travel agency air bookings processed by the global CRS. It excludes air bookings made directly through in-house airline systems and single country operators (primarily in China, Japan and Russia), which together combined represent an important part of the industry.
Page 15 of 40 amadeus.com
© 2
01
7 A
mad
eus
IT G
rou
p a
nd
its
affi
liate
s an
d s
ub
sid
iari
es
3.1 2016 corporate transactions Navitaire On July 1, 2015, Amadeus announced its agreement to acquire Navitaire, a U.S-based provider of technology and business solutions to the airline industry. Amadeus received all the necessary regulatory approvals and the closing took place on January 26, 2016. The cash consideration in relation to this acquisition amounted to €760.1 million. The acquisition was 100% debt-financed, partially through the drawing of a €500 million bank loan facility executed on July 3, 2015 (though cancelled and replaced in October 2016 by a four-year bond), and partially through €500 million debt securities issued under our Euro Medium Term Note Programme in November 2015 (with maturity in 2021). The results of Navitaire were consolidated into Amadeus’ books from January 26, 2016.
A purchase price allocation exercise in relation to the consolidation of Navitaire into Amadeus’ books was carried out in the fourth quarter of 2016.
Meeting Intelligence business On July 21, 2016, Amadeus Hospitality US (formerly Newmarket International) divested its non-core Meeting Intelligence business. The total net consideration of the transaction was €11.3 million.
3.2 2017 corporate transactions i:FAO On January 13, 2017, Amadeus announced the closing of the acceptance period for the tender offer it had launched on October 21, 2016 for the outstanding i:FAO shares Amadeus did not already own (29.74%). i:FAO was acquired on June 23, 2014, indirectly through Amadeus Corporate Business AG and, as of December 31, 2016 the Group owned 70.72% of the shares of i:FAO. As of September 30, 2017, Amadeus’ shareholding in i:FAO is 88.89%. The total amount paid for the 963,439 shares acquired in the past months was €28.9 million (€30.0 per share). i:FAO was delisted from the Frankfurt Stock Exchange on December 23, 2016.
Page 16 of 40 amadeus.com
© 2
01
7 A
mad
eus
IT G
rou
p a
nd
its
affi
liate
s an
d s
ub
sid
iari
es
4 Main financial risks and hedging policy
Page 17 of 40 amadeus.com
© 2
01
7 A
mad
eus
IT G
rou
p a
nd
its
affi
liate
s an
d s
ub
sid
iari
es
4.1 Foreign exchange rate risk Our reporting currency is the Euro. However, as a result of Amadeus’ global activity and presence, part of our results are generated in currencies different from the Euro and therefore are impacted by foreign exchange fluctuations. Similarly, part of our cash inflows and outflows are denominated in non-Euro currencies.
Our revenue is almost entirely generated either in Euro or in US Dollar (the latter representing 30%-40% of our total revenue). Revenue generated in currencies other than the Euro or US Dollar is negligible.
In turn, 45%-55% of our net operating costs5 are denominated in many currencies different from the Euro, including the US Dollar which represents 25%-35% of our operating costs. The rest of the foreign currency operating expenses are denominated in a variety of currencies, GBP, AUD, INR, SGD and THB being the most significant. A number of these currencies may fluctuate vs. the Euro similarly to the US Dollar - Euro fluctuations, and the degree of this correlation may vary with time.
Amadeus’ target is to reduce the volatility generated by foreign exchange fluctuations on its non-Euro denominated net cash flows. Our hedging strategy is as follows:
_ To manage our exposure to the US Dollar, we have a natural hedge to our net operating cash flow generated in US Dollar through, among others, payments of US Dollar-denominated debt (when applicable) and taxes paid in the U.S. We enter into derivative arrangements when this natural hedge is not sufficient to cover our outstanding exposure.
_ We also hedge a number of currencies, such as the GBP, AUD, INR and SEK, for which we enter into foreign exchange derivatives with banks.
When the hedges in place qualify for hedge accounting under IFRS, profits and losses are recognised within the revenue caption. Our hedging arrangements typically qualify for hedge accounting under IFRS.
During the third quarter of 2017, the US Dollar, which had appreciated vs. the Euro during the first half of the year (in comparison to the same period of 2016), depreciated vs. the Euro, negatively impacting revenue and largely offsetting the positive foreign exchange effects that had impacted revenue during the first half. As a result, in the first nine months of 2017 revenue was impacted by small positive foreign exchange effects.
In turn, operating costs6 were positively impacted by foreign exchange effects (both from the US Dollar depreciation and from other currencies’ depreciation vs. the Euro) in the third quarter of 2017, offsetting the negative impact on costs reported in the first half of the year.
5 Including Cost of revenue, Personnel expenses and Other operating expenses, net of capitalisations. Excludes Depreciation and
amortisation.
Page 18 of 40 amadeus.com
© 2
01
7 A
mad
eus
IT G
rou
p a
nd
its
affi
liate
s an
d s
ub
sid
iari
es
As a consequence of the above, EBITDA and EBITDA margin were positively impacted by foreign exchange effects both in the third quarter and in the nine-month period in 2017.
Excluding foreign exchange effects, both revenue and EBITDA increased at a high single-digit growth rate and EBITDA margin expanded, in the third quarter of 2017 and in the first nine months of 2017.
4.2 Interest rate risk Our target is to reduce volatility in net interest flows. In order to achieve this objective, Amadeus may enter into interest rate hedging agreements (interest rate swaps, caps, collars) to cover the floating rate debt.
At September 30, 2017, 11.6% of our total covenant financial debt (related to the European Commercial Paper Programme) was subject to floating interest rates, indexed to the EURIBOR. As of this date no interest rate hedges were in place.
4.3 Own shares price evolution risk Amadeus has three different staff remuneration schemes which are settled with Amadeus’ shares.
According to the rules of these plans, when they mature all beneficiaries will receive a number of Amadeus shares which for the outstanding plans amount to (depending on the evolution of certain performance conditions) between a minimum of 282,000 shares and a maximum of 1,737,000 shares, approximately. It is Amadeus’ intention to make use of its treasury shares to settle these plans at their maturity.
Page 19 of 40 amadeus.com
© 2
01
7 A
mad
eus
IT G
rou
p a
nd
its
affi
liate
s an
d s
ub
sid
iari
es
5 Consolidated financial statements
Page 20 of 40 amadeus.com
© 2
01
7 A
mad
eus
IT G
rou
p a
nd
its
affi
liate
s an
d s
ub
sid
iari
es
Group income statement
Income Statement (figures in million euros) Jul-Sep
2017 Jul-Sep 2016
% Change
Jan-Sep 2017
Jan-Sep 2016
% Change
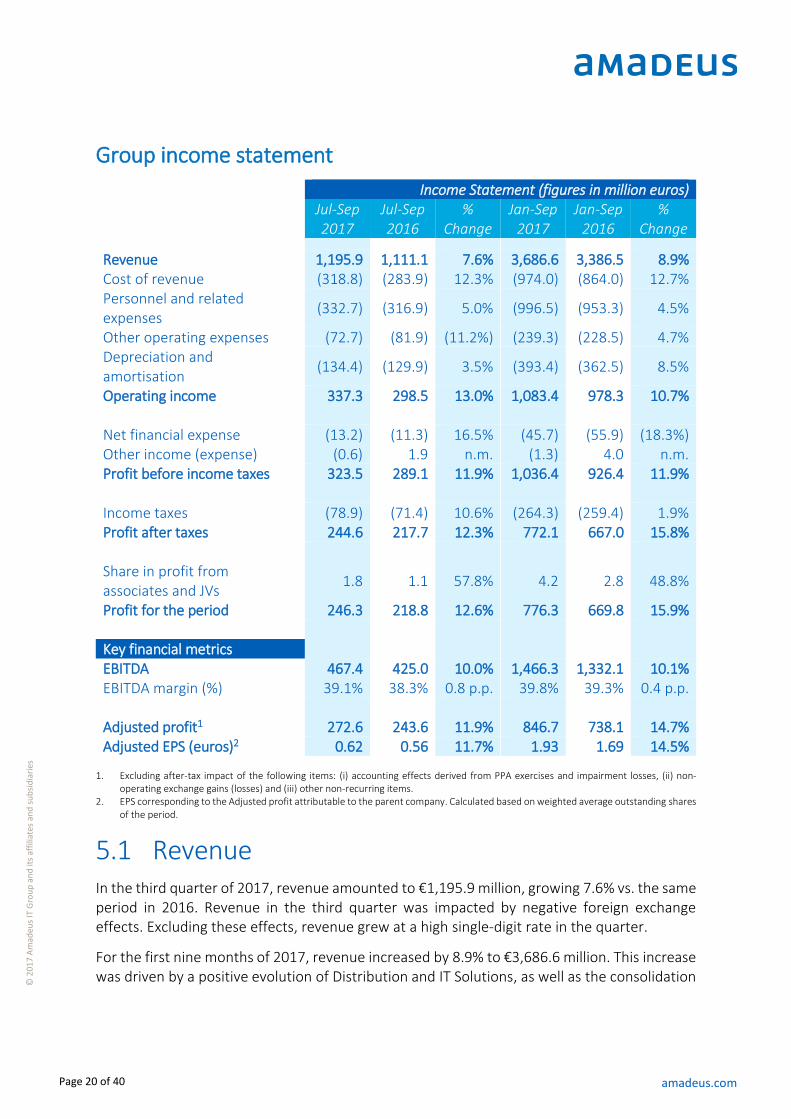
Revenue 1,195.9 1,111.1 7.6% 3,686.6 3,386.5 8.9% Cost of revenue (318.8) (283.9) 12.3% (974.0) (864.0) 12.7% Personnel and related expenses
(332.7) (316.9) 5.0% (996.5) (953.3) 4.5%
Other operating expenses (72.7) (81.9) (11.2%) (239.3) (228.5) 4.7% Depreciation and amortisation
(134.4) (129.9) 3.5% (393.4) (362.5) 8.5%
Operating income 337.3 298.5 13.0% 1,083.4 978.3 10.7% Net financial expense (13.2) (11.3) 16.5% (45.7) (55.9) (18.3%) Other income (expense) (0.6) 1.9 n.m. (1.3) 4.0 n.m. Profit before income taxes 323.5 289.1 11.9% 1,036.4 926.4 11.9% Income taxes (78.9) (71.4) 10.6% (264.3) (259.4) 1.9% Profit after taxes 244.6 217.7 12.3% 772.1 667.0 15.8% Share in profit from associates and JVs
1.8 1.1 57.8% 4.2 2.8 48.8%
Profit for the period 246.3 218.8 12.6% 776.3 669.8 15.9% Key financial metrics EBITDA 467.4 425.0 10.0% 1,466.3 1,332.1 10.1% EBITDA margin (%) 39.1% 38.3% 0.8 p.p. 39.8% 39.3% 0.4 p.p. Adjusted profit1 272.6 243.6 11.9% 846.7 738.1 14.7% Adjusted EPS (euros)2 0.62 0.56 11.7% 1.93 1.69 14.5%
1. Excluding after-tax impact of the following items: (i) accounting effects derived from PPA exercises and impairment losses, (ii) non-
operating exchange gains (losses) and (iii) other non-recurring items. 2. EPS corresponding to the Adjusted profit attributable to the parent company. Calculated based on weighted average outstanding shares
of the period.
5.1 Revenue In the third quarter of 2017, revenue amounted to €1,195.9 million, growing 7.6% vs. the same period in 2016. Revenue in the third quarter was impacted by negative foreign exchange effects. Excluding these effects, revenue grew at a high single-digit rate in the quarter.
For the first nine months of 2017, revenue increased by 8.9% to €3,686.6 million. This increase was driven by a positive evolution of Distribution and IT Solutions, as well as the consolidation
Page 21 of 40 amadeus.com
© 2
01
7 A
mad
eus
IT G
rou
p a
nd
its
affi
liate
s an
d s
ub
sid
iari
es
of Navitaire (since January 26, 2016), a small positive foreign exchange impact and a negative 2016 leap-year effect. Overall, revenue growth was a combination of:
_ An increase of 6.7% in Distribution in the third quarter of 2017, leading to 7.3% growth for the first nine months of the year.
_ An increase of 9.2% in IT Solutions in the third quarter of 2017 and 11.8% in the nine-month period.
See sections 5.1.2. and 5.2.2. for more detail on revenue growth within Distribution and IT Solutions.
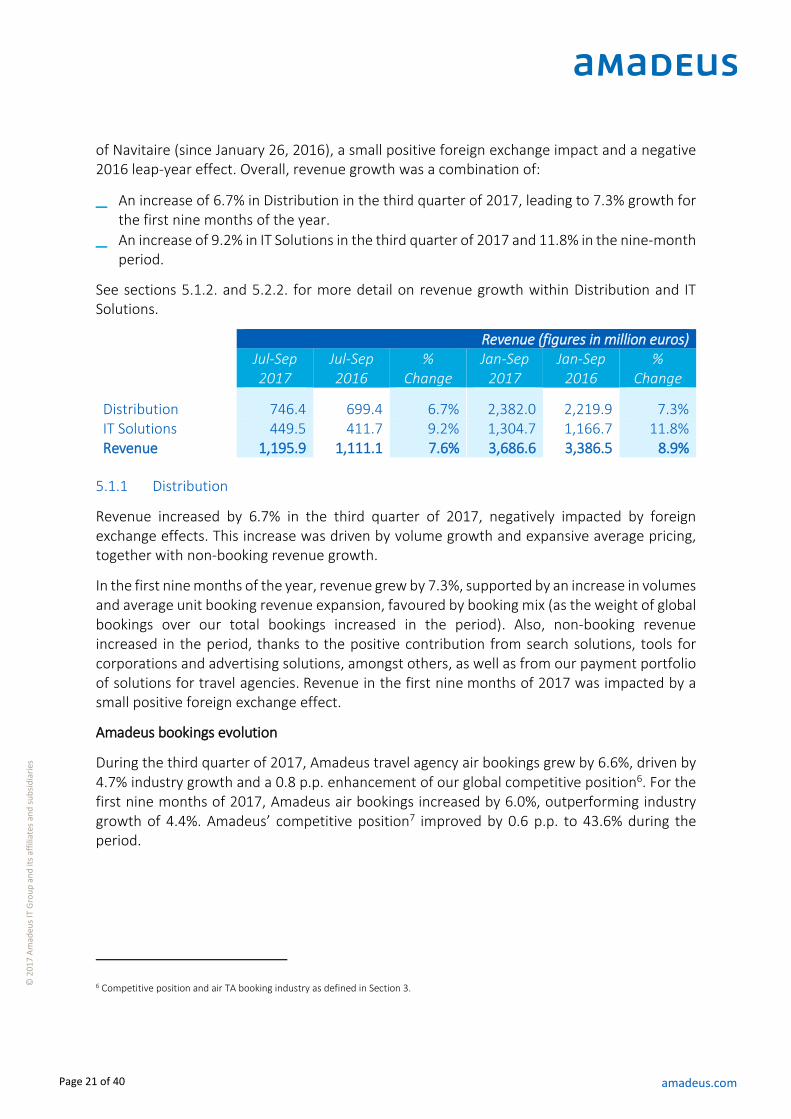
Revenue (figures in million euros) Jul-Sep
2017 Jul-Sep 2016
% Change
Jan-Sep 2017
Jan-Sep 2016
% Change
Distribution 746.4 699.4 6.7% 2,382.0 2,219.9 7.3% IT Solutions 449.5 411.7 9.2% 1,304.7 1,166.7 11.8% Revenue 1,195.9 1,111.1 7.6% 3,686.6 3,386.5 8.9%
5.1.1 Distribution
Revenue increased by 6.7% in the third quarter of 2017, negatively impacted by foreign exchange effects. This increase was driven by volume growth and expansive average pricing, together with non-booking revenue growth.
In the first nine months of the year, revenue grew by 7.3%, supported by an increase in volumes and average unit booking revenue expansion, favoured by booking mix (as the weight of global bookings over our total bookings increased in the period). Also, non-booking revenue increased in the period, thanks to the positive contribution from search solutions, tools for corporations and advertising solutions, amongst others, as well as from our payment portfolio of solutions for travel agencies. Revenue in the first nine months of 2017 was impacted by a small positive foreign exchange effect.
Amadeus bookings evolution
During the third quarter of 2017, Amadeus travel agency air bookings grew by 6.6%, driven by 4.7% industry growth and a 0.8 p.p. enhancement of our global competitive position6. For the first nine months of 2017, Amadeus air bookings increased by 6.0%, outperforming industry growth of 4.4%. Amadeus’ competitive position7 improved by 0.6 p.p. to 43.6% during the period.
6 Competitive position and air TA booking industry as defined in Section 3.
Page 22 of 40 amadeus.com
© 2
01
7 A
mad
eus
IT G
rou
p a
nd
its
affi
liate
s an
d s
ub
sid
iari
es
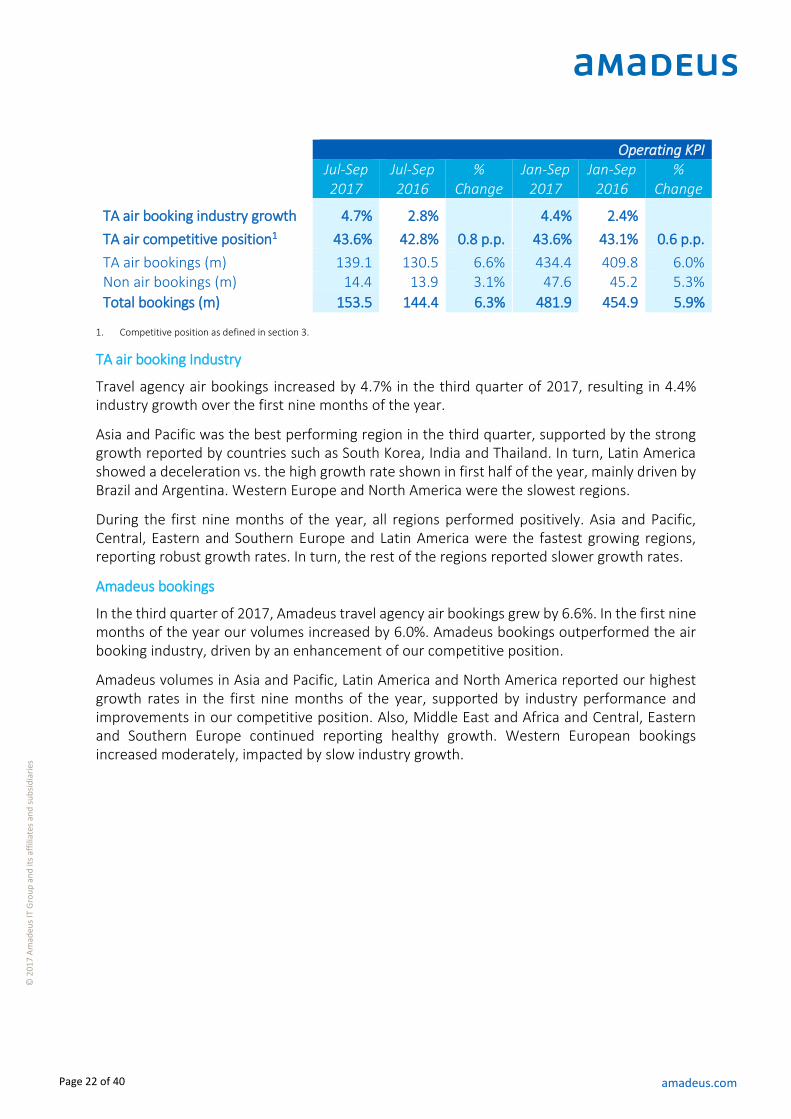
Operating KPI
Jul-Sep 2017
Jul-Sep 2016
% Change
Jan-Sep 2017
Jan-Sep 2016
% Change
TA air booking industry growth 4.7% 2.8% 4.4% 2.4%
TA air competitive position1 43.6% 42.8% 0.8 p.p. 43.6% 43.1% 0.6 p.p.
TA air bookings (m) 139.1 130.5 6.6% 434.4 409.8 6.0% Non air bookings (m) 14.4 13.9 3.1% 47.6 45.2 5.3%
Total bookings (m) 153.5 144.4 6.3% 481.9 454.9 5.9%
1. Competitive position as defined in section 3.
TA air booking Industry
Travel agency air bookings increased by 4.7% in the third quarter of 2017, resulting in 4.4% industry growth over the first nine months of the year.
Asia and Pacific was the best performing region in the third quarter, supported by the strong growth reported by countries such as South Korea, India and Thailand. In turn, Latin America showed a deceleration vs. the high growth rate shown in first half of the year, mainly driven by Brazil and Argentina. Western Europe and North America were the slowest regions.
During the first nine months of the year, all regions performed positively. Asia and Pacific, Central, Eastern and Southern Europe and Latin America were the fastest growing regions, reporting robust growth rates. In turn, the rest of the regions reported slower growth rates.
Amadeus bookings
In the third quarter of 2017, Amadeus travel agency air bookings grew by 6.6%. In the first nine months of the year our volumes increased by 6.0%. Amadeus bookings outperformed the air booking industry, driven by an enhancement of our competitive position.
Amadeus volumes in Asia and Pacific, Latin America and North America reported our highest growth rates in the first nine months of the year, supported by industry performance and improvements in our competitive position. Also, Middle East and Africa and Central, Eastern and Southern Europe continued reporting healthy growth. Western European bookings increased moderately, impacted by slow industry growth.
Page 23 of 40 amadeus.com
© 2
01
7 A
mad
eus
IT G
rou
p a
nd
its
affi
liate
s an
d s
ub
sid
iari
es
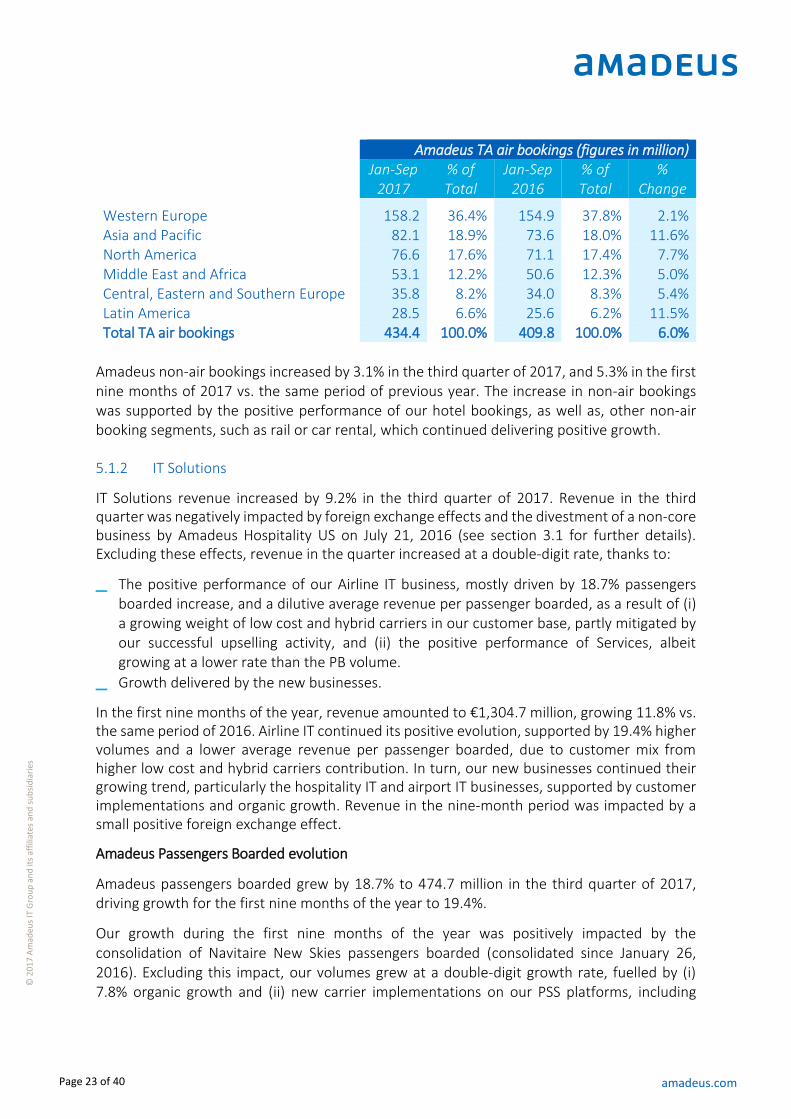
Amadeus TA air bookings (figures in million)
Jan-Sep 2017
% of Total
Jan-Sep 2016
% of Total
% Change
Western Europe 158.2 36.4% 154.9 37.8% 2.1% Asia and Pacific 82.1 18.9% 73.6 18.0% 11.6% North America 76.6 17.6% 71.1 17.4% 7.7% Middle East and Africa 53.1 12.2% 50.6 12.3% 5.0% Central, Eastern and Southern Europe 35.8 8.2% 34.0 8.3% 5.4% Latin America 28.5 6.6% 25.6 6.2% 11.5% Total TA air bookings 434.4 100.0% 409.8 100.0% 6.0%
Amadeus non-air bookings increased by 3.1% in the third quarter of 2017, and 5.3% in the first nine months of 2017 vs. the same period of previous year. The increase in non-air bookings was supported by the positive performance of our hotel bookings, as well as, other non-air booking segments, such as rail or car rental, which continued delivering positive growth.
5.1.2 IT Solutions
IT Solutions revenue increased by 9.2% in the third quarter of 2017. Revenue in the third quarter was negatively impacted by foreign exchange effects and the divestment of a non-core business by Amadeus Hospitality US on July 21, 2016 (see section 3.1 for further details). Excluding these effects, revenue in the quarter increased at a double-digit rate, thanks to:
_ The positive performance of our Airline IT business, mostly driven by 18.7% passengers boarded increase, and a dilutive average revenue per passenger boarded, as a result of (i) a growing weight of low cost and hybrid carriers in our customer base, partly mitigated by our successful upselling activity, and (ii) the positive performance of Services, albeit growing at a lower rate than the PB volume.
_ Growth delivered by the new businesses.
In the first nine months of the year, revenue amounted to €1,304.7 million, growing 11.8% vs. the same period of 2016. Airline IT continued its positive evolution, supported by 19.4% higher volumes and a lower average revenue per passenger boarded, due to customer mix from higher low cost and hybrid carriers contribution. In turn, our new businesses continued their growing trend, particularly the hospitality IT and airport IT businesses, supported by customer implementations and organic growth. Revenue in the nine-month period was impacted by a small positive foreign exchange effect.
Amadeus Passengers Boarded evolution
Amadeus passengers boarded grew by 18.7% to 474.7 million in the third quarter of 2017, driving growth for the first nine months of the year to 19.4%.
Our growth during the first nine months of the year was positively impacted by the consolidation of Navitaire New Skies passengers boarded (consolidated since January 26, 2016). Excluding this impact, our volumes grew at a double-digit growth rate, fuelled by (i) 7.8% organic growth and (ii) new carrier implementations on our PSS platforms, including
Page 24 of 40 amadeus.com
© 2
01
7 A
mad
eus
IT G
rou
p a
nd
its
affi
liate
s an
d s
ub
sid
iari
es
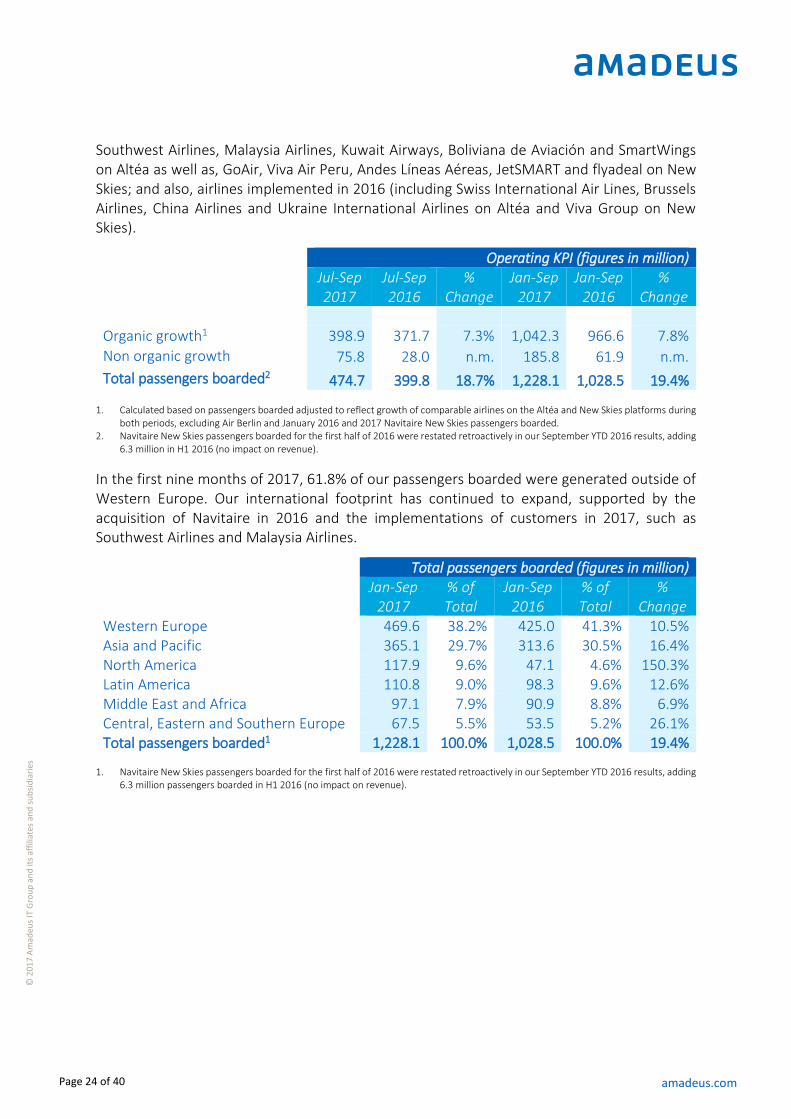
Southwest Airlines, Malaysia Airlines, Kuwait Airways, Boliviana de Aviación and SmartWings on Altéa as well as, GoAir, Viva Air Peru, Andes Líneas Aéreas, JetSMART and flyadeal on New Skies; and also, airlines implemented in 2016 (including Swiss International Air Lines, Brussels Airlines, China Airlines and Ukraine International Airlines on Altéa and Viva Group on New Skies).
Operating KPI (figures in million)
Jul-Sep 2017
Jul-Sep 2016
% Change
Jan-Sep 2017
Jan-Sep 2016
% Change
Organic growth1 398.9 371.7 7.3% 1,042.3 966.6 7.8%
Non organic growth 75.8 28.0 n.m. 185.8 61.9 n.m.
Total passengers boarded2 474.7 399.8 18.7% 1,228.1 1,028.5 19.4%
1. Calculated based on passengers boarded adjusted to reflect growth of comparable airlines on the Altéa and New Skies platforms during both periods, excluding Air Berlin and January 2016 and 2017 Navitaire New Skies passengers boarded.
2. Navitaire New Skies passengers boarded for the first half of 2016 were restated retroactively in our September YTD 2016 results, adding 6.3 million in H1 2016 (no impact on revenue).
In the first nine months of 2017, 61.8% of our passengers boarded were generated outside of Western Europe. Our international footprint has continued to expand, supported by the acquisition of Navitaire in 2016 and the implementations of customers in 2017, such as Southwest Airlines and Malaysia Airlines.
Total passengers boarded (figures in million)
Jan-Sep 2017
% of Total
Jan-Sep 2016
% of Total
% Change
Western Europe 469.6 38.2% 425.0 41.3% 10.5% Asia and Pacific 365.1 29.7% 313.6 30.5% 16.4% North America 117.9 9.6% 47.1 4.6% 150.3% Latin America 110.8 9.0% 98.3 9.6% 12.6% Middle East and Africa 97.1 7.9% 90.9 8.8% 6.9% Central, Eastern and Southern Europe 67.5 5.5% 53.5 5.2% 26.1% Total passengers boarded1 1,228.1 100.0% 1,028.5 100.0% 19.4%
1. Navitaire New Skies passengers boarded for the first half of 2016 were restated retroactively in our September YTD 2016 results, adding
6.3 million passengers boarded in H1 2016 (no impact on revenue).
Page 25 of 40 amadeus.com
© 2
01
7 A
mad
eus
IT G
rou
p a
nd
its
affi
liate
s an
d s
ub
sid
iari
es
5.2 Group operating costs
5.2.1 Cost of revenue
These costs are mainly related to: (i) incentive fees paid to travel agencies, (ii) distribution fees paid to local commercial organisations which act as a local distributor (mainly in the Middle East, North Africa, India, and South Korea) and (iii) data communication expenses related to the maintenance of our computer network, including connection charges.
Cost of revenue grew by 12.3% in the third quarter of 2017, or 12.7% to €974.0 million in the first nine months of 2017 vs. the same period of previous year. Cost of revenue in the first nine months of the year was negatively impacted by foreign exchange effects. The increase in the nine-month period was driven by higher travel agency air bookings (+6.0%) and a higher unitary distribution cost, resulting from competitive pressure and a negative regional and customer mix impact on incentives paid to travel agencies. Also, data communications costs increased, as a consequence of higher transaction volumes driven by business expansion.
5.2.2 Personnel and related expenses and other operating expenses
A large number of Amadeus’ employees are software engineers. Amadeus also hires contractors to support its development activity, complementing permanent staff. The overall ratio of permanent staff vs. contractors devoted to R&D may fluctuate depending on business needs and project mix, therefore impacting the evolution of both “Personnel expenses” and “Other operating expenses” captions in our income statement.
Our combined operating expenses cost line, including both Personnel expenses and Other operating expenses, increased by 1.7% in the third quarter of 2017 vs. prior year, positively impacted by foreign exchange effects. In the first nine months of 2017, operating costs increased by 4.6%. Growth in fixed operating expenses in the first nine months of the year resulted from:
_ Higher FTEs (4% increase, including both permanent staff and contractors) and consultancy costs dedicated to (i) R&D investment in product evolution and portfolio expansion, including the progress achieved in our new businesses (see further details in sections 2.2 and 5.8.2), and (ii) the expansion of our corporate, technical and commercial teams to support our business growth and to better serve our customers, both centrally and locally.
_ Global salary and variable remuneration reviews, offset by efficiencies reached due to a positive country mix.
_ Growth in non-personnel related expenses, affecting particularly computing expenses (as Navitaire is hosted externally).
_ An increase in the overall capitalisation ratio, impacted by project mix.
_ The Navitaire consolidation since January 26, 2016.
_ A positive foreign exchange impact.
Page 26 of 40 amadeus.com
© 2
01
7 A
mad
eus
IT G
rou
p a
nd
its
affi
liate
s an
d s
ub
sid
iari
es
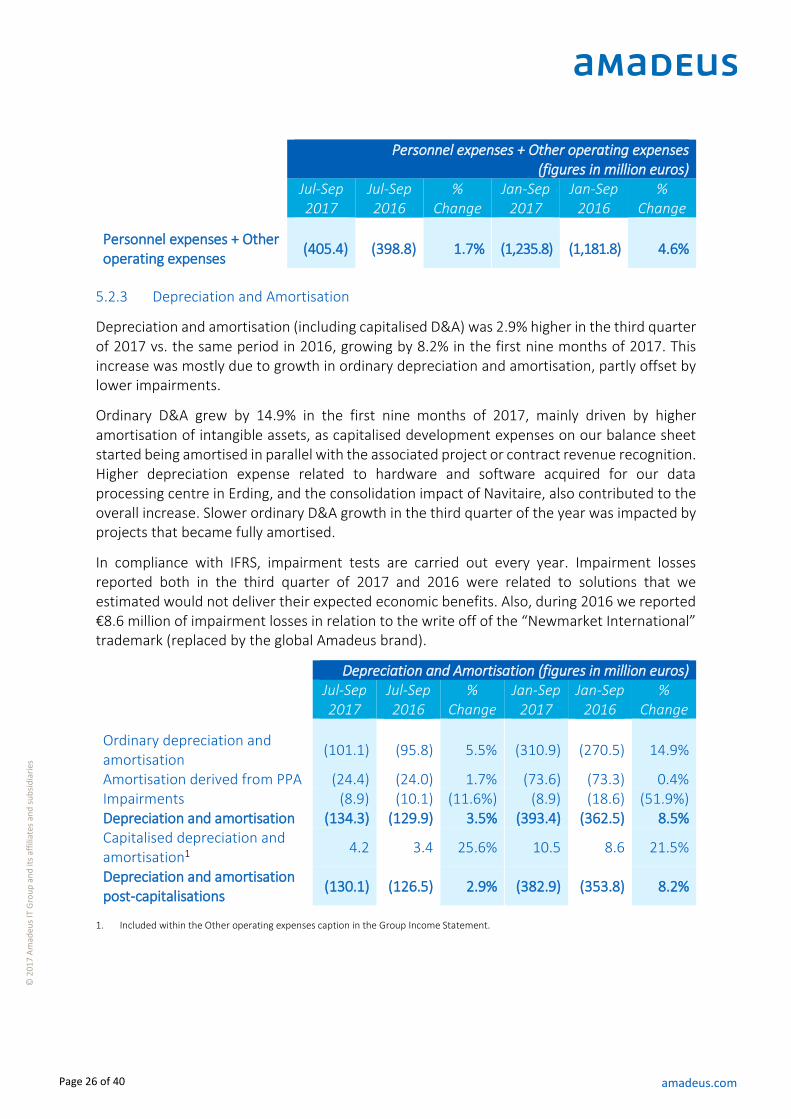
Personnel expenses + Other operating expenses
(figures in million euros)
Jul-Sep 2017
Jul-Sep 2016
% Change
Jan-Sep 2017
Jan-Sep 2016
% Change
Personnel expenses + Other operating expenses
(405.4) (398.8) 1.7% (1,235.8) (1,181.8) 4.6%
5.2.3 Depreciation and Amortisation
Depreciation and amortisation (including capitalised D&A) was 2.9% higher in the third quarter of 2017 vs. the same period in 2016, growing by 8.2% in the first nine months of 2017. This increase was mostly due to growth in ordinary depreciation and amortisation, partly offset by lower impairments.
Ordinary D&A grew by 14.9% in the first nine months of 2017, mainly driven by higher amortisation of intangible assets, as capitalised development expenses on our balance sheet started being amortised in parallel with the associated project or contract revenue recognition. Higher depreciation expense related to hardware and software acquired for our data processing centre in Erding, and the consolidation impact of Navitaire, also contributed to the overall increase. Slower ordinary D&A growth in the third quarter of the year was impacted by projects that became fully amortised.
In compliance with IFRS, impairment tests are carried out every year. Impairment losses reported both in the third quarter of 2017 and 2016 were related to solutions that we estimated would not deliver their expected economic benefits. Also, during 2016 we reported €8.6 million of impairment losses in relation to the write off of the “Newmarket International” trademark (replaced by the global Amadeus brand).
Depreciation and Amortisation (figures in million euros)
Jul-Sep 2017
Jul-Sep 2016
% Change
Jan-Sep 2017
Jan-Sep 2016
% Change
Ordinary depreciation and amortisation
(101.1) (95.8) 5.5% (310.9) (270.5) 14.9%
Amortisation derived from PPA (24.4) (24.0) 1.7% (73.6) (73.3) 0.4% Impairments (8.9) (10.1) (11.6%) (8.9) (18.6) (51.9%) Depreciation and amortisation (134.3) (129.9) 3.5% (393.4) (362.5) 8.5% Capitalised depreciation and amortisation1
4.2 3.4 25.6% 10.5 8.6 21.5%
Depreciation and amortisation post-capitalisations
(130.1) (126.5) 2.9% (382.9) (353.8) 8.2%
1. Included within the Other operating expenses caption in the Group Income Statement.
Page 27 of 40 amadeus.com
© 2
01
7 A
mad
eus
IT G
rou
p a
nd
its
affi
liate
s an
d s
ub
sid
iari
es
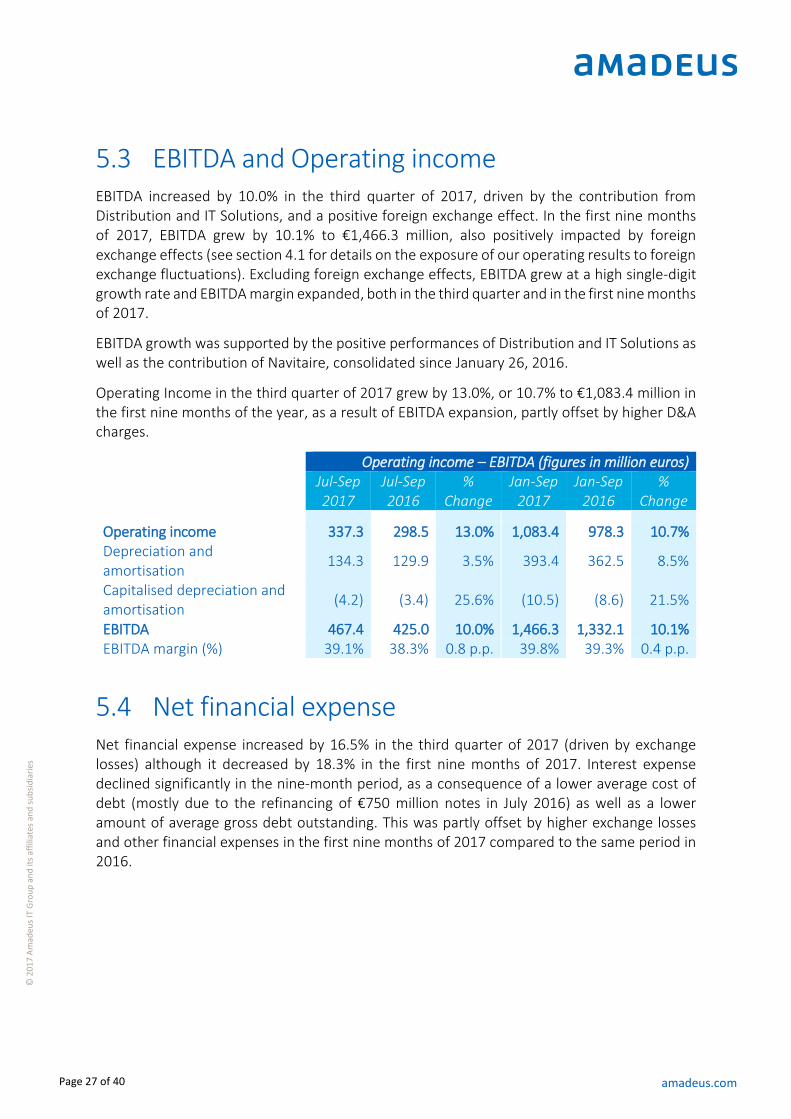
5.3 EBITDA and Operating income EBITDA increased by 10.0% in the third quarter of 2017, driven by the contribution from Distribution and IT Solutions, and a positive foreign exchange effect. In the first nine months of 2017, EBITDA grew by 10.1% to €1,466.3 million, also positively impacted by foreign exchange effects (see section 4.1 for details on the exposure of our operating results to foreign exchange fluctuations). Excluding foreign exchange effects, EBITDA grew at a high single-digit growth rate and EBITDA margin expanded, both in the third quarter and in the first nine months of 2017.
EBITDA growth was supported by the positive performances of Distribution and IT Solutions as well as the contribution of Navitaire, consolidated since January 26, 2016.
Operating Income in the third quarter of 2017 grew by 13.0%, or 10.7% to €1,083.4 million in the first nine months of the year, as a result of EBITDA expansion, partly offset by higher D&A charges.
Operating income – EBITDA (figures in million euros)
Jul-Sep 2017
Jul-Sep 2016
% Change
Jan-Sep 2017
Jan-Sep 2016
% Change
Operating income 337.3 298.5 13.0% 1,083.4 978.3 10.7% Depreciation and amortisation
134.3 129.9 3.5% 393.4 362.5 8.5%
Capitalised depreciation and amortisation
(4.2) (3.4) 25.6% (10.5) (8.6) 21.5%
EBITDA 467.4 425.0 10.0% 1,466.3 1,332.1 10.1% EBITDA margin (%) 39.1% 38.3% 0.8 p.p. 39.8% 39.3% 0.4 p.p.
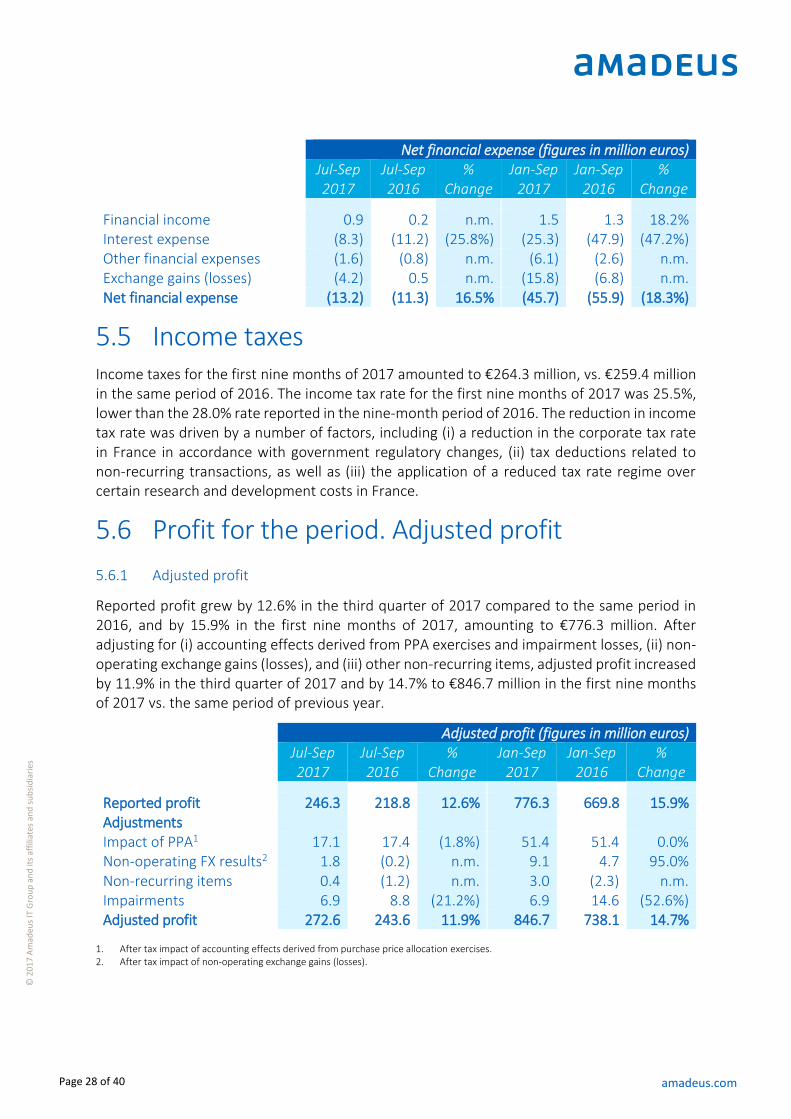
5.4 Net financial expense Net financial expense increased by 16.5% in the third quarter of 2017 (driven by exchange losses) although it decreased by 18.3% in the first nine months of 2017. Interest expense declined significantly in the nine-month period, as a consequence of a lower average cost of debt (mostly due to the refinancing of €750 million notes in July 2016) as well as a lower amount of average gross debt outstanding. This was partly offset by higher exchange losses and other financial expenses in the first nine months of 2017 compared to the same period in 2016.
Page 28 of 40 amadeus.com
© 2
01
7 A
mad
eus
IT G
rou
p a
nd
its
affi
liate
s an
d s
ub
sid
iari
es
Net financial expense (figures in million euros)
Jul-Sep 2017
Jul-Sep 2016
% Change
Jan-Sep 2017
Jan-Sep 2016
% Change
Financial income 0.9 0.2 n.m. 1.5 1.3 18.2% Interest expense (8.3) (11.2) (25.8%) (25.3) (47.9) (47.2%) Other financial expenses (1.6) (0.8) n.m. (6.1) (2.6) n.m. Exchange gains (losses) (4.2) 0.5 n.m. (15.8) (6.8) n.m. Net financial expense (13.2) (11.3) 16.5% (45.7) (55.9) (18.3%)
5.5 Income taxes Income taxes for the first nine months of 2017 amounted to €264.3 million, vs. €259.4 million in the same period of 2016. The income tax rate for the first nine months of 2017 was 25.5%, lower than the 28.0% rate reported in the nine-month period of 2016. The reduction in income tax rate was driven by a number of factors, including (i) a reduction in the corporate tax rate in France in accordance with government regulatory changes, (ii) tax deductions related to non-recurring transactions, as well as (iii) the application of a reduced tax rate regime over certain research and development costs in France.
5.6 Profit for the period. Adjusted profit
5.6.1 Adjusted profit
Reported profit grew by 12.6% in the third quarter of 2017 compared to the same period in 2016, and by 15.9% in the first nine months of 2017, amounting to €776.3 million. After adjusting for (i) accounting effects derived from PPA exercises and impairment losses, (ii) non-operating exchange gains (losses), and (iii) other non-recurring items, adjusted profit increased by 11.9% in the third quarter of 2017 and by 14.7% to €846.7 million in the first nine months of 2017 vs. the same period of previous year.
Adjusted profit (figures in million euros)
Jul-Sep 2017
Jul-Sep 2016
% Change
Jan-Sep 2017
Jan-Sep 2016
% Change
Reported profit 246.3 218.8 12.6% 776.3 669.8 15.9% Adjustments Impact of PPA1 17.1 17.4 (1.8%) 51.4 51.4 0.0% Non-operating FX results2 1.8 (0.2) n.m. 9.1 4.7 95.0% Non-recurring items 0.4 (1.2) n.m. 3.0 (2.3) n.m. Impairments 6.9 8.8 (21.2%) 6.9 14.6 (52.6%) Adjusted profit 272.6 243.6 11.9% 846.7 738.1 14.7%
1. After tax impact of accounting effects derived from purchase price allocation exercises. 2. After tax impact of non-operating exchange gains (losses).
Page 29 of 40 amadeus.com
© 2
01
7 A
mad
eus
IT G
rou
p a
nd
its
affi
liate
s an
d s
ub
sid
iari
es
5.6.2 Earnings per share (EPS)
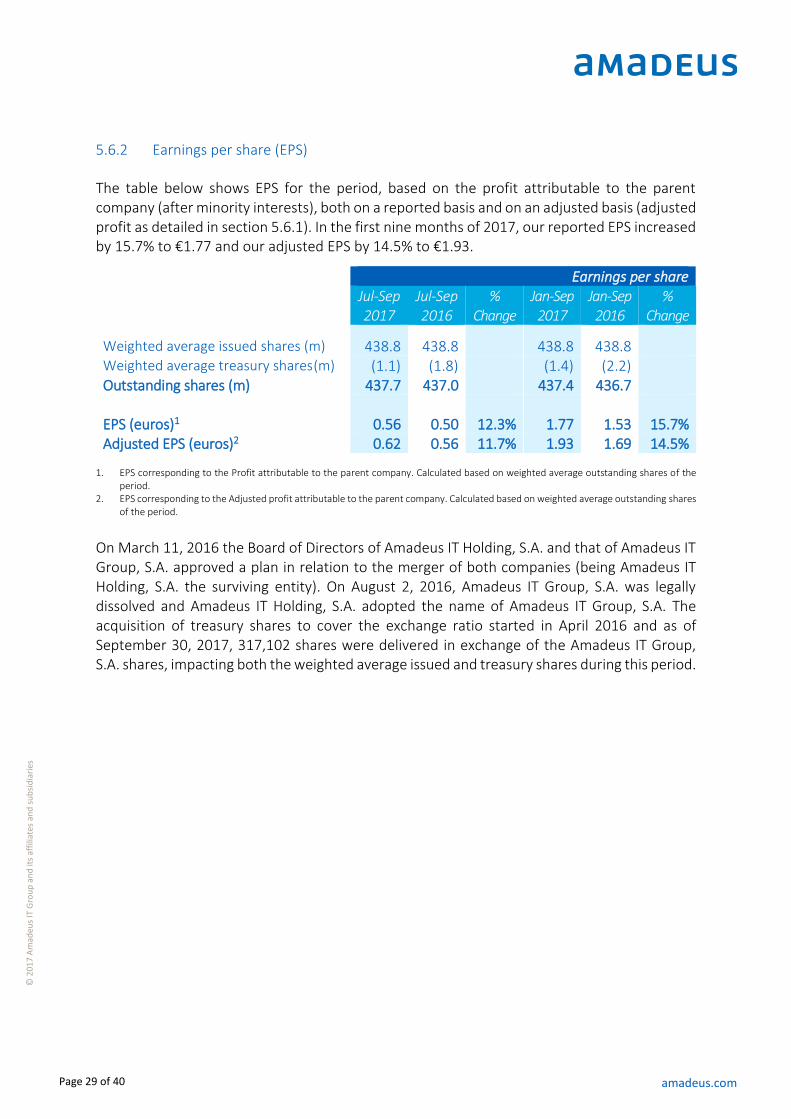
The table below shows EPS for the period, based on the profit attributable to the parent company (after minority interests), both on a reported basis and on an adjusted basis (adjusted profit as detailed in section 5.6.1). In the first nine months of 2017, our reported EPS increased by 15.7% to €1.77 and our adjusted EPS by 14.5% to €1.93.
Earnings per share
Jul-Sep 2017
Jul-Sep 2016
% Change
Jan-Sep 2017
Jan-Sep 2016
% Change
Weighted average issued shares (m) 438.8 438.8 438.8 438.8 Weighted average treasury shares (m) (1.1) (1.8) (1.4) (2.2) Outstanding shares (m) 437.7 437.0 437.4 436.7 EPS (euros)1 0.56 0.50 12.3% 1.77 1.53 15.7% Adjusted EPS (euros)2 0.62 0.56 11.7% 1.93 1.69 14.5%
1. EPS corresponding to the Profit attributable to the parent company. Calculated based on weighted average outstanding shares of the
period. 2. EPS corresponding to the Adjusted profit attributable to the parent company. Calculated based on weighted average outstanding shares
of the period.
On March 11, 2016 the Board of Directors of Amadeus IT Holding, S.A. and that of Amadeus IT Group, S.A. approved a plan in relation to the merger of both companies (being Amadeus IT Holding, S.A. the surviving entity). On August 2, 2016, Amadeus IT Group, S.A. was legally dissolved and Amadeus IT Holding, S.A. adopted the name of Amadeus IT Group, S.A. The acquisition of treasury shares to cover the exchange ratio started in April 2016 and as of September 30, 2017, 317,102 shares were delivered in exchange of the Amadeus IT Group, S.A. shares, impacting both the weighted average issued and treasury shares during this period.
Page 30 of 40 amadeus.com
© 2
01
7 A
mad
eus
IT G
rou
p a
nd
its
affi
liate
s an
d s
ub
sid
iari
es
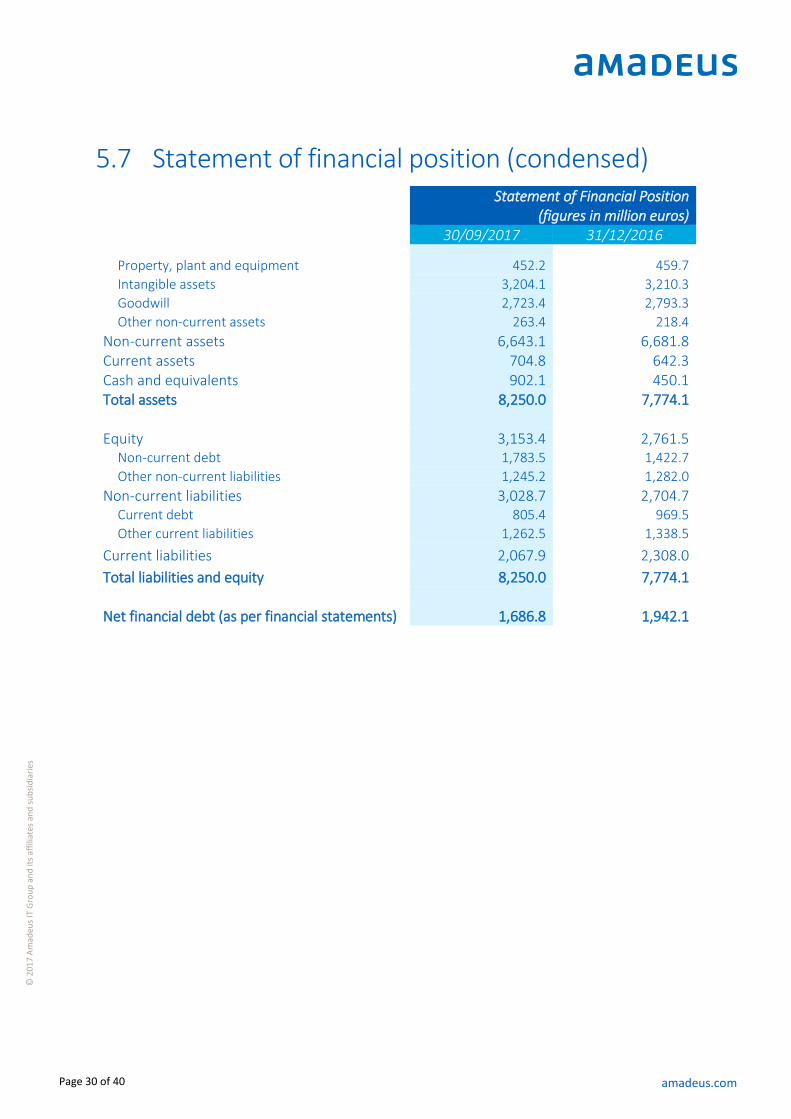
5.7 Statement of financial position (condensed)
Statement of Financial Position
(figures in million euros) 30/09/2017 31/12/2016
Property, plant and equipment 452.2 459.7
Intangible assets 3,204.1 3,210.3
Goodwill 2,723.4 2,793.3
Other non-current assets 263.4 218.4
Non-current assets 6,643.1 6,681.8 Current assets 704.8 642.3 Cash and equivalents 902.1 450.1 Total assets 8,250.0 7,774.1 Equity 3,153.4 2,761.5
Non-current debt 1,783.5 1,422.7
Other non-current liabilities 1,245.2 1,282.0
Non-current liabilities 3,028.7 2,704.7 Current debt 805.4 969.5
Other current liabilities 1,262.5 1,338.5
Current liabilities 2,067.9 2,308.0
Total liabilities and equity 8,250.0 7,774.1 Net financial debt (as per financial statements) 1,686.8 1,942.1
Page 31 of 40 amadeus.com
© 2
01
7 A
mad
eus
IT G
rou
p a
nd
its
affi
liate
s an
d s
ub
sid
iari
es
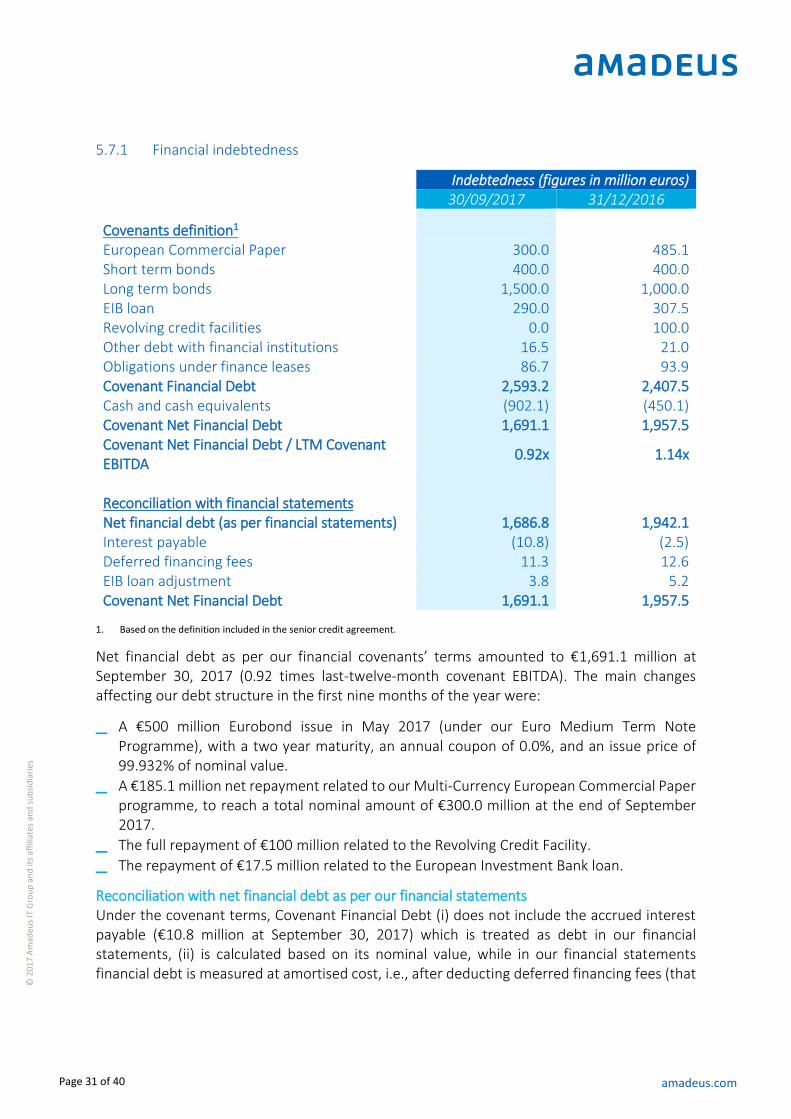
5.7.1 Financial indebtedness
Indebtedness (figures in million euros) 30/09/2017 31/12/2016
Covenants definition1 European Commercial Paper 300.0 485.1 Short term bonds 400.0 400.0 Long term bonds 1,500.0 1,000.0 EIB loan 290.0 307.5 Revolving credit facilities 0.0 100.0 Other debt with financial institutions 16.5 21.0 Obligations under finance leases 86.7 93.9 Covenant Financial Debt 2,593.2 2,407.5 Cash and cash equivalents (902.1) (450.1) Covenant Net Financial Debt 1,691.1 1,957.5 Covenant Net Financial Debt / LTM Covenant EBITDA
0.92x 1.14x
Reconciliation with financial statements Net financial debt (as per financial statements) 1,686.8 1,942.1 Interest payable (10.8) (2.5) Deferred financing fees 11.3 12.6 EIB loan adjustment 3.8 5.2 Covenant Net Financial Debt 1,691.1 1,957.5
1. Based on the definition included in the senior credit agreement.
Net financial debt as per our financial covenants’ terms amounted to €1,691.1 million at September 30, 2017 (0.92 times last-twelve-month covenant EBITDA). The main changes affecting our debt structure in the first nine months of the year were:
_ A €500 million Eurobond issue in May 2017 (under our Euro Medium Term Note Programme), with a two year maturity, an annual coupon of 0.0%, and an issue price of 99.932% of nominal value.
_ A €185.1 million net repayment related to our Multi-Currency European Commercial Paper programme, to reach a total nominal amount of €300.0 million at the end of September 2017.
_ The full repayment of €100 million related to the Revolving Credit Facility.
_ The repayment of €17.5 million related to the European Investment Bank loan.
Reconciliation with net financial debt as per our financial statements Under the covenant terms, Covenant Financial Debt (i) does not include the accrued interest payable (€10.8 million at September 30, 2017) which is treated as debt in our financial statements, (ii) is calculated based on its nominal value, while in our financial statements financial debt is measured at amortised cost, i.e., after deducting deferred financing fees (that
Page 32 of 40 amadeus.com
© 2
01
7 A
mad
eus
IT G
rou
p a
nd
its
affi
liate
s an
d s
ub
sid
iari
es
mainly correspond to fees paid upfront in connection with the set-up of new credit agreements and amount to €11.3 million at September 30, 2017), and (iii) does not include an adjustment for the difference between the nominal value of the loan granted by the EIB at below-market interest rate and its fair value (€3.8 million at September 30, 2017).
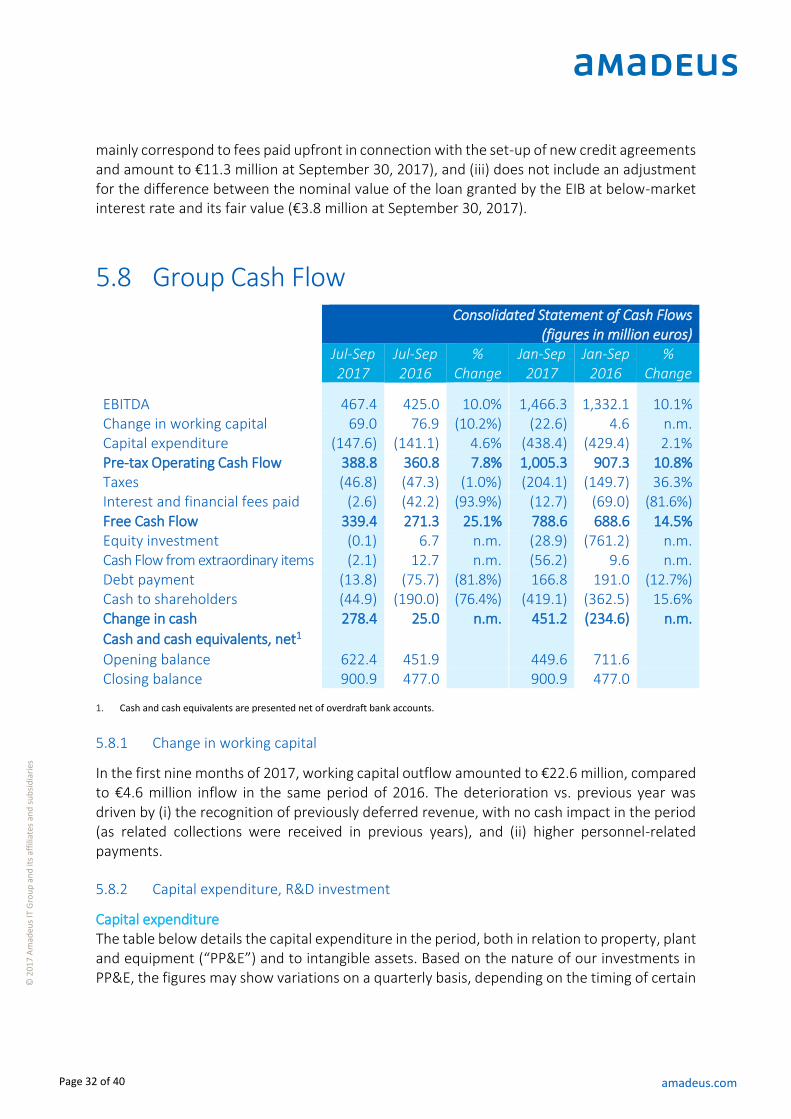
5.8 Group Cash Flow
Consolidated Statement of Cash Flows
(figures in million euros)
Jul-Sep 2017
Jul-Sep 2016
% Change
Jan-Sep 2017
Jan-Sep 2016
% Change
EBITDA 467.4 425.0 10.0% 1,466.3 1,332.1 10.1% Change in working capital 69.0 76.9 (10.2%) (22.6) 4.6 n.m. Capital expenditure (147.6) (141.1) 4.6% (438.4) (429.4) 2.1% Pre-tax Operating Cash Flow 388.8 360.8 7.8% 1,005.3 907.3 10.8% Taxes (46.8) (47.3) (1.0%) (204.1) (149.7) 36.3% Interest and financial fees paid (2.6) (42.2) (93.9%) (12.7) (69.0) (81.6%) Free Cash Flow 339.4 271.3 25.1% 788.6 688.6 14.5% Equity investment (0.1) 6.7 n.m. (28.9) (761.2) n.m. Cash Flow from extraordinary items (2.1) 12.7 n.m. (56.2) 9.6 n.m. Debt payment (13.8) (75.7) (81.8%) 166.8 191.0 (12.7%) Cash to shareholders (44.9) (190.0) (76.4%) (419.1) (362.5) 15.6% Change in cash 278.4 25.0 n.m. 451.2 (234.6) n.m.
Cash and cash equivalents, net1
Opening balance 622.4 451.9 449.6 711.6 Closing balance 900.9 477.0 900.9 477.0
1. Cash and cash equivalents are presented net of overdraft bank accounts.
5.8.1 Change in working capital
In the first nine months of 2017, working capital outflow amounted to €22.6 million, compared to €4.6 million inflow in the same period of 2016. The deterioration vs. previous year was driven by (i) the recognition of previously deferred revenue, with no cash impact in the period (as related collections were received in previous years), and (ii) higher personnel-related payments.
5.8.2 Capital expenditure, R&D investment
Capital expenditure The table below details the capital expenditure in the period, both in relation to property, plant and equipment (“PP&E”) and to intangible assets. Based on the nature of our investments in PP&E, the figures may show variations on a quarterly basis, depending on the timing of certain
Page 33 of 40 amadeus.com
© 2
01
7 A
mad
eus
IT G
rou
p a
nd
its
affi
liate
s an
d s
ub
sid
iari
es
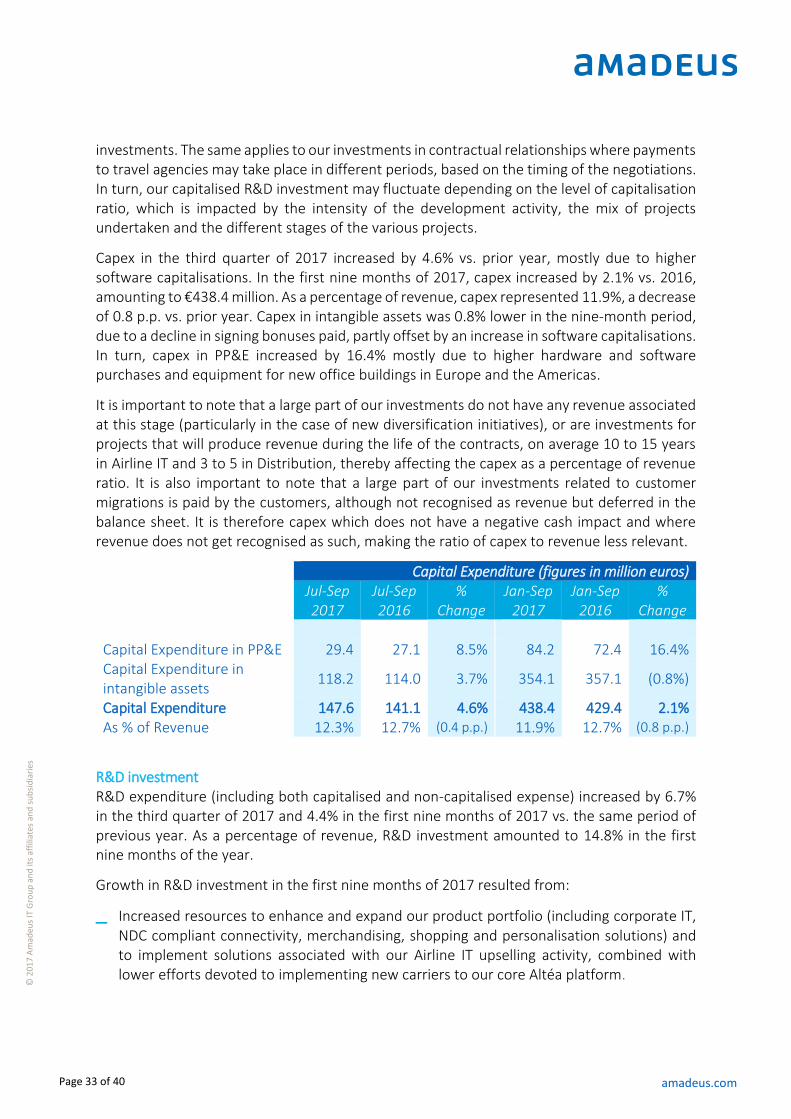
investments. The same applies to our investments in contractual relationships where payments to travel agencies may take place in different periods, based on the timing of the negotiations. In turn, our capitalised R&D investment may fluctuate depending on the level of capitalisation ratio, which is impacted by the intensity of the development activity, the mix of projects undertaken and the different stages of the various projects.
Capex in the third quarter of 2017 increased by 4.6% vs. prior year, mostly due to higher software capitalisations. In the first nine months of 2017, capex increased by 2.1% vs. 2016, amounting to €438.4 million. As a percentage of revenue, capex represented 11.9%, a decrease of 0.8 p.p. vs. prior year. Capex in intangible assets was 0.8% lower in the nine-month period, due to a decline in signing bonuses paid, partly offset by an increase in software capitalisations. In turn, capex in PP&E increased by 16.4% mostly due to higher hardware and software purchases and equipment for new office buildings in Europe and the Americas.
It is important to note that a large part of our investments do not have any revenue associated at this stage (particularly in the case of new diversification initiatives), or are investments for projects that will produce revenue during the life of the contracts, on average 10 to 15 years in Airline IT and 3 to 5 in Distribution, thereby affecting the capex as a percentage of revenue ratio. It is also important to note that a large part of our investments related to customer migrations is paid by the customers, although not recognised as revenue but deferred in the balance sheet. It is therefore capex which does not have a negative cash impact and where revenue does not get recognised as such, making the ratio of capex to revenue less relevant.
Capital Expenditure (figures in million euros)
Jul-Sep 2017
Jul-Sep 2016
% Change
Jan-Sep 2017
Jan-Sep 2016
% Change
Capital Expenditure in PP&E 29.4 27.1 8.5% 84.2 72.4 16.4% Capital Expenditure in intangible assets
118.2 114.0 3.7% 354.1 357.1 (0.8%)
Capital Expenditure 147.6 141.1 4.6% 438.4 429.4 2.1% As % of Revenue 12.3% 12.7% (0.4 p.p.) 11.9% 12.7% (0.8 p.p.)
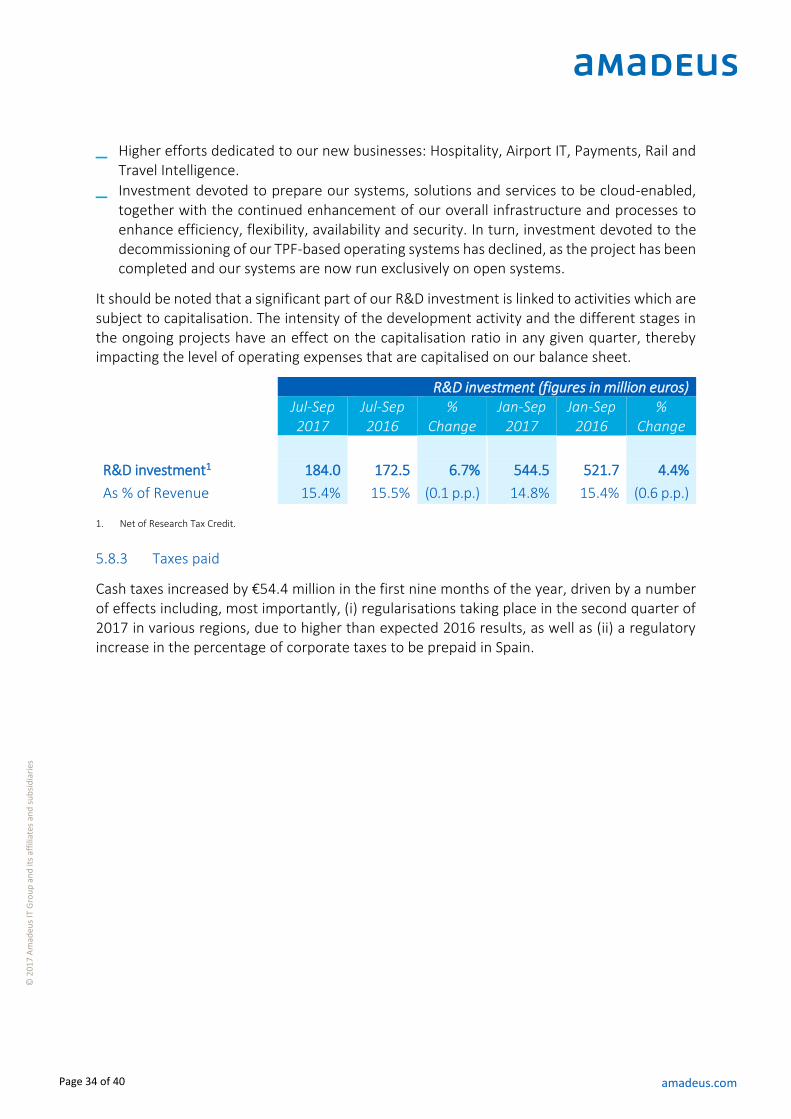
R&D investment R&D expenditure (including both capitalised and non-capitalised expense) increased by 6.7% in the third quarter of 2017 and 4.4% in the first nine months of 2017 vs. the same period of previous year. As a percentage of revenue, R&D investment amounted to 14.8% in the first nine months of the year.
Growth in R&D investment in the first nine months of 2017 resulted from:
_ Increased resources to enhance and expand our product portfolio (including corporate IT, NDC compliant connectivity, merchandising, shopping and personalisation solutions) and to implement solutions associated with our Airline IT upselling activity, combined with lower efforts devoted to implementing new carriers to our core Altéa platform.
Page 34 of 40 amadeus.com
© 2
01
7 A
mad
eus
IT G
rou
p a
nd
its
affi
liate
s an
d s
ub
sid
iari
es
_ Higher efforts dedicated to our new businesses: Hospitality, Airport IT, Payments, Rail and Travel Intelligence.
_ Investment devoted to prepare our systems, solutions and services to be cloud-enabled, together with the continued enhancement of our overall infrastructure and processes to enhance efficiency, flexibility, availability and security. In turn, investment devoted to the decommissioning of our TPF-based operating systems has declined, as the project has been completed and our systems are now run exclusively on open systems.
It should be noted that a significant part of our R&D investment is linked to activities which are subject to capitalisation. The intensity of the development activity and the different stages in the ongoing projects have an effect on the capitalisation ratio in any given quarter, thereby impacting the level of operating expenses that are capitalised on our balance sheet.
R&D investment (figures in million euros)
Jul-Sep 2017
Jul-Sep 2016
% Change
Jan-Sep 2017
Jan-Sep 2016
% Change
R&D investment1 184.0 172.5 6.7% 544.5 521.7 4.4%
As % of Revenue 15.4% 15.5% (0.1 p.p.) 14.8% 15.4% (0.6 p.p.)
1. Net of Research Tax Credit.
5.8.3 Taxes paid
Cash taxes increased by €54.4 million in the first nine months of the year, driven by a number of effects including, most importantly, (i) regularisations taking place in the second quarter of 2017 in various regions, due to higher than expected 2016 results, as well as (ii) a regulatory increase in the percentage of corporate taxes to be prepaid in Spain.
Page 35 of 40 amadeus.com
© 2
01
7 A
mad
eus
IT G
rou
p a
nd
its
affi
liate
s an
d s
ub
sid
iari
es
6 Investor information
Page 36 of 40 amadeus.com
© 2
01
7 A
mad
eus
IT G
rou
p a
nd
its
affi
liate
s an
d s
ub
sid
iari
es
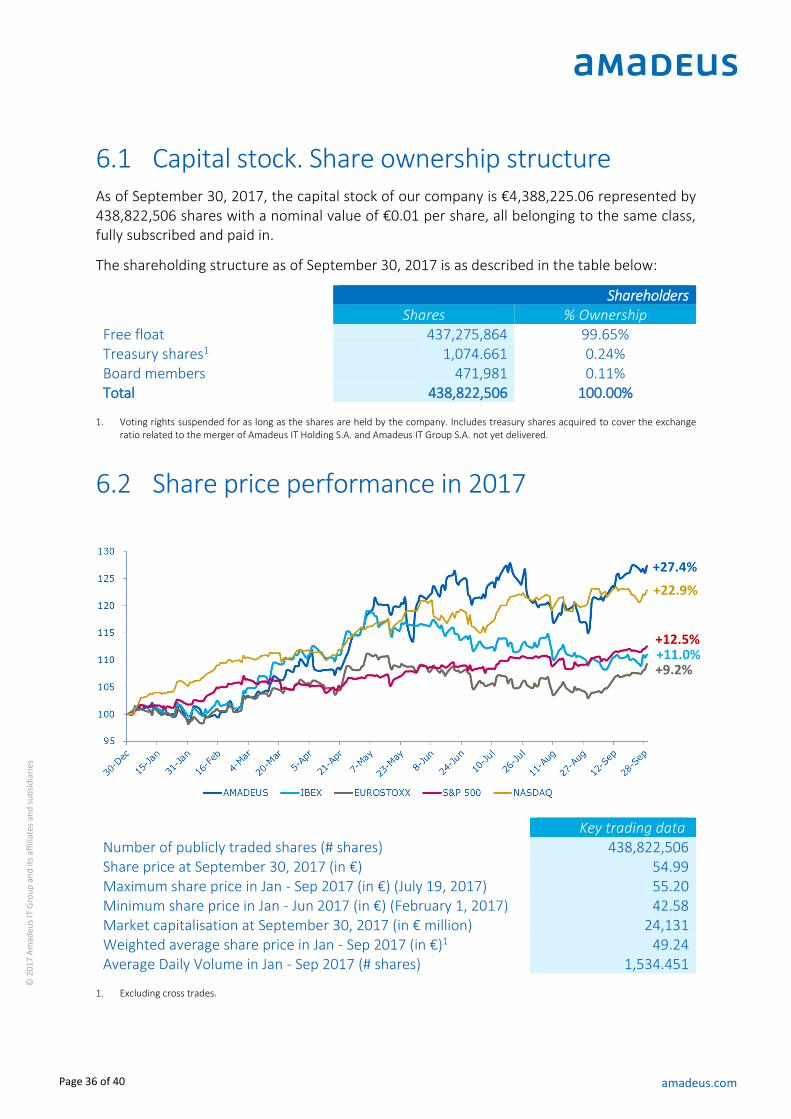
6.1 Capital stock. Share ownership structure As of September 30, 2017, the capital stock of our company is €4,388,225.06 represented by 438,822,506 shares with a nominal value of €0.01 per share, all belonging to the same class, fully subscribed and paid in.
The shareholding structure as of September 30, 2017 is as described in the table below:
Shareholders Shares % Ownership Free float 437,275,864 99.65% Treasury shares1 1,074.661 0.24% Board members 471,981 0.11% Total 438,822,506 100.00%
1. Voting rights suspended for as long as the shares are held by the company. Includes treasury shares acquired to cover the exchange
ratio related to the merger of Amadeus IT Holding S.A. and Amadeus IT Group S.A. not yet delivered.
6.2 Share price performance in 2017
Key trading data Number of publicly traded shares (# shares) 438,822,506 Share price at September 30, 2017 (in €) 54.99 Maximum share price in Jan - Sep 2017 (in €) (July 19, 2017) 55.20 Minimum share price in Jan - Jun 2017 (in €) (February 1, 2017) 42.58 Market capitalisation at September 30, 2017 (in € million) 24,131 Weighted average share price in Jan - Sep 2017 (in €)1 49.24 Average Daily Volume in Jan - Sep 2017 (# shares) 1,534.451
1. Excluding cross trades.
+27.4%
+9.2%+11.0%+12.5%
+22.9%
Page 37 of 40 amadeus.com
© 2
01
7 A
mad
eus
IT G
rou
p a
nd
its
affi
liate
s an
d s
ub
sid
iari
es
6.3 Dividend payments At the Shareholders’ General Meeting held on June 15, 2017, our shareholders approved the annual gross dividend from the 2016 profit. The total value of the dividend increased 21.3% vs. prior year to €412.5 million, representing a pay-out of 50% of the 2016 reported profit for the year, or €0.94 per share (gross). Regarding the payment, an interim amount of €0.40 per share (gross) was paid on February 1, 2017 and the complementary dividend of €0.54 per share (gross) was paid on June 30, 2017.
Page 38 of 40 amadeus.com
© 2
01
7 A
mad
eus
IT G
rou
p a
nd
its
affi
liate
s an
d s
ub
sid
iari
es
7 Key terms _ “API”: refers to “Application Programming Interface”
_ “CRS”: refers to “Computerised Reservation System”. In the context of the portfolio of solutions for the hospitality industry, it refers to “Central Reservation System”
_ “D&A”: refers to “Depreciation and Amortisation”
_ “DCS”: refers to “Departure Control System”
_ “ECP”: refers to “European Commercial Paper”
_ “EIB”: refers to “European Investment Bank”
_ “EPS”: refers to “Earnings Per Share”
_ “FTE”: refers to “full-time equivalent” employee
_ “GDS”: refers to a “global distribution system”, i.e. a worldwide computerised reservation system (CRS) used as a single point of access for reserving airline seats, hotel rooms and other travel-related items by travel agencies and large travel management corporations
_ “IATA”: refers to “International Air Transport Association”
_ “IFRS”: refers to “International Financial Reporting Standards”
_ “JV”: refers to “Joint Venture”
_ “KPI”: refers to “key performance indicators”
_ “LCC”: refers to “Low Cost Carrier”
_ “LTM”: refers to “last twelve months”
_ “NDC”: refers to “New Distribution Capability”. IATA establishes three levels of NDC certification, depending on the NDC capabilities the technology enables:
Level 1: NDC-enabled basic shopping (ancillaries post booking)
Level 2: NDC-enabled Offer Management (extensive use of Offer Management API and Air Shopping)
Level 3: NDC-enabled Offer and Order Management (extensive use of Offer and Order Management API)
_ “n.m.”: refers to “not meaningful”
_ “PB”: refers to “passengers boarded”, i.e. actual passengers boarded onto flights operated by airlines using at least our Amadeus Altéa Reservation and Inventory modules or Navitaire New Skies
_ “p.p.”: refers to “percentage point”
_ “PPA”: refers to “purchase price allocation”
_ “PP&E”: refers to “Property, Plant and Equipment”
_ “PMS”: refers to “Property Management System”
_ “PSS”: refers to “Passenger Service System”
_ “R&D”: refers to “Research and Development”
_ “RTC”: refers to “Research Tax Credit”
_ “TA”: refers to “travel agencies”
Page 39 of 40 amadeus.com
© 2
01
7 A
mad
eus
IT G
rou
p a
nd
its
affi
liate
s an
d s
ub
sid
iari
es
_ “TA air booking industry”: defined as the total volume of travel agency air bookings processed by the global CRS. It excludes air bookings made directly through in-house airline systems or single country operators, the latter primarily in China, Japan and Russia, which together combined represent an important part of the industry
_ “TPF”: refers to Transaction Processing Facility
_ “XML”: refers to “eXtensible Markup Language”
Page 40 of 40 amadeus.com
© 2
01
7 A
mad
eus
IT G
rou
p a
nd
its
affi
liate
s an
d s
ub
sid
iari
es
Contacts
For any other information please contact:
Ana de Pro Cristina Fernandez Chief Financial Officer Director, Investor Relations [email protected] [email protected] You can follow us on: AmadeusITGroup
amadeus.com/investors
Disclaimer
There may be statements in this financial report which are not purely historical facts, including statements about anticipated or expected future revenue and earnings growth. All forward looking statements in this presentation are based upon information available to Amadeus on the date of this presentation. Any forward looking statements involve risks and uncertainties that could cause actual events or results to differ materially from the events or results described in the forward looking statements. Amadeus undertakes no obligation to publicly update or revise any forward looking statements, whether as a result of new information, future events or otherwise. Readers are cautioned not to place undue reliance on forward looking statements.