Embed Size (px)
Citation preview
Radico Khaitan Limited(BSE: 532497; NSE: RADICO)
Earnings Presentation
Q3 and Nine Month FY2018
Earnings Presentation | Q3 FY2018 1
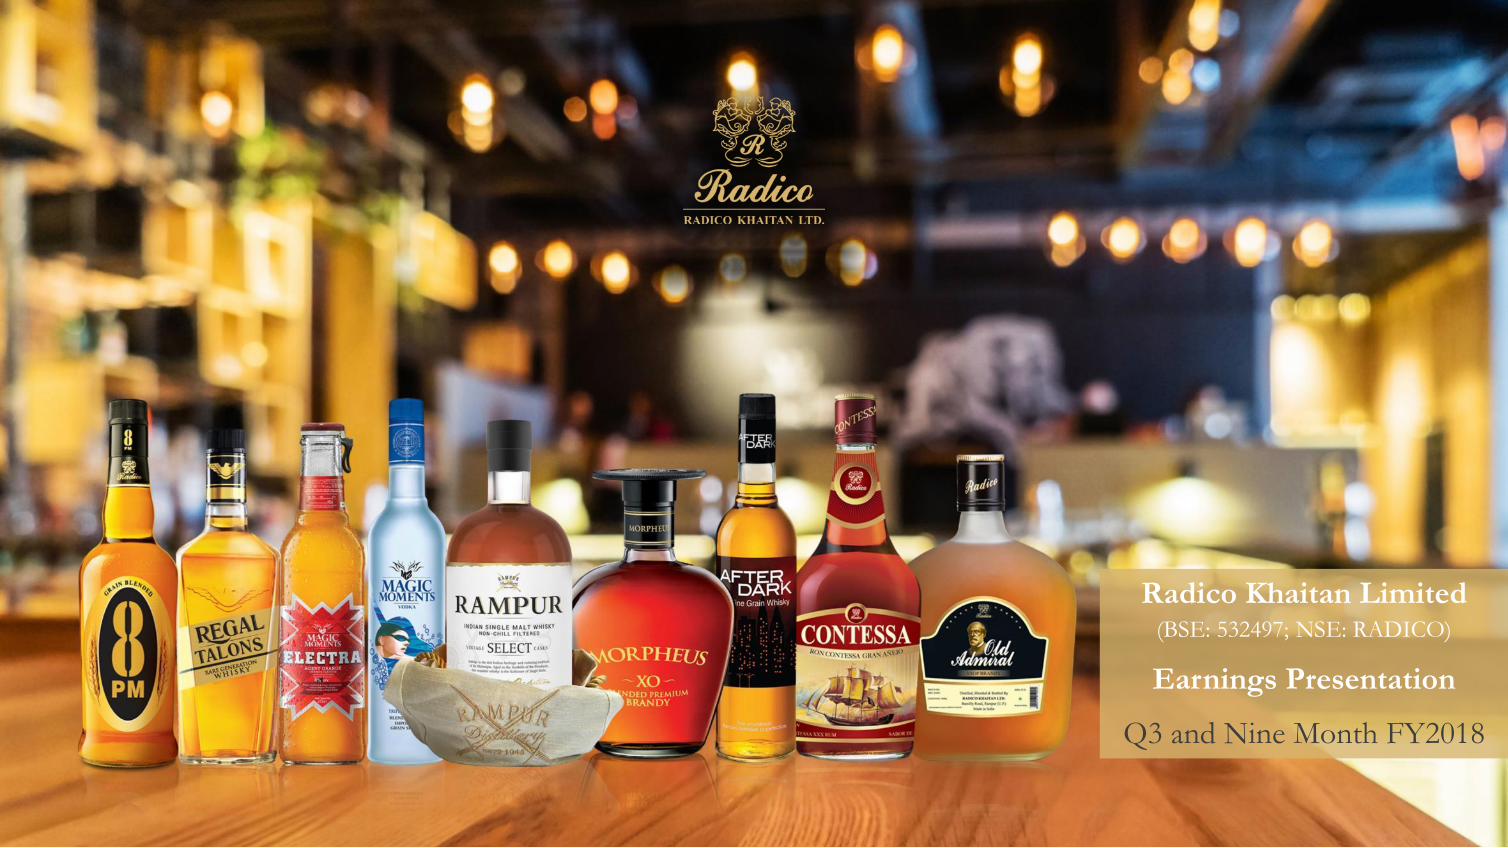
Volumes growth driven by an all round performance
Total volume +17.7%; Prestige & Above +11.2%
Significant profitability improvement
EBITDA +47.3%; Total Comprehensive Income +79.1%
Strong cash flow generation and ongoing deleveraging
Net Debt reduction of Rs. 57 Crore in Q3 FY2018 and Rs. 130 crore in 9M FY2018
Improving operating environment
Price increases in Telangana; Andhra Pradesh, Jharkhand, Uttaranchal and Kerala received earlier during the year
Note: All growth numbers above are for Q3 FY2018 and represent Y-o-Y
Q3 FY2018 Performance Highlights
High quality earnings and robust cash flows
Earnings Presentation | Q3 FY2018 2
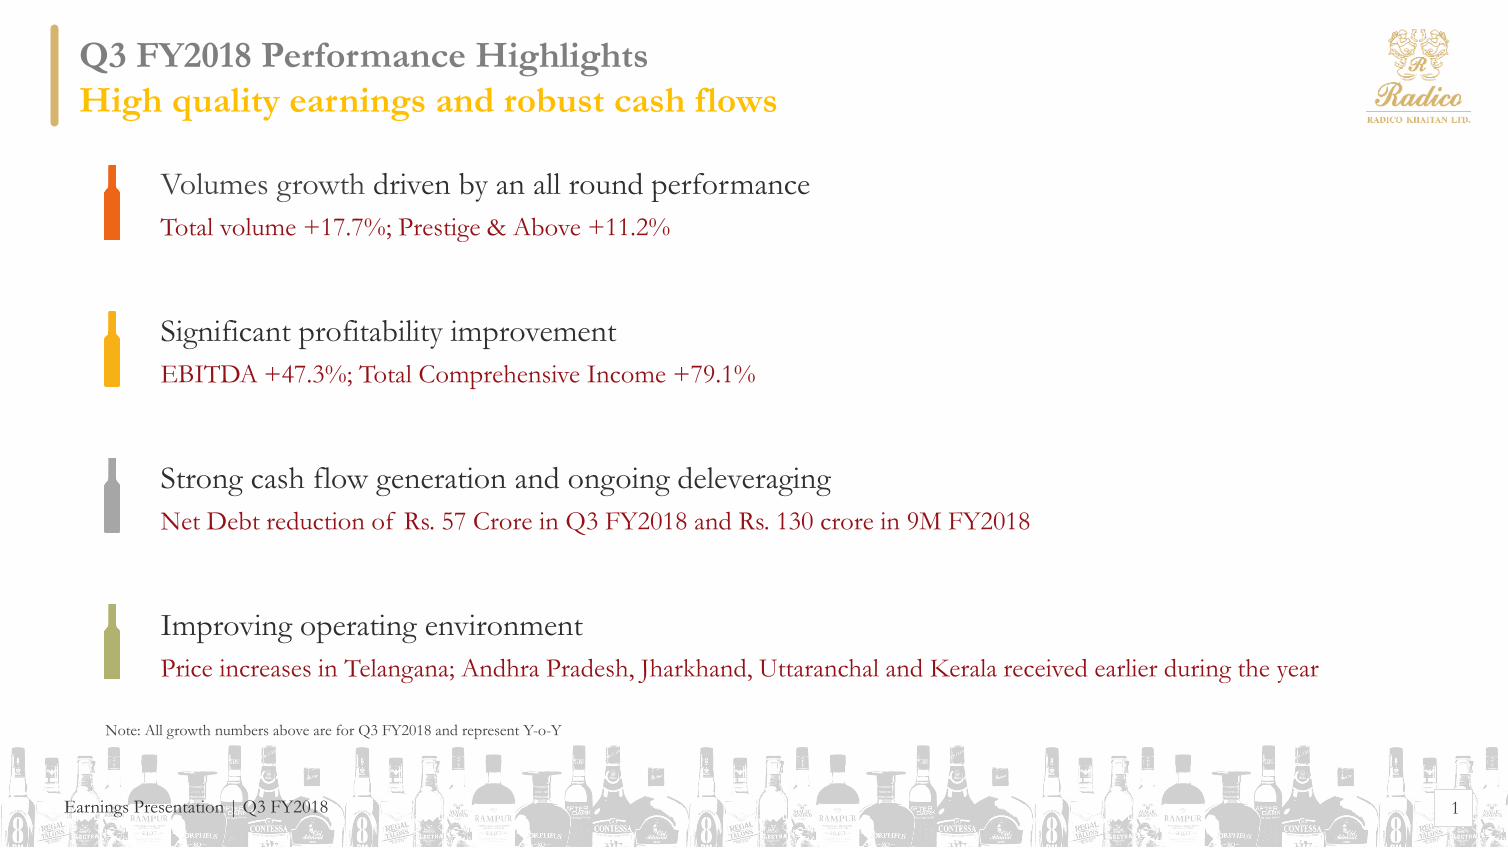
Q3 FY2018 Performance Highlights Continued volume growth driving strong topline performance
Total IMFL Volume(Lakh cases)
44.90 52.85
+17.7%
11.90 13.23
+11.2%
413.05 482.52
+16.8%
Prestige & Above(Lakh cases)
Revenue from
Operations (Rs. Crore)
Q3 FY17 Q3 FY18 Q3 FY17 Q3 FY18 Q3 FY17 Q3 FY18
Earnings Presentation | Q3 FY2018 3
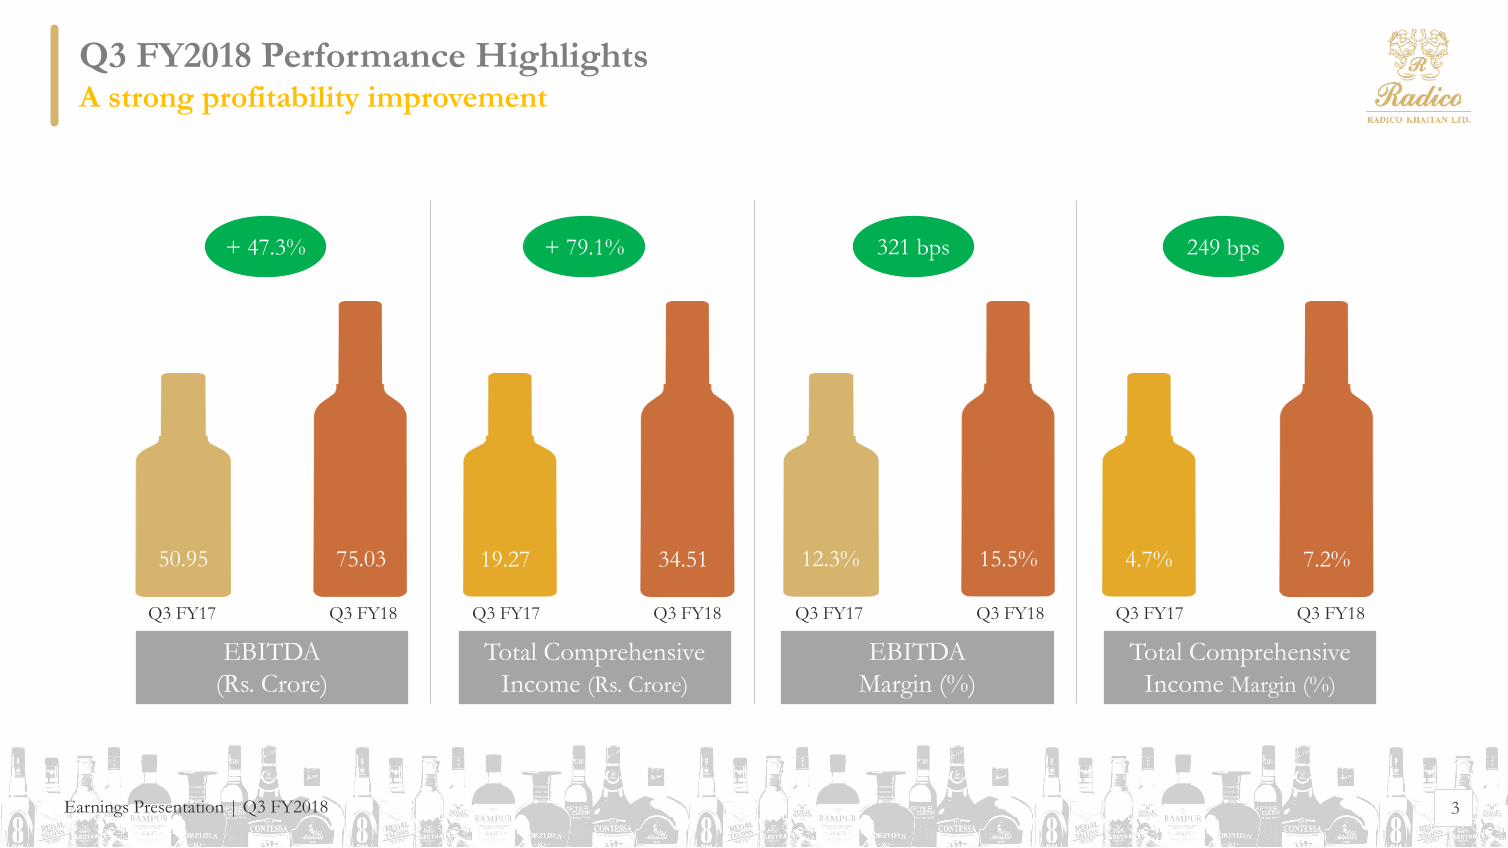
Q3 FY2018 Performance Highlights A strong profitability improvement
EBITDA
(Rs. Crore)
+ 47.3% + 79.1%
12.3% 15.5%
321 bps
Total Comprehensive
Income (Rs. Crore)
EBITDA
Margin (%)
Total Comprehensive
Income Margin (%)
4.7% 7.2%
249 bps
Q3 FY17 Q3 FY18 Q3 FY17 Q3 FY18
50.95 75.03 19.27 34.51
Q3 FY17 Q3 FY18 Q3 FY17 Q3 FY18
Earnings Presentation | Q3 FY2018 4
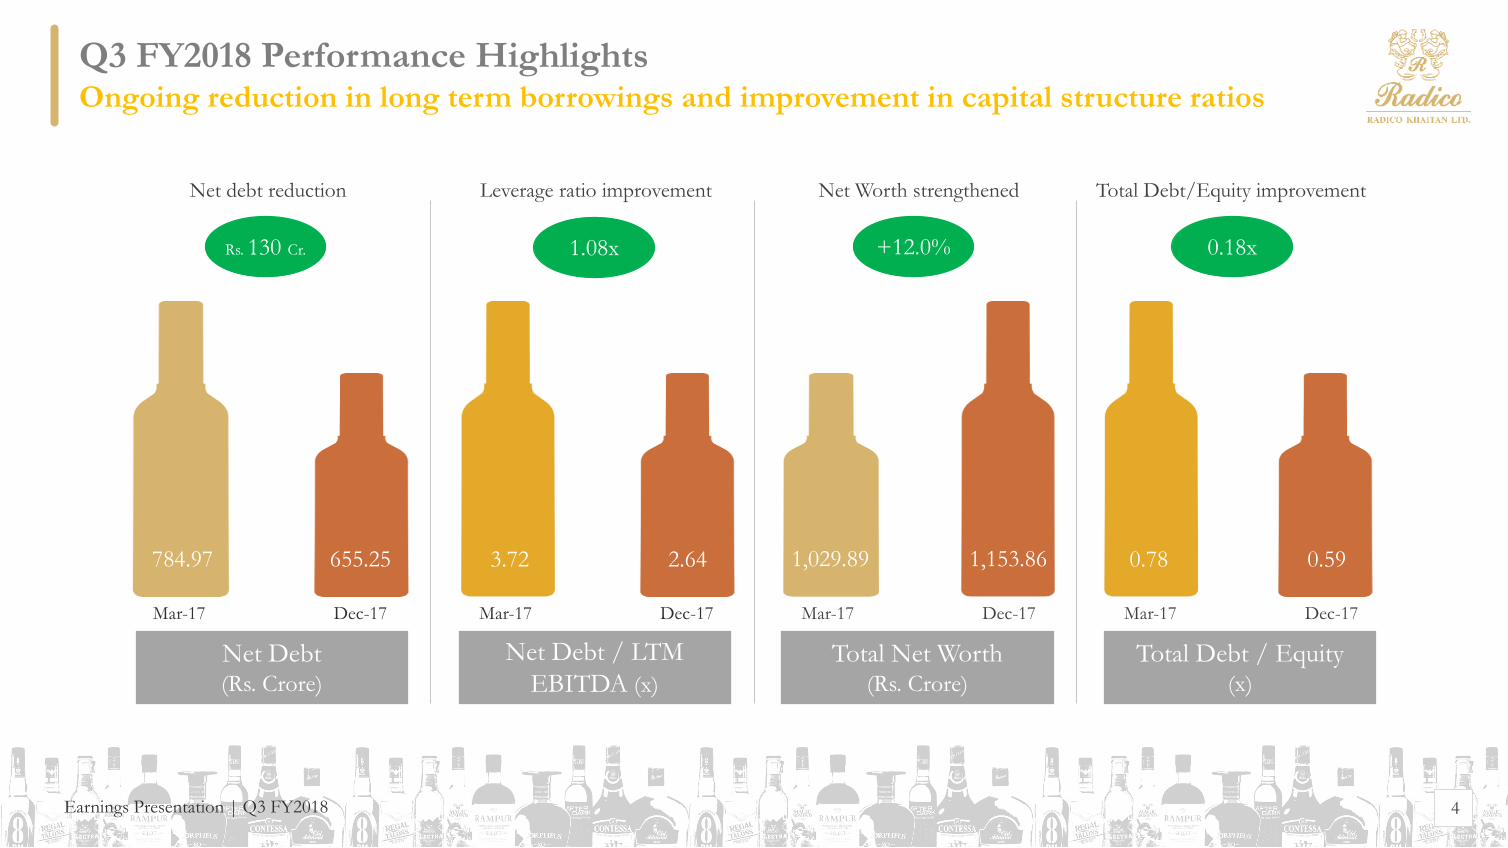
Q3 FY2018 Performance Highlights Ongoing reduction in long term borrowings and improvement in capital structure ratios
Net Debt(Rs. Crore)
784.97 655.25
Rs. 130 Cr.
3.72 2.64
1.08x
1,029.89 1,153.86
+12.0%
Net Debt / LTM
EBITDA (x)
Total Net Worth(Rs. Crore)
Total Debt / Equity(x)
0.78 0.59
0.18x
Net debt reduction Leverage ratio improvement Net Worth strengthened Total Debt/Equity improvement
Mar-17 Dec-17 Mar-17 Dec-17 Mar-17 Dec-17 Mar-17 Dec-17
Earnings Presentation | Q3 FY2018 5
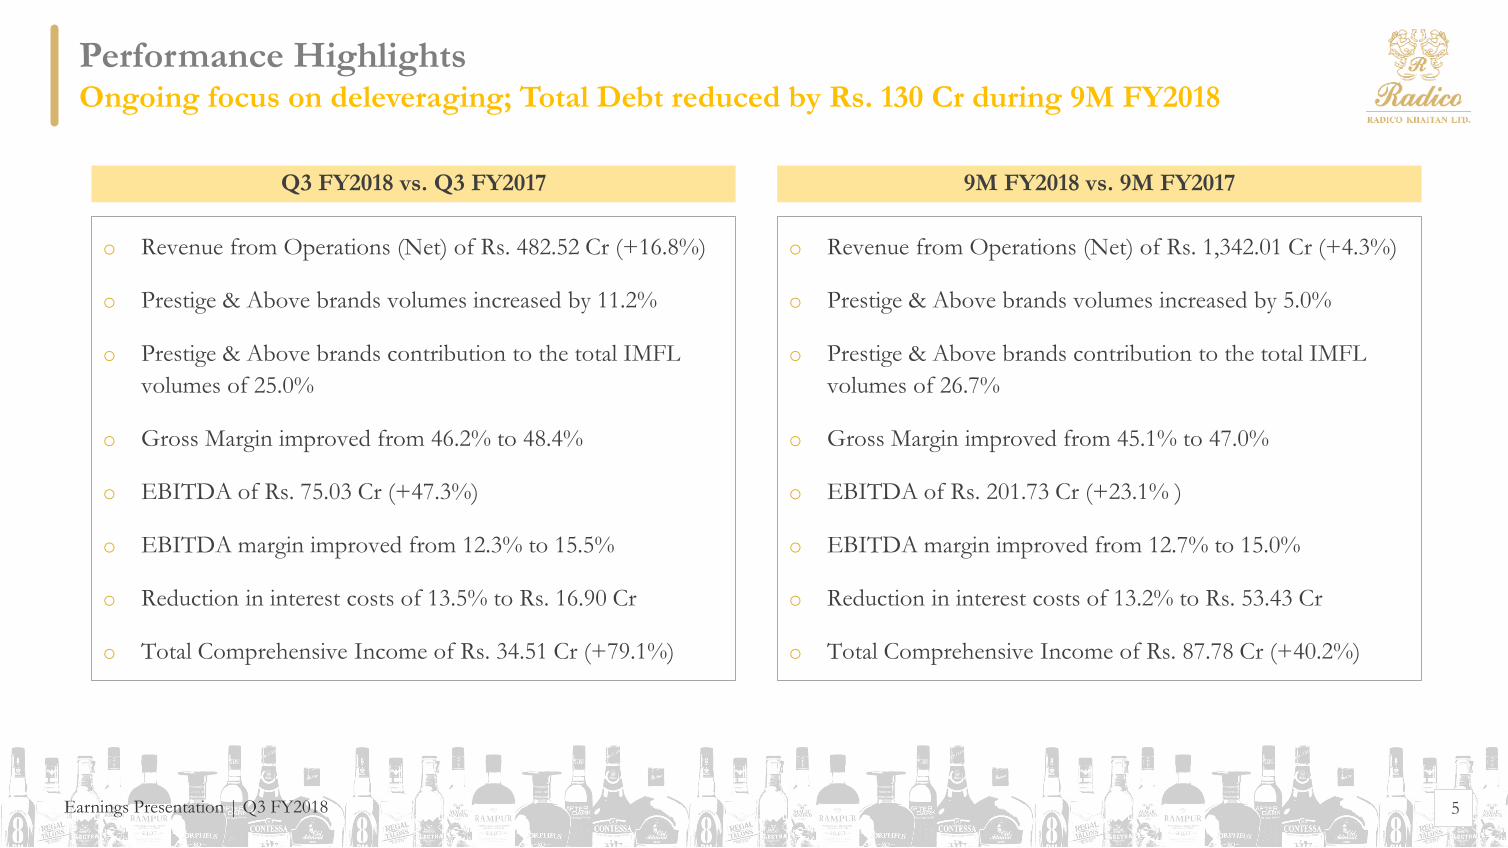
o Revenue from Operations (Net) of Rs. 482.52 Cr (+16.8%)
o Prestige & Above brands volumes increased by 11.2%
o Prestige & Above brands contribution to the total IMFL
volumes of 25.0%
o Gross Margin improved from 46.2% to 48.4%
o EBITDA of Rs. 75.03 Cr (+47.3%)
o EBITDA margin improved from 12.3% to 15.5%
o Reduction in interest costs of 13.5% to Rs. 16.90 Cr
o Total Comprehensive Income of Rs. 34.51 Cr (+79.1%)
Q3 FY2018 vs. Q3 FY2017
Performance Highlights Ongoing focus on deleveraging; Total Debt reduced by Rs. 130 Cr during 9M FY2018
o Revenue from Operations (Net) of Rs. 1,342.01 Cr (+4.3%)
o Prestige & Above brands volumes increased by 5.0%
o Prestige & Above brands contribution to the total IMFL
volumes of 26.7%
o Gross Margin improved from 45.1% to 47.0%
o EBITDA of Rs. 201.73 Cr (+23.1% )
o EBITDA margin improved from 12.7% to 15.0%
o Reduction in interest costs of 13.2% to Rs. 53.43 Cr
o Total Comprehensive Income of Rs. 87.78 Cr (+40.2%)
9M FY2018 vs. 9M FY2017
Earnings Presentation | Q3 FY2018 6
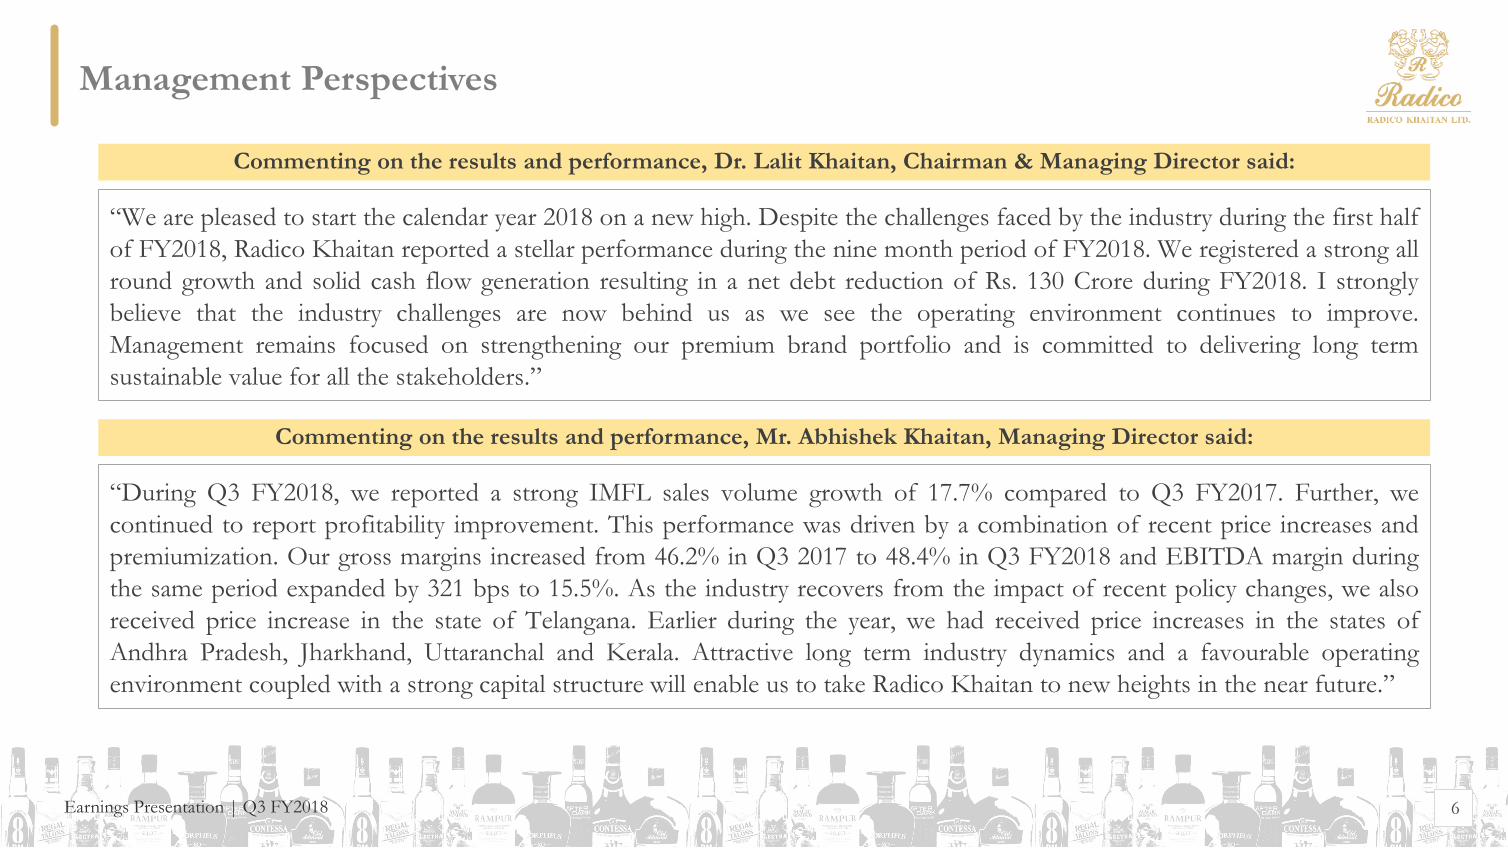
“We are pleased to start the calendar year 2018 on a new high. Despite the challenges faced by the industry during the first half
of FY2018, Radico Khaitan reported a stellar performance during the nine month period of FY2018. We registered a strong all
round growth and solid cash flow generation resulting in a net debt reduction of Rs. 130 Crore during FY2018. I strongly
believe that the industry challenges are now behind us as we see the operating environment continues to improve.
Management remains focused on strengthening our premium brand portfolio and is committed to delivering long term
sustainable value for all the stakeholders.”
Commenting on the results and performance, Dr. Lalit Khaitan, Chairman & Managing Director said:
Management Perspectives
“During Q3 FY2018, we reported a strong IMFL sales volume growth of 17.7% compared to Q3 FY2017. Further, we
continued to report profitability improvement. This performance was driven by a combination of recent price increases and
premiumization. Our gross margins increased from 46.2% in Q3 2017 to 48.4% in Q3 FY2018 and EBITDA margin during
the same period expanded by 321 bps to 15.5%. As the industry recovers from the impact of recent policy changes, we also
received price increase in the state of Telangana. Earlier during the year, we had received price increases in the states of
Andhra Pradesh, Jharkhand, Uttaranchal and Kerala. Attractive long term industry dynamics and a favourable operating
environment coupled with a strong capital structure will enable us to take Radico Khaitan to new heights in the near future.”
Commenting on the results and performance, Mr. Abhishek Khaitan, Managing Director said:
Earnings Presentation | Q3 FY2018 7
Performance Overview
Q3 y-o-y Nine Month y-o-y Full Year
FY2018 FY2017 Growth (%) FY2018 FY2017 Growth (%) FY2017
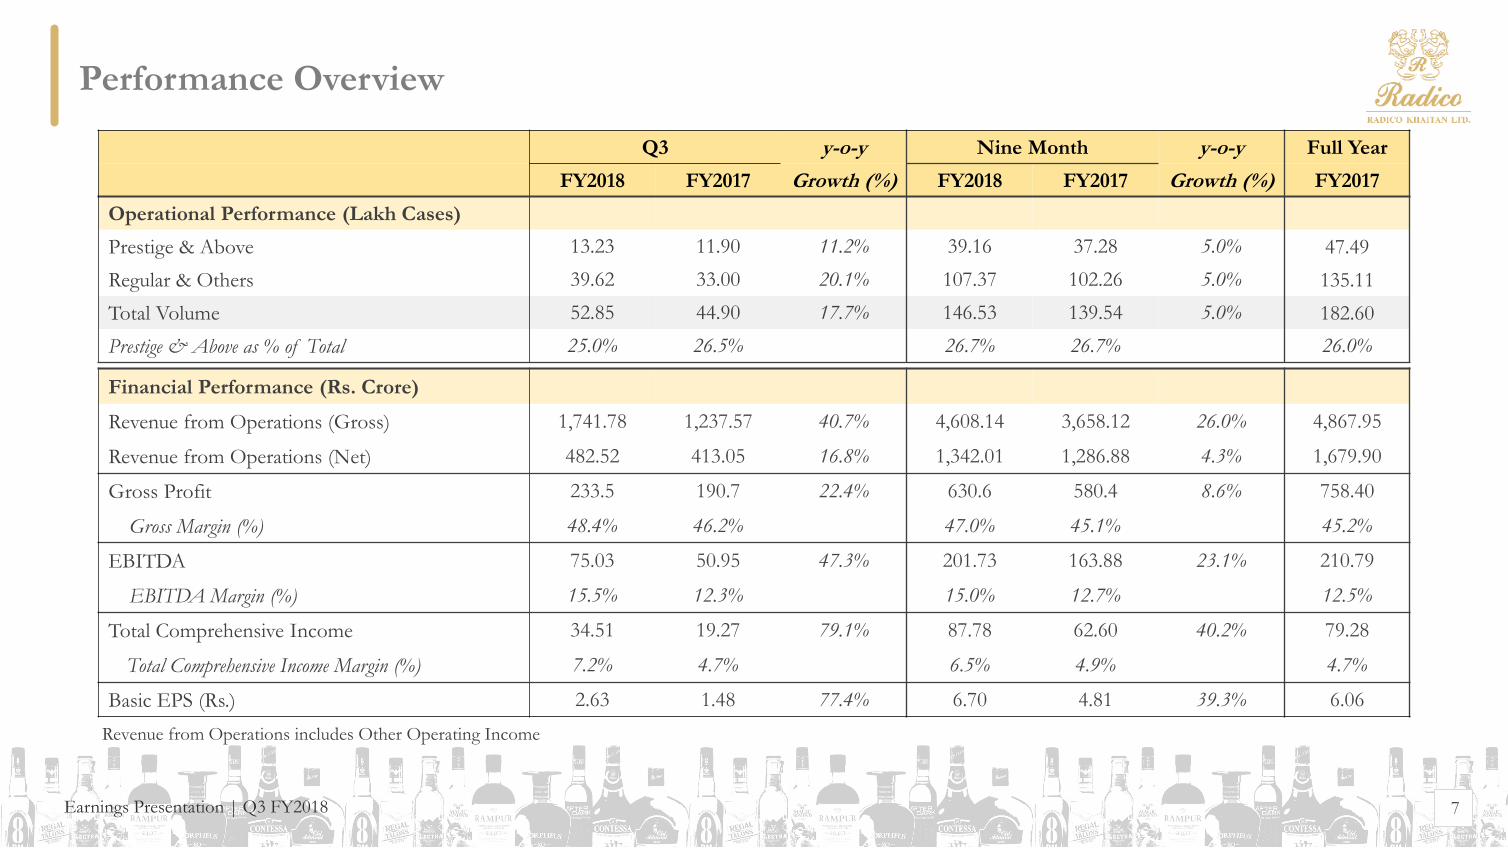
Operational Performance (Lakh Cases)
Prestige & Above 13.23 11.90 11.2% 39.16 37.28 5.0% 47.49
Regular & Others 39.62 33.00 20.1% 107.37 102.26 5.0% 135.11
Total Volume 52.85 44.90 17.7% 146.53 139.54 5.0% 182.60
Prestige & Above as % of Total 25.0% 26.5% 26.7% 26.7% 26.0%
Revenue from Operations includes Other Operating Income
Financial Performance (Rs. Crore)
Revenue from Operations (Gross) 1,741.78 1,237.57 40.7% 4,608.14 3,658.12 26.0% 4,867.95
Revenue from Operations (Net) 482.52 413.05 16.8% 1,342.01 1,286.88 4.3% 1,679.90
Gross Profit 233.5 190.7 22.4% 630.6 580.4 8.6% 758.40
Gross Margin (%) 48.4% 46.2% 47.0% 45.1% 45.2%
EBITDA 75.03 50.95 47.3% 201.73 163.88 23.1% 210.79
EBITDA Margin (%) 15.5% 12.3% 15.0% 12.7% 12.5%
Total Comprehensive Income 34.51 19.27 79.1% 87.78 62.60 40.2% 79.28
Total Comprehensive Income Margin (%) 7.2% 4.7% 6.5% 4.9% 4.7%
Basic EPS (Rs.) 2.63 1.48 77.4% 6.70 4.81 39.3% 6.06
Earnings Presentation | Q3 FY2018 8
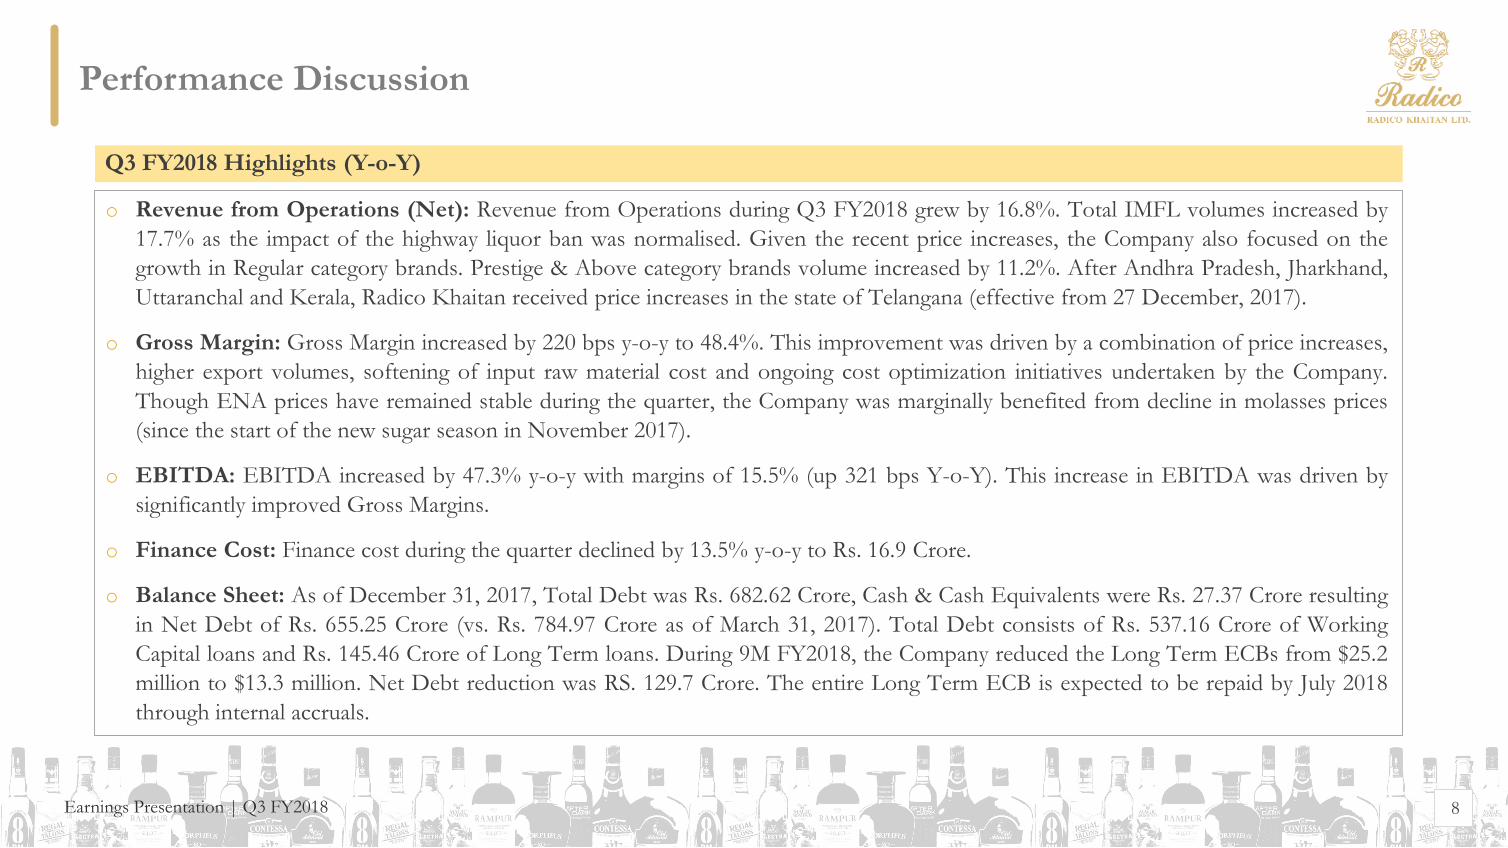
Q3 FY2018 Highlights (Y-o-Y)
Performance Discussion
o Revenue from Operations (Net): Revenue from Operations during Q3 FY2018 grew by 16.8%. Total IMFL volumes increased by
17.7% as the impact of the highway liquor ban was normalised. Given the recent price increases, the Company also focused on the
growth in Regular category brands. Prestige & Above category brands volume increased by 11.2%. After Andhra Pradesh, Jharkhand,
Uttaranchal and Kerala, Radico Khaitan received price increases in the state of Telangana (effective from 27 December, 2017).
o Gross Margin: Gross Margin increased by 220 bps y-o-y to 48.4%. This improvement was driven by a combination of price increases,
higher export volumes, softening of input raw material cost and ongoing cost optimization initiatives undertaken by the Company.
Though ENA prices have remained stable during the quarter, the Company was marginally benefited from decline in molasses prices
(since the start of the new sugar season in November 2017).
o EBITDA: EBITDA increased by 47.3% y-o-y with margins of 15.5% (up 321 bps Y-o-Y). This increase in EBITDA was driven by
significantly improved Gross Margins.
o Finance Cost: Finance cost during the quarter declined by 13.5% y-o-y to Rs. 16.9 Crore.
o Balance Sheet: As of December 31, 2017, Total Debt was Rs. 682.62 Crore, Cash & Cash Equivalents were Rs. 27.37 Crore resulting
in Net Debt of Rs. 655.25 Crore (vs. Rs. 784.97 Crore as of March 31, 2017). Total Debt consists of Rs. 537.16 Crore of Working
Capital loans and Rs. 145.46 Crore of Long Term loans. During 9M FY2018, the Company reduced the Long Term ECBs from $25.2
million to $13.3 million. Net Debt reduction was RS. 129.7 Crore. The entire Long Term ECB is expected to be repaid by July 2018
through internal accruals.
Earnings Presentation | Q3 FY2018
1943Year of
Incorporation
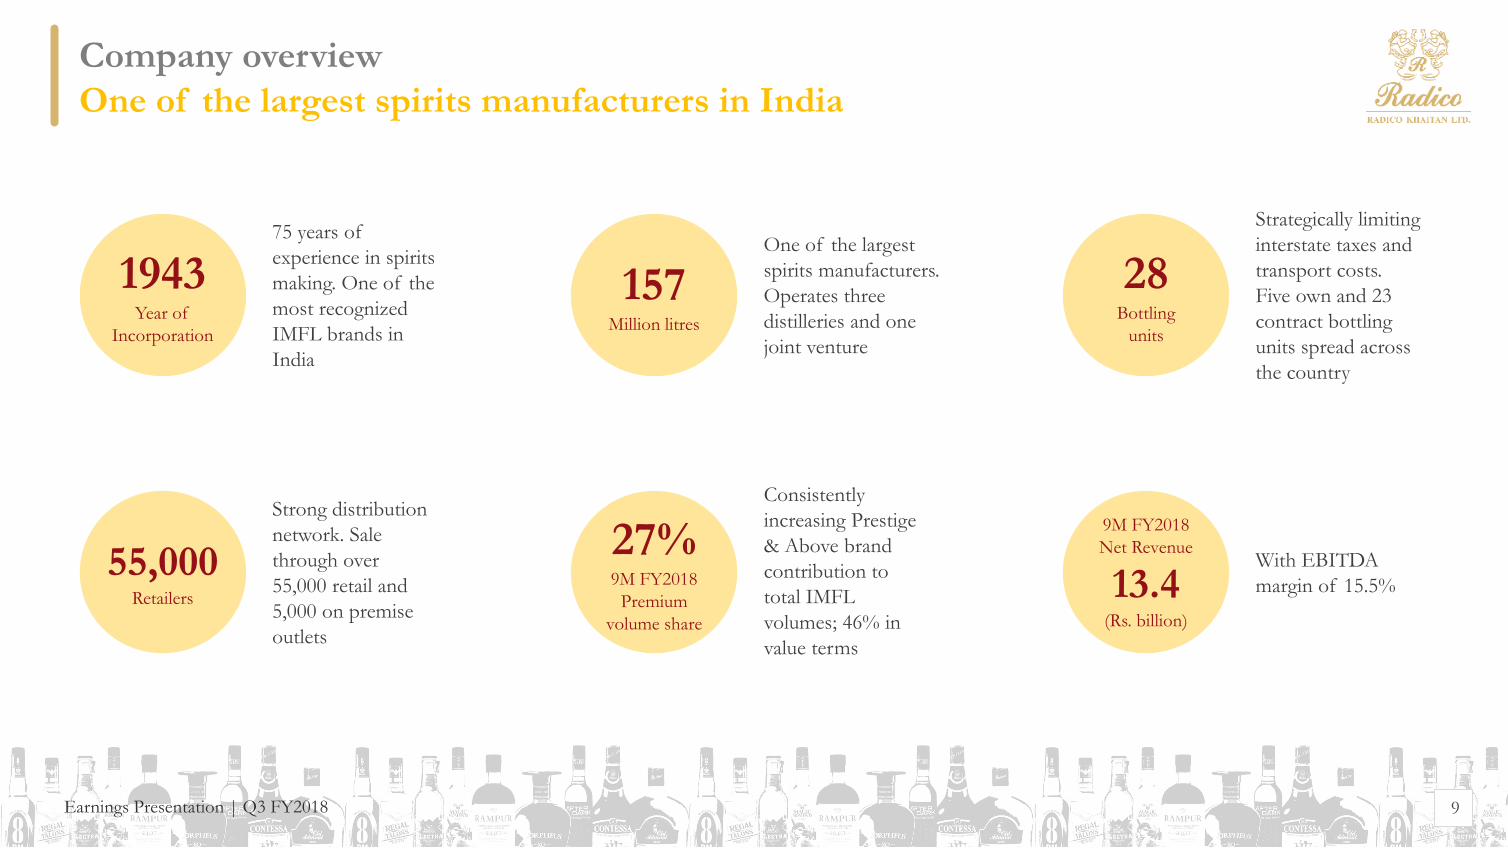
Company overview
One of the largest spirits manufacturers in India
9
75 years of
experience in spirits
making. One of the
most recognized
IMFL brands in
India
157Million litres
One of the largest
spirits manufacturers.
Operates three
distilleries and one
joint venture
28Bottling
units
Strategically limiting
interstate taxes and
transport costs.
Five own and 23
contract bottling
units spread across
the country
55,000Retailers
Strong distribution
network. Sale
through over
55,000 retail and
5,000 on premise
outlets
27%9M FY2018
Premium
volume share
Consistently
increasing Prestige
& Above brand
contribution to
total IMFL
volumes; 46% in
value terms
9M FY2018
Net Revenue
13.4(Rs. billion)
With EBITDA
margin of 15.5%
Earnings Presentation | Q3 FY2018 10
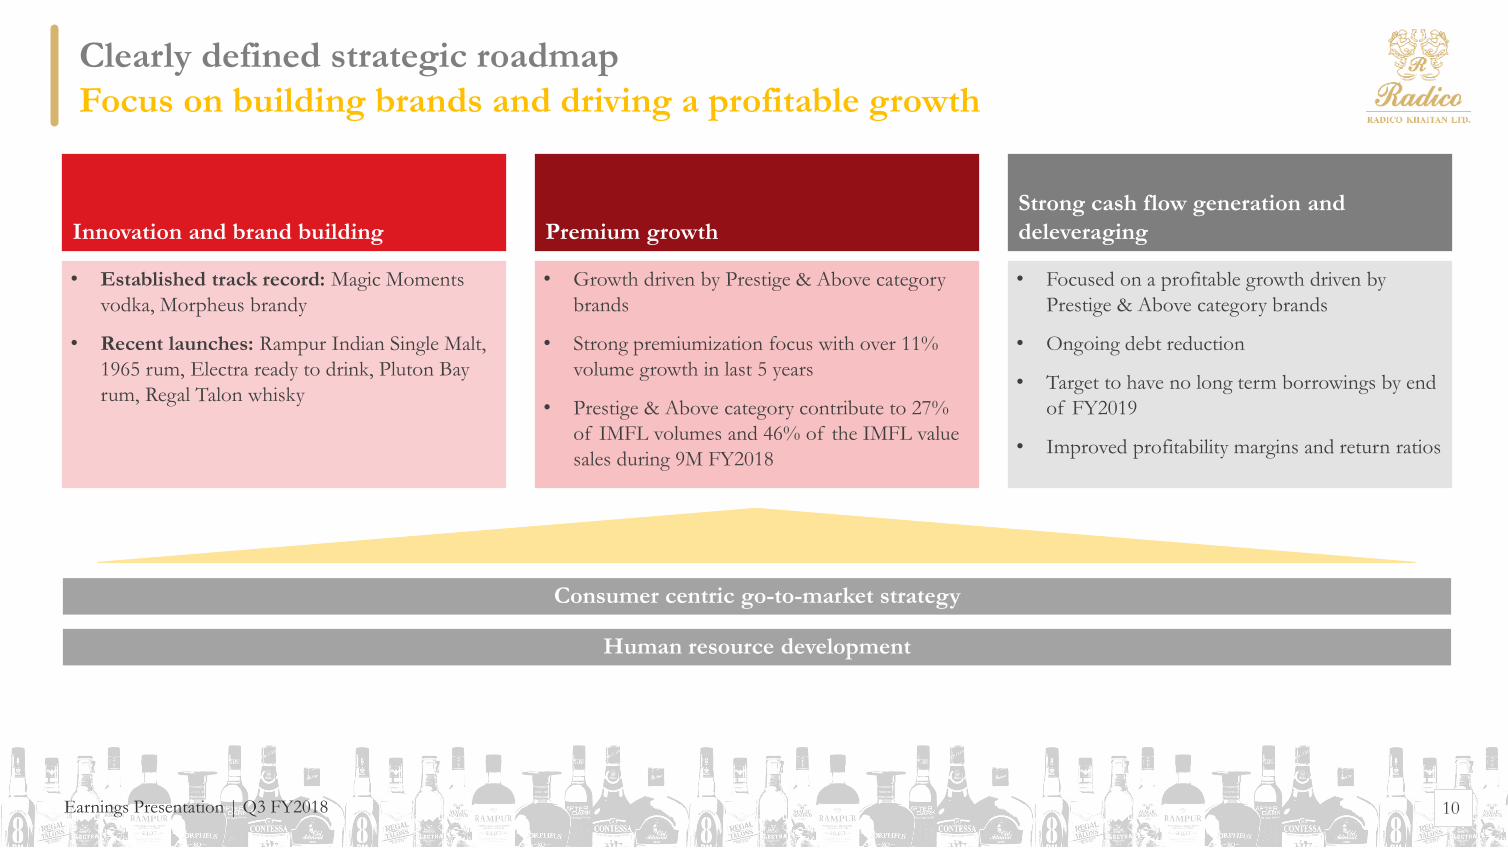
Innovation and brand building Premium growth
Strong cash flow generation and
deleveraging
• Established track record: Magic Moments
vodka, Morpheus brandy
• Recent launches: Rampur Indian Single Malt,
1965 rum, Electra ready to drink, Pluton Bay
rum, Regal Talon whisky
• Growth driven by Prestige & Above category
brands
• Strong premiumization focus with over 11%
volume growth in last 5 years
• Prestige & Above category contribute to 27%
of IMFL volumes and 46% of the IMFL value
sales during 9M FY2018
• Focused on a profitable growth driven by
Prestige & Above category brands
• Ongoing debt reduction
• Target to have no long term borrowings by end
of FY2019
• Improved profitability margins and return ratios
Consumer centric go-to-market strategy
Human resource development
Clearly defined strategic roadmap
Focus on building brands and driving a profitable growth

Earnings Presentation | Q3 FY2018
New Product
Rampur Indian single malt
11Earnings Presentation | Q2 FY2018 11
Rampur Indian Single Malt Whisky: Decades of Perfection
Takes forward the rich heritage of Rampur, a princely state of
British India and the 75 years of distillation expertise of Radico
Khaitan, the pioneers of legendary spirits in India. Aged in the
foothills of the Himalayas, Rampur is the Kohinoor of Single
Malts. The Rampur Indian Single Malt is presented in a
distinguished canister packaging. Treasured in a robust stout bottle
with a thick base, the overall appearance is of under-stated luxury.
The Rampur Indian Single Malt experience is enhanced with the
addition of a cork with sleeve and a hand crafted silk pouch
imparting a royal touch.

Earnings Presentation | Q3 FY2018
New Product
Electra ready-to-drink
1212
Exploring the wilderness within, the quest to conquer the usual
and zest to go beyond limits, is what drives non conformists.
To kick the boring out of their lives we have introduced a gush
of raw adrenalin for them – Electra.
Electra is triple distilled and triple filtered with carbon and
platinum filter. Keeping the spirit of innovation alive, this 8%
vodka infused drink comes with a premium ring pull cap.
Earnings Presentation | Q2 FY2018
Earnings Presentation | Q3 FY2018 1313
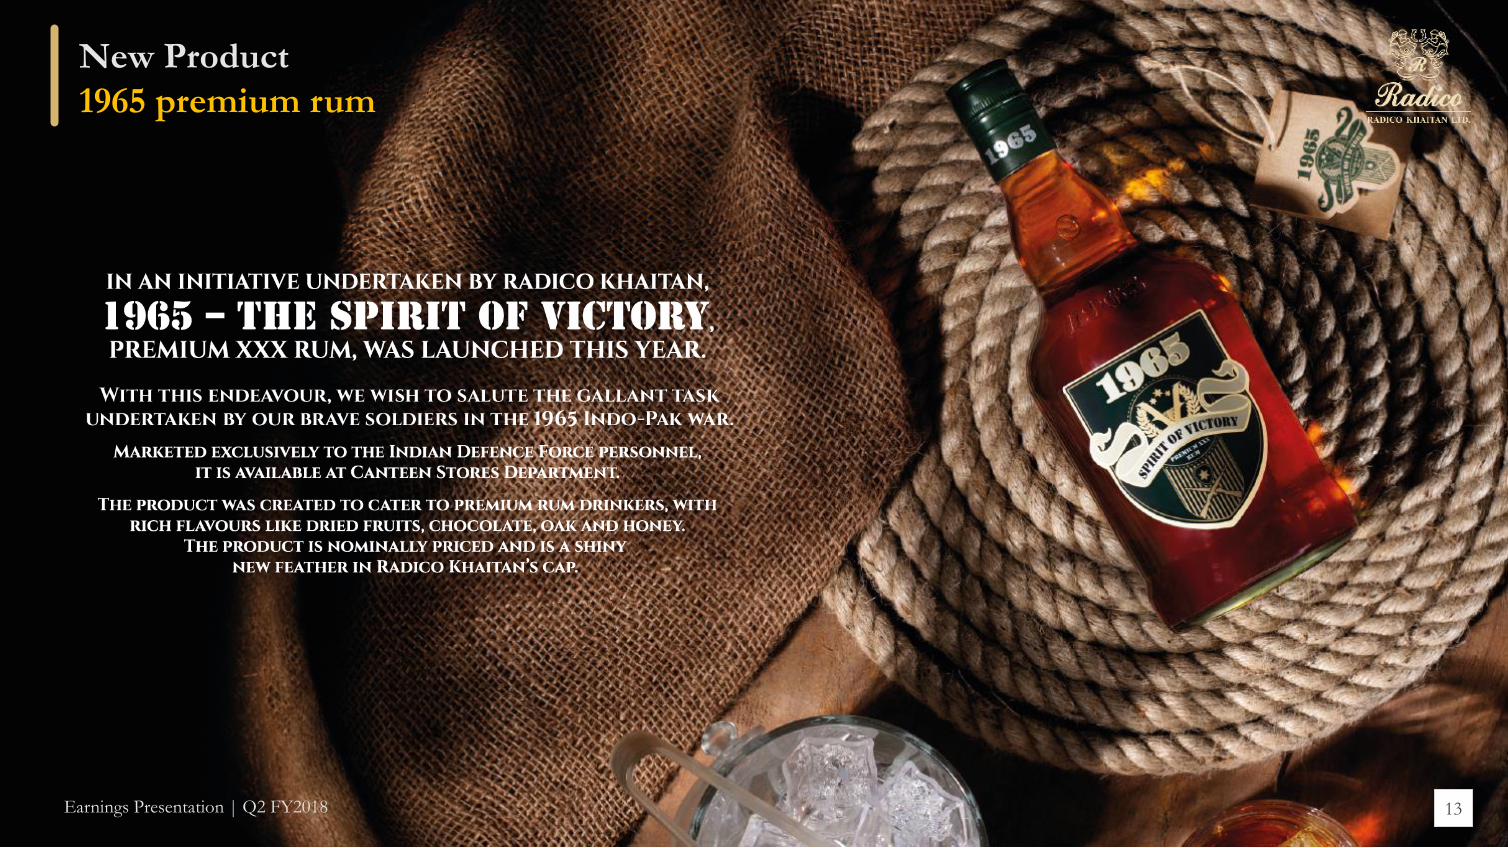
New Product
1965 premium rum
Earnings Presentation | Q2 FY2018
Earnings Presentation | Q3 FY2018 1414
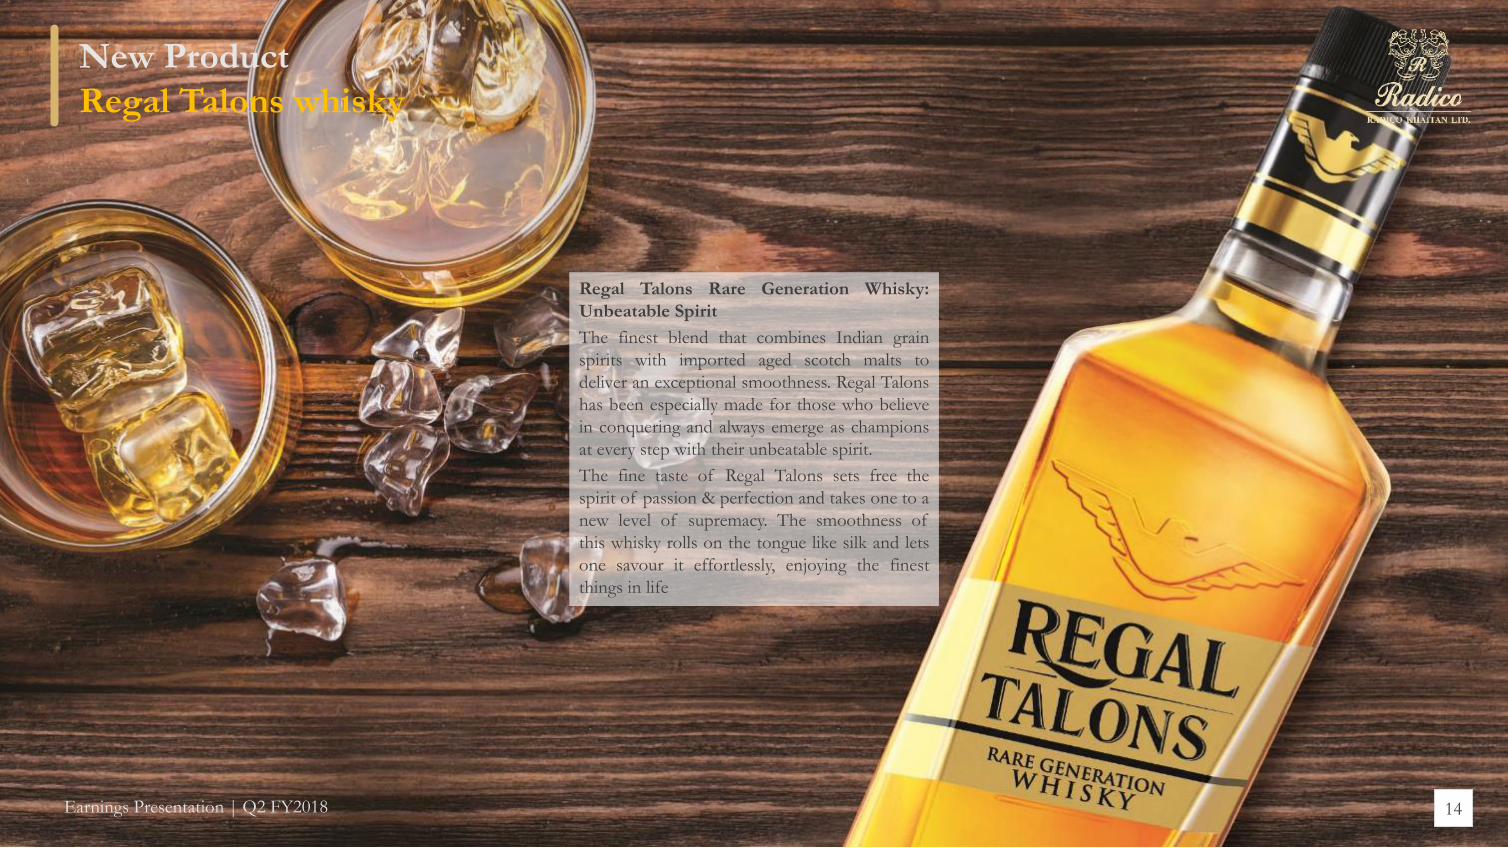
Regal Talons Rare Generation Whisky:
Unbeatable Spirit
The finest blend that combines Indian grain
spirits with imported aged scotch malts to
deliver an exceptional smoothness. Regal Talons
has been especially made for those who believe
in conquering and always emerge as champions
at every step with their unbeatable spirit.
The fine taste of Regal Talons sets free the
spirit of passion & perfection and takes one to a
new level of supremacy. The smoothness of
this whisky rolls on the tongue like silk and lets
one savour it effortlessly, enjoying the finest
things in life
New Product
Regal Talons whisky
Earnings Presentation | Q2 FY2018
Earnings Presentation | Q3 FY2018 15
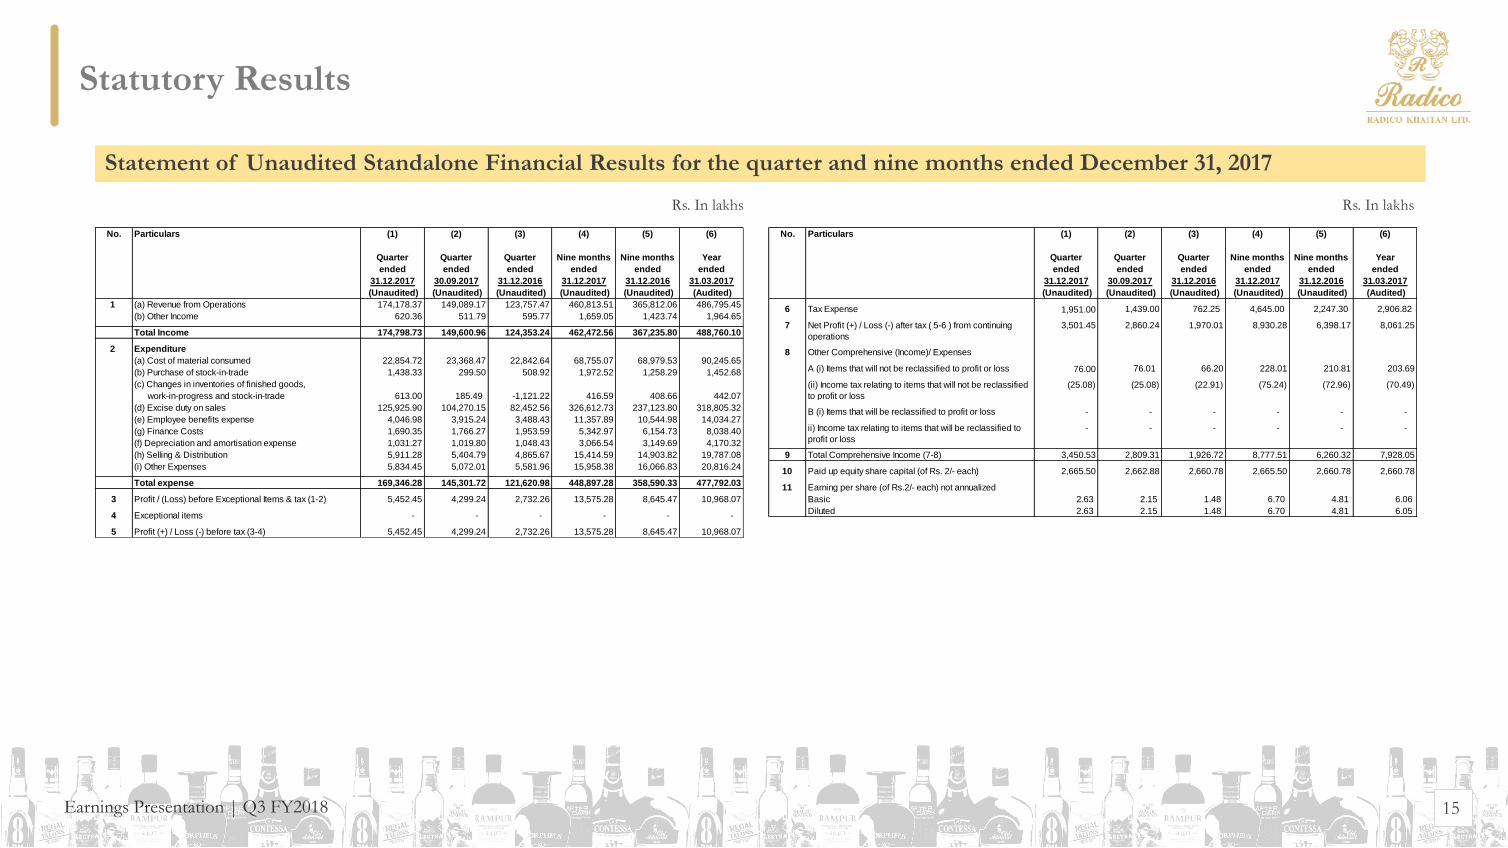
Statement of Unaudited Standalone Financial Results for the quarter and nine months ended December 31, 2017
Statutory Results
Rs. In lakhsRs. In lakhs
No. Particulars (1) (2) (3) (4) (5) (6)
Quarter Quarter Quarter Nine months Nine months Year
ended ended ended ended ended ended
31.12.2017 30.09.2017 31.12.2016 31.12.2017 31.12.2016 31.03.2017
(Unaudited) (Unaudited) (Unaudited) (Unaudited) (Unaudited) (Audited)
1 (a) Revenue from Operations 174,178.37 149,089.17 123,757.47 460,813.51 365,812.06 486,795.45
(b) Other Income 620.36 511.79 595.77 1,659.05 1,423.74 1,964.65
Total Income 174,798.73 149,600.96 124,353.24 462,472.56 367,235.80 488,760.10
2 Expenditure
(a) Cost of material consumed 22,854.72 23,368.47 22,842.64 68,755.07 68,979.53 90,245.65
(b) Purchase of stock-in-trade 1,438.33 299.50 508.92 1,972.52 1,258.29 1,452.68
(c) Changes in inventories of finished goods,
work-in-progress and stock-in-trade 613.00 185.49 -1,121.22 416.59 408.66 442.07
(d) Excise duty on sales 125,925.90 104,270.15 82,452.56 326,612.73 237,123.80 318,805.32
(e) Employee benefits expense 4,046.98 3,915.24 3,488.43 11,357.89 10,544.98 14,034.27
(g) Finance Costs 1,690.35 1,766.27 1,953.59 5,342.97 6,154.73 8,038.40
(f) Depreciation and amortisation expense 1,031.27 1,019.80 1,048.43 3,066.54 3,149.69 4,170.32
(h) Selling & Distribution 5,911.28 5,404.79 4,865.67 15,414.59 14,903.82 19,787.08
(i) Other Expenses 5,834.45 5,072.01 5,581.96 15,958.38 16,066.83 20,816.24
Total expense 169,346.28 145,301.72 121,620.98 448,897.28 358,590.33 477,792.03
3 Profit / (Loss) before Exceptional Items & tax (1-2) 5,452.45 4,299.24 2,732.26 13,575.28 8,645.47 10,968.07
4 Exceptional items - - - - - -
5 Profit (+) / Loss (-) before tax (3-4) 5,452.45 4,299.24 2,732.26 13,575.28 8,645.47 10,968.07
No. Particulars (1) (2) (3) (4) (5) (6)
Quarter Quarter Quarter Nine months Nine months Year
ended ended ended ended ended ended
31.12.2017 30.09.2017 31.12.2016 31.12.2017 31.12.2016 31.03.2017
(Unaudited) (Unaudited) (Unaudited) (Unaudited) (Unaudited) (Audited)
6 Tax Expense 1,951.00 1,439.00 762.25 4,645.00 2,247.30 2,906.82
7 Net Profit (+) / Loss (-) after tax ( 5-6 ) from continuing
operations
3,501.45 2,860.24 1,970.01 8,930.28 6,398.17 8,061.25
8 Other Comprehensive (Income)/ Expenses
A (i) Items that will not be reclassified to profit or loss 76.00 76.01 66.20 228.01 210.81 203.69
(ii) Income tax relating to items that will not be reclassified
to profit or loss
(25.08) (25.08) (22.91) (75.24) (72.96) (70.49)
B (i) Items that will be reclassified to profit or loss - - - - - -
ii) Income tax relating to items that will be reclassified to
profit or loss
- - - - - -
9 Total Comprehensive Income (7-8) 3,450.53 2,809.31 1,926.72 8,777.51 6,260.32 7,928.05
10 Paid up equity share capital (of Rs. 2/- each) 2,665.50 2,662.88 2,660.78 2,665.50 2,660.78 2,660.78
11 Earning per share (of Rs.2/- each) not annualized
Basic 2.63 2.15 1.48 6.70 4.81 6.06
Diluted 2.63 2.15 1.48 6.70 4.81 6.05
Earnings Presentation | Q3 FY2018 16
Third Quarter Results for Fiscal Year 2018
Statutory Results
Notes:
1. The above results were reviewed by the Audit Committee and were approved and taken on record by the Board of Directors in their meeting held on24th January 2018.
2. This statement has been prepared in accordance with the Companies (Indian Accounting Standards) Rules 2015 (Ind AS) prescribed under Section 133of the Companies Act, 2013 and other recognised accounting practices and policies to the extent applicable.
3. As the Company’s business activity falls within a single primary business segment, namely Alcohol and Alcoholic Beverages, the disclosure requirementsas per Ind-AS 108 “operating segments” are not applicable.
4. Tax expenses includes current tax and deferred tax.
5. Revenue from operations for periods up to June 30, 2017 includes excise duty, which is discontinued on few items effective July 01, 2017 uponimplementation of Goods and Service Tax (GST) in India. In accordance with ‘Ind-AS 18, Revenue’ GST is not included in revenue from operations. Inview of the aforesaid restructuring of indirect taxes, revenue from operations for the quarter/ nine months ended on December 31, 2017 are notcomparable with the previous periods.
6. During the quarter, the Company has allotted 1,31,000 equity shares on exercise of Employees Stock Option by the eligible employees, as per the ESOPScheme 2006.
7. The previous period figures have been regrouped / reclassified, wherever considered necessary.
For Radico Khaitan Ltd.
New Delhi
24th January, 2018
Dr. Lalit Khaitan
Chairman & Managing Director
DIN No. 00238222
Earnings Presentation | Q3 FY2018
Contact information
17
This presentation contains statements that contain “forward looking statements” including, but without limitation, statements relating to the
implementation of strategic initiatives, and other statements relating to Radico Khaitan’s future business developments and economic performance.
While these forward looking statements indicate our assessment and future expectations concerning the development of our business, a number of
risks, uncertainties and other unknown factors could cause actual developments and results to differ materially from our expectations.
These factors include, but are not limited to, general market, macro-economic, governmental and regulatory trends, movements in currency
exchange and interest rates, competitive pressures, technological developments, changes in the financial conditions of third parties dealing with us,
legislative developments, and other key factors that could affect our business and financial performance.
Radico Khaitan undertakes no obligation to publicly revise any forward looking statements to reflect future / likely events or circumstances.
For further information, please contact:
Dilip Kumar Banthiya
Chief Financial Officer
+91 11 4167 6218
Mukesh Agrawal
Head – Investor Relations
+91 11 4097 5423
Bijay Sharma / Saket Somani
Churchgate Partners
+91 22 6169 5988
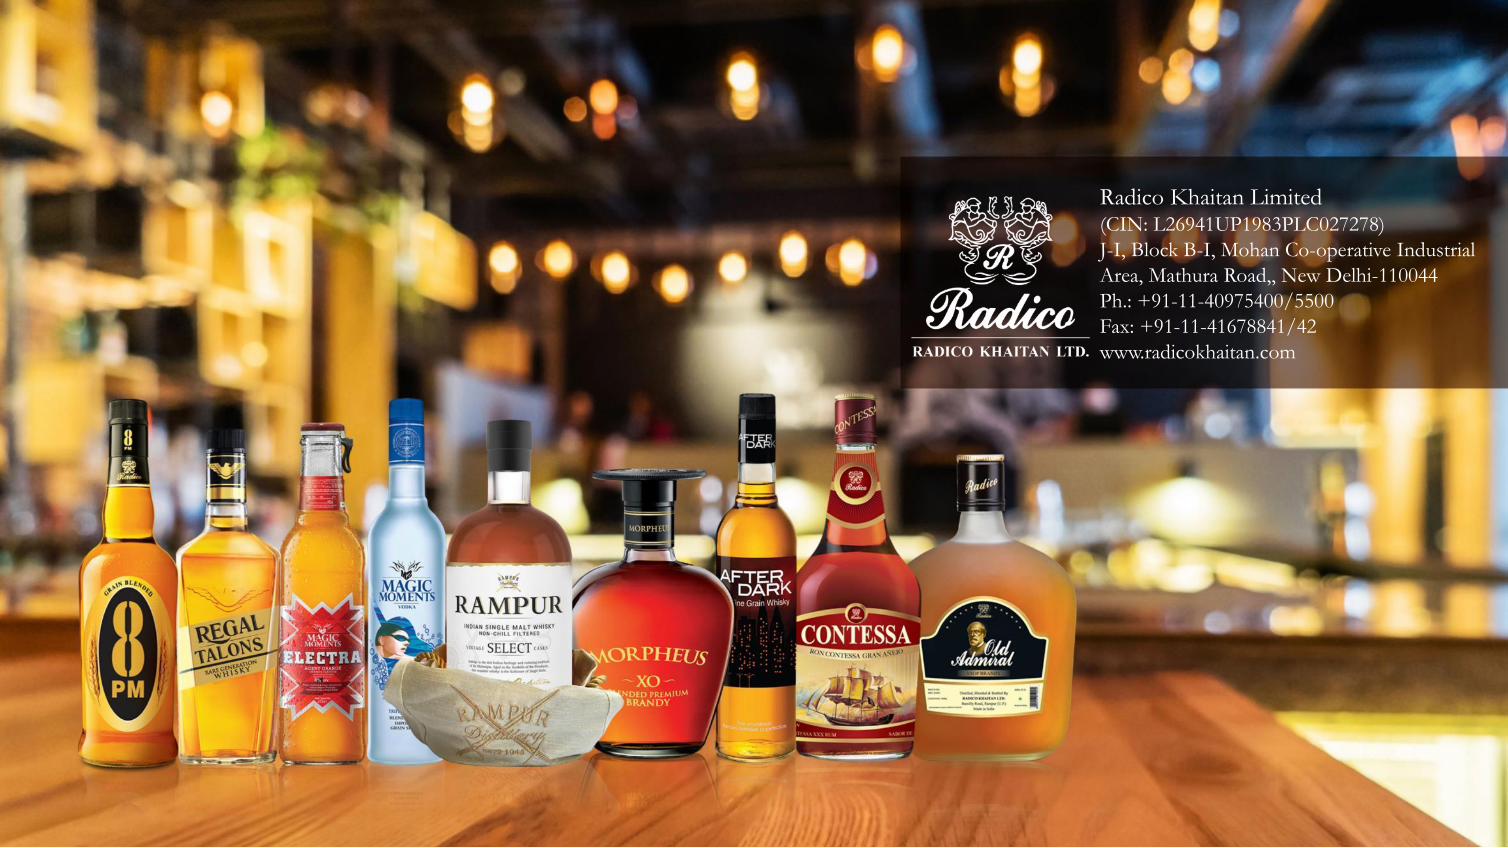
Radico Khaitan Limited(CIN: L26941UP1983PLC027278)
J-I, Block B-I, Mohan Co-operative Industrial
Area, Mathura Road,, New Delhi-110044
Ph.: +91-11-40975400/5500
Fax: +91-11-41678841/42
www.radicokhaitan.com