Embed Size (px)
Citation preview
Q4 & FY2017 Results
Disclaimer
Certain statements in this communication may be ‘forward looking statements’ within the meaning of applicable
laws and regulations. These forward-looking statements involve a number of risks, uncertainties and other factors
that could cause actual results to differ materially from those suggested by the forward-looking statements.
Important developments that could affect the Company’s operations include changes in the industry structure,
significant changes in political and economic environment in India and overseas, tax laws, import duties, litigation
and labour relations.
The Phoenix Mills Ltd. (PML) will not be in any way responsible for any action taken based on such statements and
undertakes no obligation to publicly update these forward-looking statements to reflect subsequent events or
circumstances.
2
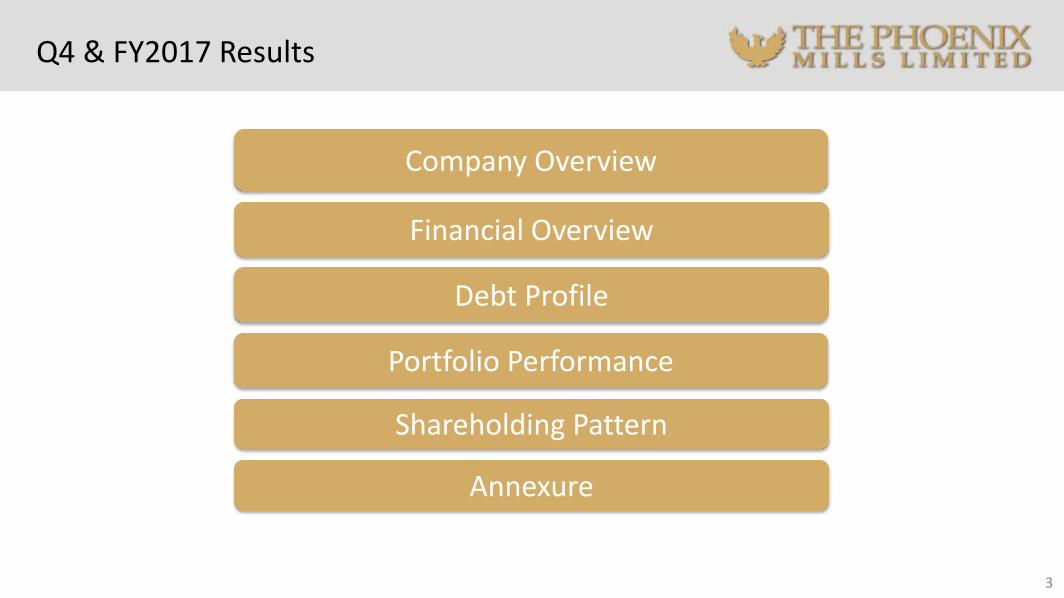
Q4 & FY2017 Results
Portfolio Performance
Shareholding Pattern
Company Overview
3
Debt Profile
Financial Overview
Annexure
Company Overview
4
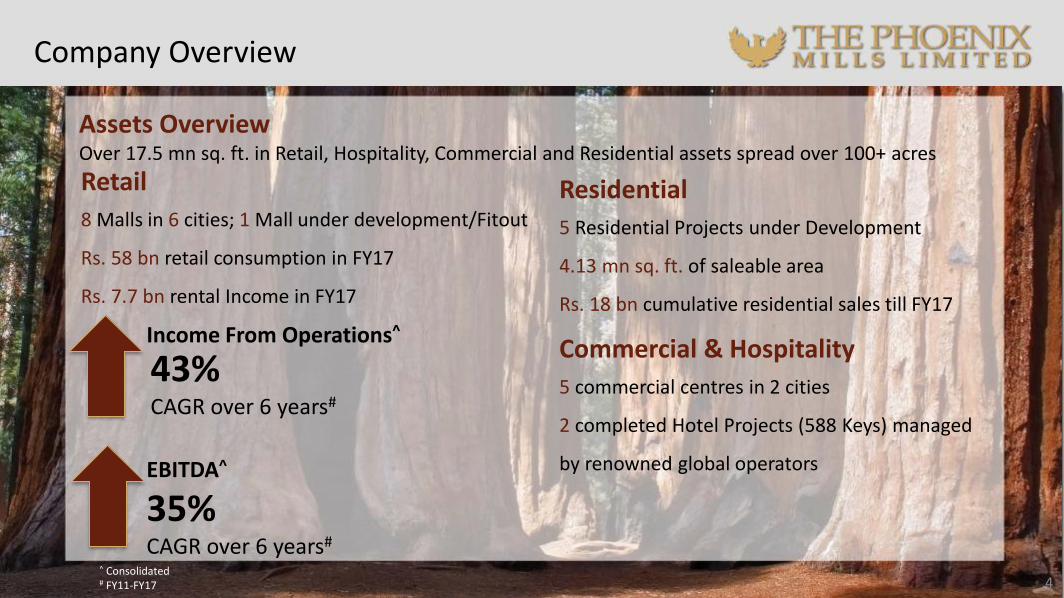
Assets OverviewOver 17.5 mn sq. ft. in Retail, Hospitality, Commercial and Residential assets spread over 100+ acres
Retail
8 Malls in 6 cities; 1 Mall under development/Fitout
Rs. 58 bn retail consumption in FY17
Rs. 7.7 bn rental Income in FY17
Residential
5 Residential Projects under Development
4.13 mn sq. ft. of saleable area
Rs. 18 bn cumulative residential sales till FY17
Commercial & Hospitality
5 commercial centres in 2 cities
2 completed Hotel Projects (588 Keys) managed
by renowned global operators
Income From Operations^
43%CAGR over 6 years#
EBITDA^
35%CAGR over 6 years#
^ Consolidated# FY11-FY17
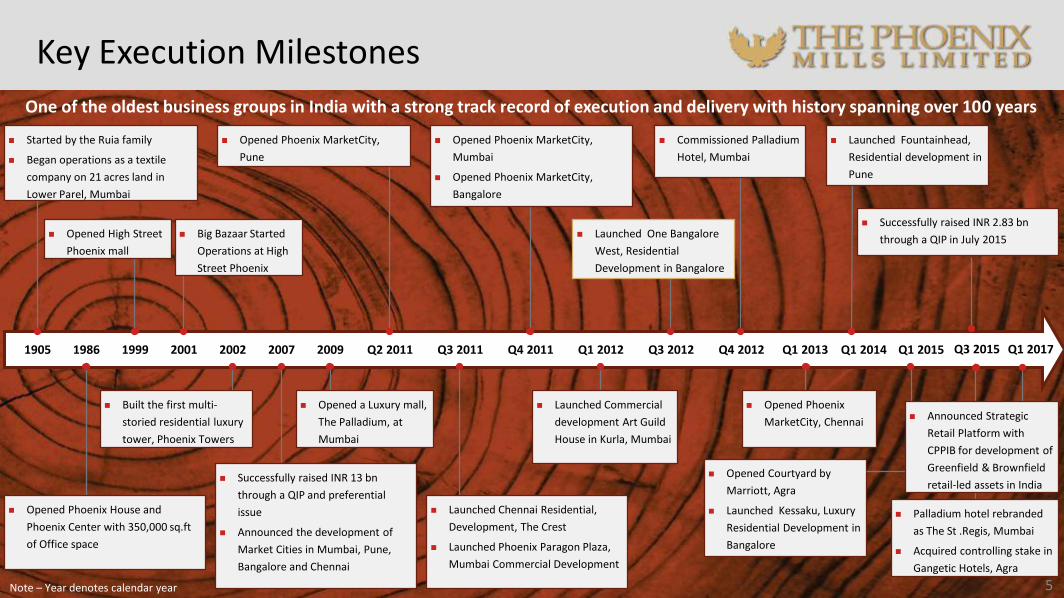
Key Execution Milestones
5
One of the oldest business groups in India with a strong track record of execution and delivery with history spanning over 100 years
Started by the Ruia family
Began operations as a textile
company on 21 acres land in
Lower Parel, Mumbai
Opened Phoenix MarketCity,
Pune
Opened Courtyard by
Marriott, Agra
Launched Kessaku, Luxury
Residential Development in
Bangalore
Opened Phoenix MarketCity,
Mumbai
Opened Phoenix MarketCity,
Bangalore
Commissioned Palladium
Hotel, Mumbai
1999 2002 Q1 20151905 Q1 2014Q4 2012 Q1 2013Q4 2011Q2 20112007 20091986 Q1 2012 Q3 20122001 Q3 2011
Successfully raised INR 13 bn
through a QIP and preferential
issue
Announced the development of
Market Cities in Mumbai, Pune,
Bangalore and Chennai
Built the first multi-
storied residential luxury
tower, Phoenix Towers
Opened a Luxury mall,
The Palladium, at
Mumbai
Opened High Street
Phoenix mall
Opened Phoenix
MarketCity, Chennai
Launched Chennai Residential,
Development, The Crest
Launched Phoenix Paragon Plaza,
Mumbai Commercial Development
Launched Commercial
development Art Guild
House in Kurla, Mumbai
Big Bazaar Started
Operations at High
Street Phoenix
Launched Fountainhead,
Residential development in
Pune
Launched One Bangalore
West, Residential
Development in Bangalore
Opened Phoenix House and
Phoenix Center with 350,000 sq.ft
of Office space
Note – Year denotes calendar year
Q3 2015
Successfully raised INR 2.83 bn
through a QIP in July 2015
Palladium hotel rebranded
as The St .Regis, Mumbai
Acquired controlling stake in
Gangetic Hotels, Agra
Q1 2017
Announced Strategic
Retail Platform with
CPPIB for development of
Greenfield & Brownfield
retail-led assets in India
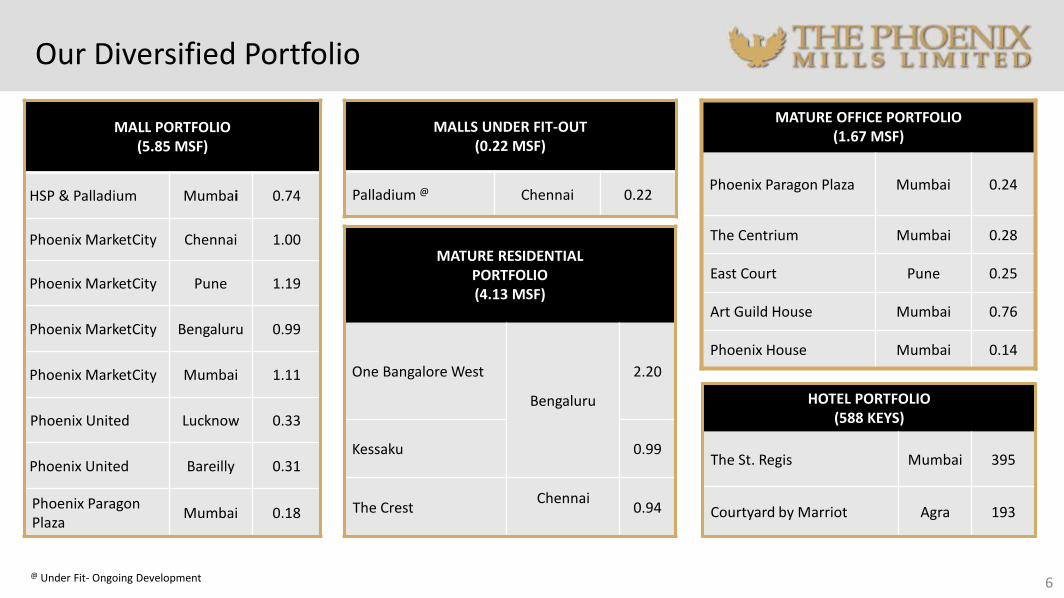
Our Diversified Portfolio
MALL PORTFOLIO (5.85 MSF)
HSP & Palladium Mumbai 0.74
Phoenix MarketCity Chennai 1.00
Phoenix MarketCity Pune 1.19
Phoenix MarketCity Bengaluru 0.99
Phoenix MarketCity Mumbai 1.11
Phoenix United Lucknow 0.33
Phoenix United Bareilly 0.31
Phoenix Paragon Plaza
Mumbai 0.18
MALLS UNDER FIT-OUT(0.22 MSF)
Palladium @ Chennai 0.22
MATURE RESIDENTIAL PORTFOLIO (4.13 MSF)
One Bangalore West
Bengaluru
2.20
Kessaku 0.99
The CrestChennai
0.94
MATURE OFFICE PORTFOLIO (1.67 MSF)
Phoenix Paragon Plaza Mumbai 0.24
The Centrium Mumbai 0.28
East Court Pune 0.25
Art Guild House Mumbai 0.76
Phoenix House Mumbai 0.14
HOTEL PORTFOLIO(588 KEYS)
The St. Regis Mumbai 395
Courtyard by Marriot Agra 193
@ Under Fit- Ongoing Development 6
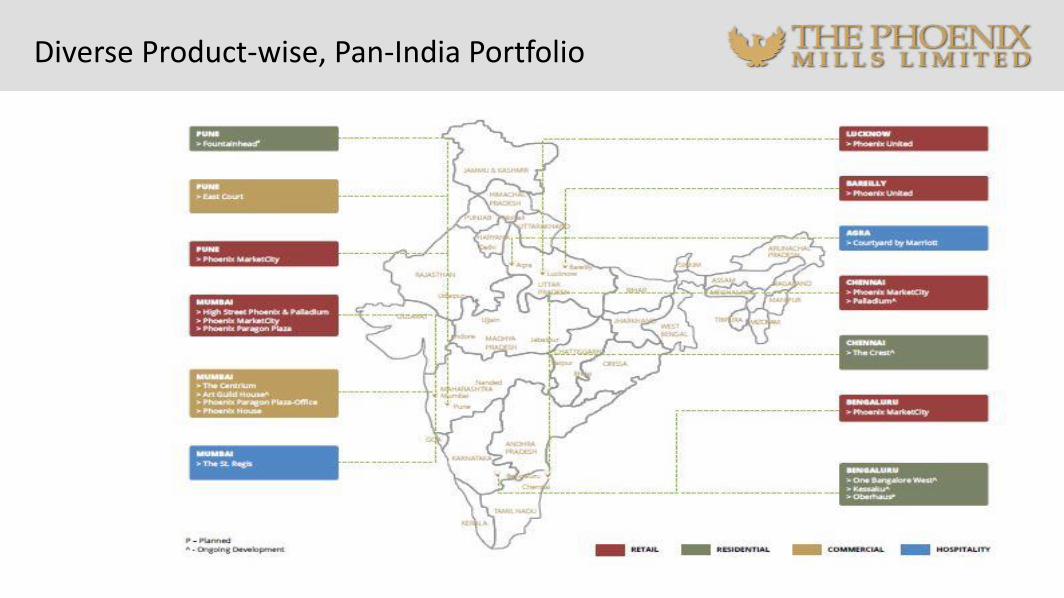
Diverse Product-wise, Pan-India Portfolio
7
Financial Overview – Standalone P&L
^ Q4FY16 & FY16 numbers are re-stated as per Ind-AS
(Rs. mn) Q4 FY17 Q4 FY16^% yoy
growthFY17 FY16^
% yoy growth
Income from operations
919 915 3,759 3,558 6%
EBITDA 603 612 2,538 2,391 6%
EBITDA Margin (%) 66% 67% 68% 67%
Profit Before Tax and exceptional item
445 591 1,975 2,395
Profit after tax & before comprehensive income# 368 149 147% 1,335 1,496
Diluted EPS (Rs.) 2.39 0.93 157% 8.71 9.93
8
Rs. 3,759 mn
FY17 EBITDA
Rs. 2,538 mn
6%yoy
6%yoy
FY17 Income from Operations
Financial Overview – Standalone Balance Sheet
(Rs. mn) As on 31st Mar 2017 (Rs. mn) As on 31st Mar 2017
Share Capital 306 Non Current Assets
Reserves & Surplus 24,015 Tangible Assets 6,058
Sub-Total 24,321 Capital Work In Progress 1,434
Minority Interest - Non-Current Investments 22,826
Non – Current Liabilities Long-term Loans and Advances 79
Long Term Borrowings 5,751 Other Non-Current Assets 1,551
Other Long-term Liabilities 1,100 Current Assets
Long Term Provisions 7 Inventories -
Current Liabilities Trade Receivables 192
Short-term Borrowings 1,026 Cash & Cash Equivalents 68
Trade Payables 169 Short-term Loans and Advances 1,261
Other Current Liabilities 1,486 Other Current Assets 390
Total 33,859 Total 33,859
Financial Overview – Consolidated P&L
^^PAT after minority interest & before comprehensive income ^Q4FY16 & FY16 numbers are restated as per Ind-AS #The number of shares outstanding has increased post Q1FY16 on account of QIP issue in July 2015 and ESOP allotment # For Q4FY17 10
(Rs. mn) Q4 FY17 Q4 FY16^% yoy
growthFY17 FY16^
% yoygrowth
Income from operations 4,544 4,667 18,246 17,795 3%
Retail 3,052 2,781 10% 11,930 11,145 7%
Residential 319 697 2,449 2,742
Commercial 273 383 796 1,431
Hospitality & Others 900 815 10% 3,072 2,477 24%
EBITDA 1,997 2,049 8,469 7,869 8%
EBITDA Margin (%) 44% 44% 46% 44%
Profit after tax 512 -105 1,900 820 132%
PAT after minority interest & before other comprehensive income
261 63 1,679 1,289 29%
PAT after minority interest & after other comprehensive income
63 30 110% 1,674 1,295 28%
Diluted EPS (Rs.) # 1.70 0.44 10.97 8.89 23%
FY17 Income from Operations
#
Rs. 18,246 mn
FY17 EBITDA#
Rs. 8,469 mn
FY17 PAT^^ #
Rs. 1,679 mn29%yoy
3%yoy
8%yoy
Financial Overview – Consolidated Balance Sheet
(Rs. Mn) As on 31st Mar, 2017 (Rs. Mn) As on 31st Mar, 2017
Shareholder’s Equity Non Current AssetsShare Capital 306 Tangible Assets 42,002
Reserves & Surplus 21,565 Intangible Assets 3,377
Sub-Total 21,871 Capital Work in Progress 3,277
Minority Interest 2,797 Non-Current Investments 4,096
Non-Current Liabilities Long-term Loans and Advances 89
Long-term Borrowings 31,066 Other Non-Current Assets 3,543
Other Long-term Liabilities 3,032 Current AssetsLong-term Provisions 443 Inventories 9,455
Current Liabilities Trade Receivables 1,470
Short-term Borrowings 2,476Cash & Cash Equivalents and Current Investments
641
Trade Payables 1,077 Short-term Loans and Advances 340Other Current Liabilities 7,345 Other Current Assets 2,162
Short-term Provisions 345
Total 70,452 Total 70,452
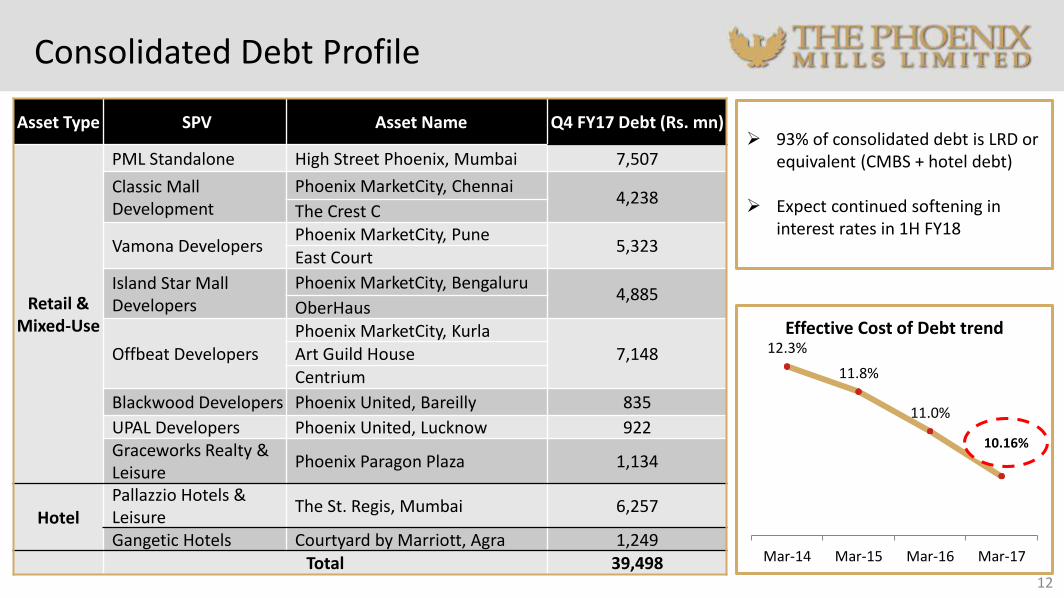
Consolidated Debt Profile
12
Asset Type SPV Asset Name Q4 FY17 Debt (Rs. mn)
Retail & Mixed-Use
PML Standalone High Street Phoenix, Mumbai 7,507
Classic Mall Development
Phoenix MarketCity, Chennai 4,238
The Crest C
Vamona DevelopersPhoenix MarketCity, Pune
5,323East Court
Island Star Mall Developers
Phoenix MarketCity, Bengaluru4,885
OberHaus
Offbeat DevelopersPhoenix MarketCity, Kurla
7,148Art Guild House Centrium
Blackwood Developers Phoenix United, Bareilly 835
UPAL Developers Phoenix United, Lucknow 922Graceworks Realty & Leisure
Phoenix Paragon Plaza 1,134
HotelPallazzio Hotels & Leisure
The St. Regis, Mumbai 6,257
Gangetic Hotels Courtyard by Marriott, Agra 1,249Total 39,498
93% of consolidated debt is LRD or equivalent (CMBS + hotel debt)
Expect continued softening in interest rates in 1H FY18
12.3%
11.8%
11.0%
10.16%
Mar-14 Mar-15 Mar-16 Mar-17
Effective Cost of Debt trend
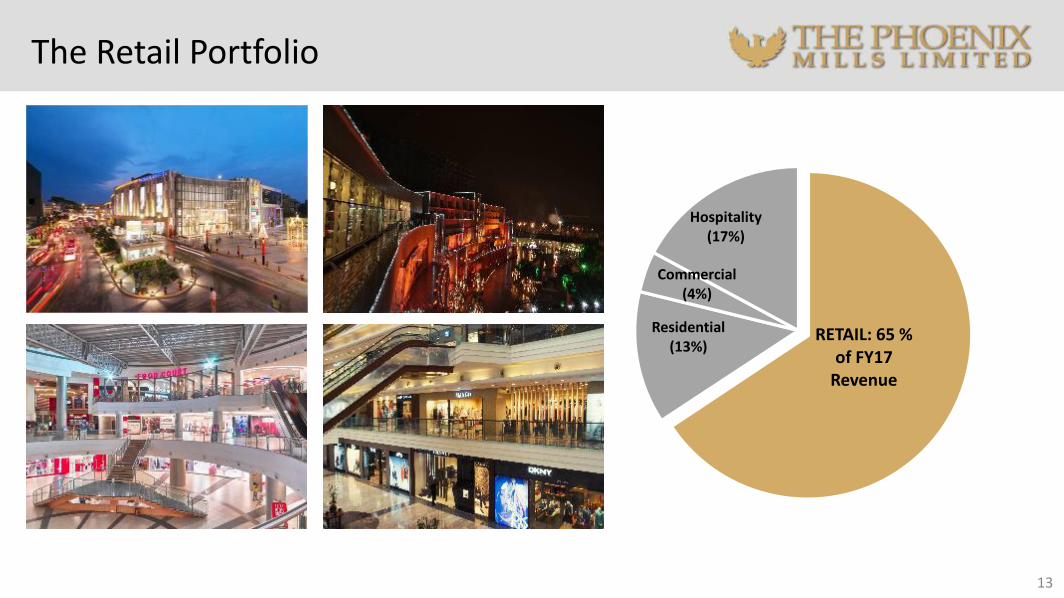
The Retail Portfolio
13
RETAIL: 65 % of FY17
Revenue
Residential (13%)
Commercial (4%)
Hospitality (17%)
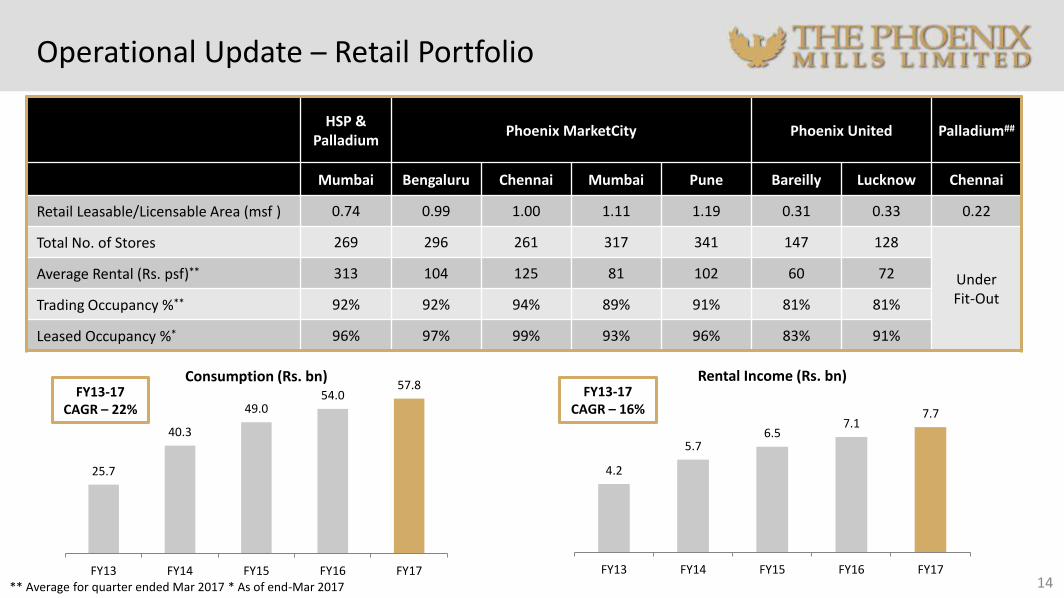
Operational Update – Retail Portfolio
14
HSP & Palladium
Phoenix MarketCity Phoenix United Palladium##
Mumbai Bengaluru Chennai Mumbai Pune Bareilly Lucknow Chennai
Retail Leasable/Licensable Area (msf ) 0.74 0.99 1.00 1.11 1.19 0.31 0.33 0.22
Total No. of Stores 269 296 261 317 341 147 128
Under Fit-Out
Average Rental (Rs. psf)** 313 104 125 81 102 60 72
Trading Occupancy %** 92% 92% 94% 89% 91% 81% 81%
Leased Occupancy %* 96% 97% 99% 93% 96% 83% 91%
25.7
40.3
49.054.0
57.8
FY13 FY14 FY15 FY16 FY17
Consumption (Rs. bn)
4.2
5.76.5
7.17.7
FY13 FY14 FY15 FY16 FY17
Rental Income (Rs. bn)
** Average for quarter ended Mar 2017 * As of end-Mar 2017
FY13-17 CAGR – 22%
FY13-17 CAGR – 16%
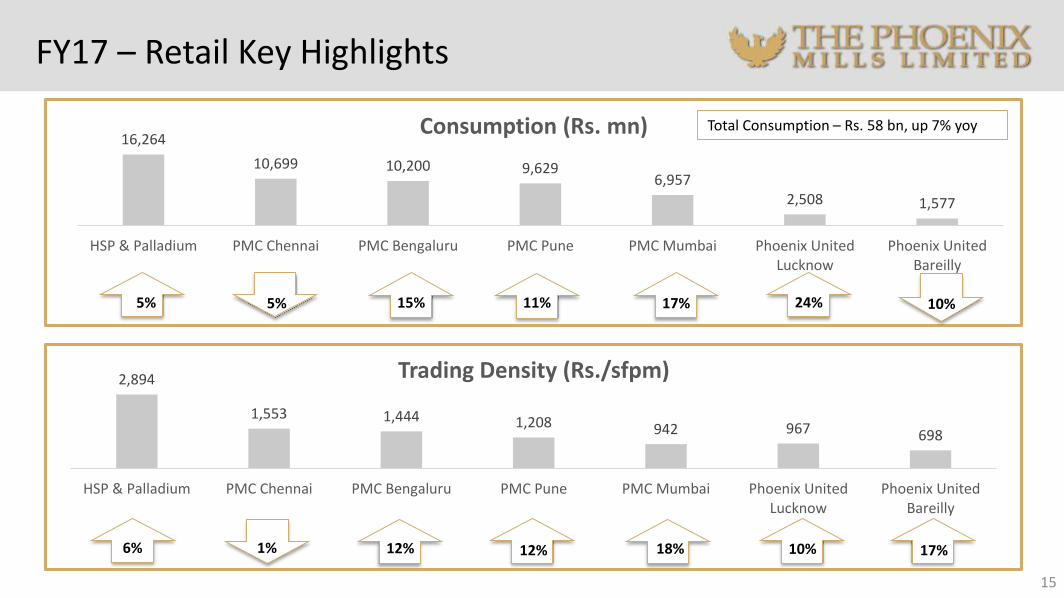
FY17 – Retail Key Highlights
15
16,264
10,699 10,200 9,6296,957
2,508 1,577
HSP & Palladium PMC Chennai PMC Bengaluru PMC Pune PMC Mumbai Phoenix UnitedLucknow
Phoenix UnitedBareilly
Consumption (Rs. mn) Total Consumption – Rs. 58 bn, up 7% yoy
5% 15% 11% 17%5% 24% 10%
2,894
1,553 1,444 1,208 942 967 698
HSP & Palladium PMC Chennai PMC Bengaluru PMC Pune PMC Mumbai Phoenix UnitedLucknow
Phoenix UnitedBareilly
Trading Density (Rs./sfpm)
6% 12% 12% 18%1% 10% 17%
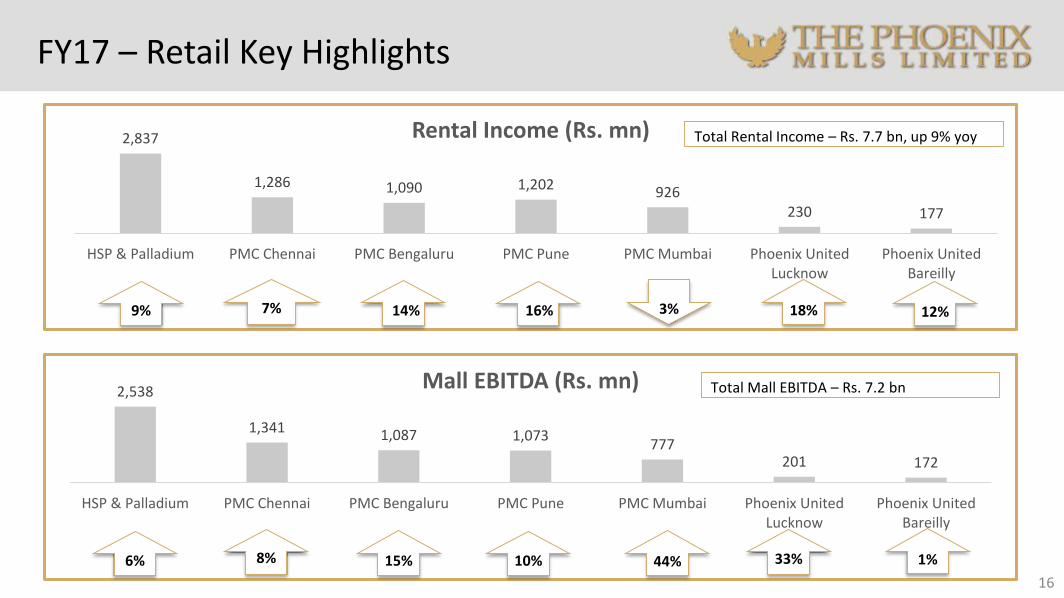
2,837
1,286 1,090 1,202 926230 177
HSP & Palladium PMC Chennai PMC Bengaluru PMC Pune PMC Mumbai Phoenix UnitedLucknow
Phoenix UnitedBareilly
Rental Income (Rs. mn) Total Rental Income – Rs. 7.7 bn, up 9% yoy
FY17 – Retail Key Highlights
16
2,538
1,341 1,087 1,073777
201 172
HSP & Palladium PMC Chennai PMC Bengaluru PMC Pune PMC Mumbai Phoenix UnitedLucknow
Phoenix UnitedBareilly
Mall EBITDA (Rs. mn) Total Mall EBITDA – Rs. 7.2 bn
9% 14% 16%8% 18% 12%
6% 15% 10% 44%8%8%
7% 3%
33% 1%
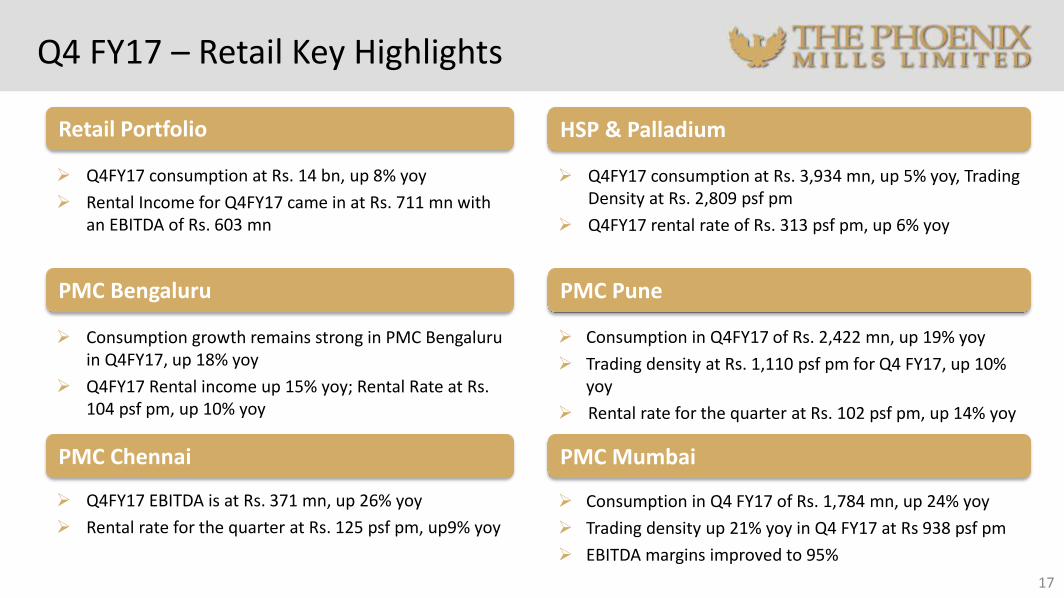
Q4 FY17 – Retail Key Highlights
17
HSP & Palladium
Q4FY17 consumption at Rs. 3,934 mn, up 5% yoy, Trading Density at Rs. 2,809 psf pm
Q4FY17 rental rate of Rs. 313 psf pm, up 6% yoy
PMC Pune
PMC Mumbai
Consumption in Q4FY17 of Rs. 2,422 mn, up 19% yoy
Trading density at Rs. 1,110 psf pm for Q4 FY17, up 10% yoy
Rental rate for the quarter at Rs. 102 psf pm, up 14% yoy
Consumption in Q4 FY17 of Rs. 1,784 mn, up 24% yoy
Trading density up 21% yoy in Q4 FY17 at Rs 938 psf pm
EBITDA margins improved to 95%
Q4FY17 consumption at Rs. 14 bn, up 8% yoy
Rental Income for Q4FY17 came in at Rs. 711 mn with an EBITDA of Rs. 603 mn
Q4FY17 EBITDA is at Rs. 371 mn, up 26% yoy
Rental rate for the quarter at Rs. 125 psf pm, up9% yoy
Retail Portfolio
PMC Bengaluru
PMC Chennai
Consumption growth remains strong in PMC Bengaluru in Q4FY17, up 18% yoy
Q4FY17 Rental income up 15% yoy; Rental Rate at Rs. 104 psf pm, up 10% yoy
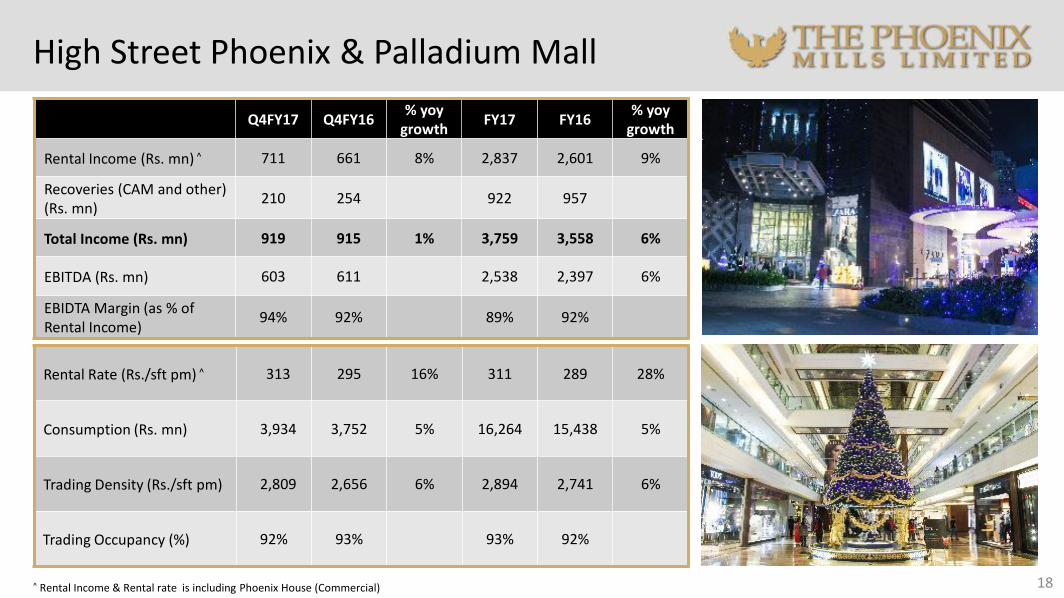
High Street Phoenix & Palladium Mall
18
Q4FY17 Q4FY16 % yoy
growthFY17 FY16
% yoygrowth
Rental Income (Rs. mn) ^ 711 661 8% 2,837 2,601 9%
Recoveries (CAM and other) (Rs. mn)
210 254 922 957
Total Income (Rs. mn) 919 915 1% 3,759 3,558 6%
EBITDA (Rs. mn) 603 611 2,538 2,397 6%
EBIDTA Margin (as % of Rental Income)
94% 92% 89% 92%
Rental Rate (Rs./sft pm) ^ 313 295 16% 311 289 28%
Consumption (Rs. mn) 3,934 3,752 5% 16,264 15,438 5%
Trading Density (Rs./sft pm) 2,809 2,656 6% 2,894 2,741 6%
Trading Occupancy (%) 92% 93% 93% 92%
^ Rental Income & Rental rate is including Phoenix House (Commercial)
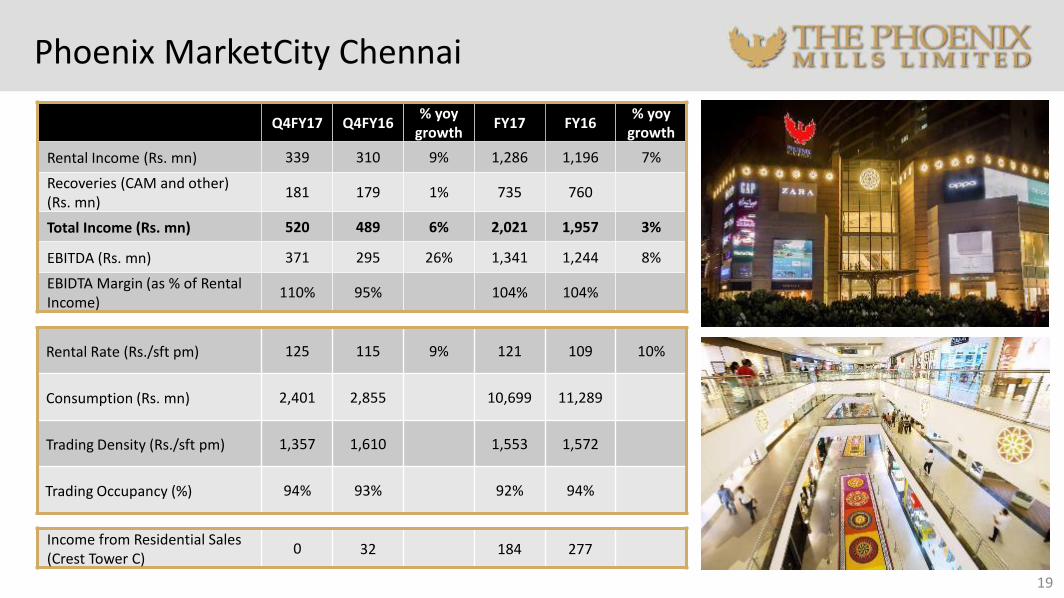
Phoenix MarketCity Chennai
19
Q4FY17 Q4FY16 % yoy
growthFY17 FY16
% yoygrowth
Rental Income (Rs. mn) 339 310 9% 1,286 1,196 7%
Recoveries (CAM and other) (Rs. mn)
181 179 1% 735 760
Total Income (Rs. mn) 520 489 6% 2,021 1,957 3%
EBITDA (Rs. mn) 371 295 26% 1,341 1,244 8%
EBIDTA Margin (as % of Rental Income)
110% 95% 104% 104%
Rental Rate (Rs./sft pm) 125 115 9% 121 109 10%
Consumption (Rs. mn) 2,401 2,855 10,699 11,289
Trading Density (Rs./sft pm) 1,357 1,610 1,553 1,572
Trading Occupancy (%) 94% 93% 92% 94%
Income from Residential Sales (Crest Tower C)
0 32 184 277
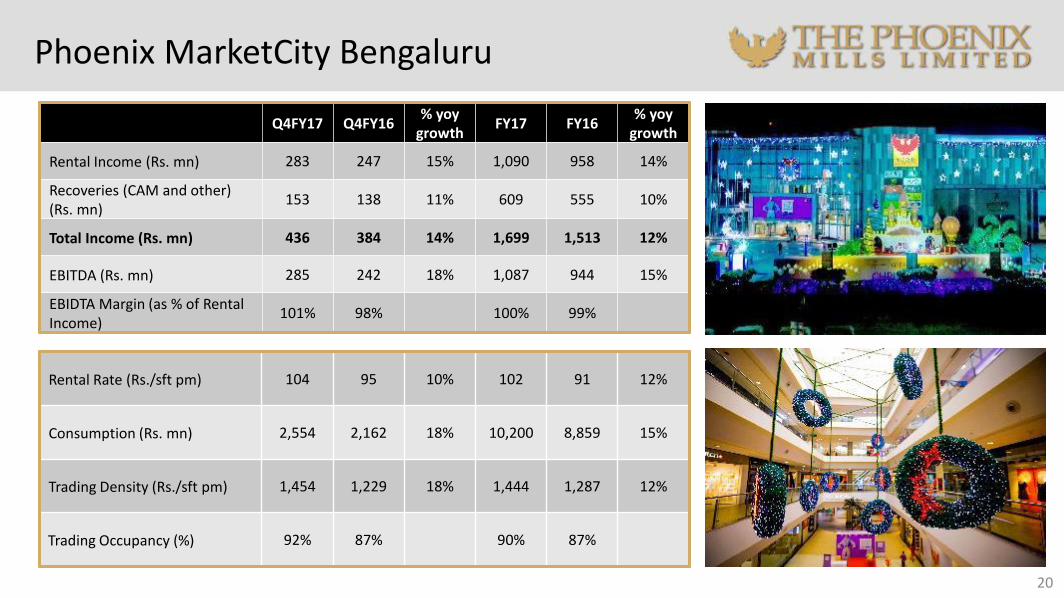
Phoenix MarketCity Bengaluru
20
Q4FY17 Q4FY16 % yoy
growthFY17 FY16
% yoygrowth
Rental Income (Rs. mn) 283 247 15% 1,090 958 14%
Recoveries (CAM and other) (Rs. mn)
153 138 11% 609 555 10%
Total Income (Rs. mn) 436 384 14% 1,699 1,513 12%
EBITDA (Rs. mn) 285 242 18% 1,087 944 15%
EBIDTA Margin (as % of Rental Income)
101% 98% 100% 99%
Rental Rate (Rs./sft pm) 104 95 10% 102 91 12%
Consumption (Rs. mn) 2,554 2,162 18% 10,200 8,859 15%
Trading Density (Rs./sft pm) 1,454 1,229 18% 1,444 1,287 12%
Trading Occupancy (%) 92% 87% 90% 87%
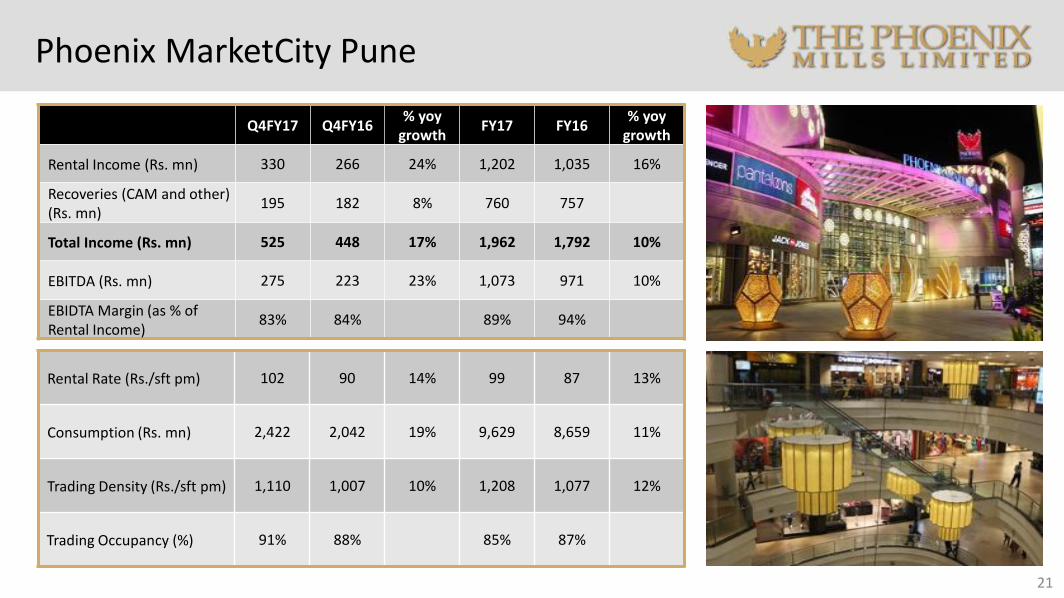
Phoenix MarketCity Pune
21
Q4FY17 Q4FY16 % yoy
growthFY17 FY16
% yoygrowth
Rental Income (Rs. mn) 330 266 24% 1,202 1,035 16%
Recoveries (CAM and other) (Rs. mn)
195 182 8% 760 757
Total Income (Rs. mn) 525 448 17% 1,962 1,792 10%
EBITDA (Rs. mn) 275 223 23% 1,073 971 10%
EBIDTA Margin (as % of Rental Income)
83% 84% 89% 94%
Rental Rate (Rs./sft pm) 102 90 14% 99 87 13%
Consumption (Rs. mn) 2,422 2,042 19% 9,629 8,659 11%
Trading Density (Rs./sft pm) 1,110 1,007 10% 1,208 1,077 12%
Trading Occupancy (%) 91% 88% 85% 87%
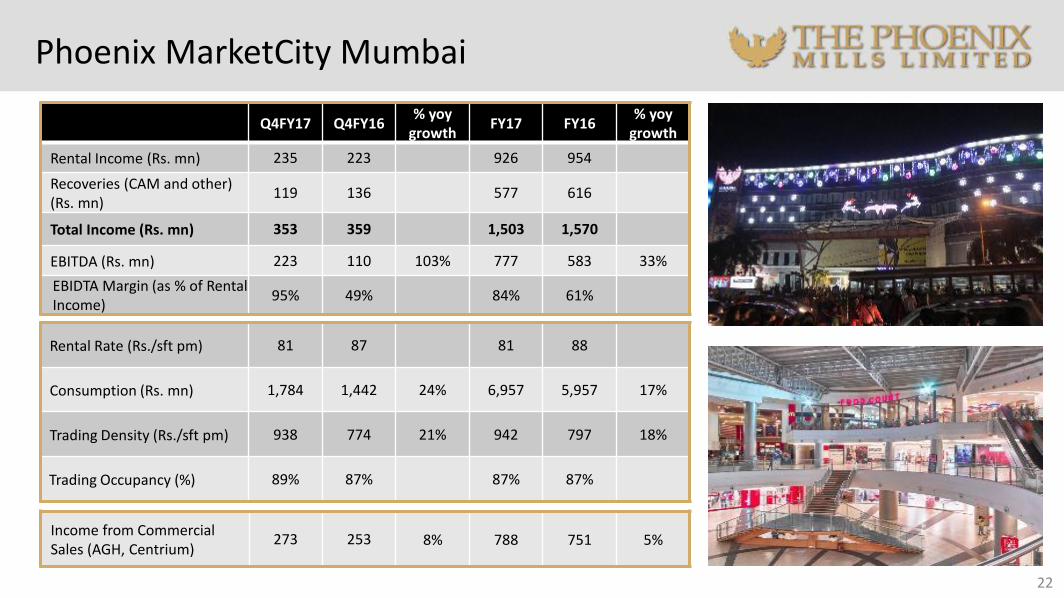
22
Q4FY17 Q4FY16 % yoy
growthFY17 FY16
% yoygrowth
Rental Income (Rs. mn) 235 223 926 954
Recoveries (CAM and other) (Rs. mn)
119 136 577 616
Total Income (Rs. mn) 353 359 1,503 1,570
EBITDA (Rs. mn) 223 110 103% 777 583 33%
EBIDTA Margin (as % of Rental Income)
95% 49% 84% 61%
Rental Rate (Rs./sft pm) 81 87 81 88
Consumption (Rs. mn) 1,784 1,442 24% 6,957 5,957 17%
Trading Density (Rs./sft pm) 938 774 21% 942 797 18%
Trading Occupancy (%) 89% 87% 87% 87%
Income from Commercial Sales (AGH, Centrium)
273 253 8% 788 751 5%
Phoenix MarketCity Mumbai
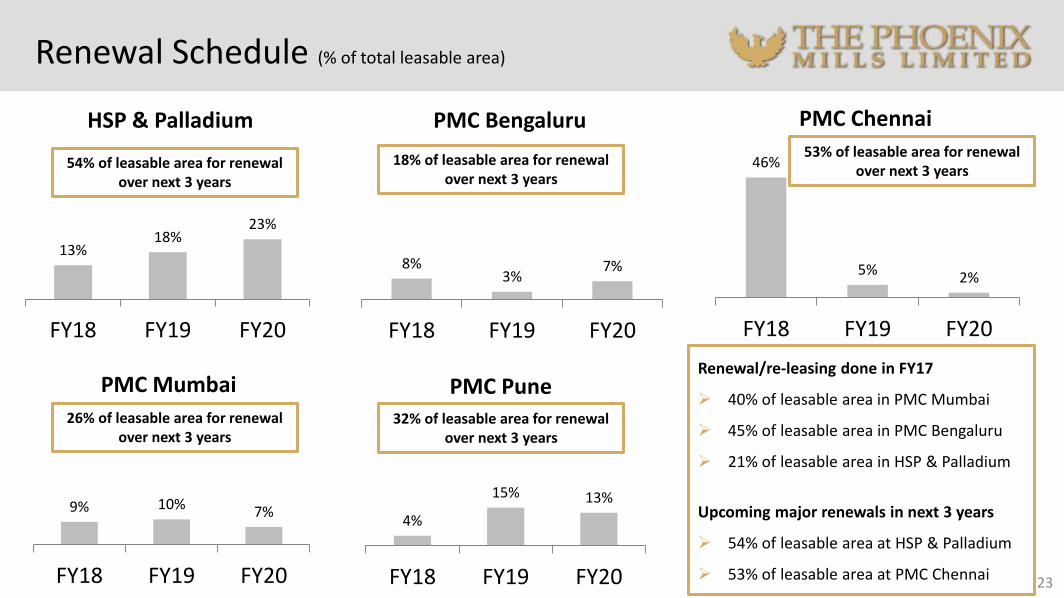
Renewal Schedule (% of total leasable area)
23
8%3%
7%
FY18 FY19 FY20
PMC Bengaluru
9% 10% 7%
FY18 FY19 FY20
PMC Mumbai
13%18%
23%
FY18 FY19 FY20
HSP & Palladium
4%
15% 13%
FY18 FY19 FY20
PMC Pune
46%
5% 2%
FY18 FY19 FY20
PMC Chennai
Renewal/re-leasing done in FY17
40% of leasable area in PMC Mumbai
45% of leasable area in PMC Bengaluru
21% of leasable area in HSP & Palladium
Upcoming major renewals in next 3 years
54% of leasable area at HSP & Palladium
53% of leasable area at PMC Chennai
54% of leasable area for renewal over next 3 years
18% of leasable area for renewal over next 3 years
53% of leasable area for renewal over next 3 years
26% of leasable area for renewal over next 3 years
32% of leasable area for renewal over next 3 years

Retail (65%)
RESIDENTIAL: 13% of FY17
Revenue
Commercial (4%)
Hospitality (17%)
The Residential Portfolio
KESSAKU - BENGALURU
24
ONE BANGALORE WEST - BENGALURU
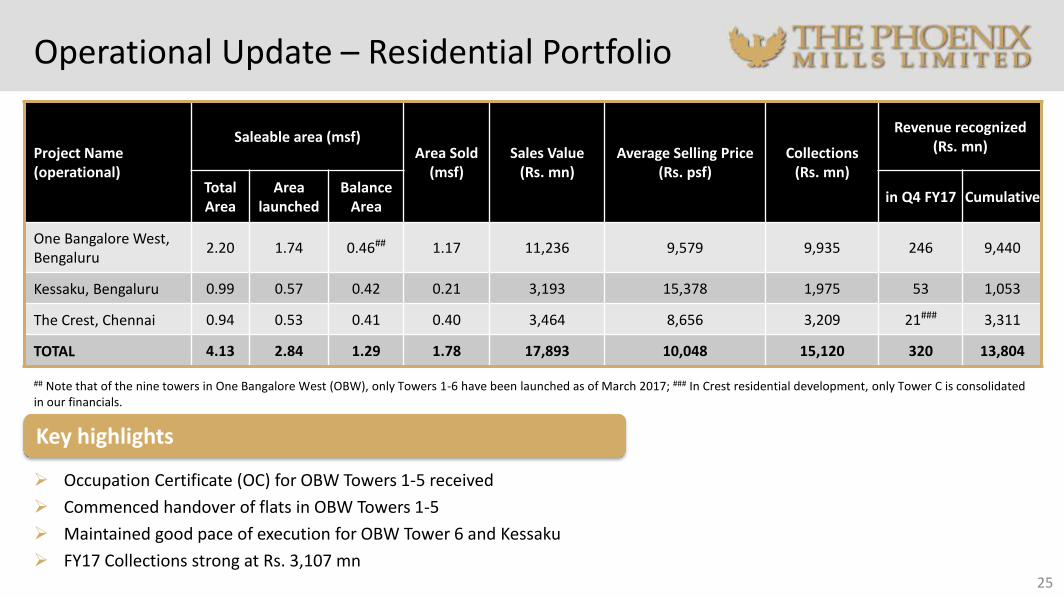
Operational Update – Residential Portfolio
## Note that of the nine towers in One Bangalore West (OBW), only Towers 1-6 have been launched as of March 2017; ### In Crest residential development, only Tower C is consolidated in our financials.
25
Project Name (operational)
Saleable area (msf)Area Sold
(msf) Sales Value
(Rs. mn) Average Selling Price
(Rs. psf)Collections
(Rs. mn)
Revenue recognized (Rs. mn)
Total Area
Area launched
Balance Area
in Q4 FY17 Cumulative
One Bangalore West, Bengaluru
2.20 1.74 0.46## 1.17 11,236 9,579 9,935 246 9,440
Kessaku, Bengaluru 0.99 0.57 0.42 0.21 3,193 15,378 1,975 53 1,053
The Crest, Chennai 0.94 0.53 0.41 0.40 3,464 8,656 3,209 21### 3,311
TOTAL 4.13 2.84 1.29 1.78 17,893 10,048 15,120 320 13,804
Occupation Certificate (OC) for OBW Towers 1-5 received
Commenced handover of flats in OBW Towers 1-5
Maintained good pace of execution for OBW Tower 6 and Kessaku
FY17 Collections strong at Rs. 3,107 mn
Key highlights
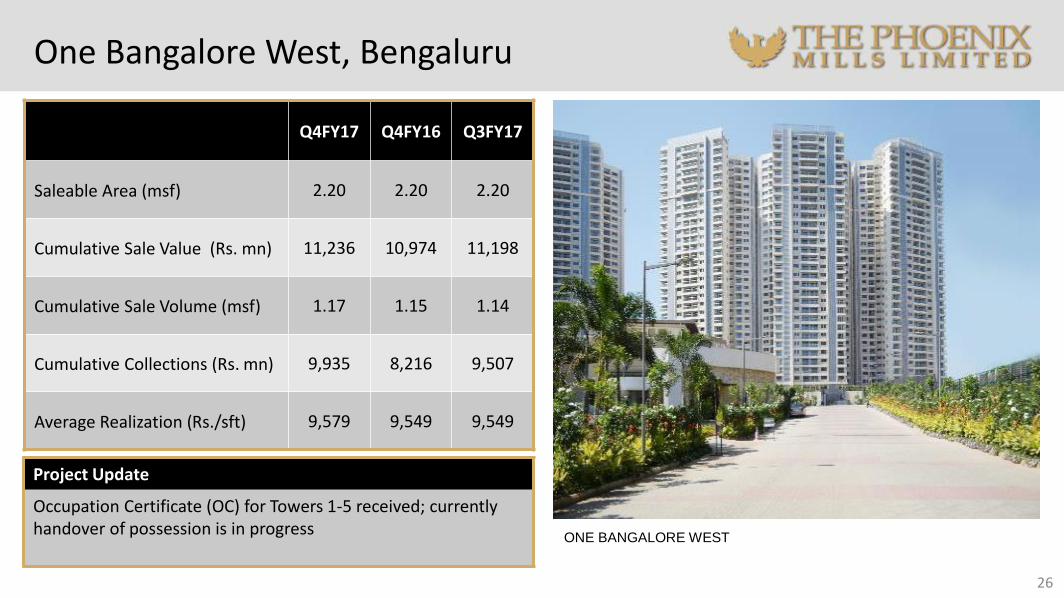
One Bangalore West, Bengaluru
26
Q4FY17 Q4FY16 Q3FY17
Saleable Area (msf) 2.20 2.20 2.20
Cumulative Sale Value (Rs. mn) 11,236 10,974 11,198
Cumulative Sale Volume (msf) 1.17 1.15 1.14
Cumulative Collections (Rs. mn) 9,935 8,216 9,507
Average Realization (Rs./sft) 9,579 9,549 9,549
ONE BANGALORE WEST
Project Update
Occupation Certificate (OC) for Towers 1-5 received; currently handover of possession is in progress
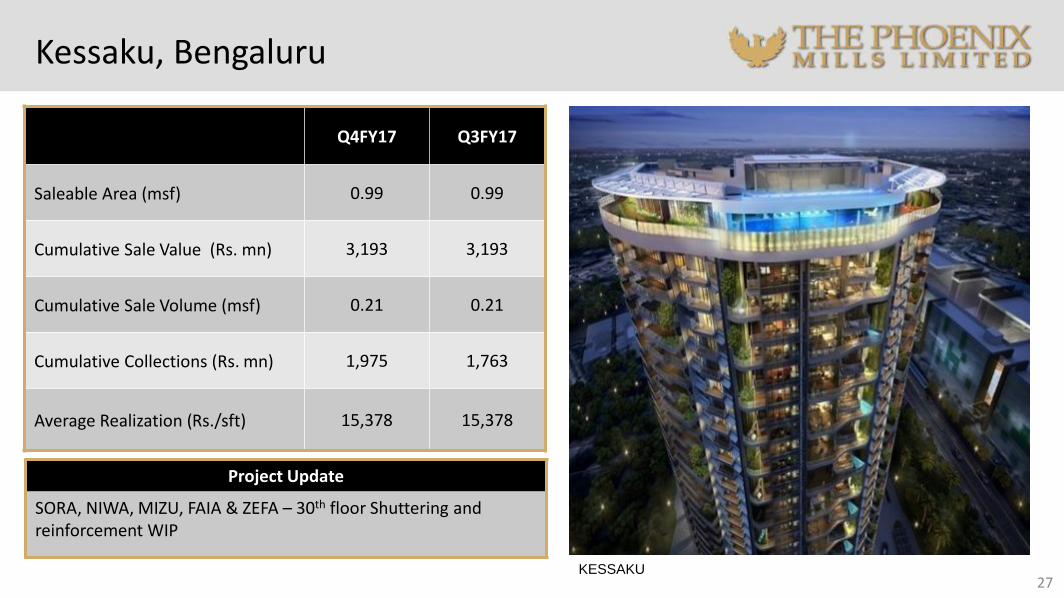
Kessaku, Bengaluru
27KESSAKU
Q4FY17 Q3FY17
Saleable Area (msf) 0.99 0.99
Cumulative Sale Value (Rs. mn) 3,193 3,193
Cumulative Sale Volume (msf) 0.21 0.21
Cumulative Collections (Rs. mn) 1,975 1,763
Average Realization (Rs./sft) 15,378 15,378
SORA -18th floor slab complete, NIWA -17th floor shuttering WIP, MIZU – 15th
Floor concreting done, FAIA & ZEFA – 16th floor Shuttering WIP
Project Update
SORA, NIWA, MIZU, FAIA & ZEFA – 30th floor Shuttering and reinforcement WIP
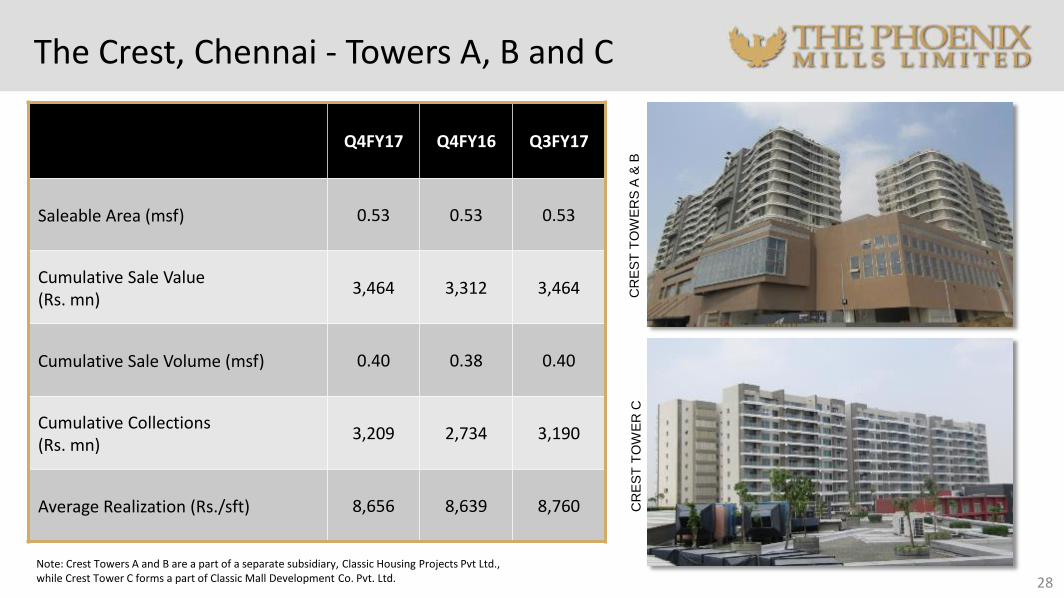
The Crest, Chennai - Towers A, B and C
Note: Crest Towers A and B are a part of a separate subsidiary, Classic Housing Projects Pvt Ltd., while Crest Tower C forms a part of Classic Mall Development Co. Pvt. Ltd.
CR
ES
T T
OW
ER
S A
& B
CR
ES
T T
OW
ER
C
28
Q4FY17 Q4FY16 Q3FY17
Saleable Area (msf) 0.53 0.53 0.53
Cumulative Sale Value (Rs. mn)
3,464 3,312 3,464
Cumulative Sale Volume (msf) 0.40 0.38 0.40
Cumulative Collections (Rs. mn)
3,209 2,734 3,190
Average Realization (Rs./sft) 8,656 8,639 8,760
The Commercial Portfolio
ART GUILD HOUSE - MUMBAI
EAST COURT - PUNE
CENTRIUM - MUMBAI
PHOENIX PARAGON PLAZA - MUMBAI
29
Retail (65%)
Residential (13%)
COMMERCIAL: 4 % of FY17 Revenue
Hospitality (17%)
Operational Update – Commercial Portfolio
30
Project Name
Total Area (msf)
Area Sold (msf)
Net Leasable
Area (msf)
Area Leased (msf)
Average Rate
(Rs./sq.ft)
Phoenix House
0.14 - 0.14 0.13 110^
Centrium 0.28 0.18 0.10#
0.07 91
Art Guild House
0.76 0.21@
0.55@
0.26 93
Phoenix Paragon Plaza
0.24 0.05 0.19 0.08 102
Total 1.42 0.45 0.98 0.54 -
@Total Area sold is 0.38 msf out of which PML owns 0.17 msf – this area is also counted in area available for lease^Rental Income from Phoenix House is part of Standalone results #Area owned by PML
The Hospitality Portfolio
31
Retail (65%)Residential (13%)
Commercial (4%)
HOSPITALITY: 17% of FY17
revenue
Operational Update – Hospitality
#For Q4 FY1732
The St. Regis, Mumbai
Courtyard by Marriott, Agra
Keys 395 193
Restaurants & Bar 10 4
Occupancy (%)# 79% 71%
Average room rent (Rs. / room night) #
11,798 4,363
The St. Regis, Mumbai
Q4 FY17 room occupancy at 80% at an ADR of Rs.
11,798
In Q4 FY17, ADR grew 10% yoy and Operating EBITDA
grew 25% yoy
Courtyard by Marriott, Agra
Q4 FY17 room occupancy at 74% at with ADR of Rs.
4,363
In Q4 FY17, income from F&B was up 19% yoy
The St. Regis, Mumbai
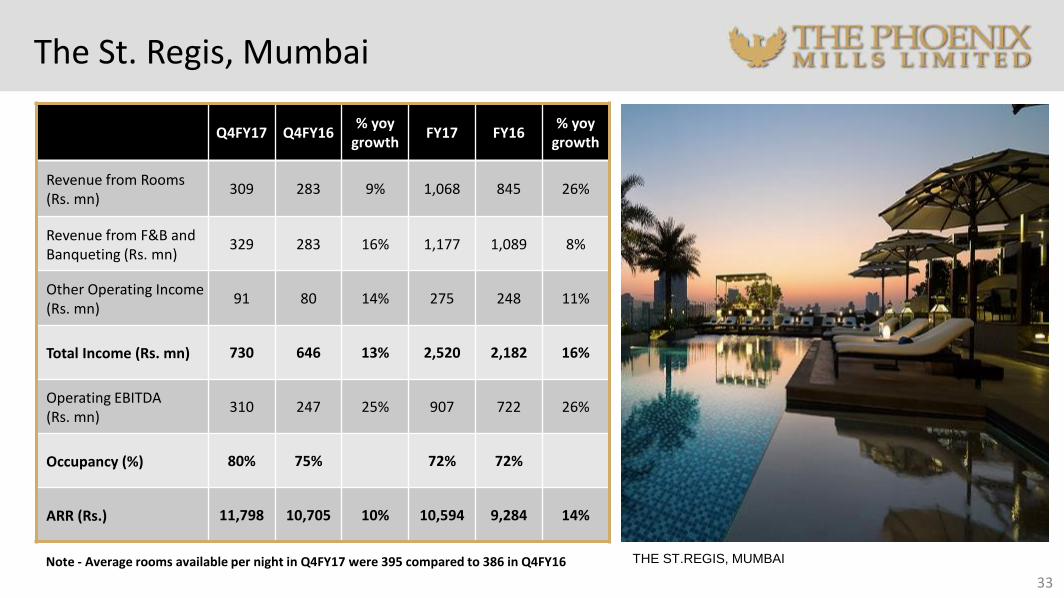
33
THE ST.REGIS, MUMBAI
Q4FY17 Q4FY16 % yoy
growthFY17 FY16
% yoy growth
Revenue from Rooms (Rs. mn)
309 283 9% 1,068 845 26%
Revenue from F&B and Banqueting (Rs. mn)
329 283 16% 1,177 1,089 8%
Other Operating Income (Rs. mn)
91 80 14% 275 248 11%
Total Income (Rs. mn) 730 646 13% 2,520 2,182 16%
Operating EBITDA(Rs. mn)
310 247 25% 907 722 26%
Occupancy (%) 80% 75% 72% 72%
ARR (Rs.) 11,798 10,705 10% 10,594 9,284 14%
Note - Average rooms available per night in Q4FY17 were 395 compared to 386 in Q4FY16
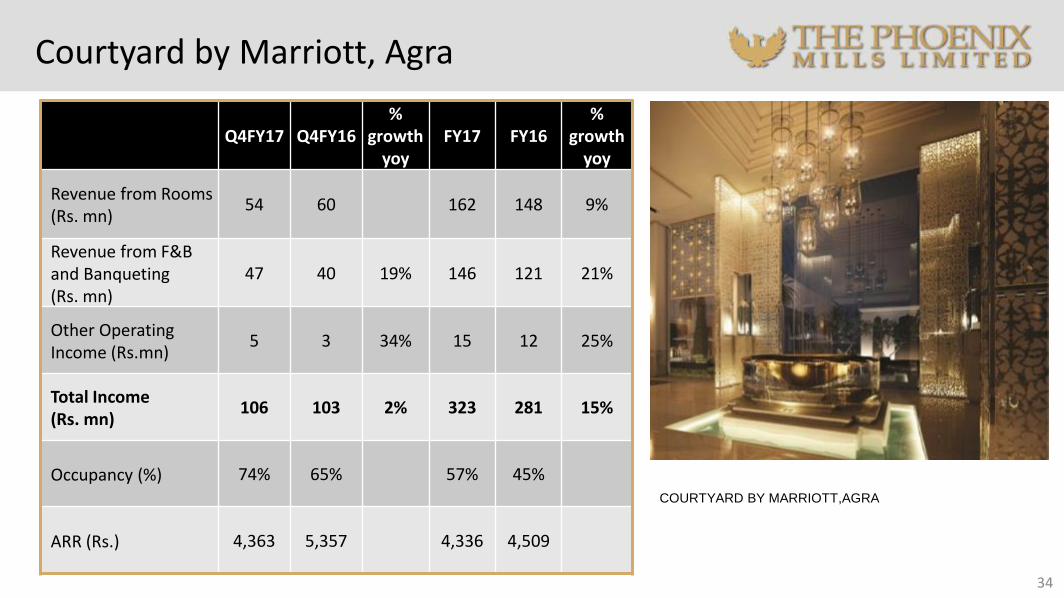
Courtyard by Marriott, Agra
34
COURTYARD BY MARRIOTT,AGRA
Q4FY17 Q4FY16%
growth yoy
FY17 FY16%
growthyoy
Revenue from Rooms (Rs. mn)
54 60 162 148 9%
Revenue from F&B and Banqueting (Rs. mn)
47 40 19% 146 121 21%
Other Operating Income (Rs.mn)
5 3 34% 15 12 25%
Total Income (Rs. mn)
106 103 2% 323 281 15%
Occupancy (%) 74% 65% 57% 45%
ARR (Rs.) 4,363 5,357 4,336 4,509
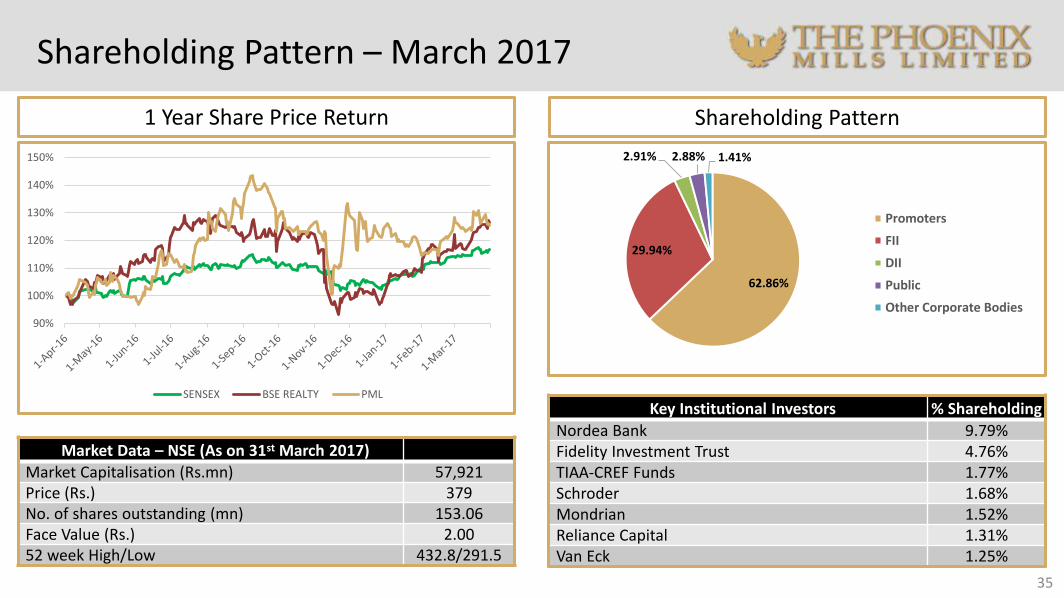
Shareholding Pattern – March 2017
Key Institutional Investors % Shareholding
Nordea Bank 9.79%Fidelity Investment Trust 4.76%TIAA-CREF Funds 1.77%Schroder 1.68%Mondrian 1.52%Reliance Capital 1.31%Van Eck 1.25%
Shareholding Pattern
35
1 Year Share Price Return
Market Data – NSE (As on 31st March 2017)
Market Capitalisation (Rs.mn) 57,921Price (Rs.) 379No. of shares outstanding (mn) 153.06Face Value (Rs.) 2.0052 week High/Low 432.8/291.5
90%
100%
110%
120%
130%
140%
150%
SENSEX BSE REALTY PML
62.86%
29.94%
2.91% 2.88% 1.41%
Promoters
FII
DII
Public
Other Corporate Bodies
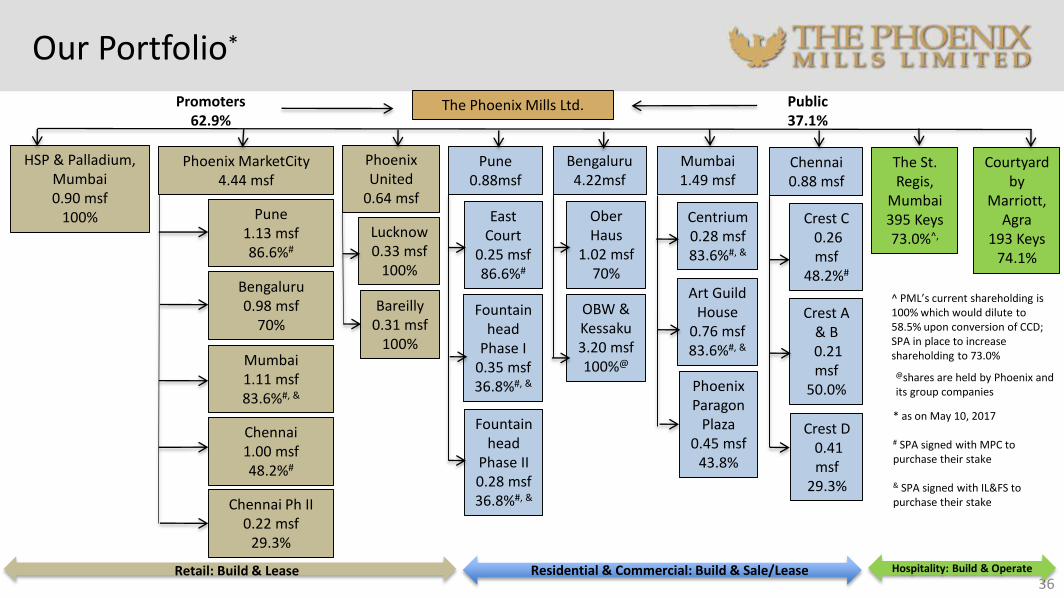
Our Portfolio*
36
The Phoenix Mills Ltd.Promoters62.9%
Public37.1%
HSP & Palladium, Mumbai0.90 msf
100%
Phoenix MarketCity4.44 msf
Pune 1.13 msf86.6%#
Bengaluru0.98 msf
70%
Mumbai1.11 msf83.6%#, &
Chennai 1.00 msf48.2%#
Chennai Ph II0.22 msf
29.3%
Phoenix United
0.64 msf
Lucknow0.33 msf
100%
Bareilly0.31 msf
100%
Pune0.88msf
East Court
0.25 msf86.6%#
Fountainhead
Phase I0.35 msf36.8%#, &
Fountainhead
Phase II0.28 msf36.8%#, &
Bengaluru4.22msf
OberHaus
1.02 msf70%
OBW & Kessaku3.20 msf100%@
Mumbai1.49 msf
Centrium0.28 msf83.6%#, &
Art Guild House
0.76 msf83.6%#, &
Phoenix Paragon
Plaza0.45 msf
43.8%
Chennai0.88 msf
Crest C0.26 msf
48.2%#
Crest A & B0.21 msf
50.0%
Crest D0.41 msf
29.3%
The St. Regis,
Mumbai395 Keys73.0%^,
Courtyard by
Marriott, Agra
193 Keys74.1%
Retail: Build & Lease Residential & Commercial: Build & Sale/Lease Hospitality: Build & Operate
^ PML’s current shareholding is 100% which would dilute to 58.5% upon conversion of CCD; SPA in place to increase shareholding to 73.0%
* as on May 10, 2017
# SPA signed with MPC to purchase their stake
& SPA signed with IL&FS to purchase their stake
@shares are held by Phoenix and its group companies
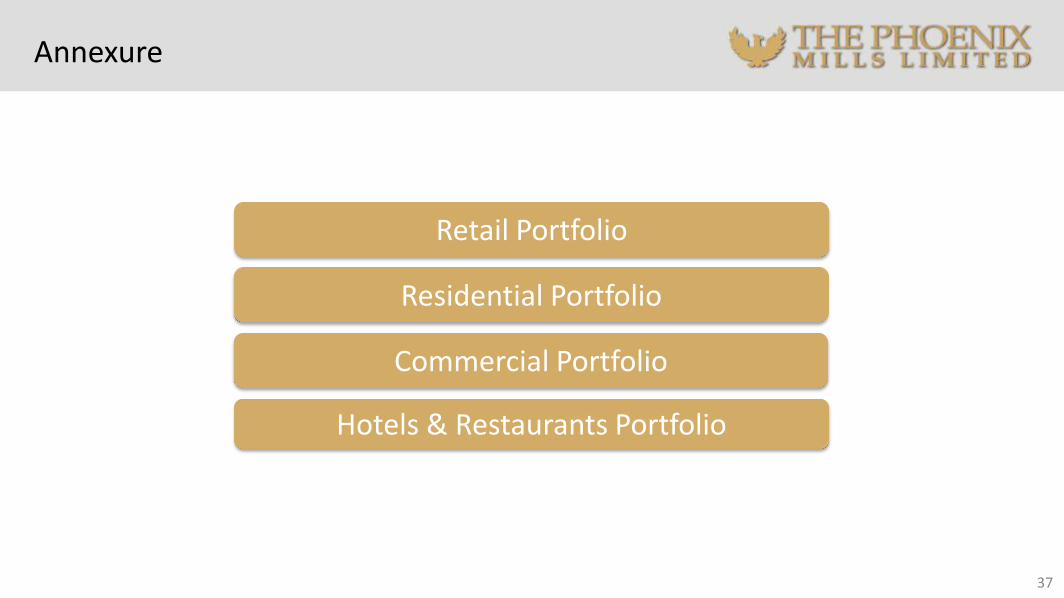
Annexure
Commercial Portfolio
Hotels & Restaurants Portfolio
37
Residential Portfolio
Retail Portfolio
38
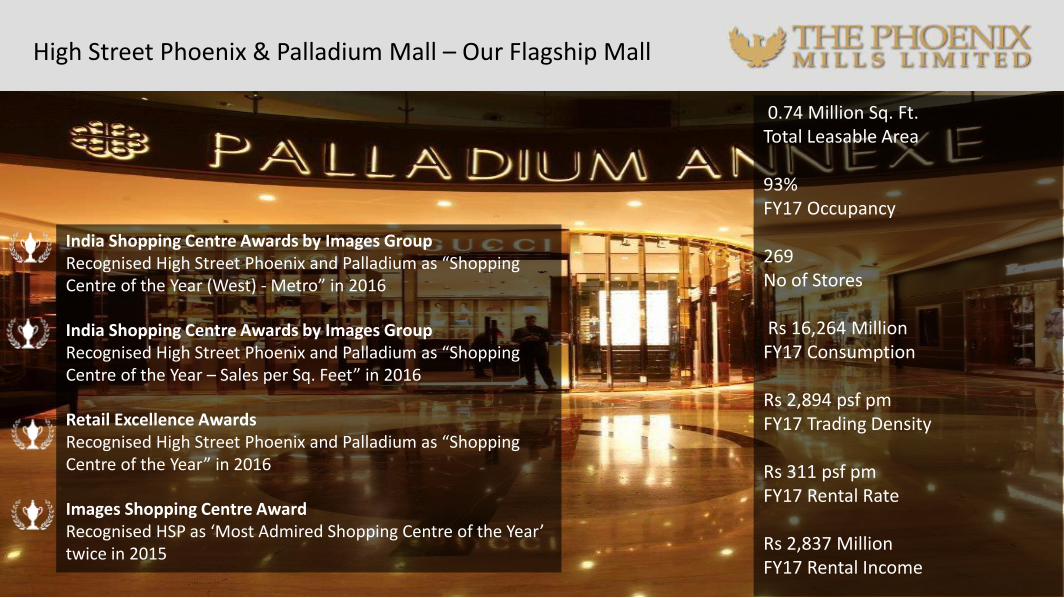
High Street Phoenix & Palladium Mall – Our Flagship Mall
39
0.74 Million Sq. Ft.Total Leasable Area
93%FY17 Occupancy
269No of Stores
Rs 16,264 MillionFY17 Consumption
Rs 2,894 psf pmFY17 Trading Density
Rs 311 psf pmFY17 Rental Rate
Rs 2,837 MillionFY17 Rental Income
India Shopping Centre Awards by Images GroupRecognised High Street Phoenix and Palladium as “Shopping Centre of the Year (West) - Metro” in 2016
India Shopping Centre Awards by Images GroupRecognised High Street Phoenix and Palladium as “Shopping Centre of the Year – Sales per Sq. Feet” in 2016
Retail Excellence Awards Recognised High Street Phoenix and Palladium as “Shopping Centre of the Year” in 2016
Images Shopping Centre AwardRecognised HSP as ‘Most Admired Shopping Centre of the Year’ twice in 2015
40
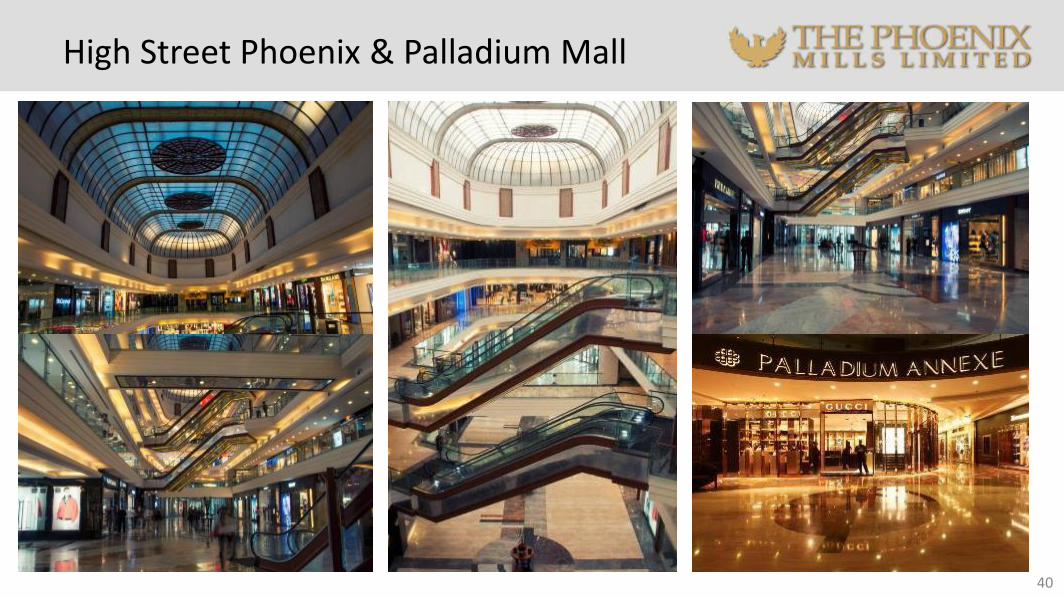
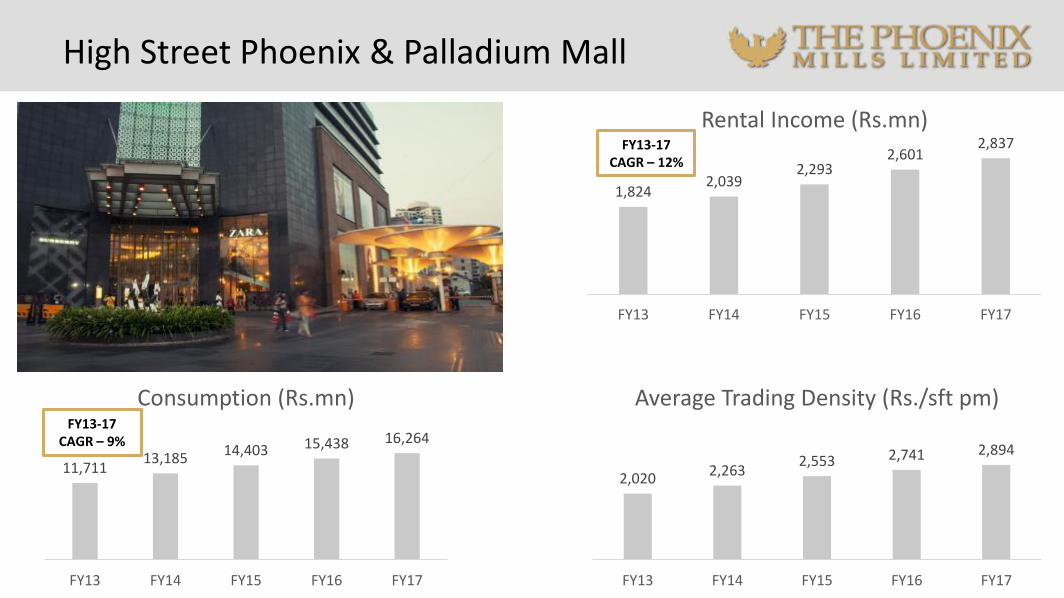
High Street Phoenix & Palladium Mall
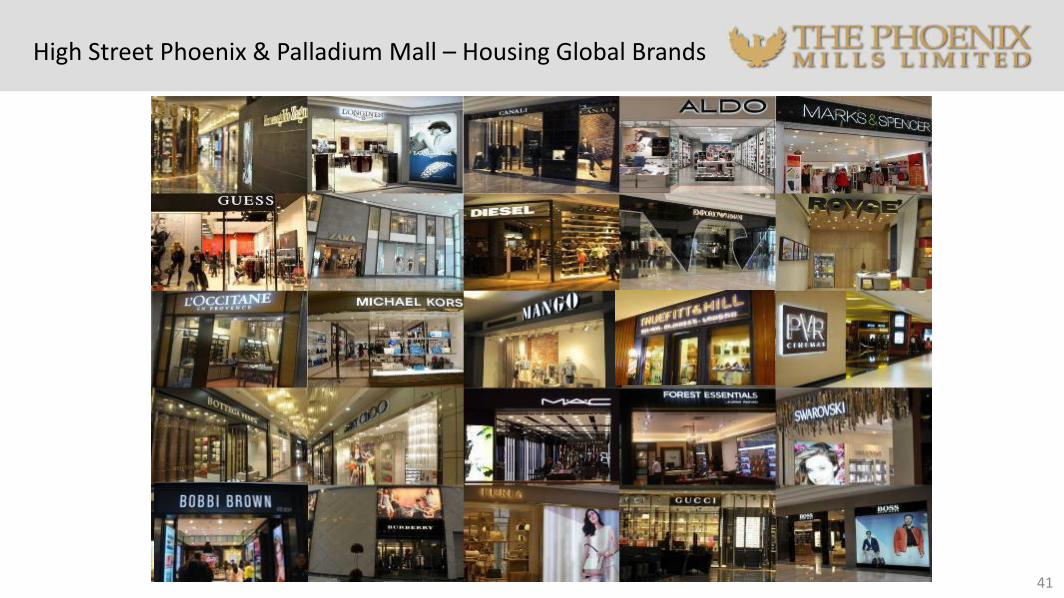
High Street Phoenix & Palladium Mall – Housing Global Brands
41
42
1,8242,039
2,2932,601
2,837
FY13 FY14 FY15 FY16 FY17
Rental Income (Rs.mn)
11,71113,185 14,403 15,438 16,264
FY13 FY14 FY15 FY16 FY17
Consumption (Rs.mn)
2,020 2,2632,553 2,741 2,894
FY13 FY14 FY15 FY16 FY17
Average Trading Density (Rs./sft pm)FY13-17
CAGR – 9%
FY13-17 CAGR – 12%
High Street Phoenix & Palladium Mall
43
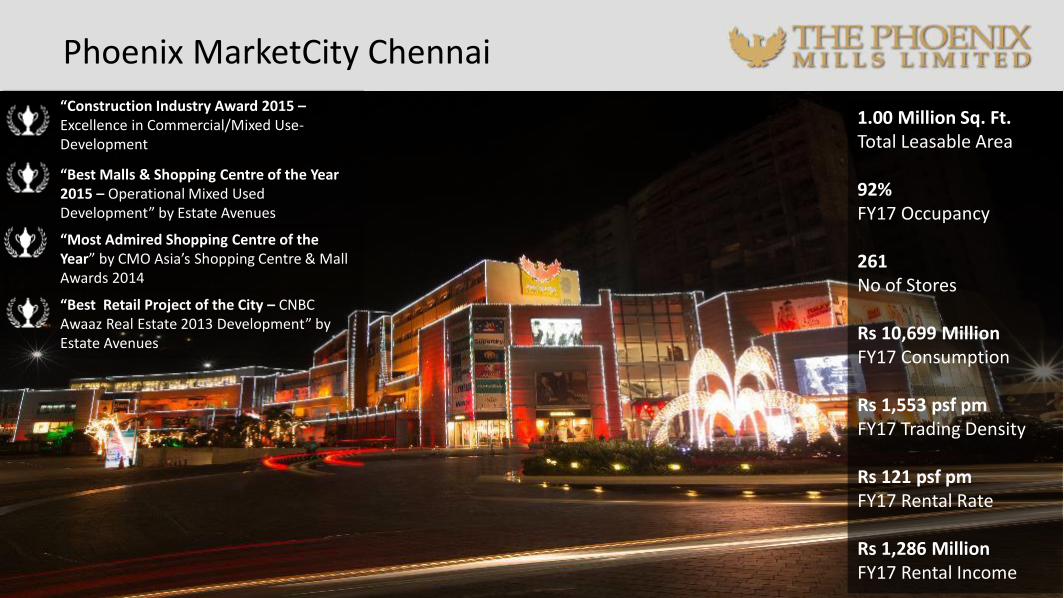
“Best Malls & Shopping Centre of the Year 2015 – Operational Mixed Used Development” by Estate Avenues
“Most Admired Shopping Centre of the Year” by CMO Asia’s Shopping Centre & Mall Awards 2014
“Best Retail Project of the City – CNBC Awaaz Real Estate 2013 Development” by Estate Avenues
“Construction Industry Award 2015 –Excellence in Commercial/Mixed Use-Development
1.00 Million Sq. Ft.Total Leasable Area
92%FY17 Occupancy
261No of Stores
Rs 10,699 MillionFY17 Consumption
Rs 1,553 psf pmFY17 Trading Density
Rs 121 psf pmFY17 Rental Rate
Rs 1,286 MillionFY17 Rental Income
Phoenix MarketCity Chennai
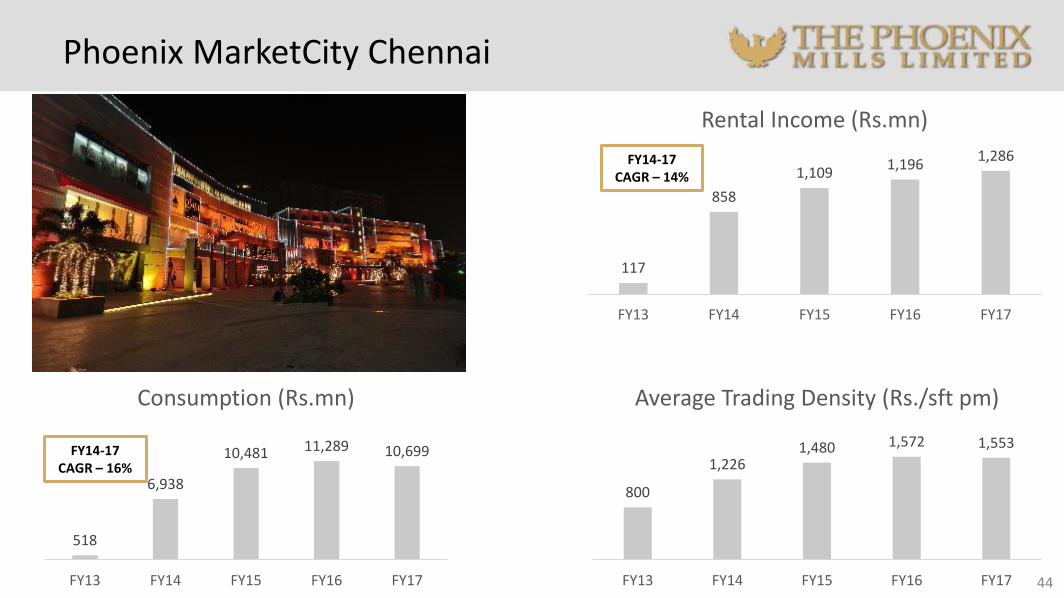
117
858
1,1091,196
1,286
FY13 FY14 FY15 FY16 FY17
Rental Income (Rs.mn)
44
518
6,938
10,481 11,289 10,699
FY13 FY14 FY15 FY16 FY17
Consumption (Rs.mn)
800
1,2261,480 1,572 1,553
FY13 FY14 FY15 FY16 FY17
Average Trading Density (Rs./sft pm)
FY14-17 CAGR – 16%
FY14-17 CAGR – 14%
Phoenix MarketCity Chennai
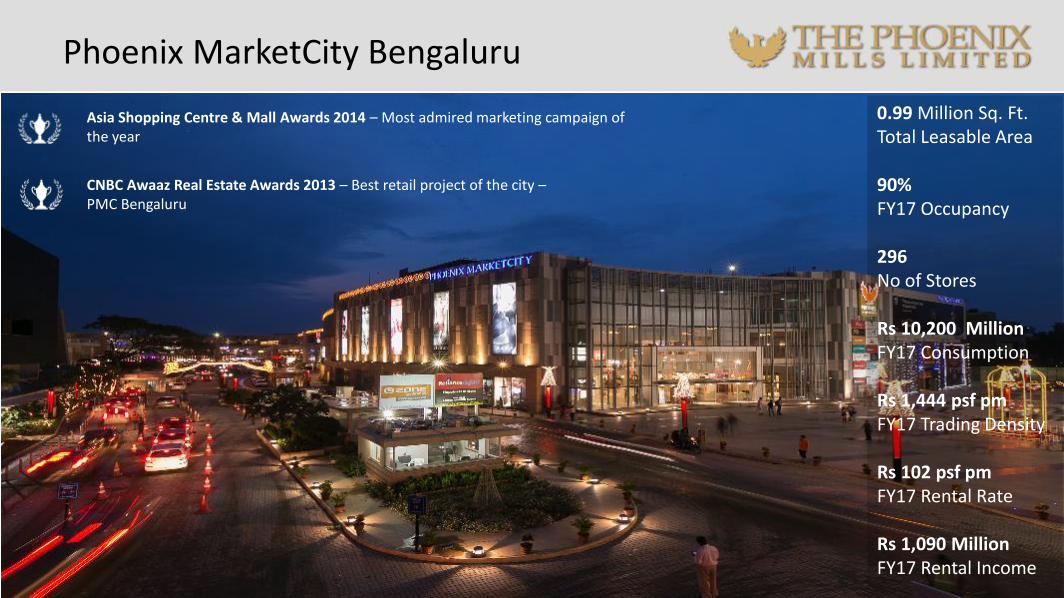
45
0.99 Million Sq. Ft.Total Leasable Area
90%FY17 Occupancy
296No of Stores
Rs 10,200 MillionFY17 Consumption
Rs 1,444 psf pmFY17 Trading Density
Rs 102 psf pmFY17 Rental Rate
Rs 1,090 MillionFY17 Rental Income
Asia Shopping Centre & Mall Awards 2014 – Most admired marketing campaign of the year
CNBC Awaaz Real Estate Awards 2013 – Best retail project of the city –PMC Bengaluru
Phoenix MarketCity Bengaluru
Phoenix MarketCity Bengaluru
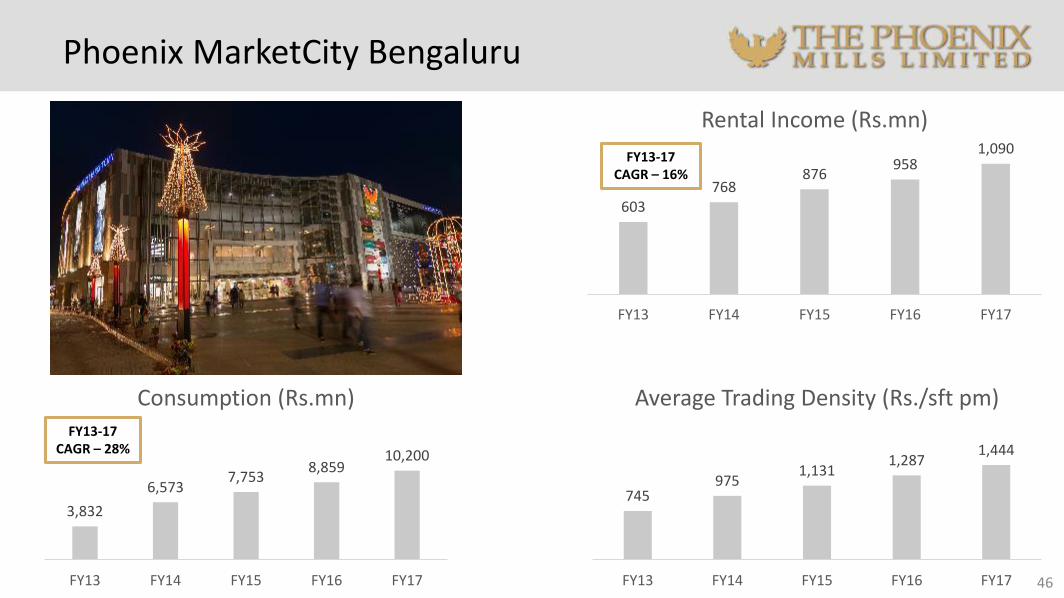
603768
876958
1,090
FY13 FY14 FY15 FY16 FY17
Rental Income (Rs.mn)
46
3,832
6,5737,753
8,85910,200
FY13 FY14 FY15 FY16 FY17
Consumption (Rs.mn)
745975
1,1311,287
1,444
FY13 FY14 FY15 FY16 FY17
Average Trading Density (Rs./sft pm)
FY13-17 CAGR – 16%
FY13-17 CAGR – 28%
47
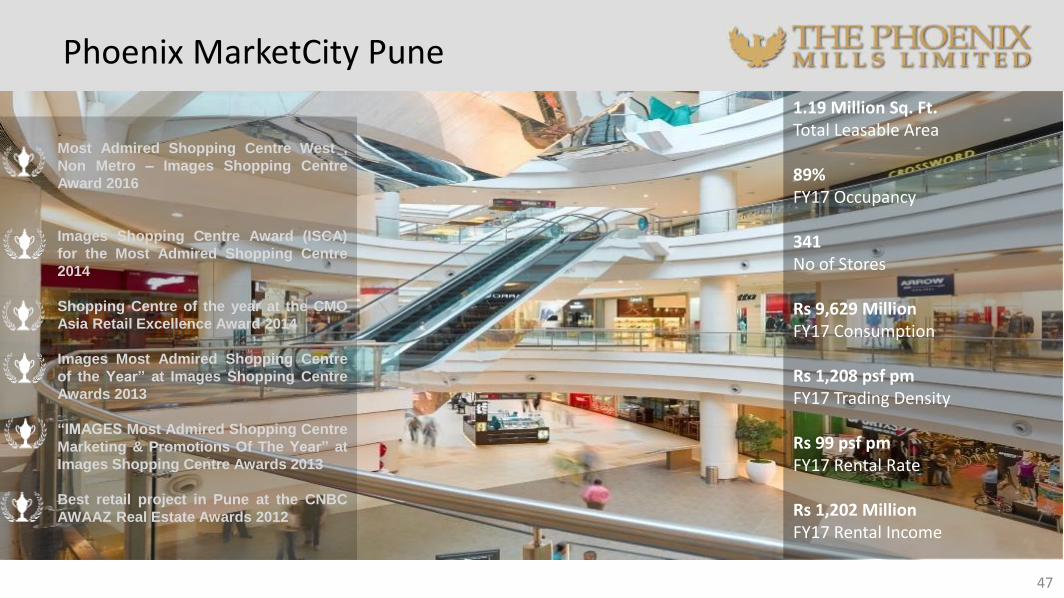
Most Admired Shopping Centre West ,
Non Metro – Images Shopping Centre
Award 2016
Images Shopping Centre Award (ISCA)
for the Most Admired Shopping Centre
2014
Shopping Centre of the year at the CMO
Asia Retail Excellence Award 2014
Images Most Admired Shopping Centre
of the Year” at Images Shopping Centre
Awards 2013
“IMAGES Most Admired Shopping Centre
Marketing & Promotions Of The Year” at
Images Shopping Centre Awards 2013
Best retail project in Pune at the CNBC
AWAAZ Real Estate Awards 2012
1.19 Million Sq. Ft.Total Leasable Area
89%FY17 Occupancy
341No of Stores
Rs 9,629 MillionFY17 Consumption
Rs 1,208 psf pmFY17 Trading Density
Rs 99 psf pmFY17 Rental Rate
Rs 1,202 MillionFY17 Rental Income
Phoenix MarketCity Pune
Phoenix MarketCity Pune
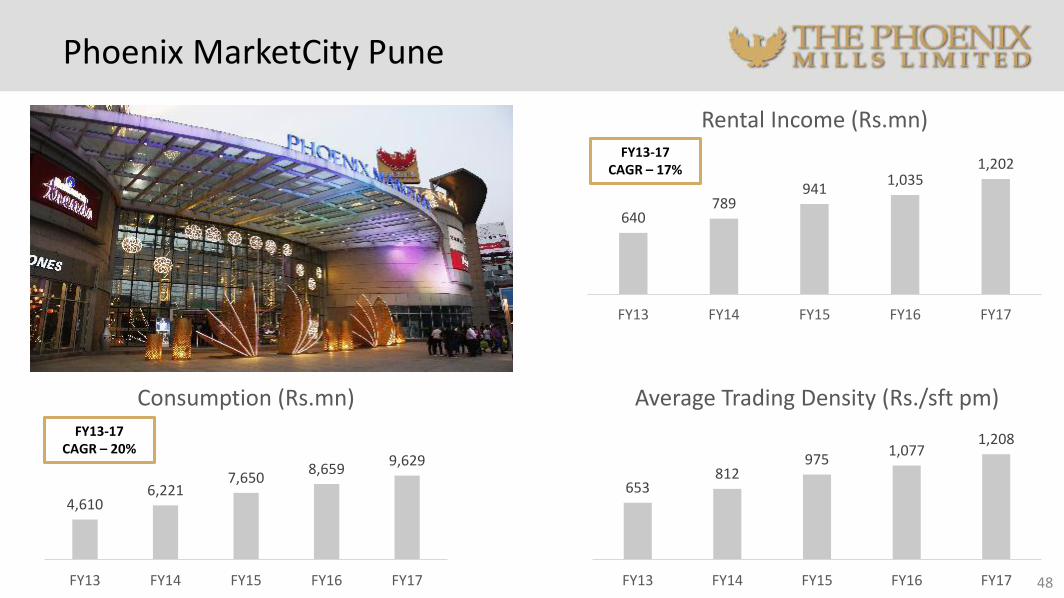
640789
9411,035
1,202
FY13 FY14 FY15 FY16 FY17
Rental Income (Rs.mn)
48
4,6106,221
7,6508,659
9,629
FY13 FY14 FY15 FY16 FY17
Consumption (Rs.mn)
653812
9751,077
1,208
FY13 FY14 FY15 FY16 FY17
Average Trading Density (Rs./sft pm)
FY13-17 CAGR – 17%
FY13-17 CAGR – 20%
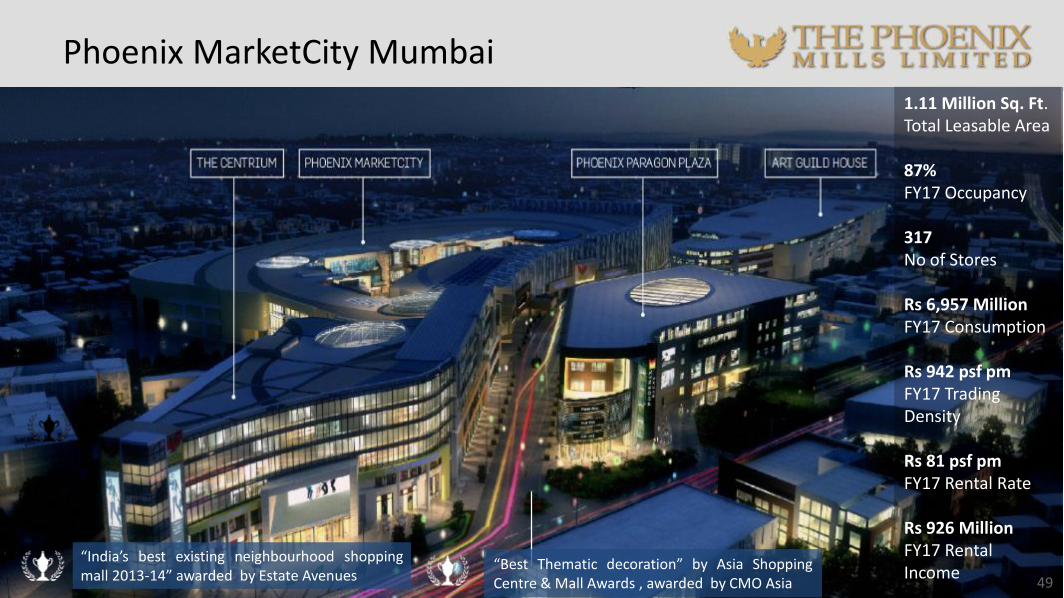
49
“India’s best existing neighbourhood shoppingmall 2013-14” awarded by Estate Avenues
“Best Thematic decoration” by Asia ShoppingCentre & Mall Awards , awarded by CMO Asia
1.11 Million Sq. Ft.Total Leasable Area
87%FY17 Occupancy
317No of Stores
Rs 6,957 MillionFY17 Consumption
Rs 942 psf pmFY17 Trading Density
Rs 81 psf pmFY17 Rental Rate
Rs 926 MillionFY17 Rental Income
Phoenix MarketCity Mumbai
Phoenix MarketCity Mumbai
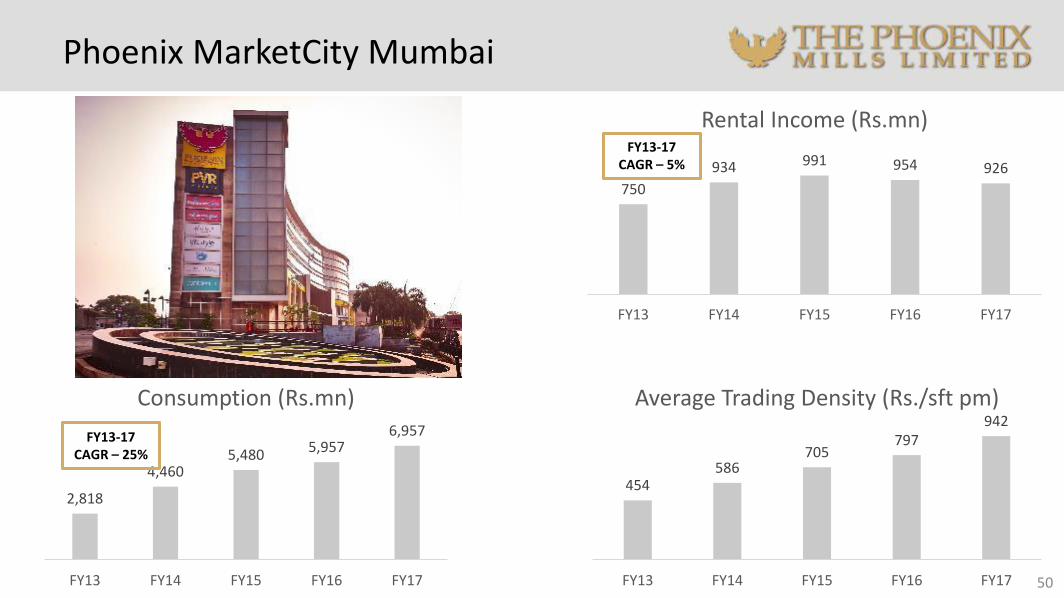
750
934 991 954 926
FY13 FY14 FY15 FY16 FY17
Rental Income (Rs.mn)
50
2,818
4,4605,480 5,957
6,957
FY13 FY14 FY15 FY16 FY17
Consumption (Rs.mn)
454586
705797
942
FY13 FY14 FY15 FY16 FY17
Average Trading Density (Rs./sft pm)
FY13-17 CAGR – 5%
FY13-17 CAGR – 25%
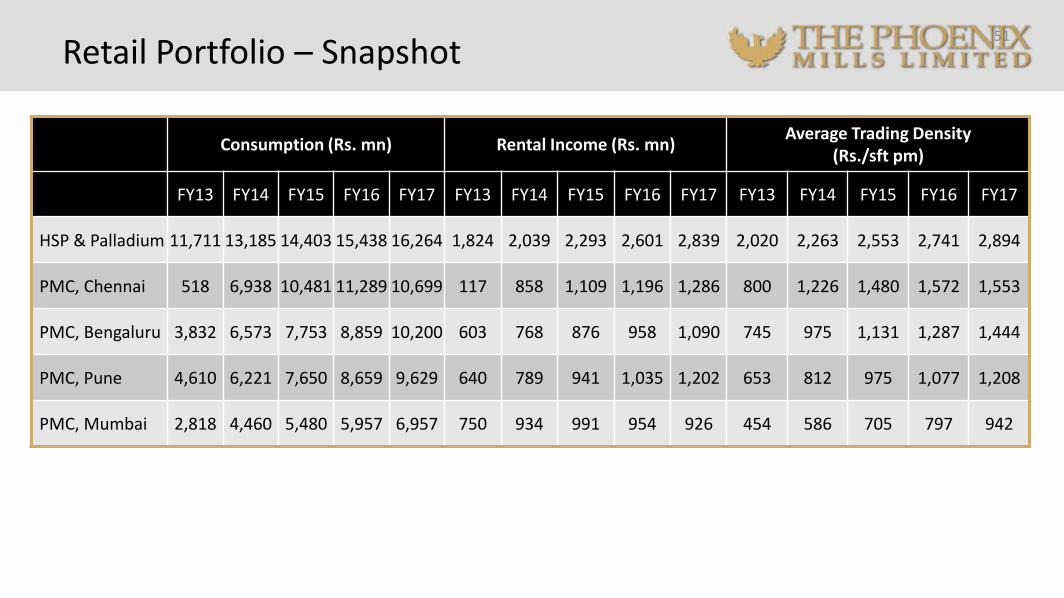
Retail Portfolio – Snapshot51
Consumption (Rs. mn) Rental Income (Rs. mn)Average Trading Density
(Rs./sft pm)
FY13 FY14 FY15 FY16 FY17 FY13 FY14 FY15 FY16 FY17 FY13 FY14 FY15 FY16 FY17
HSP & Palladium 11,711 13,185 14,403 15,438 16,264 1,824 2,039 2,293 2,601 2,839 2,020 2,263 2,553 2,741 2,894
PMC, Chennai 518 6,938 10,481 11,289 10,699 117 858 1,109 1,196 1,286 800 1,226 1,480 1,572 1,553
PMC, Bengaluru 3,832 6,573 7,753 8,859 10,200 603 768 876 958 1,090 745 975 1,131 1,287 1,444
PMC, Pune 4,610 6,221 7,650 8,659 9,629 640 789 941 1,035 1,202 653 812 975 1,077 1,208
PMC, Mumbai 2,818 4,460 5,480 5,957 6,957 750 934 991 954 926 454 586 705 797 942
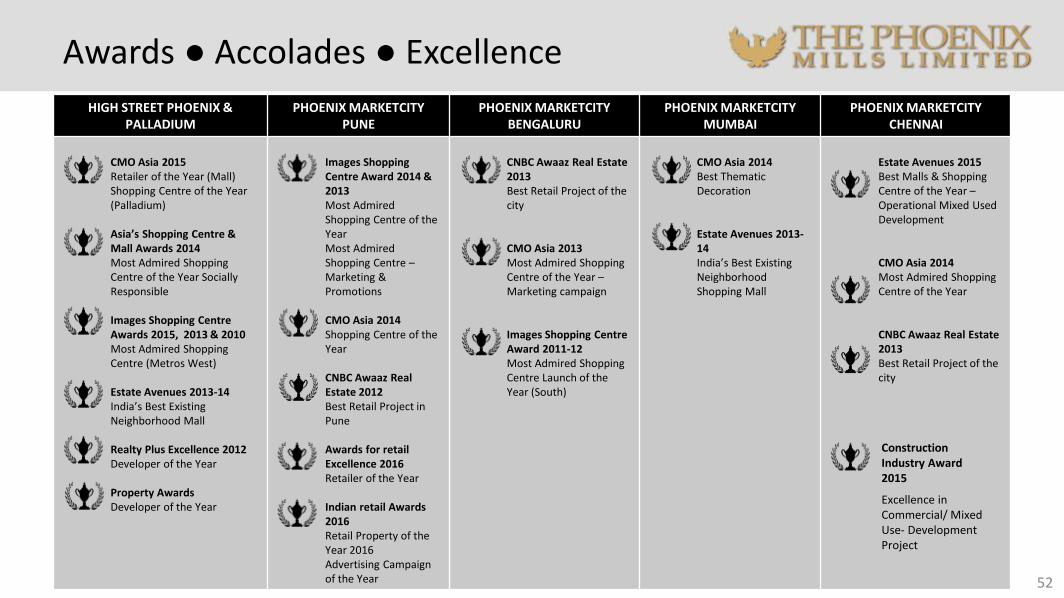
Awards ● Accolades ● Excellence
52
HIGH STREET PHOENIX & PALLADIUM
PHOENIX MARKETCITY PUNE
PHOENIX MARKETCITY BENGALURU
PHOENIX MARKETCITY MUMBAI
PHOENIX MARKETCITY CHENNAI
CMO Asia 2015Retailer of the Year (Mall)Shopping Centre of the Year (Palladium)
Asia’s Shopping Centre & Mall Awards 2014Most Admired Shopping Centre of the Year Socially Responsible
Images Shopping Centre Awards 2015, 2013 & 2010Most Admired Shopping Centre (Metros West)
Estate Avenues 2013-14India’s Best Existing Neighborhood Mall
Realty Plus Excellence 2012Developer of the Year
Property AwardsDeveloper of the Year
Images Shopping Centre Award 2014 & 2013Most Admired Shopping Centre of the YearMost Admired Shopping Centre –Marketing & Promotions
CMO Asia 2014Shopping Centre of the Year
CNBC Awaaz Real Estate 2012Best Retail Project in Pune
Awards for retail Excellence 2016Retailer of the Year
Indian retail Awards 2016Retail Property of the Year 2016Advertising Campaign of the Year
CNBC Awaaz Real Estate 2013Best Retail Project of the city
CMO Asia 2013Most Admired Shopping Centre of the Year –Marketing campaign
Images Shopping Centre Award 2011-12Most Admired Shopping Centre Launch of the Year (South)
CMO Asia 2014Best Thematic Decoration
Estate Avenues 2013-14India’s Best Existing Neighborhood Shopping Mall
Estate Avenues 2015Best Malls & Shopping Centre of the Year –Operational Mixed Used Development
CMO Asia 2014Most Admired Shopping Centre of the Year
CNBC Awaaz Real Estate 2013Best Retail Project of the city
Excellence in Commercial/ Mixed Use- Development Project
Construction Industry Award 2015

53
Project Name LocationNo. of towers
Saleable area (msf)
Commencement of planning
Launch dateExpected Date of
completion
Rajajinagar,Bengaluru
9 2.20 Q2 2011Phase I – Q3 2012Phase II – Q4 2014
Phase I (Towers 1-5)2016
Phase II Towers 6Q3 2018
Towers 7-9 – Under Planning
Rajajinagar,Bengaluru
5 0.99 Q3 2013 Q1 2015 Q2 2018
Velachery, Chennai
4 0.94 2009
Tower A, B & C – Q3 2011
Tower D – Under Planning
ConstructionCompleted. Awaiting
Occupation Certificate
TOTAL 4.13
Overview of Residential Projects
Key Residential Projects Ongoing / Planned
54
Note – Year denotes calendar year
Awards ● Accolades ● Excellence
55
ONE BANGALORE WEST KESSAKU FOUNTAINHEAD
Asia Pacific Property Awards 2013Developer Website
7th Estate Awards 2014(Franchise India & ET NOW)Regional Project of the Year – South
Asia Pacific Property Awards 2015Architecture Multiple ResidenceResidential High-rise Development
3rd Asian CEF Awards 2014The Residential Project of the Year –Towers
7th Estate Awards 2014(Franchise India & ET NOW)Project of the Year – National
Asia Pacific Property Awards 2015Development MarketingResidential Property Interior (Show Home)
Designomics Awards 2014Integrated Design Project / Marketing StrategyDirect Response – Brochures / Catalogue
3rd Asia CEF Awards 2014The Residential Project of the Year –Residential Buildings
Asia Pacific Property Awards 2015Apartment/CondominiumDeveloper WebsiteDevelopment MarketingResidential Interior (Show Home)
Designomics Awards 2014Integrated Design Project / Marketing StrategyDirect Response – Brochures / Catalogue
Estate Award 2015
Best Marketer of the year 2015
Best Marketer of the year 2015
Estate Award 2015
Estate Award 2015Best Marketer of the year 2015
CNBC-AWAAZ Real Estate Awards 15-16
Best Residential Project in Bengaluru City (Luxury)

56
Project name Location Total area
(msf) Expected Date of
Completion
Phoenix House Lower Parel, Mumbai 0.13 Completed
Centrium Kurla, Mumbai 0.28 Completed
East Court Viman Nagar, Pune 0.25 Completed
Paragon Plaza Kurla, Mumbai 0.24 Completed
Art Guild House Kurla, Mumbai 0.76 Completed
West Court * Viman Nagar, Pune 0.28 -
TOTAL 1.92
Commercial Portfolio – Building an Annuity Business
* Planned Project
57

58
Hospitality
59
The St. Regis,
Mumbai
Courtyard by Marriott
Agra
Year of Establishment 2012 2015
Total Rooms 395 193
Restaurants & Bar 10 4
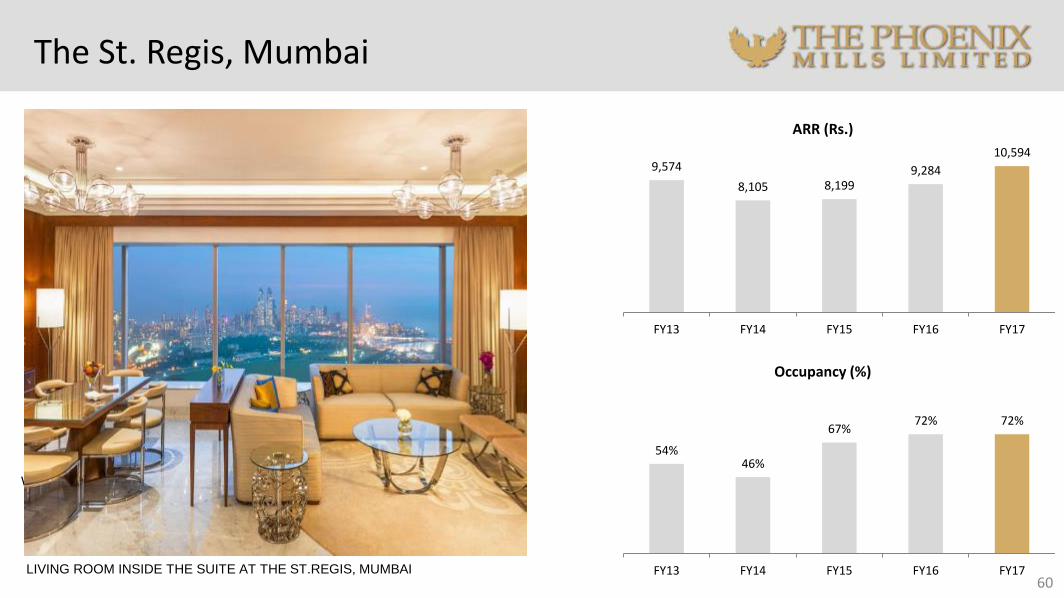
The St. Regis, Mumbai
60
9,574
8,105 8,1999,284
10,594
FY13 FY14 FY15 FY16 FY17
ARR (Rs.)
54%46%
67%72% 72%
FY13 FY14 FY15 FY16 FY17
Occupancy (%)
WEDDING SETUP AT THE ST.REGIS, MUMBAI
LIVING ROOM INSIDE THE SUITE AT THE ST.REGIS, MUMBAI
Restaurants & Banquets
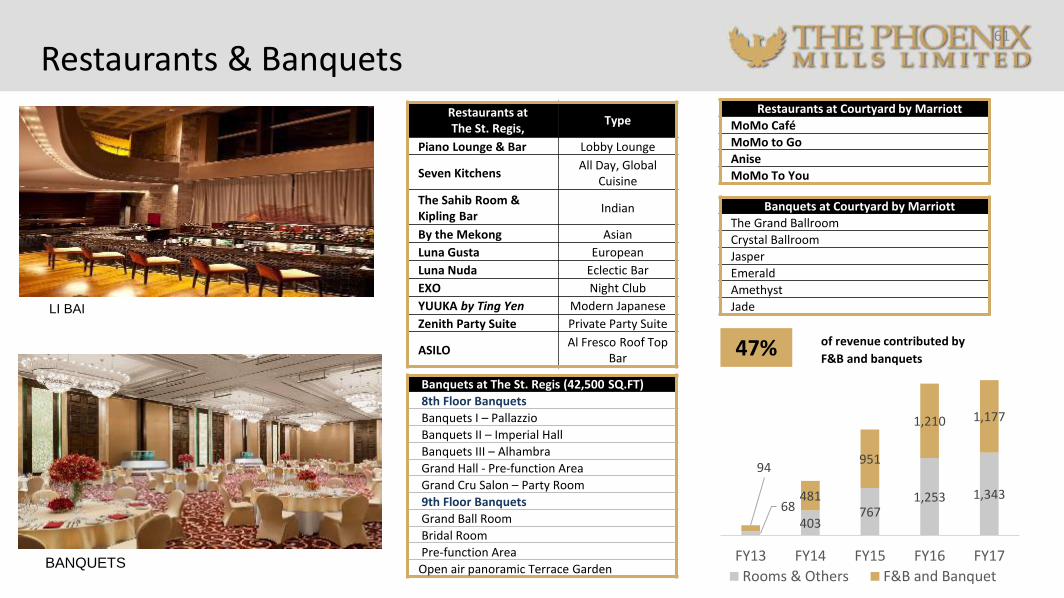
LI BAI
Restaurants atThe St. Regis,
Type
Piano Lounge & Bar Lobby Lounge
Seven KitchensAll Day, Global
Cuisine
The Sahib Room & Kipling Bar
Indian
By the Mekong Asian
Luna Gusta European
Luna Nuda Eclectic Bar
EXO Night Club
YUUKA by Ting Yen Modern Japanese
Zenith Party Suite Private Party Suite
ASILOAl Fresco Roof Top
Bar
61
Banquets at The St. Regis (42,500 SQ.FT)
8th Floor Banquets
Banquets I – Pallazzio
Banquets II – Imperial Hall
Banquets III – Alhambra
Grand Hall - Pre-function Area
Grand Cru Salon – Party Room
9th Floor Banquets
Grand Ball Room
Bridal Room
Pre-function Area
Open air panoramic Terrace GardenBANQUETS
of revenue contributed by
F&B and banquets
68403
7671,253 1,343
94
481
951
1,210 1,177
FY13 FY14 FY15 FY16 FY17
Rooms & Others F&B and Banquet
Restaurants at Courtyard by Marriott
MoMo Café
MoMo to Go
Anise
MoMo To You
47%
Banquets at Courtyard by Marriott
The Grand Ballroom
Crystal Ballroom
Jasper
Emerald
Amethyst
Jade
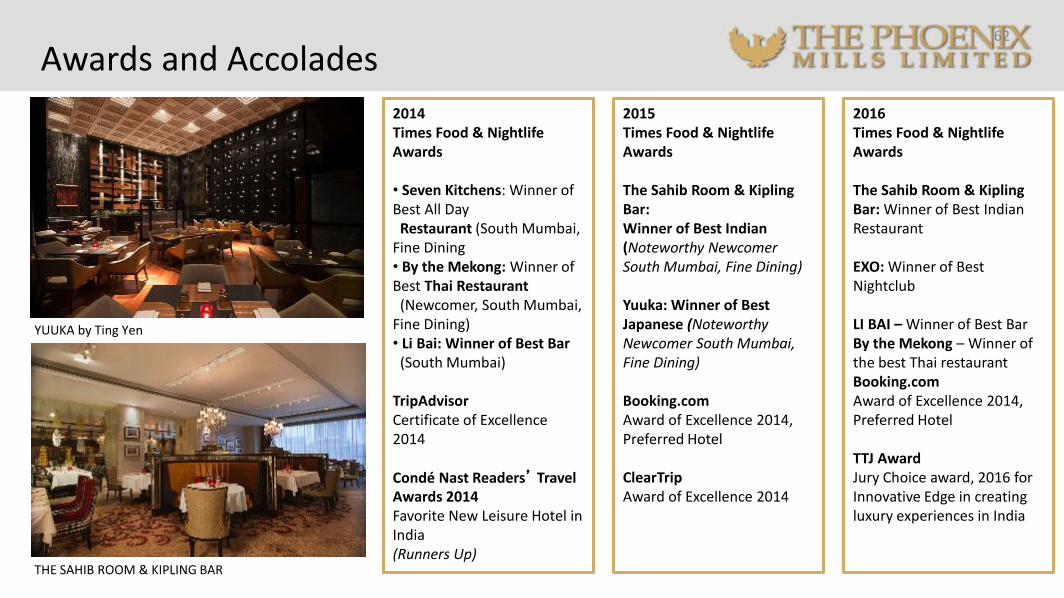
Awards and Accolades
2014Times Food & Nightlife Awards
• Seven Kitchens: Winner of Best All Day
Restaurant (South Mumbai, Fine Dining• By the Mekong: Winner of Best Thai Restaurant
(Newcomer, South Mumbai, Fine Dining)• Li Bai: Winner of Best Bar
(South Mumbai)
TripAdvisorCertificate of Excellence 2014
Condé Nast Readers’ Travel Awards 2014Favorite New Leisure Hotel in India(Runners Up)
YUUKA by Ting Yen
62
2015Times Food & Nightlife Awards
The Sahib Room & Kipling Bar: Winner of Best Indian (Noteworthy Newcomer South Mumbai, Fine Dining)
Yuuka: Winner of Best Japanese (Noteworthy Newcomer South Mumbai, Fine Dining)
Booking.comAward of Excellence 2014, Preferred Hotel
ClearTripAward of Excellence 2014
THE SAHIB ROOM & KIPLING BAR
2016Times Food & Nightlife Awards
The Sahib Room & Kipling Bar: Winner of Best Indian Restaurant
EXO: Winner of Best Nightclub
LI BAI – Winner of Best BarBy the Mekong – Winner of the best Thai restaurantBooking.comAward of Excellence 2014, Preferred Hotel
TTJ Award Jury Choice award, 2016 for Innovative Edge in creating luxury experiences in India
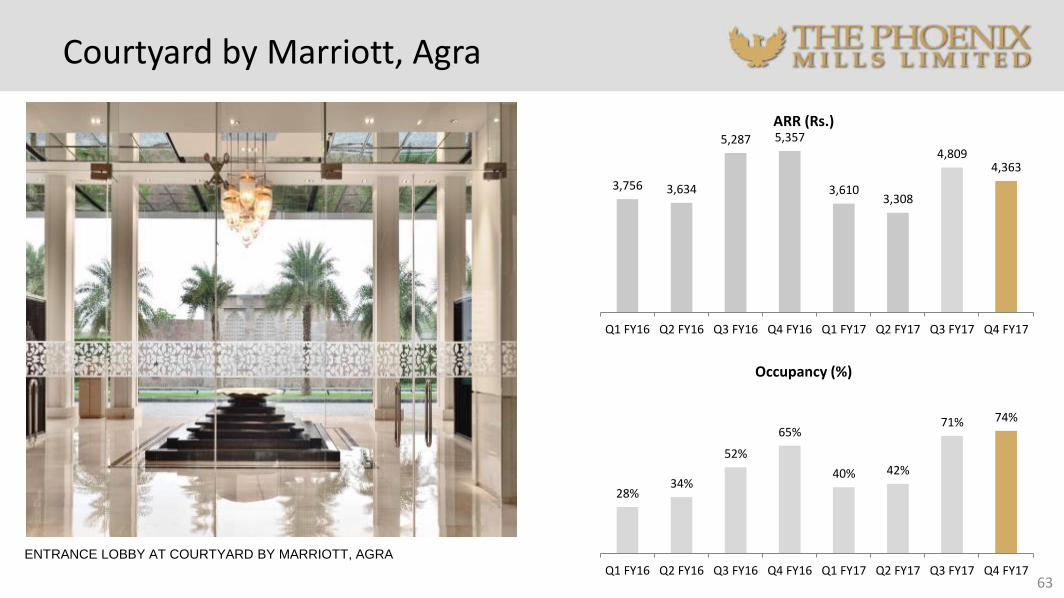
Courtyard by Marriott, Agra
63
3,756 3,634
5,287 5,357
3,6103,308
4,8094,363
Q1 FY16 Q2 FY16 Q3 FY16 Q4 FY16 Q1 FY17 Q2 FY17 Q3 FY17 Q4 FY17
ARR (Rs.)
28%34%
52%
65%
40% 42%
71% 74%
Q1 FY16 Q2 FY16 Q3 FY16 Q4 FY16 Q1 FY17 Q2 FY17 Q3 FY17 Q4 FY17
Occupancy (%)
ENTRANCE LOBBY AT COURTYARD BY MARRIOTT, AGRA
Restaurants – F&B Concept
• 7 Food & Beverage Concepts/ brands rolled out across 13 stores (2 are under fit-outs)• Potential for more rollouts with opportunities across all Phoenix malls at initial stage• Adds to Phoenix malls leisure and entertainment bouquet, creating a larger consumption center• Scalable model that can be replicated on a Pan India basis at other malls & stand alone locations
64
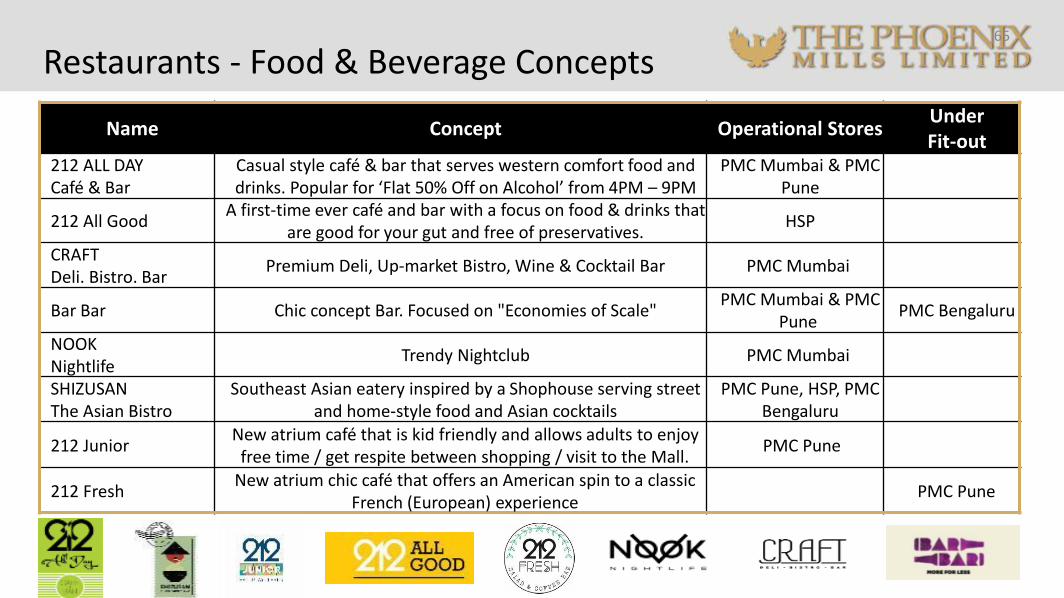
Restaurants - Food & Beverage Concepts65
Name Concept Operational StoresUnder Fit-out
212 ALL DAYCafé & Bar
Casual style café & bar that serves western comfort food and drinks. Popular for ‘Flat 50% Off on Alcohol’ from 4PM – 9PM
PMC Mumbai & PMC Pune
212 All GoodA first-time ever café and bar with a focus on food & drinks that
are good for your gut and free of preservatives.HSP
CRAFTDeli. Bistro. Bar
Premium Deli, Up-market Bistro, Wine & Cocktail Bar PMC Mumbai
Bar Bar Chic concept Bar. Focused on "Economies of Scale"PMC Mumbai & PMC
PunePMC Bengaluru
NOOK Nightlife
Trendy Nightclub PMC Mumbai
SHIZUSANThe Asian Bistro
Southeast Asian eatery inspired by a Shophouse serving street and home-style food and Asian cocktails
PMC Pune, HSP, PMC Bengaluru
212 JuniorNew atrium café that is kid friendly and allows adults to enjoy
free time / get respite between shopping / visit to the Mall. PMC Pune
212 FreshNew atrium chic café that offers an American spin to a classic
French (European) experiencePMC Pune

Thank You!
66
For more information on the Company, its projects and services please log on to
www.thephoenixmills.comor contact:
Varun Parwal
Contact: +91 22 30016737
Email: [email protected]
Advait Phatarfod
Contact: +91 22 30016804
Email: [email protected]
Pawan Saxena
Contact: +91 22 30016849
Email: [email protected]


![app.churchgatepartners.comapp.churchgatepartners.com/Docs/Client/CLT10/CLT10... · l!emny eqeM IY (puqôua) - PU011eU]ê1Ul Y-7,L eoueon 'JCI ell) 9L0t 'LC .suollejêdo llnse] le!OUeUlJ](https://img.pdfslide.net/doc/110x75/5ec5d240acb7740ab05169e3/app-lemny-eqem-iy-puqua-pu011eu1ul-y-7l-eoueon-jci-ell-9l0t-lc-suollejdo.jpg)