Embed Size (px)
Citation preview
Q32017
powered by
Commercial Construction Index
USG CORPORATION + U.S. CHAMBER OF COMMERCE
We are pleased to share the results of the Q3 2017 USG Corporation + U.S. Chamber of Commerce
Commercial Construction Index (CCI). When we launched the CCI earlier this year, we did so to help
uncover insights into the financial health and outlook of the commercial construction industry, its
challenges and opportunities, as well as its impact on our nation’s economy.
More than 3 million Americans are employed in the commercial construction industry, and the
sector contributes over $700 billion in construction spending, playing a vital role in the nation’s
economic growth. In fact, according to a recent study by George Mason University, every $1 billion
in nonresidential construction spending adds about $3.4 billion to gross domestic product, about
$1.1 billion to personal earnings, and creates or sustains 28,500 jobs.
That’s why we created this index. We saw an opportunity to better understand what drives
the commercial construction industry and its leaders. Working with Dodge Data & Analytics,
the construction industry’s leading authority on data, we have developed a unique index that
measures where contractors stand quarter-to-quarter on their backlog, their pipeline and their
revenue. To give context to the index, we also ask them quarterly about factors that influence
these metrics, such as their hiring plans and what’s keeping them up at night. Our research has
already created a valuable window into the sector and the direction of the broader economy.
As this quarter’s report indicates, the industry is strong and healthy, but not without its challenges. From sentiment on
workforce readiness to the ability to recruit and retain adequate staff levels, from prioritizing the skill set required for
today’s jobsite and the ability of a contractor to staff a future pipeline of work, this report provides important insights that
will help foster the future success of this industry.
USG Corporation and the U.S. Chamber of Commerce have a long history of supporting the construction industry and
hope this collaboration helps us develop a deeper understanding of and appreciation for the unique role the commercial
construction industry plays in our country.
Revitalizing the American economy must be priority No. 1 in Washington—to create jobs, increase wages, raise living
standards and strengthen our social safety net. A healthy and vibrant commercial construction industry can play a
critical role in achieving this goal. We hope this report is not only of keen interest to those actively engaged in commercial
construction, but also to policymakers at all levels of government. Because when America is building, America is growing.
Sincerely,
Thomas J. Donohue Jennifer F. Scanlon
THE USG CORPORATION + U.S. CHAMBER OF COMMERCE COMMERCIAL CONSTRUCTION INDEX
Jennifer F. ScanlonPresident and CEOUSG Corporation
Thomas J. DonohuePresident and CEOU.S. Chamber of Commerce
1COMMERCIAL CONSTRUCTION INDEX ∫ Q3 2017Powered by
commercial
construction
i n d e x
usg + us chamber
TABLE OF CONTENTS
The USG Corporation + U.S. Chamber of Commerce Commercial Construction Index (CCI) is a quarterly economic index designed to gauge the outlook for and resulting confidence in the commercial construction industry. Recognizing a need to highlight the important contributions of this sector to the nation’s economy, USG Corporation and the U.S. Chamber of Commerce partnered to produce this first-of-its-kind index. Each quarter, contractors across the country are surveyed in order to better understand their levels of confidence in the industry and top-of-mind concerns.
EXECUTIVE SUMMARY
DRIVERS OF CONFIDENCE
4 Backlog
5 New Business
7 Revenue/Profit Margins
QUARTERLY SPOTLIGHT
9 Skills Development
MARKET TRENDS
11 Workforce
14 Access to Financing
15 Materials & Equipment
16 Regional Insights
17 Insights by Firm Type
METHODOLOGY
1
2
3
4
5
11
Powered by2
11
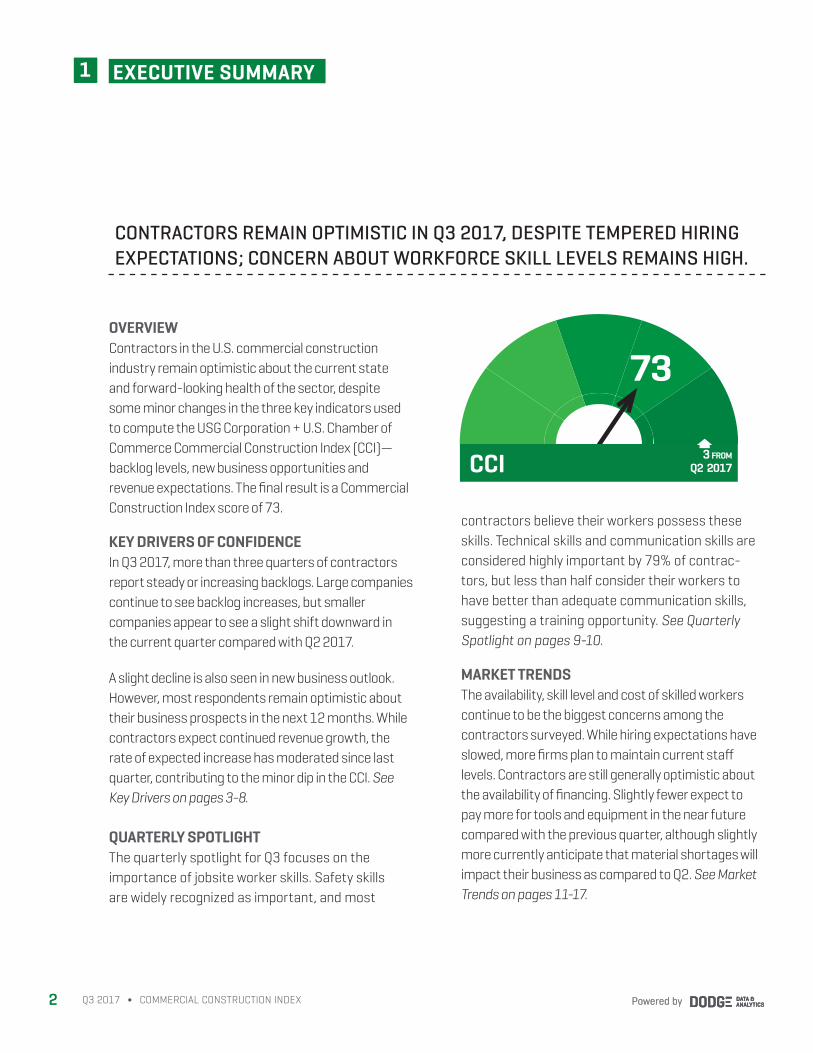
OVERVIEW Contractors in the U.S. commercial construction industry remain optimistic about the current state and forward-looking health of the sector, despite some minor changes in the three key indicators used to compute the USG Corporation + U.S. Chamber of Commerce Commercial Construction Index (CCI)—backlog levels, new business opportunities and revenue expectations. The final result is a Commercial Construction Index score of 73.
KEY DRIVERS OF CONFIDENCEIn Q3 2017, more than three quarters of contractors report steady or increasing backlogs. Large companies continue to see backlog increases, but smaller companies appear to see a slight shift downward in the current quarter compared with Q2 2017.
A slight decline is also seen in new business outlook. However, most respondents remain optimistic about their business prospects in the next 12 months. While contractors expect continued revenue growth, the rate of expected increase has moderated since last quarter, contributing to the minor dip in the CCI. See Key Drivers on pages 3-8.
QUARTERLY SPOTLIGHTThe quarterly spotlight for Q3 focuses on the importance of jobsite worker skills. Safety skills are widely recognized as important, and most
contractors believe their workers possess these skills. Technical skills and communication skills are considered highly important by 79% of contrac-tors, but less than half consider their workers to have better than adequate communication skills, suggesting a training opportunity. See Quarterly Spotlight on pages 9-10.
MARKET TRENDSThe availability, skill level and cost of skilled workers continue to be the biggest concerns among the contractors surveyed. While hiring expectations have slowed, more firms plan to maintain current staff levels. Contractors are still generally optimistic about the availability of financing. Slightly fewer expect to pay more for tools and equipment in the near future compared with the previous quarter, although slightly more currently anticipate that material shortages will impact their business as compared to Q2. See Market Trends on pages 11-17.
Powered by2 Q3 2017 ∫ COMMERCIAL CONSTRUCTION INDEX
CONTRACTORS REMAIN OPTIMISTIC IN Q3 2017, DESPITE TEMPERED HIRING EXPECTATIONS; CONCERN ABOUT WORKFORCE SKILL LEVELS REMAINS HIGH.
73
CCI 3 from Q2 2017
➧
EXECUTIVE SUMMARY
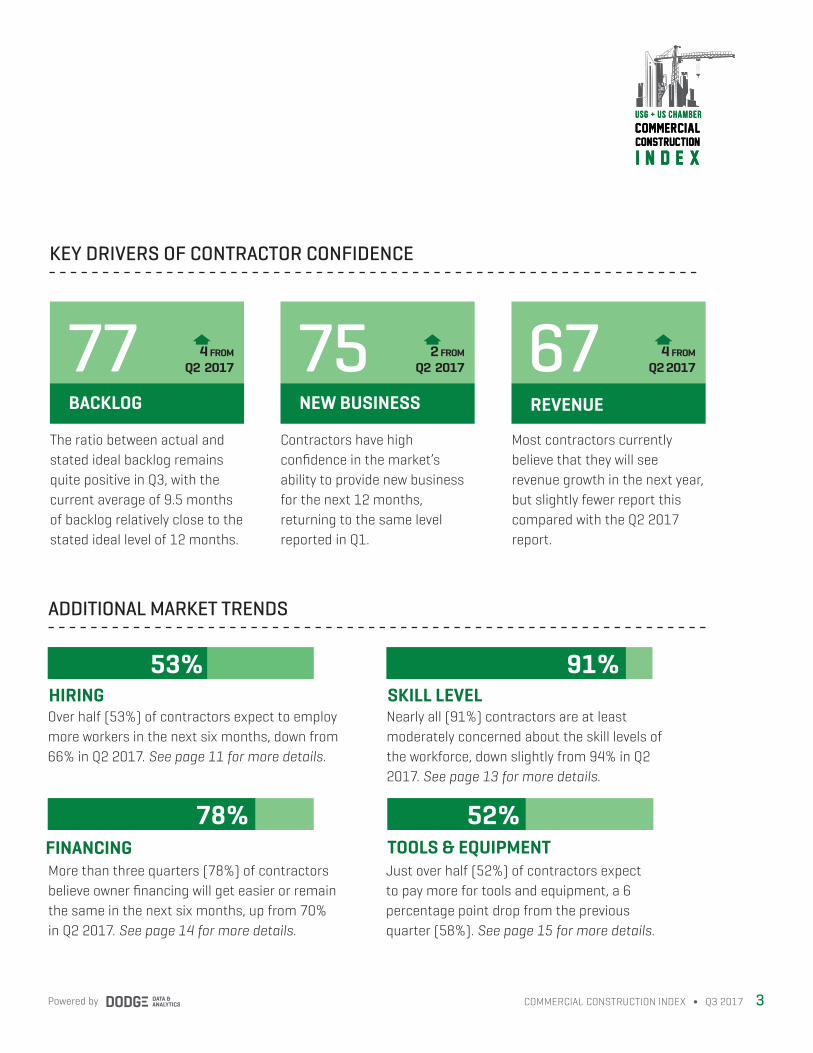
KEY DRIVERS OF CONTRACTOR CONFIDENCE
4 from Q2 2017
➧67REVENUE
4 from Q2 2017
➧77BACKLOG
2 from Q2 2017
➧75NEW BUSINESS
The ratio between actual and stated ideal backlog remains quite positive in Q3, with the current average of 9.5 months of backlog relatively close to the stated ideal level of 12 months.
Contractors have high confidence in the market’s ability to provide new business for the next 12 months, returning to the same level reported in Q1.
Most contractors currently believe that they will see revenue growth in the next year, but slightly fewer report this compared with the Q2 2017 report.
3COMMERCIAL CONSTRUCTION INDEX ∫ Q3 2017Powered by
commercial
construction
i n d e x
usg + us chamber
ADDITIONAL MARKET TRENDS
HIRING
FINANCING
SKILL LEVELOver half (53%) of contractors expect to employ more workers in the next six months, down from 66% in Q2 2017. See page 11 for more details.
Nearly all (91%) contractors are at least moderately concerned about the skill levels of the workforce, down slightly from 94% in Q2 2017. See page 13 for more details.
53%
TOOLS & EQUIPMENT More than three quarters (78%) of contractors believe owner financing will get easier or remain the same in the next six months, up from 70% in Q2 2017. See page 14 for more details.
Just over half (52%) of contractors expect to pay more for tools and equipment, a 6 percentage point drop from the previous quarter (58%). See page 15 for more details.
78%
91%
commercial
construction
i n d e x
usg + us chamber
52%

DRIVERS OF CONFIDENCE BACKLOG 2
CHANGE OVER LAST QUARTERMost (77%) contractors report a stable or increased project backlog in the last three months, down slightly from 82% in Q2. This quarter, more contractors report a stable backlog (42%) than those reporting an increase (35%), a shift from the Q2 findings in which nearly half (47%) reported an increase in backlog.
CURRENT BACKLOGThe average backlog reported dropped slightly to 9.5 months from 9.9 months in Q2. However, this still represents 77% of the average ideal backlog (12 months) and suggests a steady market.
AMOUNT OF BACKLOG REPORTED In Q3, 17% report a high level of backlog (18 months or more), the same percentage as in Q2. However, the lowest category of backlog (less than 9 months) increased by 4 percentage points compared with Q2, and the moderate category (9 to 17 months) declined by the same amount.
VARIANCE BY SIZEFewer small firms (annual revenues less than $10M) reported an increase in backlog this quarter, which may have contributed to the increase in the lowest category of backlog (less than 9 months).
Amount of Backlog Reported
Change in Backlog in the Last 3 Months
35%
Increased Decreased
Q3 2017Q2 2017
Stable
Note: Remaining 1% in Q2 responses to Change in Backlog in the last three months responded "Not Sure." Please see pages 18–19 for more details on backlog methodology.
Powered by4
77%9.5 Months 12 Months
Average Current BacklogAverage Stated Ideal Backlog
Current vs. Ideal Backlog
42%
22%
47%
35%
17%
More than three quarters of contractors report increased or stable backlogs, despite a slight decline compared with Q2 2017.
Q3 2017 ∫ COMMERCIAL CONSTRUCTION INDEX
17%
18 or More Months
Less Than 9 Months
Q3 2017Q2 2017
9 to 17 Months
27%
56%
17%
31%
52%
Q3 2017Q2 2017
NEW BUSINESS 2
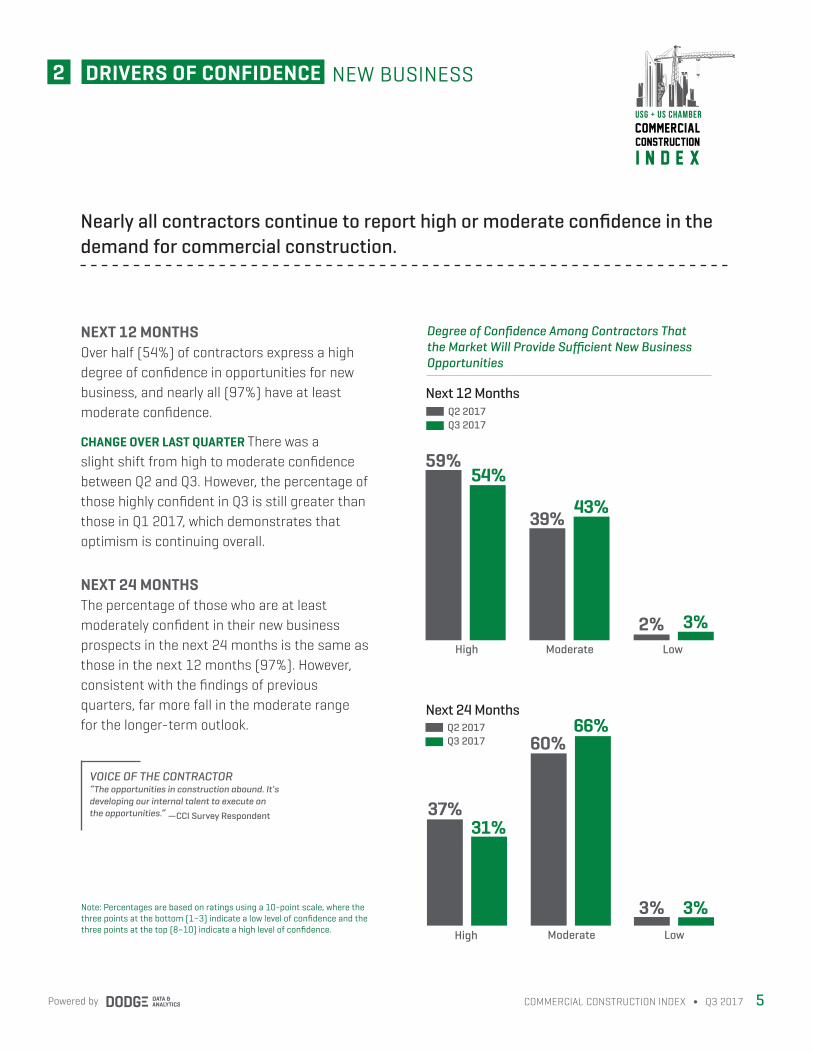
NEXT 12 MONTHSOver half (54%) of contractors express a high degree of confidence in opportunities for new business, and nearly all (97%) have at least moderate confidence.
CHANGE OVER LAST QUARTER There was a slight shift from high to moderate confidence between Q2 and Q3. However, the percentage of those highly confident in Q3 is still greater than those in Q1 2017, which demonstrates that optimism is continuing overall.
NEXT 24 MONTHSThe percentage of those who are at least moderately confident in their new business prospects in the next 24 months is the same as those in the next 12 months (97%). However, consistent with the findings of previous quarters, far more fall in the moderate range for the longer-term outlook.
Degree of Confidence Among Contractors That the Market Will Provide Sufficient New Business Opportunities
3%3%Low
66%60%
Moderate
31%37%
High
3%2%Low
43%
Moderate
54%59%
High
Next 12 Months
Next 24 Months
Note: Percentages are based on ratings using a 10-point scale, where the three points at the bottom (1–3) indicate a low level of confidence and the three points at the top (8–10) indicate a high level of confidence.
39%
commercial
construction
i n d e x
usg + us chamber
5COMMERCIAL CONSTRUCTION INDEX ∫ Q3 2017Powered by
Nearly all contractors continue to report high or moderate confidence in the demand for commercial construction.
Q3 2017Q2 2017
Q3 2017Q2 2017
VOICE OF THE CONTRACTOR“The opportunities in construction abound. It's developing our internal talent to execute on the opportunities.” —CCI Survey Respondent
DRIVERS OF CONFIDENCE

NEW BUSINESS
VARIANCE BY SIZEMore large contractors (annual revenues of $100M and more] are highly confident than small contractors (annual revenues under $10M) in their 12-month outlook. While this overall finding is consistent with the previous quarter, the gap has grown to 23 percentage points.
This finding, combined with the finding of the steadiness of large backlogs (18 months or more) and the shift from moderate (9 to 17 months) to smaller backlogs (less than 9 months), suggests that smaller contractors may be experiencing more challenges related to new business than larger ones. See page 4 for backlog findings.
However, since the vast majority of small contractors (93%) still report at least a moderate degree of confidence in the upcoming market, it appears that in general, contractors at all levels are still optimistic about the future.
Note: Percentages are based on ratings using a 10-point scale, where the three points at the bottom (1–3) indicate a low level of confidence and the three points at the top (8–10) indicate a high level of confidence.
Powered by6
Large and midsize companies express more confidence than small companies in their 12-month outlook.
Q3 2017 ∫ COMMERCIAL CONSTRUCTION INDEX
Q3 2017Q2 2017
Contractors Reporting High Confidence in Demand for Commercial Construction in the Next 12 Months by Company Size
Large Companies ($100 Million and More)
Midsize Companies ($10 Million to Under $100 Million)
Small Companies (Under $10 Million)
69% 67%
64% 67%
49% 44%
DRIVERS OF CONFIDENCE 2
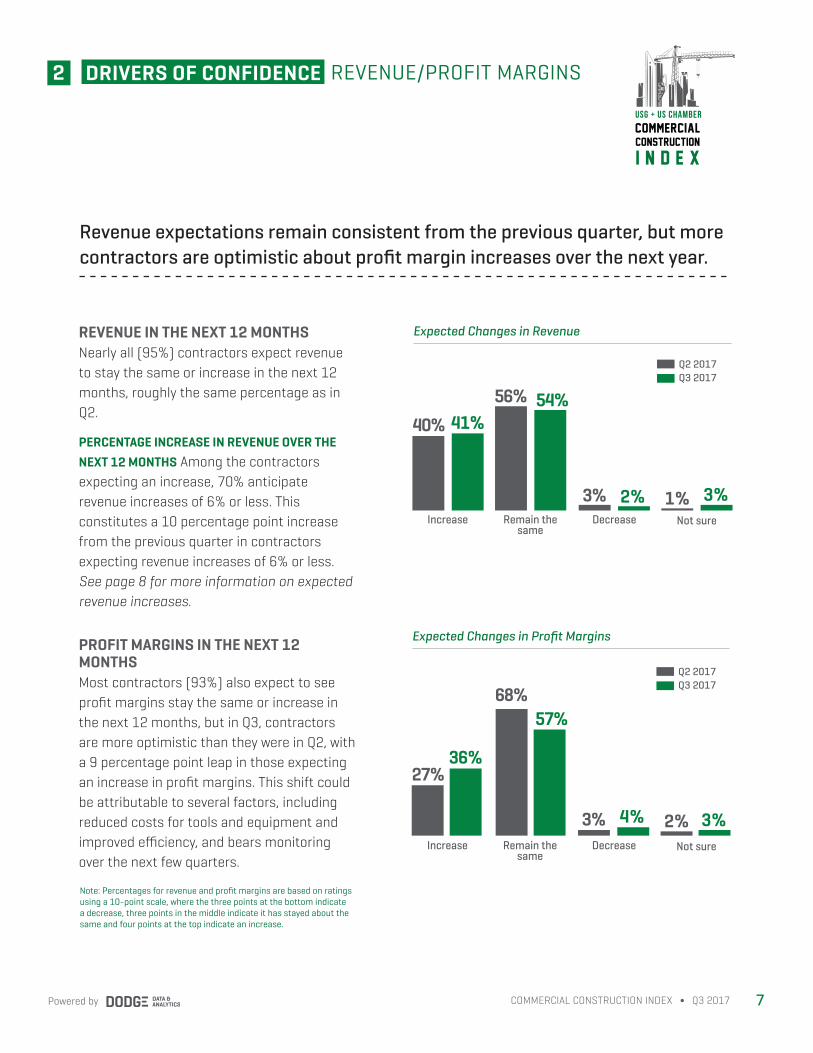
REVENUE IN THE NEXT 12 MONTHS Nearly all (95%) contractors expect revenue to stay the same or increase in the next 12 months, roughly the same percentage as in Q2.
PERCENTAGE INCREASE IN REVENUE OVER THE NEXT 12 MONTHS Among the contractors expecting an increase, 70% anticipate revenue increases of 6% or less. This constitutes a 10 percentage point increase from the previous quarter in contractors expecting revenue increases of 6% or less. See page 8 for more information on expected revenue increases.
PROFIT MARGINS IN THE NEXT 12 MONTHSMost contractors (93%) also expect to see profit margins stay the same or increase in the next 12 months, but in Q3, contractors are more optimistic than they were in Q2, with a 9 percentage point leap in those expecting an increase in profit margins. This shift could be attributable to several factors, including reduced costs for tools and equipment and improved efficiency, and bears monitoring over the next few quarters.
Note: Percentages for revenue and profit margins are based on ratings using a 10-point scale, where the three points at the bottom indicate a decrease, three points in the middle indicate it has stayed about the same and four points at the top indicate an increase.
REVENUE/PROFIT MARGINS
Expected Changes in Profit Margins
7COMMERCIAL CONSTRUCTION INDEX ∫ Q3 2017Powered by
commercial
construction
i n d e x
usg + us chamber
27%36%
68%57%
2% 3%3% 4%
Revenue expectations remain consistent from the previous quarter, but more contractors are optimistic about profit margin increases over the next year.
Q3 2017Q2 2017
Expected Changes in Revenue
40% 41%
Increase Not sure
56% 54%
1% 3%3% 2%Remain the
sameDecrease
Q3 2017Q2 2017
Increase Not sureRemain the same
Decrease
2 DRIVERS OF CONFIDENCE
REVENUE
Powered by8 Q3 2017 ∫ COMMERCIAL CONSTRUCTION INDEX
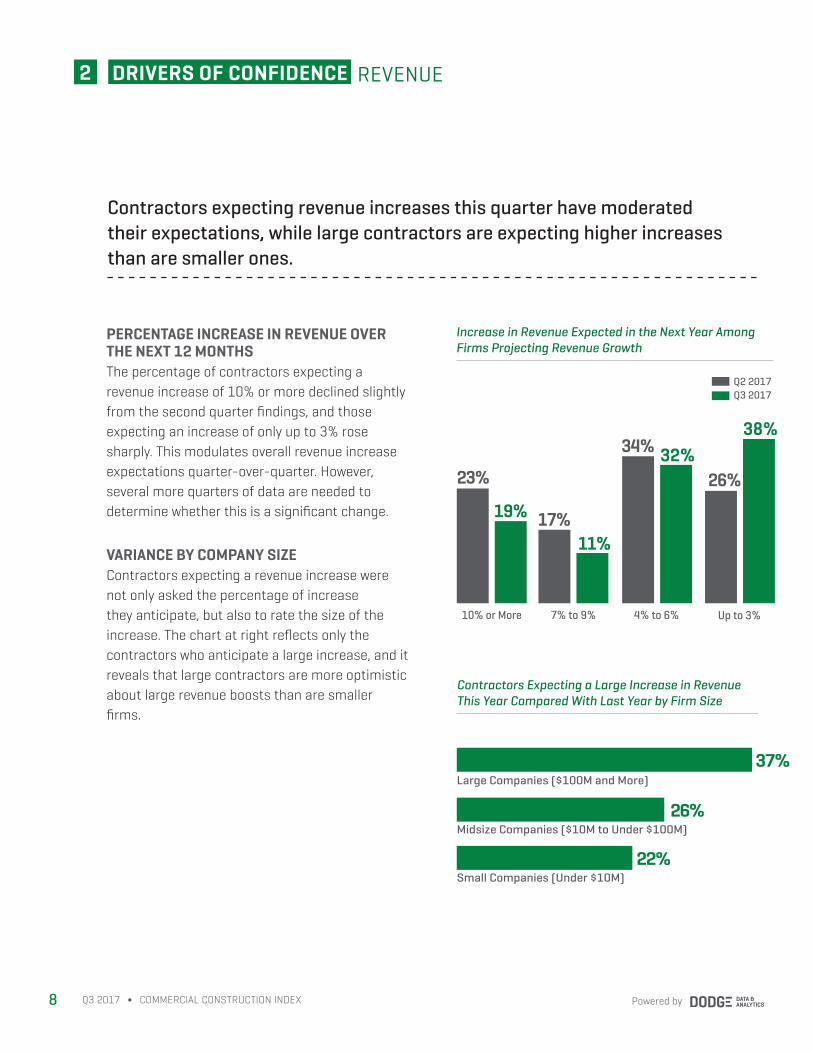
PERCENTAGE INCREASE IN REVENUE OVER THE NEXT 12 MONTHSThe percentage of contractors expecting a revenue increase of 10% or more declined slightly from the second quarter findings, and those expecting an increase of only up to 3% rose sharply. This modulates overall revenue increase expectations quarter-over-quarter. However, several more quarters of data are needed to determine whether this is a significant change.
VARIANCE BY COMPANY SIZEContractors expecting a revenue increase were not only asked the percentage of increase they anticipate, but also to rate the size of the increase. The chart at right reflects only the contractors who anticipate a large increase, and it reveals that large contractors are more optimistic about large revenue boosts than are smaller firms.
Contractors expecting revenue increases this quarter have moderated their expectations, while large contractors are expecting higher increases than are smaller ones.
Contractors Expecting a Large Increase in Revenue This Year Compared With Last Year by Firm Size
37%
26%
22%
Large Companies ($100M and More)
Midsize Companies ($10M to Under $100M)
Small Companies (Under $10M)
Increase in Revenue Expected in the Next Year Among Firms Projecting Revenue Growth
23%
19%
10% or More
17%11%
34% 32%
7% to 9% 4% to 6%
Q3 2017Q2 2017
26%
38%
Up to 3%
DRIVERS OF CONFIDENCE 2
Q3 2017Q2 2017
commercial
construction
i n d e x
usg + us chamber
3 SKILLS DEVELOPMENTQUARTERLY SPOTLIGHT
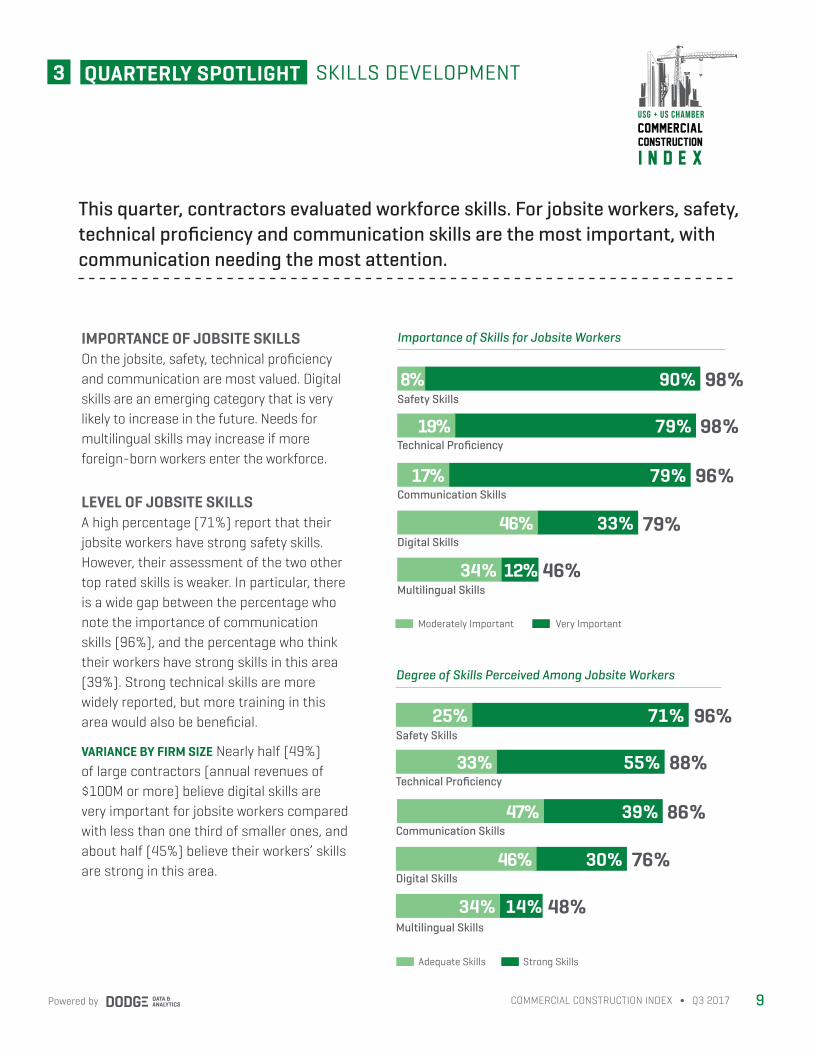
IMPORTANCE OF JOBSITE SKILLSOn the jobsite, safety, technical proficiency and communication are most valued. Digital skills are an emerging category that is very likely to increase in the future. Needs for multilingual skills may increase if more foreign-born workers enter the workforce.
LEVEL OF JOBSITE SKILLSA high percentage (71%) report that their jobsite workers have strong safety skills. However, their assessment of the two other top rated skills is weaker. In particular, there is a wide gap between the percentage who note the importance of communication skills (96%), and the percentage who think their workers have strong skills in this area (39%). Strong technical skills are more widely reported, but more training in this area would also be beneficial.
VARIANCE BY FIRM SIZE Nearly half (49%) of large contractors (annual revenues of $100M or more) believe digital skills are very important for jobsite workers compared with less than one third of smaller ones, and about half (45%) believe their workers’ skills are strong in this area.
Importance of Skills for Jobsite Workers
33%
79%
90%
79%Communication Skills
Digital Skills
Safety Skills
Technical Proficiency
This quarter, contractors evaluated workforce skills. For jobsite workers, safety, technical proficiency and communication skills are the most important, with communication needing the most attention.
12%Multilingual Skills
8%
34%
19%
17%
46%
Degree of Skills Perceived Among Jobsite Workers
30%
55%
71%
39%Communication Skills
Digital Skills
Safety Skills
Technical Proficiency
14%Multilingual Skills
25%
34%
33%
47%
46%
Strong SkillsAdequate Skills
Very ImportantModerately Important
98%
98%
96%
79%
46%
96%
88%
86%
76%
48%
9COMMERCIAL CONSTRUCTION INDEX ∫ Q3 2017Powered by
Powered by10
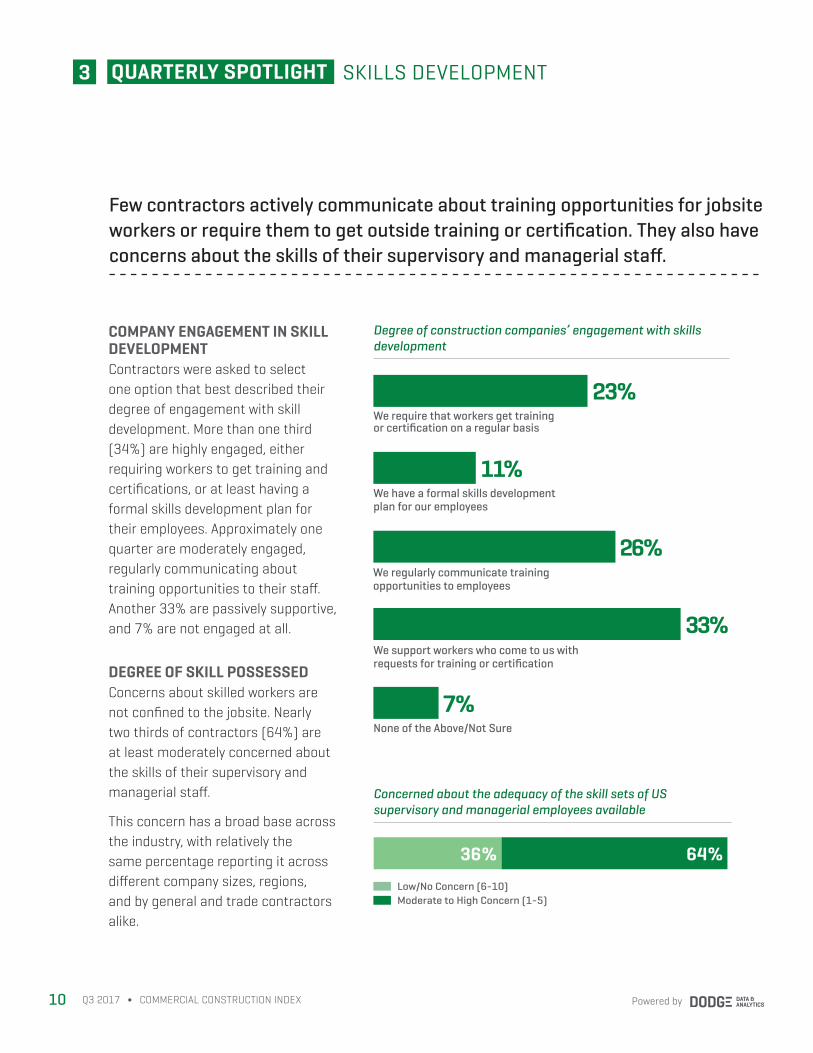
COMPANY ENGAGEMENT IN SKILL DEVELOPMENTContractors were asked to select one option that best described their degree of engagement with skill development. More than one third (34%) are highly engaged, either requiring workers to get training and certifications, or at least having a formal skills development plan for their employees. Approximately one quarter are moderately engaged, regularly communicating about training opportunities to their staff. Another 33% are passively supportive, and 7% are not engaged at all.
DEGREE OF SKILL POSSESSEDConcerns about skilled workers are not confined to the jobsite. Nearly two thirds of contractors (64%) are at least moderately concerned about the skills of their supervisory and managerial staff.
This concern has a broad base across the industry, with relatively the same percentage reporting it across different company sizes, regions, and by general and trade contractors alike.
Few contractors actively communicate about training opportunities for jobsite workers or require them to get outside training or certification. They also have concerns about the skills of their supervisory and managerial staff.
Degree of construction companies’ engagement with skills development
3 SKILLS DEVELOPMENTQUARTERLY SPOTLIGHT
Concerned about the adequacy of the skill sets of US supervisory and managerial employees available
64%
Q3 2017 ∫ COMMERCIAL CONSTRUCTION INDEX
36%
Low/No Concern (6-10)Moderate to High Concern (1-5)
We require that workers get training or certification on a regular basis
We have a formal skills development plan for our employees
We regularly communicate training opportunities to employees
We support workers who come to us with requests for training or certification
None of the Above/Not Sure
33%
7%
26%
11%
23%
11COMMERCIAL CONSTRUCTION INDEX ∫ Q3 2017Powered by
commercial
construction
i n d e x
usg + us chamber
WORKFORCE
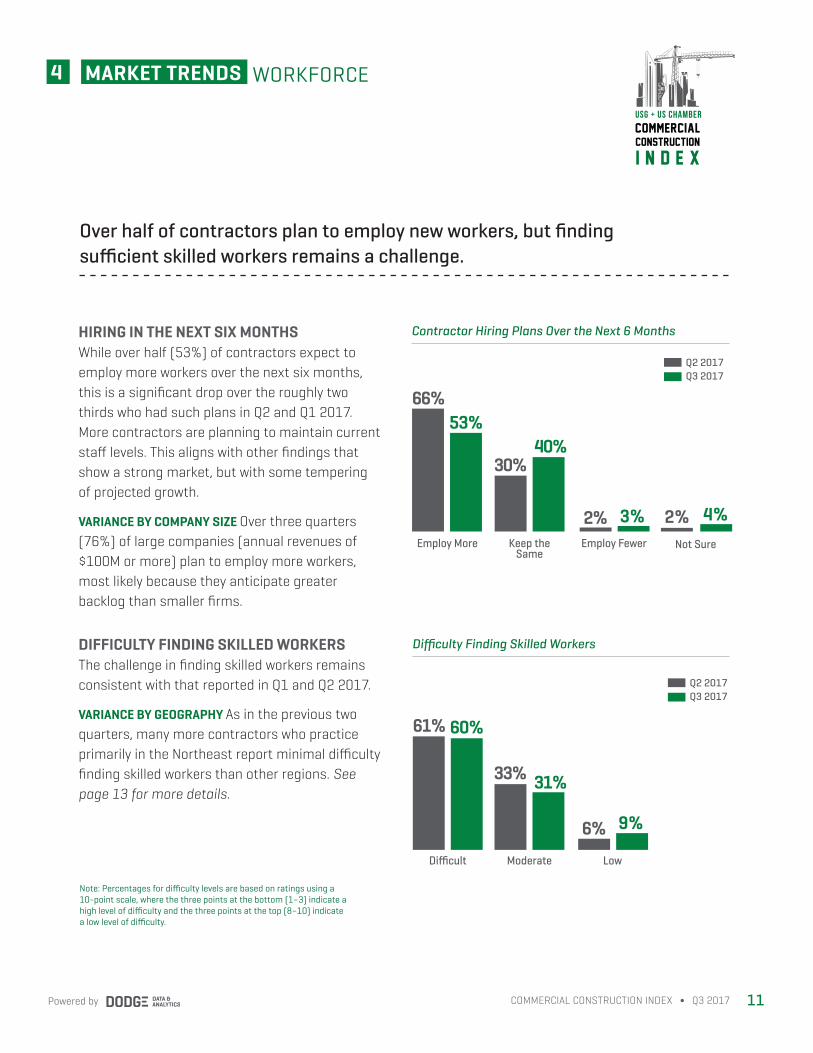
HIRING IN THE NEXT SIX MONTHS While over half (53%) of contractors expect to employ more workers over the next six months, this is a significant drop over the roughly two thirds who had such plans in Q2 and Q1 2017. More contractors are planning to maintain current staff levels. This aligns with other findings that show a strong market, but with some tempering of projected growth.
VARIANCE BY COMPANY SIZE Over three quarters (76%) of large companies (annual revenues of $100M or more) plan to employ more workers, most likely because they anticipate greater backlog than smaller firms.
DIFFICULTY FINDING SKILLED WORKERS The challenge in finding skilled workers remains consistent with that reported in Q1 and Q2 2017.
VARIANCE BY GEOGRAPHY As in the previous two quarters, many more contractors who practice primarily in the Northeast report minimal difficulty finding skilled workers than other regions. See page 13 for more details.
Note: Percentages for difficulty levels are based on ratings using a 10-point scale, where the three points at the bottom (1–3) indicate a high level of difficulty and the three points at the top (8–10) indicate a low level of difficulty.
Contractor Hiring Plans Over the Next 6 Months
Difficulty Finding Skilled Workers
66%53%
Employ More Not Sure
30%40%
2% 4%2% 3%Keep the
SameEmploy Fewer
61% 60%
Difficult
33% 31%
6% 9%
Moderate Low
Over half of contractors plan to employ new workers, but finding sufficient skilled workers remains a challenge.
Q3 2017Q2 2017
Q3 2017Q2 2017
4 MARKET TRENDS
Powered by12 Q3 2017 ∫ COMMERCIAL CONSTRUCTION INDEX
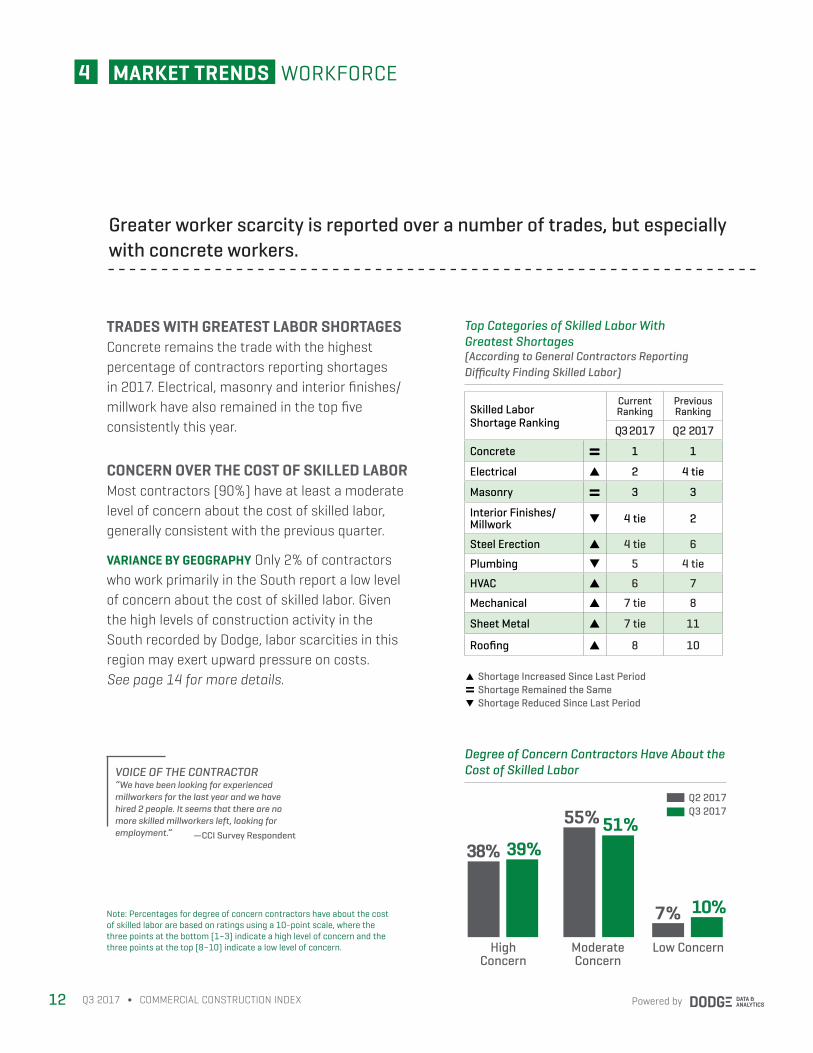
TRADES WITH GREATEST LABOR SHORTAGES Concrete remains the trade with the highest percentage of contractors reporting shortages in 2017. Electrical, masonry and interior finishes/millwork have also remained in the top five consistently this year.
CONCERN OVER THE COST OF SKILLED LABORMost contractors (90%) have at least a moderate level of concern about the cost of skilled labor, generally consistent with the previous quarter.
VARIANCE BY GEOGRAPHY Only 2% of contractors who work primarily in the South report a low level of concern about the cost of skilled labor. Given the high levels of construction activity in the South recorded by Dodge, labor scarcities in this region may exert upward pressure on costs. See page 14 for more details.
Note: Percentages for degree of concern contractors have about the cost of skilled labor are based on ratings using a 10-point scale, where the three points at the bottom (1–3) indicate a high level of concern and the three points at the top (8–10) indicate a low level of concern.
Top Categories of Skilled Labor With Greatest Shortages (According to General Contractors Reporting Difficulty Finding Skilled Labor)
▲ Shortage Increased Since Last Period Shortage Remained the Same▼ Shortage Reduced Since Last Period
Skilled Labor Shortage Ranking
Current Ranking
Previous Ranking
Q3 2017 Q2 2017
Concrete = 1 1
Electrical ▲ 2 4 tie
Masonry = 3 3
Interior Finishes/ Millwork ▼ 4 tie 2
Steel Erection ▲ 4 tie 6
Plumbing ▼ 5 4 tie
HVAC ▲ 6 7
Mechanical ▲ 7 tie 8
Sheet Metal ▲ 7 tie 11
Roofing ▲ 8 10
Degree of Concern Contractors Have About the Cost of Skilled Labor
55% 51%
Moderate Concern
High Concern
38% 39%
7% 10%
Low Concern
=
VOICE OF THE CONTRACTOR“We have been looking for experienced millworkers for the last year and we have hired 2 people. It seems that there are no more skilled millworkers left, looking for employment.” —CCI Survey Respondent
Greater worker scarcity is reported over a number of trades, but especially with concrete workers.
Q3 2017Q2 2017
WORKFORCE4 MARKET TRENDS
13COMMERCIAL CONSTRUCTION INDEX ∫ Q3 2017Powered by
commercial
construction
i n d e x
usg + us chamber
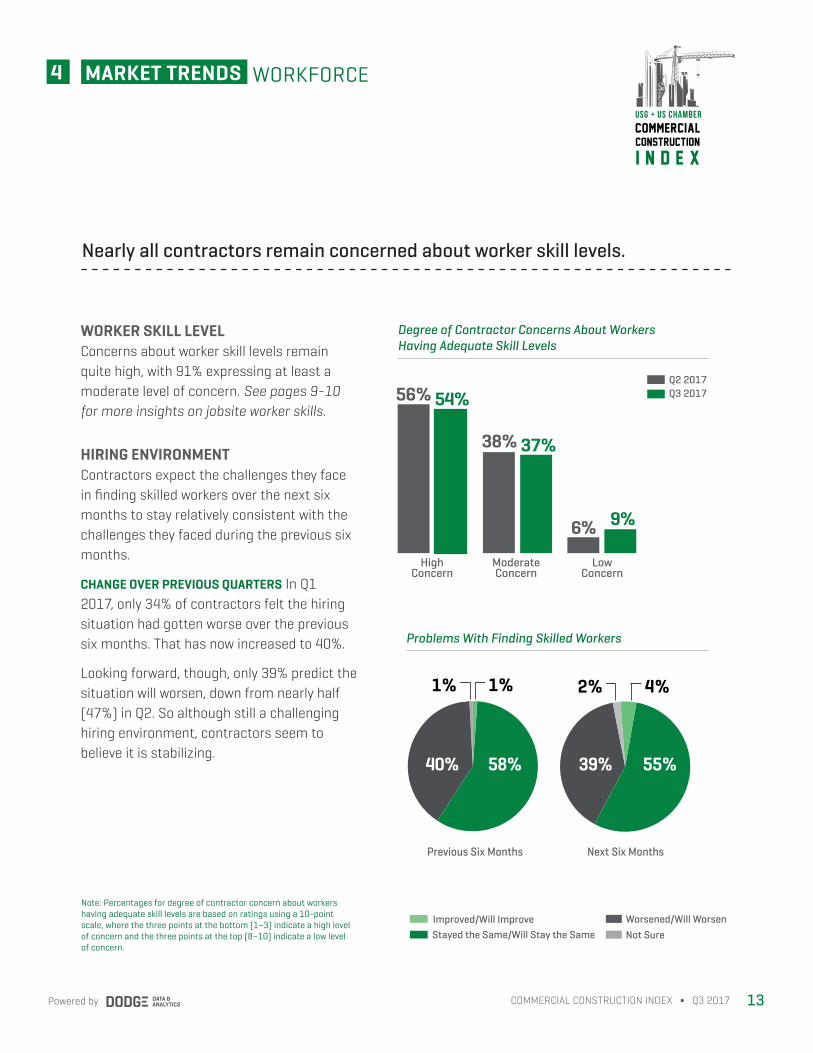
WORKER SKILL LEVEL Concerns about worker skill levels remain quite high, with 91% expressing at least a moderate level of concern. See pages 9-10 for more insights on jobsite worker skills.
HIRING ENVIRONMENTContractors expect the challenges they face in finding skilled workers over the next six months to stay relatively consistent with the challenges they faced during the previous six months.
CHANGE OVER PREVIOUS QUARTERS In Q1 2017, only 34% of contractors felt the hiring situation had gotten worse over the previous six months. That has now increased to 40%.
Looking forward, though, only 39% predict the situation will worsen, down from nearly half (47%) in Q2. So although still a challenging hiring environment, contractors seem to believe it is stabilizing.
Note: Percentages for degree of contractor concern about workers having adequate skill levels are based on ratings using a 10-point scale, where the three points at the bottom (1–3) indicate a high level of concern and the three points at the top (8–10) indicate a low level of concern.
Degree of Contractor Concerns About Workers Having Adequate Skill Levels
38% 37%
Moderate Concern
High Concern
56% 54%
6%
Low Concern
9%
Problems With Finding Skilled Workers
58%
Previous Six Months Next Six Months
40% 39%
Improved/Will ImproveStayed the Same/Will Stay the Same
Worsened/Will WorsenNot Sure
55%
1% 4%2%1%
Nearly all contractors remain concerned about worker skill levels.
Q3 2017Q2 2017
WORKFORCE4 MARKET TRENDS
Powered by14 Q3 2017 ∫ COMMERCIAL CONSTRUCTION INDEX
Not Sure
Get Easier
Become More DifficultRemain About the Same
ACCESS TO FINANCING
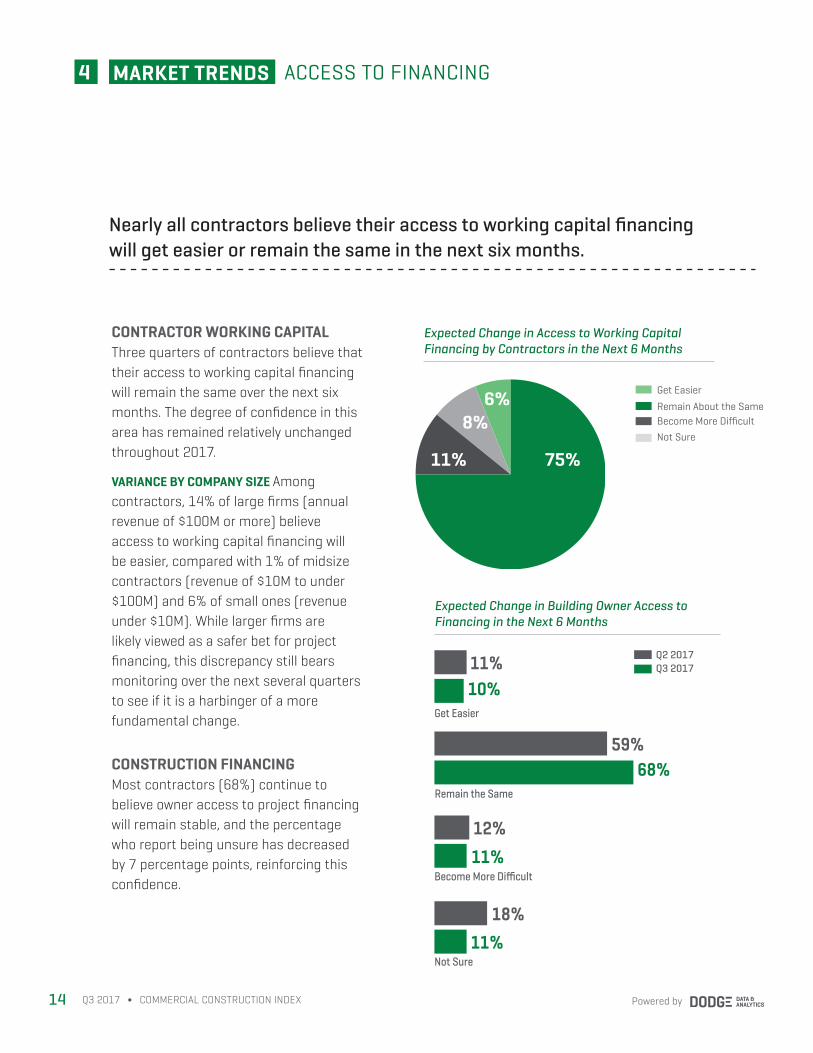
CONTRACTOR WORKING CAPITAL Three quarters of contractors believe that their access to working capital financing will remain the same over the next six months. The degree of confidence in this area has remained relatively unchanged throughout 2017.
VARIANCE BY COMPANY SIZE Among contractors, 14% of large firms (annual revenue of $100M or more) believe access to working capital financing will be easier, compared with 1% of midsize contractors (revenue of $10M to under $100M) and 6% of small ones (revenue under $10M). While larger firms are likely viewed as a safer bet for project financing, this discrepancy still bears monitoring over the next several quarters to see if it is a harbinger of a more fundamental change.
CONSTRUCTION FINANCINGMost contractors (68%) continue to believe owner access to project financing will remain stable, and the percentage who report being unsure has decreased by 7 percentage points, reinforcing this confidence.
Expected Change in Building Owner Access to Financing in the Next 6 Months
68%59%
10%Get Easier
Remain the Same
11%Become More Difficult
11%18%
Not Sure
12%
11%
Expected Change in Access to Working Capital Financing by Contractors in the Next 6 Months
75%
6%8%
11%
Nearly all contractors believe their access to working capital financing will get easier or remain the same in the next six months.
Q3 2017Q2 2017
4 MARKET TRENDS

15COMMERCIAL CONSTRUCTION INDEX ∫ Q3 2017Powered by
TOOL AND EQUIPMENT PRICESWhile more than half of contractors (52%) expect to pay more for tools and equipment in the next six months, this is a 6 percentage point decrease from the Q2 survey. Fewer concerns about these costs may contribute to the more optimistic forecasts in Q3 for profit margin increases, despite relatively steady revenue streams. This optimism is consistent regionally and across all firm sizes.
IMPACT OF MATERIAL SHORTAGES ON CONTRACTORS On the other hand, 2017 has seen a steady increase in concerns about the impact of material shortages on contractors, with the percentage of those expecting a moderate or higher impact growing from 51% in Q1 to 75% in Q3. If this shift continues, material shortages may begin to impact contractor confidence, which would eventually influence the overall CCI number.
Contractors Expecting to Pay More for Tools and Equipment in the Next 6 Months
Expected Material Shortages’ Impact on Contractors
4%
47%
Q1 Q2
54%
10%
Moderate Impact (4-7)High Impact (1-3)
Q3
11%
MATERIALS & EQUIPMENT
31%
52%
12%
36%
Expecting to Pay More
Not Expecting to Pay More
Not Sure
58%
11%
Contractors are slightly less concerned about tool and equipment prices in Q3 than in Q2, but more expect to be impacted by material shortages.
Note: Percentages for Expected Material Shortages’ Impact on Contractors are based on ratings using a 10-point scale, where the three points at the bottom indicate a high impact and the three points at the top indicate a low impact.
64%
Q3 2017Q2 2017
commercial
construction
i n d e x
usg + us chamber
4 MARKET TRENDS
Powered by16 Q3 2017 ∫ COMMERCIAL CONSTRUCTION INDEX
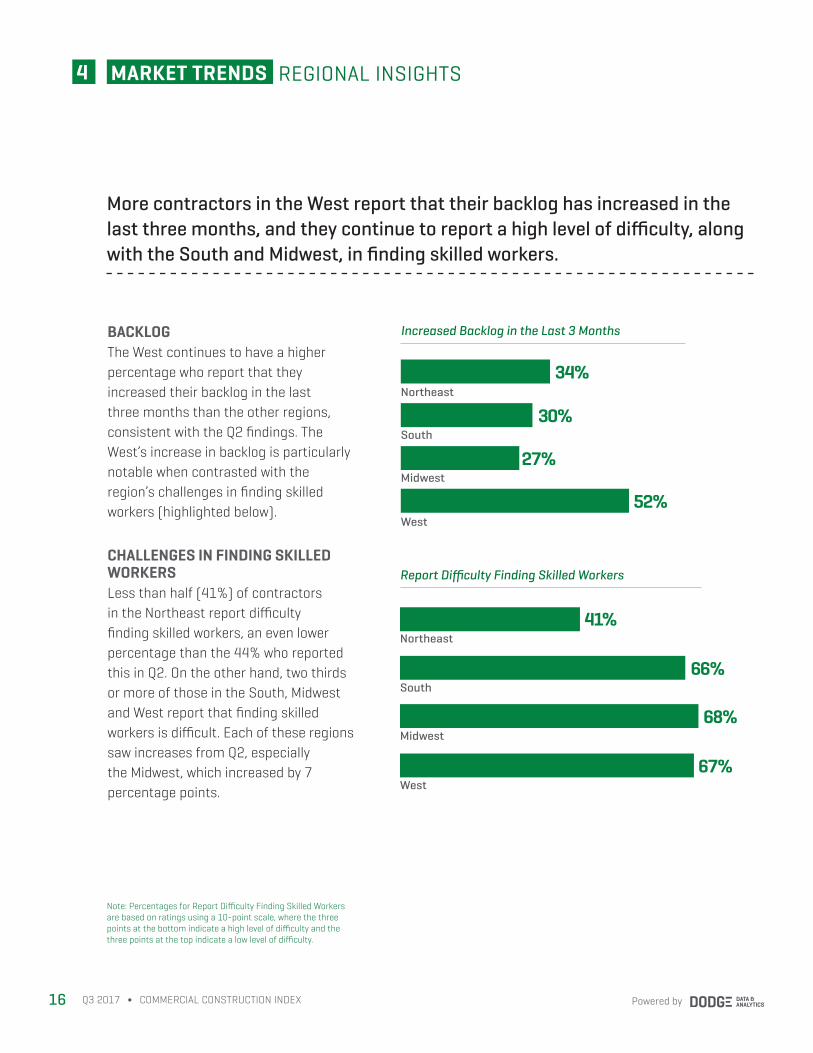
BACKLOG The West continues to have a higher percentage who report that they increased their backlog in the last three months than the other regions, consistent with the Q2 findings. The West’s increase in backlog is particularly notable when contrasted with the region’s challenges in finding skilled workers (highlighted below).
CHALLENGES IN FINDING SKILLED WORKERS Less than half (41%) of contractors in the Northeast report difficulty finding skilled workers, an even lower percentage than the 44% who reported this in Q2. On the other hand, two thirds or more of those in the South, Midwest and West report that finding skilled workers is difficult. Each of these regions saw increases from Q2, especially the Midwest, which increased by 7 percentage points.
4 REGIONAL INSIGHTSMARKET TRENDS
Report Difficulty Finding Skilled Workers
41%
66%
68%
67%
Northeast
South
Midwest
West
Increased Backlog in the Last 3 Months
34%
30%
27%
52%
Northeast
South
Midwest
West
More contractors in the West report that their backlog has increased in the last three months, and they continue to report a high level of difficulty, along with the South and Midwest, in finding skilled workers.
Note: Percentages for Report Difficulty Finding Skilled Workers are based on ratings using a 10-point scale, where the three points at the bottom indicate a high level of difficulty and the three points at the top indicate a low level of difficulty.
17COMMERCIAL CONSTRUCTION INDEX ∫ Q3 2017Powered by
commercial
construction
i n d e x
usg + us chamber
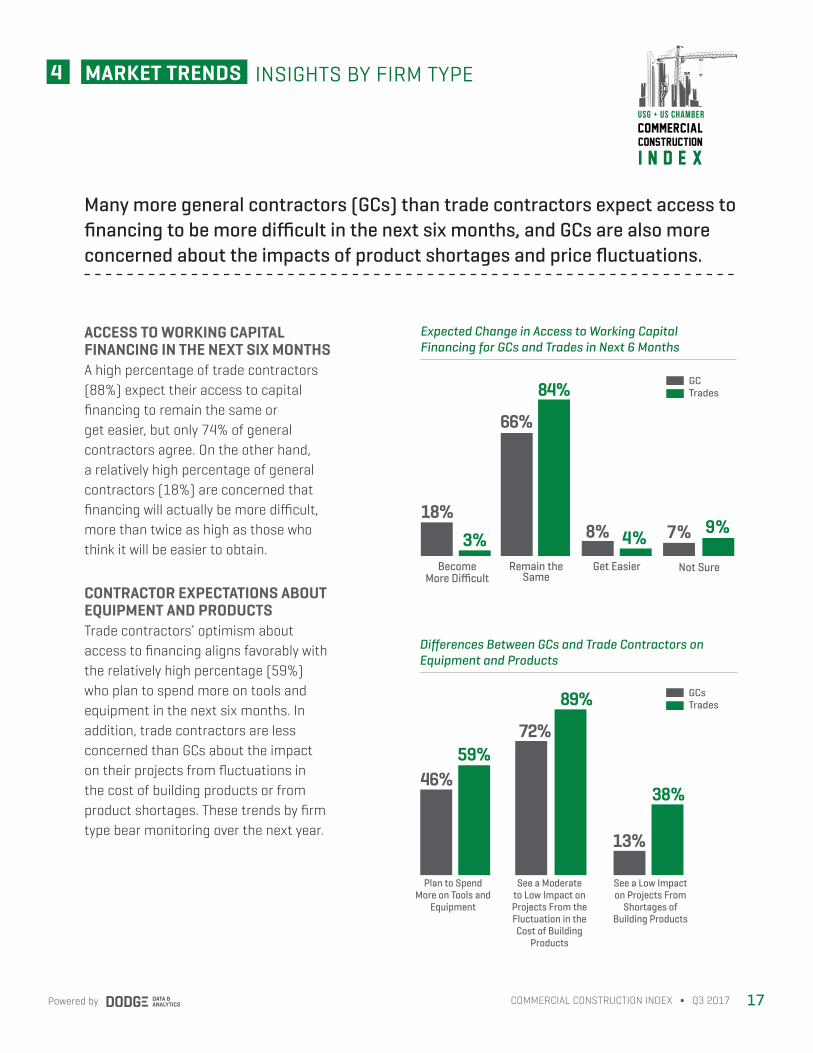
ACCESS TO WORKING CAPITAL FINANCING IN THE NEXT SIX MONTHSA high percentage of trade contractors (88%) expect their access to capital financing to remain the same or get easier, but only 74% of general contractors agree. On the other hand, a relatively high percentage of general contractors (18%) are concerned that financing will actually be more difficult, more than twice as high as those who think it will be easier to obtain.
CONTRACTOR EXPECTATIONS ABOUT EQUIPMENT AND PRODUCTSTrade contractors’ optimism about access to financing aligns favorably with the relatively high percentage (59%) who plan to spend more on tools and equipment in the next six months. In addition, trade contractors are less concerned than GCs about the impact on their projects from fluctuations in the cost of building products or from product shortages. These trends by firm type bear monitoring over the next year.
INSIGHTS BY FIRM TYPE
Expected Change in Access to Working Capital Financing for GCs and Trades in Next 6 Months
Many more general contractors (GCs) than trade contractors expect access to financing to be more difficult in the next six months, and GCs are also more concerned about the impacts of product shortages and price fluctuations.
Differences Between GCs and Trade Contractors on Equipment and Products
18%3%
Become More Difficult
Not Sure
66%
84%
7% 9%8% 4%Remain the
SameGet Easier
TradesGC
46%59%
Plan to Spend More on Tools and
Equipment
72%
89%
13%
38%
See a Moderate to Low Impact on Projects From the Fluctuation in the Cost of Building
Products
See a Low Impact on Projects From
Shortages of Building Products
TradesGCs
4 MARKET TRENDS
Powered by18 Q3 2017 ∫ COMMERCIAL CONSTRUCTION INDEX
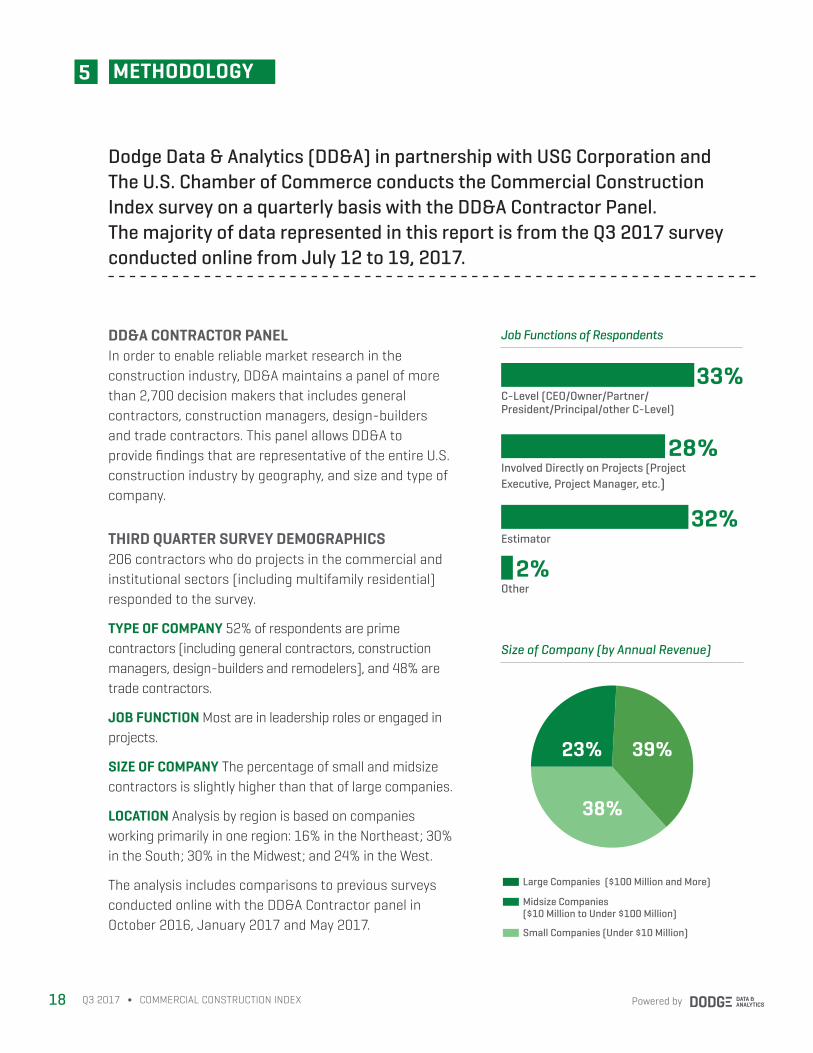
Job Functions of Respondents
C-Level (CEO/Owner/Partner/ President/Principal/other C-Level)
Involved Directly on Projects (Project Executive, Project Manager, etc.)
Estimator
Other
33%
28%
32%
Size of Company (by Annual Revenue)
2%
23%
38%
39%
Large Companies ($100 Million and More)
Midsize Companies ($10 Million to Under $100 Million)
Small Companies (Under $10 Million)
Dodge Data & Analytics (DD&A) in partnership with USG Corporation and The U.S. Chamber of Commerce conducts the Commercial Construction Index survey on a quarterly basis with the DD&A Contractor Panel. The majority of data represented in this report is from the Q3 2017 survey conducted online from July 12 to 19, 2017.
DD&A CONTRACTOR PANELIn order to enable reliable market research in the construction industry, DD&A maintains a panel of more than 2,700 decision makers that includes general contractors, construction managers, design-builders and trade contractors. This panel allows DD&A to provide findings that are representative of the entire U.S. construction industry by geography, and size and type of company.
THIRD QUARTER SURVEY DEMOGRAPHICS206 contractors who do projects in the commercial and institutional sectors (including multifamily residential) responded to the survey.
TYPE OF COMPANY 52% of respondents are prime contractors (including general contractors, construction managers, design-builders and remodelers], and 48% are trade contractors.
JOB FUNCTION Most are in leadership roles or engaged in projects.
SIZE OF COMPANY The percentage of small and midsize contractors is slightly higher than that of large companies.
LOCATION Analysis by region is based on companies working primarily in one region: 16% in the Northeast; 30% in the South; 30% in the Midwest; and 24% in the West.
The analysis includes comparisons to previous surveys conducted online with the DD&A Contractor panel in October 2016, January 2017 and May 2017.
5 METHODOLOGY
73
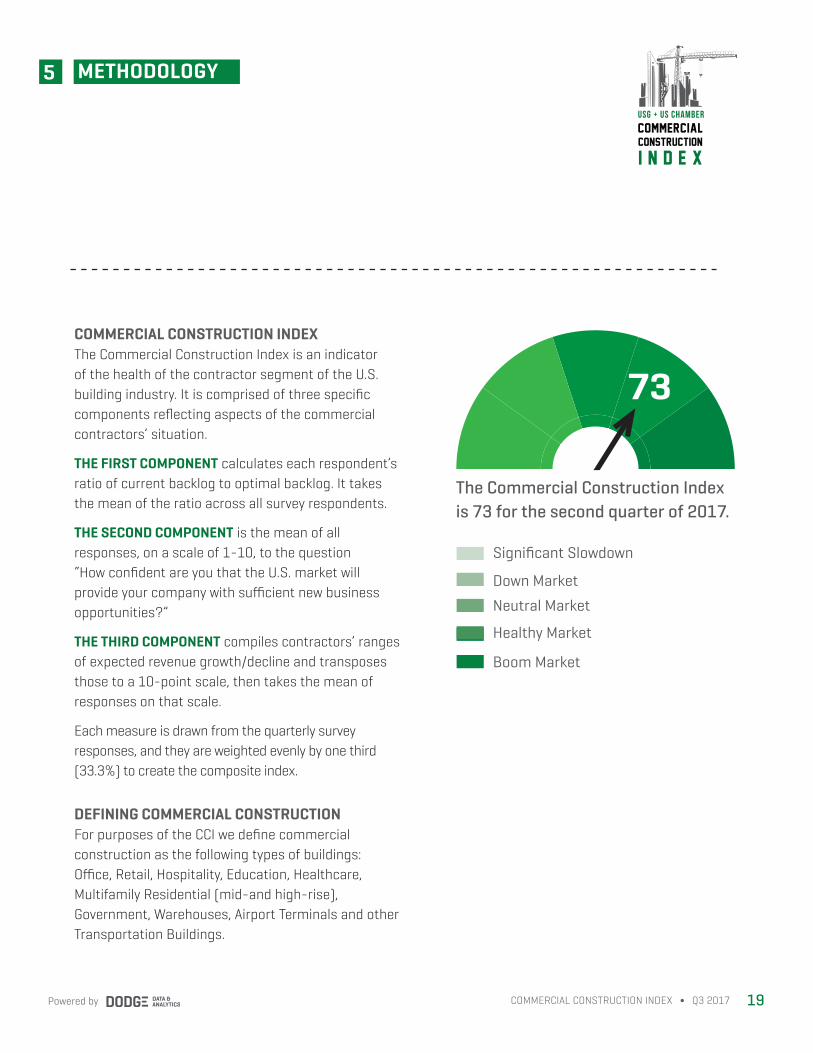
The Commercial Construction Index is 73 for the second quarter of 2017.
Significant Slowdown
Neutral Market
Down Market
Healthy Market
Boom Market
COMMERCIAL CONSTRUCTION INDEXThe Commercial Construction Index is an indicator of the health of the contractor segment of the U.S. building industry. It is comprised of three specific components reflecting aspects of the commercial contractors’ situation.
THE FIRST COMPONENT calculates each respondent’s ratio of current backlog to optimal backlog. It takes the mean of the ratio across all survey respondents.
THE SECOND COMPONENT is the mean of all responses, on a scale of 1-10, to the question “How confident are you that the U.S. market will provide your company with sufficient new business opportunities?”
THE THIRD COMPONENT compiles contractors’ ranges of expected revenue growth/decline and transposes those to a 10-point scale, then takes the mean of responses on that scale.
Each measure is drawn from the quarterly survey responses, and they are weighted evenly by one third (33.3%) to create the composite index.
DEFINING COMMERCIAL CONSTRUCTIONFor purposes of the CCI we define commercial construction as the following types of buildings: Office, Retail, Hospitality, Education, Healthcare, Multifamily Residential (mid-and high-rise), Government, Warehouses, Airport Terminals and other Transportation Buildings.
19COMMERCIAL CONSTRUCTION INDEX ∫ Q3 2017Powered by
5 METHODOLOGY
commercial
construction
i n d e x
usg + us chamber
USG Corporation is an industry-leading manufacturer of building products and innovative solutions. Headquartered in Chicago, USG serves construction markets around the world through its United States Gypsum Company and USG Interiors, LLC subsidiaries and its international subsidiaries, including its USG Boral Building Products joint venture. Its wall, ceiling, flooring, sheathing and roofing products provide the solutions that enable customers to build the outstanding spaces where people live, work and play. Its USG Boral Building Products joint venture is a leading plasterboard and ceilings producer across Asia, Australasia and the Middle East. For additional information, visit www.usg.com.
The U.S. Chamber of Commerce is the world’s largest business federation representing the interests of more than 3 million businesses of all sizes, sectors and regions, as well as state and local chambers and industry associations. Its International Affairs division includes more than 70 regional and policy experts and 25 country- and region-specific business councils and initiatives. The U.S. Chamber also works closely with 117 American Chambers of Commerce abroad.
Dodge Data & Analytics is North America’s leading provider of analytics and software-based workflow integration solutions for the construction industry. Building product manufacturers, architects, engineers, contractors and service providers leverage Dodge to identify and pursue unseen growth opportunities and execute on those opportunities for enhanced business performance. Whether it’s on a local, regional or national level, Dodge makes the hidden obvious, empowering its clients to better understand their markets, uncover key relationships, size growth opportunities and pursue those opportunities with success. The company’s construction project information is the most comprehensive and verified in the industry. Dodge is leveraging its 100-year-old legacy of continuous innovation to help the industry meet the building challenges of the future. To learn more, visit www.construction.com.
This report is intended for general informational purposes only. It is not intended to support an investment decision with respect to USG Corporation, nor is it intended to be used for marketing purposes to any existing or prospective investor of USG. This report is not a forecast of future results for USG and actual results of USG may differ materially from those of the commercial construction industry.

commercial
construction
i n d e x
usg + us chamber
For more information, please visit www.commercialconstructionindex.com.
USG Corporation550 W. Adams Street
Chicago, IL 60661www.usg.com
U.S. Chamber of Commerce1615 H Street NW
Washington, DC 20062www.uschamber.com