Embed Size (px)
Citation preview

Q3/Q4 2018 Solar Industry Update
David Feldman, NRELAnna Ebers, DOERobert Margolis, NREL
January 2019
NREL/PR-6A20-73234

NREL | 2NREL | 2
Executive Summary
• By the end of 2018, Hawaii, California, the District of Columbia, 104 cities, 11 counties, and 51 American companies in the United States had made 100% clean power commitments.
• In 2018, renewables generated more electricity (41%) in Germany than coal (38%)—a first.
• An IEA report projects 4.3 GW-AC of global CSP installations from 2018 to 2023.
• EIA estimates 23% of all new electricity generating capacity in the United States came from solar installations in 2018—second to natural gas.
• Utility-scale PV contributed 39% to Q3 2018 U.S. PV installations—its lowest level since Q1 2012. Wood Mackenzie attributes the low level of utility-scale PV installation to uncertainty of the impacts of the Section 201 tariff in 2017.
• In January 2019, the California IOU PG&E declared bankruptcy;
it is uncertain how this development might impact utility-scale solar PPAs signed within the past several years.
• Roughly 3 GW of new or refurbished U.S. PV manufacturing capacity is expected to come online in 2019. Historically, actual production capacity brought online has often taken longer and/or been lower than originally reported.
• In January 2019, global module ASP was reported to be $0.22/W.
• In 2018, solar stocks were down 28% compared to -1% performance by the S&P 500 Index.
• 2018 global and U.S. solar investment were $132B and $21B respectively—the vast majority of which went to project deployment.
A list of acronyms and abbreviations is availableat the end of the presentation.

NREL | 3
State and Federal Updates1
Global Solar Deployment2
U.S. PV Deployment3
PV System Pricing4
Global Manufacturing5
Component Pricing6
Market Activity7

NREL | 4
State and Federal Updates1
Global Solar Deployment2
U.S. PV Deployment3
PV System Pricing4
Global Manufacturing5
Component Pricing6
Market Activity7
By the end of 2018, Hawaii, California, the District of Columbia, 104 cities, 11 counties, and 51 American companies all over the United States made commitments to 100% clean power.

NREL | 5NREL | 5
States, Cities, and Counties Ramping Up Clean Energy Goals
• Non-federal U.S. actors have increased efforts for clean energy deployment.
– A recent report titled America’s Pledge estimates clean energy commitments by states, cities, and businesses could increase demand for non-hydro renewable energy generation to 500 TWh by 2025—enough to power 56 million homes for a year.
• While the technical feasibility for 100% renewable electricity is currently being debated by the scientific community, many policymakers and corporate leaders have pushed for aggressive clean energy targets, including some with 100%.
Source: https://www.americaspledgeonclimate.com/reports/.
Goals range from 12.5% in Ohio and North Carolina to 100% in several states, territories, counties, and cities.

NREL | 6NREL | 6
Cities with 100% Clean Electricity Commitments
• By the end of 2018, 104 cities and 11 counties all over the United States had made 100% clean power commitments.
– Fifty million people, or over 15% of the U.S. population, now live in these places.
– Notable clean energy commitment announcements in 2018 include a number of major cities, including Minneapolis, Cincinnati, Denver, and Berkeley.
• Six cities have already achieved their 100% clean power targets.
• Most commitments have a target date between 2030 and 2050.
Source: https://www.sierraclub.org/ready-for-100/commitments.
Powered by 100% Renewable Energy: These communities have currently achieved their 100% clean, renewable electricity targets.
Committed to 100% Renewable Energy: These communities have made community-wide commitments to transition to 100% clean, renewable electricity by no later than 2050.

NREL | 7NREL | 7
States’ Commitments to 100% Clean Electricity
Sources: PV Magazine (11/09/18); Spokesman (12/10/18); UtilityDive (12/18/18).
2045 2040DC
> State mandate
> Executive order
> Governor’s pledge
2045
2050
2032
2050
2050
2040
2045
2045
2050
• In 2018, California and Washington, D.C. joined Hawaii in committing to 100% clean power.
• Additionally, the governors of New Jersey and New York signed executive orders, and eight governors made pledges (CO, CT, IL, MA, ME, OR, PR, and WA) to achieve 100% clean electricity.
– In 2017, these 13 jurisdictions consumed more than 18% of U.S. electricity.
• All these commitments have a target date between 2030 and 2050.
PR
2050 (Puerto Rico)

NREL | 8NREL | 8
Private Sector Commitments to 100% Renewable Energy
• Companies have also made similar commitments to 100% renewable energy.
– With 158 members globally, the non-profit RE100 commits businesses to 100% renewable power for their global operations.
– Last year, 10 new American companies joined the RE100 initiative, increasing the number of American companies to 51.
• Currently, these U.S. businesses consume over 29 million MWh of electricity per year, 56% of which is currently supplied from renewable sources.
• The United States is the most represented country in the RE100.
– A large share of RE100 companies operate in the banking and consumer sectors.
– To achieve 100% renewable energy, U.S. companies in most cases opt to purchase unbundled RECs or sign a PPA. Self-generation is still not widely practiced.
Sources: there100.org, wemeanbusinesscoalition.org, and BrinkNews.
• A 2018 survey found business executives believe that committing to renewable energy targets strengthened their brand reputation.
• Outside the RE100 project, businesses were making similar pledges.
– Sony committed to achieving 100% renewable energy for its North American operations.
– Xcel was the first utility to announce it will be carbon-free by 2050.
• In 2017, they were the provider for 55% and 47% of the customers in Colorado and Minnesota respectively. They also provide service in Michigan, New Mexico, North Dakota, South Dakota, Texas, and Wisconsin.

NREL | 9
State and Federal Updates1
Global Solar Deployment2
U.S. PV Deployment3
PV System Pricing4
Global Manufacturing5
Component Pricing6
Market Activity7
• Currently, the largest solar PV system in the world is a 1.5-GW facility in China; however, 2 GW-projects (or parks) are in development in Egypt, India, and China.
• In 2018, renewables generated more electricity (41%) in Germany than coal (38%)—a first.
• An IEA report projects 4.3 GW-AC of global CSP installations from 2018 to 2023.

NREL | 10NREL | 10
World’s Largest PV System
97 MW
200 MW
333 MW
733 MW
850 MW
1.5 GW2 GW
2006 2008 2010 2011 2012 2014 2015 2016 In development
• In 2006, the largest PV system in the world was an 11-MW facility in Germany.
• Currently, the largest PV system in the world is a 1.5-GW facility in China; however, 2-GW projects (or parks) are in development in Egypt, India, and China.
Sources: BBC (08/22/18); CleanTechnica (10/11/10); Energydigital.com; Engadget (03/08/17); Greentech Media (09/10/12); The Star (04/26/07); Google Maps, accessed 01/21/19.
60 MW
11 MW
Tengger Desert Solar Park1,547 MW
4.5 miles wide
Erlasee Solar Park11.4 MW
0.8 miles wide
© 2009 Google Maps
© 2009 Google Maps

NREL | 11NREL | 11
German ElectricityGeneration by Source • In 2018, renewables generated more electricity (41%) in
Germany than coal (38%)—a first.
– From November 2017 to October 2018, the United States generated 18% from renewables and 27% from coal.
• An increase in solar generation in Germany coincided more with a decrease in nuclear electricity production than a decrease in coal production.
– From 2009 to 2014, solar generation increased 28 GWh, while nuclear generation decreased 36 GWh.
– Electricity from coal actually increased 16 GWh over the same period.
• The drop in electricity from coal coincided more with an increase in wind than an increase in solar.
– From 2014 to 2018, wind and solar generation increased 55 GWh and 11 GWh, respectively, while coal and nuclear generation decreased 34 GWh and 20 GWh, respectively.
0%
10%
20%
30%
40%
50%
60%
0
100
200
300
400
500
600
2009 2010 2011 2012 2013 2014 2015 2016 2017 2018
% o
f Tot
al G
ener
atio
n
Elec
tric
Gen
erat
ion
(GW
h)
Solar Wind Biomass Hydro
Nuclear Gas Hard Coal Brown Coal
% Renewables % Coal
Source: The Fraunhofer Institute.

NREL | 12NREL | 12
Recent Developments in CSP SectorPV and CSP
Sources: CSP Today (November 28, 2018; January 16, 2019; January 19, 2019).
• In December 2018, the Dubai Electricity Water and Authority (DEWA) announced it would add 250 MW-AC of PV to its 700 MW-AC Mohammed bin Rashid Al Maktoum CSP project.
– The CSP plant, with 15 hours of storage, was awarded at a record low PPA price of $73/MWh ($29/MWh from 10AM – 4PM in the seven-month summer period, $92/MWh at other times).
• The PV plant was also awarded a PPA price of $24/MWh
– The PPA is structured to encourage CSP energy storage during the day, relying more heavily on PV production for the daytime.
– Morocco also believes there are valuable coupling gains with a hybrid CSP-PV project, and it is in the final stages of tendering a PPA, which New Energy Update believes could be at a record low level.
0
10
20
30
40
50
60
70
80
90
100
1 AM 4 AM 7 AM 10 AM 1 PM 4 PM 7 PM 10 PM
PPA
Pric
e ($
/MW
h)
CSP (Apr.-Oct.) CSP (Nov.-Mar.) PV
CSP incentivized to store energy
CSP incentivized to produce electricity

NREL | 13NREL | 13
Recent Developments in CSP SectorIEA Projections, 2018–2023
Sources: CSP Today (November 28, 2018; January 16, 2019; January 19, 2019).
• IEA projects most installations will come from China (1.9 GW), Morocco and South Africa (1 GW), and the Middle East (1 GW).
• This represents 32% faster growth for CSP than from 2012 to 2017.
• In October 2018, the IEA released its Renewables 2018 report, in which they project 4.3 GW-AC of CSP will be installed from 2018 to 2023 in its main case, and 6.9 GW-AC under an accelerated scenario.
CSP Historical Installs and Projections (IEA)
NREL | 14NREL | 14
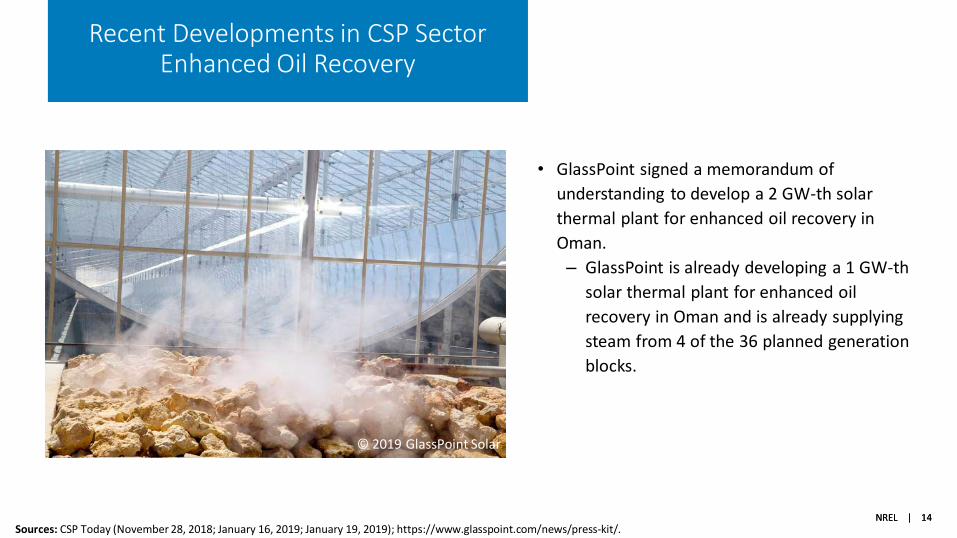
Recent Developments in CSP SectorEnhanced Oil Recovery
Sources: CSP Today (November 28, 2018; January 16, 2019; January 19, 2019); https://www.glasspoint.com/news/press-kit/.
• GlassPoint signed a memorandum of understanding to develop a 2 GW-th solar thermal plant for enhanced oil recovery in Oman.– GlassPoint is already developing a 1 GW-th
solar thermal plant for enhanced oil recovery in Oman and is already supplying steam from 4 of the 36 planned generation blocks.
© 2019 GlassPoint Solar

NREL | 15
State and Federal Updates1
Global Solar Deployment2
U.S. PV Deployment3
PV System Pricing4
Global Manufacturing5
Component Pricing6
Market Activity7
• EIA estimates 23% of all new electricity generating capacity came from solar installations in 2018—second to natural gas.
• Utility-scale contributed 39% to Q3 2018 installations, its lowest level since Q1 2012. Wood Mackenzie attributes the low level of utility-scale installation to uncertainty of the impacts of the Section 201 tariff in 2017.
• At the end of October, there were 47.0 GW-AC of solar PV systems in the United States, of which 28.0 GW were utility-scale PV and 19.0 GW were distributed PV.
• In January 2019, the California IOU PG&E declared bankruptcy, putting into doubt higher-priced PPAs from PV systems signed several years ago.

NREL | 16NREL | 16
PG&E Declares Bankruptcy
• In January 2019, the California IOU PG&E declared bankruptcy, due to an estimated $30B in liability costs related to the company’s role in the California wildfires of 2017 and 2018.
– Until this month, PG&E had been rated investment grade, in part due to the belief that it would seek aid from California. Instead of protection through the legislature, they are seeking protection through the courts.
– In 2001, PG&E sought Chapter 11 bankruptcy after complications from deregulation.
– SEPA reports that at the end of 2017 PG&E had the second-most solar of any utility in the country, with just shy of 7 GW-AC, representing 1/6 of all U.S. solar capacity.
• Chapter 11 bankruptcy allows PG&E to continue operations while restructuring financially, meaning they could seek to cancel or renegotiate contracts. PG&E signed many PPAs with solar facilities at much higher prices than current market rates.
– Credit Suisse estimates PG&E could save $2.2B a year renegotiating renewable power contracts down to current levels.
– The contracts include those from projects that have guarantees from the DOE Loan Program on a portion of $8.3B in loans.
– Several solar companies that supply PG&E with power (e.g., Con Edison, yieldcos, and Topaz Solar Farms) have been downgraded by ratings agencies or their stock value has fallen.
– Some experts believe it may be hard for PG&E to renegotiate power contracts, or it may have to pay damages for breach of contract.
• PG&E currently has enough money to operate.
• California is aggressively pursuing clean power adoption and canceled contracts might scare potential investors.
Sources: BNEF (01/18/19); NBC News (01/14/19); Financial Times (01/21/19); New York Times (01/17/19); SEPA (2018 Utility Solar Market Snapshot).

NREL | 17
PV Curtailment: Contract Structures
Existing PPA structures generally address curtailment in one of three ways:• Take-or-pay: The offtaker agrees to buy all output—delivered and curtailed—at the settled PPA rate.
• Reduced take-or-pay: The PPA contract terms include separate rates for delivered PV output and curtailed PV output, with the curtailed rate being lower than the delivered rate. Alternatively, the offtaker may only compensate for curtailment under certain conditions (e.g., for economic curtailment but not for exceptional dispatches).
• Non-compensable curtailment: The offtaker only pays for delivered energy; the generator bears the full risk of curtailment.
New PPA structures are being explored that would impact the distribution of curtailment risk between the offtaker and the generator, including:
• Capacity plus energy PPA: The offtaker pays the generator a fixed capacity ($/MW) rate in addition to the standard volumetric ($/MWh) rate.
• Fixed lease: The offtaker pays a fixed monthly lease rate to fully control the generator.

NREL | 18
PV Curtailment: Implementation
Curtailment has been increasing in the Midwest (for wind) and California and Hawaii (for PV). The implementation of curtailment varies in these three regions.
CaliforniaCurtailment is managed by the California Independent System Operator (CAISO). In the event of a need for curtailment, CAISO first attempts to curtail through low or negative pricing. It may also accept offers from generators to curtail at some level of compensation, known as decremental bids. These economic measures resolve the issue in most cases. In rare events, CAISO manually curtails generators through an “exceptional dispatch.” However, most renewable energy procurement in CAISO is managed by its three IOUs, which have an incentive to optimize their own portfolios.
HawaiiCurtailment is managed by the Hawaiian Electric Company (HECO) based on system needs. HECO curtails generators in reverse chronological order (i.e., newer generators are curtailed before older generators).
MidwestCurtailment is managed by the Midwest System Operator (MISO). Starting in 2011, MISO requires wind farms to offer energy into the real-time market and participate in security-constrained economic dispatch, which requires them to curtail for economic reasons for all but extreme circumstances.
Source: Greentech Media, 03/23/15.
Economic Manual

NREL | 19
PV Curtailment: Trends to Date
California• CAISO curtailed about 420,000
MWh of PV output in 2018—about 1.6% of systemwide PV output.
• PV curtailment was highest in the spring when hydropower capacity peaked and electricity demand was relatively low.
Hawaii• By one estimate, expected
curtailment levels for new PPAs are about 10% on O’ahu, and 20%–50% on Maui and Hawaii (Sterling et al. 2017). Monthly Delivered and Curtailed PV Output in the CAISO System
Based on data obtained from CAISO

NREL | 20NREL | 20
High-Resolution ImageryUsed to Map U.S. PV
• Stanford researchers analyzed billions of high-resolution satellite images to identify the locations and sizes of solar PV panels in the contiguous United States, finding 1.47 million individual solar installations, including small rooftop, commercial, and utility-scale systems.
– SEIA reported 1.82 million PV systems in the contiguous United States as of Q3 2018.
• Using these data, researchers looked at deployment information together with other variables and found that higher levels of deployment have occurred where:
– Population density is 1,000 people per square mile,or greater
– Solar radiation averages at least 4.5 kWh/m2/day
– Average annual household income is at or above $150,000.
• The researchers also found that PV deployment decreases in areas with greater income inequality.
• The researchers argue this type of data could also be used to plan infrastructure upgrades, identify areas in need of solar deployment, or as a predictor model for adoption.
• The DeepSolar database was made publicly available to researchers, utilities, solar developers and policymakers.
Source: http://web.stanford.edu/group/deepsolar/home.

NREL | 21NREL | 21
Green Banks • The Green Bank Network, an international network of green banks, estimates green banks have made $41B in transactions globally.
– Green banks in Connecticut, New York, and Rhode Island are part of the international network.
• Over 15 green banks are currently operating in a dozen states in the United States.
– The Coalition for Green Capital estimates these institutions mobilized $3B in public and private capital for clean energy projects in 2018.
– Some of these green banks have moved beyond state boundaries and are active in other states.
• In addition to green banks, traditional banks have started new efforts in sustainable finance.
– In December 2018, Bloomberg announced the launch of the U.S. Alliance for Sustainable Finance—whose 15 founding members represent some of the largest banks in the world—with the mission of driving sustainable finance innovation.
• These banks have over $18.525B in assets on their balance sheet.
Source: coalitionforgreencapital.com; UNFCCC (11/28/2018).
• A green bank is a public, not-for-profit financial institution that leverages limited public dollars to drive private capital investment in clean power goods and services.
• Green banks are designed to jump-start new markets, such as LMI solar, providing road maps and data to de-risk asset classes and allow other investors to enter.
• Green banks can be established at the state (CA), county (Montgomery Country, MD), or city (New York City) level.
U.S. Green Bank Investments ($MM)

• NREL estimates LMI rooftop solar technical potential is over 300 GW in the U.S. Sixty percent of the potential is on multifamily and renter-occupied buildings.
• NREL surveyed LMI customers and found the two primary reasons for solar adoption to be being able to save on electricity bills and being influenced by their peers’ actions.
• Randomized controlled trials in Connecticut, carried out by researchers at Yale, show that the decision to go solar by LMI adopters is influenced by social factors such as local events, effective solar ambassadors and town representatives, and connection to solar peers.
• Visual exposure to solar (especially seeing a solar rooftop project from the street) increased the average number of installations within a half-mile radius by nearly 50%.
• In communications campaigns, individual-oriented messages focusing on personal financial benefits, including the stabilization of energy bills, yielded higher solar installation rates.
The Potential to Increase Solar Adoption for LMI Customers
Source: https://www.nrel.gov/solar/seeds/2017-2019-study.html. Kenneth GillinghamData: https://data.nrel.gov/submissions/81. Ben Sigrin
Percentage of LMI electricity consumption offsettable by rooftop solar using only single family owner-occupied buildings’ roofs
Solar Potential for LMI Customers

NREL | 23NREL | 23
U.S. Generation Capacity Additions by Source: 2017 and Estimated 2018
Sources: EIA “Preliminary Monthly Electric Generator Inventory. Solar: EIA “Electric Power Monthly” Table 6.1; 2018 DPV estimate is estimated by multiplying January–October installations by 12/10.
• EIA estimates 23% of all new electricity generating capacity came from solar installations in 2018—second to natural gas.
• Based on data through October 2018, solar capacity additions are expected to increase y/y.
• 2018 will likely be the first year since 2013 that solar and wind represented less than 50% of annual generation capacity additions.
• Based on EIA data through October 2018, it is estimated that 39 GW of new electric generating capacity came online in 2018—up from 25.9 GW in 2017.
– 24.7 GW came online from January through October 2018, and another 14.6 GW (37%) is estimated to have come online in November and December.
– A large part of this increase is due to the expected addition of 21 GW of natural gas plants—up from 10.5 GW in 2017.
– Wind additions are expected to also have increased by one-third as well.
Natural Gas CC18.7
Natural Gas CT2.2
Natual Gas (Other)
0.5
Wind8.3UPV
5.5DPV3.4
Other0.6
Estimated 2018 U.S. Generation Capacity Additions (Total 39.3 GW)
Natural Gas CC9.1
Natural Gas CT1.1
Natual Gas (Other)
0.3
Wind6.3
UPV5.0
DPV3.4
Other0.6
2017 U.S. Generation Capacity Additions (Total 25.9 GW)

NREL | 24NREL | 24
Total Installed Natural Gas Electric Generating Capacity
• At the end of October 2018, the United States had a cumulative electric generating capacity of approximately 538 GW of natural gas facilities, with 31% of that being in Texas, California, and Florida.
• Most states with significant levels of PV also have significant natural gas electric generation capacity. > 20 GW
> 10 GW> 5 GW
> 2.5 GW
> 1 GW> 0 GW
79 GW
45 GW
45 GW
1
23
4
5
6
7
8
9
10
# State Rank of Cumulative PV
Sources: EIA “Preliminary Monthly Electric Generator Inventory. solar: EIA, “Electric Power Monthly” Table 6.1; 2018 DPV estimate is estimated by multiplying January – October installations by 12/10. PV Rank as of October 2018.

NREL | 25NREL | 25
Estimated 2018 Natural Gas Electric Generating Capacity Additions
• An estimated 21 GW of natural gas electric generation capacity was added in 2018—approximately 4% of total natural gas electric generation capacity.– An estimated 18% of total U.S.
PV capacity was added in 2018.
• From October 2017 to October 2018, most states with significant levels of PV deployment also had significant natural gas electric generation deployment.
> 4 GW
> 2 GW> 1 GW
> 0.5 GW
> 0.25 GW> 0 GW
Sources: EIA “Preliminary Monthly Electric Generator Inventory. solar: EIA, “Electric Power Monthly” Table 6.1; 2018 DPV estimate is estimated by multiplying January – October installations by 12/10. PV Rank as of installations from October 2017 to October 2018.
1
489
6
3
7
2
5
10
# State Rank of Annual PV Installations

NREL | 26NREL | 26
2,490 954
735 621
342 334
307 299 291 268
1,846
0 500 1,000 1,500 2,000 2,500 3,000
CaliforniaFlorida
TexasNorth Carolina
New YorkMassachusetts
MinnesotaSouth Carolina
ArizonaVirginia
Other
Installed Capacity, Top 10 States, from Oct. 2017 to Oct. 2018Megawatts (MW-AC)
UPV
DPV
From October 2017 to October 2018 approximately 8.5 GW-AC of PV capacity was installed, of which 5.0 GW-AC were utility-scale PV and 3.5 GW-AC were distributed PV.
U.S. Installation Breakdownby State
Note: EIA monthly data for 2018 are not final. Additionally, smaller utilities report information to EIA on a yearly basis, and therefore, a certain amount of solar data has not yet been reported. “Net Generation” includes DPV generation.Sources: EIA, “Electric Power Monthly,” forms EIA-023, EIA-826, and EIA-861 (December 2018).
At the end of October, there were 47.0 GW-AC of solar systems in the United States, of which 28.0 GW were utility-scale PV and 19.0 GW were distributed PV.
17,719 3,686
3,022 2,150 2,088 2,077 1,991
1,531 1,417
1,086 10,270
0 5,000 10,000 15,000 20,000
CaliforniaNorth Carolina
ArizonaNew Jersey
MassachusettsTexas
NevadaFlorida
New YorkUtah
Other
Cumulative Installed Capacity, Top 10 States as of Oct. 2018Megawatts (MW-AC)
UPV
DPV

NREL | 27NREL | 27
Historical U.S. Interest Rates • The vast majority of U.S. PV installations have occurred in a historically low-interest rate environment.
• The Federal Funds Rate, which influences virtually all borrowing rates in the United States, has increased by 1.9% in the past 18 months; however, it is still at a relatively low historical level.
• Some within the solar industry worry further increases in interest rates could dampen solar deployment or could require further reductions in system costs to achieve the same levels.
0
5
10
15
20
25
1958 1968 1978 1988 1998 2008 2018
Effe
ctiv
e Fe
dera
l Fun
ds R
ate
(%)
Source: Federal Reserve Economic Data (https://fred.stlouisfed.org).

NREL | 28NREL | 28
Impact of Interest Rate Changes by Energy Technology
• An analysis was performed using NREL’s 2018 Annual Technology Baseline (ATB), in which interest rates were increased 3% for each technology.
• In 2018, solar tended to be less impacted by an increase in interest rates than other technologies.
– The tax credit reduced the impact that upfront capital costs had on LCOE.
– The need for tax equity investors resulted in a lower level of debt, dampening the impact of an increase in interest rates.
• However, by 2030, assuming no incentives and a higher level of debt, solar technologies were projected to be impacted the most by an increase in interest rates.
• The impact of an increase in interest rate depends on the proportion that upfront capital costs, O&M, incentives, and fuel have on LCOE, as well as the percent of debt a technology can raise for a project.
• Note that fuel costs and O&M are also likely to increase with a long-term interest rate environment, which is not captured in the analysis.Note: The analysis uses the “mid-case” and “market factor financials” for each technology.
Source: NREL 2018 Annual Technology Baseline (ATB): https://atb.nrel.gov/.
0%
2%
4%
6%
8%
10%
12%
14%
16%
18%
CC Land-basedWind
Coal CT Nuclear CSP Utility-scalePV
Chan
ge in
LCO
E
LCOE Impact of a 3% Increase in Interest Rates
2018 ATB Mid-Case Values
2030 ATB Mid-Case Values

NREL | 29NREL | 29
0
1
2
3
4
5
6
7
Q1'15
Q2'15
Q3'15
Q4'15
Q1'16
Q2'16
Q3'16
Q4'16
Q1'17
Q2'17
Q3'17
Q4'17
Q1'18
Q2'18
Q3'18
Qua
rter
ly P
V In
stal
led
(GW
-DC)
U.S. PV Installations by Market Segment
UtilityNon-Residential PVResidential PV
U.S. Installation BreakdownSources: Wood Mackenzie Power and Renewables/SEIA: U.S. Solar Market Insight Q4 2018.
• In Q3 2018, the United States installed 1.8 GW-DC of PV, down 15% y/y.
– Thirty-nine percent of capacity came from utility PV—the lowest level since Q1 2012.
– Wood Mackenzie attributes the low level of utility-scale installation to uncertainty of the impacts of the Section 201 tariff in 2017.
– Since late 2015, the United States has installed approximately 1 GW-DC of distributed PV each quarter.
– More than 400 MW-DC of community solar was installed during the first nine months of 2018.
California33%
Texas8%
Florida11%
Southeast10%
Northeast15%
Southwest9%
Midwest9%
Other5%
U.S. PV Installations by Region (MW-DC)Q1 - Q3 2018

NREL | 30NREL | 30
0100200300400500600700800
Q1'14
Q2'14
Q3'14
Q4'14
Q1'15
Q2'15
Q3'15
Q4'15
Q1'16
Q2'16
Q3'16
Q4'16
Q1'17
Q2'17
Q3'17
Q4'17
Q1'18
Q2'18
Q3'18
U.S
. Res
iden
tial I
nsta
lls (M
W)
Residential InstallsOther InstallersTeslaVivintSunrun
0%
20%
40%
60%
80%
100%
Q1'15
Q2'15
Q3'15
Q4'15
Q1'16
Q2'16
Q3'16
Q4'16
Q1'17
Q2'17
Q3'17
Q4'17
Q1'18
Q2'18
Q3'18
Percentage of Direct Sales/Loans
TeslaVivint SolarSunrun
Tesla, Vivint Solar, and Sunrun Residential Market Share
Source: Corporate filing, SEIA / Wood Mackenzie Solar Market Insight Q4 2018; Wood Mackenzie U.S. Residential Solar Finance Update: H2 2018 .
• A modest increase in U.S. residential installations in Q3 2018 was led in large part by increases in large national installers.
• Tesla’s direct sales continue to grow as a percentage of total sales, while Sunrun and Vivint still install mostly leased or PPA systems.
– Vivint recently switched its commission incentive structure to favor TPO over customer-owned sales.
– Wood Mackenzie also reports that business for the largest residential PV loan providers has slowed due to tightening credit requirements, rising interest rates, and a desire to achieve profitability.

NREL | 31NREL | 31
U.S. Utility-scale Solar Setto Take Off
• PV Magazine reports that developers have applied to build 139 GW-AC of utility-scale PV systems in six grid-operating territories.
– This figure does not include projects in most of the South, Mountain West, Pacific Northwest, and Plains States.
• However, ISO New England estimates 70% of the projects in its queue are never completed. Several factors can contribute to projects dropping out of the queue. For example:
– Interconnection upgrades may be cost prohibitive.
– Projects may be unable to finalize power sales contracts or financing.
Source: https://pv-magazine-usa.com/2019/01/01/solar-tsunami/.
Map of ISO territories

NREL | 32NREL | 32
California Residential MLPE• MLPE continue to gain market-share
in the U.S. residential PV market, with 83% of residential systems in California using a micro-inverter or DC optimizer in 2018.– An important factor in the shift to
MLPE in the California residential PV sector was a change in building codes requiring “rapid shutdown” of PV output. Other states have adopted similar measures.
• The vast majority of systems either use SolarEdge (DC optimizers) or Enphase (micro-inverters).– SunPower had gained significant
market share in the microinverter space but has since sold its inverter business to Enphase.
0%
10%
20%
30%
40%
50%
60%
70%
80%
90%
100%
2011 2012 2013 2014 2015 2016 2017 2018(throughOctober)
Resid
entia
l Ins
talls
in P
G&
E, SC
E, a
nd S
DG&
E (M
W)
Remainder
Microinverters
DC Optimizers
Sources: CA NEM database (10/31/18).

NREL | 33NREL | 33
California Non-Residential MLPE
• MLPEs are less common in the non-residential PV market; however, they are becoming more common in non-residential systems, too.
– The share of MLPEs in the California non-residential PV market reached approximately 17% in 2018.0%
10%
20%
30%
40%
50%
60%
70%
80%
90%
100%
2011 2012 2013 2014 2015 2016 2017 2018(throughOctober)
Resid
entia
l Ins
talls
in P
G&
E, SC
E, a
nd S
DG&
E (M
W)
Remainder
Microinverters
DC Optimizers
Sources: CA NEM database (10/31/18).

NREL | 34NREL | 34
0
50
100
150
200
250
Q1'15
Q2'15
Q3'15
Q4'15
Q1'16
Q2'16
Q3'16
Q4'16
Q1'17
Q2'17
Q3'17
Q4'17
Q1'18
Q2'18
Q3'18
Qua
rter
ly E
nerg
y St
orag
e In
stal
led
(MW
h)
Front-of-the-MeterNon-ResidentialResidential
U.S. Energy Storage Installationsby Market Segment
• The United States installed approximately 425 MWh (169 MW) of energy storage onto the electric grid in the first nine months of 2018—up 28% y/y, despite the Q1 2017 front-of-the-meter spike.
– The drop in behind-the-meter storage installations, Q/Q, was attributed to battery supply constraints. Still, it was the second-largest quarter on record.
• Of the behind-the-meter storage capacity deployed in Q3 2018, 70% and 10% occurred in California and Hawaii respectively.
• Massachusetts is expected to have a large storage market in 2019 due to the rollout of is SREC successor program, SMART. The program provides $0.03/kWh–$0.08/kWh for storage systems paired with PV that have a discharge duration of at least two hours, have a roundtrip efficiency of at least 65%, and which discharge at least 52 cycles annually.
• In July 2018, California revised its fire code to set more stringent standards on stationary storage using lithium-ion batteries. The changes are expected to add costs to certain systems and make others infeasible.
• Outside the major markets, only a few places have policies in place to provide revenue streams that make solar-plus-storage viable.
Sources: Wood Mackenzie Power & Renewables and Energy Storage Association, U.S. Energy Storage Monitor; Wood Mackenzie Power & Renewables and SEIA, U.S. Solar Market Insight: Q4 2018.
NREL | 35NREL | 35
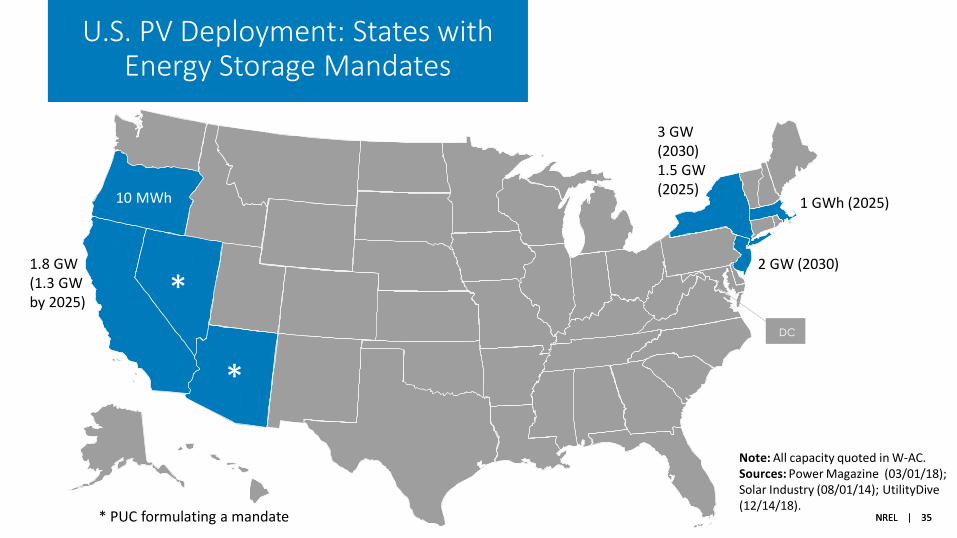
U.S. PV Deployment: States with Energy Storage Mandates
Note: All capacity quoted in W-AC.Sources: Power Magazine (03/01/18); Solar Industry (08/01/14); UtilityDive (12/14/18).
DC
3 GW (2030)1.5 GW (2025)
1 GWh (2025)
1.8 GW (1.3 GW by 2025)
2 GW (2030)
10 MWh
*
*
* PUC formulating a mandate
NREL | 36
State and Federal Updates1
Global Solar Deployment2
U.S. PV Deployment3
PV System Pricing4
Global Manufacturing5
Component Pricing6
Market Activity7
Based on preliminary reported data, from 2017 to 2018, the median reported PV system price in California, Massachusetts, and New York was relatively flat, though significant price variation remains.

NREL | 37NREL | 37
System Pricing fromSelect States
Based on preliminary data, from 2017 to 2018, the median reported PV system price in California, Massachusetts, and New York:
• Remained flat at $4.25/W for systems from 2.5 kW to 10 kW
• Fell 3% to $3.61/W for systems from 10 kWto 100 kW
• Increased 2% to $2.88/W for systems from 100 kW to 500 kW
• Fell 1% to $2.27/W for systems from 500 kW to 5 MW.
Preliminary 2018 MW: CA (657), MA (218), NY (256)Note: System prices above $10/W and below $1/W were removed from the data set.Sources: CA NEM database (10/31/18); MA SREC program (12/12/18); NYSERDA (11/30/18).

NREL | 38NREL | 38
$0
$1
$2
$3
$4
$5
$6
CA MA NY CA MA NY CA MA NY CA MA NY
2.5 kW - 10 kW 10 kW - 100 kW 100 kW - 500 kW 500 kW - 5 MW
Syst
em P
rice
($/W
-DC)
System Pricing fromSelect States, 2018 (Preliminary)
• Based on preliminary data in 2018, the median price of a small system in New York was about 8% less than the median price in California.
• In 2018, the 20th and 80th percentile preliminary prices in California for a small system were $3.46/W and $5.43/W respectively.
Bars represent the median, with error bars representing 80th and 20th percentiles.
• In addition to price differences based on system size, there is also variation between states and within individual markets.
Preliminary 2018 MW: CA (657), MA (218), NY (256)Note: System prices above $10/W and below $1/W were removed from the data set.Sources: CA NEM database (10/31/18); MA SREC program (12/12/18); NYSERDA (11/30/18).

NREL | 39
State and Federal Updates1
Global PV Deployment2
U.S. PV Deployment3
PV System Pricing4
Global Manufacturing5
Component Pricing6
Market Activity7
• Performance of solar companies was mixed in Q3 2018, improving on average due to successfully transitioning to low-cost environment.
• Three gigawatts of announced new or refurbished U.S. PV manufacturing capacity is expected to come online in 2019. Peak capacity may also be lower than originally reported, or manufacturers may take time to ramp up to full production.

NREL | 40NREL | 40
PV Manufacturers’ Margins• Performance of solar companies was mixed in
Q3 2018, improving on average due to successfully transitioning to low-cost environment.
– The median operating margin for the 11 solar companies analyzed was positive for the first time since Q3 2016.
– First Solar reported good performance in Q3 2018, with their advanced, lower-cost panels (Series 6) commencing shipments from its factory in Vietnam.
– Some module companies (e.g., Canadian Solar) have benefited from lower supply-chain costs (e.g., polysilicon costs).
Sources: Company figures based on data from Bloomberg Terminal and SEC filings by the respective companies; PV Tech (09/03/18).
Line represents the median, with error bars representing 80th and 20th percentiles for the following companies in Q3 2018: Canadian Solar, First Solar, Hanwha Q Cells, Hareon Solar, HT-SAAE, Jinko Solar, LONGi, Motech Industries, Neo Solar Power, Renesola, and SunPower. Margin data from JA Solar, Trina, and Yingli are also included from Q1 2010 to Q2 2018 where available.
-40%
-30%
-20%
-10%
0%
10%
20%
30%
40%
Q1'10
Q3'10
Q1'11
Q3'11
Q1'12
Q3'12
Q1'13
Q3'13
Q1'14
Q3'14
Q1'15
Q3'15
Q1'16
Q3'16
Q1'17
Q3'17
Q1'18
Q3'18
Mar
gins
Gross Margin
Operating Margin

NREL | 41NREL | 41
2018 U.S. PVManufacturing Expansion • Solar Power World reports that approximately
340 MW of U.S. manufacturing capacity was refurbished in 2018 and is now currently operating.
• Roughly 2.7 GW of new or refurbished U.S. PV manufacturing capacity is expected to come online in Q1 2019, and an additional 1.7 GW is under construction.
– Historically, actual production capacity brought online has often taken longer and/or been lower than originally reported.
• An additional 600 MW of U.S. PV manufacturing capacity expansion, which was announced, has not yet started construction.
Sources: Solar Power World (January 2019); NREL.
CSUN
First Solar
GreenBrilliance
Hanwha Q CELLS
Heliene
JinkoSolar
LG Solar USA
Mission Solar
Seraphim Solar USA
Silfab SolarTech UniversalSolSuntech
SunPower
0.0
0.5
1.0
1.5
2.0
2.5
3.0
Operatingrefurbished
Production in Q12019
Underconstruction
Pre-build Unable to confirm
Man
ufac
turin
g Ca
paci
ty (G
W)

NREL | 42
State and Federal Updates1
Global PV Deployment2
U.S. PV Deployment3
PV System Pricing4
Global Manufacturing5
Component Pricing6
Market Activity7
• Global module and module-component prices have dropped 94% to 97% in the past 12 years, 53% to 77% in the past five years, and 39% to 53% in the last year.
• PVinsights reports that global PV module prices dropped from $0.31/W to $0.22/W in 2018.

NREL | 43NREL | 43
PV Value Chain Spot Pricing Q1 2007–Q1 2019
Global module and module-component prices have dropped 94% to 97% in the past 12 years, 53% to 77% in the past five years, and 39% to 53% in the last year.
Sources. Barclays (12/14/09); BNEF Solar Spot Price Index, accessed 01/18/19; UBS (2/12/10, 4/23/10, 7/27/10, 10/29/2010,1/24/11, 6/3/11, 6/16/11, 8/17/11, 9/16/11, 12/12/11, 1/20/12, 2/13/12, 4/19/12).
$0$50$100$150$200$250$300$350$400$450$500
$0.00
$0.50
$1.00
$1.50
$2.00
$2.50
$3.00
$3.50
$4.00
$4.50
Q1'07
Q1'08
Q1'09
Q1'10
Q1'11
Q1'12
Q1'13
Q1'14
Q1'15
Q1'16
Q1'17
Q1'18
Q1'19
Aver
age
Selli
ng P
rice
($/k
g)
Aver
age
Selli
ng P
rice
($/W
)
c-Si Module (left axis) Multi Cells (left axis)
Multi Wafers (left axis) Polysilicon(right axis)

NREL | 44NREL | 44
PV Value Chain SpotPricing, 2018
• While global module and module-component prices dropped significantly in 2018, they were relatively flat in Q4.
– PVinsights reports that global PV module prices dropped from $0.31/W to $0.22/W in 2018.
– BNEF reports that, in 2018, cells dropped from $0.24/W to $0.12/W, wafers dropped from $0.14/W to $0.06/W, and polysilicon dropped from $16.6/kg to $9.6/kg ($0.08/W to $0.05/W).
Sources. “Modules (large buyers)” from PVinsights, accessed 01/18/19. Remaining pricing data from BNEF Solar Spot Price Index (01/18/19).Kilogram to Watt conversion: 4.78 grams per watt (2016); 4.73 grams per watt (2017, 2018, 2019), from Cowen & Co. (05/11/17); Deutsche Bank (07/19/17).
$0.00$0.05$0.10$0.15$0.20$0.25$0.30$0.35$0.40$0.45
Aver
age
Selli
ng P
rice
($/W
)
Poly Wafers
Cells Modules (large buyers)
Modules (small buyers)

NREL | 45NREL | 45
Module Average Selling Price: Global versus United States
• In Q3 2018, U.S. module prices continued to fall, dropping to their lowest recorded levels, but they were still trading at a significant premium over global module ASP.
– Modules sold in the United States inQ3 2018 were 21% lower in price than modules sold in the United States in Q4 2017 but 51% higher in price than the global average.
Sources. U.S. (Wood Mackenzie Power & Renewables / SEIA); Global (PVinsights/Mercom).
$0.0
$0.1
$0.2
$0.3
$0.4
$0.5
$0.6
$0.7
$0.8
Q12015
Q22015
Q32015
Q42015
Q12016
Q22016
Q32016
Q42016
Q12017
Q22017
Q32017
Q42017
Q12018
Q22018
Q32018
PV M
odul
e AS
P ($
/W)
U.S.
Global

NREL | 46NREL | 46
Inverter Pricing
U.S. inverter pricing was relatively flat in Q3 2018, though it was still trading at historical lows.
Source. Wood Mackenzie Power & Renewables/SEIA.
$0.00
$0.10
$0.20
$0.30
$0.40
$0.50
$0.60
$0.70
Q3'13
Q4'13
Q1'14
Q2'14
Q3'14
Q4'14
Q1'15
Q2'15
Q3'15
Q4'15
Q1'16
Q2'16
Q3'16
Q4'16
Q1'17
Q2'17
Q3'17
Q4'17
Q1'18
Q2'18
Q3'18
Fact
ory
Gat
e Pr
ice
($/W
-AC)
MicroinvertersResidential (string)Commercial (string)Utility (central)

NREL | 47
State and Federal Updates1
Global PV Deployment2
U.S. PV Deployment3
PV System Pricing4
Global Manufacturing5
Component Pricing6
Market Activity7
• SREC pricing rose in virtually all markets in the second half of 2018, as some markets are in undersupply, and others have been buoyed by proposed or enacted legislation.
• At the end of October 2018, solar stocks were down 30% for the year, compared to 5% for the broader market.
• In 2018, solar stocks were down 28% compared to -1% performance by the S&P 500 Index.
• 2018 global and U.S. solar investment were $132B and $21B respectively, the vast majority of which went to project deployment.

NREL | 48NREL | 48
SREC Pricing
Sources: SRECTrade, https://www.srectrade.com/, accessed 10/25/18.
• In December 2018, Washington D.C. unanimously approved legislation mandating 100% renewable electricity by 2032.
• As of December 2018, a veto-proof majority of legislatures had pledged support for a Maryland bill doubling their RPS to 50% by 2030.
• SREC pricing rose in all markets in the second half of 2018.
– Some of these markets are in undersupply, but many have been buoyed by proposed or enacted legislation, raising RPSs.
$0
$100
$200
$300
$400
$500
$600
Jan-17 Apr-17 Jul-17 Oct-17 Jan-18 Apr-18 Jul-18 Oct-18 Jan-19Pr
ice
Per S
REC
(Sim
ple
Aver
age)
Higher Priced Markets
NJDCMA
$0$2$4$6$8
$10$12$14$16$18$20
Jan-17 Apr-17 Jul-17 Oct-17 Jan-18 Apr-18 Jul-18 Oct-18 Jan-19
Pric
e Pe
r SRE
C (S
impl
e Av
erag
e)
Lower Priced Markets
PA
MD
OH In-state

NREL | 49NREL | 49
• While most solar stocks performed poorly in 2018, installers tended to perform better than manufacturers.
Stock Market Activity
Source: Stock market: Yahoo Finance (01/19/19); Mercom (01/19/19).
• In 2018, many solar stock prices plummeted after the Chinese announcement in late May of a decrease in subsidies, causing an oversupply of PV modules and cells in the marketplace.
• In Q4 2018 and January of 2019, solar stocks followed the general marketplace, recovering 10% of their losses from December 24, 2018 to January 16, 2019.
-40%
-30%
-20%
-10%
0%
10%
20%
Jan-18
Feb-18
Mar-18
Apr-18
May-18
Jun-18
Jul-18 Aug-18
Sep-18
Oct-18
Nov-18
Dec-18
Jan-19
% C
hang
e (In
dex:
1/2
/18
Adju
sted
Clo
se)
Invesco Solar ETF (TAN)S&P 500 IndexRussell 2000
-100%-80%-60%-40%-20%
0%20%40%60%80%
100%
NRG
Yie
ldTe
rraF
orm
Pow
erAt
lant
ic Y
ield
Patt
ern
Ener
gyAz
ure
Pow
erSu
nrun
Vivi
nt S
olar
Sunw
orks
Enph
ase
Ener
gySo
larE
dge
Can
adia
n So
lar
SunP
ower
Shun
feng
Firs
t Sol
arW
acke
r Che
mie
Tain
ergy
Tec
hJin
ko S
olar
Sola
rgig
a En
ergy
Mey
er B
urge
r2018
Sto
ck P
erfo
rman
ce
2018 Solar Stock Performance

NREL | 50NREL | 50
0
5
10
15
20
2006 2007 2008 2009 2010 2011 2012 2013 2014 2015 2016 2017 2018
Sola
r Inv
estm
ents
($B)
Non-Project Global Solar Investments
Corp. & Gov. R&D Public Markets VC&PE
Global Solar Investments
Source. BNEF, “Clean Energy Investment Trends 2018.”
• In 2018, non-project global solar public market investments grew 35% y/y but were still well below 2013–2015 levels.
• In 2018, global VC&PE investments in solar approached their lowest levels since 2006.
• The largest solar public market deal in 2018 was a $808MM IPO of the French PV developer Neoen SA.
• Since 2011, global investments in solar energy have been approximately $150B per year.
• The majority of global investment in solar has historically gone to funding of projects—94% in 2018.
• Global government and corporate solar R&D, which has been $4B–$5B since 2009, set a record in 2018 with $5.1B in spending.
• Public markets and VC&PE have varied significantly more over time, with a significant increase in public markets in 2013–2015 going toward yieldcos (e.g., Terraform and 8point3) and third-party residential companies (e.g., SolarCity and SunPower)—both of which were lower since 2016.
Large Scale PV
67%
Small Scale Solar26%
Corp. & Gov. R&D
4%
Public Markets
3%
VC&PE0%
2018 Global Solar Investments ($132B)

NREL | 51NREL | 51
Asset Finance
46%
Small Scale Solar43%
Corp. & Gov. R&D
5%
Public Markets
4%
VC&PE2%
2018 U.S. Solar Investments ($21B)
0
2
4
6
8
10
2006 2007 2008 2009 2010 2011 2012 2013 2014 2015 2016 2017 2018
Sola
r Inv
estm
ents
($B)
Non-Project U.S. Solar Investments
Corp. & Gov. R&D Public Markets VC&PE
U.S. Solar Investments
Source. BNEF, “Clean Energy Investment Trends 2018.”
– In December 2018, the CEO and founder of 8minuteenergy, a utility-scale development company, completed the sale of his 50% stake in the company to his cofounder for $200MM.
• Total U.S investments in solar energy remained relatively flat, y/y, at approximately $21B.
• The majority of U.S. investment in solar has historically gone to funding of projects—90% in 2018.
• U.S. public markets in 2013–2015 raised funds for yieldcos (e.g., Terraform and 8point3) and third-party residential companies (e.g., SolarCity, SunPower)—but dropped precipitously in 2016.
– The largest U.S. solar deal in 2018, was the $650MM in a Private Investment in Public Equity transaction by TerraForm.
– Most other public market raises were significantly smaller.

www.nrel.govwww.nrel.gov
Thank You
NREL/PR-6A20-73234
Special thanks to Dan Bilello, Wesley Cole, Jeff Logan, Mike Meshek, Eric O’Shaughnessy, Ashwin Ramdas, and Brittany Smith.

NREL | 53NREL | 53
List of Acronymsand Abbreviations
• AC alternating current• ASP average selling price• B billion• BNEF Bloomberg New Energy Finance• CSP concentrating solar power• DC direct current• EIA U.S. Energy Information Administration• ETF exchange traded fund• GW gigawatt• GW-th gigawatt-thermal• IOU investor-owned utility• IPO initial public offering• ISO independent system operator• kg kilogram• kW kilowatt• LCOE levelized cost of energy• LMI low and moderate income• m2 meter-squared• MLPE module-level power electronics• MM million• MW megawatt• MWh megawatt-hour
• NEM net energy metering• O&M operations and maintenance• PPA power purchase agreement• PV photovoltaic• R&D research and development• Q quarter• REC renewable energy certificate• RPS renewable portfolio standards• S&P Standard and Poor’s• SEIA Solar Energy Industries Association• SETO Department of Energy Solar Technology Office• SREC solar renewable energy certificate• TAN Invesco Solar ETF• TPO third-party owner• TWh terawatt-hour• UPV utility-scale PV• VC&PE venture capital and private equity• W watt• y/y year over year• YTD year to date