Embed Size (px)
Citation preview
Q4 2007 results - Analyst & Investor meeting 7 February 2007 12h00 CET Amsterdam
Focus. Execute. Deliver.Focus. Execute. Deliver.

Q4 2007 Corporate Express - Productivity in your hands 2
“Safe Harbour” Statementunder the Private Securities Litigation Reform Act of 1995
Statements included in this press release, which are not historical facts are forward-looking statements made pursuant to the safe harbour provisions of the Private Securities Litigation Reform Act of 1995 and the Securities Exchange Act of 1934. Such forward-looking statements are made based upon management’s expectations and beliefs concerning future events impacting Corporate Express and therefore involve a number of uncertainties and risks, including, but not limited to industry conditions, changes in product supply, pricing and customer demand, competition, risks in integrating new businesses, currency fluctuations, and the other risks described from time to time in the Company’s filings with the US Securities and Exchange Commission, including the Company’s Annual Report on Form 20-F filed with the Securities and Exchange Commission on March 9, 2007. As a result, the actual results of operations or financial conditions of the Company could differ materially from those expressed or implied in such forward-looking statements. Shareholders and other readers are cautioned not to place undue reliance on these forward-looking statements, which speak only as of the date on which they are made. The Company undertakes no obligation to update publicly or revise any forward-looking statements.

Q4 2007 Corporate Express - Productivity in your hands 3
Full year 2007 - Highlights
• We revisited our strategy enabling us to fully unlock potential of our company
– Strategic initiatives and changes
• Changes in senior management
• Worked hard to solve our internal issues in the US
• Name changed into Corporate Express – To reflect the strength of our brand– Private brands represent > EUR 1bn in sales
• We opened sourcing offices in Hong Kong and Shenzhen
• We divested ASAP Software, – 90% of our business is office products
• We are confident that our plans put us on the right path to drive the company forward

Q4 2007 Corporate Express - Productivity in your hands 4
Full year 2007 - Lessons learned
• We didn’t execute the model
• We have to improve drastically our operational execution and performance
• We dropped the ball in the US– New organisational structure and centralising customer
care/back offices at same time– Underestimated impact of such internal focus– All too complicated, therefore “Simplify & Sell”– It all has to be customer focused
It is all about:Focus: 4 strategic initiativesExecute: EMG, clear targets, KPIs, operationallyDeliver: avg. annual organic sales growth 2008-10 of
6% resulting in >7% EBITDA-margin

Q4 2007 Corporate Express - Productivity in your hands 5
EBIT bef special items
Europe22%Australia
24%
Printing Systems16%
North America38%
SalesNorth America
51%
Europe24%
Australia14%
Printing Systems11%
Q4 2007 overview
Gross contributionNorth America
50%
Europe26%
Australia14%
Printing Systems10%
• Net sales EUR 1,405 mln
Organic growth 2%
Constant rates 1.7%
• Gross contribution EUR 465 mln
Constant rates 1.9%
• EBIT* EUR 70.3 mln
Constant rates 2.7%* Before special items
• EPS EUR 0.70 (Q4 2006: EUR 0.23)
• EPS** EUR 0.28 (Q4 2006: EUR 0.29)
** Before special items/amortisation intangibles/fair value changes

Q4 2007 Corporate Express - Productivity in your hands 6
2008 - Full of confidence about our plans
• Unchanged dividend of EUR 0.21 proposed
• Capex 2008 around EUR 100 mln, above 2007 levels– Two-third IT related, investments in future growth
• Continued investments in optimising our infrastructuresNorth America– Consolidation distribution infrastructure in 2007 and Q1 2008– Continued investments eCommerce (new Eway)
Europe – New German dc (45,000 m², consolidating 3 existing ones)– SAP implementation in several countries, e.g. Benelux and UK
Australia– New dc in New South Wales (40,000 m², to consolidate 6
existing ones)– Project NxtGen, phased implementation SAP

Q4 2007 Corporate Express - Productivity in your hands 7
2008 - looking forward
• Global Office Products generally in good shape– January 2008 sales growth performance in line with Q4
• Can not expect that financial results would immediately reflect profound changes that are taken place
• We would expect to see results of operational improvements coming through during 2008

Q4 2007 Corporate Express - Productivity in your hands 8
Strategic direction 2008-2010
• Four key strategic priorities to deliver profitable growth– Increase share of wallet– Improve category offering– Grow mid-market share– Strengthen geographic footprint
FocusFocus
Execute Execute
• Transform organisation into more operationally focussed and sales driven one
• One global management team • Improve operational execution significantly• Clear and specific targets; KPI’s; and accountability
DeliverDeliver
Global Office Products:
• Avg. annual organic sales growth at least 6% 2008-2010
• Given business model, EBITDA* margin at least 7%
* including corporate overhead
Q4 2007 Corporate Express - Productivity in your hands 9
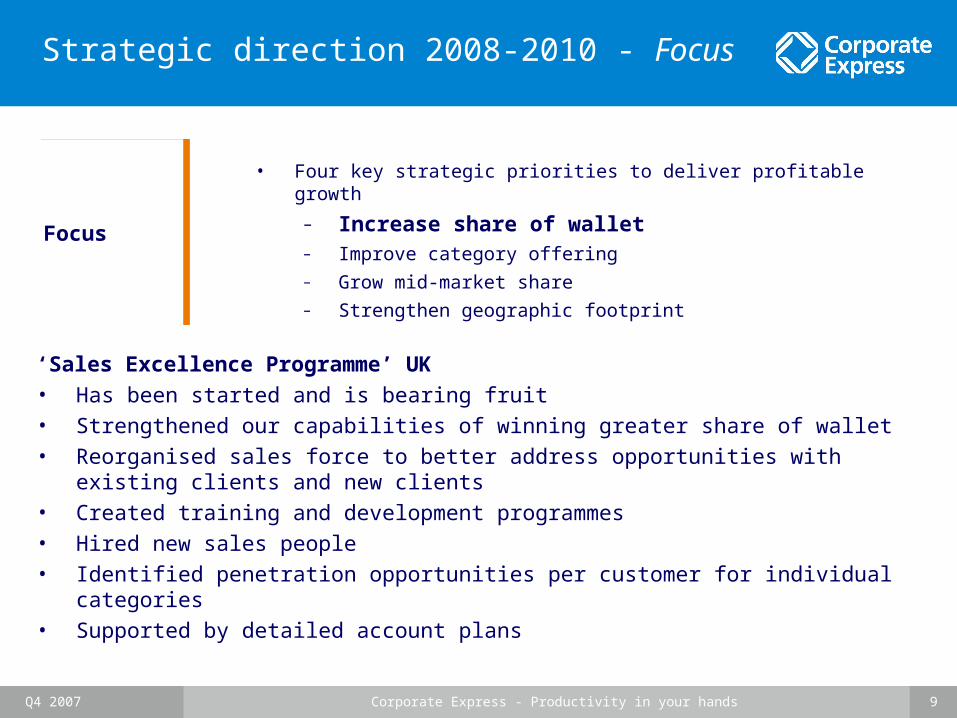
Strategic direction 2008-2010 - Focus
• Four key strategic priorities to deliver profitable growth
– Increase share of wallet– Improve category offering– Grow mid-market share– Strengthen geographic footprint
FocusFocus
‘Sales Excellence Programme’ UK• Has been started and is bearing fruit• Strengthened our capabilities of winning greater share of wallet• Reorganised sales force to better address opportunities with existing clients and
new clients• Created training and development programmes• Hired new sales people• Identified penetration opportunities per customer for individual categories• Supported by detailed account plans

Q4 2007 Corporate Express - Productivity in your hands 10
Strategic direction 2008-2010 - Execute
Execute Execute
• Transform organisation into more operationally focussed and sales driven one
• One global management team • Improve operational execution significantly
• Clear and specific targets; KPI’s; and accountability
Key performance indicators
Corporate Express KPI Dashboard
Target Actual Last year Masterlist of Indicators Target Actual Last year
# of clients:
Operational Sales:
Country: …..
Average order size
Year-to-date in local currency
Operational sales growth Large&Strategic clients
% of op.sales of new clients: Large&Strategic clients
Win rate for Large&Strategic clients
Operation costs per warehouse orderline
Year-to-date in local currency
Strategic KPI's
Improve category offering
Increase share of wallet

Q4 2007 Corporate Express - Productivity in your hands 11
Strategic direction 2008-2010 - Deliver
DeliverDeliver
Global Office Products:
• Avg. annual organic sales growth at least 6% 2008-2010
• Given business model, EBITDA* margin at least 7%
* including corporate overhead
3%
4%
5%
6%
7%
8%
9%
EBITDA-margin 2000-07 (before special items)

Floris Waller, CFO Corporate Express
Divisional and financial overview

Q4 2007 Corporate Express - Productivity in your hands 13
North America
• Organic sales growth +3% – Q4 2006: -1%– 2007: Q1 = -1%; Q2 = -3%; Q3 = -1%– January 2008 in line with Q4 performance
• Market growth est. around -1%, same as in Q3 and Q2– White-collar employment still up y-on-y– Some weakness in discretionary items (e.g. furniture)
• Financial services as sector about 10% of our sales
• Gaining market share in US and Canada– Facility double-digit growth– Office supplies, toner, paper all doing relatively well
• Increased share of wallet large customers– Internal programme “More from the Core”

Q4 2007 Corporate Express - Productivity in your hands 14
North America (Cont’d)
• Gross contribution 32.5%– Stable at constant rates growth rates– Down120 bps y-on-y; up versus Q2 and Q3– Q4 impacted by mix effects due to above average growth
At strategic and large customers At lower margin product categories, such as paper and
toner
• Operating costs (excl. special items) +1.9% at constant rates
– Increased selling, delivery and warehouse expenses
– Partly offset by lower G&A costs
• Operating margin 3.6%; EBITDA-margin 5.7%

Q4 2007 Corporate Express - Productivity in your hands 15
Europe
• Organic sales growth 5%– 2007: Q1 = 6%; Q2 = 5%; Q3 = 7%– January 2008 in line with Q4 performance
• Market growth estimated to be 2-3%
• Our main markets performing well, showing ongoing sales and earnings growth
– UK strong sales growth– Nordics despite facing tough y-on-y comps strong
performance– Germany in line with European average for sales and results
• Gross contribution +100bps, as result merchandising initiatives, relatively stable sales mix
• Operating result impacted by some double running costs (mostly IT related)

Q4 2007 Corporate Express - Productivity in your hands 16
Australia
• Reported sales EUR 199 mln– 2007: Q1 = 2%; Q2 = 5%; Q3 = 1%– Q4 organic sales growth -1%
• Australian market estimated to be slightly down due to some deflationary pressure
– Volumes up, value down
• Gross contribution growth 7.1% at constant rates
• Operating result up 1.8% at constant rate– High wage inflation– Operating margin of 8.1%
• Project NxtGen– Leveraging technology to drive further business efficiencies– Phased implementation of next generation
ERP system (SAP)

Q4 2007 Corporate Express - Productivity in your hands 17
Q4 2007Operating
resultSpecial items
(SI)Operating
result before SI
Depreciation Amortisation other
intangibles
Underlying
North America 21.9 (4.1) 26.0 13.6 0.8 40.4
Europe 12.1 (2.6) 14.7 3.0 2.5 20.2
Australia 16.2 - 16.2 2.2 0.4 18.8
Office products 50.2 (6.7) 56.9 18.8 3.7 79.4
Corporate (6.6) (9.2) 2.7 0.1 - 2.8
Office products 43.6 (15.9) 59.6 18.9 3.7 82.2
Operating result vs. underlying result
Underlying operating result, being EBITDA before special items• Q4 2007 EUR 82.2 mln, FY 2007 EUR 288.4 mln
• EBITDA-margin (includes Corporate) Q4 2007 6.5% Q3 2007 5.5%Q2 2007 4.9%Q1 2007 5.8%

Q4 2007 Corporate Express - Productivity in your hands 18
Printing Systems Division
• Q4 developed as expected, operating result EUR 10.7 mln
– Q4 order intake slowed somewhat in anticipation DRUPA
• Order portfolio at year-end remains satisfactory– Slightly below last year level
• DRUPA: 2-week trade fair starting end of May– Once every 4 years– Showcase of technological innovation by a.o. Heidelberg
0
150
300
450
600
1983 1986 1989 1992 1995 1998 2001 2004 2007Sales Trend
Graphic Systems sales trend
In EUR mln

Q4 2007 Corporate Express - Productivity in your hands 19
Q4 2007Reported Special items Amort.
intangiblesFair value
changesUnderlying
Operating result * 54.3 (15.9) (3.7) - 74.0
Net financing costs (27.3) - - (5.7) (21.6)
Result before tax 27.0 (15.9) (3.7) (5.7) 52.4
Profit tax 9.1 5.3 1.1 (0.1) 2.8
Other financial results 92.2 96.5 - - (4.4)
Net result 128.3 85.9 (2.6) (5.8) 50.8
Reported vs. underlying profits
Special items:• ASAP Software divestment, book profit EUR 96.5 mln• North America: EUR 4.1 mln for cost reductions at US headquarters• Europe: EUR 2.6 mln for planned closure German dc• Holding: EUR 3.0 mln severance payment former CEO• Holding: EUR 5.3 mln reclassification defined contribution plans into defined benefit plans• Holding: EUR 0.9 mln reversal book profit Veenman Germany
Profit taxes:• EUR 2.8 mln a consequence favourable progress with number of tax audits and net effect of adjustments to deferred tax assets and liabilities
* Operating result = Global office Products (incl. Corporate) EUR 43.6 mln plus Printing Systems EUR 10.7 mln

Q4 2007 Corporate Express - Productivity in your hands 20
in EUR mln Q4 07 Q4 06 FY 07 Guidance FY 08
EBIT 54.3 66.5 201.2
Depreciation pp&e and Amortisation intangibles 25.0 27.3 97.9 ± 100
Share based employee benefits 1.3 2.2 8.2
Additions to / (release of) provisions (0.7) (6.0) (3.6)
Change in inventories 6.0 (18.7) (12.0)
Change in trade receivables 46.2 37.7 (12.0)
Change in trade payables (55.0) 50.5 (16.7)
Change in other receivables/liabilities (22.3) 35.1 (14.2)
Change in working capital (25.2) 104.6 (21.6)
Payments for defined benefits plans 3.0 (6.4) (4.3)
Profit tax paid (9.7) (6.8) (31.4) 35 - 40
Other operational payments (5.2) (6.9) (18.5)
Cash Flow operational activities 42.9 174.5 228.0
Cash flow discontinued operations 6.7 32.0 (4.8)
Investments in pp&e and software (20.6) (23.7) (81.6) ± 100
Acquisitions, integration, divestments 251.3 (21.4) 202.9
CF available for financing activities (Total group)
279.1 160.3 340.6
Consolidated cash flow statement

Q4 2007 Corporate Express - Productivity in your hands 21
8%
9%
10%
11%
12%
13%
14%
Average working capital as % of salesRolling 4 quarter average (excludes ASAP Software)
11.0%
Working capital (per yearend 2007) EUR 563 mln (EUR 560 mln per end 2006)
Gains in account receivables offset by lower payables

Q4 2007 Corporate Express - Productivity in your hands 22
Net interest-bearing debt
• Leverage ratio: 3.1x
• Interest coverage ratio 3.7x
- Adjusted for the sale of ASAP
• Net interest-bearing debt as % of group equity: 69%
• Average blended effective cash interest rate (incl.
dividend pref. shares A)
2007: 6.7% 2006: 6.6% 2005: 6.9%

Q4 2007 Corporate Express - Productivity in your hands 23
(Cumulative) redemption scheme
0
100
200
300
400
500
Rev +Other
2008 2009 2010 >2010 Perm.
0
250
500
750
1000
1250
Rev +Other
2008 2009 2010 >2010 Perm
Cumulative redemption scheme
Redemption scheme

Q4 2007 Corporate Express - Productivity in your hands 24
Senior Credit Facility
• Covenants are part of any credit facility for non-investment grade credit facilities
– Definitions differ somewhat from published figures a.o. Currency: not quarter end, but monthly average Treatment special items and acquisitions / divestments
• Leverage ratio (acc. to Credit Facility)– Calculated on 4 quarter rolling basis– Gross debt / EBITDA– Max. EUR 50mln cash to be deducted from gross debt
Q3 2007 3.6x 2008: max. 4.0xQ4 2007 3.1x 2009: max. 3.5x
• Interest coverage (acc. to Credit Facility)
Q3 2007 4.0x 2008: min. 3.5x
Q4 2007 3.7x 2009: min. 3.5x

Peter Ventress, CEO Corporate Express
Closing remarks
Q4 2007 Corporate Express - Productivity in your hands 26
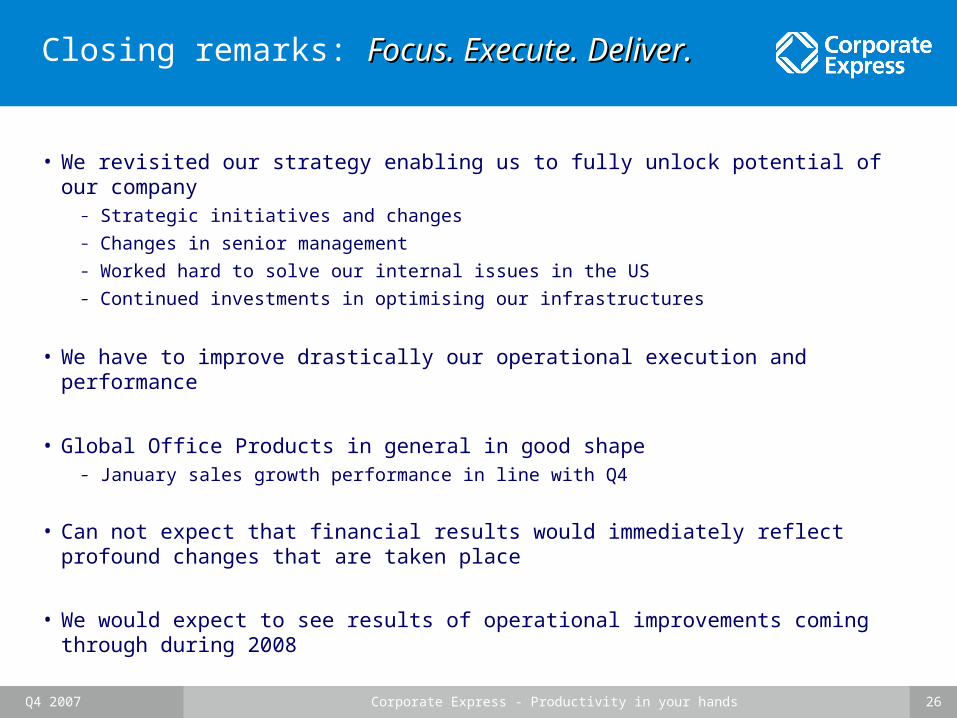
Closing remarks: Focus. Execute. Deliver.Focus. Execute. Deliver.
• We revisited our strategy enabling us to fully unlock potential of our company– Strategic initiatives and changes – Changes in senior management– Worked hard to solve our internal issues in the US– Continued investments in optimising our infrastructures
• We have to improve drastically our operational execution and performance
• Global Office Products in general in good shape– January sales growth performance in line with Q4
• Can not expect that financial results would immediately reflect profound changes that are taken place
• We would expect to see results of operational improvements coming through during 2008

..
FOCUS. EXECUTE. DELIVER.FOCUS. EXECUTE. DELIVER.

Q4 2007 Corporate Express - Productivity in your hands 28
Guidance FY 2008
• Tax rate ± 20% (excl. fair value effects, special items, amortisation intangibles, div preference shares A)
– Medium term 20-25%– 2008 cash tax payments ± EUR 35 - 40 mln
• Capex ± EUR 100 mln– FY 2007 EUR 85.4 mln, year
• Depreciation ± EUR 85 mln– FY 2007 EUR 84.0 mln, year
• Amortisation other intangibles ± EUR 15 mln– FY 2007 EUR 12.9 mln
• Corporate ± EUR 12 mln– 2007 Holdings ± EUR 32 mln– 2008 net contribution for expected return on plan assets and interest
obligations ± EUR 20 mln

Q4 2007 Corporate Express - Productivity in your hands 29
in EUR mln Actual Cash Interest %
Revolver (EUR 255 mln facility) 20 LIBOR +2.50% drawn; +0.75% undrawn
Term Loans A / D (senior credit facility) 395 EURIBOR +2.50%/2.00%
Securitisation 118 LIBOR +0.40% drawn; +0.28% liq. facility
Convertible (subordinated) 115 2.00%
Equity Adjustment Convertible (21)
High Yield bonds (USD 300 mln; subordinated) 204 7 7/8%-8¼% semi annual
Preferences Shares A (nominal value) 181 21 cts/share; EUR 11mln
Other Debt 153
Capitalized financed fees (18)
Cash (50)
Interest - Bearing Net Debt 1,097
Funding Per year-end 2007

..
FOCUS. EXECUTE. DELIVER.FOCUS. EXECUTE. DELIVER.


![ELDP Presentation 18 02(12h00)[1]](https://img.pdfslide.net/doc/110x75/589f13521a28ab226b8b695f/eldp-presentation-18-0212h001.jpg)