Embed Size (px)
Citation preview
Quarter
All Bedroom Types
Listed Leased
Q4 2018Q4 2017
922 462911 460
Quarter
All Bedroom Types
Listed Leased
Q4 2018Q4 2017
10,690 6,0579,169 5,662
20184 16.6% 7.0% 18.41% 4.98% 22.13% 12.70% 10.79% -0.29% (1.28%) -15.33%
Rental Market Report TREB Member Inquiries:
(416) 443-8158Media/Public Inquiries:
(416) 443-8152
Total TREB MLS®Apartment Rentals
TREB MLS®Avg. 1-Bdrm. Apt. Rent
Fourth Quarter 2018
Economic Indicators
Rental Market Summary: Fourth Quarter 2018
6,057 5,662
Q42018
Q42017
Apartments
Townhouses
$2,143 $1,970
Q42018
Q42017
Toronto Employment Growth % Change PrevMonth % Change
December 2018 0.9%
Toronto Unemployment RateDecember 2018 6.0%
Inflation Rate (Yr./Yr. CPIGrowth)December 2018 2.0%
Bank of Canada OvernightRateDecember 2018 -- 1.8%
Prime RateDecember 2018 -- 4.0%
Fixed 5-Year Mortgage RateDecember 2018 -- 5.34%
Sources: Statistics Canada; Bank of Canada
Real GDP QuarterlyQ3 2018 2.0%
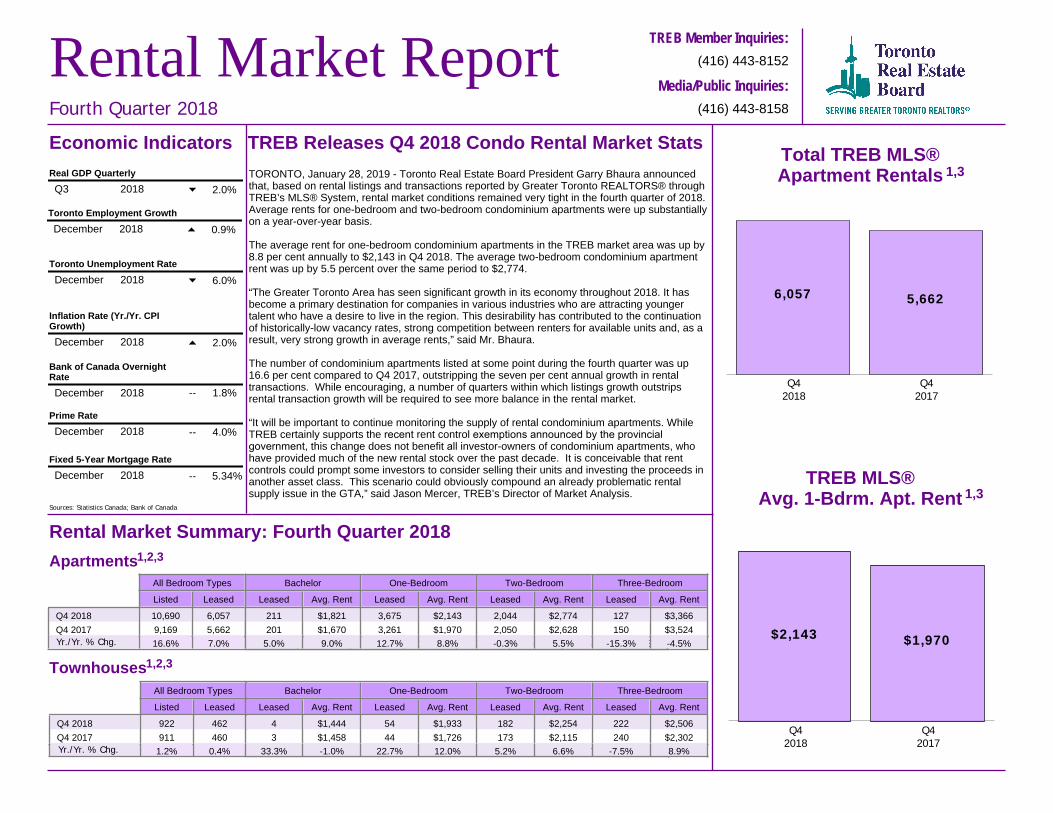
TREB Releases Q4 2018 Condo Rental Market StatsTORONTO, January 28, 2019 - Toronto Real Estate Board President Garry Bhaura announced that, based on rental listings and transactions reported by Greater Toronto REALTORS® through TREB’s MLS® System, rental market conditions remained very tight in the fourth quarter of 2018. Average rents for one-bedroom and two-bedroom condominium apartments were up substantially on a year-over-year basis.
The average rent for one-bedroom condominium apartments in the TREB market area was up by 8.8 per cent annually to $2,143 in Q4 2018. The average two-bedroom condominium apartment rent was up by 5.5 percent over the same period to $2,774.
“The Greater Toronto Area has seen significant growth in its economy throughout 2018. It has become a primary destination for companies in various industries who are attracting younger talent who have a desire to live in the region. This desirability has contributed to the continuation of historically-low vacancy rates, strong competition between renters for available units and, as a result, very strong growth in average rents,” said Mr. Bhaura.
The number of condominium apartments listed at some point during the fourth quarter was up 16.6 per cent compared to Q4 2017, outstripping the seven per cent annual growth in rental transactions. While encouraging, a number of quarters within which listings growth outstrips rental transaction growth will be required to see more balance in the rental market.
“It will be important to continue monitoring the supply of rental condominium apartments. While TREB certainly supports the recent rent control exemptions announced by the provincial government, this change does not benefit all investor-owners of condominium apartments, who have provided much of the new rental stock over the past decade. It is conceivable that rent controls could prompt some investors to consider selling their units and investing the proceeds in another asset class. This scenario could obviously compound an already problematic rental supply issue in the GTA,” said Jason Mercer, TREB’s Director of Market Analysis.
Bachelor One-Bedroom Two-Bedroom Three-Bedroom
Leased Avg. Rent Leased Avg. Rent Leased Avg. Rent Leased Avg. Rent
211 $1,821 3,675 $2,143 2,044 $2,774 127 $3,366201 $1,670 3,261 $1,970 2,050 $2,628 150 $3,524
Bachelor One-Bedroom Two-Bedroom Three-Bedroom
Leased Avg. Rent Leased Avg. Rent Leased Avg. Rent Leased Avg. Rent
4 $1,444 54 $1,933 182 $2,254 222 $2,5063 $1,458 44 $1,726 173 $2,115 240 $2,302
20184 1.2% 0.4% 50.00% 0 7.14% 0 7.04% 0 -4.70% (0)
1,3
1,3
1,2,3
1,2,35.0% 9.0% 12.7% 8.8% -0.3% 5.5% -15.3% -4.5%
33.3% -1.0% 22.7% 12.0% 5.2% 6.6% -7.5% 8.9%Yr./Yr. % Chg.
Yr./Yr. % Chg.
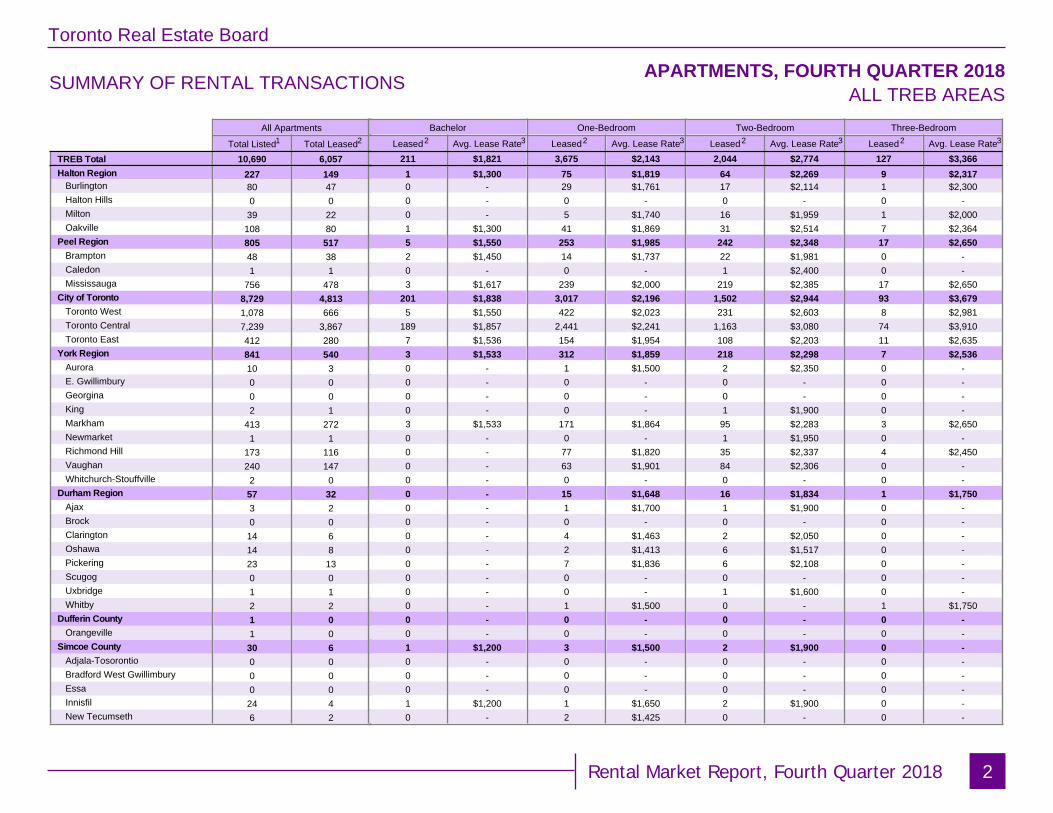
SUMMARY OF RENTAL TRANSACTIONS APARTMENTS, FOURTH QUARTER 2018ALL TREB AREAS
All ApartmentsTotal Listed Total Leased
TREB TotalHalton Region
BurlingtonHalton HillsMiltonOakville
Peel RegionBramptonCaledonMississauga
City of TorontoToronto WestToronto CentralToronto East
York RegionAuroraE. GwillimburyGeorginaKingMarkhamNewmarketRichmond HillVaughanWhitchurch-Stouffville
Durham RegionAjaxBrockClaringtonOshawaPickeringScugogUxbridgeWhitby
Dufferin CountyOrangeville
Simcoe CountyAdjala-TosorontioBradford West GwillimburyEssaInnisfilNew Tecumseth
10,690 6,057227 14980 470 0
39 22108 80805 51748 381 1
756 4788,729 4,8131,078 6667,239 3,867412 280841 54010 30 00 02 1
413 2721 1
173 116240 1472 0
57 323 20 0
14 614 823 130 01 12 21 01 0
30 60 00 00 0
24 46 2
Bachelor One-Bedroom Two-Bedroom Three-BedroomLeased Avg. Lease Rate Leased Avg. Lease Rate Leased Avg. Lease Rate Leased Avg. Lease Rate
211 $1,821 3,675 $2,143 2,044 $2,774 127 $3,3661 $1,300 75 $1,819 64 $2,269 9 $2,3170 - 29 $1,761 17 $2,114 1 $2,3000 - 0 - 0 - 0 -0 - 5 $1,740 16 $1,959 1 $2,0001 $1,300 41 $1,869 31 $2,514 7 $2,3645 $1,550 253 $1,985 242 $2,348 17 $2,6502 $1,450 14 $1,737 22 $1,981 0 -0 - 0 - 1 $2,400 0 -3 $1,617 239 $2,000 219 $2,385 17 $2,650
201 $1,838 3,017 $2,196 1,502 $2,944 93 $3,6795 $1,550 422 $2,023 231 $2,603 8 $2,981
189 $1,857 2,441 $2,241 1,163 $3,080 74 $3,9107 $1,536 154 $1,954 108 $2,203 11 $2,6353 $1,533 312 $1,859 218 $2,298 7 $2,5360 - 1 $1,500 2 $2,350 0 -0 - 0 - 0 - 0 -0 - 0 - 0 - 0 -0 - 0 - 1 $1,900 0 -3 $1,533 171 $1,864 95 $2,283 3 $2,6500 - 0 - 1 $1,950 0 -0 - 77 $1,820 35 $2,337 4 $2,4500 - 63 $1,901 84 $2,306 0 -0 - 0 - 0 - 0 -0 - 15 $1,648 16 $1,834 1 $1,7500 - 1 $1,700 1 $1,900 0 -0 - 0 - 0 - 0 -0 - 4 $1,463 2 $2,050 0 -0 - 2 $1,413 6 $1,517 0 -0 - 7 $1,836 6 $2,108 0 -0 - 0 - 0 - 0 -0 - 0 - 1 $1,600 0 -0 - 1 $1,500 0 - 1 $1,7500 - 0 - 0 - 0 -0 - 0 - 0 - 0 -1 $1,200 3 $1,500 2 $1,900 0 -0 - 0 - 0 - 0 -0 - 0 - 0 - 0 -0 - 0 - 0 - 0 -1 $1,200 1 $1,650 2 $1,900 0 -0 - 2 $1,425 0 - 0 -
2Rental Market Report, Fourth Quarter 2018
Toronto Real Estate Board
1 2 2 2 2 23 3 3 3
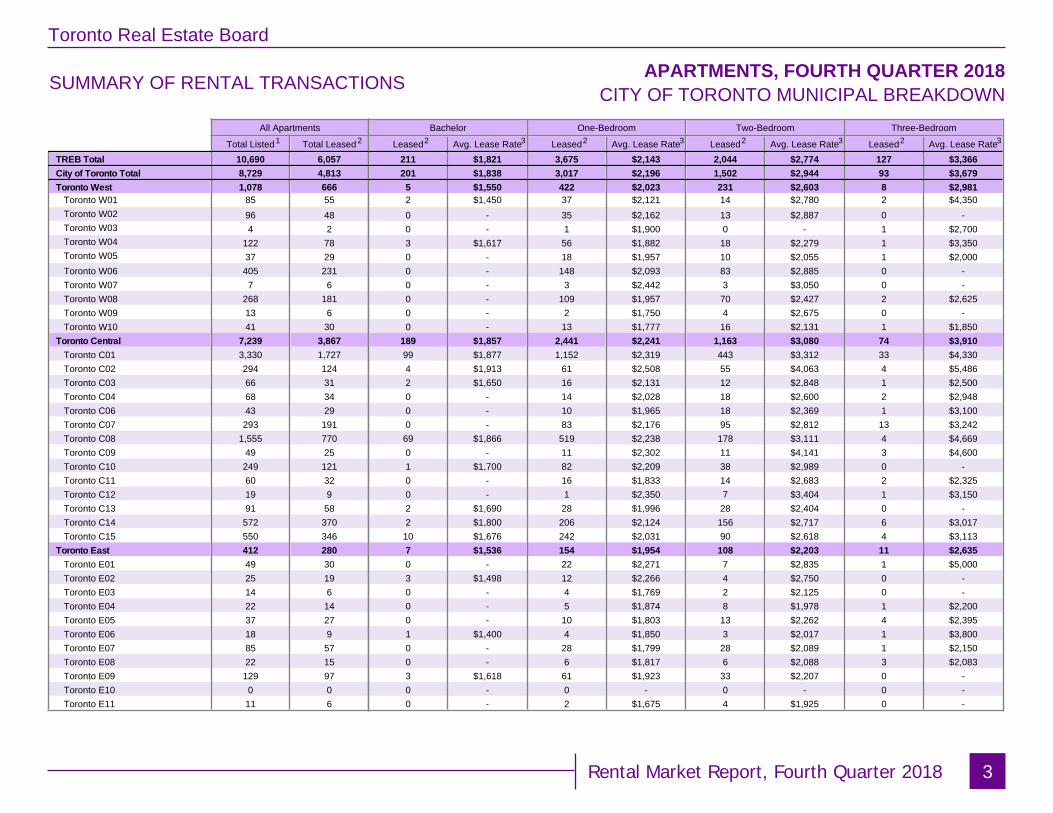
SUMMARY OF RENTAL TRANSACTIONS APARTMENTS, FOURTH QUARTER 2018CITY OF TORONTO MUNICIPAL BREAKDOWN
All Apartments
Total Listed Total LeasedTREB TotalCity of Toronto TotalToronto West
Toronto W01Toronto W02Toronto W03Toronto W04Toronto W05Toronto W06Toronto W07Toronto W08Toronto W09Toronto W10
Toronto CentralToronto C01Toronto C02Toronto C03Toronto C04Toronto C06Toronto C07Toronto C08Toronto C09Toronto C10Toronto C11Toronto C12Toronto C13Toronto C14Toronto C15
Toronto EastToronto E01Toronto E02Toronto E03Toronto E04Toronto E05Toronto E06Toronto E07Toronto E08Toronto E09Toronto E10Toronto E11
10,690 6,0578,729 4,8131,078 666
85 5596 484 2
122 7837 29405 2317 6
268 18113 641 30
7,239 3,8673,330 1,727294 12466 3168 3443 29293 191
1,555 77049 25249 12160 3219 991 58572 370550 346412 28049 3025 1914 622 1437 2718 985 5722 15129 970 0
11 6
Bachelor One-Bedroom Two-Bedroom Three-Bedroom
Leased Avg. Lease Rate Leased Avg. Lease Rate Leased Avg. Lease Rate Leased Avg. Lease Rate211 $1,821 3,675 $2,143 2,044 $2,774 127 $3,366201 $1,838 3,017 $2,196 1,502 $2,944 93 $3,6795 $1,550 422 $2,023 231 $2,603 8 $2,9812 $1,450 37 $2,121 14 $2,780 2 $4,3500 - 35 $2,162 13 $2,887 0 -0 - 1 $1,900 0 - 1 $2,7003 $1,617 56 $1,882 18 $2,279 1 $3,3500 - 18 $1,957 10 $2,055 1 $2,0000 - 148 $2,093 83 $2,885 0 -0 - 3 $2,442 3 $3,050 0 -0 - 109 $1,957 70 $2,427 2 $2,6250 - 2 $1,750 4 $2,675 0 -0 - 13 $1,777 16 $2,131 1 $1,850
189 $1,857 2,441 $2,241 1,163 $3,080 74 $3,91099 $1,877 1,152 $2,319 443 $3,312 33 $4,3304 $1,913 61 $2,508 55 $4,063 4 $5,4862 $1,650 16 $2,131 12 $2,848 1 $2,5000 - 14 $2,028 18 $2,600 2 $2,9480 - 10 $1,965 18 $2,369 1 $3,1000 - 83 $2,176 95 $2,812 13 $3,242
69 $1,866 519 $2,238 178 $3,111 4 $4,6690 - 11 $2,302 11 $4,141 3 $4,6001 $1,700 82 $2,209 38 $2,989 0 -0 - 16 $1,833 14 $2,683 2 $2,3250 - 1 $2,350 7 $3,404 1 $3,1502 $1,690 28 $1,996 28 $2,404 0 -2 $1,800 206 $2,124 156 $2,717 6 $3,017
10 $1,676 242 $2,031 90 $2,618 4 $3,1137 $1,536 154 $1,954 108 $2,203 11 $2,6350 - 22 $2,271 7 $2,835 1 $5,0003 $1,498 12 $2,266 4 $2,750 0 -0 - 4 $1,769 2 $2,125 0 -0 - 5 $1,874 8 $1,978 1 $2,2000 - 10 $1,803 13 $2,262 4 $2,3951 $1,400 4 $1,850 3 $2,017 1 $3,8000 - 28 $1,799 28 $2,089 1 $2,1500 - 6 $1,817 6 $2,088 3 $2,0833 $1,618 61 $1,923 33 $2,207 0 -0 - 0 - 0 - 0 -0 - 2 $1,675 4 $1,925 0 -
3Rental Market Report, Fourth Quarter 2018
Toronto Real Estate Board
1 2 2 3 2 3 2 3 2 3
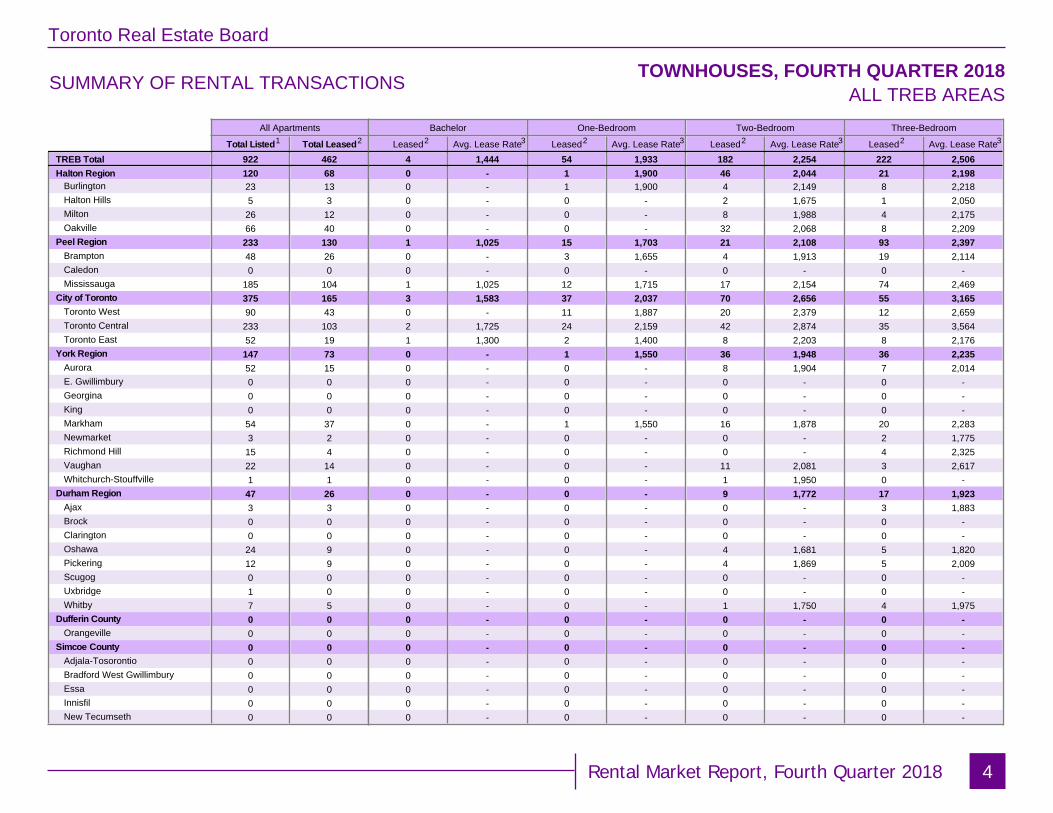
SUMMARY OF RENTAL TRANSACTIONS TOWNHOUSES, FOURTH QUARTER 2018ALL TREB AREAS
All Apartments
Total Listed Total LeasedTREB TotalHalton Region
BurlingtonHalton HillsMiltonOakville
Peel RegionBramptonCaledonMississauga
City of TorontoToronto WestToronto CentralToronto East
York RegionAuroraE. GwillimburyGeorginaKingMarkhamNewmarketRichmond HillVaughanWhitchurch-Stouffville
Durham RegionAjaxBrockClaringtonOshawaPickeringScugogUxbridgeWhitby
Dufferin CountyOrangeville
Simcoe CountyAdjala-TosorontioBradford West GwillimburyEssaInnisfilNew Tecumseth
922 462120 6823 135 3
26 1266 40233 13048 260 0
185 104375 16590 43233 10352 19147 7352 150 00 00 0
54 373 2
15 422 141 1
47 263 30 00 0
24 912 90 01 07 50 00 00 00 00 00 00 00 0
Bachelor One-Bedroom Two-Bedroom Three-Bedroom
Leased Avg. Lease Rate Leased Avg. Lease Rate Leased Avg. Lease Rate Leased Avg. Lease Rate4 1,444 54 1,933 182 2,254 222 2,5060 - 1 1,900 46 2,044 21 2,1980 - 1 1,900 4 2,149 8 2,2180 - 0 - 2 1,675 1 2,0500 - 0 - 8 1,988 4 2,1750 - 0 - 32 2,068 8 2,2091 1,025 15 1,703 21 2,108 93 2,3970 - 3 1,655 4 1,913 19 2,1140 - 0 - 0 - 0 -1 1,025 12 1,715 17 2,154 74 2,4693 1,583 37 2,037 70 2,656 55 3,1650 - 11 1,887 20 2,379 12 2,6592 1,725 24 2,159 42 2,874 35 3,5641 1,300 2 1,400 8 2,203 8 2,1760 - 1 1,550 36 1,948 36 2,2350 - 0 - 8 1,904 7 2,0140 - 0 - 0 - 0 -0 - 0 - 0 - 0 -0 - 0 - 0 - 0 -0 - 1 1,550 16 1,878 20 2,2830 - 0 - 0 - 2 1,7750 - 0 - 0 - 4 2,3250 - 0 - 11 2,081 3 2,6170 - 0 - 1 1,950 0 -0 - 0 - 9 1,772 17 1,9230 - 0 - 0 - 3 1,8830 - 0 - 0 - 0 -0 - 0 - 0 - 0 -0 - 0 - 4 1,681 5 1,8200 - 0 - 4 1,869 5 2,0090 - 0 - 0 - 0 -0 - 0 - 0 - 0 -0 - 0 - 1 1,750 4 1,9750 - 0 - 0 - 0 -0 - 0 - 0 - 0 -0 - 0 - 0 - 0 -0 - 0 - 0 - 0 -0 - 0 - 0 - 0 -0 - 0 - 0 - 0 -0 - 0 - 0 - 0 -0 - 0 - 0 - 0 -
4Rental Market Report, Fourth Quarter 2018
Toronto Real Estate Board
1 2 2 3 2 3 2 3 2 3
Bachelor One-Bedroom Two-Bedroom Three-Bedroom
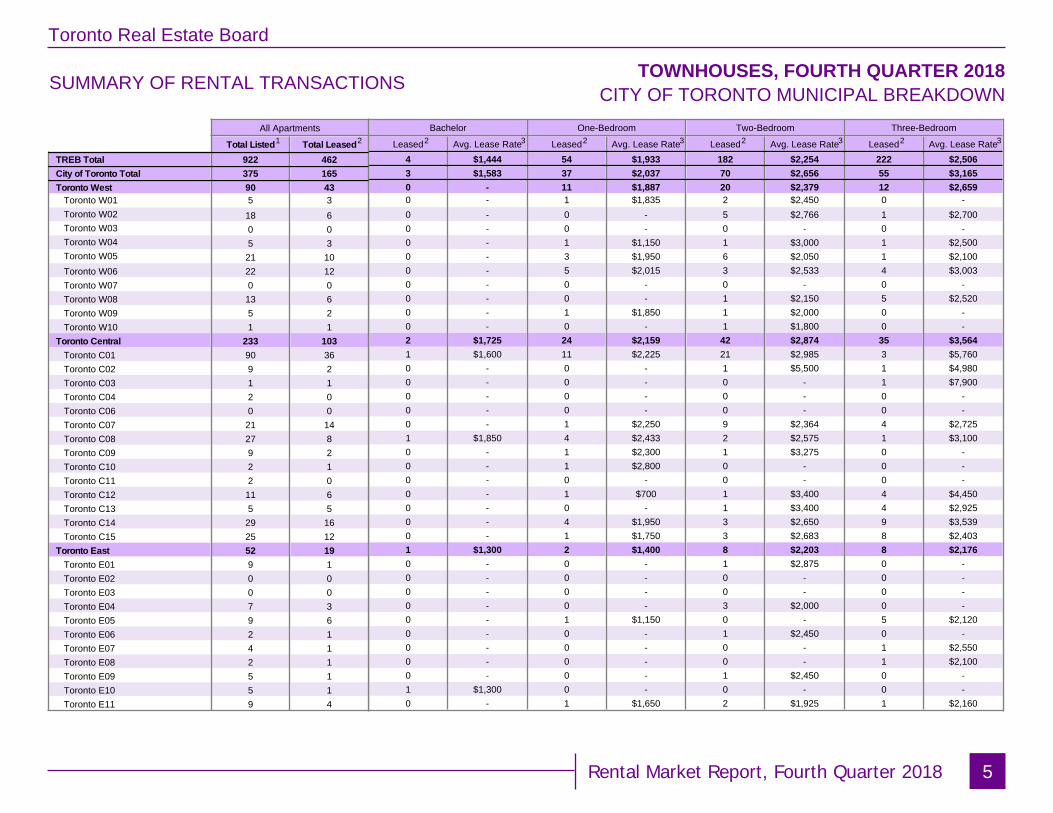
Leased Avg. Lease Rate Leased Avg. Lease Rate Leased Avg. Lease Rate Leased Avg. Lease Rate4 $1,444 54 $1,933 182 $2,254 222 $2,5063 $1,583 37 $2,037 70 $2,656 55 $3,1650 - 11 $1,887 20 $2,379 12 $2,6590 - 1 $1,835 2 $2,450 0 -0 - 0 - 5 $2,766 1 $2,7000 - 0 - 0 - 0 -0 - 1 $1,150 1 $3,000 1 $2,5000 - 3 $1,950 6 $2,050 1 $2,1000 - 5 $2,015 3 $2,533 4 $3,0030 - 0 - 0 - 0 -0 - 0 - 1 $2,150 5 $2,5200 - 1 $1,850 1 $2,000 0 -0 - 0 - 1 $1,800 0 -2 $1,725 24 $2,159 42 $2,874 35 $3,5641 $1,600 11 $2,225 21 $2,985 3 $5,7600 - 0 - 1 $5,500 1 $4,9800 - 0 - 0 - 1 $7,9000 - 0 - 0 - 0 -0 - 0 - 0 - 0 -0 - 1 $2,250 9 $2,364 4 $2,7251 $1,850 4 $2,433 2 $2,575 1 $3,1000 - 1 $2,300 1 $3,275 0 -0 - 1 $2,800 0 - 0 -0 - 0 - 0 - 0 -0 - 1 $700 1 $3,400 4 $4,4500 - 0 - 1 $3,400 4 $2,9250 - 4 $1,950 3 $2,650 9 $3,5390 - 1 $1,750 3 $2,683 8 $2,4031 $1,300 2 $1,400 8 $2,203 8 $2,1760 - 0 - 1 $2,875 0 -0 - 0 - 0 - 0 -0 - 0 - 0 - 0 -0 - 0 - 3 $2,000 0 -0 - 1 $1,150 0 - 5 $2,1200 - 0 - 1 $2,450 0 -0 - 0 - 0 - 1 $2,5500 - 0 - 0 - 1 $2,1000 - 0 - 1 $2,450 0 -1 $1,300 0 - 0 - 0 -0 - 1 $1,650 2 $1,925 1 $2,160
SUMMARY OF RENTAL TRANSACTIONS TOWNHOUSES, FOURTH QUARTER 2018CITY OF TORONTO MUNICIPAL BREAKDOWN
All Apartments
Total Listed Total LeasedTREB TotalCity of Toronto TotalToronto West
Toronto W01Toronto W02Toronto W03Toronto W04Toronto W05Toronto W06Toronto W07Toronto W08Toronto W09Toronto W10
Toronto CentralToronto C01Toronto C02Toronto C03Toronto C04Toronto C06Toronto C07Toronto C08Toronto C09Toronto C10Toronto C11Toronto C12Toronto C13Toronto C14Toronto C15
Toronto EastToronto E01Toronto E02Toronto E03Toronto E04Toronto E05Toronto E06Toronto E07Toronto E08Toronto E09Toronto E10Toronto E11
922 462375 16590 435 3
18 60 05 3
21 1022 120 0
13 65 21 1
233 10390 369 21 12 00 0
21 1427 89 22 12 0
11 65 5
29 1625 1252 199 10 00 07 39 62 14 12 15 15 19 4
5Rental Market Report, Fourth Quarter 2018
Toronto Real Estate Board
1 2 2 3 2 3 2 3 2 3
Toronto Real Estate Board
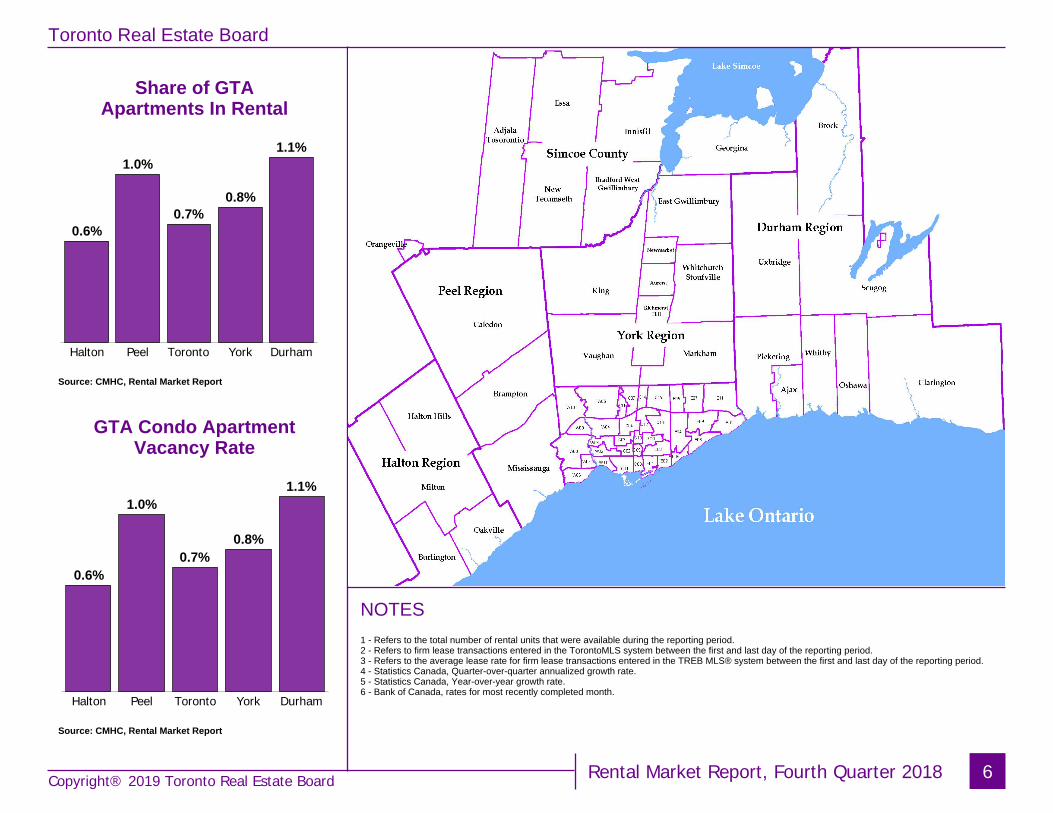
Share of GTAApartments In Rental
NOTES1 - Refers to the total number of rental units that were available during the reporting period.2 - Refers to firm lease transactions entered in the TorontoMLS system between the first and last day of the reporting period.3 - Refers to the average lease rate for firm lease transactions entered in the TREB MLS® system between the first and last day of the reporting period.4 - Statistics Canada, Quarter-over-quarter annualized growth rate.5 - Statistics Canada, Year-over-year growth rate.6 - Bank of Canada, rates for most recently completed month.
GTA Condo ApartmentVacancy Rate
6
Source: CMHC, Rental Market Report
Source: CMHC, Rental Market Report
Rental Market Report, Fourth Quarter 2018
0.6%
1.0%
0.7%0.8%
1.1%
Halton Peel Toronto York Durham
0.6%
1.0%
0.7%0.8%
1.1%
Halton Peel Toronto York Durham
Copyright® 2019 Toronto Real Estate Board