Embed Size (px)
DESCRIPTION
Informe enviado en febrero 2012
Citation preview


UNIVERSITY OF PUERTO RICO IN PONCEOFFICE SYSTEMS PROGRAMBUSINESS ADMINISTRATION DEPARTMENT
UNIVERSIDAD DE PUERTO RICO
PONCE
QUALITYASSURANCE REPORT
Prepared forThe Accreditation Council for Business Schools and ProgramsFebruary 2012


TABLE OF CONTENTS
Page
Executive Summary ....................................................................................................................................................... 1
Overview ........................................................................................................................................................................ 2
Standard 1 – Leadership ............................................................................................................................................... 4
Standard 3 – Student and Stakeholder Focus Results.................................................................................................... 5
Standard 4 – Measurement and Analysis of Student Learning and Performance ....................................................... 12
Standard 5 – Faculty and Staff Focus Results ............................................................................................................. 18
Standard 6 – Educational and Business Process Management .................................................................................... 28
Appendixes
Appendix A- Note Standard #4, Measurement and Analysis of Student Learning and Performance.................. 40
Appendix B - Note Standard #5, Faculty and Staff Focus .................................................................................... 41
Appendix C- Condition on Standard #6, Educational and Business Process Monitoring .................................... 41

1
EXECUTIVE SUMMARY
The Bachelor’s Degree in Office Systems of the University of Puerto Rico in Ponce (UPR-Ponce), established in 1982 as a
Bachelor in Secretarial Sciences, is a business related program. Its curriculum was revised in 1994 and approved by the
Board of Trustees of the University of Puerto Rico through Certification 107-1994-95, as amended. The current curriculum
focuses in the development of highly qualified administrative assistants, skilled in technology and procedures for the office
administration, as required by the business community. The name of the Program was changed to Bachelor’s Degree in
Office Systems. The Program responds to the UPR-Ponce mission and goals; its primary purpose is to satisfy the needs of
stakeholders such as employers and students of the southern region of Puerto Rico. The Program is continuously updated in
response to the changing business environment and job market. The Program was revised and will be implemented in
August 2012.
The Office Systems Program (OSP) Faculty is a highly qualified one based on its valuable teaching and business
professional experience. The OSP Faculty is constituted by eight professors who hold a master’s or doctorate degree. They
recognize the importance of continuous participation in professional development activities, which renew their knowledge
and skills to enrich the teaching and learning processes. This enables the integration of new education delivery technologies
and teaching strategies. Their commitment is also evidenced through their leadership in the design of a curriculum that
satisfies its constituents’ needs and expectations. The Faculty has also demonstrated its leadership by holding different
administrative positions in the UPR-Ponce and in the institution’s governing bodies.
In the process of teaching over 235 students enrolled in the Program, the OSP faculty is engaged with the achievement of the
learning outcome expectations. The Program fosters the knowledge acquisition as well as attitudes and skills development
necessary to perform effectively as office professionals. This is attained through the curriculum integration of business
content areas as information systems, office procedures, office administration, accounting, marketing, business law, global
dimensions, policies, statistics, and interpersonal relations. The curriculum also integrates general education areas as
communication; ethics, civic values; teamwork; critical thinking; decision making and problem solving skills. The OSP
promotes students’ social responsibility through their participation in community service projects. The curriculum provides
the senior students an internship course as the comprehensive experience in a real work environment. The quality of the
OSP has been evidenced through its accreditation by ACBSP in May 2010.

2
Accreditation Council for Business Schools and Programs (ACBSP) Quality Assurance (QA) Report
for
Baccalaureate/Graduate Degree Programs
Current as of February 2011
Overview (O)1. Complete all information requested.
Submit your report as an attachment to [email protected] on or before February 27th or September 30th.
This report should be limited to maximum of 50 pages. The average length of most good reports is 30 pages. To help reduce the page numbers you can
remove the ACBSP examples used in this report template to help you complete the report.
O2. Institution Name: University of Puerto Rico in Ponce Date February 2012
Address: PO Box 7186; Ponce, PR 00732
O3. Year Accredited/Reaffirmed: 2010 / This Report Covers Years: 2010-2012
O4. List All Accredited Programs (as they appear in your catalog):
Office Systems Bachelor Program
Business Administration Bachelor Program. Majors: Accounting, Management, Marketing, and Finance
O5. List all programs that are in your business unit that are not accredited by ACBSP and how you distinguish accurately to the public between programs that have
achieved accredited status and those that have not.
The business and business-related programs are accredited.
O6. List all campuses that a student can earn a business degree from your institution:
Students can earn a business and business-related degree from UPR-Ponce campus.
O7. Person completing report Name: Dr. Doris S. Torres
Phone: (787) 844-8181, Extension 2441
E-mail address: [email protected]
ACBSP Champion name: Dr. Doris S. Torres
ACBSP Co-Champion name: Prof. Carmen Bracero

3
O8. Conditions/Notes/Opportunity for Improvement (OFI) to be Addressed
Please explain and provide the necessary documentation/evidence for addressing each condition/note/OFI since your last report.
Remove Note: Note on Standard 4 – UPRP has an outcomes assessment program with trend data dating back to 2004. The MFT was given in the fall of 2009 to 14
students; this assessment will need to be tracked. See Appendix A.
Remove Note: Note on Standard 5 – UPRP has policies and plans to ensure an excellent faculty but will need to provide evidence of student learning outcomes and
student and stakeholder satisfaction to support rationale for not adhering to historical criteria and/or show results of plan to increase doctorally qualified faculty. See
Appendix B.
Remove Condition: Condition on Standard 6 – UPRP needs to demonstrate improvement in the following areas: 1) assessment of the new curriculum for
OSP after full implementation, 2) deployment of quantitative data to analyze the effectiveness of program improvement measures and assessment, and
3) analysis of retention rate with plan to continually monitor for improvement. See Appendix C.
O9. The business unit must routinely provide reliable information to the public on their performance, including student achievement.
As shown in Table O-1, using various mechanisms, the OSP provides reliable information and makes data accessible to the stakeholders as students,
alumni, administrators, faculty, and non-faculty personnel.
Table O-1: Mechanisms to Make OSP Information and Data Accessible to Stakeholders
Mechanisms Purpose
Dialogues between students and faculty
Request students’ recommendations about program, services, courses, and faculty performance Share actions taken regarding students’ recommendations
Newsletters (Faculty, students, non-faculty, and administrators)
Share data about the assessment process and results Share data about accreditation process
Assessment reports (Faculty, students, non-faculty, and administrators)
Share data about the assessment process and its results
OSD annual reports (Faculty, students, non-faculty, and administrators)
Provide a summary of assessment activities and changes resulting from this process
Faculty meetings
Discuss the assessment procedures to be followed Explore strategies for the student learning improvement Refine the program and its curriculum
Assessment dialogues
Share information about the program assessment with faculty, deans, and department heads
OSP Web Page
Present the OSP vision, mission, goals, values, student profile, curricular sequence, faculty profile, and office hours
Share information about the Office Systems Association Provide information about the accreditation process and the OSP Advisory Board

4
Standard #1 Leadership
Organization
a. List any organizational or administrative personnel changes within the business unit since your last report.
The Office Systems Department has experienced the following changes in terms of faculty and non-faculty members since the report submitted in January 2010.
Table 1.1: Changes in Faculty and Non-Faculty Personnel
Faculty Member Type of Contract Change Prof. Ruth Calzada Tenure Retired – December 2009
Prof. Angelita Guzmán Tenure Retired – June 2010
Dr. Lourdes Torres Tenure Transfer from UPR-Ponce Education Department – August 2010
Part-time professor at OSP during the self-study period
Dr. Rosa Del Valle Service Contract No service contract for 2011-2012 academic year
Prof. Sonia Negrón Service Contract No service contract for 2011-2012 academic year
Non-Faculty Member Type of Contract Change Mrs. Cecill Cuevas Service Contract No service contract for 2010-2011 academic year
b. List all new sites where students can earn an accredited business degree (international campus, off-campus or on campus, on-line) that have been added since
your last report?
There is no new site where students can earn an accredited business degree that has been added since the report submitted in January 2010.
Standard #2 Strategic Planning (this standard not typically addressed in the QA report) This is used as a place holder to allow all the other standards to be addressed in
the QA report and keep the numbering system consistent with self-studies and QA reports.

5
Standard #3 Student and Stakeholder Focus Results
Student- and Stakeholder-Focused Results Student- and stakeholder-focused results examine how well your organization satisfies students and stakeholders key
needs and expectations.
Key indicators may include: satisfaction and dissatisfaction of current and past students and key stakeholders, perceived
value, loyalty, persistence, or other aspects of relationship building, end of course surveys, alumni surveys, Internship
feedback, etc.
Each academic unit must demonstrate linkages to business practitioners and organizations, which are current and
significant, including an advisory board.
Periodic surveys should be made of graduates, transfer institutions, and/or employers of graduates to obtain data
on the success of business programs in preparing students to compete successfully for entry-level positions.
Std. 3 Students and Stakeholders Focus Analysis of Results
Performance Measure
(Competency)
Description of
Measurement
Instrument
Areas of Success
(results)
Analysis and
Action Taken
(Improvement)
Results of
Action
Taken
Insert Graphs or Tables of Resulting Trends for 3-5 Years (please graph all
available data up to five years)
Eighty-five percent
(85%) of Internship
students of the Office
Systems Program will
assess as excellent or
good the attainment of
the OSP learning goals
Graduating
Students
Survey,
2009-2010,
2010-2011,
and 2011-2012
(first semester)
Internship students
assess as excellent
or good the
attainment of the
OSP learning goals
as follows
2009-2010 –
97% or more
2010-2011 –
93% or more
2011-2012 –
92% or more
The OSP will
sustain promoting
academic
excellence
through
continuous
improvement.
The
Internship
students
continue
assessing
as excellent
or good the
attainment
of learning
goals.
Table 3.1: OSP Learning Goals Attainment According to Active Students
Competency
2009-2010 2010-2011 2011-2012
(First semester)
Excellent Good Excellent Good Excellent Good
Communication 83.0% 15.3% 75.9% 20.9% 80.8% 17.3%
Teamwork 93.2% 6.8% 69.0% 24.1% 92.3% 7.7%
Decision making
and problem
solving
93.0% 6.8% 82.8% 13.8% 92.3% 7.7%
Interpersonal relationships
90.9% 6.8% 86.2% 10.3% 92.3% 7.7%
Technology 81.8% 14.8% 86.3% 10.4% 92.3% 7.7%
Knowledge in
office procedures 93.2% 6.8% 86.2% 10.3% 84.6% 15.4%
Civic, ethical, and
aesthetical values 90.9% 6.8% 82.8% 10.3% 84.6% 15.4%
Logical and
critical thinking 68.2% 29.5% 72.4% 24.1% 92.3% 7.7%
Knowledge of
basic business
principles
84.1% 15.9% 82.8% 13.8% 84.6% 7.7%

6
Std. 3 Students and Stakeholders Focus Analysis of Results
Performance Measure
(Competency)
Description of
Measurement
Instrument
Areas of Success
(results)
Analysis and
Action Taken
(Improvement)
Results of
Action
Taken
Insert Graphs or Tables of Resulting Trends for 3-5 Years (please graph all
available data up to five years)
Eighty percent (80%) of
Internship’s supervisors
will assess as excellent
or good interns’
attainment of the OSP
learning goals
Internship
Supervisors
Survey
2009-2010,
2010-2011,
and 2011-2012
(first semester)
During 2009-2010
academic year,
Internship’s
supervisors totally
agreed or agreed
that interns possess
the nine learning
goals as follows:
communication;
teamwork;
interpersonal
relationships;
technology; office
procedures; civic,
ethical, and
aesthetical values;
and logical and
critical thinking -
86% or more
decision-making
and problem
solving skills -
79%
knowledge of
basic business
principles in a
global
environment -
64%
During 2010-2011
academic year,
Internship’s
supervisors totally
agreed or agreed
that interns’ possess
the nine learning
goals as follows:
The OSP
curricular
sequence was
revised. The
reviewed
curriculum
includes four one-
credit hour
courses in the
following areas:
marketing,
economics,
statistics, and
finance. The
purpose of adding
these courses is to
strengthen
students’
knowledge in
business. The
credit hours for
accounting course
were increased
from 45 hours to
60.
The curricular
revision proposal
was submitted to
the Vice
Presidency of
Academic
Affairs (VPAA)
at the systemic
level in August
2010. In
February 2011,
the OS
Department Head
received the
VPAA feedback
The OS
Department
goal is to
implement
the
reviewed
curriculum
in August
2012.
Table 3.2: OSP Learning Goals Attainment According to Internship Supervisors
Competency
2009-2010 2010-2011 2011-2012
(First Semester)
Totally
Agree Agree
Totally
Agree Agree
Totally
Agree Agree
Communication 82.2% 10.7% 66.7% 33.3% 91.7%
Teamwork 100.0% 100.0% 91.7% 8.3%
Decision making
and problem
solving
50.0% 28.6% 61.1% 33.3% 41.7% 50.0%
Interpersonal
relationships 100.0% 100.0% 83.3% 16.7%
Technology 92.9% 7.1% 94.4% 5.6% 83.3% 8.3%
Performance in office procedures
85.7% 14.3% 83.3% 16.7% 75% 16.7%
Civic, ethical, and
aesthetical values 81.0% 9.5% 98.0% 88.9% 8.3%
Logical and critical thinking
64.3% 21.4% 61.1% 27.8% 66.7% 33.3%
Knowledge of
basic business
principles
35.7% 28.6% 27.8% 38.9% 41.7% 33.3%

7
Std. 3 Students and Stakeholders Focus Analysis of Results
Performance Measure
(Competency)
Description of
Measurement
Instrument
Areas of Success
(results)
Analysis and
Action Taken
(Improvement)
Results of
Action
Taken
Insert Graphs or Tables of Resulting Trends for 3-5 Years (please graph all
available data up to five years)
communication;
teamwork;
interpersonal
relationships;
technology; office
procedures; civic,
ethical, and
aesthetical values;
decision-making
and problem
solving skills; and
logical and
critical thinking -
89% or more
the knowledge of
basic business
principles in a
global
environment-
67%
During the first
semester of 2011-
2012, Internship’s
supervisors totally
agreed or agreed
that interns’ possess
the nine learning
goals as follows:
communication;
teamwork;
interpersonal
relationships;
technology; office
procedures; civic,
ethical, and
aesthetical values;
decision-making
and problem
solving skills; and
recognizing it as
a curricular
revision with
minor changes.
The Dean of
Academic Affairs
submitted it to the
UPR-Ponce
Academic Senate
for its
recommendations
before
implementation.
In November
2011, the UPR-
Ponce Academic
Senate issued the
Certification
2011-2012-28 to
allow its
implementation.
The OSP
Accreditation
Committee in
collaboration
with the
Curriculum
Committee began
the new
curriculum
disclosure among
students as well
as other
implementation
processes.
The OSP
Advisory Board’s
recommendations
to strengthen

8
Std. 3 Students and Stakeholders Focus Analysis of Results
Performance Measure
(Competency)
Description of
Measurement
Instrument
Areas of Success
(results)
Analysis and
Action Taken
(Improvement)
Results of
Action
Taken
Insert Graphs or Tables of Resulting Trends for 3-5 Years (please graph all
available data up to five years)
logical and
critical thinking -
92% or more
knowledge of
basic business
principles in a
global
environment, 75%
students’
relationship with
business
community were
taken into
consideration.
Students continue
involved in
learning activities
in which they
collaborate with
business
community. For
example, students
enrolled in SOFI
4505, Training
Techniques for
In-service
Personnel, visited
the Banco
Popular
Development and
Training Center
for an orientation
about the
institution’s
procedures for in
service personnel
training.

9
Std. 3 Students and Stakeholders Focus Analysis of Results
Performance Measure
(Competency)
Description of
Measurement
Instrument
Areas of Success
(results)
Analysis and
Action Taken
(Improvement)
Results of
Action
Taken
Insert Graphs or Tables of Resulting Trends for 3-5 Years (please graph all
available data up to five years)
Eighty percent (80%) of
Internship’s supervisors
will assess as excellent
or good interns’
performance
Internship
Supervisors
Survey
2009-2010,
2010-2011,
and 2011-2012
(first semester)
During 2009-2010,
2010-2011, and
2011-2012 first
semester, 92% of
Internship’s
supervisors assessed
as excellent or good
the academic
preparation received
by OSP interns
regarding their job.
Also, 92% of
supervisors assessed
as excellent or good
interns performance
during the
internship.
The OSP will
sustain promoting
the academic
excellence
through
continuous
improvement.
The
Internship
supervisors
continue
assessing
as excellent
or good
interns’
perfor-
mance.
Table 3.3: Internship Students’ Performance According to Internship Supervisors
Assessment Area
2009-2010 2010-2011 2011-2012
(First Semester)
Excellent Good Excellent Good Excellent Good
OSP internship students’ academic preparation received regarding their work at the internship
78.5% 14.3% 100% - 91.7% 0.0%
OSP internship students’ performance regarding their work at the internship
86.7% 7.1% 100% - 83.3% 8.3%
Eighty percent (80%) of
internship students will
assess as excellent or
good the academic
preparation received
through OSP
Graduating
Students
Survey,
2009-2010,
2010-2011,
and 2011-2012
(first semester)
Internship students assessed their
academic
preparation as
excellent or good as
follows:
2009-2010 - 96%
2010-2011 - 100%
2011-2012 - 100%
The OSP will
sustain promoting
the academic
preparation
excellence
through
continuous
improvement.
The
internship
students
continue
assessing
as excellent
or good the
academic
preparation
received.
0%
20%
40%
60%
80%
100%
2009-2010 2010-2011 2011-2012
75% 86% 77%
21% 14% 23%
Figure 3.1: Internship Students' Perception of Academic Preparation Received at OSP
Excellent
Good

10
Std. 3 Students and Stakeholders Focus Analysis of Results
Performance Measure
(Competency)
Description of
Measurement
Instrument
Areas of Success
(results)
Analysis and
Action Taken
(Improvement)
Results of
Action
Taken
Insert Graphs or Tables of Resulting Trends for 3-5 Years (please graph all
available data up to five years)
Eighty percent (80%) of
internship students will
be very satisfied or
satisfied with the OSP
Graduating
Students
Survey,
2009-2010,
2010-2011,
and 2011-2012
(first semester)
Internship students
assess their level of
satisfaction with the
OSP as very
satisfied or satisfied
as follows:
2009-2010 - 96%
2010-2011 - 93%
2011-2012 - 100%
The OSP will
sustain promoting
the academic
excellence
through
continuous
improvement.
The
internship
students
continue
being very
satisfied or
satisfied
with the
OSP.
0%
20%
40%
60%
80%
100%
2009-2010 2010-2011 2011-2012
82% 86%76%
14%6%
24%
Figure 3.2: Internship Students' Level ofSatisfaction with OSP
Very Satisfied
Satisfied
11
Std. 3 Students and Stakeholders Focus Analysis of Results
Performance Measure
(Competency)
Description of
Measurement
Instrument
Areas of Success
(results)
Analysis and
Action Taken
(Improvement)
Results of
Action
Taken
Insert Graphs or Tables of Resulting Trends for 3-5 Years (please graph all
available data up to five years)
Eighty percent (80%) of
internship students will
be satisfied with the
OSP
Graduating
Students
Survey,
2009-2010,
2010-2011 and
first semester of
2011-2012
During 2009-2010,
2010-2011, and the
first semester of
2011-2012, 93% or
more of internship
students considered
that the OSP has
satisfied their needs
and educational
expectations.
Ninety percent
(90%) or more of
internships students
considers that the
OSP is updated
according to new
trends in the office
systems area.
Ninety-three percent
(93%) or more of
internship students
considers that they
possess the
competencies
necessary to
perform effectively
in office systems
area and would
recommend the
Program.
The OSP will
sustain promoting
the academic
excellence
through
continuous
improvement.
The
internship
students
continue
being very
satisfied or
satisfied
with the
OSP.
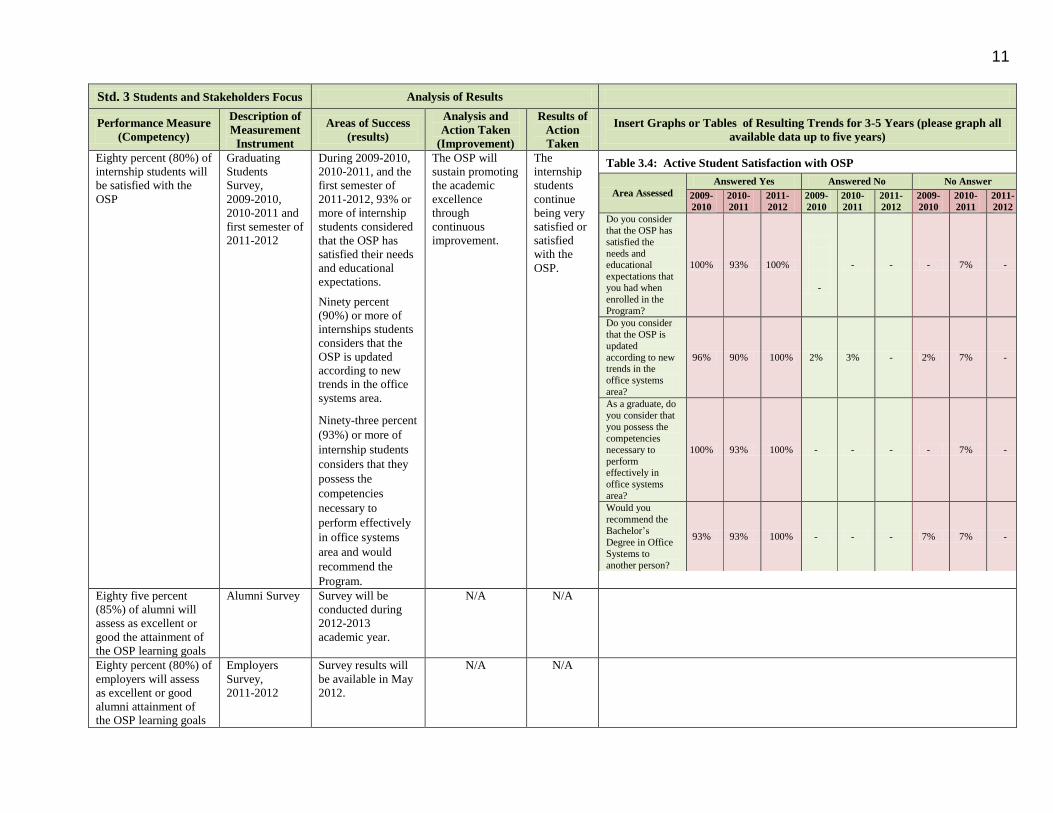
Table 3.4: Active Student Satisfaction with OSP
Area Assessed
Answered Yes Answered No No Answer
2009-
2010
2010-
2011
2011-
2012
2009-
2010
2010-
2011
2011-
2012
2009-
2010
2010-
2011
2011-
2012
Do you consider
that the OSP has
satisfied the
needs and educational
expectations that
you had when
enrolled in the
Program?
100% 93% 100%
-
- - - 7% -
Do you consider
that the OSP is
updated
according to new trends in the
office systems
area?
96% 90% 100% 2% 3% - 2% 7% -
As a graduate, do
you consider that
you possess the
competencies
necessary to
perform effectively in
office systems
area?
100% 93% 100% - - - - 7% -
Would you
recommend the
Bachelor’s
Degree in Office
Systems to
another person?
93% 93% 100% - - - 7% 7% -
Eighty five percent
(85%) of alumni will
assess as excellent or
good the attainment of
the OSP learning goals
Alumni Survey Survey will be
conducted during
2012-2013
academic year.
N/A N/A
Eighty percent (80%) of
employers will assess
as excellent or good
alumni attainment of
the OSP learning goals
Employers
Survey,
2011-2012
Survey results will
be available in May
2012.
N/A N/A

12
Standard #4 Measurement and Analysis of Student Learning and Performance
a. Program Outcomes
List outcomes, by accredited program. Many of the program outcomes should be used as part of a student learning assessment plan and be measurable.
The Office Systems Program’s graduate will demonstrate effectively the following competencies:
b, Performance Results
Student Learning Results (Required for each accredited program, doctorate, masters, and baccalaureate)
Performance Indicator Definition
1. Student Learning Results
(Required for each accredited program)
A student learning outcome is one that measures a specific competency attainment.
Examples of a direct assessment (evidence) of student learning attainment that might be used include: capstone
performance, third-party examination, faculty-designed examination, professional performance, licensure examination).
Add these to the description of the measurement instrument in column two:
Direct - Assessing student performance by examining samples of student work.
Indirect - Assessing indicators other than student work such as getting feedback from the student or other persons who may
provide relevant information.
Formative – An assessment conducted during the student’s education.
Summative – An assessment conducted at the end of the student’s education.
Internal – An assessment instrument that was developed within the business unit.
External – An assessment instrument that was developed outside the business unit.
Comparative – Compare results between classes, between online and on ground classes, between professors, between
programs, between campuses, or compare to external results such as results from the U.S. Department of Education
Research and Statistics, or results from a vendor providing comparable data.
1. Communication skills
2. Teamwork skills
3. Problem solving and decision making skills
4. Interpersonal relationships skills
5. Technological skills
6. Knowledge and skills in office procedures
7. Civic, ethical, and aesthetical values
8. Logical and critical thinking skills
9. Knowledge of basic business principles in a global environment (marketing, finance, management, economics, statistics, accounting, and legal environment
of business)

13
Std. 4 - Student Learning Results Analysis of Results
Performance
Measure
(Competency)
Description of
Measurement
Instrument
Areas of
Success
Analysis and
Action Taken
Results of
Action
Taken
Insert Graphs or Tables of Resulting Trends for 3-5 Years (please
graph all available data up to five years)
Seventy percent
(70%) of students
will obtain 70% or
more in oral
communication
skills assessment
Direct,
formative,
internal,
assessment
rubric used in
SOFI 3355
During 2009-
2010 academic
year, 100% of
students
obtained 70%
or more.
Continue oral
communication
skills
reinforcement in
SOFI 3017 and
SOFI 3355
courses through
a workshop
about effective
oral
presentations.
For the second
semester of
2012-2013
academic year,
increase success
indicator to 75%
of students will
obtain 70% or
more for the
competency
assessment.
During
2010-2011
academic
year, 100%
of students
obtained
70% or
more.
0%
20%
40%
60%
80%
100%
2009-2010 2010-2011
100% 100%
Figure 4.1: Oral Communication Skills Assessment
Eighty five percent
(85%) of students
will obtain 90% or
more in
communication
skills assessment
Indirect,
summative,
internal,
capstone
course SOFI
4985,
(Internship
Performance
Evaluation
Instrument).
During 2009-
2010 academic
year, 71% of
students
obtained 90%
or more.
Revise the
Internship
Evaluation
Instrument to
assess
individually the
oral and writing
competency to
determine which
of the two areas
students need to
reinforce.
During
2011-201
academic
year 2, 82%
of students
obtained
90% or
more.
14
Std. 4 - Student Learning Results Analysis of Results
Performance
Measure
(Competency)
Description of
Measurement
Instrument
Areas of
Success
Analysis and
Action Taken
Results of
Action
Taken
Insert Graphs or Tables of Resulting Trends for 3-5 Years (please
graph all available data up to five years)
Coordinate,
through the
UPR-Ponce
Academic
Learning and
Support Center
for Students and
Faculty, writing
workshops for
students
enrolled in SOFI
3215 and SOFI
3327 courses.
Continue
reinforcing the
writing skills in
SOFI 3215 and
SOFI 3327
through
reviewing
language and
grammatical
rules usage and
writing
exercises.
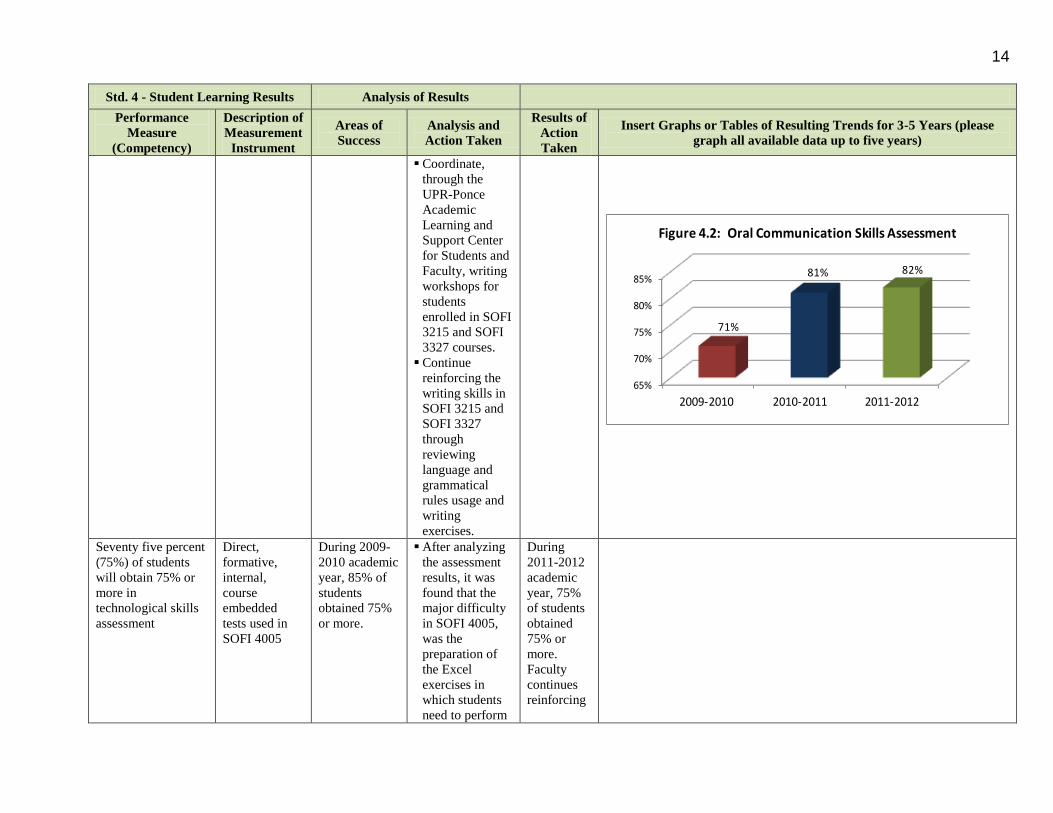
65%
70%
75%
80%
85%
2009-2010 2010-2011 2011-2012
71%
81% 82%
Figure 4.2: Oral Communication Skills Assessment
Seventy five percent
(75%) of students
will obtain 75% or
more in
technological skills
assessment
Direct,
formative,
internal,
course
embedded
tests used in
SOFI 4005
During 2009-
2010 academic
year, 85% of
students
obtained 75%
or more.
After analyzing
the assessment
results, it was
found that the
major difficulty
in SOFI 4005,
was the
preparation of
the Excel
exercises in
which students
need to perform
During
2011-2012
academic
year, 75%
of students
obtained
75% or
more.
Faculty
continues
reinforcing

15
Std. 4 - Student Learning Results Analysis of Results
Performance
Measure
(Competency)
Description of
Measurement
Instrument
Areas of
Success
Analysis and
Action Taken
Results of
Action
Taken
Insert Graphs or Tables of Resulting Trends for 3-5 Years (please
graph all available data up to five years)
mathematical
operations. The
Faculty in
charge of the
course has
determined that
it is necessary to
increase the
hours assigned
in the course to
the development
of this skill.
Continue
reinforcing the
technological
skills in SOFI
3005, SOFI
3105, SOFI
3125, SOFI
3218, SOFI
3305 and SOFI
4005 through
work on
practical
exercises.
the technol-
ogical skills
in the OSP
courses.
Eighty five percent
(85%) of students
will obtain 90% or
more in
technological skills
assessment
Indirect,
summative,
internal,
capstone
course SOFI
4985
(Internship
Performance
Evaluation
Instrument).
During 2009-
2010 academic
year, 96% of
students
obtained 90%
or more.
Continue
reinforcing the
technological
skills in SOFI
3005, SOFI
3105, SOFI
3125, SOFI
3218, SOFI
3305 and SOFI
4005 through
work on
practical
During
2011-2012
academic
year, 93%
of students
obtained
90% or
more.
65%70%75%80%85%90%
2009-2010 2010-2011 2011-2012
85% 89%
75%
Figure 4.3: Technological Skills Assessment

16
Std. 4 - Student Learning Results Analysis of Results
Performance
Measure
(Competency)
Description of
Measurement
Instrument
Areas of
Success
Analysis and
Action Taken
Results of
Action
Taken
Insert Graphs or Tables of Resulting Trends for 3-5 Years (please
graph all available data up to five years)
exercises.
Eighty five percent
(85%) of students
will obtain 90% or
more in civic values
assessment
Indirect,
summative,
internal,
capstone
course SOFI
4985, rubric
for civic
values
assessment
through a
community
service project.
During 2009-
2010 academic
year, 83% of
students
obtained 90%
or more.
Continue
reinforcing the
civic values in
SOFI 3017,
SOFI 3355, and
SOFI 4985
through
community
service projects.
During
2011-2012
academic
year, 100%
of students
obtained
90% or
more.
0%
20%
40%
60%
80%
100%
2009-2010 2010-2011 2011-2012
83%
97% 100%
Figure 4.5: Civic Values Assessment
Eighty five percent
(85%) of students
Indirect,
summative,
During 2009-
2010 academic
Continue
reinforcing the
During
2011-2012
85%
90%
95%
100%
2009-2010 2010-2011 2011-2012
96%
100%
93%
Figure 4.4: Technological Skills Assessment

17
Std. 4 - Student Learning Results Analysis of Results
Performance
Measure
(Competency)
Description of
Measurement
Instrument
Areas of
Success
Analysis and
Action Taken
Results of
Action
Taken
Insert Graphs or Tables of Resulting Trends for 3-5 Years (please
graph all available data up to five years)
will obtain 90% or
more in ethical
values assessment
Internal,
capstone
course SOFI
4985
(Internship
Performance
Evaluation
Instrument).
year, 96% of
students
obtained 90%
or more.
ethical values in
SOFI 3015,
SOFI 3017,
SOFI 3210,
SOFI 3355,
SOFI 4038 and
SOFI 4985
through
community
service projects
and case studies.
academic
year, 100%
of students
obtained
90% or
more.
85%
90%
95%
100%
2009-2010 2010-2011 2011-2012
96%
100% 100%
Figure 4.6: Ethical Values Assessment
Sixty five percent
(65%) of students
will obtain 70% or
more in the
assessment of basic
business principles
knowledge in global
environment
Direct,
formative
internal,
course
embedded
comprehensive
test used in
SOFI 4038
During 2009-
2010 academic
year, 91% of
students
obtained 70%
or more.
Continue
reinforcing the
knowledge
acquisition of
basic business
principles in
global
environment in
SOFI 3357 and
SOFI 4038
through quizzes,
critical analysis,
research
projects, and
case studies.
During
2011-2012
academic
year, 89%
of students
obtained
70% or
more.
80%
85%
90%
95%
2009-2010 2010-2011 2011-2012
91%
85%
89%
Figure 4.7: Basic Business Principles Knowledge in Global Environment Assessment

18
Standard #5 Faculty and Staff Focus
Complete the following table. Use a maximum of three or four examples, reporting what you consider to be the most important data. It is not necessary to
provide results for every process.
Standard 5 - Faculty- and Staff-Focused Results
4. Faculty and Staff Focused
Results
Faculty and staff-focused results examine how well the organization create and maintains a positive, productive,
learning-centered work environment for business faculty and staff.
Key indicators may include: professional development, scholarly activities, community service, administrative duties,
business and industry interaction, number of advisees, number of committees, number of theses supervised, satisfaction
or dissatisfaction of faculty and staff, positive, productive, and learning-centered environment, safety, absenteeism,
turnover, or complaints.
Std. 5 - Faculty and Staff Focused
Results Analysis of Results
Performance
Measure
(Competency)
Description of
Measurement
Instrument
Areas of
Success
Analysis and
Action Taken
Results of
Action Taken
Insert Graphs or Tables of Resulting Trends for 3-5 Years
(please graph all available data up to five years)
Assess Faculty job
satisfaction in
various aspects
Opportunities
for Faculty
professional
development
offered by the
Office Systems
Department
2008-2009 and
2010-2011
OSD
Leadership
Survey
During 2008-
2009 and
2010-2011
academic
years, 100% of
OSP Faculty
was very
satisfied or
satisfied with
the
opportunities
for
professional
development
offered by the
Office
Systems
Department.
When
comparing
2008-2009 and
2010-2011 OSP
Faculty level of
satisfaction
regarding the
professional
development
opportunities
offered by the
Department, an
increase of 24%
was observed in
the very
satisfied option.
One hundred
percent (100%)
of OSP Faculty
was very
satisfied or
satisfied with
the following
professional
activities
coordinated by
the OSP
Professional
Development
Committee:
Workshop:
Using the
Grade Center
in Blackboard
0%
20%
40%
60%
80%
100%
Very Satisfied Satisfied
46% 54%70%
30%
Figure 5.1: OSP Faculty Professional Development
2008
2010

19
Std. 5 - Faculty and Staff Focused
Results Analysis of Results
Performance
Measure
(Competency)
Description of
Measurement
Instrument
Areas of
Success
Analysis and
Action Taken
Results of
Action Taken
Insert Graphs or Tables of Resulting Trends for 3-5 Years
(please graph all available data up to five years)
Ethical values
disclosure and
procedures to
address ethical
issues in OS
Department
The OSP
Faculty was
very satisfied
or satisfied
with the
disclosure of
the ethical
values of the
OSP and with
the procedures
to address
ethical issues
as follows:
The OSP
Professional
Development
Committee has
continued the
coordination of
professional
activities
according to the
needs
assessment
completed by
the OSP
Faculty.
When
comparing
2008-2009 and
2010-2011 OSP
Faculty level of
satisfaction
regarding the
disclosure of
the ethical
values of the
OSP and
procedures to
address ethical
issues, an
increase of 8%
was observed in
Workshop:
Information
Skills
Workshop:
Teaching
Strategies for
Office
Systems
Courses
Workshop:
Meaningful
Learning for
New
Generations
Workshop:
Faculty Role
in Students
Retention
The OSP ethical
values
statement is
included in the
syllabi and
disclosed
through
different means.
0%
20%
40%
60%
80%
100%
Very Satisfied Satisfied
82%
9%
90%
10%
Figure 5.2: OSP Ethical Values Disclosure
2008
2010

20
Std. 5 - Faculty and Staff Focused
Results Analysis of Results
Performance
Measure
(Competency)
Description of
Measurement
Instrument
Areas of
Success
Analysis and
Action Taken
Results of
Action Taken
Insert Graphs or Tables of Resulting Trends for 3-5 Years
(please graph all available data up to five years)
Faculty
participation in
the planning
process that is
conducted in
the OS
Department
2008-2009 -
91%
2010-2011 -
100%
The OSP
Faculty
expressed to
be very
satisfied or
satisfied with
their
participation in
the planning
process
conducted in
the OSD as
follows:
the very
satisfied option.
The OSP
Department
Head has
continued with
the disclosure
of the ethical
values and
procedures to
address ethical
issues in OS
Department.
When
comparing
2008-2009 and
2010-2011,
OSP Faculty
level of
satisfaction
regarding their
participation in
the planning
process
conducted in
the OSD, an
increase of 34%
was observed.in
the very
satisfied
alternative.
The OSP Faculty has participated actively in the development of the following plans: OSD Operational Plans and OSD Assessment Plans for the academic years 2010-2011 and 2011-2012.
The OSD committees for Faculty Professional Development, Orientation and
0%
20%
40%
60%
80%
100%
Very Satisfied Satisfied
46% 36%
80%
20%
Figure 5.3: OSP Faculty Participation in thePlanning Process
2008
2010
21
Std. 5 - Faculty and Staff Focused
Results Analysis of Results
Performance
Measure
(Competency)
Description of
Measurement
Instrument
Areas of
Success
Analysis and
Action Taken
Results of
Action Taken
Insert Graphs or Tables of Resulting Trends for 3-5 Years
(please graph all available data up to five years)
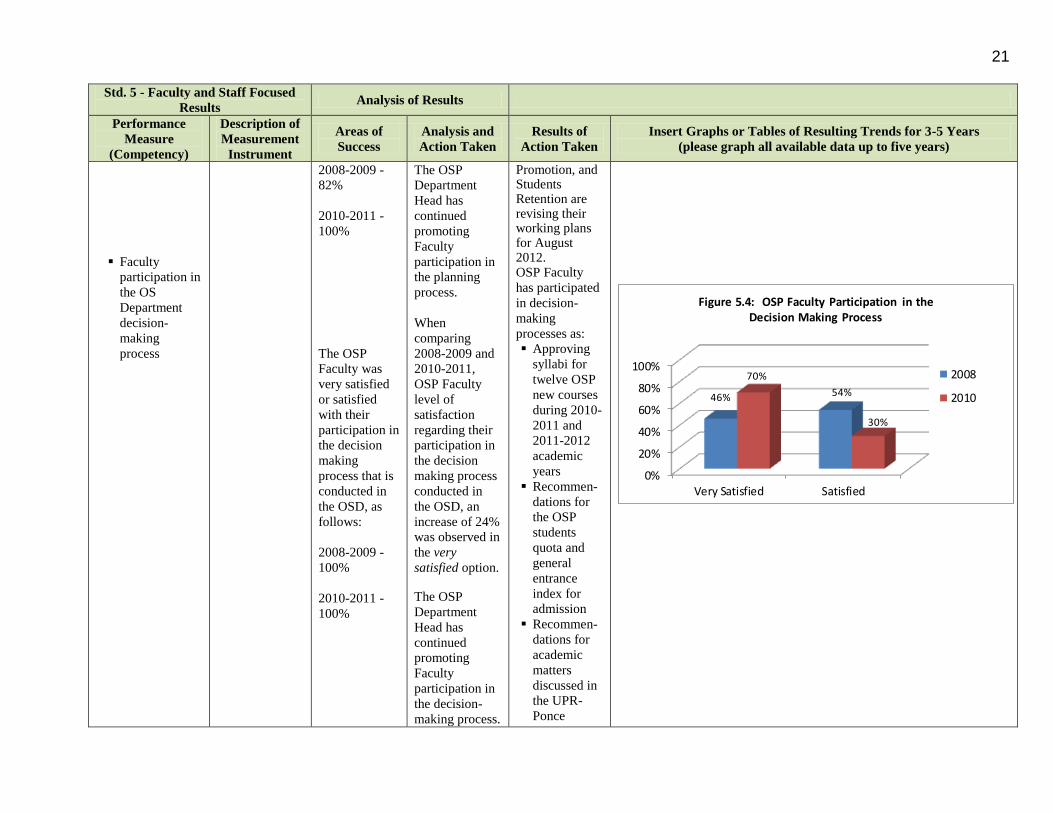
Faculty
participation in
the OS
Department
decision-
making
process
2008-2009 -
82%
2010-2011 -
100%
The OSP
Faculty was
very satisfied
or satisfied
with their
participation in
the decision
making
process that is
conducted in
the OSD, as
follows:
2008-2009 -
100%
2010-2011 -
100%
The OSP
Department
Head has
continued
promoting
Faculty
participation in
the planning
process.
When
comparing
2008-2009 and
2010-2011,
OSP Faculty
level of
satisfaction
regarding their
participation in
the decision
making process
conducted in
the OSD, an
increase of 24%
was observed in
the very
satisfied option.
The OSP
Department
Head has
continued
promoting
Faculty
participation in
the decision-
making process.
Promotion, and Students Retention are revising their working plans for August 2012. OSP Faculty
has participated
in decision-
making
processes as:
Approving
syllabi for
twelve OSP
new courses
during 2010-
2011 and
2011-2012
academic
years
Recommen-
dations for
the OSP
students
quota and
general
entrance
index for
admission
Recommen-
dations for
academic
matters
discussed in
the UPR-
Ponce
0%
20%
40%
60%
80%
100%
Very Satisfied Satisfied
46% 54%
70%
30%
Figure 5.4: OSP Faculty Participation in the Decision Making Process
2008
2010

22
Std. 5 - Faculty and Staff Focused
Results Analysis of Results
Performance
Measure
(Competency)
Description of
Measurement
Instrument
Areas of
Success
Analysis and
Action Taken
Results of
Action Taken
Insert Graphs or Tables of Resulting Trends for 3-5 Years
(please graph all available data up to five years)
Availability of
technology for
Faculty work
The OSP
Faculty was
satisfied or
very satisfied
with the
availability of
technology for
their work in
the OSD, as
follows:
2008-2009 -
91%
2010-2011 -
90%
When
comparing
2008-2009 and
2010-2011,
OSP Faculty
level of
satisfaction
regarding the
availability of
technology for
their work in
the OSD, the
results were
similar,
although there
is a significant
difference in the
percentages
distribution.
The OSP
Department
Head has
continued
working on the
availability of
OSD
equipment,
software, and
Academic
Senate as
policy for
general
education
components
The OSD
acquired the
MedOne and
IMClaim
software
licenses for
billing and
medical records
courses.
Microsoft
Office 2010 and
Windows 7
were installed
in five
computer
laboratories.
The memory
(RAM) was
upgraded in a
computer lab.
The OSD
requested the
acquisition of
26 computers
for a lab for
August 2012.
0%
20%
40%
60%
80%
100%
Very Satisfied Satisfied
73%
18%
40% 50%
Figure 5.5: Availability of Technology at OSP
2008
2010

23
Std. 5 - Faculty and Staff Focused
Results Analysis of Results
Performance
Measure
(Competency)
Description of
Measurement
Instrument
Areas of
Success
Analysis and
Action Taken
Results of
Action Taken
Insert Graphs or Tables of Resulting Trends for 3-5 Years
(please graph all available data up to five years)
Availability of
financial
resources for
Faculty work
The OSP
Faculty was
very satisfied
with the
availability of
financial
resources for
their work in
the OSD as
follows
2008-2009 -
64%
2010-2011 -
40%
Internet
connection.
When
comparing
2008-2009 and
2010-2011,
OSP Faculty
level of
satisfaction
regarding the
availability of
financial
resources, a
decrease of
24% was
observed in the
level of
satisfaction.
The UPRP has
experienced a
decrease in the
budget. This
resulted in a
decrease in the
department
budget for
materials
acquisition,
travel
arrangements,
and
professional
development.
The OS
The OSD has
been updating
the equipment
and software
necessary to
comply with the
attainment of
the OSP
competencies.
0%
20%
40%
60%
80%
100%
Very Satisfied Satisfied
0%
64%
0%
40%
Figure 5.6: Availability of Financial Resources
2008
2010

24
Std. 5 - Faculty and Staff Focused
Results Analysis of Results
Performance
Measure
(Competency)
Description of
Measurement
Instrument
Areas of
Success
Analysis and
Action Taken
Results of
Action Taken
Insert Graphs or Tables of Resulting Trends for 3-5 Years
(please graph all available data up to five years)
Department
Head has made
necessary
adjustments in
the use of
operational
budget to assure
academic
excellence and
quality service.
Assess Faculty
participation in the
academic advising
process
Log of students
advised
The number of
students per
advisor is at
manageable
levels.
The OSP
Faculty is
involved in the
students’
academic
advising each
semester.
From First
Semester to
Second
Semester of
academic year
2010-2011,
there was an
increase of
36% of students
advised by
Faculty. From
Second
Semester
2010 -2011 to
First Semester
2011-2012,
there was an
additional
increase of 4%.
All full-time
professors
continue
participating as
academic
advisors.
Table 5.1: OSP Students Advised by Faculty
Professor I Semester
2010-2011
II Semester
2010-2011
I Semester
2011-2012
Bracero, Carmen Acting
Chancellor - 13
Del Valle, Rosa 11 11 **
Fournier, Ada I. 2 12 6
Mercado, Rosa 6 18 18
Negrón, Sonia 7 20 **
Rodríguez, Aida - 14 6
Rodríguez, Yannira 8 * 9
Román, Marilyn - 17 5
Torres, Doris*** 82 90 118
Torres, Lourdes - - 24
Total 116 182 199
Total Enrollment 255 225 235
% Students Advised 45% 81% 85%
*Maternity leave.
**No service contract for 2011-2012 academic year.
***Dr. Doris Torres is the OSD Department Head.

25
Std. 5 - Faculty and Staff Focused
Results Analysis of Results
Performance
Measure
(Competency)
Description of
Measurement
Instrument
Areas of
Success
Analysis and
Action Taken
Results of
Action Taken
Insert Graphs or Tables of Resulting Trends for 3-5 Years
(please graph all available data up to five years)
The OSP
Department
Head has
continued
promoting OSP
Faculty
participation in
students’
academic*Dr.
Rosa del Valle
and Prof. Sonia
Negrón were not
contracted for
2011-2012
academic year.
*Dr. Rosa del
Valle and Prof.
Sonia Negrón
were not
contracted for
2011-2012
academic year.
advising.

26
Std. 5 - Faculty and Staff Focused
Results Analysis of Results
Performance
Measure
(Competency)
Description of
Measurement
Instrument
Areas of
Success
Analysis and
Action Taken
Results of
Action Taken
Insert Graphs or Tables of Resulting Trends for 3-5 Years
(please graph all available data up to five years)
Faculty
involvement with
the community
Number of
community
organizations to
which Faculty
offered services
The OSP
Faculty is
actively
involved with
the business
and non-
business
community
organizations.
The OSP
Faculty
participates in
business and
non-business
community
service
activities as:
helping less
advantage
people in
nonprofit
organizations;
coordinating
workshops,
professional
development
activities, and
trainings for in-
service
personnel at
public and
private business
organizations;
holding
leadership
positions in
boards of
nonprofit
organizations;
and
participating as
evaluators in
ACBSP
accreditation
Continue
promoting OSP
Faculty
participation in
business and
non-business
community
services
projects.
Table 5.2: OSP Faculty Participation in the Business Community
and Community Service Organizations
Professor 2009-2010 2010-2011
2011-2012
(First
Semester)
Bracero, Carmen 5 7 4
Calzada, Ruth 2 * *
Del Valle, Rosa*** 0 5 **
Fournier, Ada I. 0 1 0
Guzmán, Angelita 2 * *
Mercado, Rosa*** 0 2 0
Negrón, Sonia 0 2 **
Rodríguez, Aida 1 1 1
Rodríguez, Yannira 0 1 2
Román, Marilyn 0 1 0
Torres, Doris 6 17 4
Torres, Lourdes 8 6 3
Total 24 43 14
*Retired.
**No service contract for 2011-2012 academic year.
***Dr. Rosa Del Valle and Prof. Rosa Mercado were actively
involved in the collection of food and personal hygiene articles
to be donated to community organizations, mainly to help
children and elderly people.

27
Std. 5 - Faculty and Staff Focused
Results Analysis of Results
Performance
Measure
(Competency)
Description of
Measurement
Instrument
Areas of
Success
Analysis and
Action Taken
Results of
Action Taken
Insert Graphs or Tables of Resulting Trends for 3-5 Years
(please graph all available data up to five years)
process mock
visits.
When
comparing
2009-2010 and
2010-2011,
there is an
increase of 44%
in Faculty
participation in
community
services
projects.
Faculty
participation in
OSD committees
Number of
committees in
which OSP
Faculty serves
on
The OSP
Faculty is
dynamically
involved in
various
departmental
committees.
When
comparing the
the last two
academic years,
it is observed
that Faculty has
been actively
involved in
more OSD
committees.
The OSD
Faculty
participation in
committees has
been essential
in the
attainment of
the OSD
objectives as
stated in the
Annual
Operational
Plans.
Table 5.3: OSP Faculty Participation in Departmental
Committees
Professor 2009-2010 2010-2011
2011-2012
(First
Semester)
Bracero, Carmen 2 4 4
Del Valle, Rosa* 1 4 N/A
Fournier, Ada I. 5 4 5
Mercado, Rosa 3 3 4
Negrón, Sonia* 1 4 N/A
Rodríguez, Aida 5 2 3
Rodríguez, Yannira 4 5 6
Román, Marilyn 2 4 4
Torres, Doris 3 5 5
Torres, Lourdes 2 6 7
*No service contract for 2011-2012 academic year.

28
Standard 6 -Budgetary, Financial, and Market Results
a. Describe how you routinely provide reliable information to the public on your performance, including student achievement.
See Overview O9, Page 3.
b. Curriculum
1. List any existing accredited degree programs/curricula that have been substantially revised since your last report and attach a Table - Standard 6, Criterion
6.1.3 – Undergraduate CPC Coverage for each program. The OSP was revised in 2009. In February 2011, the Vice Presidency of Academic Affairs (VPAA) at the systemic level recognized it as a curricular revision with minor
changes. The Undergraduate CPC Compliance through the Office Systems new curricular sequence was revised. It is included as Table – Standard 6, Criterion 6.9 at
Page 37.
2. List any new degree programs that have been developed and attach a Table - Standard 6, Criterion 6.1.3 – Undergraduate CPC Coverage for each new
program since your last report.
Any new degree programs have been developed.
3. List any accredited programs that have been terminated since your last report.
None accredited programs have been terminated.

29
Budgetary, Financial, and
Market Performance Results
Budgetary, financial, and market performance results examine (1) management and use of financial resources and (2) market
challenges and opportunities.
Adequate financial resources are vital to ensuring an outstanding faculty and teaching environment. The resources budgeted
for and allocated to business units should be adequate to fund the necessary technology and training to allow students to
develop the requisite competencies for business environments.
Key indicators may include: expenditures per business student, business program expenditures as a percentage of budget, annual
business unit budget increases or decreases, enrollment increase or decrease of business students, transfer in or out of business
students, student credit hour production, or comparative data.
Analysis of Results
Performance
Measure
(Competency)
Description of
Measurement
Instrument
Areas of Success Analysis and
Action Taken
Results of
Action Taken
(occurs in the
following year)
Insert Graphs or Tables of Resulting Trends for 3-5 Years (please
graph all available data up to five years)
Availability of
financial
resources to
meet OSP
needs
Approved OSP
budget for
2009-2010,
2010-2011,
and 2011-2012
academic years
The budget
assigned to OSP
for 2010-2011
increased in 12%,
when comparing
to 2009-20l0
budget.
The percentage of
UPR-Ponce
budget assigned
to OSP has
increased by
0.19% from
2009-2010 to
2011-2012
academic years.
The OSP
Department Head
used allocated
funds to acquire
the necessary
resources to
comply with the
Program’s goals.
The OSP Faculty
has available the
necessary
equipment and
updated software
to deliver courses.
The OSP
Department Head
has requested
additional funds
to meet other
needs.
The OSP
requested
budget increase
for 2012-2013
academic year
according to
enrollment and
Program’s
needs as
computers,
educational
materials, and
office supplies,
traveling, and
Faculty and
staff
professional
development.
$751,294
$853,064
$767,235
Figure 6.1: OSP Budget
2009-2010
2010-2011
2011-2012
Table 6.1: Expenditures per OSP Student
Academic Year Expenditures
2009-2010 $2,889.59
2010-2011 $3,345.35
2011-2012 $3,264.83
Table 6.2: OSP Expenditures as a Percentage of
UPR-Ponce Budget
Academic Year Percentage
2009-2010 3.15%
2010-2011 3.21%
2011-2012 3.34%

30
Analysis of Results
Performance
Measure
(Competency)
Description of
Measurement
Instrument
Areas of Success Analysis and
Action Taken
Results of
Action Taken
(occurs in the
following year)
Insert Graphs or Tables of Resulting Trends for 3-5 Years (please
graph all available data up to five years)
Admission
quota
established by
the UPR-Ponce
Administrative
Board
Institutional
Annual Data
Profile
prepared by
UPR-Ponce
Office of
Planning and
Institutional
Research
(OPIR)
During 2010-
2011 and 2011-
2012 academic
years, the
admission quota
for freshman
students was
exceeded by 5%
and 6%
respectively.
The total
enrollment in
OSP decreased by
2% during 2010-
2011, when
comparing to
2009-2010
academic year.
The total
enrollment in
OSP decreased by
8% during 2011-
2012 when
comparing to
2010-2011
academic year.
The OSP
Department Head
has appointed the
Orientation and
Promotion
Committee who
has developed
activities to
promote the
Program as open
houses,
occupational
fairs, and high
school visits. The
members of the
Committee
coordinate the
preparation of the
OSP academic
offerings
brochures and
promotional
recruiting
materials with the
collaboration of
the non-faculty
personnel and
students enrolled
in SOFI 4030 -
Desktop
Publishing
course.
The Orientation
and Promotion
Committee
continues
developing
activities to
promote the
Program to
increase
enrollment.
During 2009-
2010 academic
year, the
Committee
visited three
high schools
and participated
in the UPR-
Ponce Open
House.
During 2010-
2011 academic
year, the
Committee
visited six high
schools offering
orientation to
199 students.
Also, the
committee
participated in
the UPR-Ponce
Open House.
The
Table 6.3:Freshman OSP Admission Quota and
Students Enrolled
Academic Year Quota
Freshman
Students
Enrolled
2009-2010 75 73
2010-2011 75 79
2011-2012 75 80
260
255
235
Figure 6.2: Total OSP Enrollment
2009-2010
2010-2011
2011-2012

31
Analysis of Results
Performance
Measure
(Competency)
Description of
Measurement
Instrument
Areas of Success Analysis and
Action Taken
Results of
Action Taken
(occurs in the
following year)
Insert Graphs or Tables of Resulting Trends for 3-5 Years (please
graph all available data up to five years)
Committee’s
members
coordinated a
departmental
Open House.
These activities
impacted high
schools
students, and
based on the
enrolled
freshman
students, the
Committee is
complying with
its purpose.
Compliance
with Student-
Credit Hour
Production of
an average of
15 credits per
semester
Institutional
Annual Data
Profile
The student-credit
hour production
was almost the
same for the past
three years:
2009-2010 –
15 credits
2010-2011 –
15 credits
2011-2012 –
15 credits
When comparing the average per year, it remained almost the same. The Faculty
advised students
to enroll in the
courses following
the curricular
sequence.
The Faculty
encourages
students to
follow the
curricular
sequence as an
approach to
complete the
OSP
requirements in
a six-year
period or less
and to increase
the graduation
rate.
Table 6.4: Student-Credit Hour Production
Academic Year First
Semester
Second
Semester
Average
per Year
2009-2010 15.47 14.57 15.02
2010-2011 15.48 14.52 15.00
2011-2012 15.40 14.50 14.95
Average per Semester 15.45 14.53 14.99

32
Standard 6 - Organizational Performance Results
5. Organizational Effectiveness Results Organizational effectiveness results examine attainment of organizational goals. Each business unit must have a
systematic reporting mechanism for each business program that charts enrollment patterns, student rete ntion,
student academic success, and other characteristics reflecting students' performance.
Key indicators may include: graduation rates, enrollment, improvement in safety, hiring equity, increased use of web-
based technologies, use of facilities by community organizations, contributions to the community, or partnerships,
retention rates by program, and what you report to governing boards and administrative units.
Analysis of Results
Performance
Measure
(Competency)
Description of
Measurement
Instrument
Areas of
Success
Analysis and
Action Taken
Results of
Action Taken
(occurs in the
following year)
Insert Graphs or Tales of Resulting Trends for 3-5 Years (please
graph all available data up to five years))
Increase the
OSP graduation
rate at least 38%
over the next
five years
Data from the
Integrated
Postsecondary
Education
Data System
(IPEDS)
Institutional
Annual Data
Profile
During 2009-
2010 academic
year (2003
Cohort), the OSP
graduation rate
was 32%.
During the last
three years, the
average time to
degree has been
five years.
During 2010-2011
academic year
(Cohort 2004), the
OSP graduation
rate was 42%
exceeding the
projection of 38%
over the next five
years.
The OSP’s
graduation rate for
2010-2011
(Cohort 2004) had
increased a 10%,
when comparing
to 2009-2010
(Cohort 2003).
The degrees
granted in 2010-
2011 (Cohort
2004) increased
by 20% when
comparing to
2009-2010
(Cohort 2003).
The OSP
continues
developing
strategies to
increase the
graduation rate
as the academic
counseling by
appointment.
This allows
students to
comply with the
curricular
sequence in a
six-year period
or less and with
the credit-hour
production.
Table 6.5: OSP and UPR-Ponce Graduation Rates
Academic Year OSP
Graduation Rate
UPR-Ponce
Graduation Rate
2009-2010
(Cohort 2003) 32% 42%
2010-2011
(Cohort 2004) 42% 45%
2011-2012
(Cohort 2005) 34% *
Average 37% 44%
*Data not available.
Table 6.6: Time to Degree
Academic
Year
Total
Degrees
Granted
Four
Years
Five
Years
Six
Years
2009-2010
(Cohort 2003) 22 2 12 8
2010-2011
(Cohort 2004) 28 7 20 1
2011-2012
(Cohort 2005) 20 6 11 3

33
Analysis of Results
Performance
Measure
(Competency)
Description of
Measurement
Instrument
Areas of
Success
Analysis and
Action Taken
Results of
Action Taken
(occurs in the
following year)
Insert Graphs or Tales of Resulting Trends for 3-5 Years (please
graph all available data up to five years))
The current OSP
requires 132
semester credit
hours. To
complete a
bachelor’s degree
on a traditional
four year
academic
schedule, a
student must
complete from 14
to 19 credits per
semester for eight
semesters (four
years).
Improve OSP
freshman to
sophomore
retention rate by
at least 5% over
the next five
years
Institutional
Annual Data
Profile
The OSP
retention rate for
the past three
years was
2009-2010 - 81%
2010-2011 - 65%
2011-2012 - 58%
The OSP’s
retention rate for
2010-2011
(Cohort 2009-
2010) had
decreased a 16%,
when comparing
to 2009-2010
(Cohort 2008-
2009).
The OSP’s
retention rate for
2011-2011
(Cohort 2010-
2011) had
decreased a 7%,
when comparing
to 2010-2011
The OSP
continues
developing
proactive
strategies to
increase the
retention rate
as:
promote
students’
development
of strong ties
with the
University
promote
students’
participation
in OSP
Table 6.7: Freshman to Sophomore Retention Rate
Academic Year
OSP
Retention
Rate
UPR-Ponce
Retention
Rate
2009-2010
(Cohort 2008-2009) 81% 83%
2010-2011
(Cohort 2009-2010) 65%
74%
2011-2012
(Cohort 2010-2011) 58%
77%
Average 73% 79%

34
Analysis of Results
Performance
Measure
(Competency)
Description of
Measurement
Instrument
Areas of
Success
Analysis and
Action Taken
Results of
Action Taken
(occurs in the
following year)
Insert Graphs or Tales of Resulting Trends for 3-5 Years (please
graph all available data up to five years))
(Cohort 2009-
2010).
The OSP
Retention
Committee was
appointed to
strengthen the
students’
retention. The
Committee
approaches are
focused on
freshman and
sophomore
students through
the collaboration
of alumni,
Counseling and
Guidance
Department,
senior students,
Office Systems
Students’
Association, and
OSP Faculty.
extracurr-
icular
activities
identify on
time students
who need
support and
intervene
with them
improve
students’
experience in
the
university
ensure
academic
advising’s
quality
monitor
students’
progress
encourage
students’
participation
in tutoring
and
mentoring
services.
With the
implementation
of the new
curricular
sequence, the
professors
encourage

35
Analysis of Results
Performance
Measure
(Competency)
Description of
Measurement
Instrument
Areas of
Success
Analysis and
Action Taken
Results of
Action Taken
(occurs in the
following year)
Insert Graphs or Tales of Resulting Trends for 3-5 Years (please
graph all available data up to five years))
students,
through the
academic
advising
process, to
continue in the
Program.
Students’
participation in
community
service projects
Number of
community
organizations
that students
impact with
their projects
Rubric to
assess level of
satisfaction of
the impacted
community
organizations
OSP students
participate in
community
service projects
mainly with
marginalized
communities.
One hundred
percent (100%)
of community
organizations
impacted with
students’
projects is very
satisfied with the
contribution of
the students.
The OSP students
are involved in
diverse projects
as:
train
community
groups through
workshops
support
community
and university
projects,
especially
those aimed at
the rescue of
marginalized
and vulnerable
communities.
The OSP
curriculum
provides
opportunities for
students’
participation in
community
service projects in
courses as SOFI
The OSP fosters
students’ social
responsibility
through their
participation in
community
service projects
as in-service
training;
collection of
food, clothes
and personal
hygiene articles
for children and
elderly; and
activities that
aimed to at
caring for the
environment,
among others.
The OSP
students
continue
participating in
community
service projects
to reinforce the
social
responsibility
Table 6.8: Community Organizations Impacted by
Students
Academic
Year
Course
ASOFI SOFI
4985
SOFI
3017
SOFI
4505
2009-2010 4 0 2 2
2010-2011 5 1 2 2
2011-2012
(First semester) 3 0 1 2

36
Analysis of Results
Performance
Measure
(Competency)
Description of
Measurement
Instrument
Areas of
Success
Analysis and
Action Taken
Results of
Action Taken
(occurs in the
following year)
Insert Graphs or Tales of Resulting Trends for 3-5 Years (please
graph all available data up to five years))
3017, SOFI 4505,
and SOFI 4985.
The Office
Systems
Association
(ASOFI, for its
Spanish acronym)
also develops
these activities.
skills.
The community
service project is
integrated as an
enriching
activity in other
OSP courses.
Course
availability
through
several formats
for
instructional
delivery
Courses
available
through
independent
study format
and
BlackBoard
educational
platform
The OSP has
identified four
(4) courses that
students can
enroll as
independent
study format.
The use of the
BlackBoard
educational
platform has
been
incorporated in
60% of OSP
courses.
The OSD
Committee for
Courses Design in
BlackBoard and
Elluminate was
appointed to
promote faculty
participation and
training in
designing courses
through these
educational
platforms.
According to a
survey
administered in
May 2010, 96%
of students is very
satisfied or
satisfied with the
use of BlackBoard
in OSP courses.
The OSP
continues with
instructional
delivery
through several
formats to meet
the needs and
preferences of
the OSP
students.
The OSD plans
to survey the
students’
preference for
the offering of
hybrid and
online courses.

37
Standard 6, Criterion 6.1.3
Table 6.9 presents the Common Professional Components for the OSP as the new curricular sequence.
Table 6.9: Common Professional Components Compliance through the OSP New Curricular Sequence
Core Courses
Hour Class Sessions by Common Professional Component
a1
MKT
a2
FIN
a3
ACC
a4
MGT
b1
LAW
b2
ECO
b3
ETH
b4
GLO
c1
IS
c2
STAT/
QUANT
d
POL/
COMP
Total
SOFI XXXX – Document
Production Basic Level 3 60 63
SOFI XXXX –
Document Production
Intermediate Level
3 60 63
SOFI 3327 –
Spanish Transcription 2 2 30 34
SOFI XXXX –Document
Production Advanced Level 7 7 6 6 6 2 55 1 90
SOFI 3305-3306 – Information
Processing
Information Processing Lab
6 8 60 10 84
SOFI 3017 –
Interpersonal Relations in the
Office
7 3 6 6 22
SOFI 3015 –
Office Systems Concepts and
Technologies
3 6 10 45 64
SOFI 4005 –Programs Integration
for Electronic Processing of
Information
6 8 60 10 84
SOFI XXXX – Administrative
Procedures for Office
Professionals
3 24 2 5 6 4 44
SOFI 3210 –
Records Management 4 3 6 13
SOFI XXXX –Accounting
Procedures for Office
Professionals
3 60 2 1 3 20 3 5 96
SOFI 4038 –
Office Administration 45 6 6 4 3 64
SOFI 4030 – Desktop Publishing 45 45
SOFI 4985 –
Internship and Seminar 4 2 2 15 6 8 84 200 321

38
Table 6.9: Common Professional Components Compliance through the OSP New Curricular Sequence
Core Courses
Hour Class Sessions by Common Professional Component
a1
MKT
a2
FIN
a3
ACC
a4
MGT
b1
LAW
b2
ECO
b3
ETH
b4
GLO
c1
IS
c2
STAT/
QUANT
d
POL/
COMP
Total
SOFI 4040 – Planning and
Implementation of Office Systems 4 10 2 3 3 1 45 68
SOFI 4505 – Training Techniques
for In-service Personnel 2 2 4 2 2 3 20 3 26 64
MATE 3041 – Introductory
Mathematics 45 45
MERC XXXX –Basic Principles
of Marketing for Office
Professionals 18 4 2 2 2 2 30
ECON XXXX –Basic Principles
of Economics for Office
Professionals 20 20
ESTA XXXX –Basic Principles of
Statistics for Office Professionals 15 15
FINA XXXX –Basic Principles of
Finance for Office Professionals 15 15
Totals 31 36 80 117 30 31 70 35 590 89 234 1,343
Table 6.10: Bachelor’s Degree Credits for the OSP New Curricular Sequence
Major General
Education
Business
(Office System) General
Electives
Total Credit
Hours Required
for Graduation Core Requirements
Requirements
Beyond Core
Business
Courses
Office
Systems
33 credit
hours 61 credit hours 20 credit hours 4 credit hours
12 credit
hours 130

39
APPENDIX A: NOTE STANDARD #4, MEASUREMENT AND ANALYSIS OF STUDENT LEARNING AND PERFORMANCE, CRITERION 4.2
The ACBSP evaluation team that evaluated the Office System Bachelor Program included a note in the Evaluation Report indicating that the Major Field
Test was given during the fall of 2009 to 14 students and recommending that the assessment be tracked.
The OSP Accreditation Committee continued administering the MFT to graduating students enrolled in the capstone course SOFI 4985 – Internship and
Seminar. Table A-1 shows the results obtained from 2009-2010 academic year to 2011-2012.
Table A-1: Associate Degree Business Major Field Test Results of UPR-Ponce OS Program
Semester
Academic Year
Number of
Students Accounting Marketing Management Economics
Semester
Average
Annual
Average
August – Dec 2009 13 27% 28% 32% 36% 31%
30% January-May 2010 15 26% 25% 29% 36% 29%
Average 14 27% 27% 31% 36% 30%
August – Dec 2010 13 30% 31% 34% 35% 33%
33% January – May 2011 18 32% 33% 27% 35% 32%
Average 16 31% 32% 31% 35% 33%
August – Dec 2011 14 25% 27% 32% 33% 29% 29%
The OSP current curriculum includes two courses in the area of administration and one course in accounting. In the revised OSP, the credit hours for the
accounting course were increased from 45 to 60 hours. It also includes a one-credit hour course for each of the following areas: marketing, economics,
finance, and statistics.
Based on the 2009-2010 Business MFT results, the OSP Accreditation Committee has been coordinating coaching workshops in the areas of accounting,
marketing, and economics since 2010-2011 academic year. Students assessed the workshops regarding its usefulness while answering the Business MFT.
Results revealed that 73% of students was very satisfied or satisfied with the workshops. Other results showed that 65% of students stated that the
workshops were helpful when answering the MFT, and 84% of students recommended continuing offering the workshops. The 2010-2011 Business MFT
results revealed an increase in the average percentage for accounting and marketing, when compared to 2009-2010 percentages. When comparing first
semester of 2011-2012 to each semester of 2009-2010 and 2010-2011 academic years, the results were similar to one of the semesters, but lower than the
other three semesters. The OSP Curriculum and Accreditation Committees are in the process of implementing the new curricular sequence in August 2012.
The one-credit courses in the areas of economics, marketing and finance will allow students to strengthen their knowledge in those areas. The OSP Faculty
continues reinforcing management concepts in OSP courses.
The OSP has been complying with the administration of the Business MFT and maintaining a tracking of the results. Therefore, we request the removal of
the Note for Standard #4, Measurement and Analysis of Student Learning and Performance, Criterion 4.2.

40
APPENDIX B: NOTE STANDARD #5, FACULTY AND STAFF FOCUS, CRITERIONS 5.3 AND 5.4
The ACBSP Office System Bachelor Program evaluation team included a note in the Evaluation Report indicating that UPRP will need to provide evidence
of student learning outcomes and student and stakeholder satisfaction to support rationale for not adhering to historical criteria and/or show results of plan
to increase doctorally qualified faculty.
Information included in Standards 3 and 4 provides sufficient evidence of stakeholder’s and students’ satisfaction with OSP and student learning outcomes
that support the rationale for not adhering to historical criteria. Program’s Faculty reflects an adequate mix of professionally and doctorally qualified
faculty and their qualifications are appropriate for meeting program’s mission and goals. Faculty credentials respond to the OSP’s mission which is to
deliver a curriculum at the undergraduate level, theoretically sound and directly pertinent, that facilitates and promotes the students’ integral development.
Since 2006-2007 academic year, Article 42 (as amended) of the UPR General By-Laws established that for a faculty position the candidate should have
obtained a doctorate degree or an equivalent terminal title in the discipline to be taught, from an accredited institution of higher education. According to
this institutional law, and to comply with ACBSP requirements, the OSP Human Resource Plan states that the candidate for a faculty position should have
obtained a doctorate degree. Currently a full-time professor is in the process of completing the doctoral degree. Therefore, we request the removal of the
Note for Standard #5, Faculty and Staff Focus, Criterions 5.3 and 5.4.
APPENDIX C: CONDITION ON STANDARD #6, EDUCATIONAL AND BUSINESS PROCESS MONITORING
The ACBSP Office System Bachelor Program evaluation team included a condition in the Evaluation Report indicating that UPR-Ponce needs to
demonstrate improvement in the following areas: 1) assessment of the new curriculum for OSP after full implementation, 2) deployment of quantitative
data to analyze the effectiveness of program improvement measures and assessment, and 3) analysis of retention rate with plan to continually monitor for
improvement.
Assessment of the new curriculum for OSP after full implementation
The OSP curricular sequence was revised. It was submitted in August 2010 to the UPR Vice Presidency of Academic Affairs (VPAA) at the systemic
level. In February 2011, the OSP Department Head received the VPAA feedback recognizing it as a curricular revision with minor changes. The UPR-
Ponce Dean of Academic Affairs submitted it to the UPR-Ponce Academic Senate for its recommendations before implementation. The UPR-Ponce
Academic Senate reviewed the curricular sequence and in November 2011issued Certification 2011-2012-28 to allow its implementation.
The OSP Accreditation Committee in collaboration with the Curriculum Committee coordinated the new curricular sequence disclosure among students
and of other implementation processes. On February 8, 2012, the OSP Department Head called to a student’s assembly to inform about the new curricular
sequence. The students have had a reflection period to decide to stay in the current curriculum or change. The Committees developed an adjusted curricular
sequence for sophomore and junior students that decided to change from the current curriculum to the new one. During the academic counseling process for
the first semester of 2012-2013 academic year, the students will sign an agreement to establish their selection of the two options: to stay in the current
curriculum or change to the new curricular sequence.

41
The new curricular sequence will begin in August 2012. After five years, the OSD will assess the effectiveness of the curriculum implemented, as stated in
Certification No. 43 (2006-2007) of the UPR Board of Trustees.
Deployment of quantitative data to analyze the effectiveness of program improvement measures and assessment
The OSP Faculty is committed to comply with the assessment activities until closing the loop. At the end of each academic year, the OSP Faculty meets to
evaluate and review the assessment results and identify actions to be taken when the success indicator is not accomplished, when the data reflects a
decrease in the percentage of students who attains the performance measure or when Faculty’s target is to increase the percentage of students who
accomplish the performance measure. Those actions are evaluated to determine their effectiveness. If the actions are not effective, the Faculty develops
other strategies for students learning improvement. Table XX presents some examples of competencies assessment activities, results, actions taken, and
analysis of those actions.
Table C-1: Competencies Assessment Activities, Results, Actions Taken, and Analysis of Actions Taken
Competency Result Action Taken Analysis of Action Taken
Technological Skills
Course: SOFI 4005
Performance measure:
Seventy five percent (75%) of
students will obtain 75% or
more in technological skills
assessment
The performance measure was
attained, as stated in the assessment
plan.
The technological skills were
reinforced in SOFI 3305 through
more practical exercises.
Although the success indicator was
attained in 2011-2012 academic
year, the percentage of students who
attained the success indicator
decreased. After analyzing the
assessment results, it was found that
the major difficulty in SOFI 4005
was the preparation of the Excel
exercises in which students need to
perform mathematical operations.
The Faculty in charge of the course
has determined that it is necessary to
increase the hours assigned in the
course to the development of this
skill.
Basic Business Principles
Knowledge in Global
Environment
Course: SOFI 4038
Performance measure:
The performance measure was
attained, as stated in the assessment
plan.
The course content of basic business
principles in global environment was
reinforced through the use of
strategies as quizzes, oral
presentations, research papers, case
studies, teamwork, and providing
students written material.
Although the performance measure
was attained, the percentage of
students who attained the success
indicator showed a slight decrease
during 2010-2011 academic year.
The strategies integrated to the
learning and teaching process

42
Table C-1: Competencies Assessment Activities, Results, Actions Taken, and Analysis of Actions Taken
Competency Result Action Taken Analysis of Action Taken
Sixty five percent (65%) of
students will obtain 70% or
more in the assessment of basic
business principles knowledge
in global environment
demonstrated to be effective. During
2011-2012 academic year, the
percentage of students who attained
the performance measure increased
by 4% in comparison to 2010-2011
academic year.
Civic Values
Course: SOFI 4985 (Capstone
Course)
Performance measure:
Eighty five percent (85%) of
students will obtain 90% or
more in civic values
assessment
The performance measure was
attained, as stated in the assessment
plan.
The civic values were reinforced in
SOFI 4985 through the use of
strategies as the presentation of
community service projects
completed by students enrolled in
the course during the previous
semester, and the orientation of
persons with experience in
community service projects.
The strategies integrated to the
learning and teaching process
demonstrated to be effective. During
2011-2012 academic year, the
percentage of students who attained
the performance measure increased
by 17% in comparison to 2009-2010
academic year.
Comparative information and data analysis are continuously reviewed by OSP Faculty to improve its deployment and the effectiveness in promoting
program mission, goals, and objectives attainment. Periodically, the Program conducts surveys to identify program strengths and weaknesses and to
determine performance improvements needed to achieve program’s targets. The OSP receives feedback from graduating students, alumni, employers,
external reviewers, and interns’ supervisors. The comparative information and data are obtained from measurement instruments as:
Business Major Field Test developed by ETS (BMFT)
Internship performance assessment
Employers’ evaluation of OSP alumni competencies
Alumni evaluation of OSP competencies attainment
Retention rates
Graduation rates
The OSP Faculty meets periodically to evaluate and review comparative information and data used by the Program to improve its effectiveness. A result
sustained from the analysis of comparative data serves as a framework for revising program targets and benchmarks and for developing strategies and
improvements required to achieve the goals.
The OSP Assessment Plan was implemented during 2009-2010 academic year. Assessment activities have been completed as stated in the Plan. This
provides the opportunity to accumulate comparable historical data assessment results for a three-year period. The OSP Faculty has decided to revise the

43
plan and the instruments designed after a cycle of three years. The OSP Faculty has submitted recommendations for the revision of some instruments:
comprehensive tests, rubrics, and case studies, among others. After an analysis of the process of gathering data, the OSP Faculty identified the need of
developing a system to securely maintain the assessment information. A template was designed in Excel to compile assessment data. At the end of each
academic semester, the OSP Faculty completes the template according to the competency assessed and provides the data with the evidence to the OSP
Assessment Committee.
Analysis of retention rate with plan to continually monitor for improvement
The OSD Faculty is aware of continually to monitor its retention rate for improvement and has developed a plan. Figure C-1 presents the stages included
in the plan.
Figure C-1: Retention Rate Plan to Continually Monitor for Improvement
Request retention data from UPR-Ponce Office
of Planning and Institutional Research
(OPIR)
Identify students on probation through the
Counseling and Guidance Department
Organize the data in comparative tables in
Excel
Meet with UPR-Ponce professional counselor assigned to advice the students on probation
Discuss retention data with OSP Faculty at
departmental meetings
Provide recommendations to
OSP Students Retention Committee
Develop a students retention plan
Implement retention strategies
Assess retention plan's effectiveness

44
The OSP Faculty annually gathers retention rate data from the Office of Planning and Institutional Research (OPIR) and analyzes it. Based on the data, the
Retention Committee determines specific actions with the purpose of improving the rates.
Some of the strategies developed to impact freshmen to increase the retention rates are:
conduct workshops for adjusting to university life
provide mentoring and tutoring programs on basic skills
have dialogues to know their experiences within the Institution and the Program and to identify areas that need to be improved or need to be taken
into consideration for student retention
organize motivational orientations provided by alumni
promote students’ participation in OSP extracurricular activities
identify on time students who need support and intervene with them
ensure academic advising’s quality
encourage students’ participation in tutoring/mentoring services
Other strategies that the OSP Retention Committee is considering are:
promote students’ development of strong ties with the UPR-Ponce
improve students’ experience in the university
monitor students’ progress
During the academic advising process, the OSP Faculty encourages students to maintain in the Program, asks about their experience in the Program, and
shares with them information about the support services available in the institution. Also, students that need help are referred to the Counseling and
Guidance Department where professional counselors and psychologists are available to advise them.
The OSP Faculty is committed to explore the reasons for the decrease of the OSP retention rates for the past two years. The Retention Committee is
conducting a study to determine the reasons for leaving and will use the results to develop strategies to address the reasons presented by students. The
Committee is currently revising the OSP Retention Plan developed in 2009-2010 academic year.
The OSP has been very proactive in analyzing its retention rates and has a formal plan for its monitoring and improvement.
After explaining and providing the necessary documentation for addressing the condition placed for Standard 6-Educational and Business Process
Management, we request the removal of the condition.