Embed Size (px)
Citation preview
QANTAS AIRWAYS LIMITED AND ITS CONTROLLED ENTITIES
PRELIMINARY FINAL REPORT FOR THE FINANCIAL YEAR ENDED 30 JUNE 2015
ABN: 16 009 661 901
ASX CODE: QAN
QANTAS AIRWAYS LIMITED PRELIMINARY FINAL REPORT
ABN: 16 009 661 901 YEAR ENDED 30 JUNE 2015
Page 1
Table of Contents
ASX Appendix 4E – Preliminary Final Report Results for Announcement to the Market 2 Other Information 15 Consolidated Income Statement 17 Consolidated Statement of Comprehensive Income 18 Consolidated Balance Sheet 19 Consolidated Statement of Changes in Equity 20 Consolidated Cash Flow Statement 22 Notes to the Preliminary Final Report 23
Additional Information Operational Statistics 37
QANTAS AIRWAYS LIMITED PRELIMINARY FINAL REPORT
ABN: 16 009 661 901 YEAR ENDED 30 JUNE 2015
Page 2
RESULTS FOR ANNOUNCEMENT TO THE MARKET Qantas Airways Limited (Qantas) and its controlled entities (the Qantas Group or Group) Results for Announcement to the Market are detailed below.
June 2015 $M
June 2014 $M
Change $M
Change %
Revenue and other income 15,816 15,352 464 3.0
Statutory profit/(loss) after tax 560 (2,843) 3,403 >100
Statutory profit/(loss) after tax attributable to members of Qantas
557 (2,843) 3,400 >100
Underlying profit before tax 975 (646) 1,621 >100
DIVIDENDS
No interim dividend was paid in relation to the year ended 30 June 2015.
No final dividend will be paid in relation to the year ended 30 June 2015.
The information provided in this report contains all the information required by ASX Listing Rule 4.3A.
EXPLANATION OF RESULTS
The Qantas Group reported an Underlying Profit Before Tax1 of $975 million for the 12 months ended 30 June 2015, an
improvement of over $1.6 billion from 2013/2014. The Group’s Statutory Profit After Tax of $560 million included $186 million of costs which were not included in Underlying PBT
1 primarily driven by redundancies, restructuring and other
costs associated with the Qantas Transformation program.
The Underlying PBT result is a strong turnaround from the 2013/2014 financial year, driven by cost and revenue benefits2
from the Qantas Transformation program and a more favourable operating environment. Qantas continued to deliver on all of its major strategic and operational commitments over the 2014/2015 financial year, resulting in the rapid recovery in earnings and return to a strong balance sheet position.
The Qantas Transformation program was the major driver of the result delivering benefits of $894 million. Other drivers of the result included:
Improved Revenue per ASK3
Reduced fuel cost, benefiting from lower AUD fuel prices
The positive impact of reduced depreciation expense resulting from the non-cash write down of Qantas International Fleet in 2013/2014 and the removal of the carbon tax
Qantas takes a disciplined approach to continually reviewing its optimal capital structure and, where there is surplus capital, to assess how to enhance shareholder value with the appropriate mix of growth and shareholder returns. Having returned to our optimal capital structure as at the end of 2014/2015, a $505 million capital return was declared.
The shareholder distribution is in the form of 23 cents per share capital return combined with a share consolidation. Subject to a final Australian Taxation Office ruling, the entire $505 million will be treated as a capital return, enabling a highly tax efficient distribution with no tax payable by shareholders on receipt of the cash return. Subject to shareholder approval at Qantas’ Annual General Meeting in October 2015, the 23 cents per share payment will be made in November 2015.
1 Underlying Profit Before Tax (Underlying PBT) is the primary reporting measure used by the Qantas Group’s chief operating decision-making bodies,
being the Chief Executive Officer, Group Management Committee and the Board of Directors, for the purpose of assessing the performance of the Group. The primary reporting measure of the Qantas International, Qantas Domestic, Jetstar Group, Qantas Loyalty and Qantas Freight operating segments is Underlying Earnings Before Net Finance Costs and Tax (Underlying EBIT). The primary reporting measure of the Corporate segment is Underlying PBT as net finance costs are managed centrally. Refer to the reconciliation of Underlying PBT to Statutory Profit/(Loss) Before Tax.
2 Any incremental costs associated with revenue benefits are netted in the overall cost benefits attributed to the Qantas Transformation program. 3 Passenger Revenue per Available Seat Kilometre.
QANTAS AIRWAYS LIMITED PRELIMINARY FINAL REPORT
ABN: 16 009 661 901 YEAR ENDED 30 JUNE 2015
Page 3
EXPLANATION OF RESULTS (continued)
Strategic highlights of the 2014/2015 financial year included:
Qantas Transformation continuing to drive permanent shift in cost base and competitive position
Disciplined capital allocation facilitated debt reduction and recommencement of shareholder returns
Investment in product and innovation strengthened the Group’s leading market positions
Focus on engaging our people and improving workplace culture
Management of external volatility with robust hedging program, capacity and capital expenditure flexibility
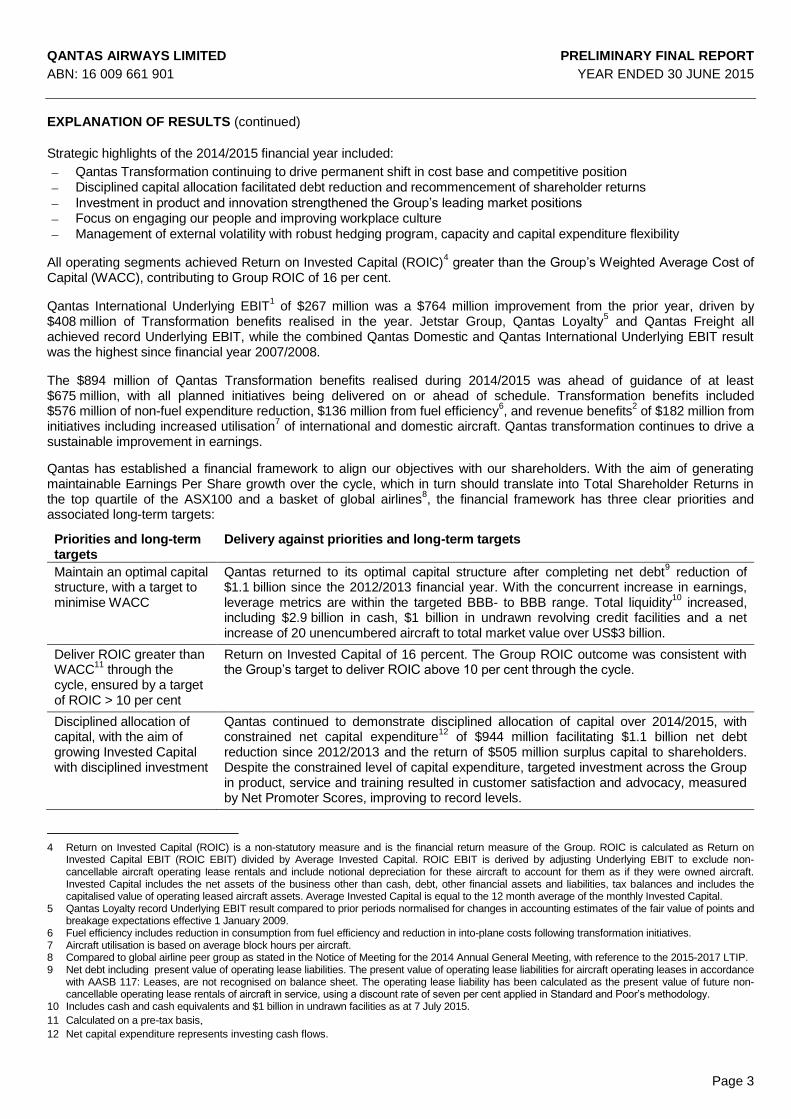
All operating segments achieved Return on Invested Capital (ROIC)4 greater than the Group’s Weighted Average Cost of
Capital (WACC), contributing to Group ROIC of 16 per cent.
Qantas International Underlying EBIT1 of $267 million was a $764 million improvement from the prior year, driven by
$408 million of Transformation benefits realised in the year. Jetstar Group, Qantas Loyalty5 and Qantas Freight all
achieved record Underlying EBIT, while the combined Qantas Domestic and Qantas International Underlying EBIT result was the highest since financial year 2007/2008.
The $894 million of Qantas Transformation benefits realised during 2014/2015 was ahead of guidance of at least $675 million, with all planned initiatives being delivered on or ahead of schedule. Transformation benefits included $576 million of non-fuel expenditure reduction, $136 million from fuel efficiency
6, and revenue benefits
2 of $182 million from
initiatives including increased utilisation7 of international and domestic aircraft. Qantas transformation continues to drive a
sustainable improvement in earnings.
Qantas has established a financial framework to align our objectives with our shareholders. With the aim of generating maintainable Earnings Per Share growth over the cycle, which in turn should translate into Total Shareholder Returns in the top quartile of the ASX100 and a basket of global airlines
8, the financial framework has three clear priorities and
associated long-term targets:
Priorities and long-term targets
Delivery against priorities and long-term targets
Maintain an optimal capital structure, with a target to minimise WACC
Qantas returned to its optimal capital structure after completing net debt9 reduction of
$1.1 billion since the 2012/2013 financial year. With the concurrent increase in earnings, leverage metrics are within the targeted BBB- to BBB range. Total liquidity
10 increased,
including $2.9 billion in cash, $1 billion in undrawn revolving credit facilities and a net increase of 20 unencumbered aircraft to total market value over US$3 billion.
Deliver ROIC greater than WACC
11 through the
cycle, ensured by a target of ROIC > 10 per cent
Return on Invested Capital of 16 percent. The Group ROIC outcome was consistent with the Group’s target to deliver ROIC above 10 per cent through the cycle.
Disciplined allocation of capital, with the aim of growing Invested Capital with disciplined investment
Qantas continued to demonstrate disciplined allocation of capital over 2014/2015, with constrained net capital expenditure
12 of $944 million facilitating $1.1 billion net debt
reduction since 2012/2013 and the return of $505 million surplus capital to shareholders. Despite the constrained level of capital expenditure, targeted investment across the Group in product, service and training resulted in customer satisfaction and advocacy, measured by Net Promoter Scores, improving to record levels.
4 Return on Invested Capital (ROIC) is a non-statutory measure and is the financial return measure of the Group. ROIC is calculated as Return on
Invested Capital EBIT (ROIC EBIT) divided by Average Invested Capital. ROIC EBIT is derived by adjusting Underlying EBIT to exclude non-cancellable aircraft operating lease rentals and include notional depreciation for these aircraft to account for them as if they were owned aircraft. Invested Capital includes the net assets of the business other than cash, debt, other financial assets and liabilities, tax balances and includes the capitalised value of operating leased aircraft assets. Average Invested Capital is equal to the 12 month average of the monthly Invested Capital.
5 Qantas Loyalty record Underlying EBIT result compared to prior periods normalised for changes in accounting estimates of the fair value of points and breakage expectations effective 1 January 2009.
6 Fuel efficiency includes reduction in consumption from fuel efficiency and reduction in into-plane costs following transformation initiatives. 7 Aircraft utilisation is based on average block hours per aircraft. 8 Compared to global airline peer group as stated in the Notice of Meeting for the 2014 Annual General Meeting, with reference to the 2015-2017 LTIP. 9 Net debt including present value of operating lease liabilities. The present value of operating lease liabilities for aircraft operating leases in accordance
with AASB 117: Leases, are not recognised on balance sheet. The operating lease liability has been calculated as the present value of future non-cancellable operating lease rentals of aircraft in service, using a discount rate of seven per cent applied in Standard and Poor’s methodology.
10 Includes cash and cash equivalents and $1 billion in undrawn facilities as at 7 July 2015.
11 Calculated on a pre-tax basis. 12 Net capital expenditure represents investing cash flows.
QANTAS AIRWAYS LIMITED PRELIMINARY FINAL REPORT
ABN: 16 009 661 901 YEAR ENDED 30 JUNE 2015
Page 4
EXPLANATION OF RESULTS (continued)
The Group’s balanced scorecard through the Qantas Transformation program ensures a net benefit for the customer experience. This was seen in customer and brand highlights for the year including:
Record13
customer advocacy (NPS) results at Qantas Domestic and Qantas International
The opening of new First and Business lounges in Los Angeles
Commencement of the A330 reconfiguration program, progressively adding ‘Business Suites’ with lie-flat beds on 28 A330 family aircraft
B787 aircraft with enhanced customer offering in the Jetstar International fleet with two further aircraft already delivered since 30 June 2015
Ongoing customer service training programs completed by more than 10,000 staff
Digital innovation focused on improving speed and ease of travel including auto check-in on mobile for Qantas Domestic and next-gen online retailing and boarding at Jetstar
UNDERLYING PBT
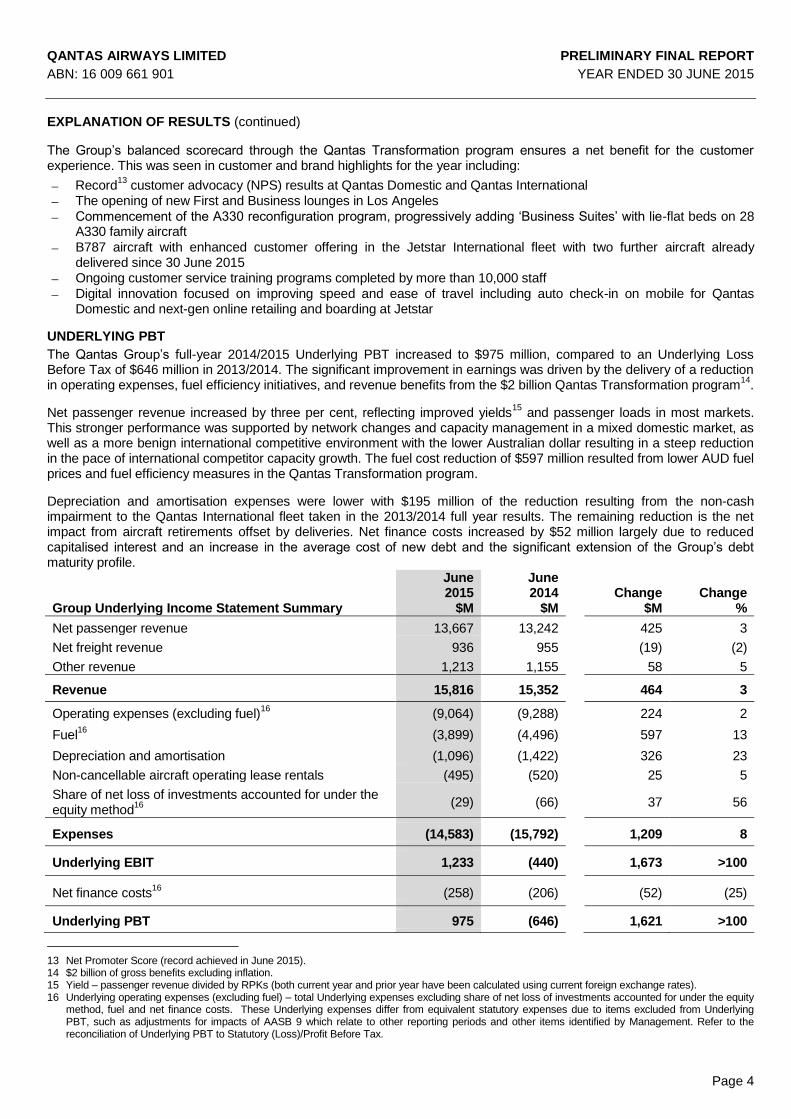
The Qantas Group’s full-year 2014/2015 Underlying PBT increased to $975 million, compared to an Underlying Loss Before Tax of $646 million in 2013/2014. The significant improvement in earnings was driven by the delivery of a reduction in operating expenses, fuel efficiency initiatives, and revenue benefits from the $2 billion Qantas Transformation program
14.
Net passenger revenue increased by three per cent, reflecting improved yields15
and passenger loads in most markets. This stronger performance was supported by network changes and capacity management in a mixed domestic market, as well as a more benign international competitive environment with the lower Australian dollar resulting in a steep reduction in the pace of international competitor capacity growth. The fuel cost reduction of $597 million resulted from lower AUD fuel prices and fuel efficiency measures in the Qantas Transformation program.
Depreciation and amortisation expenses were lower with $195 million of the reduction resulting from the non-cash impairment to the Qantas International fleet taken in the 2013/2014 full year results. The remaining reduction is the net impact from aircraft retirements offset by deliveries. Net finance costs increased by $52 million largely due to reduced capitalised interest and an increase in the average cost of new debt and the significant extension of the Group’s debt maturity profile.
Group Underlying Income Statement Summary
June 2015
$M
June 2014
$M
Change
$M
Change
%
Net passenger revenue
13,667 13,242 425 3
Net freight revenue
936 955 (19) (2)
Other revenue
1,213 1,155 58 5
Revenue 15,816 15,352 464 3
Operating expenses (excluding fuel)16
(9,064) (9,288) 224 2
Fuel16
(3,899) (4,496) 597 13
Depreciation and amortisation (1,096) (1,422) 326 23
Non-cancellable aircraft operating lease rentals (495) (520) 25 5
Share of net loss of investments accounted for under the equity method
16
(29) (66)
37 56
Expenses (14,583) (15,792) 1,209 8
Underlying EBIT
1,233 (440) 1,673 >100
Net finance costs16
(258) (206) (52) (25)
Underlying PBT 975 (646) 1,621 >100
13 Net Promoter Score (record achieved in June 2015). 14 $2 billion of gross benefits excluding inflation. 15 Yield – passenger revenue divided by RPKs (both current year and prior year have been calculated using current foreign exchange rates).
16 Underlying operating expenses (excluding fuel) – total Underlying expenses excluding share of net loss of investments accounted for under the equity method, fuel and net finance costs. These Underlying expenses differ from equivalent statutory expenses due to items excluded from Underlying PBT, such as adjustments for impacts of AASB 9 which relate to other reporting periods and other items identified by Management. Refer to the reconciliation of Underlying PBT to Statutory (Loss)/Profit Before Tax.
QANTAS AIRWAYS LIMITED PRELIMINARY FINAL REPORT
ABN: 16 009 661 901 YEAR ENDED 30 JUNE 2015
Page 5
EXPLANATION OF RESULTS (continued)
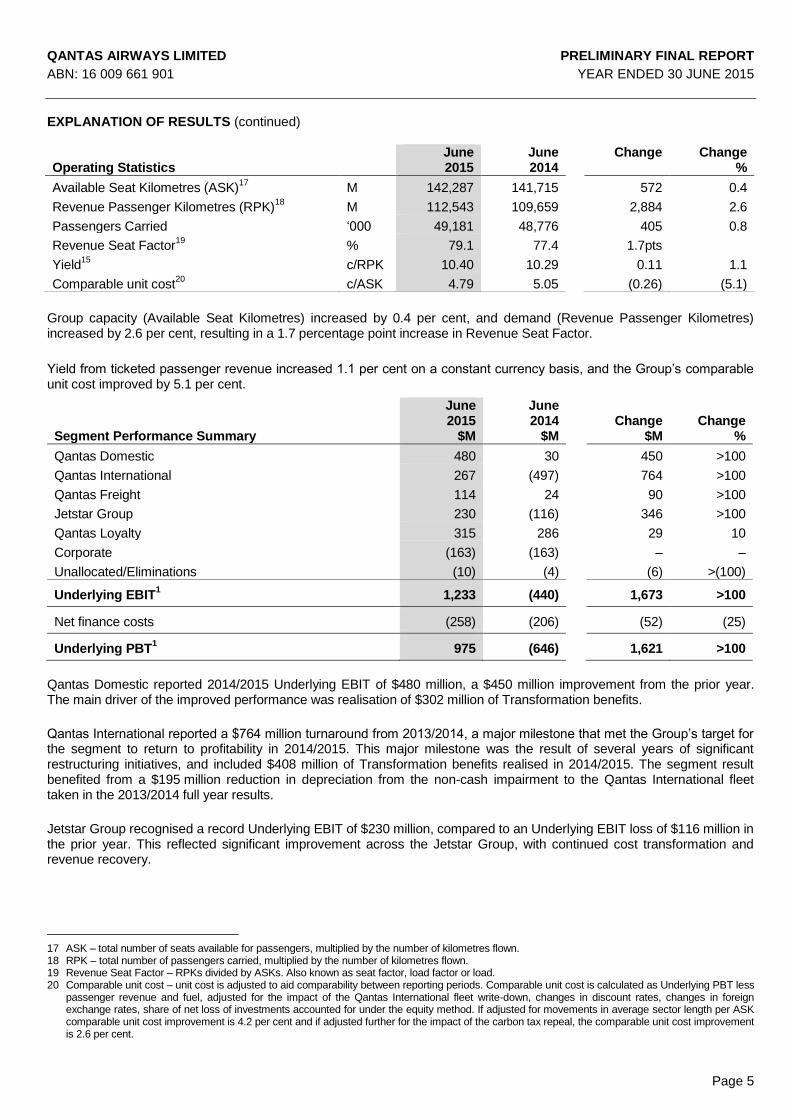
Operating Statistics June
2015 June 2014
Change
Change %
Available Seat Kilometres (ASK)17
M 142,287 141,715 572 0.4
Revenue Passenger Kilometres (RPK)18
M 112,543 109,659 2,884 2.6
Passengers Carried ‘000 49,181 48,776 405 0.8
Revenue Seat Factor19
% 79.1 77.4 1.7pts
Yield15
c/RPK 10.40 10.29 0.11 1.1
Comparable unit cost20
c/ASK 4.79 5.05 (0.26) (5.1)
Group capacity (Available Seat Kilometres) increased by 0.4 per cent, and demand (Revenue Passenger Kilometres) increased by 2.6 per cent, resulting in a 1.7 percentage point increase in Revenue Seat Factor.
Yield from ticketed passenger revenue increased 1.1 per cent on a constant currency basis, and the Group’s comparable unit cost improved by 5.1 per cent.
Segment Performance Summary
June 2015
$M
June 2014
$M
Change
$M
Change
%
Qantas Domestic 480 30 450 >100
Qantas International 267 (497) 764 >100
Qantas Freight 114 24 90 >100
Jetstar Group 230 (116) 346 >100
Qantas Loyalty 315 286 29 10
Corporate (163) (163) – –
Unallocated/Eliminations (10) (4) (6) >(100)
Underlying EBIT1 1,233 (440) 1,673 >100
Net finance costs (258) (206) (52) (25)
Underlying PBT1 975 (646) 1,621 >100
Qantas Domestic reported 2014/2015 Underlying EBIT of $480 million, a $450 million improvement from the prior year. The main driver of the improved performance was realisation of $302 million of Transformation benefits.
Qantas International reported a $764 million turnaround from 2013/2014, a major milestone that met the Group’s target for the segment to return to profitability in 2014/2015. This major milestone was the result of several years of significant restructuring initiatives, and included $408 million of Transformation benefits realised in 2014/2015. The segment result benefited from a $195 million reduction in depreciation from the non-cash impairment to the Qantas International fleet taken in the 2013/2014 full year results.
Jetstar Group recognised a record Underlying EBIT of $230 million, compared to an Underlying EBIT loss of $116 million in the prior year. This reflected significant improvement across the Jetstar Group, with continued cost transformation and revenue recovery.
17 ASK – total number of seats available for passengers, multiplied by the number of kilometres flown. 18 RPK – total number of passengers carried, multiplied by the number of kilometres flown. 19 Revenue Seat Factor – RPKs divided by ASKs. Also known as seat factor, load factor or load. 20 Comparable unit cost – unit cost is adjusted to aid comparability between reporting periods. Comparable unit cost is calculated as Underlying PBT less
passenger revenue and fuel, adjusted for the impact of the Qantas International fleet write-down, changes in discount rates, changes in foreign exchange rates, share of net loss of investments accounted for under the equity method. If adjusted for movements in average sector length per ASK comparable unit cost improvement is 4.2 per cent and if adjusted further for the impact of the carbon tax repeal, the comparable unit cost improvement is 2.6 per cent.
QANTAS AIRWAYS LIMITED PRELIMINARY FINAL REPORT
ABN: 16 009 661 901 YEAR ENDED 30 JUNE 2015
Page 6
EXPLANATION OF RESULTS (continued)
Qantas Loyalty Underlying EBIT increased 10 per cent to a record $315 million, driven by a five per cent increase in billings
21 and the growth of new and adjacent business ventures including Qantas Cash, Aquire, Accumulate and Red
Planet.
Qantas Freight reported record Underlying EBIT of $114 million, with Transformation benefits of $38 million and yield22
reductions offset by higher loads.
DISCIPLINED INVESTMENT TO ENHANCE LONG-TERM SHAREHOLDER VALUE
With the Group having returned to its optimal capital structure, and no further net debt reduction required, disciplined investment will grow Invested Capital over time and maximise long-term shareholder value by:
Building on the Group’s competitive advantages
Integrated portfolio of premier brands
Superior domestic market position
Improving customer experience
Leveraging customer insights
Positioning the Group to succeed in future growth markets
Loyalty growth initiatives
Jetstar in Asia
Strengthening long-term Group ROIC
Next-generation fleet
Transformation
Aligning with our brand values and vision
QANTAS TRANSFORMATION – DELIVERING AGAINST A BALANCED SCORECARD
The accelerated Qantas Transformation program is targeting the delivery of $2 billion of gross benefits by the end of financial year 2016/2017, with all milestones to date having been met or exceeded. Within the $2 billion target, the program is sized and structured to achieve important strategic outcomes.
Strategic outcomes by 2016/2017 include:
Group ex-fuel expenditure reduced by >10 per cent23
Qantas Domestic unit cost gap24
to competitor to close to <five per cent
Qantas International unit cost comparable to direct competitors
Jetstar lowest seat cost and yield advantage maintained
Consistent and improved customer experience
Embedded culture of transformation for ongoing benefits beyond 2016/2017
21 Billings represent point sales to partners. 22 Yield is calculated as freight revenue excluding foreign exchange divided by revenue freight tonne kilometres (RFTKs). 23 Target assumes steady foreign exchange rates, capacity and sector length 24 Unit cost is calculated as Underlying EBIT less passenger revenue per ASK. Qantas Domestic unit cost includes QantasLink. Competitor refers to
Virgin Australia including mainline domestic and regional operations. Virgin’s assumed domestic unit cost is based on Qantas’ internal estimates and published competitor data.
QANTAS AIRWAYS LIMITED PRELIMINARY FINAL REPORT
ABN: 16 009 661 901 YEAR ENDED 30 JUNE 2015
Page 7
EXPLANATION OF RESULTS (continued)
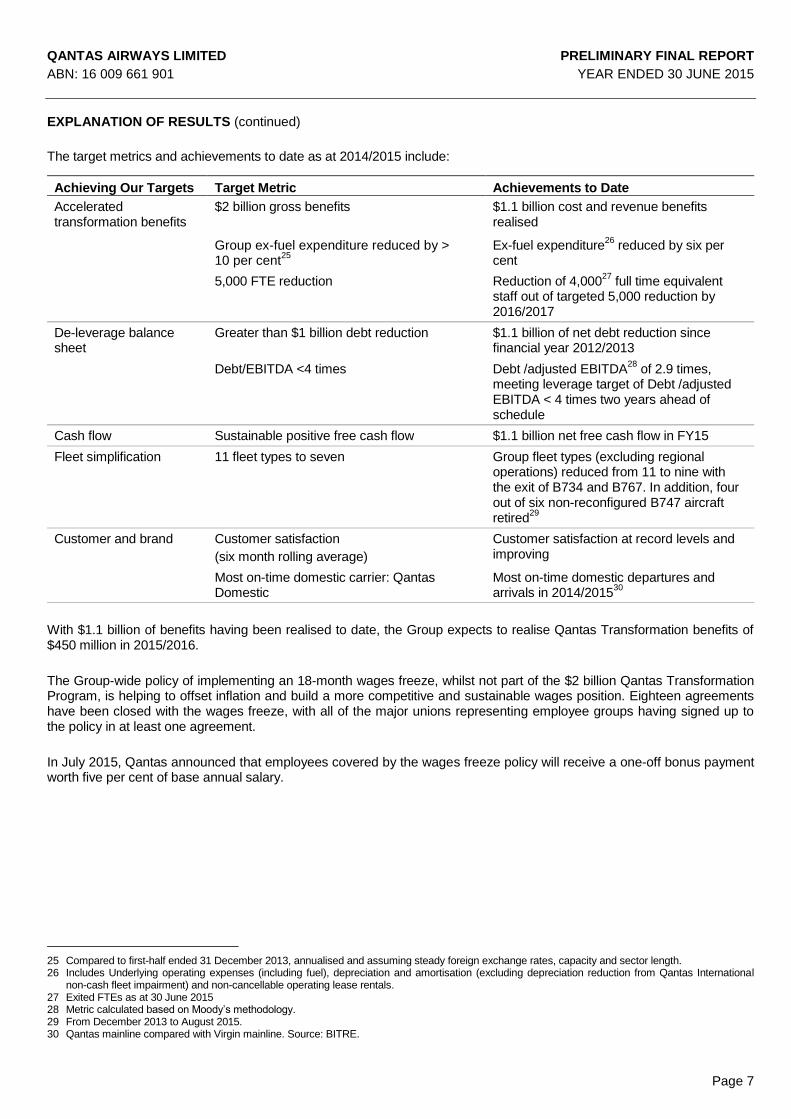
The target metrics and achievements to date as at 2014/2015 include:
Achieving Our Targets Target Metric Achievements to Date
Accelerated transformation benefits
$2 billion gross benefits
$1.1 billion cost and revenue benefits realised
Group ex-fuel expenditure reduced by > 10 per cent
25
Ex-fuel expenditure26
reduced by six per cent
5,000 FTE reduction Reduction of 4,00027
full time equivalent staff out of targeted 5,000 reduction by 2016/2017
De-leverage balance sheet
Greater than $1 billion debt reduction $1.1 billion of net debt reduction since financial year 2012/2013
Debt/EBITDA <4 times Debt /adjusted EBITDA28
of 2.9 times, meeting leverage target of Debt /adjusted EBITDA < 4 times two years ahead of schedule
Cash flow Sustainable positive free cash flow $1.1 billion net free cash flow in FY15
Fleet simplification 11 fleet types to seven Group fleet types (excluding regional operations) reduced from 11 to nine with the exit of B734 and B767. In addition, four out of six non-reconfigured B747 aircraft retired
29
Customer and brand
Customer satisfaction
(six month rolling average)
Customer satisfaction at record levels and improving
Most on-time domestic carrier: Qantas Domestic
Most on-time domestic departures and arrivals in 2014/2015
30
With $1.1 billion of benefits having been realised to date, the Group expects to realise Qantas Transformation benefits of $450 million in 2015/2016.
The Group-wide policy of implementing an 18-month wages freeze, whilst not part of the $2 billion Qantas Transformation Program, is helping to offset inflation and build a more competitive and sustainable wages position. Eighteen agreements have been closed with the wages freeze, with all of the major unions representing employee groups having signed up to the policy in at least one agreement.
In July 2015, Qantas announced that employees covered by the wages freeze policy will receive a one-off bonus payment worth five per cent of base annual salary.
25 Compared to first-half ended 31 December 2013, annualised and assuming steady foreign exchange rates, capacity and sector length. 26 Includes Underlying operating expenses (including fuel), depreciation and amortisation (excluding depreciation reduction from Qantas International
non-cash fleet impairment) and non-cancellable operating lease rentals. 27 Exited FTEs as at 30 June 2015 28 Metric calculated based on Moody’s methodology. 29 From December 2013 to August 2015. 30 Qantas mainline compared with Virgin mainline. Source: BITRE.
QANTAS AIRWAYS LIMITED PRELIMINARY FINAL REPORT
ABN: 16 009 661 901 YEAR ENDED 30 JUNE 2015
Page 8
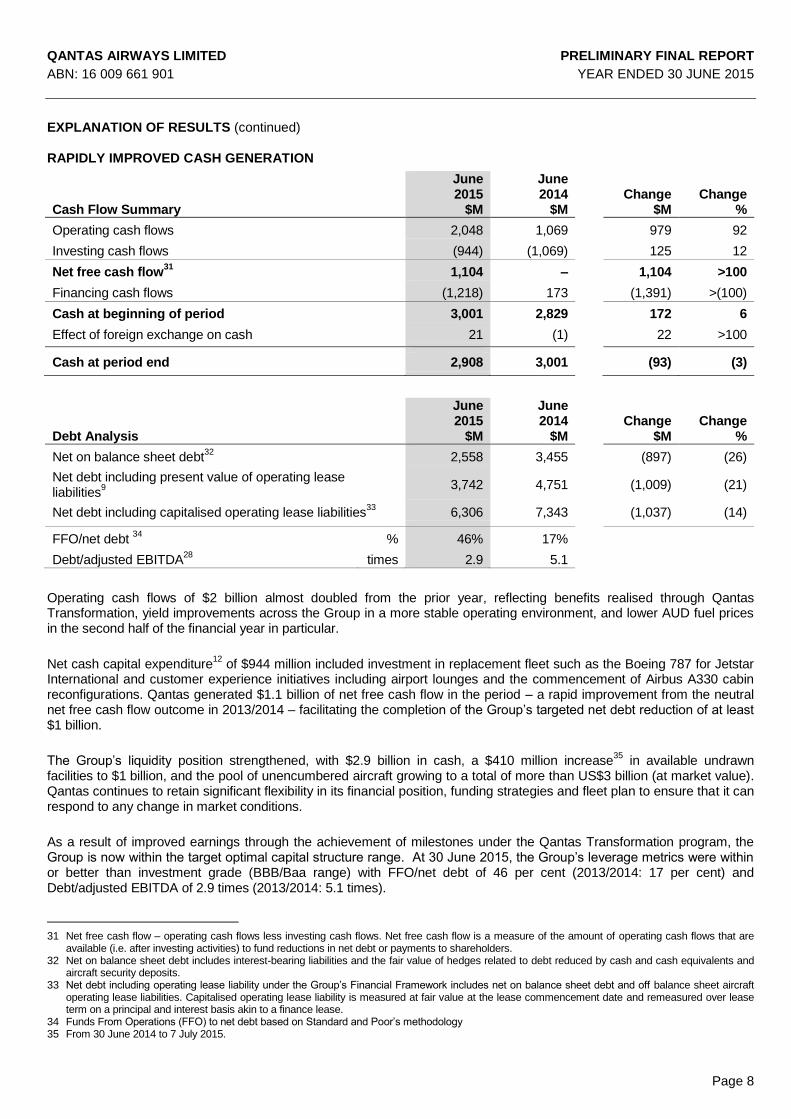
EXPLANATION OF RESULTS (continued) RAPIDLY IMPROVED CASH GENERATION
Cash Flow Summary
June 2015
$M
June 2014
$M
Change
$M
Change
%
Operating cash flows 2,048 1,069 979 92
Investing cash flows (944) (1,069) 125 12
Net free cash flow31
1,104 – 1,104 >100
Financing cash flows (1,218) 173 (1,391) >(100)
Cash at beginning of period 3,001 2,829 172 6
Effect of foreign exchange on cash 21 (1) 22 >100
Cash at period end 2,908 3,001 (93) (3)
Debt Analysis
June 2015
$M
June 2014
$M
Change
$M
Change
%
Net on balance sheet debt32
2,558 3,455 (897) (26)
Net debt including present value of operating lease liabilities
9 3,742 4,751 (1,009) (21)
Net debt including capitalised operating lease liabilities33
6,306 7,343 (1,037) (14)
FFO/net debt 34
% 46% 17%
Debt/adjusted EBITDA28
times 2.9 5.1
Operating cash flows of $2 billion almost doubled from the prior year, reflecting benefits realised through Qantas Transformation, yield improvements across the Group in a more stable operating environment, and lower AUD fuel prices in the second half of the financial year in particular.
Net cash capital expenditure12
of $944 million included investment in replacement fleet such as the Boeing 787 for Jetstar International and customer experience initiatives including airport lounges and the commencement of Airbus A330 cabin reconfigurations. Qantas generated $1.1 billion of net free cash flow in the period – a rapid improvement from the neutral net free cash flow outcome in 2013/2014 – facilitating the completion of the Group’s targeted net debt reduction of at least $1 billion.
The Group’s liquidity position strengthened, with $2.9 billion in cash, a $410 million increase35
in available undrawn facilities to $1 billion, and the pool of unencumbered aircraft growing to a total of more than US$3 billion (at market value). Qantas continues to retain significant flexibility in its financial position, funding strategies and fleet plan to ensure that it can respond to any change in market conditions.
As a result of improved earnings through the achievement of milestones under the Qantas Transformation program, the Group is now within the target optimal capital structure range. At 30 June 2015, the Group’s leverage metrics were within or better than investment grade (BBB/Baa range) with FFO/net debt of 46 per cent (2013/2014: 17 per cent) and Debt/adjusted EBITDA of 2.9 times (2013/2014: 5.1 times).
31 Net free cash flow – operating cash flows less investing cash flows. Net free cash flow is a measure of the amount of operating cash flows that are
available (i.e. after investing activities) to fund reductions in net debt or payments to shareholders. 32 Net on balance sheet debt includes interest-bearing liabilities and the fair value of hedges related to debt reduced by cash and cash equivalents and
aircraft security deposits. 33 Net debt including operating lease liability under the Group’s Financial Framework includes net on balance sheet debt and off balance sheet aircraft
operating lease liabilities. Capitalised operating lease liability is measured at fair value at the lease commencement date and remeasured over lease term on a principal and interest basis akin to a finance lease.
34 Funds From Operations (FFO) to net debt based on Standard and Poor’s methodology 35 From 30 June 2014 to 7 July 2015.
QANTAS AIRWAYS LIMITED PRELIMINARY FINAL REPORT
ABN: 16 009 661 901 YEAR ENDED 30 JUNE 2015
Page 9
EXPLANATION OF RESULTS (continued) FLEET
The Qantas Group remains committed to a fleet strategy that provides for long-term flexibility and renewal, and that prioritises Group fleet simplification. The fleet strategy is designed to support the strategic objectives of the Group’s two flying brands and the overarching targets of the Qantas Transformation program. At all times, the Group retains significant flexibility to respond to any changes in market conditions and the competitive environment.
At 30 June 2015, the Qantas Group fleet36
totalled 299 aircraft. During 2014/2015, the Group purchased 11 aircraft and leased one aircraft:
Qantas – five B737-800s, one Bombardier Q400 and one Fokker100
Jetstar (including Jetstar Asia) – four B787-8s and one A320-200
The Group removed 21 aircraft from service in 2014/2015 including three lease returns. These included 13 B767-300s, one B747-400, three A320-200s, one Q300 and three EMB120s.
The Qantas Group’s scheduled passenger fleet average age is now 7.7 years37
, below the targeted 8-10 year range. The benefits of fleet investment include improved customer satisfaction, environmental outcomes, operational efficiencies and cost reductions.
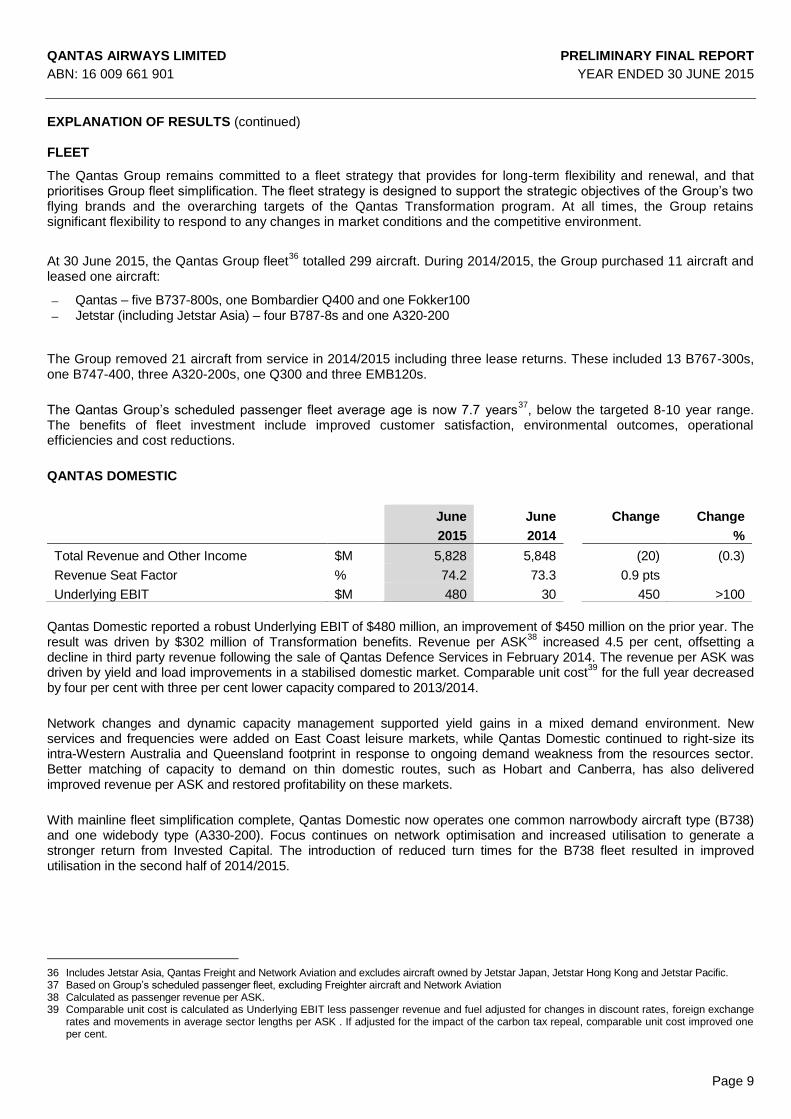
QANTAS DOMESTIC
Qantas Domestic reported a robust Underlying EBIT of $480 million, an improvement of $450 million on the prior year. The
result was driven by $302 million of Transformation benefits. Revenue per ASK38
increased 4.5 per cent, offsetting a decline in third party revenue following the sale of Qantas Defence Services in February 2014. The revenue per ASK was driven by yield and load improvements in a stabilised domestic market. Comparable unit cost
39 for the full year decreased
by four per cent with three per cent lower capacity compared to 2013/2014.
Network changes and dynamic capacity management supported yield gains in a mixed demand environment. New services and frequencies were added on East Coast leisure markets, while Qantas Domestic continued to right-size its intra-Western Australia and Queensland footprint in response to ongoing demand weakness from the resources sector. Better matching of capacity to demand on thin domestic routes, such as Hobart and Canberra, has also delivered improved revenue per ASK and restored profitability on these markets.
With mainline fleet simplification complete, Qantas Domestic now operates one common narrowbody aircraft type (B738) and one widebody type (A330-200). Focus continues on network optimisation and increased utilisation to generate a stronger return from Invested Capital. The introduction of reduced turn times for the B738 fleet resulted in improved utilisation in the second half of 2014/2015.
36 Includes Jetstar Asia, Qantas Freight and Network Aviation and excludes aircraft owned by Jetstar Japan, Jetstar Hong Kong and Jetstar Pacific. 37 Based on Group’s scheduled passenger fleet, excluding Freighter aircraft and Network Aviation 38 Calculated as passenger revenue per ASK. 39 Comparable unit cost is calculated as Underlying EBIT less passenger revenue and fuel adjusted for changes in discount rates, foreign exchange
rates and movements in average sector lengths per ASK . If adjusted for the impact of the carbon tax repeal, comparable unit cost improved one per cent.
June
2015
June
2014
Change
Change
%
Total Revenue and Other Income $M 5,828 5,848 (20) (0.3)
Revenue Seat Factor % 74.2 73.3 0.9 pts
Underlying EBIT $M 480 30 450 >100
QANTAS AIRWAYS LIMITED PRELIMINARY FINAL REPORT
ABN: 16 009 661 901 YEAR ENDED 30 JUNE 2015
Page 10
EXPLANATION OF RESULTS (continued)
Qantas Domestic increased on-time performance over the year to 88.3 per cent with the best on-time performance40
result in over ten years. With ongoing investment in the customer experience and service training for our people, customer advocacy measured by Net Promoter Score increased to a record
41 in 2014/2015.
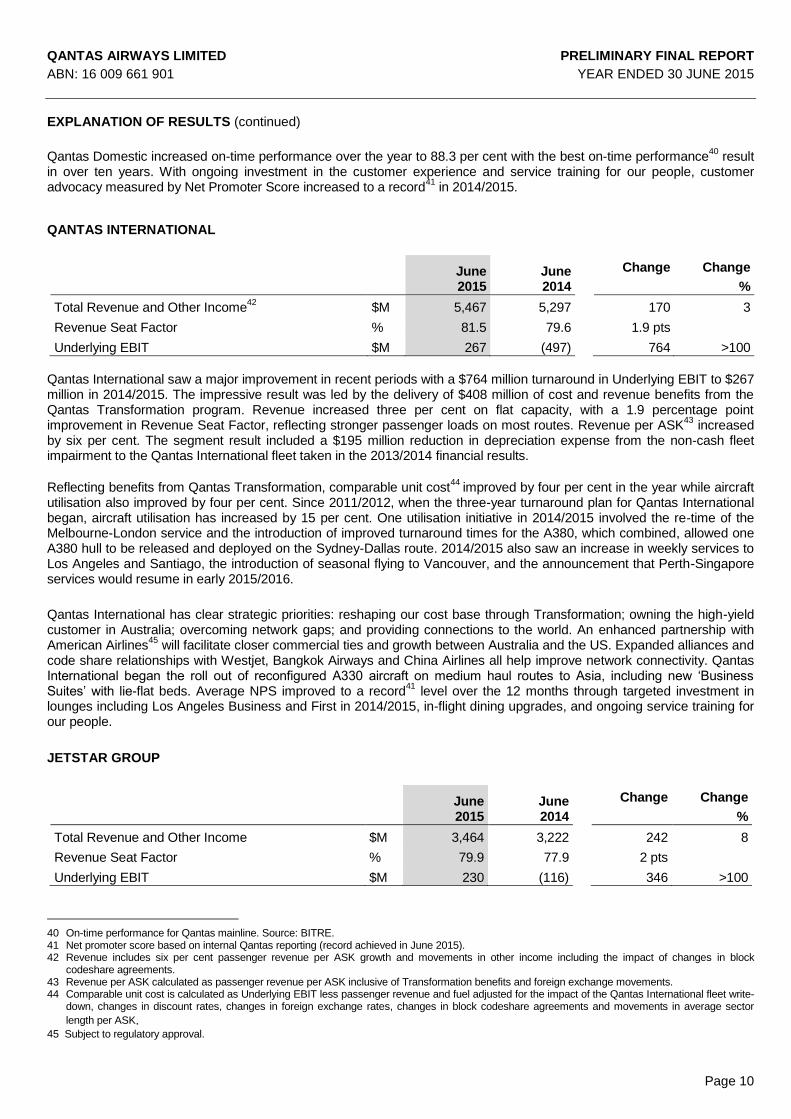
QANTAS INTERNATIONAL
June 2015
June 2014
Change
Change
%
Total Revenue and Other Income42
$M 5,467 5,297 170 3
Revenue Seat Factor % 81.5 79.6 1.9 pts
Underlying EBIT $M 267 (497) 764 >100
Qantas International saw a major improvement in recent periods with a $764 million turnaround in Underlying EBIT to $267 million in 2014/2015. The impressive result was led by the delivery of $408 million of cost and revenue benefits from the Qantas Transformation program. Revenue increased three per cent on flat capacity, with a 1.9 percentage point improvement in Revenue Seat Factor, reflecting stronger passenger loads on most routes. Revenue per ASK
43 increased
by six per cent. The segment result included a $195 million reduction in depreciation expense from the non-cash fleet impairment to the Qantas International fleet taken in the 2013/2014 financial results.
Reflecting benefits from Qantas Transformation, comparable unit cost44
improved by four per cent in the year while aircraft utilisation also improved by four per cent. Since 2011/2012, when the three-year turnaround plan for Qantas International began, aircraft utilisation has increased by 15 per cent. One utilisation initiative in 2014/2015 involved the re-time of the Melbourne-London service and the introduction of improved turnaround times for the A380, which combined, allowed one A380 hull to be released and deployed on the Sydney-Dallas route. 2014/2015 also saw an increase in weekly services to Los Angeles and Santiago, the introduction of seasonal flying to Vancouver, and the announcement that Perth-Singapore services would resume in early 2015/2016.
Qantas International has clear strategic priorities: reshaping our cost base through Transformation; owning the high-yield customer in Australia; overcoming network gaps; and providing connections to the world. An enhanced partnership with American Airlines
45 will facilitate closer commercial ties and growth between Australia and the US. Expanded alliances and
code share relationships with Westjet, Bangkok Airways and China Airlines all help improve network connectivity. Qantas International began the roll out of reconfigured A330 aircraft on medium haul routes to Asia, including new ‘Business Suites’ with lie-flat beds. Average NPS improved to a record
41 level over the 12 months through targeted investment in
lounges including Los Angeles Business and First in 2014/2015, in-flight dining upgrades, and ongoing service training for our people.
JETSTAR GROUP
40 On-time performance for Qantas mainline. Source: BITRE. 41 Net promoter score based on internal Qantas reporting (record achieved in June 2015). 42 Revenue includes six per cent passenger revenue per ASK growth and movements in other income including the impact of changes in block
codeshare agreements. 43 Revenue per ASK calculated as passenger revenue per ASK inclusive of Transformation benefits and foreign exchange movements. 44 Comparable unit cost is calculated as Underlying EBIT less passenger revenue and fuel adjusted for the impact of the Qantas International fleet write-
down, changes in discount rates, changes in foreign exchange rates, changes in block codeshare agreements and movements in average sector
length per ASK. 45 Subject to regulatory approval.
June 2015
June 2014
Change
Change
%
Total Revenue and Other Income $M 3,464 3,222 242 8
Revenue Seat Factor % 79.9 77.9 2 pts
Underlying EBIT $M 230 (116) 346 >100
QANTAS AIRWAYS LIMITED PRELIMINARY FINAL REPORT
ABN: 16 009 661 901 YEAR ENDED 30 JUNE 2015
Page 11
EXPLANATION OF RESULTS (continued) Jetstar Group reported record Underlying EBIT of $230 million, a strong turnaround from a $116 million Underlying EBIT loss in the prior year. The record performance reflected significant improvement across the Jetstar Group, with a continued focus on cost transformation and revenue recovery. Controllable unit cost
46 improved by two per cent
47, while total revenue
and other income rose eight per cent reflecting higher yields and passenger loads as well as growth in ancillary revenue.
In domestic Australia, Jetstar benefits from closer dual-brand coordination with Qantas Domestic in stabilised market conditions. Jetstar International delivered a record performance helped by the customer appeal and unit cost benefits of introducing the B787 on long haul international routes. Domestic New Zealand was profitable for Jetstar for the first time with ongoing RASK improvement over the year.
All Jetstar Group airlines in Asia reported an improvement in earnings48
, with combined losses halved compared to financial 2013/2014. Jetstar Asia (Singapore) returned to profit, Jetstar Pacific (Vietnam) was profitable
in the second half
of 2014/2015, and Jetstar Japan reported a significant reduction in losses, with strong revenue per ASK improvement and ongoing controllable unit cost
46 reduction. The 2014/2015 financial accounts include a write-off of the Jetstar Hong Kong
business of $21 million, following the disappointing outcome of the Hong Kong Air Transport Licensing Authority’s rejection of Jetstar Hong Kong’s licence application. The write-off was recognised outside of Underlying PBT.
Jetstar-branded airlines continue to focus on a differentiated low fares product offering and service standard with innovation and investment in new technology and B787 roll out. Greater self-service, including automated bag drops and kiosk check-in, is improving the customer experience while also delivering cost benefits. Investment in next-generation booking engine and online retailing capabilities will drive the next wave of ancillary revenue growth.
Jetstar was awarded the best low-cost carrier in Australia/Pacific and was in the top five low-cost carriers worldwide49
.
QANTAS LOYALTY
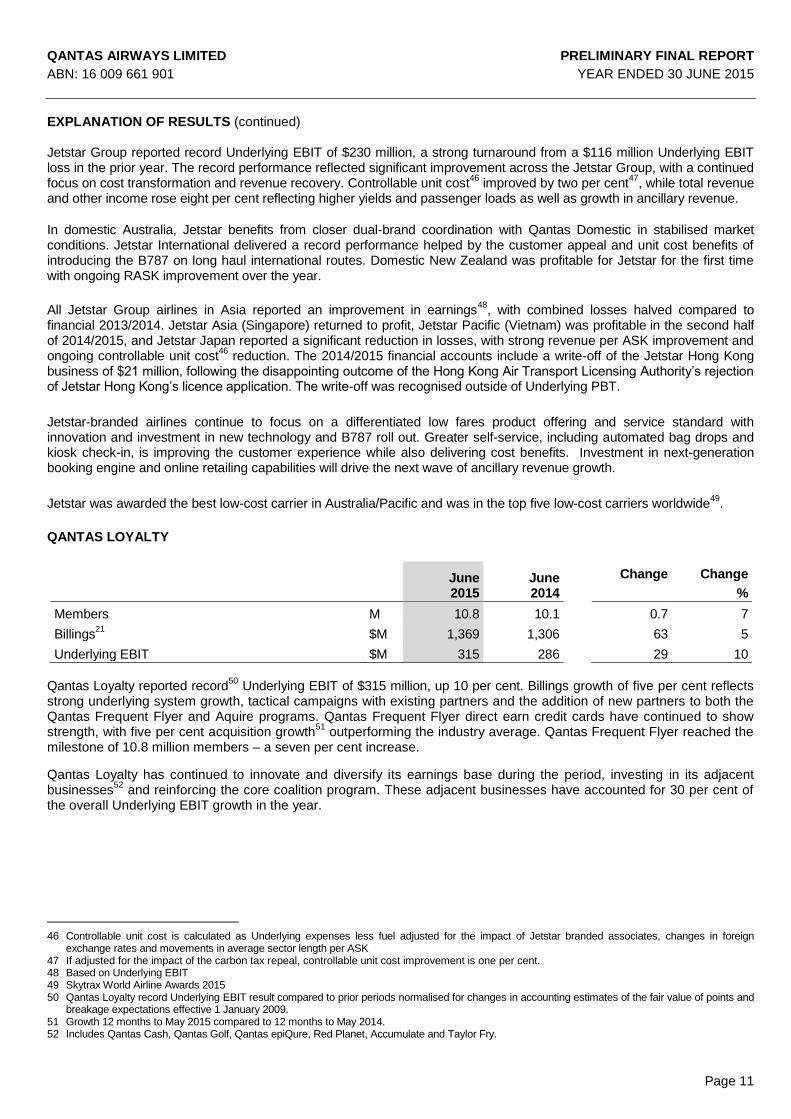
Qantas Loyalty reported record
50 Underlying EBIT of $315 million, up 10 per cent. Billings growth of five per cent reflects
strong underlying system growth, tactical campaigns with existing partners and the addition of new partners to both the Qantas Frequent Flyer and Aquire programs. Qantas Frequent Flyer direct earn credit cards have continued to show strength, with five per cent acquisition growth
51 outperforming the industry average. Qantas Frequent Flyer reached the
milestone of 10.8 million members – a seven per cent increase.
Qantas Loyalty has continued to innovate and diversify its earnings base during the period, investing in its adjacent businesses
52 and reinforcing the core coalition program. These adjacent businesses have accounted for 30 per cent of
the overall Underlying EBIT growth in the year.
46 Controllable unit cost is calculated as Underlying expenses less fuel adjusted for the impact of Jetstar branded associates, changes in foreign
exchange rates and movements in average sector length per ASK 47 If adjusted for the impact of the carbon tax repeal, controllable unit cost improvement is one per cent. 48 Based on Underlying EBIT 49 Skytrax World Airline Awards 2015 50 Qantas Loyalty record Underlying EBIT result compared to prior periods normalised for changes in accounting estimates of the fair value of points and
breakage expectations effective 1 January 2009. 51 Growth 12 months to May 2015 compared to 12 months to May 2014. 52 Includes Qantas Cash, Qantas Golf, Qantas epiQure, Red Planet, Accumulate and Taylor Fry.
June 2015
June 2014
Change
Change
%
Members M 10.8 10.1 0.7 7
Billings21
$M 1,369 1,306 63 5
Underlying EBIT $M 315 286 29 10
QANTAS AIRWAYS LIMITED PRELIMINARY FINAL REPORT
ABN: 16 009 661 901 YEAR ENDED 30 JUNE 2015
Page 12
EXPLANATION OF RESULTS (continued) Highlights include:
$1.1 billion currency loaded on Qantas Cash cards, with 410,000 cards activated
A 57 per cent increase in Qantas epiQure member base driving a 43 per cent growth in wine sales
Red Planet launch and delivering profits within first year, growing its external client portfolio and delivering top line value to the airline
Growth of the Aquire loyalty program for small to medium-sized businesses During 2014/2015 Qantas Loyalty purchased a controlling stake in actuarial and data analytics consulting firm Taylor Fry, an acquisition that adds to the Group’s customer insights capability and provides a new adjacent revenue stream. The Qantas Frequent Flyer program maintained a record annual NPS
53 and continues to hold a premium over
competitor programs.
QANTAS FREIGHT
June 2015
June 2014
Change
Change
%
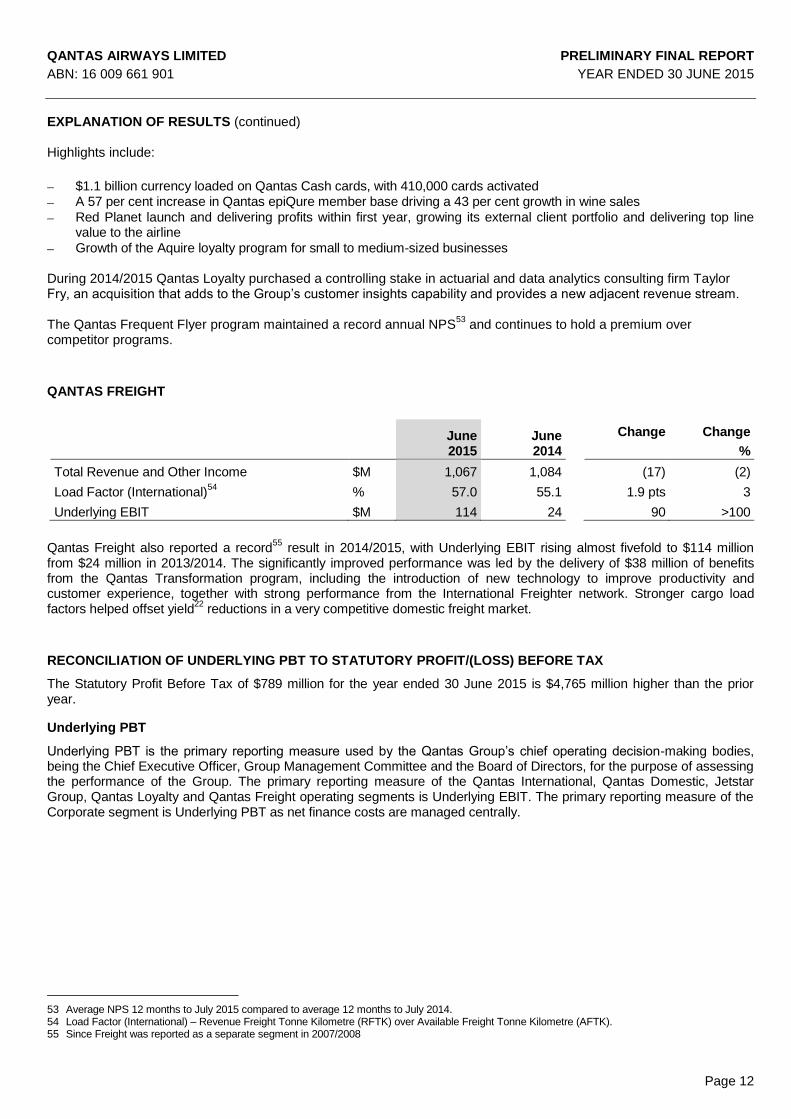
Total Revenue and Other Income $M 1,067 1,084 (17) (2)
Load Factor (International)54
% 57.0 55.1 1.9 pts 3
Underlying EBIT $M 114 24 90 >100
Qantas Freight also reported a record55
result in 2014/2015, with Underlying EBIT rising almost fivefold to $114 million from $24 million in 2013/2014. The significantly improved performance was led by the delivery of $38 million of benefits from the Qantas Transformation program, including the introduction of new technology to improve productivity and customer experience, together with strong performance from the International Freighter network. Stronger cargo load factors helped offset yield
22 reductions in a very competitive domestic freight market.
RECONCILIATION OF UNDERLYING PBT TO STATUTORY PROFIT/(LOSS) BEFORE TAX
The Statutory Profit Before Tax of $789 million for the year ended 30 June 2015 is $4,765 million higher than the prior year.
Underlying PBT
Underlying PBT is the primary reporting measure used by the Qantas Group’s chief operating decision-making bodies, being the Chief Executive Officer, Group Management Committee and the Board of Directors, for the purpose of assessing the performance of the Group. The primary reporting measure of the Qantas International, Qantas Domestic, Jetstar Group, Qantas Loyalty and Qantas Freight operating segments is Underlying EBIT. The primary reporting measure of the Corporate segment is Underlying PBT as net finance costs are managed centrally.
53 Average NPS 12 months to July 2015 compared to average 12 months to July 2014. 54 Load Factor (International) – Revenue Freight Tonne Kilometre (RFTK) over Available Freight Tonne Kilometre (AFTK). 55 Since Freight was reported as a separate segment in 2007/2008
QANTAS AIRWAYS LIMITED PRELIMINARY FINAL REPORT
ABN: 16 009 661 901 YEAR ENDED 30 JUNE 2015
Page 13
EXPLANATION OF RESULTS (continued)
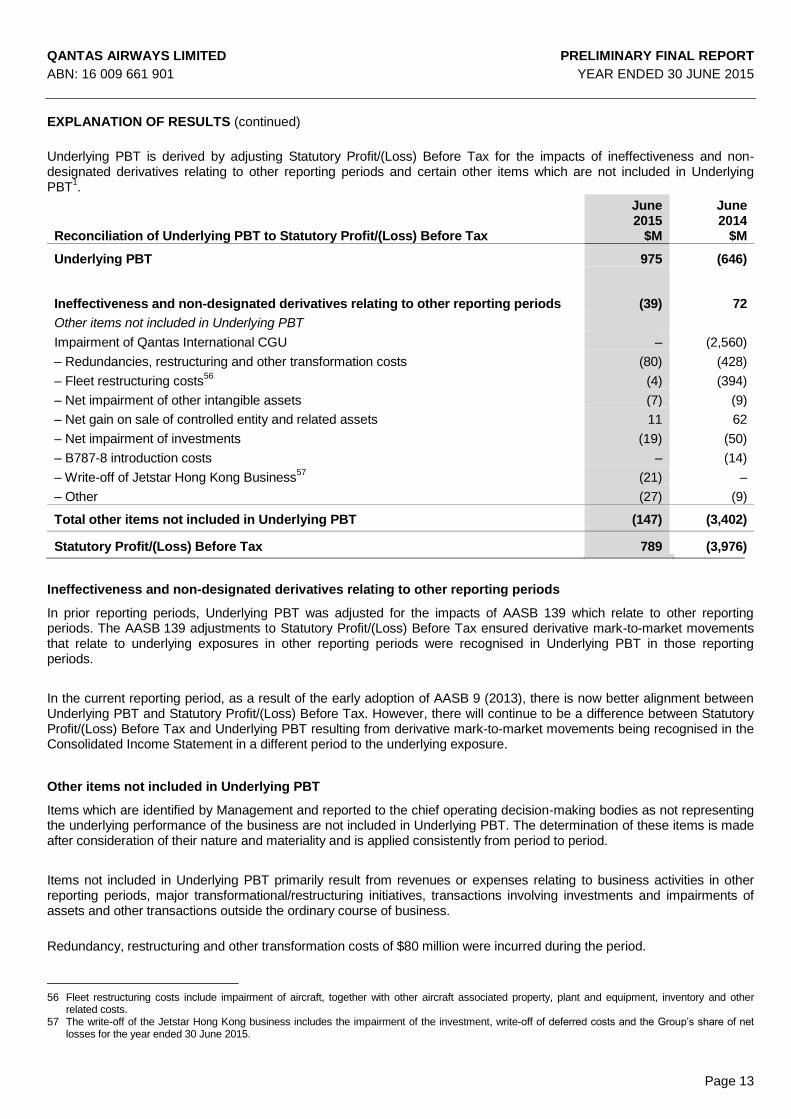
Underlying PBT is derived by adjusting Statutory Profit/(Loss) Before Tax for the impacts of ineffectiveness and non-designated derivatives relating to other reporting periods and certain other items which are not included in Underlying PBT
1.
Reconciliation of Underlying PBT to Statutory Profit/(Loss) Before Tax
June 2015
$M
June 2014
$M
Underlying PBT 975 (646)
Ineffectiveness and non-designated derivatives relating to other reporting periods (39) 72
Other items not included in Underlying PBT
Impairment of Qantas International CGU – (2,560)
– Redundancies, restructuring and other transformation costs (80) (428)
– Fleet restructuring costs56
(4) (394)
– Net impairment of other intangible assets (7) (9)
– Net gain on sale of controlled entity and related assets 11 62
– Net impairment of investments (19) (50)
– B787-8 introduction costs – (14)
– Write-off of Jetstar Hong Kong Business57
(21) –
– Other (27) (9)
Total other items not included in Underlying PBT (147) (3,402)
Statutory Profit/(Loss) Before Tax 789 (3,976)
Ineffectiveness and non-designated derivatives relating to other reporting periods
In prior reporting periods, Underlying PBT was adjusted for the impacts of AASB 139 which relate to other reporting periods. The AASB 139 adjustments to Statutory Profit/(Loss) Before Tax ensured derivative mark-to-market movements that relate to underlying exposures in other reporting periods were recognised in Underlying PBT in those reporting periods.
In the current reporting period, as a result of the early adoption of AASB 9 (2013), there is now better alignment between Underlying PBT and Statutory Profit/(Loss) Before Tax. However, there will continue to be a difference between Statutory Profit/(Loss) Before Tax and Underlying PBT resulting from derivative mark-to-market movements being recognised in the Consolidated Income Statement in a different period to the underlying exposure.
Other items not included in Underlying PBT
Items which are identified by Management and reported to the chief operating decision-making bodies as not representing the underlying performance of the business are not included in Underlying PBT. The determination of these items is made after consideration of their nature and materiality and is applied consistently from period to period.
Items not included in Underlying PBT primarily result from revenues or expenses relating to business activities in other reporting periods, major transformational/restructuring initiatives, transactions involving investments and impairments of assets and other transactions outside the ordinary course of business.
Redundancy, restructuring and other transformation costs of $80 million were incurred during the period.
56 Fleet restructuring costs include impairment of aircraft, together with other aircraft associated property, plant and equipment, inventory and other
related costs. 57 The write-off of the Jetstar Hong Kong business includes the impairment of the investment, write-off of deferred costs and the Group’s share of net
losses for the year ended 30 June 2015.
QANTAS AIRWAYS LIMITED PRELIMINARY FINAL REPORT
ABN: 16 009 661 901 YEAR ENDED 30 JUNE 2015
Page 14
EXPLANATION OF RESULTS (continued)
A write-off of the Jetstar Hong Kong business of $21 million was recognised as a result of the Hong Kong’s Air Transport Licensing Authority’s rejection of Jetstar Hong Kong’s licence application.
MATERIAL BUSINESS RISKS
The aviation industry is subject to a number of inherent risks. These include, but are not limited to, exposure to changes in economic conditions, changes in government regulations, fuel and foreign exchange volatility and other exogenous events such as aviation incidents, natural disasters, war or an epidemic.
Qantas is subject to a number of specific business risks which may impact the achievement of the Group’s strategy and financial prospects:
Competitive intensity: Market capacity growth ahead of underlying demand impacts industry profitability.
Australia’s liberal aviation policy settings coupled with the strength of the Australian economy relative to global economic weakness in recent years has attracted more offshore competitors to the Australian international aviation market, predominantly state-sponsored airlines. Qantas is responding by building key strategic airline partnerships with strong global partners and optimising its network. Qantas brings domestic strength and the unrivalled customer offering of Qantas Loyalty. Qantas International has embarked on a major restructure of its legacy cost issues through the Qantas Transformation program with the objective of achieving a cost base comparable to direct competitors. The operating environment has moderated in 2014/2015 driven by the fall in the AUD against the USD and moderated capacity growth has brought international market capacity growth in line with demand growth. These changes have improved passenger loads and led to a recovery of yields in the international business.
The Australian domestic aviation market continues to attract increased competition. The Qantas Group’s market-leading domestic position and dual-brand strategy allow Qantas to effectively mitigate the impact of any market changes. This strategy leverages Qantas Domestic (including QantasLink) to serve business and premium leisure customers and Jetstar to serve price-sensitive customers. Qantas Domestic is focused on removing the cost base disadvantage to its competitor through Qantas Transformation initiatives, while Jetstar is working to maintain its low-cost scale advantage and continually lower unit costs. During 2014/2015, the operating environment has stabilised with market capacity moderation supporting stronger passenger loads and early yield recovery in the domestic business.
Fuel and foreign exchange volatility: The Qantas Group is subject to fuel and foreign exchange risks. These risks are an inherent part of the operations of an airline. The Qantas Group manages these risks through a comprehensive hedging program. For 2015/2016 the Group’s hedging profile is positioned such that the worst case total fuel cost is $3.94 billion with 73 per cent participation rate in lower fuel prices (at current forward market price total fuel cost for 2015/2016 is $3.64 billion)
58
Industrial relations: The associated risks of transformation including industrial action relating to Qantas’ collective agreements with its employees. The risk is being mitigated through continuous employee engagement initiatives and ongoing, constructive dialogue with all union groups and other relevant stakeholders. The Group has successfully closed a number of Enterprise Bargaining Agreements (EBAs) subsequent to the commencement of the Qantas Transformation program. These EBAs have included an 18-month wage freeze. As a result of the improved profitability of the Group, and in recognition of the contribution made by all employees to strengthen the Group’s long-term competitive position through the wage freeze and the delivery of all Qantas Transformation targets ahead of schedule, a one-off bonus payment will be made to all employees covered by an 18-month wage freeze.
Continuity of critical systems: The Group’s operations depend on the continuity of a number of information
technology and communication services. The Group has an extensive control and Group Risk Management Framework
59 to reduce the likelihood of outages, ensure early detection and to mitigate the impact.
58 As at 18 August 2015. 59 An overview of the Group Risk Management Framework is available through the Qantas Group Business Practices Document on
www.qantas.com.au.
QANTAS AIRWAYS LIMITED PRELIMINARY FINAL REPORT
ABN: 16 009 661 901 YEAR ENDED 30 JUNE 2015
Page 15
EXPLANATION OF RESULTS (continued)
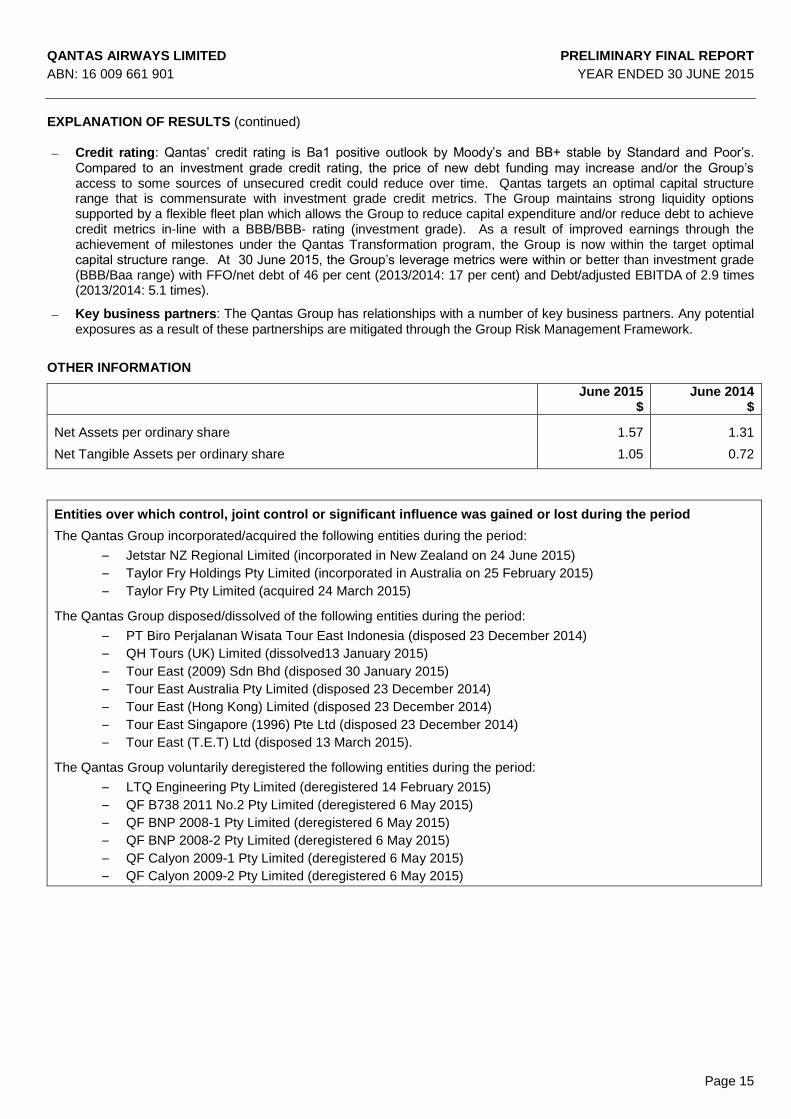
Credit rating: Qantas’ credit rating is Ba1 positive outlook by Moody’s and BB+ stable by Standard and Poor’s.
Compared to an investment grade credit rating, the price of new debt funding may increase and/or the Group’s access to some sources of unsecured credit could reduce over time. Qantas targets an optimal capital structure range that is commensurate with investment grade credit metrics. The Group maintains strong liquidity options supported by a flexible fleet plan which allows the Group to reduce capital expenditure and/or reduce debt to achieve credit metrics in-line with a BBB/BBB- rating (investment grade). As a result of improved earnings through the achievement of milestones under the Qantas Transformation program, the Group is now within the target optimal capital structure range. At 30 June 2015, the Group’s leverage metrics were within or better than investment grade (BBB/Baa range) with FFO/net debt of 46 per cent (2013/2014: 17 per cent) and Debt/adjusted EBITDA
of 2.9 times
(2013/2014: 5.1 times).
Key business partners: The Qantas Group has relationships with a number of key business partners. Any potential
exposures as a result of these partnerships are mitigated through the Group Risk Management Framework.
OTHER INFORMATION
June 2015 $
June 2014 $
Net Assets per ordinary share 1.57 1.31
Net Tangible Assets per ordinary share 1.05 0.72
Entities over which control, joint control or significant influence was gained or lost during the period
The Qantas Group incorporated/acquired the following entities during the period:
– Jetstar NZ Regional Limited (incorporated in New Zealand on 24 June 2015)
– Taylor Fry Holdings Pty Limited (incorporated in Australia on 25 February 2015)
– Taylor Fry Pty Limited (acquired 24 March 2015)
The Qantas Group disposed/dissolved of the following entities during the period:
– PT Biro Perjalanan Wisata Tour East Indonesia (disposed 23 December 2014)
– QH Tours (UK) Limited (dissolved13 January 2015)
– Tour East (2009) Sdn Bhd (disposed 30 January 2015)
– Tour East Australia Pty Limited (disposed 23 December 2014)
– Tour East (Hong Kong) Limited (disposed 23 December 2014)
– Tour East Singapore (1996) Pte Ltd (disposed 23 December 2014)
– Tour East (T.E.T) Ltd (disposed 13 March 2015).
The Qantas Group voluntarily deregistered the following entities during the period:
– LTQ Engineering Pty Limited (deregistered 14 February 2015)
– QF B738 2011 No.2 Pty Limited (deregistered 6 May 2015)
– QF BNP 2008-1 Pty Limited (deregistered 6 May 2015)
– QF BNP 2008-2 Pty Limited (deregistered 6 May 2015)
– QF Calyon 2009-1 Pty Limited (deregistered 6 May 2015)
– QF Calyon 2009-2 Pty Limited (deregistered 6 May 2015)
QANTAS AIRWAYS LIMITED PRELIMINARY FINAL REPORT
ABN: 16 009 661 901 YEAR ENDED 30 JUNE 2015
Page 16
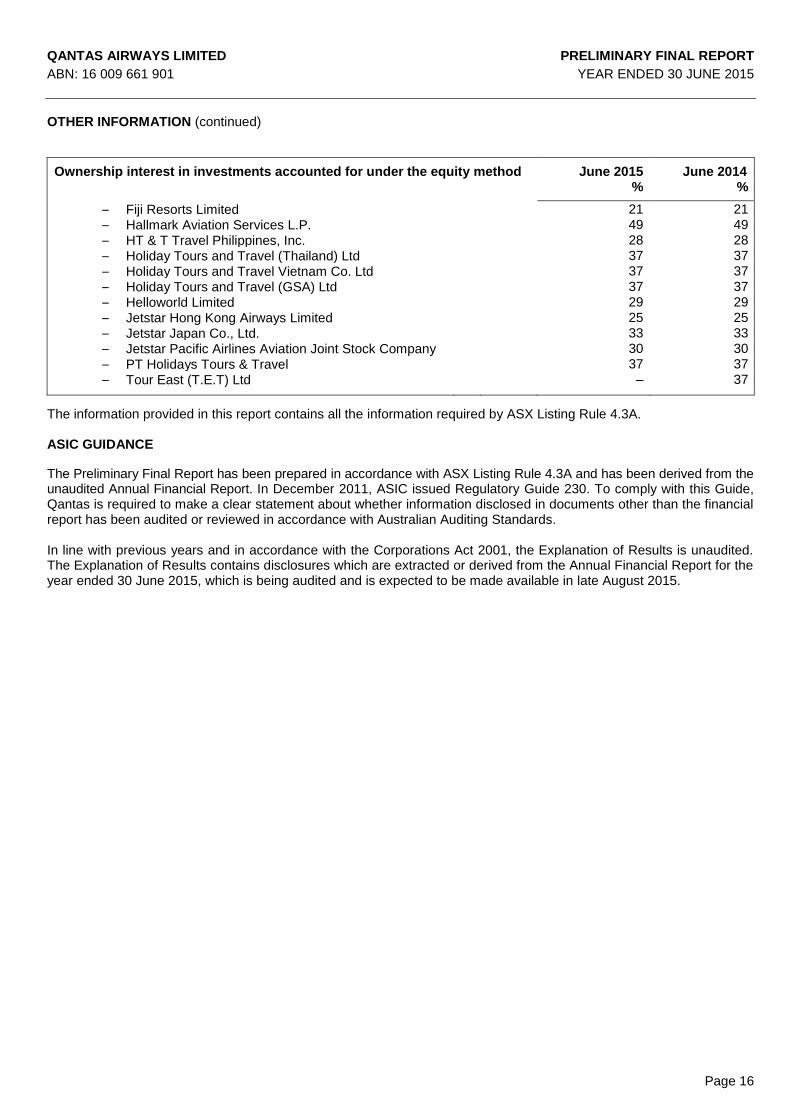
OTHER INFORMATION (continued)
Ownership interest in investments accounted for under the equity method June 2015 June 2014 % %
– Fiji Resorts Limited 21 21
– Hallmark Aviation Services L.P. 49 49
– HT & T Travel Philippines, Inc. 28 28
– Holiday Tours and Travel (Thailand) Ltd 37 37
– Holiday Tours and Travel Vietnam Co. Ltd
37 37
– Holiday Tours and Travel (GSA) Ltd
37 37
– Helloworld Limited
29 29
– Jetstar Hong Kong Airways Limited
25 25
– Jetstar Japan Co., Ltd.
33 33
– Jetstar Pacific Airlines Aviation Joint Stock Company
30 30
– PT Holidays Tours & Travel
37 37
– Tour East (T.E.T) Ltd
– 37
The information provided in this report contains all the information required by ASX Listing Rule 4.3A. ASIC GUIDANCE
The Preliminary Final Report has been prepared in accordance with ASX Listing Rule 4.3A and has been derived from the unaudited Annual Financial Report. In December 2011, ASIC issued Regulatory Guide 230. To comply with this Guide, Qantas is required to make a clear statement about whether information disclosed in documents other than the financial report has been audited or reviewed in accordance with Australian Auditing Standards. In line with previous years and in accordance with the Corporations Act 2001, the Explanation of Results is unaudited. The Explanation of Results contains disclosures which are extracted or derived from the Annual Financial Report for the year ended 30 June 2015, which is being audited and is expected to be made available in late August 2015.
QANTAS AIRWAYS LIMITED PRELIMINARY FINAL REPORT
ABN: 16 009 661 901 YEAR ENDED 30 JUNE 2015
Page 17
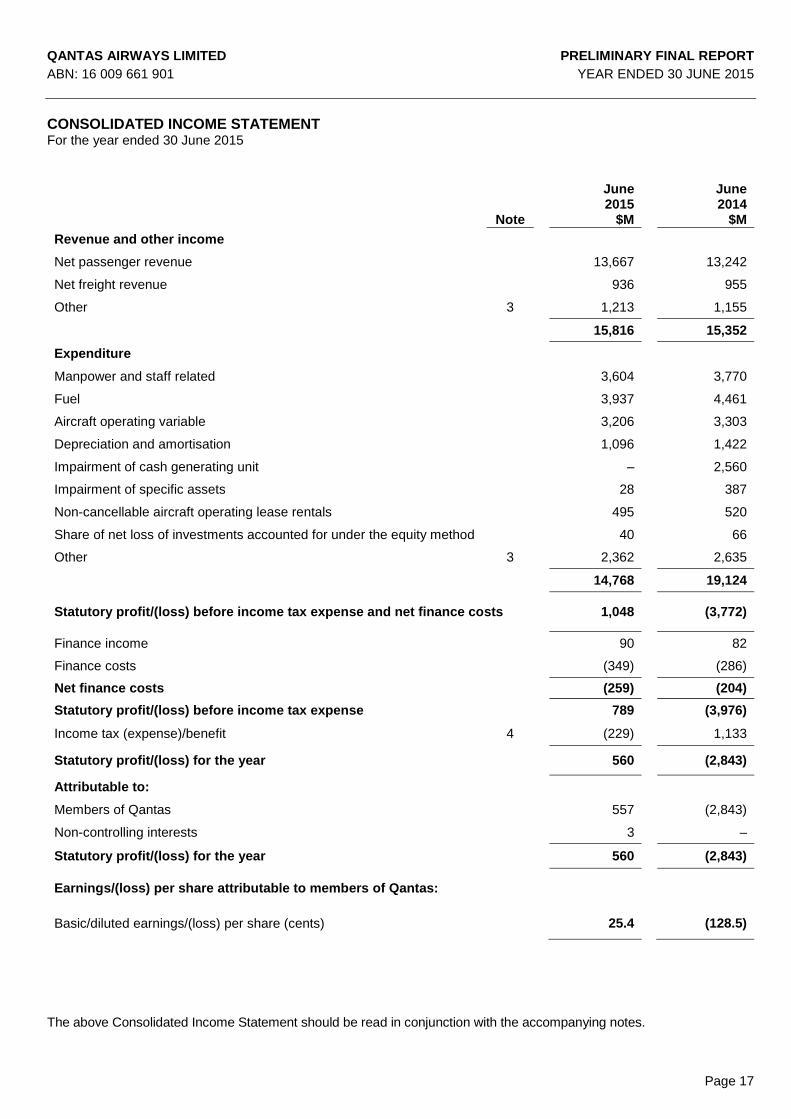
CONSOLIDATED INCOME STATEMENT For the year ended 30 June 2015
June
2015
June 2014
Note $M $M
Revenue and other income
Net passenger revenue 13,667 13,242
Net freight revenue 936 955
Other 3 1,213 1,155
15,816 15,352
Expenditure
Manpower and staff related 3,604 3,770
Fuel 3,937 4,461
Aircraft operating variable 3,206 3,303
Depreciation and amortisation 1,096 1,422
Impairment of cash generating unit – 2,560
Impairment of specific assets 28 387
Non-cancellable aircraft operating lease rentals 495 520
Share of net loss of investments accounted for under the equity method 40 66
Other 3 2,362 2,635
14,768 19,124
Statutory profit/(loss) before income tax expense and net finance costs
1,048 (3,772)
Finance income 90 82
Finance costs (349) (286)
Net finance costs (259) (204)
Statutory profit/(loss) before income tax expense 789 (3,976)
Income tax (expense)/benefit 4 (229) 1,133
Statutory profit/(loss) for the year
560 (2,843)
Attributable to:
Members of Qantas 557 (2,843)
Non-controlling interests
3 –
Statutory profit/(loss) for the year 560 (2,843)
Earnings/(loss) per share attributable to members of Qantas:
Basic/diluted earnings/(loss) per share (cents)
25.4 (128.5)
The above Consolidated Income Statement should be read in conjunction with the accompanying notes.
QANTAS AIRWAYS LIMITED PRELIMINARY FINAL REPORT
ABN: 16 009 661 901 YEAR ENDED 30 JUNE 2015
Page 18
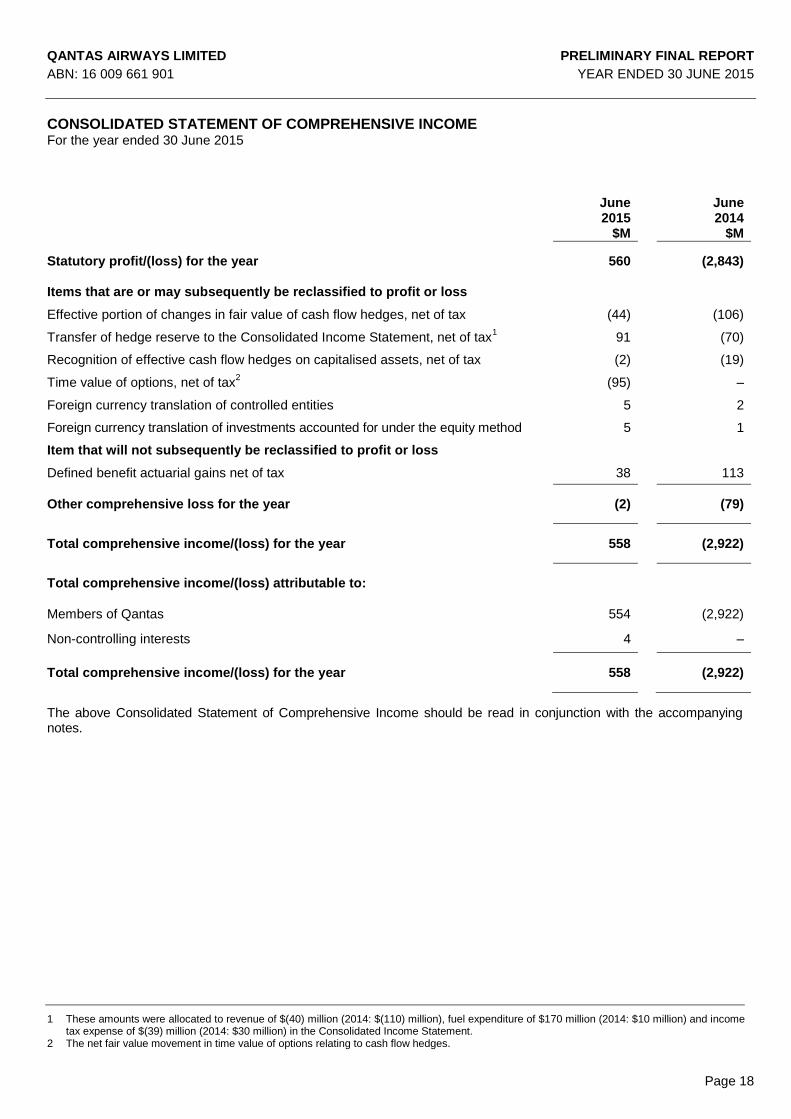
CONSOLIDATED STATEMENT OF COMPREHENSIVE INCOME For the year ended 30 June 2015
June 2015
June 2014
$M $M
Statutory profit/(loss) for the year 560 (2,843)
Items that are or may subsequently be reclassified to profit or loss
Effective portion of changes in fair value of cash flow hedges, net of tax (44) (106)
Transfer of hedge reserve to the Consolidated Income Statement, net of tax1 91 (70)
Recognition of effective cash flow hedges on capitalised assets, net of tax (2) (19)
Time value of options, net of tax2 (95) –
Foreign currency translation of controlled entities 5 2
Foreign currency translation of investments accounted for under the equity method 5 1
Item that will not subsequently be reclassified to profit or loss
Defined benefit actuarial gains net of tax 38 113
Other comprehensive loss for the year (2) (79)
Total comprehensive income/(loss) for the year 558 (2,922)
Total comprehensive income/(loss) attributable to:
Members of Qantas 554 (2,922)
Non-controlling interests 4 –
Total comprehensive income/(loss) for the year 558 (2,922)
The above Consolidated Statement of Comprehensive Income should be read in conjunction with the accompanying notes.
1 These amounts were allocated to revenue of $(40) million (2014: $(110) million), fuel expenditure of $170 million (2014: $10 million) and income tax expense of $(39) million (2014: $30 million) in the Consolidated Income Statement.
2 The net fair value movement in time value of options relating to cash flow hedges.
QANTAS AIRWAYS LIMITED PRELIMINARY FINAL REPORT
ABN: 16 009 661 901 YEAR ENDED 30 JUNE 2015
Page 19
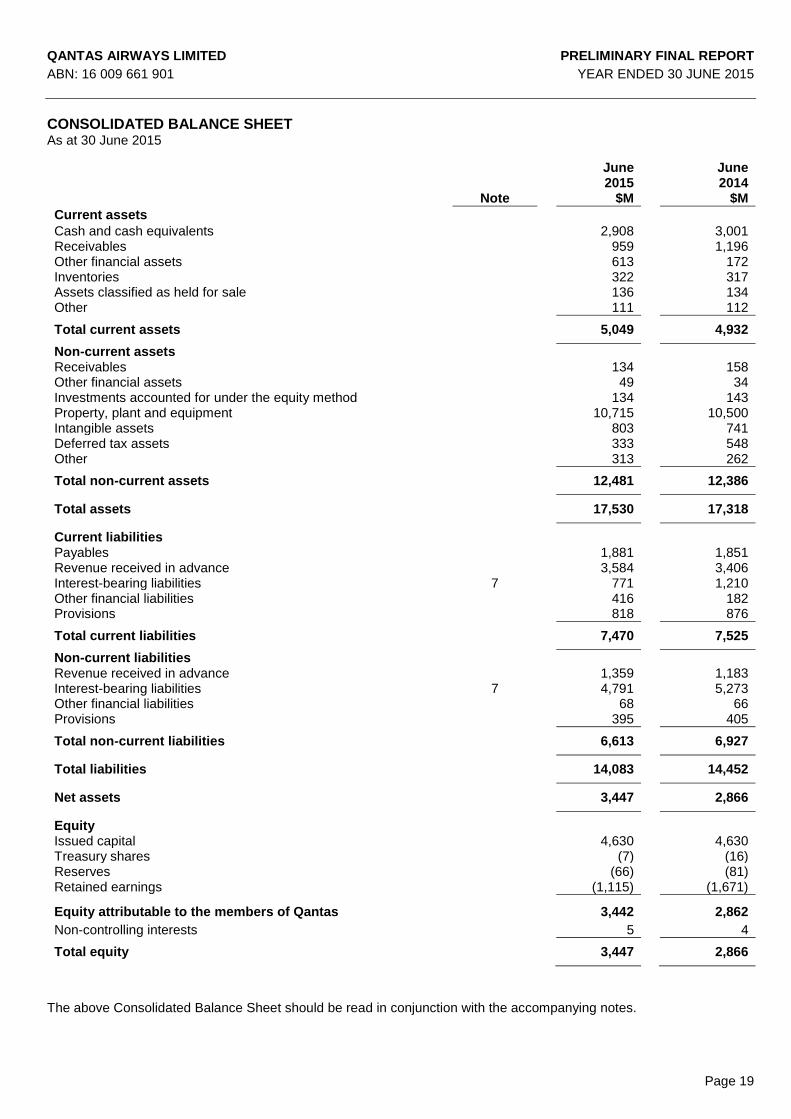
CONSOLIDATED BALANCE SHEET As at 30 June 2015
June 2015
June
2014 Note $M $M
Current assets
Cash and cash equivalents 2,908 3,001 Receivables 959 1,196 Other financial assets 613 172 Inventories 322 317 Assets classified as held for sale 136 134 Other 111 112
Total current assets 5,049 4,932
Non-current assets Receivables 134 158 Other financial assets 49 34 Investments accounted for under the equity method 134 143 Property, plant and equipment 10,715 10,500 Intangible assets 803 741 Deferred tax assets 333 548 Other 313 262
Total non-current assets 12,481 12,386
Total assets 17,530 17,318
Current liabilities Payables 1,881 1,851 Revenue received in advance 3,584 3,406 Interest-bearing liabilities 7 771 1,210 Other financial liabilities 416 182 Provisions 818 876
Total current liabilities 7,470 7,525
Non-current liabilities Revenue received in advance 1,359 1,183 Interest-bearing liabilities 7 4,791 5,273 Other financial liabilities 68 66 Provisions 395 405
Total non-current liabilities 6,613 6,927
Total liabilities 14,083 14,452
Net assets 3,447 2,866
Equity Issued capital 4,630 4,630 Treasury shares (7) (16) Reserves (66) (81) Retained earnings (1,115) (1,671)
Equity attributable to the members of Qantas 3,442 2,862
Non-controlling interests 5 4
Total equity 3,447 2,866
The above Consolidated Balance Sheet should be read in conjunction with the accompanying notes.
QANTAS AIRWAYS LIMITED PRELIMINARY FINAL REPORT
ABN: 16 009 661 901 YEAR ENDED 30 JUNE 2015
Page 20
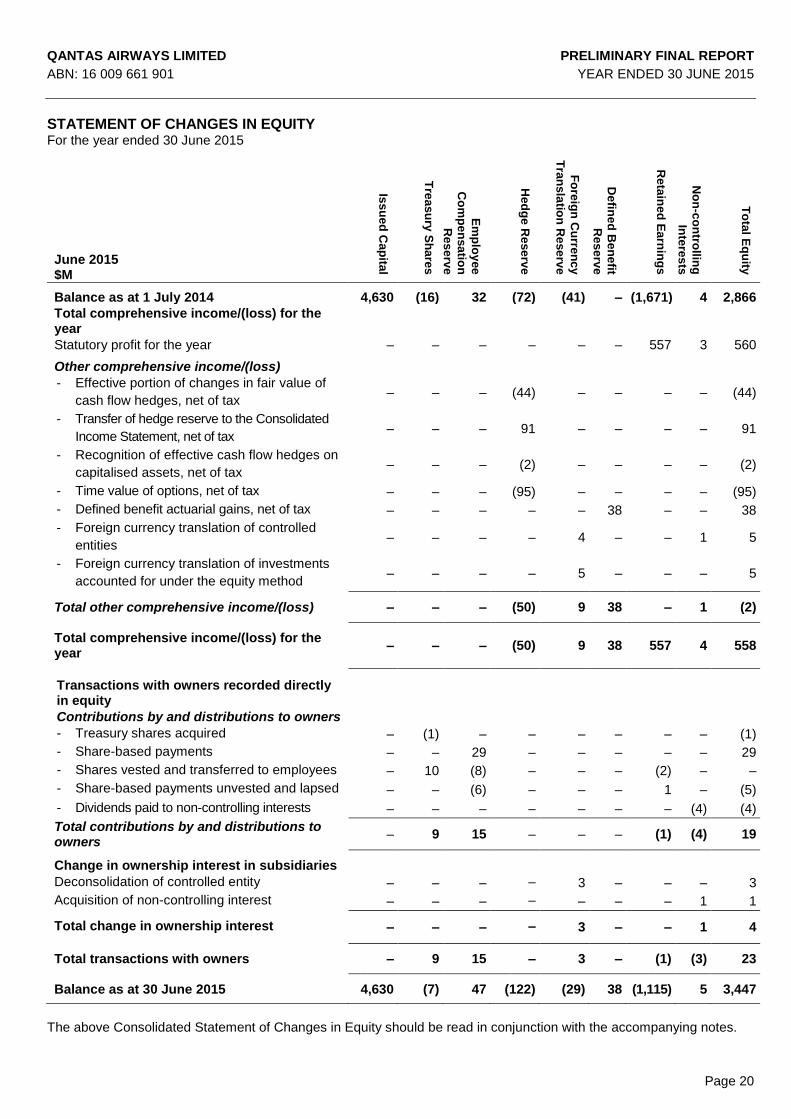
STATEMENT OF CHANGES IN EQUITY For the year ended 30 June 2015
June 2015 $M
Iss
ue
d C
ap
ital
Tre
as
ury
Sh
are
s
Em
plo
yee
Co
mp
en
sa
tion
Re
se
rve
He
dg
e R
ese
rve
Fo
reig
n C
urre
nc
y
Tra
ns
latio
n R
ese
rve
De
fine
d B
en
efit
Re
se
rve
Re
tain
ed
Ea
rnin
gs
No
n-c
on
trollin
g
Inte
res
ts
To
tal E
qu
ity
Balance as at 1 July 2014 4,630 (16) 32 (72) (41) – (1,671) 4 2,866
Total comprehensive income/(loss) for the year
Statutory profit for the year – – – – – – 557 3 560
Other comprehensive income/(loss)
- Effective portion of changes in fair value of
cash flow hedges, net of tax – – – (44) – – – – (44)
- Transfer of hedge reserve to the Consolidated
Income Statement, net of tax – – – 91 – – – – 91
- Recognition of effective cash flow hedges on
capitalised assets, net of tax – – – (2) – – – – (2)
- Time value of options, net of tax – – – (95) – – – – (95)
- Defined benefit actuarial gains, net of tax – – – – – 38 – – 38
- Foreign currency translation of controlled
entities – – – – 4 – – 1 5
- Foreign currency translation of investments
accounted for under the equity method – – – – 5 – – – 5
Total other comprehensive income/(loss) – – – (50) 9 38 – 1 (2)
Total comprehensive income/(loss) for the year
– – – (50) 9 38 557 4 558
Transactions with owners recorded directly in equity
Contributions by and distributions to owners
- Treasury shares acquired – (1) – – – – – – (1)
- Share-based payments – – 29 – – – – – 29
- Shares vested and transferred to employees – 10 (8) – – – (2) – –
- Share-based payments unvested and lapsed – – (6) – – – 1 – (5)
- Dividends paid to non-controlling interests – – – – – – – (4) (4)
Total contributions by and distributions to owners
– 9 15 – – – (1) (4) 19
Change in ownership interest in subsidiaries
Deconsolidation of controlled entity – – – – 3 – – – 3
Acquisition of non-controlling interest – – – – – – – 1 1
Total change in ownership interest – – – – 3 – – 1 4
Total transactions with owners – 9 15 – 3 – (1) (3) 23
Balance as at 30 June 2015 4,630 (7) 47 (122) (29) 38 (1,115) 5 3,447
The above Consolidated Statement of Changes in Equity should be read in conjunction with the accompanying notes.
QANTAS AIRWAYS LIMITED PRELIMINARY FINAL REPORT
ABN: 16 009 661 901 YEAR ENDED 30 JUNE 2015
Page 21
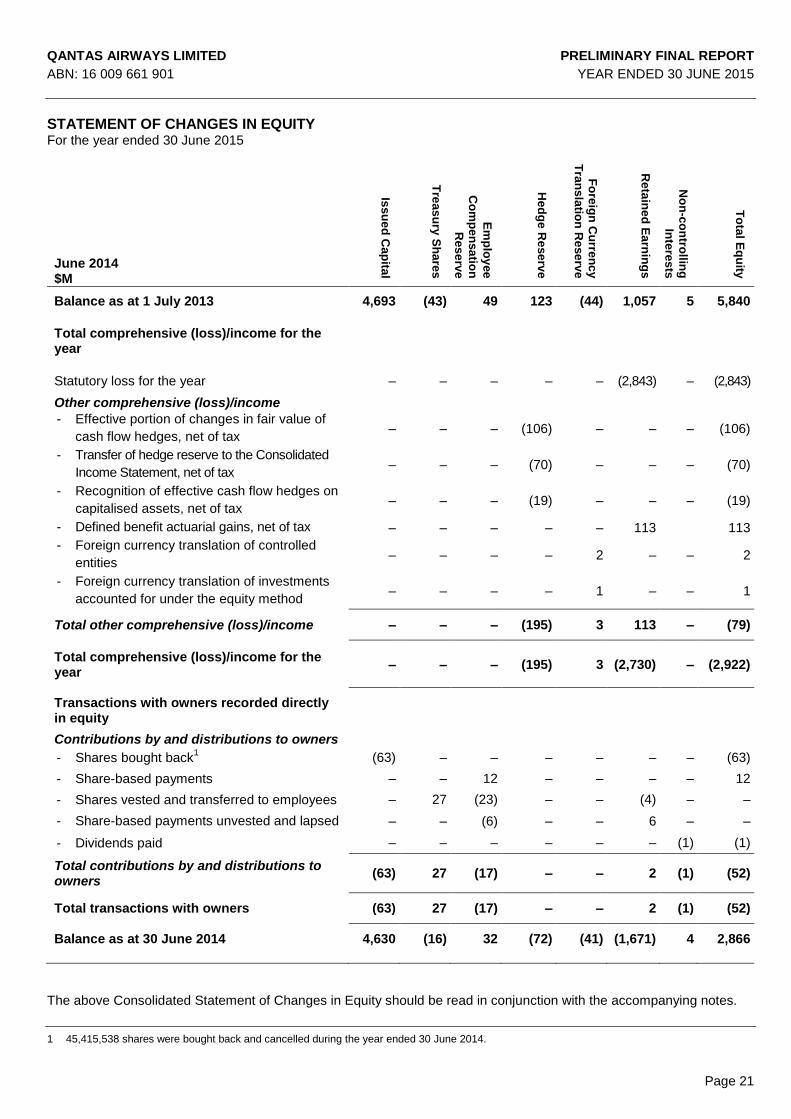
STATEMENT OF CHANGES IN EQUITY For the year ended 30 June 2015
June 2014 $M
Iss
ue
d C
ap
ital
Tre
as
ury
Sh
are
s
Em
plo
yee
Co
mp
en
sa
tion
R
es
erv
e
He
dg
e R
ese
rve
Fo
reig
n C
urre
nc
y
Tra
ns
latio
n R
ese
rve
Re
tain
ed
Ea
rnin
gs
No
n-c
on
trollin
g
Inte
res
ts
To
tal E
qu
ity
Balance as at 1 July 2013 4,693 (43) 49 123 (44) 1,057 5 5,840
Total comprehensive (loss)/income for the year
Statutory loss for the year – – – – – (2,843) – (2,843)
Other comprehensive (loss)/income
- Effective portion of changes in fair value of
cash flow hedges, net of tax – – – (106) – – – (106)
- Transfer of hedge reserve to the Consolidated
Income Statement, net of tax – – – (70) – – – (70)
- Recognition of effective cash flow hedges on
capitalised assets, net of tax – – – (19) – – – (19)
- Defined benefit actuarial gains, net of tax – – – – – 113 113
- Foreign currency translation of controlled
entities – – – – 2 – – 2
- Foreign currency translation of investments
accounted for under the equity method – – – – 1 – – 1
Total other comprehensive (loss)/income – – – (195) 3 113 – (79)
Total comprehensive (loss)/income for the year
– – – (195) 3 (2,730) – (2,922)
Transactions with owners recorded directly in equity
Contributions by and distributions to owners
- Shares bought back1 (63) – – – – – – (63)
- Share-based payments – – 12 – – – – 12
- Shares vested and transferred to employees – 27 (23) – – (4) – –
- Share-based payments unvested and lapsed – – (6) – – 6 – –
- Dividends paid – – – – – – (1) (1)
Total contributions by and distributions to owners
(63) 27 (17) – – 2 (1) (52)
Total transactions with owners (63) 27 (17) – – 2 (1) (52)
Balance as at 30 June 2014 4,630 (16) 32 (72) (41) (1,671) 4 2,866
The above Consolidated Statement of Changes in Equity should be read in conjunction with the accompanying notes.
1 45,415,538 shares were bought back and cancelled during the year ended 30 June 2014.
QANTAS AIRWAYS LIMITED PRELIMINARY FINAL REPORT
ABN: 16 009 661 901 YEAR ENDED 30 JUNE 2015
Page 22
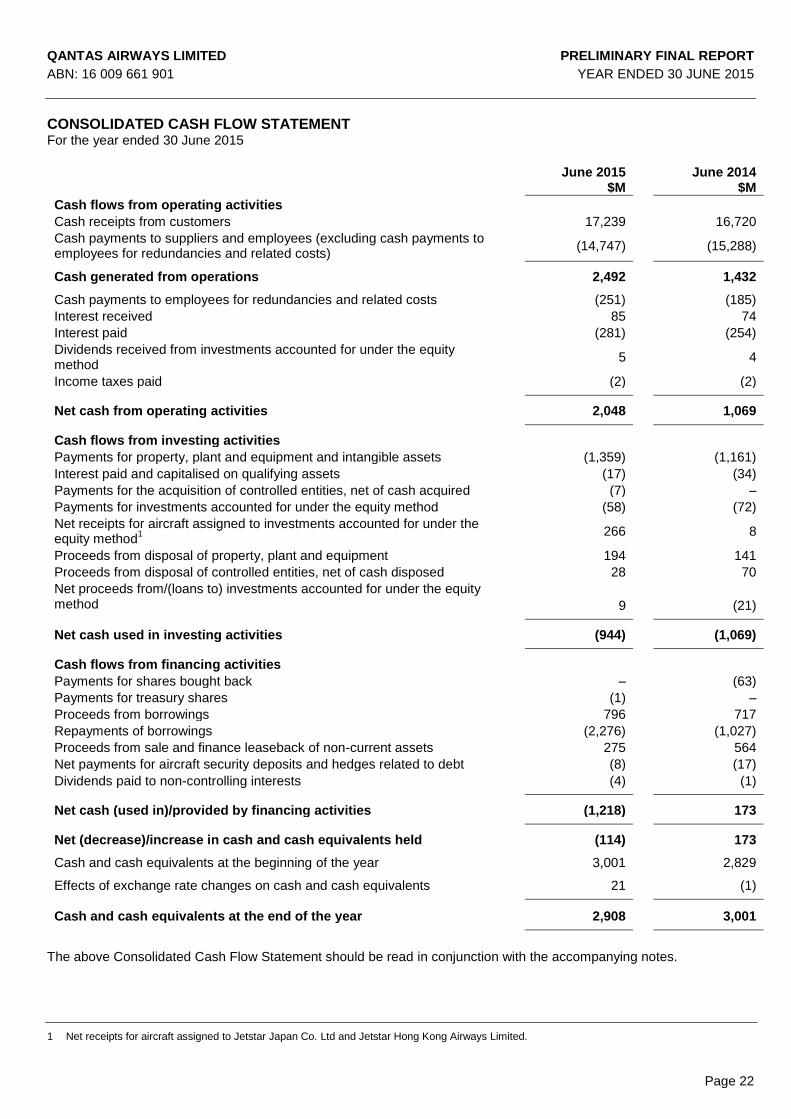
CONSOLIDATED CASH FLOW STATEMENT
For the year ended 30 June 2015
June 2015 June 2014 $M $M
Cash flows from operating activities
Cash receipts from customers 17,239 16,720
Cash payments to suppliers and employees (excluding cash payments to employees for redundancies and related costs)
(14,747) (15,288)
Cash generated from operations 2,492 1,432
Cash payments to employees for redundancies and related costs (251) (185)
Interest received 85 74
Interest paid (281) (254)
Dividends received from investments accounted for under the equity method
5 4
Income taxes paid (2) (2)
Net cash from operating activities 2,048 1,069
Cash flows from investing activities
Payments for property, plant and equipment and intangible assets (1,359) (1,161)
Interest paid and capitalised on qualifying assets (17) (34)
Payments for the acquisition of controlled entities, net of cash acquired (7) –
Payments for investments accounted for under the equity method (58) (72)
Net receipts for aircraft assigned to investments accounted for under the equity method
1
266 8
Proceeds from disposal of property, plant and equipment 194 141
Proceeds from disposal of controlled entities, net of cash disposed 28 70
Net proceeds from/(loans to) investments accounted for under the equity method
9
(21)
Net cash used in investing activities (944) (1,069)
Cash flows from financing activities
Payments for shares bought back – (63)
Payments for treasury shares (1) –
Proceeds from borrowings 796 717
Repayments of borrowings (2,276) (1,027)
Proceeds from sale and finance leaseback of non-current assets 275 564
Net payments for aircraft security deposits and hedges related to debt (8) (17)
Dividends paid to non-controlling interests (4) (1)
Net cash (used in)/provided by financing activities (1,218) 173
Net (decrease)/increase in cash and cash equivalents held (114) 173
Cash and cash equivalents at the beginning of the year 3,001 2,829
Effects of exchange rate changes on cash and cash equivalents 21 (1)
Cash and cash equivalents at the end of the year 2,908 3,001
The above Consolidated Cash Flow Statement should be read in conjunction with the accompanying notes.
1 Net receipts for aircraft assigned to Jetstar Japan Co. Ltd and Jetstar Hong Kong Airways Limited.
QANTAS AIRWAYS LIMITED PRELIMINARY FINAL REPORT
ABN: 16 009 661 901 YEAR ENDED 30 JUNE 2015
Page 23
NOTES TO THE PRELIMINARY FINAL REPORT For the year ended 30 June 2015 Note 1. Statement of Significant Accounting Policies (a) Statement of Compliance The Preliminary Final Report (the Report) has been prepared in accordance with Australian Accounting Standards (AASBs) adopted by the Australian Accounting Standards Board and the Corporations Act 2001. The Annual Financial Report also complies with International Financial Reporting Standards (IFRSs) and interpretations adopted by the International Accounting Standards Board. The Report is presented in Australian dollars, which is the functional currency of Qantas Airways Limited (Qantas) and its controlled entities (the Qantas Group), and has been prepared on the basis of historical cost except in accordance with relevant accounting policies where assets and liabilities are stated at their fair values. The Annual Financial Report is in the process of being audited and is expected to be made available in late August 2015. This Report should also be read in conjunction with any public announcements made by Qantas during the year in accordance with the continuous disclosure requirements arising under the Corporations Act 2001 and ASX Listing Rules. (b) Significant Accounting Policies Except as described below, the significant accounting policies applied by the Qantas Group in this Preliminary Final Report are the same as those applied by the Qantas Group in the Qantas Annual Report for the year ended 30 June 2014. AASB 9 Financial Instruments The Group early adopted AASB 9: Financial Instruments as amended in December 2013 (AASB 9 (2013)) with a date of initial application of 1 July 2014. This standard replaced AASB 139 Financial Instruments: Recognition and Measurement (AASB 139). The impact of this standard for the Qantas Group is as follows: Classification and Measurement The Group has classified its financial assets and financial liabilities in accordance with AASB 9 (2013). There were no changes in measurement of the Group’s financial assets and financial liabilities as a result of the changes in classification required by AASB 9 (2013). Hedge accounting AASB 9 (2013) introduced a new hedge accounting model to simplify hedge accounting outcomes and more closely align hedge accounting with risk management objectives. Some of the key improvements in the standard impacting the Qantas Group include:
Risk components – AASB 9 (2013) permits hedge accounting for a non-financial component of an economic
risk that is separately identifiable and measurable. The Qantas Group uses options and swaps on jet kerosene, gasoil and crude oil to hedge exposure to movements in the price of aviation fuel. Previously under AASB 139, non-financial components of aviation fuel price, such as crude oil, were prohibited from being designated as hedged items and as a result, ineffectiveness occurred due to the differences in the mark-to-market movements of crude oil derivatives compared to the underlying aviation fuel exposure. The designation of component hedges has reduced the changes in fair value of derivative financial instruments recognised immediately in the Consolidated Income Statement as ‘ineffective and non-designated derivatives’.
QANTAS AIRWAYS LIMITED PRELIMINARY FINAL REPORT
ABN: 16 009 661 901 YEAR ENDED 30 JUNE 2015
Page 24
NOTES TO THE PRELIMINARY FINAL REPORT (continued)
For the year ended 30 June 2015
Note 1. Statement of Significant Accounting Policies (continued) (b) Significant Accounting Policies (continued)
Cost of hedging – AASB 9 (2013) allows the time value of an option, the forward element of a forward contract
and any foreign currency basis spread to be excluded from the designation of a financial instrument and accounted for as a cost of hedging. The fair value changes of these elements are recognised in other comprehensive income and depending on the nature of the hedged item will either be transferred to the Consolidated Income Statement in the same period that the underlying transaction affects the Consolidated Income Statement or be capitalised into the initial carrying value of a hedged item. Under AASB 139, the Group recognised the change in these elements in the Consolidated Income Statement. This change has reduced the changes in the fair value of derivative financial instruments recognised in the Consolidated Income Statement as ‘ineffective and non-designated derivatives’.
Aggregated exposures – Under AASB 9 (2013), the Group has the ability to hedge an aggregated exposure
that is a combination of a derivative and a non-derivative exposure. This has allowed the Qantas Group to designate economic hedging relationships as accounting hedges, which would not have qualified under AASB 139. This change has reduced the changes in fair value of derivative financial instruments recognised in the Consolidated Income Statement as ‘ineffective and non-designated derivatives’.
Hedge effectiveness – AASB 9 (2013) requires that the hedge effectiveness assessment be forward-looking
and does not prescribe defined effectiveness parameters. Under AASB 139, an entity had to test effectiveness both retrospectively and prospectively and hedge accounting could only be applied if the relationship was 80 to 125 per cent effective. Under AASB 9 (2013), ineffectiveness is the extent to which the changes in the fair value or the cash flows of the hedging instrument are greater or less than those on the hedged item. This change has not had a material impact on the Consolidated Income Statement.
The Group has applied AASB 9 (2013) on a prospective basis. Accordingly, there was no retrospective adjustment to the Group results. (c) Comparatives
Where applicable, various comparative balances have been reclassified to align with current period presentation.
(d) Critical Accounting Estimates and Judgements
The preparation of the Consolidated Financial Statements requires management to make judgements, estimates and assumptions that affect the application of accounting policies and reported amounts of assets, liabilities, income and expenses. The estimates and associated assumptions are based on historical experience and various other factors that are believed to be reasonable under the circumstances, the results of which form the basis for making the judgements about carrying values of assets and liabilities that are not readily apparent from other sources. Actual results may differ from these estimates. Estimates and underlying assumptions are reviewed on an ongoing basis. Revisions to accounting estimates are recognised in the period in which the estimate is revised and in any future periods affected. Judgements made by management in the application of AASBs that have a significant effect on the Consolidated Financial Statements and estimates with a significant risk of material adjustment in future periods are highlighted below. Changes in accounting estimates – Discount Rates
Qantas has changed its estimate of the discount rates used to calculate the present value of employee benefits in accordance with AASB 119: Employee Benefits (AASB 119). AASB 119 requires employee benefit provisions to be discounted to their present value using a discount rate determined by reference to market yields at the end of the reporting period on high quality corporate bonds. Previously, it was determined that there was no deep market in Australia for such bonds and therefore, the market yields at the end of the reporting period for government bonds was used. In March 2015, the Group of 100 commissioned the actuarial firm Milliman to perform an assessment of the depth of Australia’s high quality corporate bond market. In their report released in April 2015, Milliman concluded that it is generally accepted practice that bonds rated AA or above are considered high quality and therefore there is now sufficient evidence to support a conclusion that the high quality corporate bond market in Australia is deep. From this date, as required by AASB 119 the Group has changed the rate it uses to discount its Employee Benefit Provisions from State Government Bond Rates to the Corporate Bond Rate.
QANTAS AIRWAYS LIMITED PRELIMINARY FINAL REPORT
ABN: 16 009 661 901 YEAR ENDED 30 JUNE 2015
Page 25
NOTES TO THE PRELIMINARY FINAL REPORT (continued)
For the year ended 30 June 2015 Note 1. Statement of Significant Accounting Policies (continued)
(d) Critical Accounting Estimates and Judgements (continued)
During the year, the discount rate determined with reference to Corporate Bonds was higher than State Government Bonds. However, a significant reduction in discount rates due to market movements has offset the increase in discount rate resulting from the change to Corporate Bond Rates. The net favourable impact of the change in discount rates on Employee Benefits provisions of $14 million was recognised in the Consolidated Income Statement for the year ended 30 June 2015.
(e) Carrying Amount of Non-Financial Assets
(i) Cash generating units
The carrying amounts of non-financial assets are reviewed at each balance date to determine whether there is any indication of impairment. If any such indication exists, the asset’s recoverable amount is estimated. For goodwill and intangible assets with indefinite lives, recoverable amounts are estimated at the end of each financial year. The recoverable amount of an asset is the greater of its fair value less costs to sell and its value in use. Assets which primarily generate cash flows as a group, such as aircraft, are assessed on a cash generating unit (CGU) basis, inclusive of related infrastructure and intangible assets and compared to net cash inflows for the CGU. Estimated net cash flows used in determining recoverable amount are discounted to their net present value using a pre-tax discount rate that reflects current market assessments of the time value of money and the risks specific to the assets. Identification of an asset’s CGU requires judgement, as it requires identification of the lowest aggregation of assets that generate largely independent cash inflows. In Management’s judgement, the lowest aggregation of assets, which give rise to CGUs as defined by AASB 136: Impairment of Assets are the Qantas Domestic CGU, Qantas International CGU, Qantas Loyalty CGU, Qantas Freight CGU and the Jetstar Group CGU. (ii) Assets held for sale
Non-current assets, or disposal groups comprising assets and liabilities, that are expected to be recovered primarily through sale rather than through continued use are classified as held for sale. Immediately before classification as held for sale, the measurement of the assets or components of a disposal group is remeasured in accordance with the Qantas Group’s accounting policies. Thereafter, the assets, or disposal group, are measured at the lower of carrying amount and fair value less costs to sell. Any impairment of a disposal group is first allocated to goodwill and then to remaining assets and liabilities on a pro-rata basis except that no loss is allocated to inventories, financial assets or deferred tax asset. These continue to be measured in accordance with the Qantas Group’s accounting policies. Impairment losses on initial classification as held for sale and subsequent gains or losses on remeasurement are recognised in the Consolidated Income Statement. Note 2. Underlying Profit/(Loss) Before Tax, Operating Segments and Return on Invested Capital
(a) Underlying Profit/(Loss) Before Tax (Underlying PBT) Underlying PBT is the primary reporting measure used by the Qantas Group’s chief operating decision-making bodies, being the Chief Executive Officer, Group Management Committee and the Board of Directors, for the purpose of assessing the performance of the Group. The primary reporting measure of the Qantas Domestic, Qantas International, Qantas Freight, Jetstar Group and Qantas Loyalty operating segments is Underlying EBIT. The primary reporting measure of the Corporate segment is Underlying PBT as net finance costs are managed centrally and are not allocated to Qantas Domestic, Qantas International, Qantas Freight, Jetstar Group and Qantas Loyalty operating segments. Refer to Note 2(d) for a Description of Underlying PBT and Reconciliation from Statutory Profit/(Loss) Before Tax.
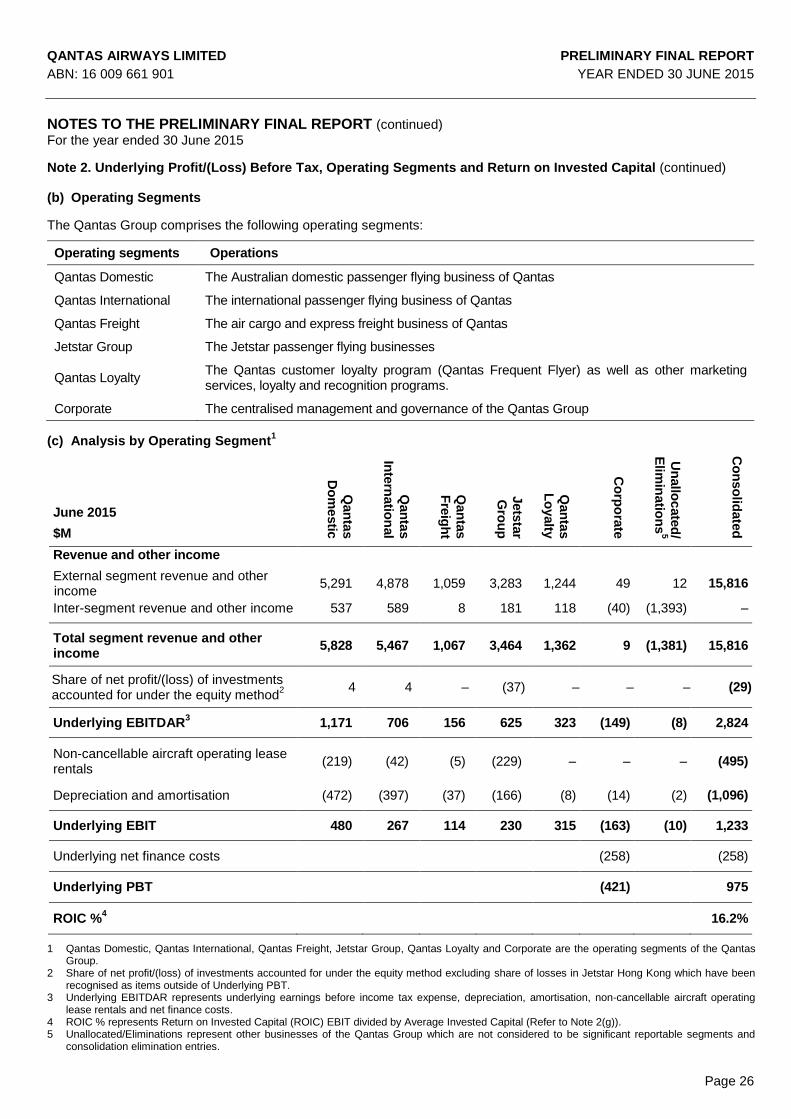
QANTAS AIRWAYS LIMITED PRELIMINARY FINAL REPORT
ABN: 16 009 661 901 YEAR ENDED 30 JUNE 2015
Page 26
NOTES TO THE PRELIMINARY FINAL REPORT (continued)
For the year ended 30 June 2015
Note 2. Underlying Profit/(Loss) Before Tax, Operating Segments and Return on Invested Capital (continued)
(b) Operating Segments
The Qantas Group comprises the following operating segments:
Operating segments Operations
Qantas Domestic The Australian domestic passenger flying business of Qantas
Qantas International The international passenger flying business of Qantas
Qantas Freight The air cargo and express freight business of Qantas
Jetstar Group The Jetstar passenger flying businesses
Qantas Loyalty The Qantas customer loyalty program (Qantas Frequent Flyer) as well as other marketing services, loyalty and recognition programs.
Corporate The centralised management and governance of the Qantas Group
(c) Analysis by Operating Segment
1
June 2015
$M
Qan
tas
Do
mestic
Qan
tas
Inte
rnatio
nal
Qan
tas
Fre
igh
t
Jets
tar
Gro
up
Qan
tas
Lo
yalty
Co
rpo
rate
Un
allo
cate
d/
Elim
inatio
ns
5
Co
nso
lidate
d
Revenue and other income
External segment revenue and other income
5,291 4,878 1,059 3,283 1,244 49 12 15,816
Inter-segment revenue and other income 537 589 8 181 118 (40) (1,393) – Total segment revenue and other income
5,828 5,467 1,067 3,464 1,362 9 (1,381) 15,816
Share of net profit/(loss) of investments accounted for under the equity method
2
4 4 – (37) – – – (29)
Underlying EBITDAR
3 1,171 706 156 625 323 (149) (8) 2,824
Non-cancellable aircraft operating lease rentals
(219) (42) (5) (229) – – – (495)
Depreciation and amortisation (472) (397) (37) (166) (8) (14) (2) (1,096) Underlying EBIT 480 267 114 230 315 (163) (10) 1,233 Underlying net finance costs (258) (258) Underlying PBT (421) 975 ROIC %
4 16.2%
1 Qantas Domestic, Qantas International, Qantas Freight, Jetstar Group, Qantas Loyalty and Corporate are the operating segments of the Qantas
Group. 2 Share of net profit/(loss) of investments accounted for under the equity method excluding share of losses in Jetstar Hong Kong which have been
recognised as items outside of Underlying PBT. 3 Underlying EBITDAR represents underlying earnings before income tax expense, depreciation, amortisation, non-cancellable aircraft operating
lease rentals and net finance costs. 4 ROIC % represents Return on Invested Capital (ROIC) EBIT divided by Average Invested Capital (Refer to Note 2(g)). 5 Unallocated/Eliminations represent other businesses of the Qantas Group which are not considered to be significant reportable segments and
consolidation elimination entries.
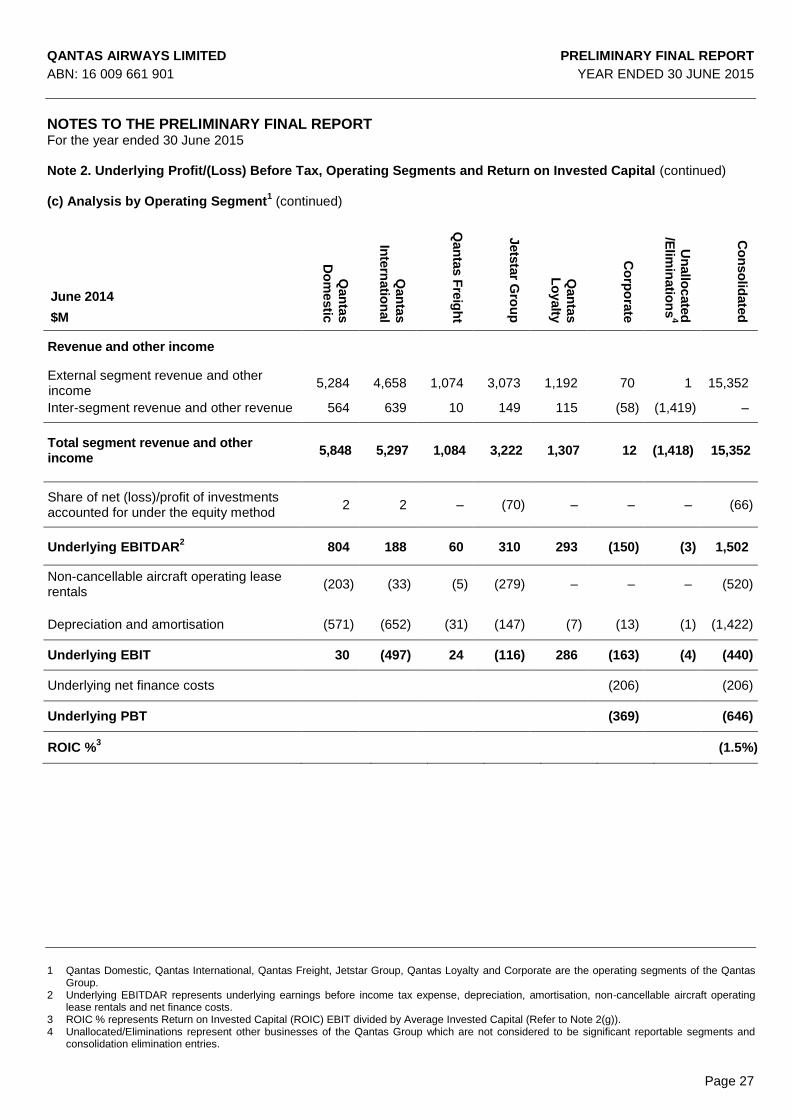
QANTAS AIRWAYS LIMITED PRELIMINARY FINAL REPORT
ABN: 16 009 661 901 YEAR ENDED 30 JUNE 2015
Page 27
NOTES TO THE PRELIMINARY FINAL REPORT
For the year ended 30 June 2015 Note 2. Underlying Profit/(Loss) Before Tax, Operating Segments and Return on Invested Capital (continued) (c) Analysis by Operating Segment
1 (continued)
June 2014
$M
Qan
tas
Do
mestic
Qan
tas
Inte
rnatio
nal
Qan
tas F
reig
ht
Jets
tar G
rou
p
Qan
tas
Lo
yalty
Co
rpo
rate
Un
allo
cate
d
/Elim
inatio
ns
4
Co
nso
lidate
d
Revenue and other income
External segment revenue and other income
5,284 4,658 1,074 3,073 1,192 70 1 15,352
Inter-segment revenue and other revenue 564 639 10 149 115 (58) (1,419) – Total segment revenue and other income
5,848 5,297 1,084 3,222 1,307 12 (1,418) 15,352
Share of net (loss)/profit of investments accounted for under the equity method
2 2 – (70) – – – (66)
Underlying EBITDAR
2 804 188 60 310 293 (150) (3) 1,502
Non-cancellable aircraft operating lease rentals
(203) (33) (5) (279) – – – (520)
Depreciation and amortisation (571) (652) (31) (147) (7) (13) (1) (1,422) Underlying EBIT 30 (497) 24 (116) 286 (163) (4) (440) Underlying net finance costs (206) (206) Underlying PBT (369) (646) ROIC %
3 (1.5%)
1 Qantas Domestic, Qantas International, Qantas Freight, Jetstar Group, Qantas Loyalty and Corporate are the operating segments of the Qantas
Group. 2 Underlying EBITDAR represents underlying earnings before income tax expense, depreciation, amortisation, non-cancellable aircraft operating
lease rentals and net finance costs. 3 ROIC % represents Return on Invested Capital (ROIC) EBIT divided by Average Invested Capital (Refer to Note 2(g)). 4 Unallocated/Eliminations represent other businesses of the Qantas Group which are not considered to be significant reportable segments and
consolidation elimination entries.
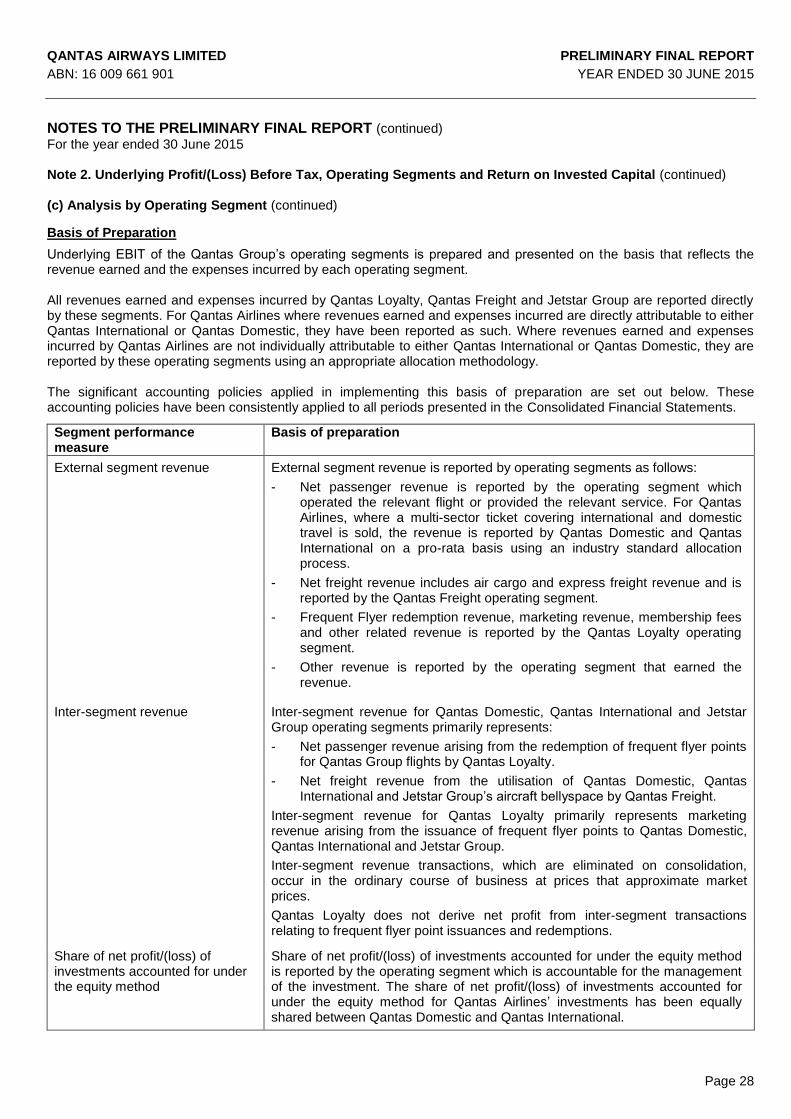
QANTAS AIRWAYS LIMITED PRELIMINARY FINAL REPORT
ABN: 16 009 661 901 YEAR ENDED 30 JUNE 2015
Page 28
NOTES TO THE PRELIMINARY FINAL REPORT (continued)
For the year ended 30 June 2015 Note 2. Underlying Profit/(Loss) Before Tax, Operating Segments and Return on Invested Capital (continued) (c) Analysis by Operating Segment (continued)
Basis of Preparation
Underlying EBIT of the Qantas Group’s operating segments is prepared and presented on the basis that reflects the revenue earned and the expenses incurred by each operating segment. All revenues earned and expenses incurred by Qantas Loyalty, Qantas Freight and Jetstar Group are reported directly by these segments. For Qantas Airlines where revenues earned and expenses incurred are directly attributable to either Qantas International or Qantas Domestic, they have been reported as such. Where revenues earned and expenses incurred by Qantas Airlines are not individually attributable to either Qantas International or Qantas Domestic, they are reported by these operating segments using an appropriate allocation methodology. The significant accounting policies applied in implementing this basis of preparation are set out below. These accounting policies have been consistently applied to all periods presented in the Consolidated Financial Statements.
Segment performance measure
Basis of preparation
External segment revenue External segment revenue is reported by operating segments as follows:
- Net passenger revenue is reported by the operating segment which operated the relevant flight or provided the relevant service. For Qantas Airlines, where a multi-sector ticket covering international and domestic travel is sold, the revenue is reported by Qantas Domestic and Qantas International on a pro-rata basis using an industry standard allocation process.
- Net freight revenue includes air cargo and express freight revenue and is reported by the Qantas Freight operating segment.
- Frequent Flyer redemption revenue, marketing revenue, membership fees and other related revenue is reported by the Qantas Loyalty operating segment.
- Other revenue is reported by the operating segment that earned the revenue.
Inter-segment revenue Inter-segment revenue for Qantas Domestic, Qantas International and Jetstar Group operating segments primarily represents:
- Net passenger revenue arising from the redemption of frequent flyer points for Qantas Group flights by Qantas Loyalty.
- Net freight revenue from the utilisation of Qantas Domestic, Qantas International and Jetstar Group’s aircraft bellyspace by Qantas Freight.
Inter-segment revenue for Qantas Loyalty primarily represents marketing revenue arising from the issuance of frequent flyer points to Qantas Domestic, Qantas International and Jetstar Group.
Inter-segment revenue transactions, which are eliminated on consolidation, occur in the ordinary course of business at prices that approximate market prices.
Qantas Loyalty does not derive net profit from inter-segment transactions relating to frequent flyer point issuances and redemptions.
Share of net profit/(loss) of investments accounted for under the equity method
Share of net profit/(loss) of investments accounted for under the equity method is reported by the operating segment which is accountable for the management of the investment. The share of net profit/(loss) of investments accounted for under the equity method for Qantas Airlines’ investments has been equally shared between Qantas Domestic and Qantas International.
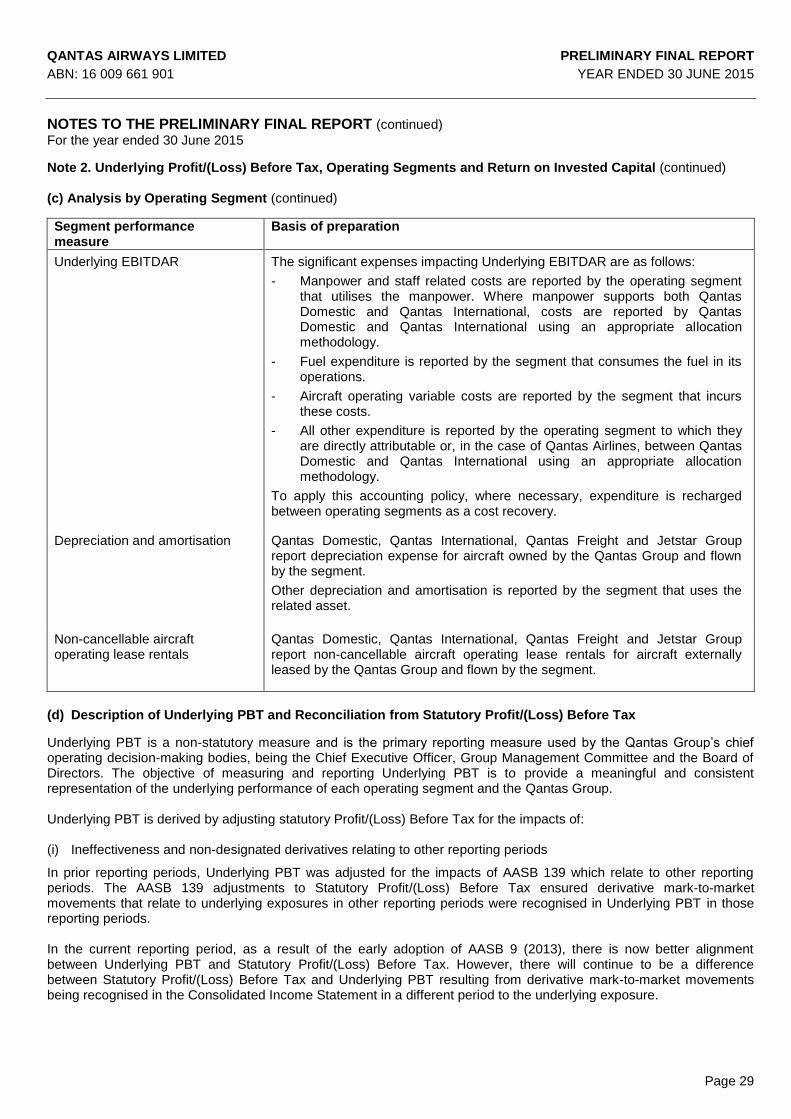
QANTAS AIRWAYS LIMITED PRELIMINARY FINAL REPORT
ABN: 16 009 661 901 YEAR ENDED 30 JUNE 2015
Page 29
NOTES TO THE PRELIMINARY FINAL REPORT (continued)
For the year ended 30 June 2015
Note 2. Underlying Profit/(Loss) Before Tax, Operating Segments and Return on Invested Capital (continued) (c) Analysis by Operating Segment (continued)
Segment performance measure
Basis of preparation
Underlying EBITDAR The significant expenses impacting Underlying EBITDAR are as follows:
- Manpower and staff related costs are reported by the operating segment that utilises the manpower. Where manpower supports both Qantas Domestic and Qantas International, costs are reported by Qantas Domestic and Qantas International using an appropriate allocation methodology.
- Fuel expenditure is reported by the segment that consumes the fuel in its operations.
- Aircraft operating variable costs are reported by the segment that incurs these costs.
- All other expenditure is reported by the operating segment to which they are directly attributable or, in the case of Qantas Airlines, between Qantas Domestic and Qantas International using an appropriate allocation methodology.
To apply this accounting policy, where necessary, expenditure is recharged between operating segments as a cost recovery.
Depreciation and amortisation Qantas Domestic, Qantas International, Qantas Freight and Jetstar Group report depreciation expense for aircraft owned by the Qantas Group and flown by the segment.
Other depreciation and amortisation is reported by the segment that uses the related asset.
Non-cancellable aircraft operating lease rentals
Qantas Domestic, Qantas International, Qantas Freight and Jetstar Group report non-cancellable aircraft operating lease rentals for aircraft externally leased by the Qantas Group and flown by the segment.
(d) Description of Underlying PBT and Reconciliation from Statutory Profit/(Loss) Before Tax
Underlying PBT is a non-statutory measure and is the primary reporting measure used by the Qantas Group’s chief operating decision-making bodies, being the Chief Executive Officer, Group Management Committee and the Board of Directors. The objective of measuring and reporting Underlying PBT is to provide a meaningful and consistent representation of the underlying performance of each operating segment and the Qantas Group. Underlying PBT is derived by adjusting statutory Profit/(Loss) Before Tax for the impacts of: (i) Ineffectiveness and non-designated derivatives relating to other reporting periods
In prior reporting periods, Underlying PBT was adjusted for the impacts of AASB 139 which relate to other reporting periods. The AASB 139 adjustments to Statutory Profit/(Loss) Before Tax ensured derivative mark-to-market movements that relate to underlying exposures in other reporting periods were recognised in Underlying PBT in those reporting periods. In the current reporting period, as a result of the early adoption of AASB 9 (2013), there is now better alignment between Underlying PBT and Statutory Profit/(Loss) Before Tax. However, there will continue to be a difference between Statutory Profit/(Loss) Before Tax and Underlying PBT resulting from derivative mark-to-market movements being recognised in the Consolidated Income Statement in a different period to the underlying exposure.
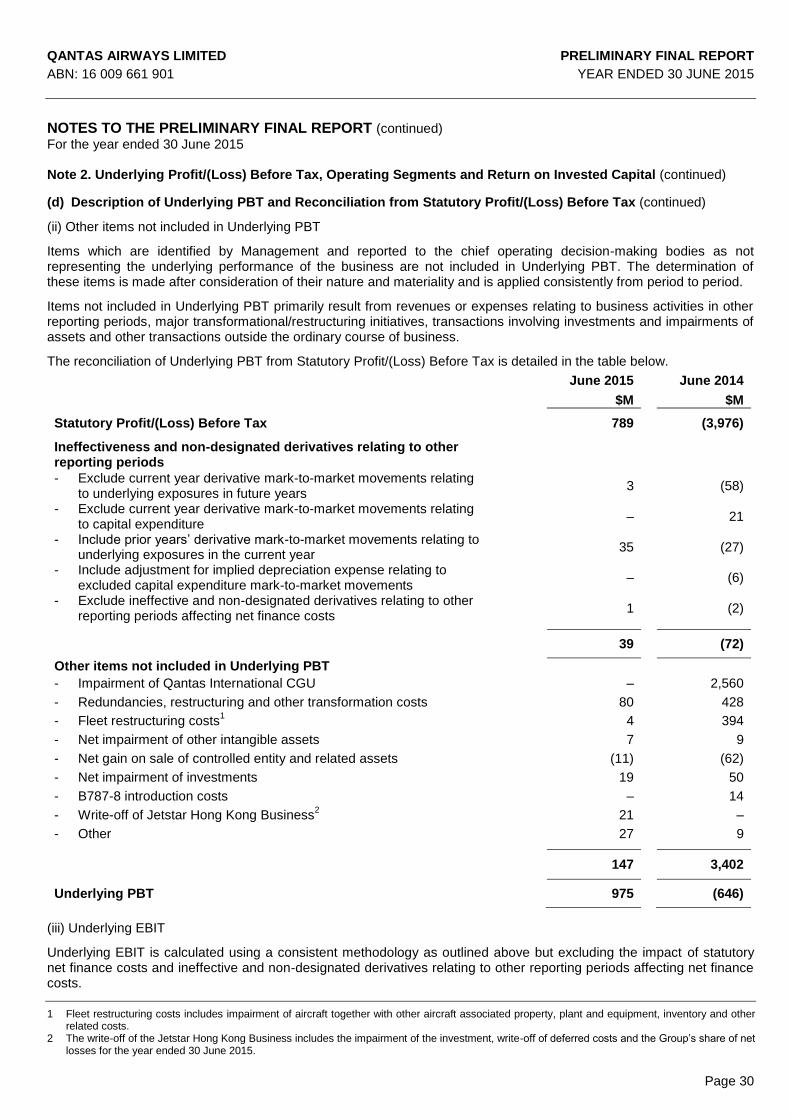
QANTAS AIRWAYS LIMITED PRELIMINARY FINAL REPORT
ABN: 16 009 661 901 YEAR ENDED 30 JUNE 2015
Page 30
NOTES TO THE PRELIMINARY FINAL REPORT (continued)
For the year ended 30 June 2015 Note 2. Underlying Profit/(Loss) Before Tax, Operating Segments and Return on Invested Capital (continued)
(d) Description of Underlying PBT and Reconciliation from Statutory Profit/(Loss) Before Tax (continued)
(ii) Other items not included in Underlying PBT
Items which are identified by Management and reported to the chief operating decision-making bodies as not representing the underlying performance of the business are not included in Underlying PBT. The determination of these items is made after consideration of their nature and materiality and is applied consistently from period to period.
Items not included in Underlying PBT primarily result from revenues or expenses relating to business activities in other reporting periods, major transformational/restructuring initiatives, transactions involving investments and impairments of assets and other transactions outside the ordinary course of business.
The reconciliation of Underlying PBT from Statutory Profit/(Loss) Before Tax is detailed in the table below.
June 2015 June 2014
$M $M
Statutory Profit/(Loss) Before Tax 789 (3,976)
Ineffectiveness and non-designated derivatives relating to other reporting periods - Exclude current year derivative mark-to-market movements relating
to underlying exposures in future years
3 (58)
- Exclude current year derivative mark-to-market movements relating to capital expenditure
– 21
- Include prior years’ derivative mark-to-market movements relating to underlying exposures in the current year
35 (27)
- Include adjustment for implied depreciation expense relating to excluded capital expenditure mark-to-market movements
– (6)
- Exclude ineffective and non-designated derivatives relating to other reporting periods affecting net finance costs
1 (2)
39 (72)
Other items not included in Underlying PBT
- Impairment of Qantas International CGU – 2,560
- Redundancies, restructuring and other transformation costs 80 428
- Fleet restructuring costs1 4 394
- Net impairment of other intangible assets 7 9
- Net gain on sale of controlled entity and related assets (11) (62)
- Net impairment of investments 19 50
- B787-8 introduction costs – 14
- Write-off of Jetstar Hong Kong Business2 21 –
- Other 27 9
147 3,402
Underlying PBT
975 (646)
(iii) Underlying EBIT Underlying EBIT is calculated using a consistent methodology as outlined above but excluding the impact of statutory net finance costs and ineffective and non-designated derivatives relating to other reporting periods affecting net finance costs.
1 Fleet restructuring costs includes impairment of aircraft together with other aircraft associated property, plant and equipment, inventory and other related costs.
2 The write-off of the Jetstar Hong Kong Business includes the impairment of the investment, write-off of deferred costs and the Group’s share of net losses for the year ended 30 June 2015.
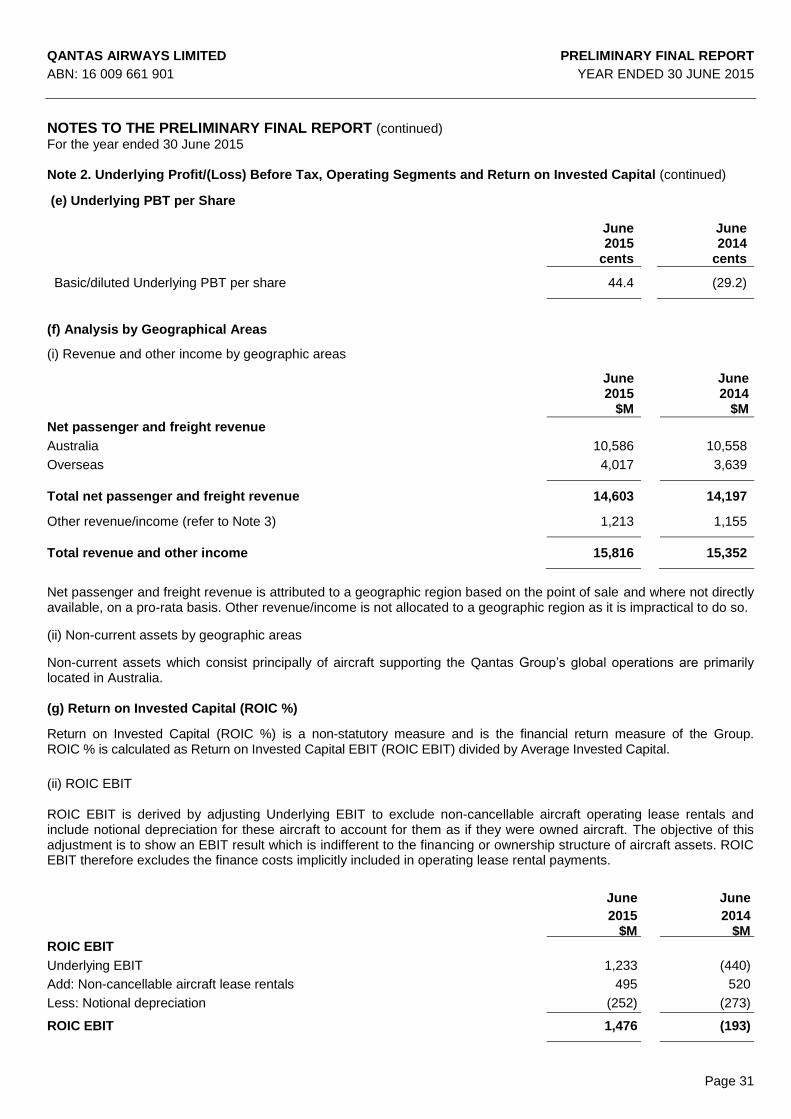
QANTAS AIRWAYS LIMITED PRELIMINARY FINAL REPORT
ABN: 16 009 661 901 YEAR ENDED 30 JUNE 2015
Page 31
NOTES TO THE PRELIMINARY FINAL REPORT (continued)
For the year ended 30 June 2015 Note 2. Underlying Profit/(Loss) Before Tax, Operating Segments and Return on Invested Capital (continued)
(e) Underlying PBT per Share
June 2015
June 2014
cents cents
Basic/diluted Underlying PBT per share 44.4 (29.2)
(f) Analysis by Geographical Areas
(i) Revenue and other income by geographic areas
June 2015
June 2014
$M $M
Net passenger and freight revenue
Australia 10,586 10,558
Overseas 4,017 3,639
Total net passenger and freight revenue 14,603 14,197
Other revenue/income (refer to Note 3) 1,213 1,155
Total revenue and other income 15,816 15,352
Net passenger and freight revenue is attributed to a geographic region based on the point of sale and where not directly available, on a pro-rata basis. Other revenue/income is not allocated to a geographic region as it is impractical to do so.
(ii) Non-current assets by geographic areas
Non-current assets which consist principally of aircraft supporting the Qantas Group’s global operations are primarily located in Australia. (g) Return on Invested Capital (ROIC %)
Return on Invested Capital (ROIC %) is a non-statutory measure and is the financial return measure of the Group. ROIC % is calculated as Return on Invested Capital EBIT (ROIC EBIT) divided by Average Invested Capital.
(ii) ROIC EBIT ROIC EBIT is derived by adjusting Underlying EBIT to exclude non-cancellable aircraft operating lease rentals and include notional depreciation for these aircraft to account for them as if they were owned aircraft. The objective of this adjustment is to show an EBIT result which is indifferent to the financing or ownership structure of aircraft assets. ROIC EBIT therefore excludes the finance costs implicitly included in operating lease rental payments.
June
2015 $M
June
2014 $M
ROIC EBIT
Underlying EBIT 1,233 (440)
Add: Non-cancellable aircraft lease rentals 495 520
Less: Notional depreciation (252) (273)
ROIC EBIT 1,476 (193)
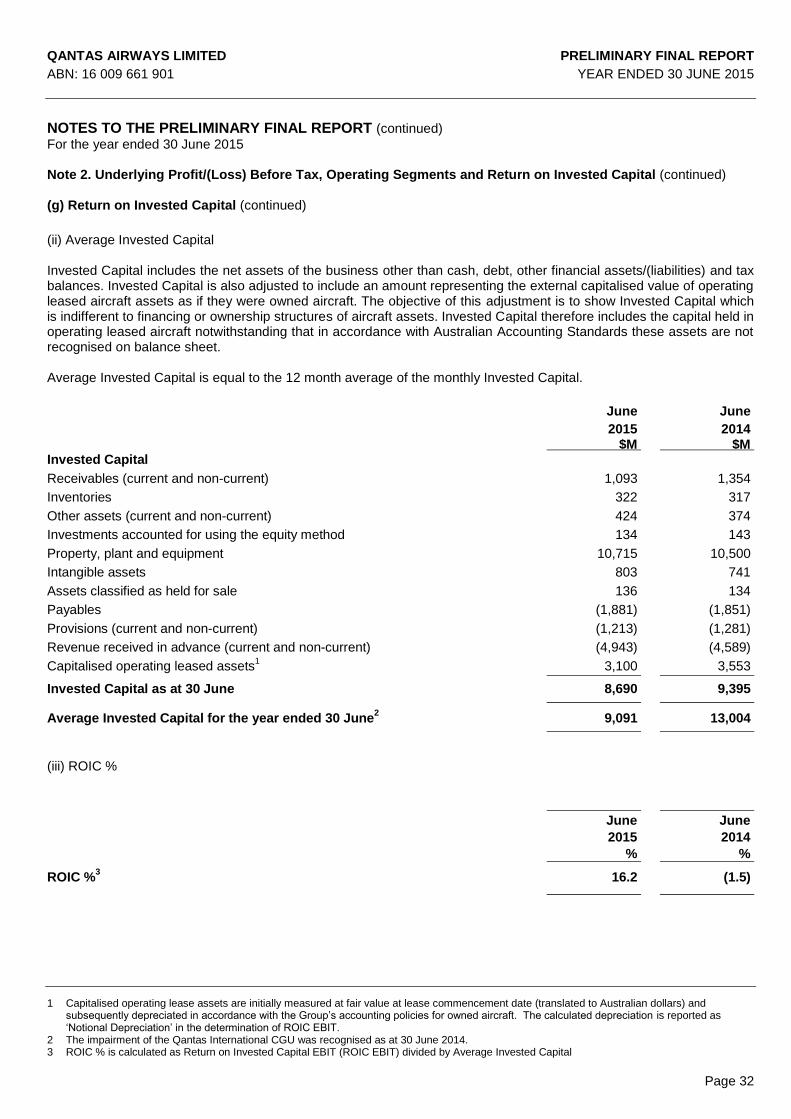
QANTAS AIRWAYS LIMITED PRELIMINARY FINAL REPORT
ABN: 16 009 661 901 YEAR ENDED 30 JUNE 2015
Page 32
NOTES TO THE PRELIMINARY FINAL REPORT (continued)
For the year ended 30 June 2015 Note 2. Underlying Profit/(Loss) Before Tax, Operating Segments and Return on Invested Capital (continued) (g) Return on Invested Capital (continued)
(ii) Average Invested Capital Invested Capital includes the net assets of the business other than cash, debt, other financial assets/(liabilities) and tax balances. Invested Capital is also adjusted to include an amount representing the external capitalised value of operating leased aircraft assets as if they were owned aircraft. The objective of this adjustment is to show Invested Capital which is indifferent to financing or ownership structures of aircraft assets. Invested Capital therefore includes the capital held in operating leased aircraft notwithstanding that in accordance with Australian Accounting Standards these assets are not recognised on balance sheet. Average Invested Capital is equal to the 12 month average of the monthly Invested Capital.
June
2015 $M
June
2014 $M
Invested Capital
Receivables (current and non-current) 1,093 1,354
Inventories 322 317
Other assets (current and non-current) 424 374
Investments accounted for using the equity method 134 143
Property, plant and equipment 10,715 10,500
Intangible assets 803 741
Assets classified as held for sale 136 134
Payables (1,881) (1,851)
Provisions (current and non-current) (1,213) (1,281)
Revenue received in advance (current and non-current) (4,943) (4,589)
Capitalised operating leased assets1 3,100 3,553
Invested Capital as at 30 June 8,690 9,395
Average Invested Capital for the year ended 30 June2 9,091 13,004
(iii) ROIC %
June
2015
%
June
2014
%
ROIC %3 16.2 (1.5)
1 Capitalised operating lease assets are initially measured at fair value at lease commencement date (translated to Australian dollars) and subsequently depreciated in accordance with the Group’s accounting policies for owned aircraft. The calculated depreciation is reported as ‘Notional Depreciation’ in the determination of ROIC EBIT.
2 The impairment of the Qantas International CGU was recognised as at 30 June 2014. 3 ROIC % is calculated as Return on Invested Capital EBIT (ROIC EBIT) divided by Average Invested Capital
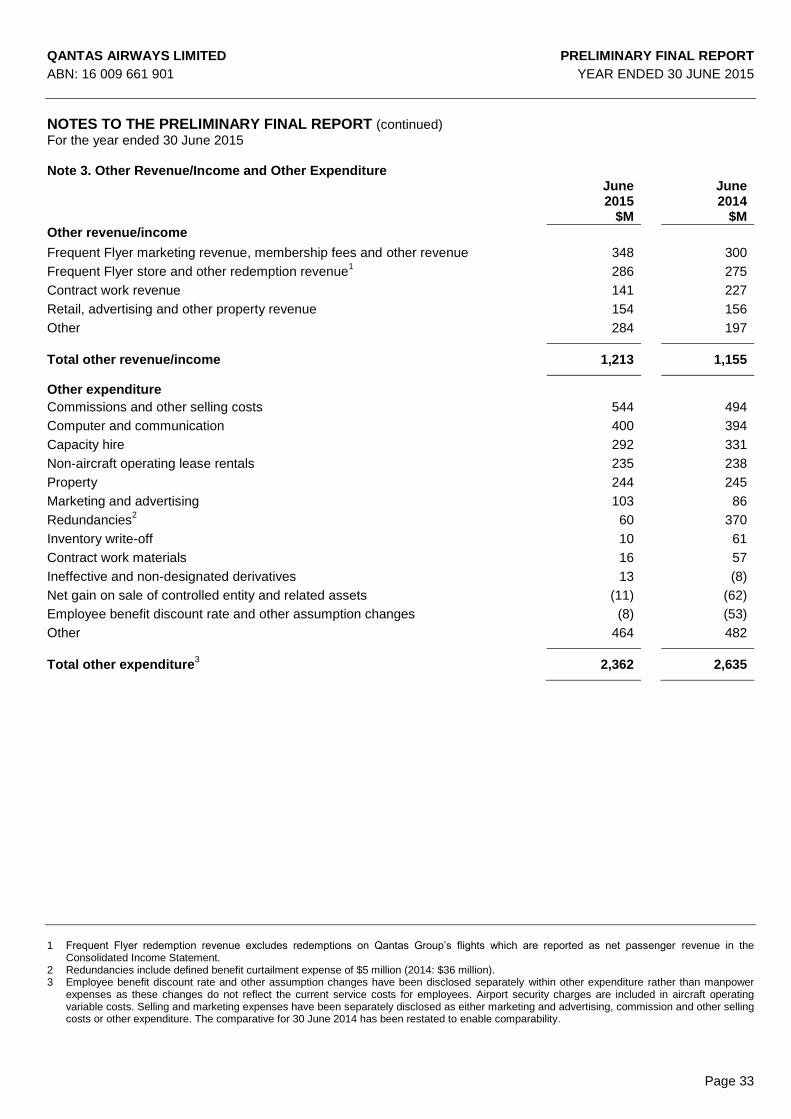
QANTAS AIRWAYS LIMITED PRELIMINARY FINAL REPORT
ABN: 16 009 661 901 YEAR ENDED 30 JUNE 2015
Page 33
NOTES TO THE PRELIMINARY FINAL REPORT (continued)
For the year ended 30 June 2015 Note 3. Other Revenue/Income and Other Expenditure
June 2015
June 2014
$M $M
Other revenue/income
Frequent Flyer marketing revenue, membership fees and other revenue 348 300
Frequent Flyer store and other redemption revenue1 286 275
Contract work revenue 141 227
Retail, advertising and other property revenue 154 156
Other 284 197
Total other revenue/income 1,213 1,155
Other expenditure
Commissions and other selling costs 544 494
Computer and communication 400 394
Capacity hire 292 331
Non-aircraft operating lease rentals 235 238
Property Q 244 245
Marketing and advertising 103 86
Redundancies2 60 370
Inventory write-off 10 61
Contract work materials 16 57
Ineffective and non-designated derivatives 13 (8)
Net gain on sale of controlled entity and related assets (11) (62)
Employee benefit discount rate and other assumption changes (8) (53)
Other 464 482
Total other expenditure3 2,362 2,635
1 Frequent Flyer redemption revenue excludes redemptions on Qantas Group’s flights which are reported as net passenger revenue in the Consolidated Income Statement.
2 Redundancies include defined benefit curtailment expense of $5 million (2014: $36 million). 3 Employee benefit discount rate and other assumption changes have been disclosed separately within other expenditure rather than manpower
expenses as these changes do not reflect the current service costs for employees. Airport security charges are included in aircraft operating variable costs. Selling and marketing expenses have been separately disclosed as either marketing and advertising, commission and other selling costs or other expenditure. The comparative for 30 June 2014 has been restated to enable comparability.
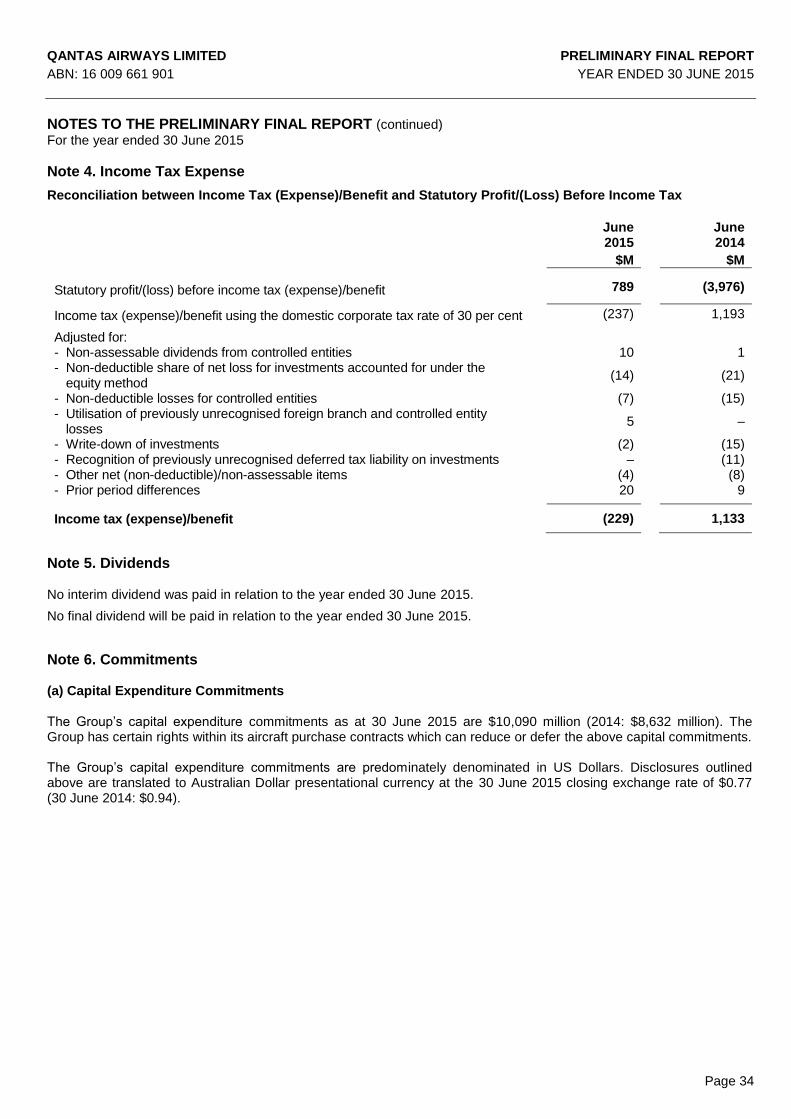
QANTAS AIRWAYS LIMITED PRELIMINARY FINAL REPORT
ABN: 16 009 661 901 YEAR ENDED 30 JUNE 2015
Page 34
NOTES TO THE PRELIMINARY FINAL REPORT (continued)
For the year ended 30 June 2015
Note 4. Income Tax Expense
Reconciliation between Income Tax (Expense)/Benefit and Statutory Profit/(Loss) Before Income Tax
June
2015 June
2014
$M $M
Statutory profit/(loss) before income tax (expense)/benefit 789 (3,976)
Income tax (expense)/benefit using the domestic corporate tax rate of 30 per cent (237) 1,193
Adjusted for: - Non-assessable dividends from controlled entities 10 1 - Non-deductible share of net loss for investments accounted for under the
equity method
(14) (21)
- Non-deductible losses for controlled entities (7) (15) - Utilisation of previously unrecognised foreign branch and controlled entity
losses
5 –
- Write-down of investments (2) (15) - Recognition of previously unrecognised deferred tax liability on investments – (11) - Other net (non-deductible)/non-assessable items (4) (8) - Prior period differences 20 9
Income tax (expense)/benefit (229) 1,133
Note 5. Dividends No interim dividend was paid in relation to the year ended 30 June 2015.
No final dividend will be paid in relation to the year ended 30 June 2015.
Note 6. Commitments (a) Capital Expenditure Commitments The Group’s capital expenditure commitments as at 30 June 2015 are $10,090 million (2014: $8,632 million). The Group has certain rights within its aircraft purchase contracts which can reduce or defer the above capital commitments. The Group’s capital expenditure commitments are predominately denominated in US Dollars. Disclosures outlined above are translated to Australian Dollar presentational currency at the 30 June 2015 closing exchange rate of $0.77 (30 June 2014: $0.94).
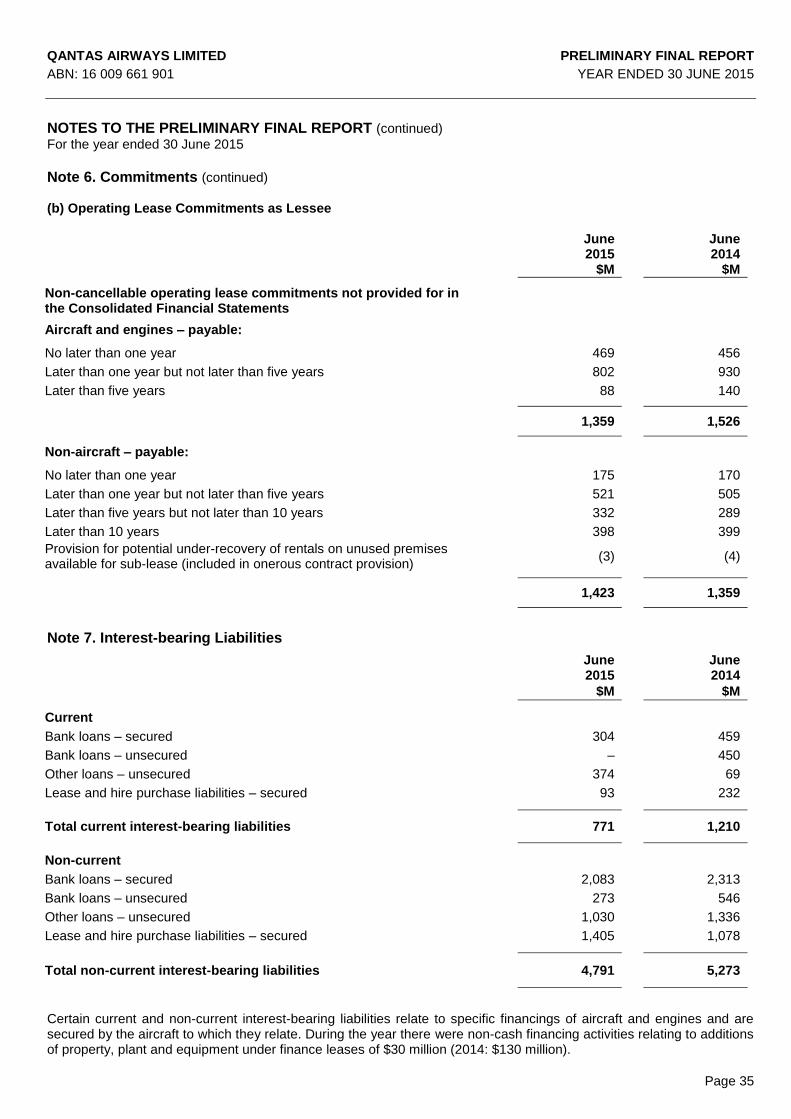
QANTAS AIRWAYS LIMITED PRELIMINARY FINAL REPORT
ABN: 16 009 661 901 YEAR ENDED 30 JUNE 2015
Page 35
NOTES TO THE PRELIMINARY FINAL REPORT (continued)
For the year ended 30 June 2015
Note 6. Commitments (continued)
(b) Operating Lease Commitments as Lessee
June 2015
$M
June 2014
$M
Non-cancellable operating lease commitments not provided for in the Consolidated Financial Statements
Aircraft and engines – payable:
No later than one year 469 456
Later than one year but not later than five years 802 930
Later than five years 88 140
1,359
1,526
Non-aircraft – payable:
No later than one year 175 170
Later than one year but not later than five years 521 505
Later than five years but not later than 10 years 332 289
Later than 10 years 398 399
Provision for potential under-recovery of rentals on unused premises available for sub-lease (included in onerous contract provision)
(3) (4)
1,423 1,359
Note 7. Interest-bearing Liabilities
June
2015
June 2014
$M $M
Current
Bank loans – secured 304 459
Bank loans – unsecured – 450
Other loans – unsecured 374 69
Lease and hire purchase liabilities – secured 93 232
Total current interest-bearing liabilities 771 1,210
Non-current
Bank loans – secured 2,083 2,313
Bank loans – unsecured 273 546
Other loans – unsecured 1,030 1,336
Lease and hire purchase liabilities – secured 1,405 1,078
Total non-current interest-bearing liabilities
4,791 5,273
Certain current and non-current interest-bearing liabilities relate to specific financings of aircraft and engines and are secured by the aircraft to which they relate. During the year there were non-cash financing activities relating to additions of property, plant and equipment under finance leases of $30 million (2014: $130 million).
QANTAS AIRWAYS LIMITED PRELIMINARY FINAL REPORT
ABN: 16 009 661 901 YEAR ENDED 30 JUNE 2015
Page 36
NOTES TO THE PRELIMINARY FINAL REPORT (continued)
For the year ended 30 June 2015
Note 8. Entities over which control was gained or lost during the year On 24 March 2015, Qantas Frequent Flyer Limited (Qantas Loyalty) acquired a 51 per cent controlling interest in Taylor Fry Holdings Pty Limited (Taylor Fry Holdings), which owns 100 per cent of Taylor Fry Pty Limited for $9 million. From this date, the results of Taylor Fry Holdings are consolidated into the results of the Group with a 49 per cent non-controlling interest being recognised. Goodwill of $8 million was recognised on acquisition. During the year, the Group sold the Tour East Group subsidiaries for SGD$18.3 million (A$16.3 million). These entities are wholly owned subsidiaries of the Holiday Tours and Travel Group of which Qantas owns 75 per cent. A gain on sale of these subsidiaries of $13 million was recognised.
Note 9. Post Balance Date Events Sale of Terminal Three On 18 August 2015, Qantas Airways Limited and Sydney Airport Corporation Limited (SACL) reached a commercial agreement that delivers long-term certainty to both concerning the airport’s domestic third terminal. Under the terms of the 10-year deal, ownership of Terminal Three will revert from Qantas to SACL as of 1 September 2015. Qantas held a 30-year lease on the terminal, signed in 1989, which was due to expire on 30 June 2019. Qantas will receive total cash proceeds of $535 million from SACL which exceeds the carrying value of the assets disposed. Use of the terminal from 1 September will incur a per-passenger charge at an agreed rate through to 2025. In line with current operations, Qantas will retain exclusive use of Terminal Three and will manage the terminal on behalf of SACL until July 2019. After that time, Qantas will retain priority access to Terminal Three through to 2025. The arrangement with SACL also incorporates a five-year agreement covering Qantas’ domestic runway charge and Qantas and Jetstar international aeronautical charges. Shareholder Distribution On 20 August 2015, Qantas announced that the Board proposed to undertake a capital management initiative for Qantas shareholders, comprising a distribution to shareholders of 23 cents per share and a related share consolidation. The proposed capital management initiative (subject to shareholder approval at Qantas’ Annual General Meeting in October 2015) is comprised of: – a return of approximately $505 million of share capital (to be effected by Qantas paying each shareholder 23 cents
per share held), to be paid in November 2015; and
– an equal and proportionate share consolidation, relating to the return of capital, through the conversion of each
share into 0.939 shares.
Other than the matters noted above, there has not arisen in the interval between 30 June 2015 and the date of this Report any other event that would have had a material effect on the Consolidated Financial Statements as at 30 June 2015.
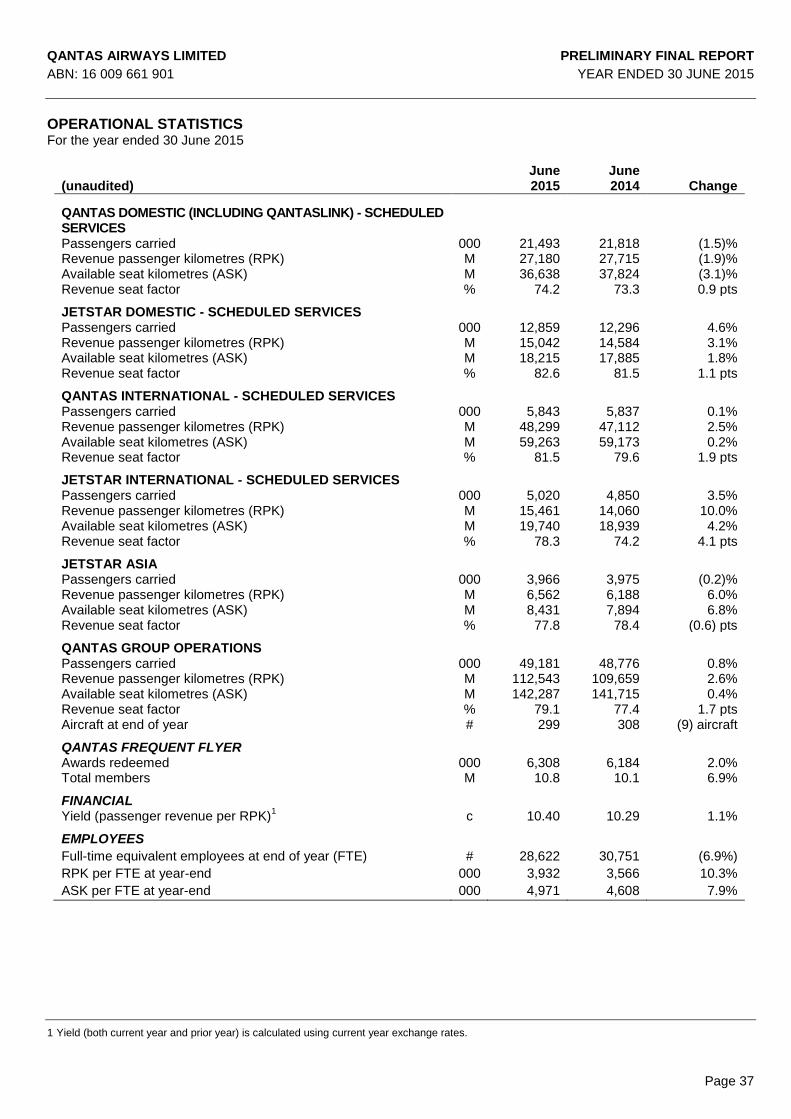
QANTAS AIRWAYS LIMITED PRELIMINARY FINAL REPORT
ABN: 16 009 661 901 YEAR ENDED 30 JUNE 2015
Page 37
OPERATIONAL STATISTICS
For the year ended 30 June 2015
(unaudited) June 2015
June 2014 Change
QANTAS DOMESTIC (INCLUDING QANTASLINK) - SCHEDULED SERVICES Passengers carried 000 21,493 21,818 (1.5)% Revenue passenger kilometres (RPK) M 27,180 27,715 (1.9)% Available seat kilometres (ASK) M 36,638 37,824 (3.1)% Revenue seat factor % 74.2 73.3 0.9 pts
JETSTAR DOMESTIC - SCHEDULED SERVICES
Passengers carried 000 12,859 12,296 4.6% Revenue passenger kilometres (RPK) M 15,042 14,584 3.1% Available seat kilometres (ASK) M 18,215 17,885 1.8% Revenue seat factor % 82.6 81.5 1.1 pts
QANTAS INTERNATIONAL - SCHEDULED SERVICES
Passengers carried 000 5,843 5,837 0.1% Revenue passenger kilometres (RPK) M 48,299 47,112 2.5% Available seat kilometres (ASK) M 59,263 59,173 0.2% Revenue seat factor % 81.5 79.6 1.9 pts
JETSTAR INTERNATIONAL - SCHEDULED SERVICES
Passengers carried 000 5,020 4,850 3.5% Revenue passenger kilometres (RPK) M 15,461 14,060 10.0% Available seat kilometres (ASK) M 19,740 18,939 4.2% Revenue seat factor % 78.3 74.2 4.1 pts
JETSTAR ASIA
Passengers carried 000 3,966 3,975 (0.2)% Revenue passenger kilometres (RPK) M 6,562 6,188 6.0% Available seat kilometres (ASK) M 8,431 7,894 6.8% Revenue seat factor % 77.8 78.4 (0.6) pts QANTAS GROUP OPERATIONS
Passengers carried 000 49,181 48,776 0.8% Revenue passenger kilometres (RPK) M 112,543 109,659 2.6% Available seat kilometres (ASK) M 142,287 141,715 0.4% Revenue seat factor % 79.1 77.4 1.7 pts Aircraft at end of year # 299 308 (9) aircraft
QANTAS FREQUENT FLYER
Awards redeemed 000 6,308 6,184 2.0% Total members M 10.8 10.1 6.9%
FINANCIAL
Yield (passenger revenue per RPK)1 c 10.40 10.29 1.1%
EMPLOYEES
Full-time equivalent employees at end of year (FTE) # 28,622 30,751 (6.9%)
RPK per FTE at year-end 000 3,932 3,566 10.3%
ASK per FTE at year-end 000 4,971 4,608 7.9%
1 Yield (both current year and prior year) is calculated using current year exchange rates.