Embed Size (px)
Citation preview
Research Material - 187
Japanese Science and Technology
Indicators 2010Jan. 2011
Research Unit for Science and Technology Analysis and IndicatorsNational Institute of Science and Technology Policy, MEXT
Research Material - 187
Japanese Science and Technology Indicators 2010NISTEP, M
EXT
This material is the English translation from the “Science and Technology Indicators 2010” by NISTEP in July 2010.
Japanese Science and Technology Indicators 2010
January 2011
Research Unit for Science and
Technology Analysis and Indicators
National Institute of Science and Technology Policy
(NISTEP)
Ministry of Education, Culture, Sports,
Science and Technology, Japan
i
Science and Technology Indicators 2010 Table of Contents
Summary ··································································································································· 1 Main parts Chapter 1:R&D expenditure ······································································································· 13
1.1 International comparison of each country’s R&D expenditure ······················································· 13 1.1.1 Trend of R&D expenditure in each country ········································································· 13 1.1.2 Trend of R&D expenditure by sector in each country ···························································· 17
1.2 Government budgets ··········································································································· 20 1.2.1 GBAORD in each country ······························································································· 20 1.2.2 Ratio of R&D expenditure funded by the government in each country ······································ 23 1.2.3 GBAORD (the government budget appropriations for S&T) in Japan ········································ 26
1.3 R&D expenditure by sector ··································································································· 29 1.3.1 R&D expenditure in the public organization sector ······························································· 29
(1) R&D expenditure in the public organization sector for each country ········································· 29 (2) R&D expenditure in Japan’s public organization sector ························································· 31
1.3.2 R&D expenditure in the business enterprise sector ······························································ 32 (1) R&D expenditure in the business enterprise sector for each country ········································ 32 (2) R&D expenditure per turnover amount in the business enterprise sector ··································· 35
1.3.3 R&D expenditure in the university and college sector ··························································· 36 (1) R&D expenditure in the university and college sector in each country ······································· 36 (2) Structure of source of funds for R&D expenditure in the university and college sector in selected countries ······························································································ 39 (3) Funding structure for universities and colleges R&D expenditures by form of institution in Japan and U.S. ··············································································· 42 (4) Comparison of share of R&D expenditures in total operating costs at Japanese and U.S. universities and colleges ···································································· 44 Column: The status of U.S. universities and colleges’ revenue and expenditures ··································· 47
(5) R&D expenditure in the university and college sector in Japan ················································ 48 (6) R&D expenditure by item of expense in the university and college sector for Japan ···················· 50
1.4 R&D expenditure by type of R&D ··························································································· 51 1.4.1 R&D expenditure by type of R&D ····················································································· 51
(1) Basic research in each country ························································································ 52 1.4.2 R&D expenditure by type of R&D in each sector for each country············································ 55
(1) R&D expenditure by type of R&D in the public organization sector ··········································· 55 (2) R&D expenditure by type of R&D in the business enterprise sector ·········································· 58 (3) R&D expenditure by type of R&D in the university and college sector ······································· 60
ii
Chapter 2:R&D personnel ·················································································································· 63
2.1 International comparison of the number of researchers in each country ················································· 63
2.1.1 Methods for measuring the number of researchers in each country ················································· 63
2.1.2 Trends in the numbers of researchers in each country ·································································· 67
2.1.3 Trends in the proportion of the number of researchers by sector in each selected country ··················· 69
2.1.4 Female researchers in each country ························································································· 72
2.1.5 Doctoral degree holders ········································································································· 74
2.1.6 Mobility of researchers ··········································································································· 75
2.2 Researchers by sector ················································································································· 77
2.2.1 Researchers in the public organization sector ············································································· 77
(1) Researchers in public organizations in each country ···································································· 77
(2) Researchers in the public organization sector in Japan ································································ 80
2.2.2 Researchers in the business enterprise sector ············································································ 81
(1) Researchers in the business enterprise sector in each country ······················································ 81
(2) Researchers by industry in each country ··················································································· 82
(3) Density of the number of researchers against the total number of employees by industry for Japan ······ 83
2.2.3 Researchers in the university and college sector ········································································· 84
(1) Researchers in the university and college sector in each country ··················································· 84
(2) International comparison of the number of researchers in the university and college sector ················· 84
(3) Researchers in the university and college sector in Japan ···························································· 86
(4) Greater diversity in alma maters of university teachers ································································· 88
2.3 Research assistants ···················································································································· 89
2.3.1 Status of research assistants in each country ············································································· 89
2.3.2 Status of research assistants in the university and college sector in Japan ······································· 92
(1) Breakdown of research assistants ···························································································· 92
(2) Research assistants per researcher·························································································· 94
(3) Research assistants per teacher ······························································································ 95
Chapter 3:Higher Education ················································································································ 97
3.1 The status of the number of students in Japan’s education institutions ·················································· 97
3.2 The status of students in Higher Education institutions ······································································· 98
3.2.1 New enrollment of undergraduates ··························································································· 98
3.2.2 New enrollment in master’s programs in graduate schools ··························································· 100
3.2.3 New enrollment in doctoral programs in graduate schools ···························································· 101
3.2.4 The ratio of female students ··································································································· 102
3.2.5 Mature students in higher education institutions ········································································· 103
3.3 Career options for students in Natural sciences and Engineering························································· 104
3.3.1 The status of employment and continuing education among students of
iii
Natural sciences and Engineering ····················································································· 104
(1) Career options of college graduates ························································································ 104
(2) Career options of persons who complete master’s programs ························································ 105
Column: Postdoctoral career options in Natural sciences and Engineering ·········································· 106
3.3.2 The employment status of students of Natural sciences and Engineering by industry classification ······ 107
(1) College graduates entering employment ··················································································· 107
(2) Master’s degree program graduates entering employment ··························································· 108
(3) Doctoral graduates entering employment ·················································································· 108
3.3.3 The employment status of Natural sciences and Engineering students ··········································· 109
(1) College graduates entering employment ··················································································· 109
(2) Master’s degree program graduates entering employment ··························································· 109
(3) Doctoral graduates entering employment ·················································································· 110
3.4 International comparison of degree awarded ··················································································· 111
3.4.1 Doctoral degree awarded in Japan ·························································································· 111
3.4.2 International comparison of the number of bachelor’s degrees, master’s degrees
and doctorates degrees awarded····························································································· 112
(1) Bachelor’s degrees awarded per one million of the population ······················································ 112
(2) Master’s degrees awarded per one million of the population ························································· 113
(3) Doctoral degrees awarded per one million of the population ························································· 114
(4) The percentage of international and foreign students in institutes of higher education ······················· 114
Column: The International Science Olympiads ··············································································· 116
Chapter 4:The output of R&D ··································································································· 119
4.1 Scientific Papers ·············································································································· 119 4.1.1 Quantitative and qualitative changes in research activities in the world ··································· 120
(1) The change in the numbers of papers ············································································· 120 (2) The change in the style of the production of papers ···························································· 120
4.1.2 A comparison of research activities by country ·································································· 122 (1) International comparison of countries by “the degree of participation in the production of papers in the world” and “the degree of contribution to the production of papers in the world” ······ 122 (2) A comparison of the share of the numbers of papers ·························································· 124 (3) A comparison of the numbers of Top 10% papers ······························································· 125
4.1.3 The characteristics of the research activities of main countries ············································· 126 (1) The ratio of the numbers of papers in the world and main countries by field ····························· 126 (2) A comparison of the field balance by quantity and quality in the main countries ························ 129 (3) The change in the production styles of papers in main countries ··········································· 130 Column: Times cited in domestic co-authorship papers and international co-authorship papers ········ 132
4.2 Patents ··························································································································· 133
iv
4.2.1 The patent applications in the world ················································································ 134 (1) The number of patent applications in the world ·································································· 134 (2)The situation of patent applications in main countries ·························································· 135
4.2.2 The patent applications to trilateral patent offices from the main countries ······························· 137 4.2.3 The patent applications by technological field ··································································· 139
(1) The patent applications to EPO by field ··········································································· 139 (2) The granted patents in USPTO by field ············································································ 139
4.2.4 The analysis of Science Linkage and Technological Cycle Time for US Patents ······················· 142
Chapter 5:The outcome of R&D ································································································ 145 5.1 Technology trade ·············································································································· 145
5.1.1 International comparison of technology trade ···································································· 145 5.1.2 The Technology Trade of Japan ····················································································· 150
(1) Technology trade by industry classification ······································································· 150 (2) Technology trade by industry classification and partner ······················································· 152
5.2 High-technology industry trade ···························································································· 155 5.3 Total Factor Productivity (TFP) ···························································································· 158
Reference Materials Indicators for the regions ·················································································································· 159
1. The number of graduate students in national, public and private universities and colleges ······················ 160
2. The number of papers (all fields) ································································································· 162
3. The number of papers (the field of Life sciences) ············································································ 164
4. The number of papers (the field of Natural sciences and Engineering) ················································ 166
5. The balance of papers between the field of Natural sciences and Engineering and
the field of Life sciences ············································································································ 168
6. The number of patent applications ······························································································· 170
7. The number of inventors ············································································································ 172
Statistical Reference A Population of the main countries ······································································ 174
Statistical Reference B Labor force population of the main countries ······················································ 174
Statistical Reference C Gross Domestic Product (GDP) of the main countries ·········································· 175
Statistical Reference D Gross Domestic Product (GDP) deflator of the main countries ······························· 176
Statistical Reference E Purchasing Power Parity of the main countries ··················································· 176
v
List of charts
Chapter 1 R&D expenditure Chart 1-1-1: Trend in total R&D expenditure in selected countries ······························································ 14
Chart 1-1-2: Ratio of the total R&D expenditure against GDP in each country (2007) ···································· 16
Chart 1-1-3: Trend in the ratio of the total R&D expenditure against GDP for each country ····························· 16
Chart 1-1-4: The definition of the performing sector in R&D expenditure in selected countries ························· 17
Chart 1-1-5: Trends in the proportion of R&D expenditure by performing sector in selected countries ··············· 18
Chart 1-2-1: Trend in the GBAORD in selected countries ········································································· 21
Chart 1-2-2: Trends of the ratio of Government budget appropriations or outlays for R&D
against GDP in selected countries ····················································································· 22
Chart 1-2-3: Definition of “the government” as a source of expenditure in selected countries ·························· 23
Chart 1-2-4: Trend in the ratio of R&D expenditure funded by the government in selected countries ················· 23
Chart 1-2-5: Trend of the proportion of R&D expenditure funded by the government by sector
in selected countries ······································································································· 24
Chart 1-2-6: Trend of the government budget appropriation for S&T under the Science and Technology
Basic Plans ··················································································································· 27
Chart 1-2-7: Trend of the growth rate of the total government budget appropriations for S&T
and the general expenditure, both compared to previous fiscal years in Japan ··························· 27
Chart 1-2-8: Breakdown of Japanese government budget appropriations for S&T (FY 2010) ··························· 27
Chart 1-2-9: Trend in the breakdown of the government budget appropriation by ministry and agency ·············· 28
Chart 1-2-10: Government budget appropriations for S&T by the central government and
by local governments (FY 2009) ························································································ 28
Chart 1-3-1: Trend of R&D expenditure in the public organization sector for selected countries ······················· 30
Chart 1-3-2: Trend of R&D expenditure used by public organization sector in Japan ····································· 31
Chart 1-3-3: R&D expenditure in the business enterprise sector for selected countries ·································· 32
Chart 1-3-4: Trend in the Ratio of R&D expenditure in the business enterprise sector
against GDP for selected countries ···················································································· 34
Chart 1-3-5: Direct fund distribution and R&D tax incentives by the government for R&D
in the business enterprise sector (2007) ·············································································· 34
Chart 1-3-6: Comparison between R&D expenditure in the manufacturing industry and
in all industries in selected countries (OECD purchasing power parity equivalent) ······················· 35
Chart 1-3-7: R&D per turnover in the business enterprise sector ······························································· 35
Chart 1-3-8: Trend of R&D expenditure in the university and college sector for selected countries ··················· 37
Chart 1-3-9: Trend of the ratio of R&D expenditure in the university and college sector
against the total for selected countries ················································································ 39
Chart 1-3-10: Changes in the cost-sharing structure for universities and colleges R&D expenditure
in selected countries ······································································································· 40
vi
Chart 1-3-11: Number of universities and colleges ·················································································· 42
Chart 1-3-12: Funding structure for R&D expenditures of universities and colleges in Japan and U.S. ·············· 43
Chart 1-3-13: Share of total expenditures at Japanese universities accounted for by R&D expenditures ··········· 44
Chart 1-3-14: Share of total expenditures at U.S. universities and colleges accounted for
by research expenditures (IPEDS data) ·············································································· 45
Chart 1-3-15: Share of total expenditures at U.S. universities and colleges accounted for
by R&D expenditures (NSF data) ······················································································· 45
Chart 1-3-16: Comparison of statistics on R&D expenditures at Japanese and U.S. universities and colleges ···· 46
Chart 1-3-17: Financial status of U.S. universities and colleges ································································· 47
Chart 1-3-18: R&D expenditure by national, public and private universities ·················································· 48
Chart 1-3-19: Trend of the proportion of R&D expenditure by field of study in universities and colleges ············· 49
Chart 1-3-20: Trend of the ratio of R&D expenditure from the business enterprise sector
against the total intramural R&D expenditure in universities and colleges ·································· 49
Chart 1-3-21: R&D expenditure by item of expense in universities and colleges ··········································· 50
Chart 1-4-1: Trend of the proportion of R&D expenditure by type of R&D in selected countries ························ 52
Chart 1-4-2: Basic research expenditure by sector in selected countries ····················································· 53
Chart 1-4-3: R&D expenditure by type of R&D in the public organization sector for selected countries ·············· 55
Chart 1-4-4: R&D expenditure by type of R&D in the business enterprise sector
for selected countries (for all industries) ·············································································· 58
Chart 1-4-5: R&D expenditure by type of R&D in the university and college sector
in selected countries ······································································································· 60
Chapter 2 R&D personnel
Chart 2-1-1: Definition and measurement method of researchers by sector in each country ···························· 65
Chart 2-1-2: Methods for measuring researchers in Japan ······································································· 65
Chart 2-1-3: Trends in the number of researchers in selected countries ······················································ 67
Chart 2-1-4: Trends in the number of researchers per capita in selected countries ········································ 68
Chart 2-1-5: Trends in the number of researchers per labor force in selected countries ·································· 68
Chart 2-1-6: Breakdown of the number of researchers by sector in selected countries ··································· 69
Chart 2-1-7: Trends in the number of researchers by sector ····································································· 70
Chart 2-1-8: Ratio of the number of female researchers against the total (comparison in HC values) ················ 72
Chart 2-1-9: The ratio of the number of female researchers by sector for selected countries ··························· 72
Chart 2-1-10: The number of Japanese female researchers and their ratio against
the total number of researchers ························································································· 73
Chart 2-1-11: Ratio of the doctoral degree holders from foreign countries against
the total by specialized field of study in U.S. (2006) ······························································· 74
Chart 2-1-12: Status of employment for doctoral degree holders by country or region of origin
in each occupational field (2006) ······················································································· 74
vii
Chart 2-1-13: Employment status for post doctoral fellows in the university and college sector
and public organization by the field of research in Japan (2008) ·············································· 75
Chart 2-1-14: Numbers of new graduates employed and midterm recruits/transfers with regard to researchers ·· 76
Chart 2-1-15: Breakdown of transferred researchers from other sectors by their former affiliated sector ············ 76
Chart 2-2-1: Researchers in the public organization sector in selected countries ·········································· 79
Chart 2-2-2: Trend in the number of researchers in the public organization sector in Japan ···························· 80
Chart 2-2-3: Breakdown of researchers in the public organization sector by specialty in Japan ························ 80
Chart 2-2-4: Trends in the number of researchers in the business enterprise sector in selected countries ·········· 81
Chart 2-2-5: Number of researchers by industry in each country ································································ 82
Chart 2-2-6: Number of researchers per 10,000 employees by type of industry in Japan (2009) ······················ 83
Chart 2-2-7: Trends in the number of researchers in the university and college sector for selected countries ····· 84
Chart 2-2-8: Number of researchers in the university and college sector ····················································· 85
Chart 2-2-9: Breakdown of the number of researchers in the university and college sector in Japan (2009) ······· 86
Chart 2-2-10: Researchers in the university and college sector in Japan ····················································· 86
Chart 2-2-11: Ratio of university teachers working at their alma maters······················································· 88
Chart 2-3-1: Research assistants by sector in each country ······································································ 90
Chart 2-3-2: Trends in the number of research assistants per researcher by sector for selected countries ········· 90
Chart 2-3-3: Numbers of research assistants by academic field of study in the university and college sector ······ 92
Chart 2-3-4: Breakdown of research assistants by academic field of study in the university and college sector ··· 93
Chart 2-3-5: Trends in the number of research assistants per researcher by type of university
in each academic field ····································································································· 94
Chart 2-3-6: Trends in the number of research assistants per teacher by type of university
in each academic field ····································································································· 95
Chapter 3 Higher Education Chart 3-1: The present status of the number of students and pupils in school education (for the FY 2009) ········· 97
Chart 3-2-1: 18-year-olds in the population and the transition of the numbers newly enrolled
for undergraduate studies ································································································ 98
Chart 3-2-2: The numbers newly enrolled for undergraduate studies ·························································· 99
Chart 3-2-3: The number of new enrollments in graduate school (master’s program) ···································· 100
Chart 3-2-4: The numbers of new enrollments in graduate school (doctoral program) ··································· 101
Chart 3-2-5: The ratio of new enrollment of female students for undergraduate studies ································· 102
Chart 3-2-6: The transition of the number of mature graduate students in Japan·········································· 103
Chart 3-2-7: The transition of Natural sciences and Engineering mature graduate students ··························· 103
Chart 3-3-1: Career options of “Natural sciences and Engineering” college graduates ·································· 104
Chart 3-3-2: Career options of persons who complete master’s programs
in “Natural sciences and Engineering” ··············································································· 105
Chart 3-3-3: Postdoctoral career options in Natural sciences and Engineering ············································ 106
viii
Chart 3-3-4: College graduates in Natural sciences and Engineering entering employment ··························· 107
Chart 3-3-5: Graduates from master’s degree programs in Natural sciences and Engineering
entering employment ······································································································ 108
Chart 3-3-6: Doctoral graduates in Natural sciences and Engineering entering employment ·························· 108
Chart 3-3-7: The status of Natural sciences and Engineering college graduates by occupation ······················ 109
Chart 3-3-8: The status of the employment of persons who completed master’s program
in Natural sciences and Engineering by occupation ······························································ 109
Chart 3-3-9: The status of the employment of doctoral graduates in Natural sciences
and Engineering by occupation ························································································ 110
Chart 3-4-1: The transition of the number of doctorates awarded ······························································ 111
Chart 3-4-2: The Change of the number of doctorates awarded (the number of Ph.D.s conferred
by a thesis alone/the number of Ph.D.s awarded during a doctoral program) ····························· 112
Chart 3-4-3: The international comparison of the number of bachelor’s degrees awarded
per one million of the population ······················································································· 113
Chart 3-4-4: Percentage of international and foreign students in institutes of higher education ······················· 115
Chart 3-4-5: The national origins and the former country of residence of students overseas
and foreign students who are in higher education (2007) ······················································· 115
Chart 3-5-1: Medal counts of major countries in the International Science Olympiads ··································· 117
Chapter 4 The output of R&D Chart 4-1-1: The change in the numbers of papers in the world ································································ 120
Chart 4-1-2: The change in the ratio of the co-authorship forms in the world ··············································· 120
Chart 4-1-3: International co-authorship papers by field ·········································································· 121
Chart 4-1-4: The methods of whole counting and fractional counting ························································· 122
Chart 4-1-5: The numbers of the papers presented by country and region: Top 25 countries and regions ········· 123
Chart 4-1-6: The change in the share of the numbers of papers in main countries
(All fields, moving average over 3 years) ············································································ 124
Chart 4-1-7: The change in the share of the numbers of Top 10% papers in main countries
(All fields, moving average over 3 years) ············································································ 125
Chart 4-1-8: The change in the ratio of the numbers of the papers in the world by field ····························· 126
Chart 4-1-9: The change in the ratio of the numbers of the papers in main countries by field ·························· 127
Chart 4-1-10: A comparison of the share of the papers and Top 10% papers
in main countries by field (%, 2007–2009) ·········································································· 129
Chart 4-1-11: The change in the ratio of the numbers of papers in main countries by co-authorship form ·········· 130
Chart 4-1-12: A comparison of papers in main countries, when divided into domestic papers
and internationally co-authored papers (1996-2000) ····························································· 132
Chart 4-2-1: The change in the numbers of patent applications in the world ················································ 134
Chart 4-2-2: The situation of patent applications to and from main countries ··············································· 135
ix
Chart 4-2-3: The share of the patent applications of the main countries to JPO, EPO and USPTO ·················· 138
Chart 4-2-4: The situation of patent applications to EPO by field ······························································· 140
Chart 4-2-5: The situation of patent applications to USPTO by field ··························································· 141
Chart 4-2-6: The numbers of registrations of patents by industrial classification
(the average value over 3 years) ······················································································ 142
Chart 4-2-7: Science Linkage in US Patents ························································································· 143
Chart 4-2-8: Technology Cycle Time for US Patents ··············································································· 144
Chapter 5 The outcome of R&D Chart 5-1-1: The technology trade of main countries ·············································································· 146
Chart 5-1-2: The change in the amount of technology trade in Japan and U.S. (Technology trade
among parent companies and subsidiaries, associated companies and others) ························· 148
Chart 5-1-3: The ratio of the amount of technology trade against the whole amount of trade ·························· 149
Chart 5-1-4: The technology trade of Japan by industry classification ························································ 151
Chart 5-1-5: The amount of technology trade of Japan by partner (FY 2008) ·············································· 153
Chart 5-2-1: The change of the trade amount of the high-technology industry
of 30 OECD member-countries and 17 Non-OECD countries and regions ································ 156
Chart 5-2-2: The trade balance of High-Technology industries in main countries ·········································· 156
Chart 5-2-3: The change in the trade amount of high technology industry in main countries ··························· 157
Chart 5-2-4: The breakdown of the factors of economic growth rates in main countries ································· 158

- 1 -
Summary
1. R&D expenditure
(1) International comparison of each country’s R&D expenditure
The total Japan’s R&D expenditure was approximately 18.8 trillion yen in FY 2008. This amount
is the equivalent of approximately 17.8 trillion yen on a full time equivalent (FTE) basis, the
highest ever ratio against GDP (3.8% and 3.4%, respectively).
Out of all the performing sectors, the business enterprise sector accounted for the highest ratio of
the total R&D expenditure in each country. The proportions of R&D expenditure by the business
enterprise sector in Japan, U.S. and Germany were approximately 70%; however, those in France
and U.K. were approximately 60%.
The proportion of R&D expenditure by the university and college sector in U.K. is increasing while
that in Japan and Germany remains flat.
(2) Government budgets With regard to the GBAORD (government budget appropriations or outlays for Science &
Technology), only in Japan was the growth rate lower during the 2000s than in the 1990s. In all the
other countries, the growth rate was higher during the 2000s than in the 1990s.
Japan’s initial government budget (the government budget appropriation for S&T) in FY 2010 was 3.6
trillion yen.
(3) R&D expenditure in the business enterprise sector The ratio of R&D expenditure against GDP in the business enterprise sector was 2.74% in Japan
followed by 2.45% in Korea, and each value was an all time high in the corresponding country.
The ratio was 2.00% in U.S., and has recently been gradually increasing.
With regard to direct fund distribution (direct aid) and R&D tax incentives (indirect aid) to the
business enterprise sector by the government in each country, the former accounts for a large
proportion in U.S. France, U.K., etc., and the latter accounts for a large proportion in the in Japan,
Canada, etc., respectively.
(4) R&D expenditure in the university and college sector The R&D expenditure in the university and college sector was 3445.0 billion yen (FY 2008), which
is the equivalent of 2,236.1 billion (FY 2007) yen if the labor cost is multiplied by FTE factor.
With regard to the annual average growth rate of R&D expenditure by real value (2000 base,
national currency), Japan, U.S. and France showed a lower rise in the 1990s than in the 2000s.
However, U.S. was still relatively high at 3.9%.
Looking at the share of universities and colleges R&D expenditure covered by governments, more
than 80% is covered in Germany and France, while about 70% is covered in U.S., U.K. and, in
recent years, Korea. In Japan, the figure is about 50%.
- 2 -
By observing the R&D expenditure in the university and college sector in Japan by field, it was
found that national universities used approximately 50% of the total R&D expenditure in the field of
natural science and engineering, While private universities used approximately 70% of the total
R&D expenditure in the field of social sciences and humanities.
(5) R&D expenditure by type of R&D Among the countries studied, in France, the proportion of R&D expenditure for basic research in
the latest available year was 25.1%. In contrast, the proportion of R&D expenditure for the basic
research was smallest in China at 4.7%. In Japan and U.S., the values were 13.7% and 17.4%,
respectively.
With regard to R&D expenditure by type of R&D in the business enterprise sector, the expenditure
for development accounts for 70% or more in Japan, U.S., China and Korea. Expenditure for
applied research for approximately 40% in France and U.K.
- 3 -
2. Chapter 2 R&D Human Resources
(1) International comparison of the number of researchers in each country
The definition and measurement of researchers in each country are conducted in line with the
Frascati Manual. However, the actual methods used for the investigations are often different in each
country. In particular, the university and college sector are excluded from the coverage of R&D
statistical surveys in some countries. Also some countries set special conditions regarding the scope
of the range of the surveys. Also there are countries which apply the full-time equivalent (FTE)
method in surveying the number of researchers. And there are other countries which apply actual
head counting for this purpose. Therefore, it could be said that there are many contributing factors
which reduce the performance of the international comparability. In addition, in U.S., the number
of researchers belonging to some sectors is not reported to the OECD. This forces the OECD to
utilize estimated figures as a substitute. For the reasons given above, it is necessary to be careful in
making international comparisons and trend comparisons of the number of researchers.
In 2009, the number of researchers in Japan was a total of about 660,000, if the number of
researchers working at universities and colleges is calculated by using the FTE method. The
number is about 890,000 with the head count method. In recent years, the number of researchers in
China has greatly increased. But the number of researchers per capita still lags behind compared to
the other selected countries.
(2) Researchers by sector The numbers of researchers in the business enterprise sector has tended to increase over the long
term for both Japan and U.S. and has recently increased sharply in China. The numbers for
Germany and U.K. have been flat. With regard to the proportion of the number of researchers by
industry, the ratio of those in the manufacturing industry to the non-manufacturing industry in
Japan was approximately 90% to 10%, and in U.S. was approximately 60% to 40%. The trends of
both countries are different in this way.
The number of researchers in the university and college sector in Japan in accordance with the
statistics by the OECD was extremely large compared to other countries (180,000 people (2006) in
Japan, while 190,000 people (1999) in U.S.). But if the number of researchers in the university
and college sector is measured using the statistics for education, the value is not necessarily
extremely large (250,000 people in Japan compared to 740,000 people in U.S. (both in 2006)).
(3) Research assistants With regard to the number of research assistants per researcher by sector, the value is large in the
public organization sector and small in the university and college sector in almost all the countries.
Especially in Japan, the number of research assistants is so small that the value is approximately a
half of that in Germany and France.

- 4 -
Out of the number of research assistants in the university and college sector in Japan, the number of
“assistant research workers” has been flat while that of “clerical and other supporting human
resources” is increasing in number.
- 5 -
3. Higher Education
(1) The status of students in Higher Education institutions
The number of newly enrolled undergraduates in Japan has been roughly unchanged since about
2000, and that for the FY 2009 is about 609,000. The numbers newly enrolled in private
universities and colleges is high, and constitutes about 80% of the total. When classified by field,
the students who major in “Natural science and engineering” are about 30% of the total. Of these,
the students who study in national universities and colleges are about 30%, and those in private
universities and colleges are about 60%.
The numbers newly enrolled in master’s programs has been roughly unchanged since about 2005
and that for the FY 2009 is about 78,000. The numbers newly enrolled in national universities and
colleges constitutes about 60% of the total. When classified by field, the students who major in
“Natural science and engineering” are about 60% of the total. Of these, the students who study in
national universities and colleges are about 60%, and those in private universities and colleges are
about 30%.
The number newly enrolled in doctoral programs has been decreasing since peaking in 2003 and
was about 16,000 for the FY 2009. The numbers newly enrolled in national universities and
colleges is high and constitutes about 70% of the total. When classified by field, the students who
major in “Natural science and engineering” are about 70% of the total. Of these, about 70% of the
students study in national universities and colleges, and the students who study in private
universities and colleges are about 20%.
(2) Career options for students in Natural sciences and Engineering Looking at career options for undergraduate students in “Natural sciences and engineering” after
graduation, students who enter employment are about 60% and those who proceed to higher
education are about 40%. When it comes to master’s students, those who enter employment are
about 90% and those who go on to the next stage of education are about 10%. The percentage of
students who head into the workforce has increased during recent years.
Looking at those who enter employment among the graduates of “Natural sciences and engineering”
by industrial classification, in case of undergraduates, the “Manufacturing industry”, “Service type
industries” and “Others” comprise one-third each. And in the case of master’s students, the
percentage of students who enter employment in the “Manufacturing industry” is about 60%, and
the percentage of students who find employment in “Service type industries” is about 20%.
(3) The number of degree-awarded Looking at the number of persons who have degrees per one million of the population, bachelor’s
degree awarded in Japan are about 4,400. This is less than U.S. and U.K., however, it greatly
surpasses Germany and France. Meanwhile, the number of doctoral degree awarded is about 140,
which is half as many as that in U.K. and Germany and falls below that of U.S. and France.

- 6 -
When the rate of increase of the number of doctoral degree awarded per one million of the
population is compared with the rate of increase during the 10 years from 1995, U.K. has been
enlarged 1.61 times, which has reached approximately the same level as Germany. During these
years, Japan has enlarged to 1.29 times, which is a higher increase than U.S. and Germany.
- 7 -
4. The output of R&D
(1) Scientific Papers
The quantity of papers, which are the output of the world’s research activities, has consistently
shown an upward trend.
Research activities themselves have changed from the activities of a single country into joint
activities that are conducted by multiple countries. Now international co-authorship papers have
increased, and a difference has emerged between the “degree of participation (whole counting) in
the production of papers in the world” and the “degree of contribution (fractional counting) to the
production of papers in the world”.
Regarding the numbers of papers produced in Japan (the average from 2007–2009), in terms of the
“degree of participation in the production of papers in the world” Japan is ranked fifth in the world,
after U.S., China, U.K. and Germany. Meanwhile, although in terms of the “degree of
contribution to the production of papers in the world” Japan ranks third, behind U.S. and China, it
outranks U.K. and Germany.
China has increased both in terms of the “degree of participation in the production of papers in the
world” and the “degree of contribution to the production of papers in the world” since the late
1990s, holding second place in the world during the latter half of the 2000s.
Looking at the balance of the fields in Japan, the share of Chemistry has decreased and that of
Clinical medicine has increased.
On the other hand, looking at the field portfolios in main countries by world share, Japan has more
weight on Chemistry, Material science and Physics, and less weight on Computer
science/Mathematics, Environment/Geoscience, Basic life sciences and Clinical medicine. In U.S.
and U.K., there is much weight placed on Basic life sciences and Clinical medicine.
The percentage of international co-authorship for 2009 was 50% for Germany, 51% for U.K. and
51% for France, while U.S. was 32% and Japan was 26%.
(2) Patents The numbers of patent applications had been increasing with an annual average growth rate of
about 5% since the mid 1990s, and reached 1.85 million for 2007.
The numbers of patent applications to the Japan Patent Office (hereinafter “JPO”) have been about
400,000 over these past several years. The numbers of patent applications to U.S. Patent and
Trademark Office (hereinafter “USPTO”) have been rapidly increasing, and it was more than that
to JPO in 2006. The applications to JPO from Non-Residents have been increased, and accounted
for over 15% of all in 2006. However, this ratio is small compared with that of USPTO, about a
half of whose applications are from Non-Residents.
All main countries including Japan have increased their numbers of patent applications. However,
there has been a slight leveling off over the past few years. Even under these circumstances,
Patent applications from China have steadily increased. Many Chinese applications, however, are
- 8 -
to the State Intellectual Property Office of the P.R.C. (hereinafter SIPO), and China’s presence in
the world is still small. Korea has been applying for patents to patent offices in main country and
has strengthened its world presence.
Looking at the numbers of patent applications to JPO, USPTO and The European Patent Office
(hereinafter EPO), Japan has shown a big presence since 10 years ago. Looking at the applications
by technical field, Japan has a big share in Nanotechnology and Information and communication
technology.
The relation between patents and scientific papers has been getting stronger. The Science Linkage,
which indicates the degree to which patent literature cites scientific literature, has been increasing.
From 1996-1998 to 2006–2008, the Science Linkage in all fields increased from 1.9 to 3.1. The
value of Medical and chemical manufacturing is highest. Science Linkage has recently increased
in “Petroleum/Coal product manufacturing.”
- 9 -
5. The outcome of R&D
(1) Technology trade
Japan’s technology trade balance was 3.71 in 2008, with an export surplus continuing since 1993.
Technology trade exclusive of trade with overseas affiliates, i.e., that between parent companies
and subsidiaries, can be considered a more appropriate indicator of technology strength. Using
that criterion, Japan’s technology trade balance in 2008 was 1.3, which represents a slight rise from
2001.
Looking at the amount of technology exports of Japan, “Transportation equipment manufacturing”
ac-counts for about 50% of all industries, and it is followed by “Drugs and medicines”, which
accounts for about 10% of all industries. Regarding “Transportation equipment manufacturing”,
the ratio of parent companies and subsidiaries is approximately 90%. However, that of “Drugs
and medicines” remains at approximately 50%. “Drugs and medicines” can be said to be an
industry involving more international technology transfer for technology exports in Japan, many of
which transactions are made among parent companies and subsidiaries.
Most transactions for technology imports in Japan are made in companies excluding parent
companies and subsidiaries.
Looking at the partners of technology exports from Japan, U.S. accounts for 36.7% of them all,
which is first, and China follows it at 12.1%. U.K. accounts for 5.6%, which is third place. On
the other hand, regarding technology imports, U.S. accounts for 68.9% of the total, and Germany,
France and U.K. follow it with about 5% each.
(2) The High Technology Industry Trade The high-technology industry trade of the entire world increased by 70 percent in the past six years.
Especially, the “Radio, Television and Communication Equipment” industry was the largest, which
ac-counted for about 40% of the total.
Looking by country, the trade scale of U.S. was large and is tending to expand. However, China
has in-creased its trade amount rapidly during recent years and to the value of its exports has
surpassed that of U.S. The trade amount of Germany has also rapidly expanded. Japan has
followed it, and is in fourth place.
The trade balance of Japan’s high-technology industry had an export surplus of over 3 in the early
1990s. After that, the trade balance tended to decrease and it was an export surplus of over 1.3 in
2008. Korea has been on an upward trend in recent years and passed Japan in 2003. China’s
2008 figure was even with Japan’s at 1.3. Europe has moved around 1 since 1990s, and U.S. has
shifted to less than 1 since 2000, which means it now has an import surplus.
Looking at it by field, the “Radio, Television and Communication Equipment” industry showed a
large ratio, and particularly the amount of the imports and the exports of China have been larger
than those of U.S. in recent years.
The “Radio, Television and Communication Equipment” industry and the “Medical, Precision and
- 10 -
Optical Instruments” industry of Japan have an export surplus. The “Aircraft and Spacecraft”
industry of U.S. has an export surplus, and the “Pharmaceuticals,” “Medical, Precision and Optical
Instruments” and “Aircraft and Spacecraft” industries of Germany have an export surplus
(3) Total Factor Productivity (TFP) The contribution of Total Factor Productivity (TFP) to economic growth during 2002–2006 was
highest in U.S. (1.2%). Following U.S. were France (0.77%) and Germany (0.73%) at levels
roughly equal to each other. Japan (0.55%) and U.K. (0.54%) were also roughly equal to one
another.
- 11 -
Notes concerning Science and Technology Indicators 2010
1 Clarification of points of attention regarding international comparisons and time-series comparisons
The reminder marks, “Attention to international comparison” and “Attention to trend” have been
attached where they are required. Generally, the data for each country conforms to OECD guidelines.
In some cases, however, attention to comparisons is necessary due to differences in methods of
collecting data or the range of objects. Such cases are marked “Attention to international comparison.”
For some time series data, data could not be continuous collected under the same conditions due to
changes in statistical standards. Cases where special attention is required in reading trends of
increases and decreases are marked “Attention to trend” Details of such points for attention are
described in the notes of individual charts.
2 Adjustment of statistical assumptions in each country’s metadata
Every effort has been made to clarify each country’s method of collecting statistics and how it differs
from other country’s methods.
3 Integration of databases used
Data regarding scientific papers are integrated with data from Web of Science, and the increase in
international co-authorship papers is analyzed. Regarding patents, patent applications to
Japan/U.S./Europe are analyzed in order to heighten international comparability.
4 Color-coding of charts
Charts are color-coded such that, to the extent possible, a given color will correspond to the same
country in every chart.


Main parts

- 13 -
Chapter1:R&D expenditure
Chapter 1:R&D expenditure
In this chapter, the status of R&D expenditure in Japan and other selected countries, which is a type of input data for R&D activities, is reviewed. R&D expenditure is the expenditure used for conducting R&D operations in an organization. Expenditure which is internally used for R&D at an organization is called intramural R&D expenditure, and expenditure for outsourcing or commissioning R&D is called extramural R&D expenditure. Because this chapter deals with only intramural R&D expenditure, the simpler expression of R&D expenditure is used to refer to intramural R&D expenditure. The contents of this chapter also include mention of a part of the government budget appropriations or outlays for R&D (hereinafter referred to as GBAORD).
1.1 International comparison of each country’s R&D expenditure
Key points ○The total Japan’s R&D expenditure was approximately 18.8 trillion yen in FY 2008. This amount is the
equivalent of approximately 17.8 trillion yen on a full time equivalent (FTE) basis, the highest ever ratio against GDP (3.8% and 3.4%, respectively).
○Out of all the performing sectors, the business enterprise sector accounted for the highest ratio of the total R&D expenditure in each country. The proportions of R&D expenditure by the business enterprise sector in Japan, U.S. and Germany were approximately 70%; however, those in France and U.K. were approx-imately 60%.
○The proportion of R&D expenditure by the university and college sector in U.K. is increasing while that in Japan and Germany remains flat.
1.1.1 Trend of R&D expenditure in each country
First of all, the total R&D expenditure in selected countries is examined in order to provide an overview of their sizes and trends. A precise comparison of R&D expenditures among different countries is dif-ficult because surveying methods for R&D expendi-tures differ by country; however, the comparison of the data in each country over time is considered to represent the trend of the country.
For a comparison of R&D expenditures in each country, currency conversion is necessary. But, because of the conversion, the comparison inevitably falls under the influence of each country’s economic conditions. Therefore, converted values are used for the international comparison of each country’s R&D expenditure, and the value of each national currency is used for examining the change of R&D expenditure over time in the corresponding country.
Japan’s R&D expenditures are shown with two types of values. One of such values was obtained from the Survey of Research and Development con-
ducted and published by the Ministry of Public Management, Home Affairs, Posts and Telecommu-nications. And the other values were obtained from materials published by the OECD. The difference between both the values is how to obtain labor costs in the university and college sector. In the Survey of Research and Development, the expenditures in the university and college sector were measured on the basis of a head count (HC) of researchers, due to the background that the strict separation of expenditure for research and that for education in the university and college sector is difficult. Accordingly, R&D expenditure in the university and college sector amounts to the total cost of labor including duties other than research carried out by universities’ teaching staffs. As for the OECD(1), the total R&D expenditure in Japan’s university and college sector is (1) The Organization for Economic Co-operation and Development (OECD) is the organization in which countries supporting democracy and market economy engage in activities for the purpose of 1) economic devel-opment, 2) aid to developing countries and 3) expansion of multilateral free trading. OECD is currently composed of 31 member countries, and gath-ers statistics, economic and social data which can be internationally com-pared, and also conducts prediction and analysis.
- 14 -
Chapter1:R&D expenditure
provided on the FTE basis (for more details, refer to Section 1.3.3, the R&D expenditure in the university and college sector). In this chapter, the status of R&D investment in each country is studied using the data estimated by the OECD (referred to as “Japan (estimated by the OECD)”) and others.
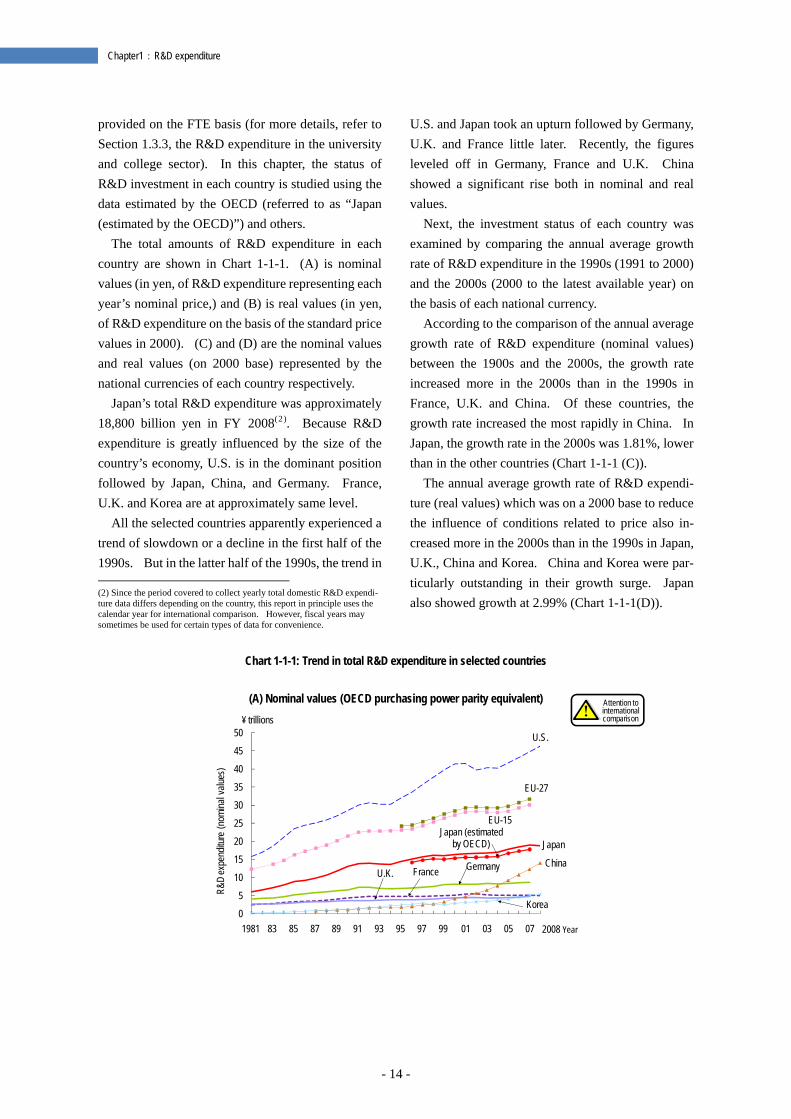
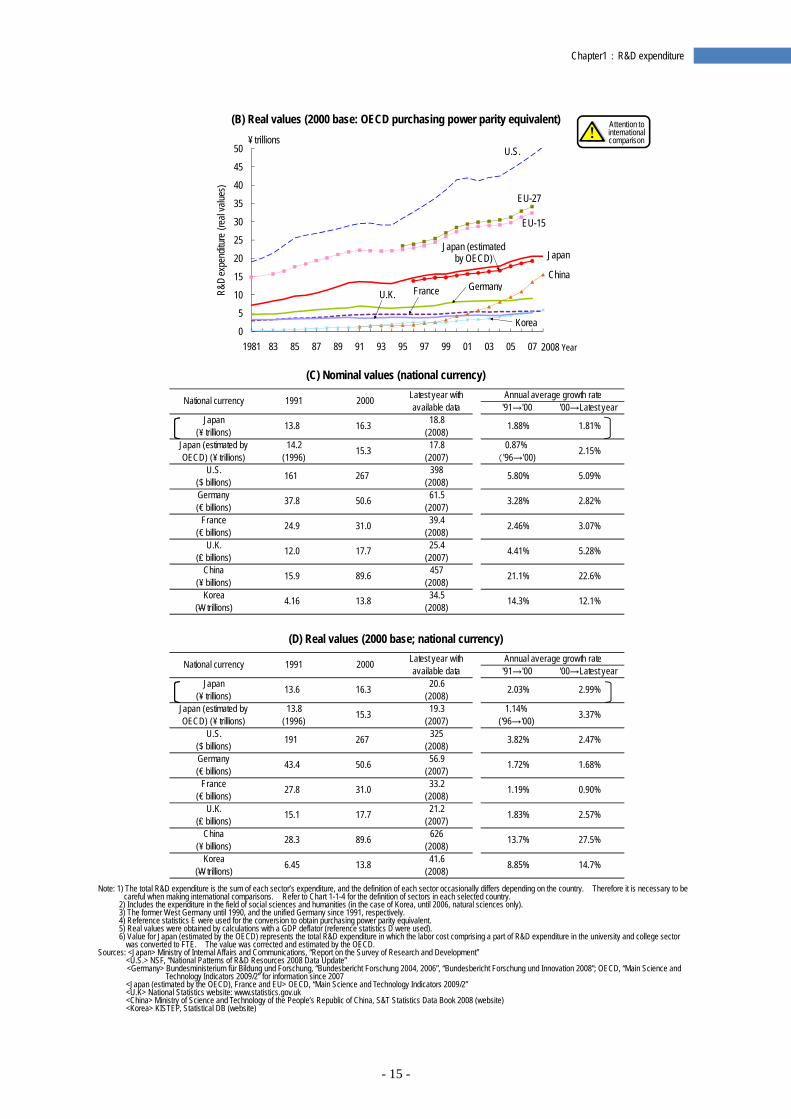
The total amounts of R&D expenditure in each country are shown in Chart 1-1-1. (A) is nominal values (in yen, of R&D expenditure representing each year’s nominal price,) and (B) is real values (in yen, of R&D expenditure on the basis of the standard price values in 2000). (C) and (D) are the nominal values and real values (on 2000 base) represented by the national currencies of each country respectively.
Japan’s total R&D expenditure was approximately 18,800 billion yen in FY 2008(2). Because R&D expenditure is greatly influenced by the size of the country’s economy, U.S. is in the dominant position followed by Japan, China, and Germany. France, U.K. and Korea are at approximately same level.
All the selected countries apparently experienced a trend of slowdown or a decline in the first half of the 1990s. But in the latter half of the 1990s, the trend in (2) Since the period covered to collect yearly total domestic R&D expendi-ture data differs depending on the country, this report in principle uses the calendar year for international comparison. However, fiscal years may sometimes be used for certain types of data for convenience.
U.S. and Japan took an upturn followed by Germany, U.K. and France little later. Recently, the figures leveled off in Germany, France and U.K. China showed a significant rise both in nominal and real values.
Next, the investment status of each country was examined by comparing the annual average growth rate of R&D expenditure in the 1990s (1991 to 2000) and the 2000s (2000 to the latest available year) on the basis of each national currency.
According to the comparison of the annual average growth rate of R&D expenditure (nominal values) between the 1900s and the 2000s, the growth rate increased more in the 2000s than in the 1990s in France, U.K. and China. Of these countries, the growth rate increased the most rapidly in China. In Japan, the growth rate in the 2000s was 1.81%, lower than in the other countries (Chart 1-1-1 (C)).
The annual average growth rate of R&D expendi-ture (real values) which was on a 2000 base to reduce the influence of conditions related to price also in-creased more in the 2000s than in the 1990s in Japan, U.K., China and Korea. China and Korea were par-ticularly outstanding in their growth surge. Japan also showed growth at 2.99% (Chart 1-1-1(D)).
Chart 1-1-1: Trend in total R&D expenditure in selected countries
(A) Nominal values (OECD purchasing power parity equivalent)
Japan (estimated by OECD)
0
5
10
15
20
25
30
35
40
45
50
1981 83 85 87 89 91 93 95 97 99 01 03 05 07
R&D
expe
nditu
re (n
omina
l valu
es)
2008 Year
¥ trillionsU.S.
Japan
Germany China
EU-27
EU-15
Korea
U.K. France
Attention to international comparison
- 15 -
Chapter1:R&D expenditure
(B) Real values (2000 base: OECD purchasing power parity equivalent)
(C) Nominal values (national currency)
(D) Real values (2000 base; national currency)
Note: 1) The total R&D expenditure is the sum of each sector’s expenditure, and the definition of each sector occasionally differs depending on the country. Therefore it is necessary to be
careful when making international comparisons. Refer to Chart 1-1-4 for the definition of sectors in each selected country. 2) Includes the expenditure in the field of social sciences and humanities (in the case of Korea, until 2006, natural sciences only). 3) The former West Germany until 1990, and the unified Germany since 1991, respectively. 4) Reference statistics E were used for the conversion to obtain purchasing power parity equivalent. 5) Real values were obtained by calculations with a GDP deflator (reference statistics D were used). 6) Value for Japan (estimated by the OECD) represents the total R&D expenditure in which the labor cost comprising a part of R&D expenditure in the university and college sector
was converted to FTE. The value was corrected and estimated by the OECD. Sources: <Japan> Ministry of Internal Affairs and Communications, “Report on the Survey of Research and Development”
<U.S.> NSF, “National Patterns of R&D Resources 2008 Data Update” <Germany> Bundesministerium für Bildung und Forschung, “Bundesbericht Forschung 2004, 2006”, “Bundesbericht Forschung und Innovation 2008”; OECD, “Main Science and
Technology Indicators 2009/2” for information since 2007 <Japan (estimated by the OECD), France and EU> OECD, “Main Science and Technology Indicators 2009/2” <U.K> National Statistics website: www.statistics.gov.uk <China> Ministry of Science and Technology of the People’s Republic of China, S&T Statistics Data Book 2008 (website) <Korea> KISTEP, Statistical DB (website)
Japan (estimated by OECD)
0
5
10
15
20
25
30
35
40
45
50
1981 83 85 87 89 91 93 95 97 99 01 03 05 07
R&D
expe
nditu
re (r
eal v
alues
)
2008 Year
¥ trillionsU.S.
Japan
Germany
Korea
China
EU-27
EU-15
U.K. France
Annual average growth rate'91→'00 '00→Latest year
Japan(¥ trillions) 13.8 16.3 18.8
(2008) 1.88% 1.81%
Japan (estimated byOECD) (¥ trillions)
14.2(1996) 15.3 17.8
(2007)0.87%
('96→'00) 2.15%
U.S.($ billions) 161 267 398
(2008) 5.80% 5.09%
Germany(€ billions) 37.8 50.6 61.5
(2007) 3.28% 2.82%
France(€ billions) 24.9 31.0 39.4
(2008) 2.46% 3.07%
U.K.(₤ billions) 12.0 17.7 25.4
(2007) 4.41% 5.28%
China(¥ billions) 15.9 89.6 457
(2008) 21.1% 22.6%
Korea(W trillions) 4.16 13.8 34.5
(2008) 14.3% 12.1%
National currency 1991 2000 Latest year withavailable data
Annual average growth rate'91→'00 '00→Latest year
Japan(¥ trillions) 13.6 16.3 20.6
(2008) 2.03% 2.99%
Japan (estimated byOECD) (¥ trillions)
13.8(1996) 15.3 19.3
(2007)1.14%
('96→'00) 3.37%
U.S.($ billions) 191 267 325
(2008) 3.82% 2.47%
Germany(€ billions) 43.4 50.6 56.9
(2007) 1.72% 1.68%
France(€ billions) 27.8 31.0 33.2
(2008) 1.19% 0.90%
U.K.(₤ billions) 15.1 17.7 21.2
(2007) 1.83% 2.57%
China(¥ billions) 28.3 89.6 626
(2008) 13.7% 27.5%
Korea(W trillions) 6.45 13.8 41.6
(2008) 8.85% 14.7%
National currency 1991 2000 Latest year withavailable data
Attention to international comparison
- 16 -
Chapter1:R&D expenditure
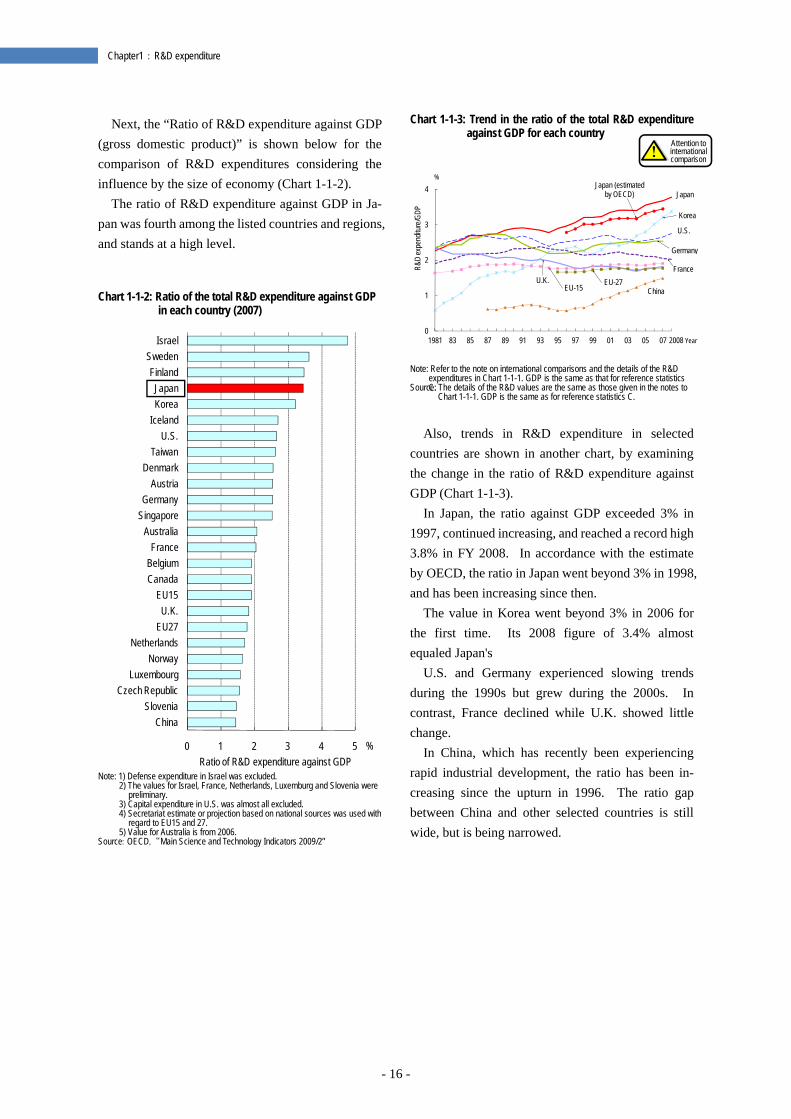
Next, the “Ratio of R&D expenditure against GDP (gross domestic product)” is shown below for the comparison of R&D expenditures considering the influence by the size of economy (Chart 1-1-2).
The ratio of R&D expenditure against GDP in Ja-pan was fourth among the listed countries and regions, and stands at a high level. Chart 1-1-2: Ratio of the total R&D expenditure against GDP
in each country (2007)
Note: 1) Defense expenditure in Israel was excluded.
2) The values for Israel, France, Netherlands, Luxemburg and Slovenia were preliminary.
3) Capital expenditure in U.S. was almost all excluded. 4) Secretariat estimate or projection based on national sources was used with
regard to EU15 and 27. 5) Value for Australia is from 2006.
Source: OECD,“Main Science and Technology Indicators 2009/2”
Chart 1-1-3: Trend in the ratio of the total R&D expenditure against GDP for each country
Note: Refer to the note on international comparisons and the details of the R&D
expenditures in Chart 1-1-1. GDP is the same as that for reference statistics C. Source: The details of the R&D values are the same as those given in the notes to
Chart 1-1-1. GDP is the same as for reference statistics C.
Also, trends in R&D expenditure in selected countries are shown in another chart, by examining the change in the ratio of R&D expenditure against GDP (Chart 1-1-3).
In Japan, the ratio against GDP exceeded 3% in 1997, continued increasing, and reached a record high 3.8% in FY 2008. In accordance with the estimate by OECD, the ratio in Japan went beyond 3% in 1998, and has been increasing since then.
The value in Korea went beyond 3% in 2006 for the first time. Its 2008 figure of 3.4% almost equaled Japan's
U.S. and Germany experienced slowing trends during the 1990s but grew during the 2000s. In contrast, France declined while U.K. showed little change.
In China, which has recently been experiencing rapid industrial development, the ratio has been in-creasing since the upturn in 1996. The ratio gap between China and other selected countries is still wide, but is being narrowed.
0 1 2 3 4 5
ChinaSlovenia
Czech RepublicLuxembourg
NorwayNetherlands
EU27U.K.
EU15CanadaBelgiumFrance
AustraliaSingaporeGermany
AustriaDenmark
TaiwanU.S.
IcelandKoreaJapan
FinlandSweden
Israel
Ratio of R&D expenditure against GDP%
Japan (estimated by OECD)
0
1
2
3
4
1981 83 85 87 89 91 93 95 97 99 01 03 05 07
R&D
expe
nditu
re/G
DP
2008 Year
%
Japan
U.S.
Germany
FranceU.K.
China
Korea
EU-15 EU-27
Attention to international comparison
- 17 -
Chapter1:R&D expenditure
1.1.2 Trend of R&D expenditure by sector in each country
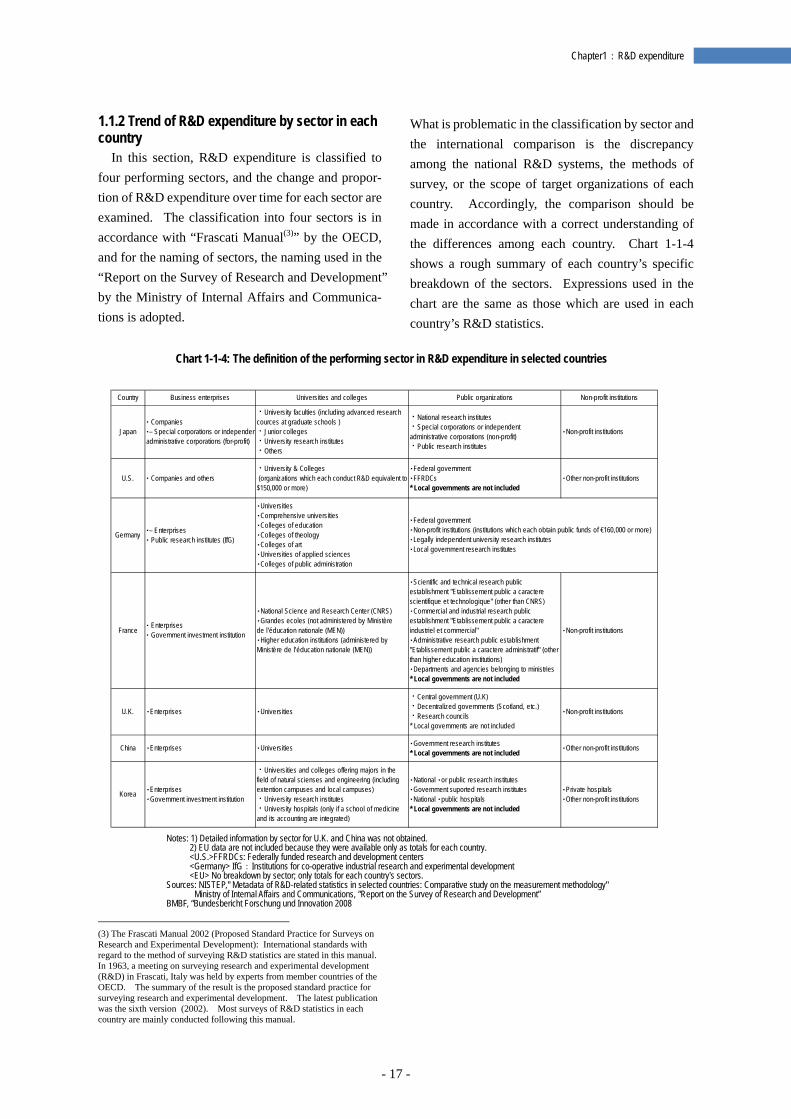
In this section, R&D expenditure is classified to four performing sectors, and the change and propor-tion of R&D expenditure over time for each sector are examined. The classification into four sectors is in accordance with “Frascati Manual(3)” by the OECD, and for the naming of sectors, the naming used in the “Report on the Survey of Research and Development” by the Ministry of Internal Affairs and Communica-tions is adopted.
(3) The Frascati Manual 2002 (Proposed Standard Practice for Surveys on Research and Experimental Development): International standards with regard to the method of surveying R&D statistics are stated in this manual. In 1963, a meeting on surveying research and experimental development (R&D) in Frascati, Italy was held by experts from member countries of the OECD. The summary of the result is the proposed standard practice for surveying research and experimental development. The latest publication was the sixth version (2002). Most surveys of R&D statistics in each country are mainly conducted following this manual.
What is problematic in the classification by sector and the international comparison is the discrepancy among the national R&D systems, the methods of survey, or the scope of target organizations of each country. Accordingly, the comparison should be made in accordance with a correct understanding of the differences among each country. Chart 1-1-4 shows a rough summary of each country’s specific breakdown of the sectors. Expressions used in the chart are the same as those which are used in each country’s R&D statistics.
Chart 1-1-4: The definition of the performing sector in R&D expenditure in selected countries
Notes: 1) Detailed information by sector for U.K. and China was not obtained. 2) EU data are not included because they were available only as totals for each country. <U.S.>FFRDCs: Federally funded research and development centers <Germany> IfG:Institutions for co-operative industrial research and experimental development <EU> No breakdown by sector; only totals for each country's sectors. Sources: NISTEP," Metadata of R&D-related statistics in selected countries: Comparative study on the measurement methodology"
Ministry of Internal Affairs and Communications, “Report on the Survey of Research and Development” BMBF, “Bundesbericht Forschung und Innovation 2008
Country Business enterprises Universities and colleges Public organizations Non-profit institutions
Japan Companies– Special corporations or independen
administrative corporations (for-profit)
・University faculties (including advanced researchcources at graduate schools )・Junior colleges・University research institutes・Others
・National research institutes・Special corporations or independentadministrative corporations (non-profit)・Public research institutes
・Non-profit institutions
U.S. Companies and others・University & Colleges (organizations which each conduct R&D equivalent to$150,000 or more)
・Federal government・FFRDCs* Local governments are not included
・Other non-profit institutions
Germany – Enterprises Public research institutes (IfG)
・Universities・Comprehensive universities・Colleges of education・Colleges of theology・Colleges of art・Universities of applied sciences・Colleges of public administration
France Enterprises Government investment institution
・National Science and Research Center (CNRS)・Grandes ecoles (not administered by Ministèrede l'éducation nationale (MEN))・Higher education institutions (administered byMinistère de l'éducation nationale (MEN))
・Scientific and technical research publicestablishment "Etablissement public a caracterescientifique et technologique" (other than CNRS)・Commercial and industrial research publicestablishment "Etablissement public a caractereindustriel et commercial"・Administrative research public establishment"Etablissement public a caractere administratif" (otherthan higher education institutions)・Departments and agencies belonging to ministries* Local governments are not included
・Non-profit institutions
U.K. ・Enterprises ・Universities
・Central government (U.K)・Decentralized governments (Scotland, etc.)・Research councils* Local governments are not included
・Non-profit institutions
China ・Enterprises ・Universities ・Government research institutes* Local governments are not included ・Other non-profit institutions
Korea ・Enterprises・Government investment institution
・Universities and colleges offering majors in thefield of natural scienses and engineering (includingextention campuses and local campuses)・University research institutes・University hospitals (only if a school of medicineand its accounting are integrated)
・National ・or public research institutes・Government suported research institutes・National ・public hospitals* Local governments are not included
・Private hospitals・Other non-profit institutions
・Federal government・Non-profit institutions (institutions which each obtain public funds of €160,000 or more)・Legally independent university research institutes・Local government research institutes
- 18 -
Chapter1:R&D expenditure
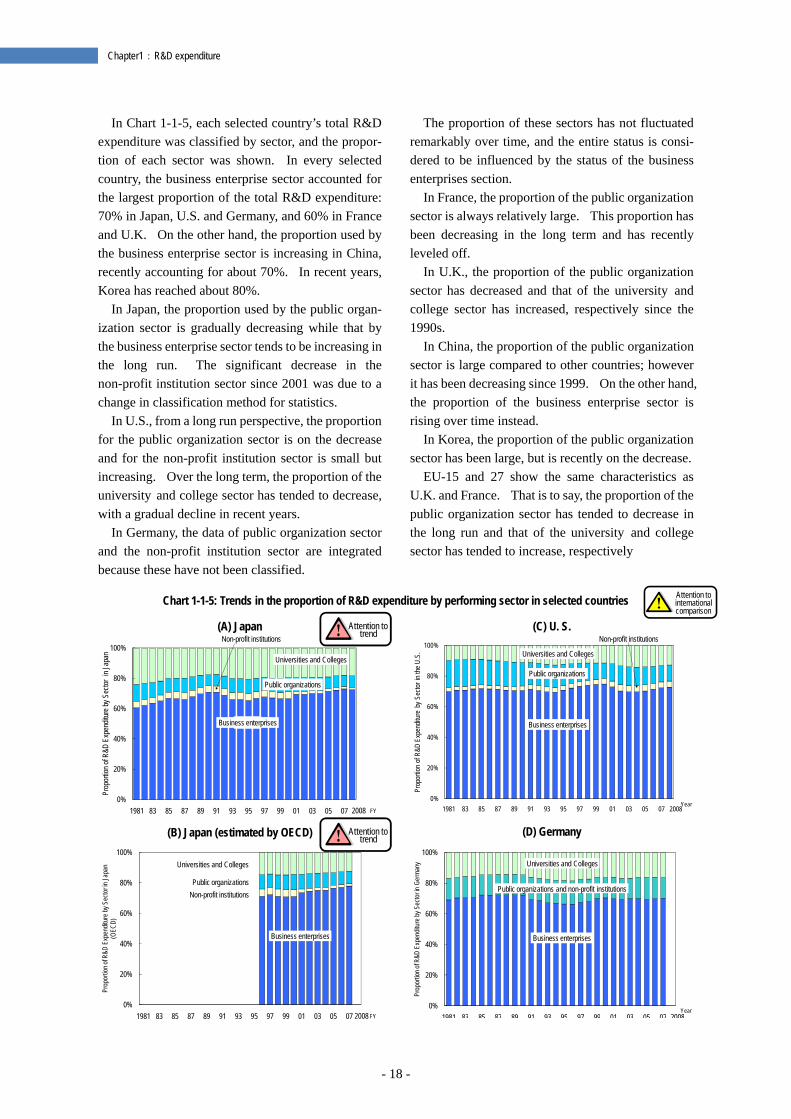
In Chart 1-1-5, each selected country’s total R&D expenditure was classified by sector, and the propor-tion of each sector was shown. In every selected country, the business enterprise sector accounted for the largest proportion of the total R&D expenditure: 70% in Japan, U.S. and Germany, and 60% in France and U.K. On the other hand, the proportion used by the business enterprise sector is increasing in China, recently accounting for about 70%. In recent years, Korea has reached about 80%.
In Japan, the proportion used by the public organ-ization sector is gradually decreasing while that by the business enterprise sector tends to be increasing in the long run. The significant decrease in the non-profit institution sector since 2001 was due to a change in classification method for statistics.
In U.S., from a long run perspective, the proportion for the public organization sector is on the decrease and for the non-profit institution sector is small but increasing. Over the long term, the proportion of the university and college sector has tended to decrease, with a gradual decline in recent years.
In Germany, the data of public organization sector and the non-profit institution sector are integrated because these have not been classified.
The proportion of these sectors has not fluctuated remarkably over time, and the entire status is consi-dered to be influenced by the status of the business enterprises section.
In France, the proportion of the public organization sector is always relatively large. This proportion has been decreasing in the long term and has recently leveled off.
In U.K., the proportion of the public organization sector has decreased and that of the university and college sector has increased, respectively since the 1990s.
In China, the proportion of the public organization sector is large compared to other countries; however it has been decreasing since 1999. On the other hand, the proportion of the business enterprise sector is rising over time instead.
In Korea, the proportion of the public organization sector has been large, but is recently on the decrease.
EU-15 and 27 show the same characteristics as U.K. and France. That is to say, the proportion of the public organization sector has tended to decrease in the long run and that of the university and college sector has tended to increase, respectively
Chart 1-1-5: Trends in the proportion of R&D expenditure by performing sector in selected countries
(A) Japan
(B) Japan (estimated by OECD)
(C) U. S.
(D) Germany
0%
20%
40%
60%
80%
100%
1981 83 85 87 89 91 93 95 97 99 01 03 05 07
Prop
ortio
n of R
&D E
xpen
ditur
e by S
ector
in Ja
pan
2008
企業
非営利団体
Business enterprises
Universities and Colleges
Public organizations
Non-profit institutions
FY
0%
20%
40%
60%
80%
100%
1981 83 85 87 89 91 93 95 97 99 01 03 05 07
Prop
ortio
n of R
&D E
xpen
ditur
e by S
ecto
r in Ja
pan
(OEC
D)
2008
Public organizations
Business enterprises
Universities and Colleges
Non-profit institutions
FY
0%
20%
40%
60%
80%
100%
1981 83 85 87 89 91 93 95 97 99 01 03 05 07
Prop
ortio
n of
R&D
Expe
nditu
re b
y Sec
tor in
the U
.S.
2008
Business enterprises
Universities and Colleges
Public organizations
Non-profit institutions
Year
0%
20%
40%
60%
80%
100%
1981 83 85 87 89 91 93 95 97 99 01 03 05 07
Prop
ortio
n of R
&D E
xpen
ditur
e by S
ecto
r in G
erma
ny
2008
Business enterprises
Universities and Colleges
Public organizations and non-profit institutions
Year
Attention to international comparison
Attention to trend
Attention to trend
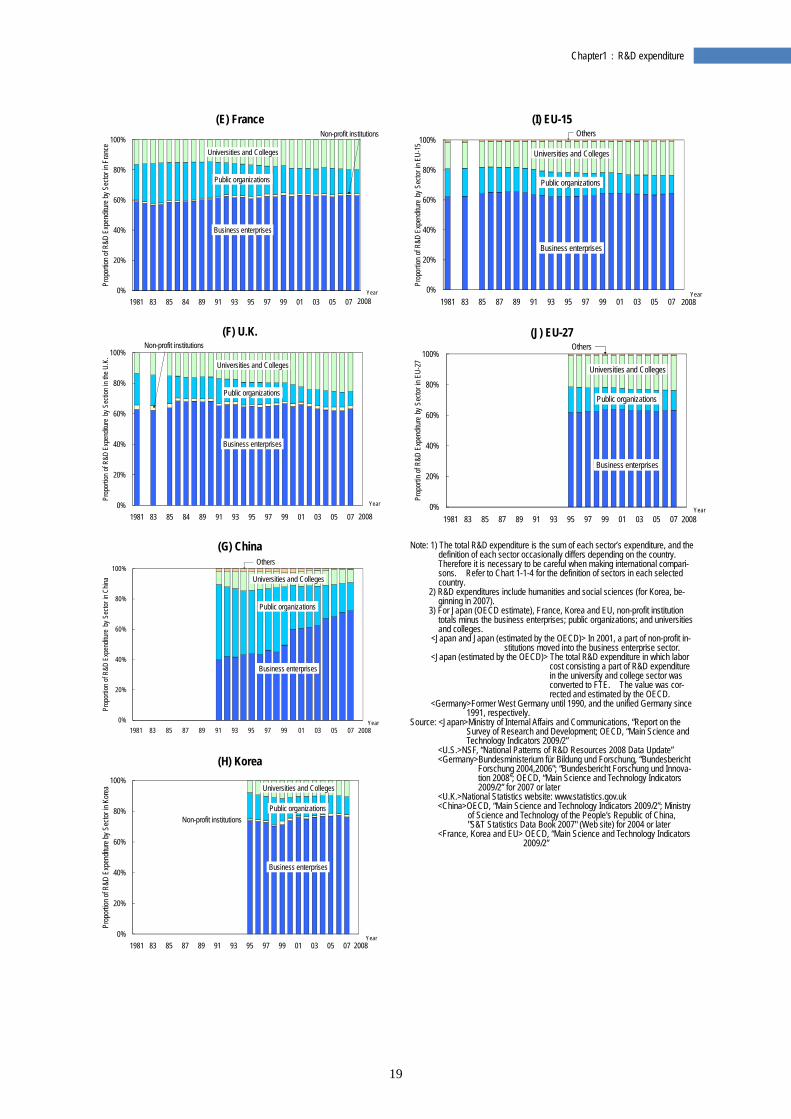
19
Chapter1:R&D expenditure
(E) France
(F) U.K.
(G) China
(H) Korea
(I) EU-15
(J) EU-27
Note: 1) The total R&D expenditure is the sum of each sector’s expenditure, and the definition of each sector occasionally differs depending on the country. Therefore it is necessary to be careful when making international compari-sons. Refer to Chart 1-1-4 for the definition of sectors in each selected country.
2) R&D expenditures include humanities and social sciences (for Korea, be-ginning in 2007).
3) For Japan (OECD estimate), France, Korea and EU, non-profit institution totals minus the business enterprises; public organizations; and universities and colleges.
<Japan and Japan (estimated by the OECD)> In 2001, a part of non-profit in-stitutions moved into the business enterprise sector.
<Japan (estimated by the OECD)> The total R&D expenditure in which labor cost consisting a part of R&D expenditure in the university and college sector was converted to FTE. The value was cor-rected and estimated by the OECD.
<Germany>Former West Germany until 1990, and the unified Germany since 1991, respectively.
Source: <Japan>Ministry of Internal Affairs and Communications, “Report on the Survey of Research and Development; OECD, “Main Science and Technology Indicators 2009/2”
<U.S.>NSF, “National Patterns of R&D Resources 2008 Data Update” <Germany>Bundesministerium für Bildung und Forschung, “Bundesbericht
Forschung 2004,2006”; “Bundesbericht Forschung und Innova-tion 2008”; OECD, “Main Science and Technology Indicators 2009/2” for 2007 or later
<U.K.>National Statistics website: www.statistics.gov.uk <China>OECD, “Main Science and Technology Indicators 2009/2”; Ministry
of Science and Technology of the People's Republic of China, "S&T Statistics Data Book 2007" (Web site) for 2004 or later
<France, Korea and EU> OECD, “Main Science and Technology Indicators 2009/2”
0%
20%
40%
60%
80%
100%
1981 83 85 84 89 91 93 95 97 99 01 03 05 07
Prop
ortio
n of R
&D E
xpen
ditur
e by S
ector
in F
ranc
e
2008
Business enterprises
Universities and Colleges
Public organizations
Non-profit institutions
Year
0%
20%
40%
60%
80%
100%
1981 83 85 84 89 91 93 95 97 99 01 03 05 07
Prop
ortio
n of
R&D
Expe
nditu
re b
y Sec
tion
in the
U.K
.
2008
Business enterprises
Universities and Colleges
Public organizations
Non-profit institutions
Year
0%
20%
40%
60%
80%
100%
1981 83 85 87 89 91 93 95 97 99 01 03 05 07
Prop
ortio
n of
R&D
Expe
nditu
re b
y Sec
tor in
Chin
a
2008
Others
Business enterprises
Universities and Colleges
Public organizations
Year
0%
20%
40%
60%
80%
100%
1981 83 85 87 89 91 93 95 97 99 01 03 05 07
Prop
ortio
n of R
&D E
xpen
ditur
e by S
ector
in K
orea
2008
Business enterprises
Universities and Colleges
Public organizationsNon-profit institutions
Year
0%
20%
40%
60%
80%
100%
1981 83 85 87 89 91 93 95 97 99 01 03 05 07
Prop
ortio
n of
R&D
Expe
nditu
re b
y Sec
tor in
EU-
15
2008
Others
Business enterprises
Universities and Colleges
Public organizations
Year
0%
20%
40%
60%
80%
100%
1981 83 85 87 89 91 93 95 97 99 01 03 05 07
Prop
ortin
of R
&D E
xpen
ditur
e by
Sec
tor in
EU-
27
2008
Others
Business enterprises
Universities and Colleges
Public organizations
Year
- 20 -
Chapter1:R&D expenditure
1.2 Government budgets
Key points ○With regard to the GBAORD (government budget appropriations or outlays for Science & Technology),
only in Japan was the growth rate lower during the 2000s than in the 1990s. In all the other countries, the growth rate was higher during the 2000s than in the 1990s.
○Japan’s initial government budget (the government budget appropriation for S&T) in FY 2010 was 3.6 tril-lion yen.
In this chapter, each country’s GBAORD included in the government budget are examined.
In this report, Japan’s “government budget appro-priations for Science & Technology (S&T)” are treated as the GBAORD. The government appropr-iations for S&T are composed of (1) funds for pro-moting science and technology (a part of the general account, with the main purpose of appropriation in the promotion of science and technology) (2) other research expenditure included in the general account, and (3) the government budget appropriation for S&T included in the special account. 1.2.1 GBAORD in each country
Chart 1-2-1(A), “Total GBAORD (OECD pur-chasing power parity equivalent) in selected coun-tries,” shows that Japan’s amount of appropriations or outlays is approximately a fifth of U.S.’s amount (2009). With regard to change over time, Japan’s GBAORD have had a tendency to increase, but re-cently became flat. In the case of U.S., the budget rose significantly between 2000 and 2004, but since then has shown little change.
In international comparisons of GBAORD, de-fense-related expenses are frequently removed. In many cases, it is appropriate to remove such expenses, especially when comparing Japan and other countries, because the expenses for the purpose of defense and others are different in character. Chart 1-2-1(B) shows the amount obtained by subtracting de-fense-related expenses from the GBAORD (non-defense GBAORD).
The ratios of the non-defense GBAORD against the GBAORD in Japan and U.S. accounted for 95.2% (2009) and only 41.4% (2009) respectively. As a result of the comparison of the non-defense GBAORD, Japan’s amount of appropriations or out-lays jumps up to a half of U.S.’s amount.
From the perspective of change over time, in the 1990s (1991 to 2000), Japan and China had the highest annual average growth rates of the total GBAORD using national currency. On the other hand, the growth rates in Germany (Federal Gov-ernment) and France were negative. In the 2000s (2000 to the latest available year of each country), annual average growth rate of the total GBAORD was strikingly high in China and Korea. Japan’s growth rate was 0.91%, while that of U.S. was high at 6.83%. U.K. also demonstrated a high growth rate in the 2000s, with 5.04% (Chart 1-2-1(C)).
Furthermore, the change in real values, which re-duces the influence of conditions related to price, shows that the growth rate was lower in the 2000s than in the 1990s only in Japan. In the other coun-tries, the growth rate was higher in the 2000s. Out of the countries in which the total GBAORD was higher in the 2000s, U.S. and France demonstrated higher growth rates in their defense-related budgets than in their non-defense budgets, while Japan, Germany, U.K. and Korea demonstrated higher growth rates in their non-defense budgets (Chart 1-2-1(D)).
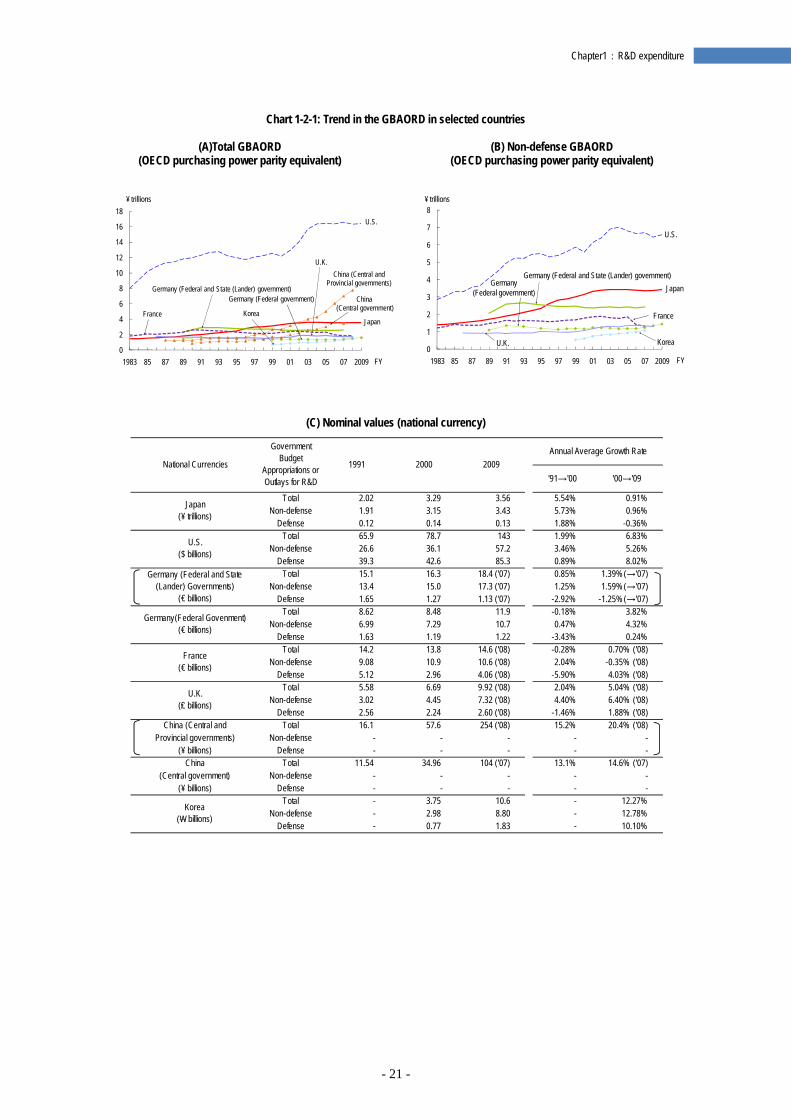
- 21 -
Chapter1:R&D expenditure
Chart 1-2-1: Trend in the GBAORD in selected countries
(A)Total GBAORD (OECD purchasing power parity equivalent)
(B) Non-defense GBAORD
(OECD purchasing power parity equivalent)
(C) Nominal values (national currency)
0
2
4
6
8
10
12
14
16
18
1983 85 87 89 91 93 95 97 99 01 03 05 07 2009
¥ trillions
FY
Korea
U.S.
Japan
Germany (Federal and State (Lander) government)
France
U.K.
Germany (Federal government)
China (Central and Provincial governments)
China(Central government)
0
1
2
3
4
5
6
7
8
1983 85 87 89 91 93 95 97 99 01 03 05 07 2009
¥ trillions
FY
Korea
U.S.
JapanGermany (Federal and State (Lander) government)
France
U.K.
Germany (Federal government)
Annual Average Growth Rate
'91→'00 '00→'09
Total 2.02 3.29 3.56 5.54% 0.91%Non-defense 1.91 3.15 3.43 5.73% 0.96%
Defense 0.12 0.14 0.13 1.88% -0.36%Total 65.9 78.7 143 1.99% 6.83%
Non-defense 26.6 36.1 57.2 3.46% 5.26%Defense 39.3 42.6 85.3 0.89% 8.02%
Total 15.1 16.3 18.4 ('07) 0.85% 1.39%(→'07)Non-defense 13.4 15.0 17.3 ('07) 1.25% 1.59%(→'07)
Defense 1.65 1.27 1.13 ('07) -2.92% -1.25%(→'07)Total 8.62 8.48 11.9 -0.18% 3.82%
Non-defense 6.99 7.29 10.7 0.47% 4.32%Defense 1.63 1.19 1.22 -3.43% 0.24%
Total 14.2 13.8 14.6 ('08) -0.28% 0.70% ('08)Non-defense 9.08 10.9 10.6 ('08) 2.04% -0.35% ('08)
Defense 5.12 2.96 4.06 ('08) -5.90% 4.03% ('08)Total 5.58 6.69 9.92 ('08) 2.04% 5.04% ('08)
Non-defense 3.02 4.45 7.32 ('08) 4.40% 6.40% ('08)Defense 2.56 2.24 2.60 ('08) -1.46% 1.88% ('08)
China (Central and Total 16.1 57.6 254 ('08) 15.2% 20.4% ('08)Provincial governments) Non-defense - - - - -
(¥ billions) Defense - - - - -China Total 11.54 34.96 104 ('07) 13.1% 14.6% ('07)
(Central government) Non-defense - - - - -(¥ billions) Defense - - - - -
Total - 3.75 10.6 - 12.27%Non-defense - 2.98 8.80 - 12.78%
Defense - 0.77 1.83 - 10.10%
Korea(W billions)
U.K.(₤ billions)
2009
U.S.($ billions)
Germany (Federal and State(Lander) Governments)
(€ billions)
Germany(Federal Govenment)(€ billions)
France(€ billions)
Japan(¥ trillions)
National Currencies
GovernmentBudget
Appropriations orOutlays for R&D
1991 2000
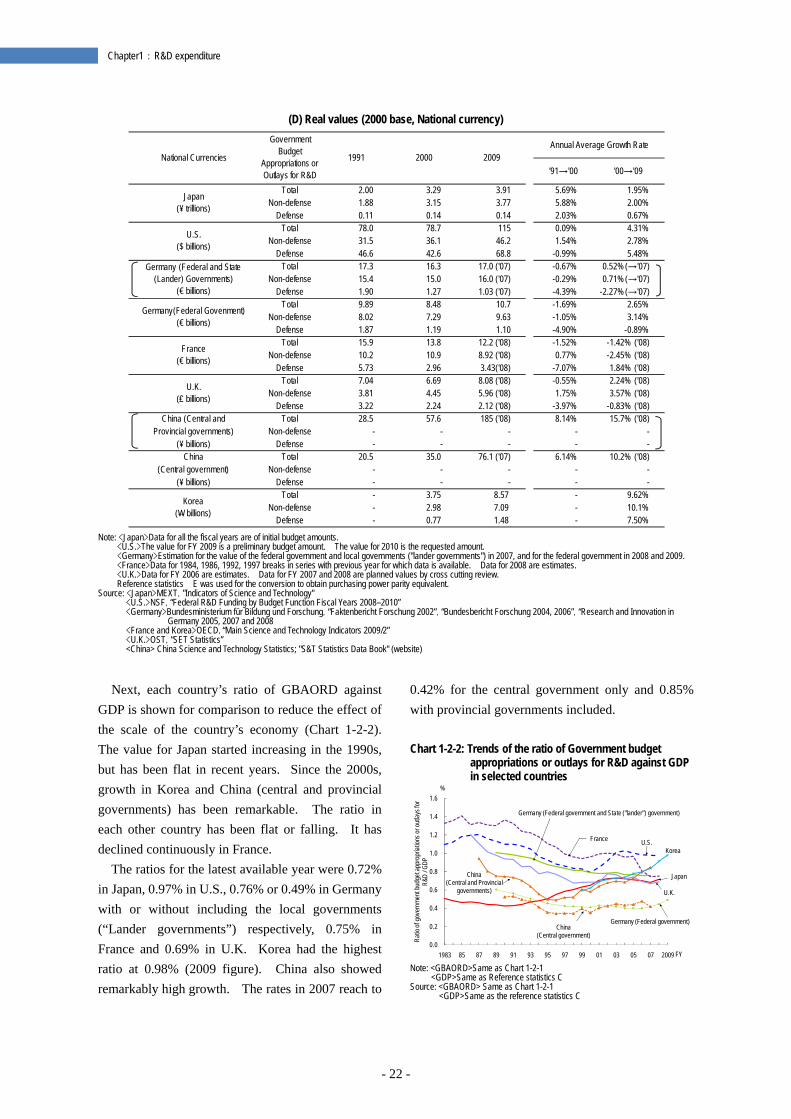
- 22 -
Chapter1:R&D expenditure
(D) Real values (2000 base, National currency)
Note: <Japan>Data for all the fiscal years are of initial budget amounts.
<U.S.>The value for FY 2009 is a preliminary budget amount. The value for 2010 is the requested amount. <Germany>Estimation for the value of the federal government and local governments ("lander governments") in 2007, and for the federal government in 2008 and 2009. <France>Data for 1984, 1986, 1992, 1997 breaks in series with previous year for which data is available. Data for 2008 are estimates. <U.K.>Data for FY 2006 are estimates. Data for FY 2007 and 2008 are planned values by cross cutting review. Reference statistics E was used for the conversion to obtain purchasing power parity equivalent.
Source: <Japan>MEXT, "Indicators of Science and Technology" <U.S.>NSF, “Federal R&D Funding by Budget Function Fiscal Years 2008–2010” <Germany>Bundesministerium für Bildung und Forschung, “Faktenbericht Forschung 2002”, “Bundesbericht Forschung 2004, 2006”, “Research and Innovation in
Germany 2005, 2007 and 2008 <France and Korea>OECD, “Main Science and Technology Indicators 2009/2” <U.K.>OST, “SET Statistics” <China> China Science and Technology Statistics; "S&T Statistics Data Book" (website)
Next, each country’s ratio of GBAORD against GDP is shown for comparison to reduce the effect of the scale of the country’s economy (Chart 1-2-2). The value for Japan started increasing in the 1990s, but has been flat in recent years. Since the 2000s, growth in Korea and China (central and provincial governments) has been remarkable. The ratio in each other country has been flat or falling. It has declined continuously in France.
The ratios for the latest available year were 0.72% in Japan, 0.97% in U.S., 0.76% or 0.49% in Germany with or without including the local governments (“Lander governments”) respectively, 0.75% in France and 0.69% in U.K. Korea had the highest ratio at 0.98% (2009 figure). China also showed remarkably high growth. The rates in 2007 reach to
0.42% for the central government only and 0.85% with provincial governments included. Chart 1-2-2: Trends of the ratio of Government budget
appropriations or outlays for R&D against GDP in selected countries
Note: <GBAORD>Same as Chart 1-2-1
<GDP>Same as Reference statistics C Source: <GBAORD> Same as Chart 1-2-1
<GDP>Same as the reference statistics C
Annual Average Growth Rate
'91→'00 '00→'09
Total 2.00 3.29 3.91 5.69% 1.95%Non-defense 1.88 3.15 3.77 5.88% 2.00%
Defense 0.11 0.14 0.14 2.03% 0.67%Total 78.0 78.7 115 0.09% 4.31%
Non-defense 31.5 36.1 46.2 1.54% 2.78%Defense 46.6 42.6 68.8 -0.99% 5.48%
Total 17.3 16.3 17.0 ('07) -0.67% 0.52% (→'07)Non-defense 15.4 15.0 16.0 ('07) -0.29% 0.71% (→'07)
Defense 1.90 1.27 1.03 ('07) -4.39% -2.27% (→'07)Total 9.89 8.48 10.7 -1.69% 2.65%
Non-defense 8.02 7.29 9.63 -1.05% 3.14%Defense 1.87 1.19 1.10 -4.90% -0.89%
Total 15.9 13.8 12.2 ('08) -1.52% -1.42% ('08)Non-defense 10.2 10.9 8.92 ('08) 0.77% -2.45% ('08)
Defense 5.73 2.96 3.43('08) -7.07% 1.84% ('08)Total 7.04 6.69 8.08 ('08) -0.55% 2.24% ('08)
Non-defense 3.81 4.45 5.96 ('08) 1.75% 3.57% ('08)Defense 3.22 2.24 2.12 ('08) -3.97% -0.83% ('08)
China (Central and Total 28.5 57.6 185 ('08) 8.14% 15.7% ('08)Provincial governments) Non-defense - - - - -
(¥ billions) Defense - - - - -China Total 20.5 35.0 76.1 ('07) 6.14% 10.2% ('08)
(Central government) Non-defense - - - - -(¥ billions) Defense - - - - -
Total - 3.75 8.57 - 9.62%Non-defense - 2.98 7.09 - 10.1%
Defense - 0.77 1.48 - 7.50%
Japan(¥ trillions)
National Currencies
Korea(W billions)
Germany (Federal and State(Lander) Governments)
(€ billions)
Germany(Federal Govenment)(€ billions)
France(€ billions)
U.K.(₤ billions)
U.S.($ billions)
GovernmentBudget
Appropriations orOutlays for R&D
1991 2000 2009
0.0
0.2
0.4
0.6
0.8
1.0
1.2
1.4
1.6
1983 85 87 89 91 93 95 97 99 01 03 05 07 2009
Ratio
of go
vern
ment
budg
et ap
prop
riatio
ns or
outla
ys fo
r R&
D / G
DP
FY
Japan
Germany (Federal government and State ("lander") government)
%
U.S.
U.K.
France
Germany (Federal government)China
(Central government)
China (Central and Provincial
governments)
Korea
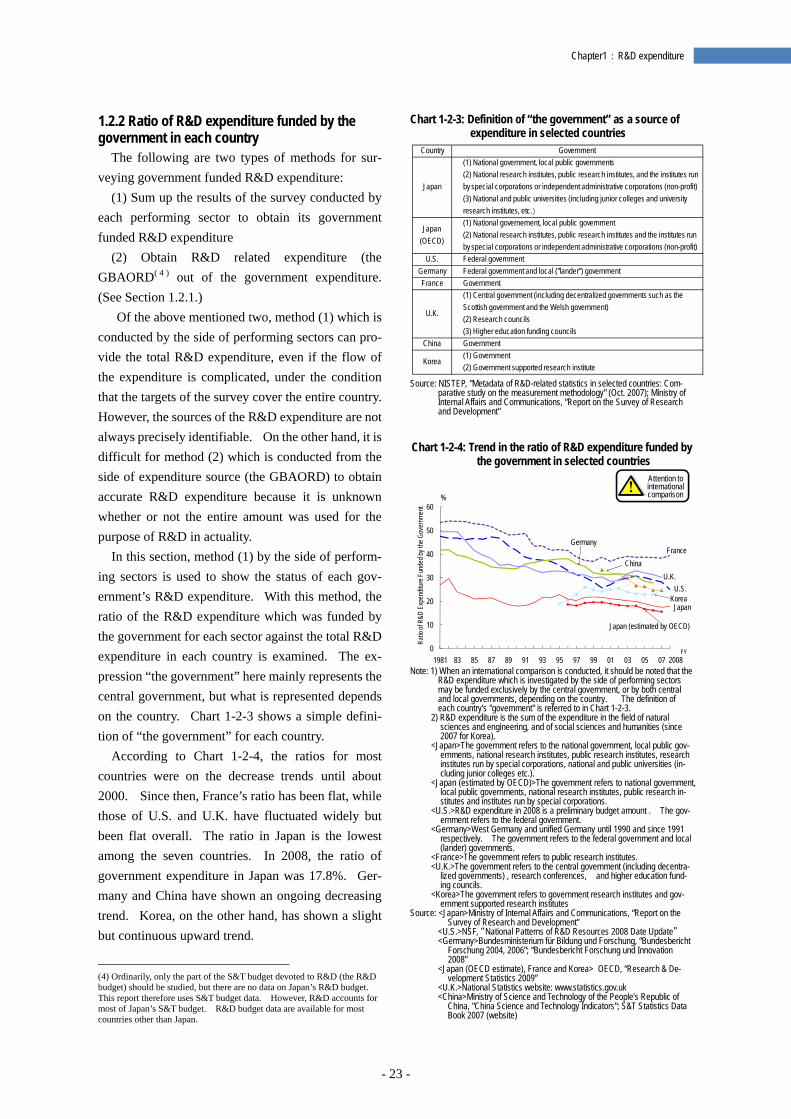
- 23 -
Chapter1:R&D expenditure
1.2.2 Ratio of R&D expenditure funded by the government in each country
The following are two types of methods for sur-veying government funded R&D expenditure:
(1) Sum up the results of the survey conducted by each performing sector to obtain its government funded R&D expenditure
(2) Obtain R&D related expenditure (the GBAORD( 4 ) out of the government expenditure. (See Section 1.2.1.)
Of the above mentioned two, method (1) which is conducted by the side of performing sectors can pro-vide the total R&D expenditure, even if the flow of the expenditure is complicated, under the condition that the targets of the survey cover the entire country. However, the sources of the R&D expenditure are not always precisely identifiable. On the other hand, it is difficult for method (2) which is conducted from the side of expenditure source (the GBAORD) to obtain accurate R&D expenditure because it is unknown whether or not the entire amount was used for the purpose of R&D in actuality.
In this section, method (1) by the side of perform-ing sectors is used to show the status of each gov-ernment’s R&D expenditure. With this method, the ratio of the R&D expenditure which was funded by the government for each sector against the total R&D expenditure in each country is examined. The ex-pression “the government” here mainly represents the central government, but what is represented depends on the country. Chart 1-2-3 shows a simple defini-tion of “the government” for each country.
According to Chart 1-2-4, the ratios for most countries were on the decrease trends until about 2000. Since then, France’s ratio has been flat, while those of U.S. and U.K. have fluctuated widely but been flat overall. The ratio in Japan is the lowest among the seven countries. In 2008, the ratio of government expenditure in Japan was 17.8%. Ger-many and China have shown an ongoing decreasing trend. Korea, on the other hand, has shown a slight but continuous upward trend.
(4) Ordinarily, only the part of the S&T budget devoted to R&D (the R&D budget) should be studied, but there are no data on Japan’s R&D budget. This report therefore uses S&T budget data. However, R&D accounts for most of Japan’s S&T budget. R&D budget data are available for most countries other than Japan.
Chart 1-2-3: Definition of “the government” as a source of expenditure in selected countries
Source: NISTEP, "Metadata of R&D-related statistics in selected countries: Com-
parative study on the measurement methodology" (Oct. 2007); Ministry of Internal Affairs and Communications, “Report on the Survey of Research and Development”
Chart 1-2-4: Trend in the ratio of R&D expenditure funded by
the government in selected countries
Note: 1) When an international comparison is conducted, it should be noted that the
R&D expenditure which is investigated by the side of performing sectors may be funded exclusively by the central government, or by both central and local governments, depending on the country. The definition of each country's "government" is referred to in Chart 1-2-3.
2) R&D expenditure is the sum of the expenditure in the field of natural sciences and engineering, and of social sciences and humanities (since 2007 for Korea).
<Japan>The government refers to the national government, local public gov-ernments, national research institutes, public research institutes, research institutes run by special corporations, national and public universities (in-cluding junior colleges etc.).
<Japan (estimated by OECD)>The government refers to national government, local public governments, national research institutes, public research in-stitutes and institutes run by special corporations.
<U.S.>R&D expenditure in 2008 is a preliminary budget amount . The gov-ernment refers to the federal government.
<Germany>West Germany and unified Germany until 1990 and since 1991 respectively. The government refers to the federal government and local (lander) governments.
<France>The government refers to public research institutes. <U.K.>The government refers to the central government (including decentra-
lized governments) , research conferences, and higher education fund-ing councils.
<Korea>The government refers to government research institutes and gov-ernment supported research institutes
Source: <Japan>Ministry of Internal Affairs and Communications, “Report on the Survey of Research and Development”
<U.S.>NSF, “National Patterns of R&D Resources 2008 Date Update” <Germany>Bundesministerium für Bildung und Forschung, “Bundesbericht
Forschung 2004, 2006”; “Bundesbericht Forschung und Innovation 2008”
<Japan (OECD estimate), France and Korea> OECD, “Research & De-velopment Statistics 2009”
<U.K.>National Statistics website: www.statistics.gov.uk <China>Ministry of Science and Technology of the People’s Republic of
China, "China Science and Technology Indicators"; S&T Statistics Data Book 2007 (website)
Country Government
Japan
(1) National government, local public governments(2) National research institutes, public research institutes, and the institutes runby special corporations or independent administrative corporations (non-profit)(3) National and public universities (including junior colleges and universityresearch institutes, etc.)
Japan(OECD)
(1) National governement, local public government(2) National research institutes, public research institutes and the institutes runby special corporations or independent administrative corporations (non-profit)
U.S. Federal governmentGermany Federal government and local ("lander") governmentFrance Government
U.K.
(1) Central government (including decentralized governments such as theScottish government and the Welsh government)(2) Research councils(3) Higher education funding councils
China Government
Korea(1) Government(2) Government supported research institute
0
10
20
30
40
50
60
1981 83 85 87 89 91 93 95 97 99 01 03 05 07
%
2008
Ratio
of R
&D E
xpen
ditur
e Fun
ded b
y the
Gov
ernm
ent
Germany
Japan
U.K.
France
U.S.
China
Korea
Japan (estimated by OECD)
FY
Attention to international comparison
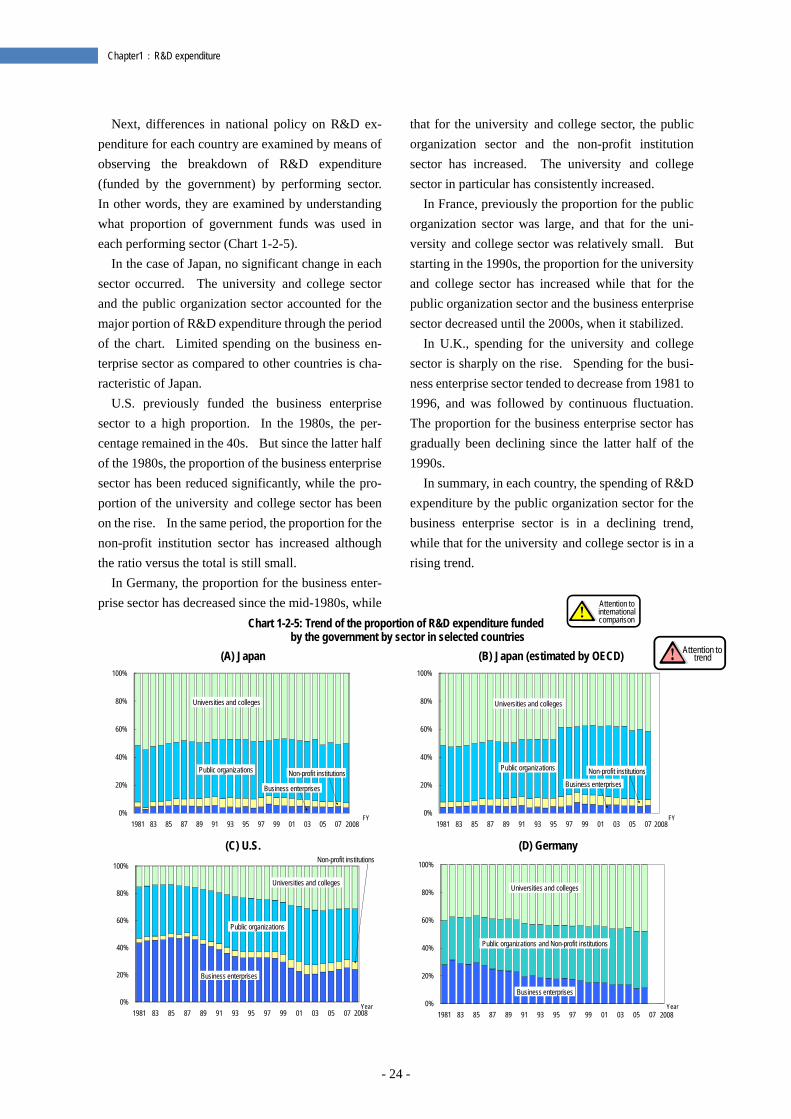
- 24 -
Chapter1:R&D expenditure
Next, differences in national policy on R&D ex-penditure for each country are examined by means of observing the breakdown of R&D expenditure (funded by the government) by performing sector. In other words, they are examined by understanding what proportion of government funds was used in each performing sector (Chart 1-2-5).
In the case of Japan, no significant change in each sector occurred. The university and college sector and the public organization sector accounted for the major portion of R&D expenditure through the period of the chart. Limited spending on the business en-terprise sector as compared to other countries is cha-racteristic of Japan.
U.S. previously funded the business enterprise sector to a high proportion. In the 1980s, the per-centage remained in the 40s. But since the latter half of the 1980s, the proportion of the business enterprise sector has been reduced significantly, while the pro-portion of the university and college sector has been on the rise. In the same period, the proportion for the non-profit institution sector has increased although the ratio versus the total is still small.
In Germany, the proportion for the business enter-prise sector has decreased since the mid-1980s, while
that for the university and college sector, the public organization sector and the non-profit institution sector has increased. The university and college sector in particular has consistently increased.
In France, previously the proportion for the public organization sector was large, and that for the uni-versity and college sector was relatively small. But starting in the 1990s, the proportion for the university and college sector has increased while that for the public organization sector and the business enterprise sector decreased until the 2000s, when it stabilized.
In U.K., spending for the university and college sector is sharply on the rise. Spending for the busi-ness enterprise sector tended to decrease from 1981 to 1996, and was followed by continuous fluctuation. The proportion for the business enterprise sector has gradually been declining since the latter half of the 1990s.
In summary, in each country, the spending of R&D expenditure by the public organization sector for the business enterprise sector is in a declining trend, while that for the university and college sector is in a rising trend.
Chart 1-2-5: Trend of the proportion of R&D expenditure funded by the government by sector in selected countries
(A) Japan (B) Japan (estimated by OECD)
(C) U.S. (D) Germany
0%
20%
40%
60%
80%
100%
1981 83 85 87 89 91 93 95 97 99 01 03 05 07 2008
Non-profit institutions
Universities and colleges
Public organizations
Business enterprises
FY 0%
20%
40%
60%
80%
100%
1981 83 85 87 89 91 93 95 97 99 01 03 05 07 2008
Non-profit institutions
Universities and colleges
Public organizations
Business enterprises
FY
0%
20%
40%
60%
80%
100%
1981 83 85 87 89 91 93 95 97 99 01 03 05 07 2008
Non-profit institutions
Universities and colleges
Public organizations
Business enterprises
Year 0%
20%
40%
60%
80%
100%
1981 83 85 87 89 91 93 95 97 99 01 03 05 07 2008
Universities and colleges
Public organizations and Non-profit institutions
Business enterprises
Year
Attention to international comparison
Attention to trend
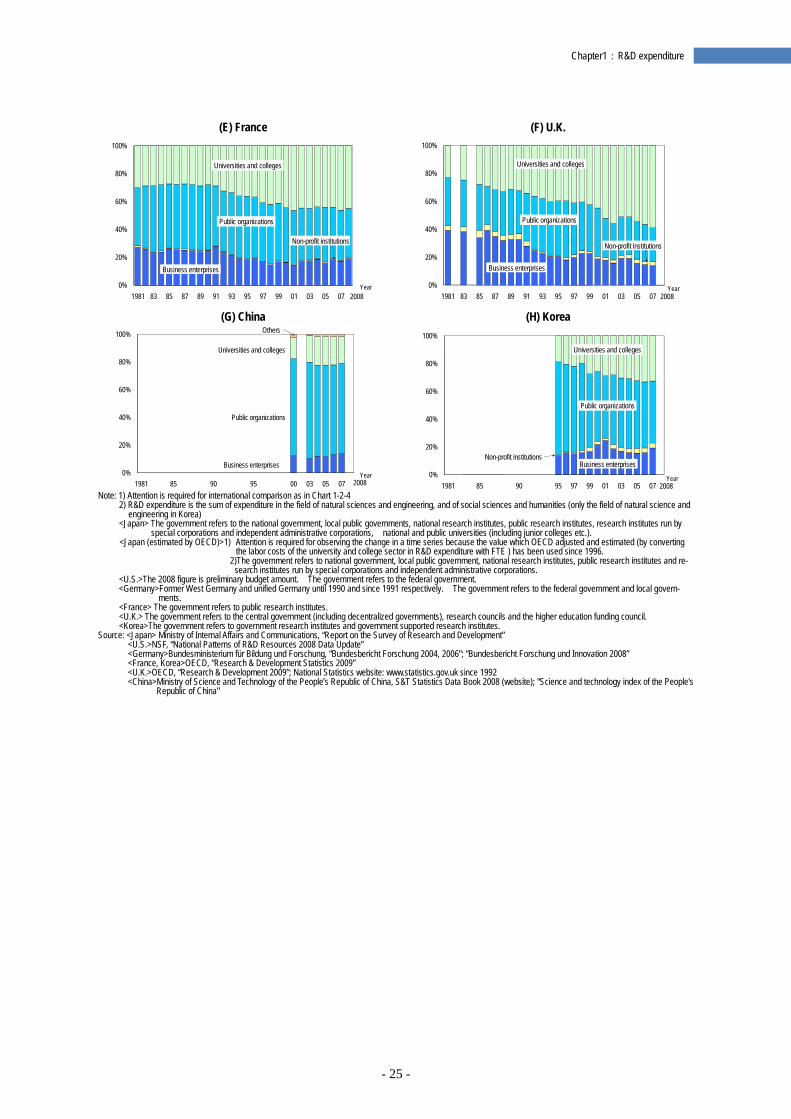
- 25 -
Chapter1:R&D expenditure
(E) France (F) U.K.
(G) China (H) Korea
Note: 1) Attention is required for international comparison as in Chart 1-2-4 2) R&D expenditure is the sum of expenditure in the field of natural sciences and engineering, and of social sciences and humanities (only the field of natural science and
engineering in Korea) <Japan> The government refers to the national government, local public governments, national research institutes, public research institutes, research institutes run by
special corporations and independent administrative corporations, national and public universities (including junior colleges etc.). <Japan (estimated by OECD)>1) Attention is required for observing the change in a time series because the value which OECD adjusted and estimated (by converting
the labor costs of the university and college sector in R&D expenditure with FTE ) has been used since 1996. 2)The government refers to national government, local public government, national research institutes, public research institutes and re-
search institutes run by special corporations and independent administrative corporations. <U.S.>The 2008 figure is preliminary budget amount. The government refers to the federal government. <Germany>Former West Germany and unified Germany until 1990 and since 1991 respectively. The government refers to the federal government and local govern-
ments. <France> The government refers to public research institutes. <U.K.> The government refers to the central government (including decentralized governments), research councils and the higher education funding council. <Korea>The government refers to government research institutes and government supported research institutes.
Source: <Japan> Ministry of Internal Affairs and Communications, “Report on the Survey of Research and Development” <U.S.>NSF, “National Patterns of R&D Resources 2008 Data Update” <Germany>Bundesministerium für Bildung und Forschung, “Bundesbericht Forschung 2004, 2006”; “Bundesbericht Forschung und Innovation 2008” <France, Korea>OECD, “Research & Development Statistics 2009” <U.K.>OECD, “Research & Development 2009”; National Statistics website: www.statistics.gov.uk since 1992 <China>Ministry of Science and Technology of the People’s Republic of China, S&T Statistics Data Book 2008 (website); "Science and technology index of the People's
Republic of China"
0%
20%
40%
60%
80%
100%
1981 83 85 87 89 91 93 95 97 99 01 03 05 07 2008
Non-profit institutions
Universities and colleges
Public organizations
Business enterprises
Year 0%
20%
40%
60%
80%
100%
1981 83 85 87 89 91 93 95 97 99 01 03 05 07 2008
Non-profit institutions
Universities and colleges
Public organizations
Business enterprises
Year
0%
20%
40%
60%
80%
100%
1981 85 90 95 00 03 05 07 2008
Others
Universities and colleges
Public organizations
Business enterprisesYear 0%
20%
40%
60%
80%
100%
1981 85 90 95 97 99 01 03 05 07 2008
Non-profit institutions
Universities and colleges
Public organizations
Business enterprises
Year
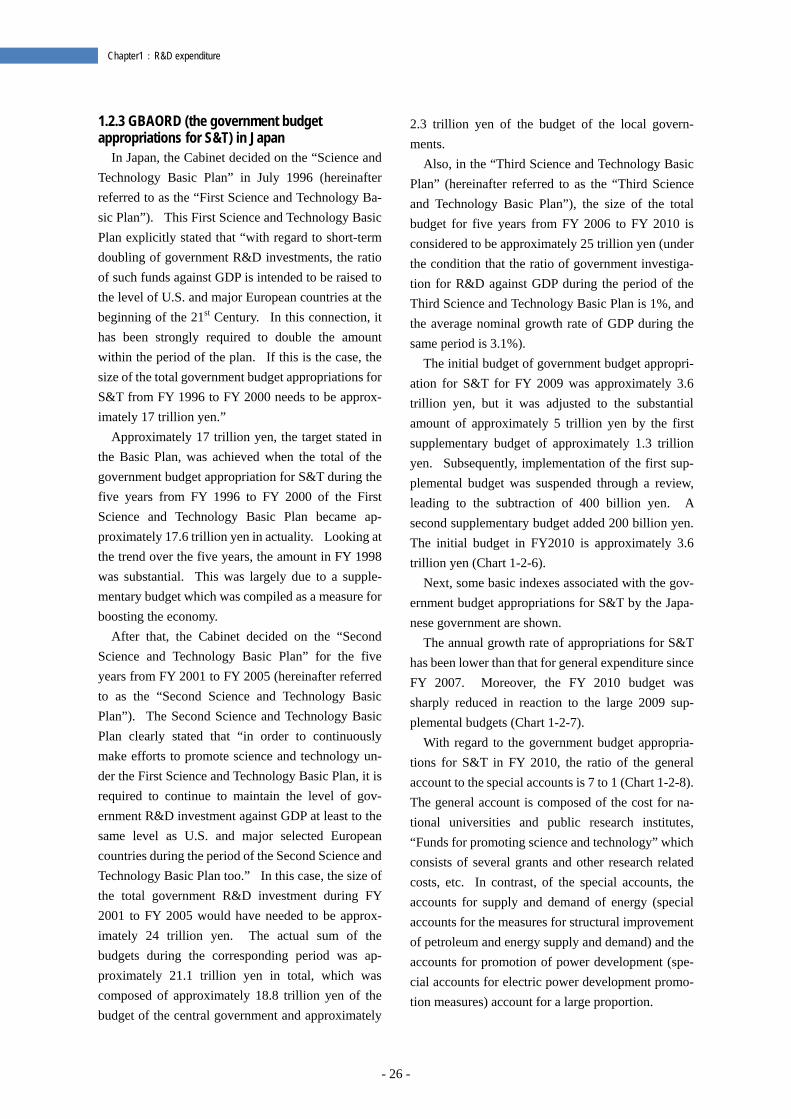
- 26 -
Chapter1:R&D expenditure
1.2.3 GBAORD (the government budget appropriations for S&T) in Japan
In Japan, the Cabinet decided on the “Science and Technology Basic Plan” in July 1996 (hereinafter referred to as the “First Science and Technology Ba-sic Plan”). This First Science and Technology Basic Plan explicitly stated that “with regard to short-term doubling of government R&D investments, the ratio of such funds against GDP is intended to be raised to the level of U.S. and major European countries at the beginning of the 21st Century. In this connection, it has been strongly required to double the amount within the period of the plan. If this is the case, the size of the total government budget appropriations for S&T from FY 1996 to FY 2000 needs to be approx-imately 17 trillion yen.”
Approximately 17 trillion yen, the target stated in the Basic Plan, was achieved when the total of the government budget appropriation for S&T during the five years from FY 1996 to FY 2000 of the First Science and Technology Basic Plan became ap-proximately 17.6 trillion yen in actuality. Looking at the trend over the five years, the amount in FY 1998 was substantial. This was largely due to a supple-mentary budget which was compiled as a measure for boosting the economy.
After that, the Cabinet decided on the “Second Science and Technology Basic Plan” for the five years from FY 2001 to FY 2005 (hereinafter referred to as the “Second Science and Technology Basic Plan”). The Second Science and Technology Basic Plan clearly stated that “in order to continuously make efforts to promote science and technology un-der the First Science and Technology Basic Plan, it is required to continue to maintain the level of gov-ernment R&D investment against GDP at least to the same level as U.S. and major selected European countries during the period of the Second Science and Technology Basic Plan too.” In this case, the size of the total government R&D investment during FY 2001 to FY 2005 would have needed to be approx-imately 24 trillion yen. The actual sum of the budgets during the corresponding period was ap-proximately 21.1 trillion yen in total, which was composed of approximately 18.8 trillion yen of the budget of the central government and approximately
2.3 trillion yen of the budget of the local govern-ments.
Also, in the “Third Science and Technology Basic Plan” (hereinafter referred to as the “Third Science and Technology Basic Plan”), the size of the total budget for five years from FY 2006 to FY 2010 is considered to be approximately 25 trillion yen (under the condition that the ratio of government investiga-tion for R&D against GDP during the period of the Third Science and Technology Basic Plan is 1%, and the average nominal growth rate of GDP during the same period is 3.1%).
The initial budget of government budget appropri-ation for S&T for FY 2009 was approximately 3.6 trillion yen, but it was adjusted to the substantial amount of approximately 5 trillion yen by the first supplementary budget of approximately 1.3 trillion yen. Subsequently, implementation of the first sup-plemental budget was suspended through a review, leading to the subtraction of 400 billion yen. A second supplementary budget added 200 billion yen. The initial budget in FY2010 is approximately 3.6 trillion yen (Chart 1-2-6).
Next, some basic indexes associated with the gov-ernment budget appropriations for S&T by the Japa-nese government are shown.
The annual growth rate of appropriations for S&T has been lower than that for general expenditure since FY 2007. Moreover, the FY 2010 budget was sharply reduced in reaction to the large 2009 sup-plemental budgets (Chart 1-2-7).
With regard to the government budget appropria-tions for S&T in FY 2010, the ratio of the general account to the special accounts is 7 to 1 (Chart 1-2-8). The general account is composed of the cost for na-tional universities and public research institutes, “Funds for promoting science and technology” which consists of several grants and other research related costs, etc. In contrast, of the special accounts, the accounts for supply and demand of energy (special accounts for the measures for structural improvement of petroleum and energy supply and demand) and the accounts for promotion of power development (spe-cial accounts for electric power development promo-tion measures) account for a large proportion.
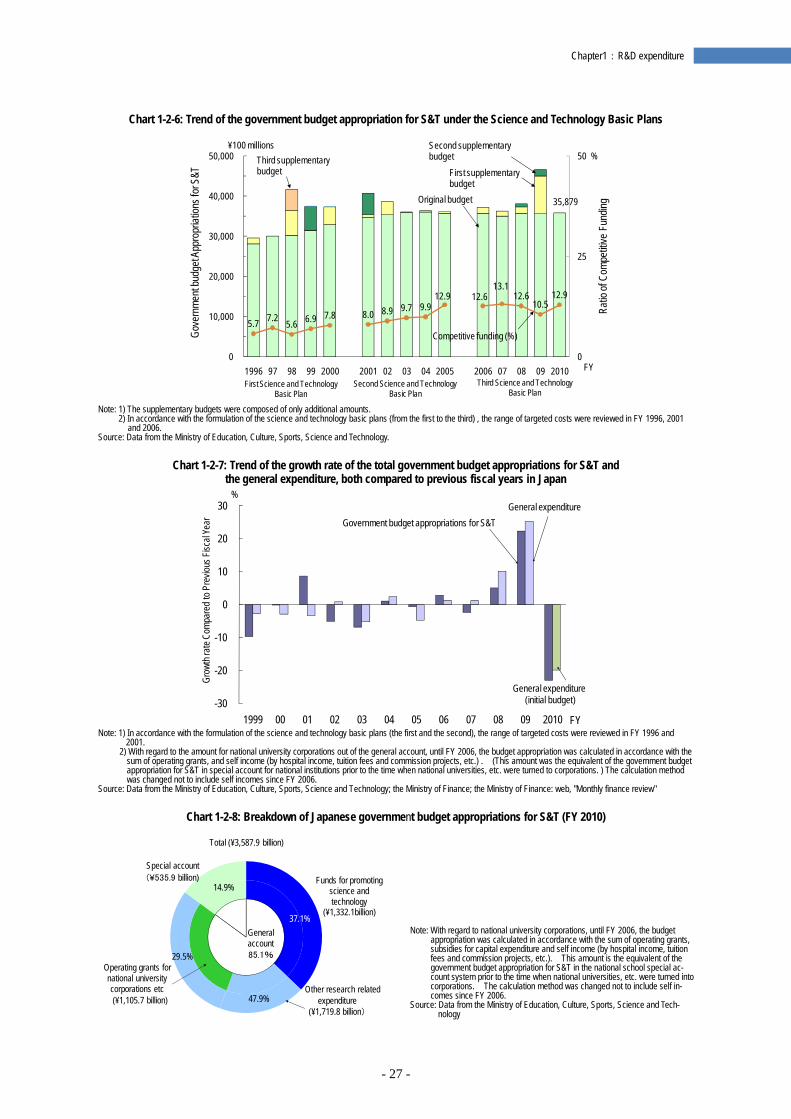
- 27 -
Chapter1:R&D expenditure
Chart 1-2-6: Trend of the government budget appropriation for S&T under the Science and Technology Basic Plans
Note: 1) The supplementary budgets were composed of only additional amounts.
2) In accordance with the formulation of the science and technology basic plans (from the first to the third) , the range of targeted costs were reviewed in FY 1996, 2001 and 2006.
Source: Data from the Ministry of Education, Culture, Sports, Science and Technology.
Chart 1-2-7: Trend of the growth rate of the total government budget appropriations for S&T and the general expenditure, both compared to previous fiscal years in Japan
Note: 1) In accordance with the formulation of the science and technology basic plans (the first and the second), the range of targeted costs were reviewed in FY 1996 and
2001. 2) With regard to the amount for national university corporations out of the general account, until FY 2006, the budget appropriation was calculated in accordance with the
sum of operating grants, and self income (by hospital income, tuition fees and commission projects, etc.) . (This amount was the equivalent of the government budget appropriation for S&T in special account for national institutions prior to the time when national universities, etc. were turned to corporations. ) The calculation method was changed not to include self incomes since FY 2006.
Source: Data from the Ministry of Education, Culture, Sports, Science and Technology; the Ministry of Finance; the Ministry of Finance: web, "Monthly finance review"
Chart 1-2-8: Breakdown of Japanese government budget appropriations for S&T (FY 2010)
Note: With regard to national university corporations, until FY 2006, the budget
appropriation was calculated in accordance with the sum of operating grants, subsidies for capital expenditure and self income (by hospital income, tuition fees and commission projects, etc.). This amount is the equivalent of the government budget appropriation for S&T in the national school special ac-count system prior to the time when national universities, etc. were turned into corporations. The calculation method was changed not to include self in-comes since FY 2006.
Source: Data from the Ministry of Education, Culture, Sports, Science and Tech-nology
35,879
5.7 7.2 5.6 6.9 7.8 8.0 8.9 9.7 9.9 12.9 12.6
13.1 12.6
10.5 12.9
0
25
50
0
10,000
20,000
30,000
40,000
50,000
1996 97 98 99 2000 2001 02 03 04 2005 2006 07 08 09 2010
Ratio
of C
ompe
titive
Fun
ding
Gove
rnme
nt bu
dget
Appr
opria
tions
for S
&T
FY
¥100 millions%
First supplementary budget
Third supplementary budget
Second supplementary budget
Competitive funding (%)
First Science and Technology Basic Plan
Second Science and TechnologyBasic Plan
Third Science and Technology Basic Plan
Original budget
-30
-20
-10
0
10
20
30
1999 00 01 02 03 04 05 06 07 08 09 2010
Grow
th ra
te C
ompa
red
to P
revio
us F
iscal
Year
FY
%
Government budget appropriations for S&TGeneral expenditure
General expenditure (initial budget)
37.1%
47.9%
14.9%
29.5%
Funds for promoting science and technology
(¥1,332.1billion)
Operating grants for national university corporations etc(¥1,105.7 billion)
Special account (¥535.9 billion)
General account 85.1%
Total (¥3,587.9 billion)
Other research related expenditure
(¥1,719.8 billion)
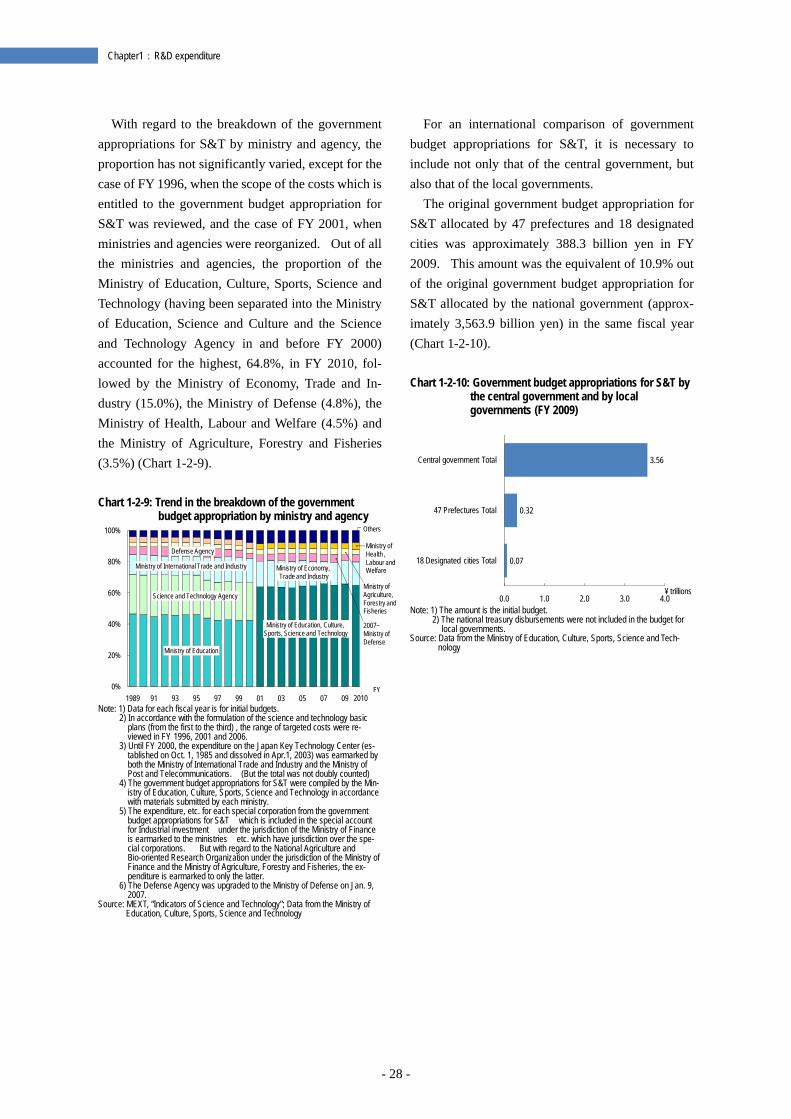
- 28 -
Chapter1:R&D expenditure
With regard to the breakdown of the government appropriations for S&T by ministry and agency, the proportion has not significantly varied, except for the case of FY 1996, when the scope of the costs which is entitled to the government budget appropriation for S&T was reviewed, and the case of FY 2001, when ministries and agencies were reorganized. Out of all the ministries and agencies, the proportion of the Ministry of Education, Culture, Sports, Science and Technology (having been separated into the Ministry of Education, Science and Culture and the Science and Technology Agency in and before FY 2000) accounted for the highest, 64.8%, in FY 2010, fol-lowed by the Ministry of Economy, Trade and In-dustry (15.0%), the Ministry of Defense (4.8%), the Ministry of Health, Labour and Welfare (4.5%) and the Ministry of Agriculture, Forestry and Fisheries (3.5%) (Chart 1-2-9). Chart 1-2-9: Trend in the breakdown of the government
budget appropriation by ministry and agency
Note: 1) Data for each fiscal year is for initial budgets.
2) In accordance with the formulation of the science and technology basic plans (from the first to the third) , the range of targeted costs were re-viewed in FY 1996, 2001 and 2006.
3) Until FY 2000, the expenditure on the Japan Key Technology Center (es-tablished on Oct. 1, 1985 and dissolved in Apr.1, 2003) was earmarked by both the Ministry of International Trade and Industry and the Ministry of Post and Telecommunications. (But the total was not doubly counted)
4) The government budget appropriations for S&T were compiled by the Min-istry of Education, Culture, Sports, Science and Technology in accordance with materials submitted by each ministry.
5) The expenditure, etc. for each special corporation from the government budget appropriations for S&T which is included in the special account for Industrial investment under the jurisdiction of the Ministry of Finance is earmarked to the ministries etc. which have jurisdiction over the spe-cial corporations. But with regard to the National Agriculture and Bio-oriented Research Organization under the jurisdiction of the Ministry of Finance and the Ministry of Agriculture, Forestry and Fisheries, the ex-penditure is earmarked to only the latter.
6) The Defense Agency was upgraded to the Ministry of Defense on Jan. 9, 2007.
Source: MEXT, “Indicators of Science and Technology”; Data from the Ministry of Education, Culture, Sports, Science and Technology
For an international comparison of government budget appropriations for S&T, it is necessary to include not only that of the central government, but also that of the local governments.
The original government budget appropriation for S&T allocated by 47 prefectures and 18 designated cities was approximately 388.3 billion yen in FY 2009. This amount was the equivalent of 10.9% out of the original government budget appropriation for S&T allocated by the national government (approx-imately 3,563.9 billion yen) in the same fiscal year (Chart 1-2-10). Chart 1-2-10: Government budget appropriations for S&T by
the central government and by local governments (FY 2009)
Note: 1) The amount is the initial budget.
2) The national treasury disbursements were not included in the budget for local governments.
Source: Data from the Ministry of Education, Culture, Sports, Science and Tech-nology
0%
20%
40%
60%
80%
100%
1989 91 93 95 97 99 01 03 05 07 09 2010
Ministry of Education
Science and Technology Agency
Ministry of International Trade and Industry
Defense Agency
Ministry of Agriculture,Forestry andFisheries
Ministry of Health , Labour and Welfare
Others
Ministry of Economy,Trade and Industry
Ministry of Education, Culture, Sports, Science and Technology
2007~Ministry of Defense
FY
0.07
0.32
3.56
0.0 1.0 2.0 3.0 4.0
18 Designated cities Total
47 Prefectures Total
Central government Total
¥ trillions
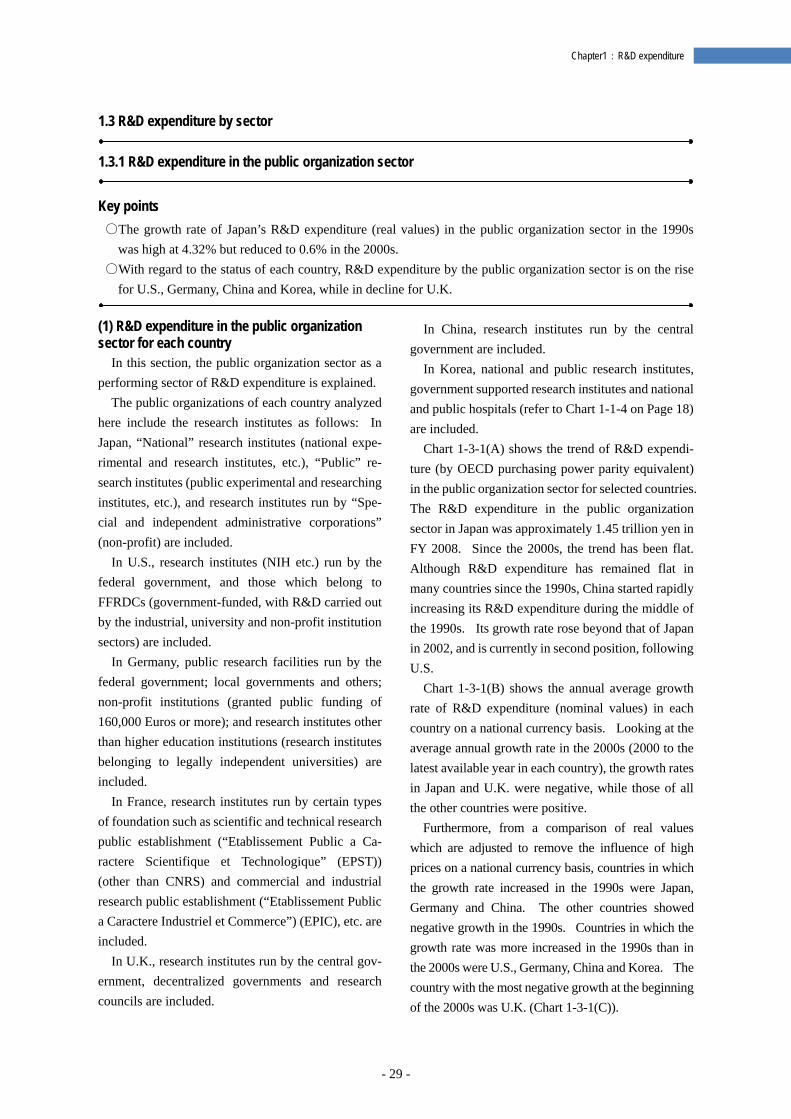
- 29 -
Chapter1:R&D expenditure
1.3 R&D expenditure by sector
1.3.1 R&D expenditure in the public organization sector
Key points ○The growth rate of Japan’s R&D expenditure (real values) in the public organization sector in the 1990s
was high at 4.32% but reduced to 0.6% in the 2000s. ○With regard to the status of each country, R&D expenditure by the public organization sector is on the rise
for U.S., Germany, China and Korea, while in decline for U.K.
(1) R&D expenditure in the public organization sector for each country
In this section, the public organization sector as a performing sector of R&D expenditure is explained.
The public organizations of each country analyzed here include the research institutes as follows: In Japan, “National” research institutes (national expe-rimental and research institutes, etc.), “Public” re-search institutes (public experimental and researching institutes, etc.), and research institutes run by “Spe-cial and independent administrative corporations” (non-profit) are included.
In U.S., research institutes (NIH etc.) run by the federal government, and those which belong to FFRDCs (government-funded, with R&D carried out by the industrial, university and non-profit institution sectors) are included.
In Germany, public research facilities run by the federal government; local governments and others; non-profit institutions (granted public funding of 160,000 Euros or more); and research institutes other than higher education institutions (research institutes belonging to legally independent universities) are included.
In France, research institutes run by certain types of foundation such as scientific and technical research public establishment (“Etablissement Public a Ca-ractere Scientifique et Technologique” (EPST)) (other than CNRS) and commercial and industrial research public establishment (“Etablissement Public a Caractere Industriel et Commerce”) (EPIC), etc. are included.
In U.K., research institutes run by the central gov-ernment, decentralized governments and research councils are included.
In China, research institutes run by the central government are included.
In Korea, national and public research institutes, government supported research institutes and national and public hospitals (refer to Chart 1-1-4 on Page 18) are included.
Chart 1-3-1(A) shows the trend of R&D expendi-ture (by OECD purchasing power parity equivalent) in the public organization sector for selected countries. The R&D expenditure in the public organization sector in Japan was approximately 1.45 trillion yen in FY 2008. Since the 2000s, the trend has been flat. Although R&D expenditure has remained flat in many countries since the 1990s, China started rapidly increasing its R&D expenditure during the middle of the 1990s. Its growth rate rose beyond that of Japan in 2002, and is currently in second position, following U.S.
Chart 1-3-1(B) shows the annual average growth rate of R&D expenditure (nominal values) in each country on a national currency basis. Looking at the average annual growth rate in the 2000s (2000 to the latest available year in each country), the growth rates in Japan and U.K. were negative, while those of all the other countries were positive.
Furthermore, from a comparison of real values which are adjusted to remove the influence of high prices on a national currency basis, countries in which the growth rate increased in the 1990s were Japan, Germany and China. The other countries showed negative growth in the 1990s. Countries in which the growth rate was more increased in the 1990s than in the 2000s were U.S., Germany, China and Korea. The country with the most negative growth at the beginning of the 2000s was U.K. (Chart 1-3-1(C)).
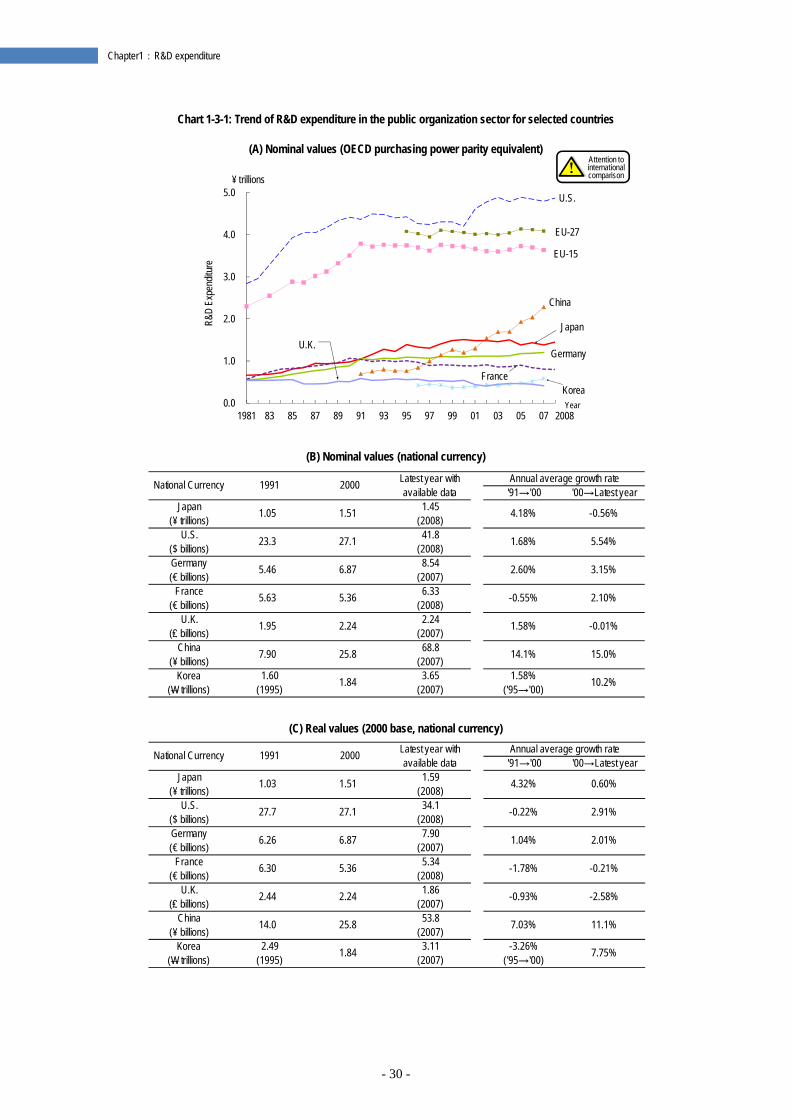
- 30 -
Chapter1:R&D expenditure
Chart 1-3-1: Trend of R&D expenditure in the public organization sector for selected countries
(A) Nominal values (OECD purchasing power parity equivalent)
(B) Nominal values (national currency)
(C) Real values (2000 base, national currency)
0.0
1.0
2.0
3.0
4.0
5.0
1981 83 85 87 89 91 93 95 97 99 01 03 05 07
R&D
Expe
nditu
re
2008
¥ trillions
EU-15
EU-27
U.K.
U.S.
Japan
France
Germany
China
KoreaYear
Annual average growth rate'91→'00 '00→Latest year
Japan(¥ trillions) 1.05 1.51 1.45
(2008) 4.18% -0.56%
U.S.($ billions) 23.3 27.1 41.8
(2008) 1.68% 5.54%
Germany(€ billions) 5.46 6.87 8.54
(2007) 2.60% 3.15%
France(€ billions) 5.63 5.36 6.33
(2008) -0.55% 2.10%
U.K.(₤ billions) 1.95 2.24 2.24
(2007) 1.58% -0.01%
China(¥ billions) 7.90 25.8 68.8
(2007) 14.1% 15.0%
Korea(W trillions)
1.60(1995) 1.84 3.65
(2007)1.58%
('95→'00) 10.2%
National Currency 1991 2000 Latest year withavailable data
Annual average growth rate'91→'00 '00→Latest year
Japan(¥ trillions) 1.03 1.51 1.59
(2008) 4.32% 0.60%
U.S.($ billions) 27.7 27.1 34.1
(2008) -0.22% 2.91%
Germany(€ billions) 6.26 6.87 7.90
(2007) 1.04% 2.01%
France(€ billions) 6.30 5.36 5.34
(2008) -1.78% -0.21%
U.K.(₤ billions) 2.44 2.24 1.86
(2007) -0.93% -2.58%
China(¥ billions) 14.0 25.8 53.8
(2007) 7.03% 11.1%
Korea(W trillions)
2.49(1995) 1.84 3.11
(2007)-3.26%
('95→'00) 7.75%
National Currency 1991 2000 Latest year withavailable data
Attention to international comparison
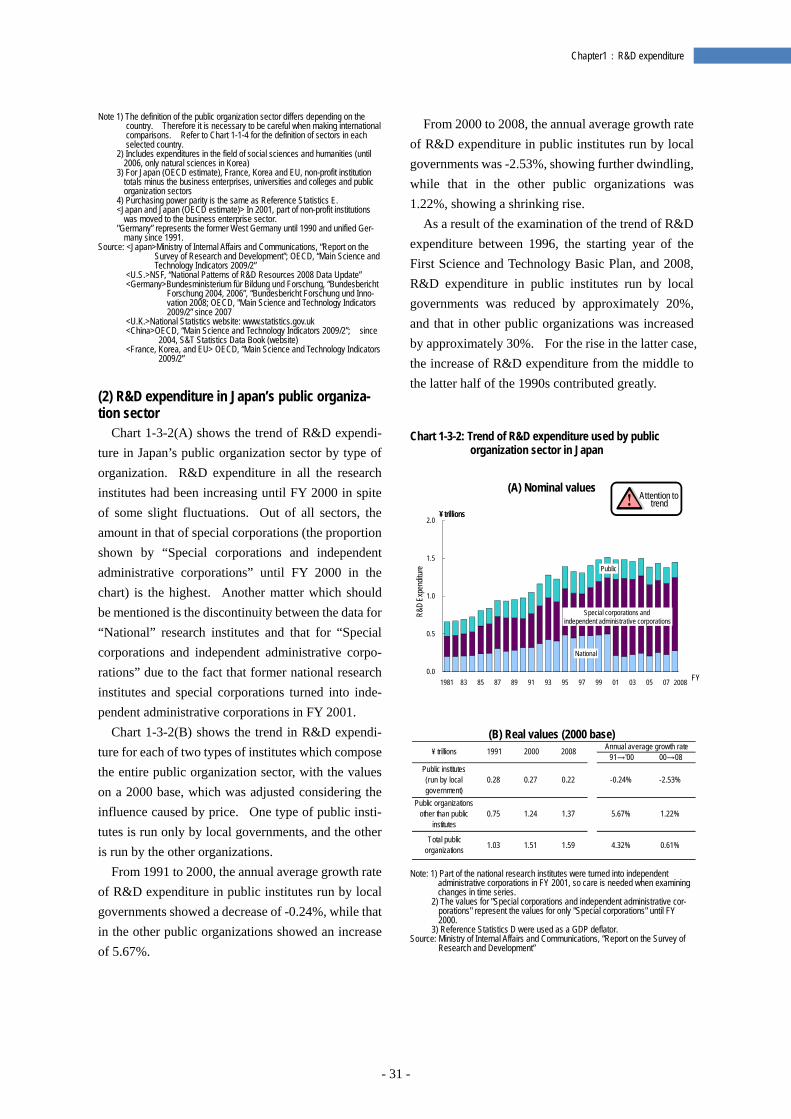
- 31 -
Chapter1:R&D expenditure
Note 1) The definition of the public organization sector differs depending on the country. Therefore it is necessary to be careful when making international comparisons. Refer to Chart 1-1-4 for the definition of sectors in each selected country.
2) Includes expenditures in the field of social sciences and humanities (until 2006, only natural sciences in Korea)
3) For Japan (OECD estimate), France, Korea and EU, non-profit institution totals minus the business enterprises, universities and colleges and public organization sectors
4) Purchasing power parity is the same as Reference Statistics E. <Japan and Japan (OECD estimate)> In 2001, part of non-profit institutions
was moved to the business enterprise sector. "Germany” represents the former West Germany until 1990 and unified Ger-
many since 1991. Source: <Japan>Ministry of Internal Affairs and Communications, “Report on the
Survey of Research and Development”; OECD, “Main Science and Technology Indicators 2009/2”
<U.S.>NSF, “National Patterns of R&D Resources 2008 Data Update” <Germany>Bundesministerium für Bildung und Forschung, “Bundesbericht
Forschung 2004, 2006”, “Bundesbericht Forschung und Inno-vation 2008; OECD, "Main Science and Technology Indicators 2009/2” since 2007
<U.K.>National Statistics website: www.statistics.gov.uk <China>OECD, “Main Science and Technology Indicators 2009/2”; since
2004, S&T Statistics Data Book (website) <France, Korea, and EU> OECD, “Main Science and Technology Indicators
2009/2”
(2) R&D expenditure in Japan’s public organiza-tion sector
Chart 1-3-2(A) shows the trend of R&D expendi-ture in Japan’s public organization sector by type of organization. R&D expenditure in all the research institutes had been increasing until FY 2000 in spite of some slight fluctuations. Out of all sectors, the amount in that of special corporations (the proportion shown by “Special corporations and independent administrative corporations” until FY 2000 in the chart) is the highest. Another matter which should be mentioned is the discontinuity between the data for “National” research institutes and that for “Special corporations and independent administrative corpo-rations” due to the fact that former national research institutes and special corporations turned into inde-pendent administrative corporations in FY 2001.
Chart 1-3-2(B) shows the trend in R&D expendi-ture for each of two types of institutes which compose the entire public organization sector, with the values on a 2000 base, which was adjusted considering the influence caused by price. One type of public insti-tutes is run only by local governments, and the other is run by the other organizations.
From 1991 to 2000, the annual average growth rate of R&D expenditure in public institutes run by local governments showed a decrease of -0.24%, while that in the other public organizations showed an increase of 5.67%.
From 2000 to 2008, the annual average growth rate of R&D expenditure in public institutes run by local governments was -2.53%, showing further dwindling, while that in the other public organizations was 1.22%, showing a shrinking rise.
As a result of the examination of the trend of R&D expenditure between 1996, the starting year of the First Science and Technology Basic Plan, and 2008, R&D expenditure in public institutes run by local governments was reduced by approximately 20%, and that in other public organizations was increased by approximately 30%. For the rise in the latter case, the increase of R&D expenditure from the middle to the latter half of the 1990s contributed greatly. Chart 1-3-2: Trend of R&D expenditure used by public
organization sector in Japan
(A) Nominal values
(B) Real values (2000 base)
Note: 1) Part of the national research institutes were turned into independent
administrative corporations in FY 2001, so care is needed when examining changes in time series.
2) The values for "Special corporations and independent administrative cor-porations" represent the values for only "Special corporations" until FY 2000.
3) Reference Statistics D were used as a GDP deflator. Source: Ministry of Internal Affairs and Communications, “Report on the Survey of
Research and Development”
0.0
0.5
1.0
1.5
2.0
1981 83 85 87 89 91 93 95 97 99 01 03 05 07
R&D
Expe
nditu
re
2008
¥ trillions
Special corporations and independent administrative corporations
Public
National
¥ trillions
FY
Annual average growth rate91→'00 00→08
Public institutes(run by localgovernment)
0.28 0.27 0.22 -0.24% -2.53%
Public organizationsother than public
institutes0.75 1.24 1.37 5.67% 1.22%
Total publicorganizations 1.03 1.51 1.59 4.32% 0.61%
¥ trillions 1991 2000 2008
Attention to trend
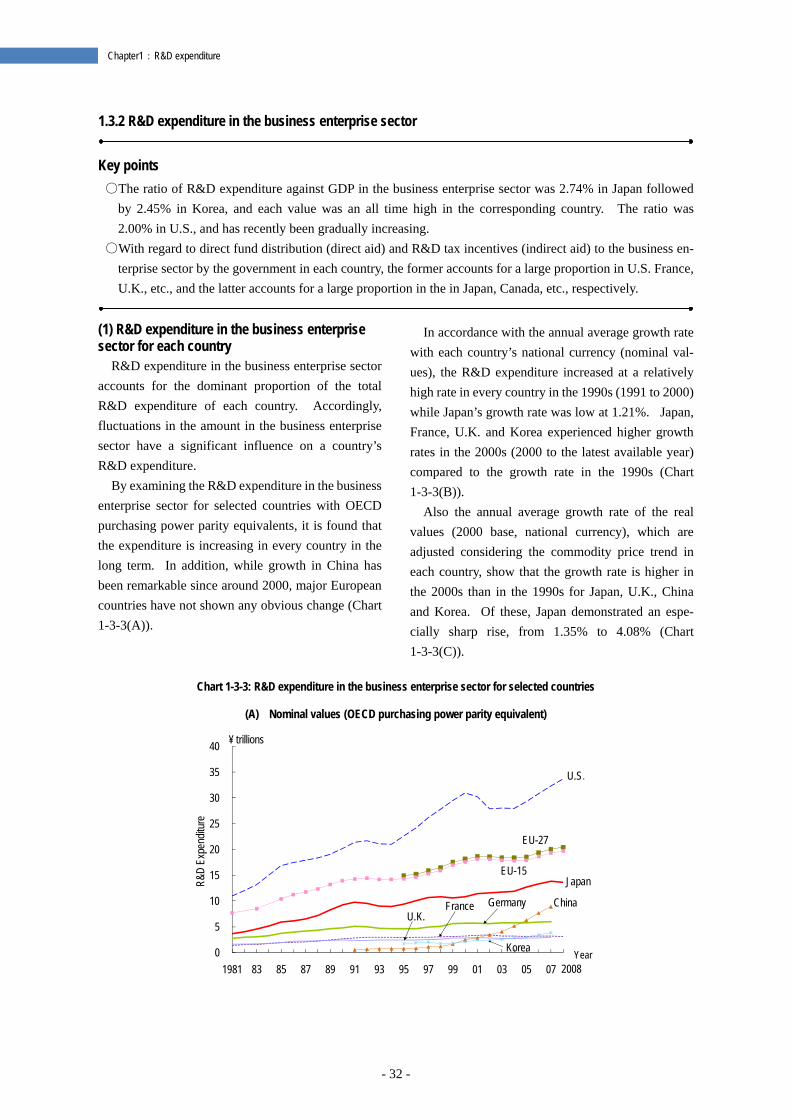
- 32 -
Chapter1:R&D expenditure
1.3.2 R&D expenditure in the business enterprise sector
Key points ○The ratio of R&D expenditure against GDP in the business enterprise sector was 2.74% in Japan followed
by 2.45% in Korea, and each value was an all time high in the corresponding country. The ratio was 2.00% in U.S., and has recently been gradually increasing.
○With regard to direct fund distribution (direct aid) and R&D tax incentives (indirect aid) to the business en-terprise sector by the government in each country, the former accounts for a large proportion in U.S. France, U.K., etc., and the latter accounts for a large proportion in the in Japan, Canada, etc., respectively.
(1) R&D expenditure in the business enterprise sector for each country
R&D expenditure in the business enterprise sector accounts for the dominant proportion of the total R&D expenditure of each country. Accordingly, fluctuations in the amount in the business enterprise sector have a significant influence on a country’s R&D expenditure.
By examining the R&D expenditure in the business enterprise sector for selected countries with OECD purchasing power parity equivalents, it is found that the expenditure is increasing in every country in the long term. In addition, while growth in China has been remarkable since around 2000, major European countries have not shown any obvious change (Chart 1-3-3(A)).
In accordance with the annual average growth rate with each country’s national currency (nominal val-ues), the R&D expenditure increased at a relatively high rate in every country in the 1990s (1991 to 2000) while Japan’s growth rate was low at 1.21%. Japan, France, U.K. and Korea experienced higher growth rates in the 2000s (2000 to the latest available year) compared to the growth rate in the 1990s (Chart 1-3-3(B)).
Also the annual average growth rate of the real values (2000 base, national currency), which are adjusted considering the commodity price trend in each country, show that the growth rate is higher in the 2000s than in the 1990s for Japan, U.K., China and Korea. Of these, Japan demonstrated an espe-cially sharp rise, from 1.35% to 4.08% (Chart 1-3-3(C)).
Chart 1-3-3: R&D expenditure in the business enterprise sector for selected countries
(A) Nominal values (OECD purchasing power parity equivalent)
Korea0
5
10
15
20
25
30
35
40
1981 83 85 87 89 91 93 95 97 99 01 03 05 07
R&D
Expe
nditu
re
2008
¥ trillions
EU-15
EU-27
U.S.
Japan
Germany ChinaFranceU.K.
Year
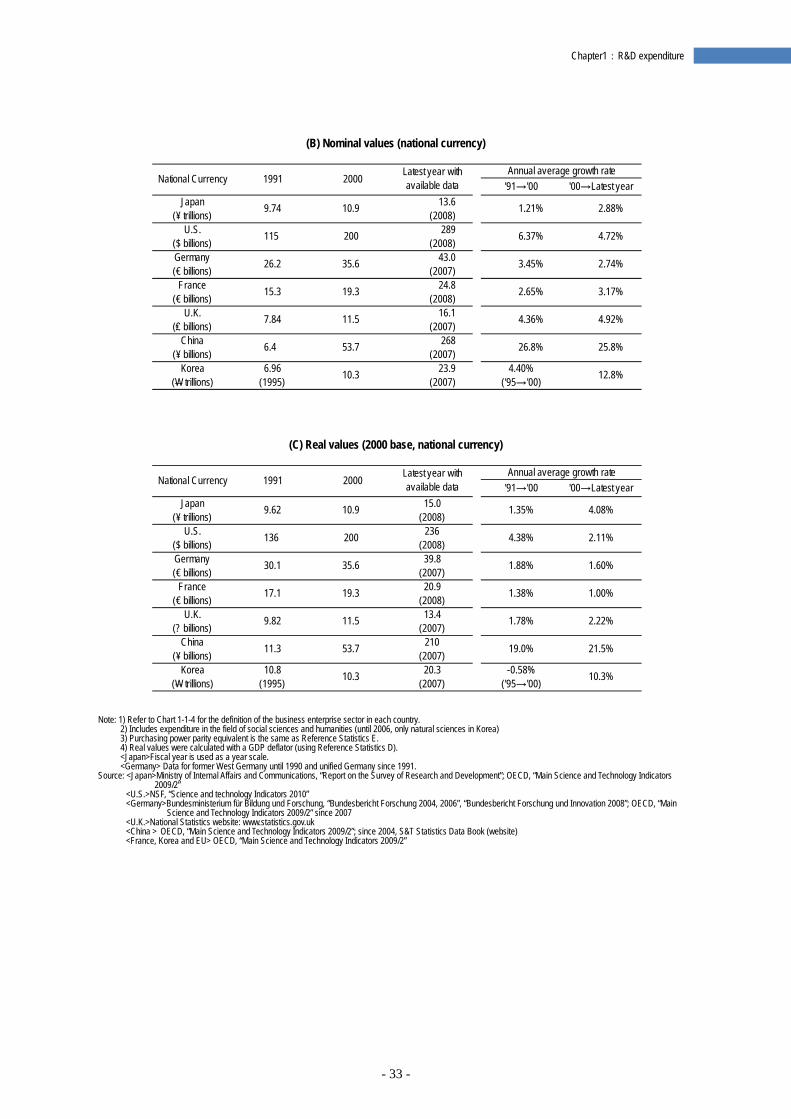
- 33 -
Chapter1:R&D expenditure
(B) Nominal values (national currency)
(C) Real values (2000 base, national currency)
Note: 1) Refer to Chart 1-1-4 for the definition of the business enterprise sector in each country.
2) Includes expenditure in the field of social sciences and humanities (until 2006, only natural sciences in Korea) 3) Purchasing power parity equivalent is the same as Reference Statistics E. 4) Real values were calculated with a GDP deflator (using Reference Statistics D). <Japan>Fiscal year is used as a year scale. <Germany> Data for former West Germany until 1990 and unified Germany since 1991.
Source: <Japan>Ministry of Internal Affairs and Communications, “Report on the Survey of Research and Development”; OECD, “Main Science and Technology Indicators 2009/2”
<U.S.>NSF, “Science and technology Indicators 2010” <Germany>Bundesministerium für Bildung und Forschung, “Bundesbericht Forschung 2004, 2006”, “Bundesbericht Forschung und Innovation 2008”; OECD, “Main
Science and Technology Indicators 2009/2” since 2007 <U.K.>National Statistics website: www.statistics.gov.uk <China > OECD, “Main Science and Technology Indicators 2009/2”; since 2004, S&T Statistics Data Book (website) <France, Korea and EU> OECD, “Main Science and Technology Indicators 2009/2”
Annual average growth rate'91→'00 '00→Latest year
Japan(¥ trillions) 9.74 10.9 13.6
(2008) 1.21% 2.88%
U.S.($ billions) 115 200 289
(2008) 6.37% 4.72%
Germany(€ billions) 26.2 35.6 43.0
(2007) 3.45% 2.74%
France(€ billions) 15.3 19.3 24.8
(2008) 2.65% 3.17%
U.K.(₤ billions) 7.84 11.5 16.1
(2007) 4.36% 4.92%
China(¥ billions) 6.4 53.7 268
(2007) 26.8% 25.8%
Korea(W trillions)
6.96(1995) 10.3 23.9
(2007)4.40%
('95→'00) 12.8%
National Currency 1991 2000Latest year withavailable data
Annual average growth rate'91→'00 '00→Latest year
Japan(¥ trillions) 9.62 10.9 15.0
(2008) 1.35% 4.08%
U.S.($ billions) 136 200 236
(2008) 4.38% 2.11%
Germany(€ billions) 30.1 35.6 39.8
(2007) 1.88% 1.60%
France(€ billions) 17.1 19.3 20.9
(2008) 1.38% 1.00%
U.K.(? billions) 9.82 11.5 13.4
(2007) 1.78% 2.22%
China(¥ billions) 11.3 53.7 210
(2007) 19.0% 21.5%
Korea(W trillions)
10.8(1995) 10.3 20.3
(2007)-0.58%
('95→'00) 10.3%
National Currency 1991 2000Latest year withavailable data
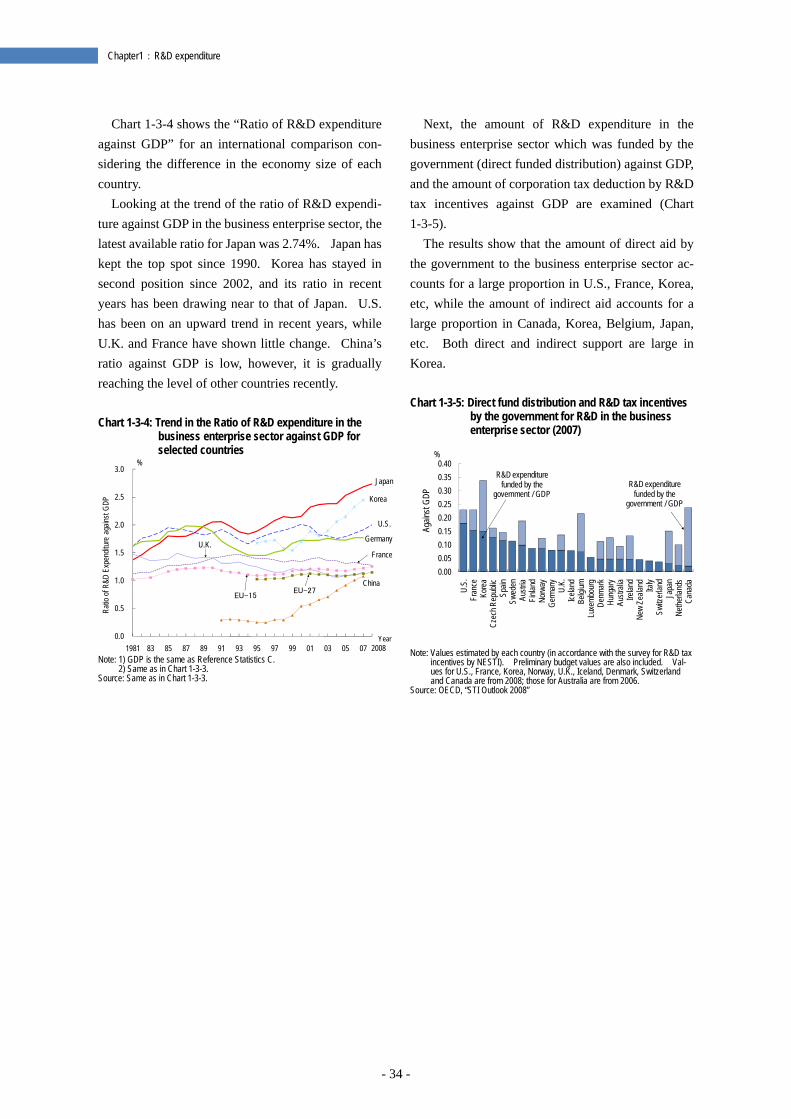
- 34 -
Chapter1:R&D expenditure
Chart 1-3-4 shows the “Ratio of R&D expenditure against GDP” for an international comparison con-sidering the difference in the economy size of each country.
Looking at the trend of the ratio of R&D expendi-ture against GDP in the business enterprise sector, the latest available ratio for Japan was 2.74%. Japan has kept the top spot since 1990. Korea has stayed in second position since 2002, and its ratio in recent years has been drawing near to that of Japan. U.S. has been on an upward trend in recent years, while U.K. and France have shown little change. China’s ratio against GDP is low, however, it is gradually reaching the level of other countries recently. Chart 1-3-4: Trend in the Ratio of R&D expenditure in the
business enterprise sector against GDP for selected countries
Note: 1) GDP is the same as Reference Statistics C.
2) Same as in Chart 1-3-3. Source: Same as in Chart 1-3-3.
Next, the amount of R&D expenditure in the business enterprise sector which was funded by the government (direct funded distribution) against GDP, and the amount of corporation tax deduction by R&D tax incentives against GDP are examined (Chart 1-3-5).
The results show that the amount of direct aid by the government to the business enterprise sector ac-counts for a large proportion in U.S., France, Korea, etc, while the amount of indirect aid accounts for a large proportion in Canada, Korea, Belgium, Japan, etc. Both direct and indirect support are large in Korea. Chart 1-3-5: Direct fund distribution and R&D tax incentives
by the government for R&D in the business enterprise sector (2007)
Note: Values estimated by each country (in accordance with the survey for R&D tax
incentives by NESTI). Preliminary budget values are also included. Val-ues for U.S., France, Korea, Norway, U.K., Iceland, Denmark, Switzerland and Canada are from 2008; those for Australia are from 2006.
Source: OECD, “STI Outlook 2008”
0.0
0.5
1.0
1.5
2.0
2.5
3.0
1981 83 85 87 89 91 93 95 97 99 01 03 05 07
Ratio
of R
&D E
xpen
ditur
e ag
ainst
GDP
2008
%
EU-15EU-27
U.S.
Japan
Germany
France
China
Korea
U.K.
Year
R&D expenditure funded by the
government / GDPR&D expenditure
funded by the government / GDP
0.000.050.100.150.200.250.300.350.40
U.S.
Fran
ceKo
rea
Czec
h Rep
ublic
Spain
Swed
enAu
stria
Finla
ndNo
rway
Germ
any
U.K.
Icelan
dBe
lgium
Luxe
mbou
rgDe
nmar
kHu
ngar
yAu
strali
aIre
land
New
Zeala
nd Italy
Switz
erlan
dJa
pan
Nethe
rland
sCa
nada
%
Again
st GD
P
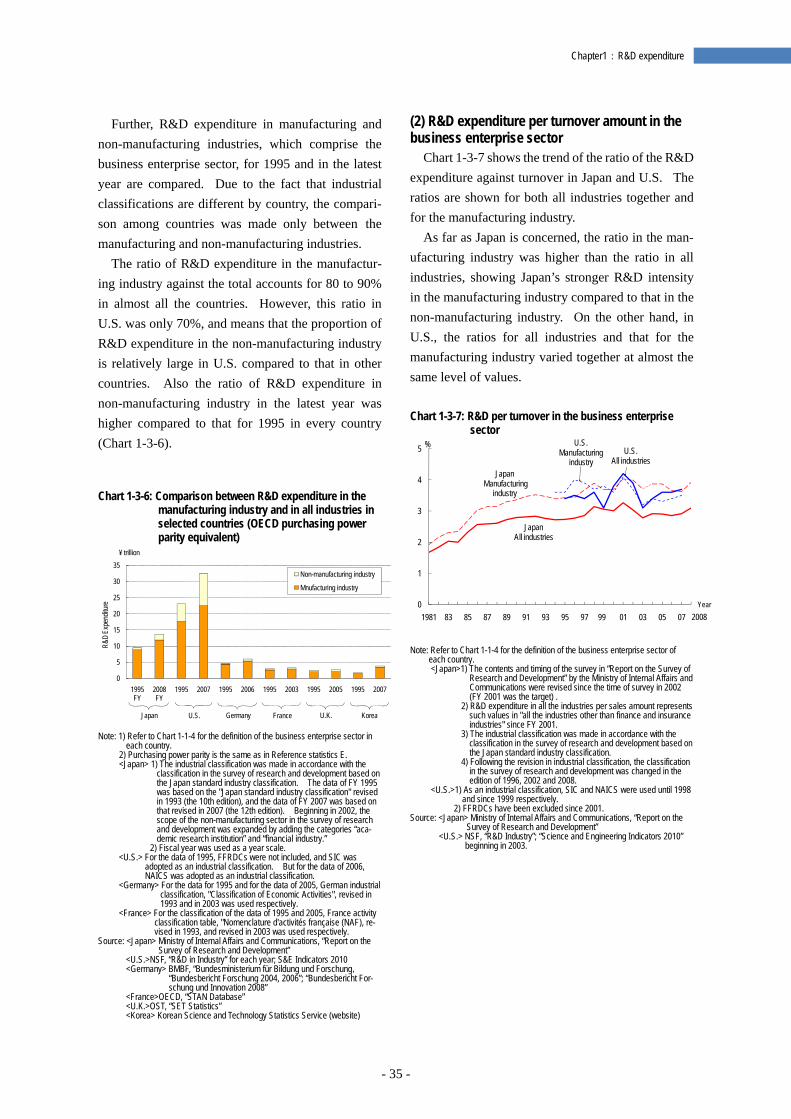
- 35 -
Chapter1:R&D expenditure
Further, R&D expenditure in manufacturing and non-manufacturing industries, which comprise the business enterprise sector, for 1995 and in the latest year are compared. Due to the fact that industrial classifications are different by country, the compari-son among countries was made only between the manufacturing and non-manufacturing industries.
The ratio of R&D expenditure in the manufactur-ing industry against the total accounts for 80 to 90% in almost all the countries. However, this ratio in U.S. was only 70%, and means that the proportion of R&D expenditure in the non-manufacturing industry is relatively large in U.S. compared to that in other countries. Also the ratio of R&D expenditure in non-manufacturing industry in the latest year was higher compared to that for 1995 in every country (Chart 1-3-6). Chart 1-3-6: Comparison between R&D expenditure in the
manufacturing industry and in all industries in selected countries (OECD purchasing power parity equivalent)
Note: 1) Refer to Chart 1-1-4 for the definition of the business enterprise sector in
each country. 2) Purchasing power parity is the same as in Reference statistics E. <Japan> 1) The industrial classification was made in accordance with the
classification in the survey of research and development based on the Japan standard industry classification. The data of FY 1995 was based on the "Japan standard industry classification" revised in 1993 (the 10th edition), and the data of FY 2007 was based on that revised in 2007 (the 12th edition). Beginning in 2002, the scope of the non-manufacturing sector in the survey of research and development was expanded by adding the categories “aca-demic research institution” and “financial industry.”
2) Fiscal year was used as a year scale. <U.S.> For the data of 1995, FFRDCs were not included, and SIC was
adopted as an industrial classification. But for the data of 2006, NAICS was adopted as an industrial classification.
<Germany> For the data for 1995 and for the data of 2005, German industrial classification, "Classification of Economic Activities", revised in 1993 and in 2003 was used respectively.
<France> For the classification of the data of 1995 and 2005, France activity classification table, "Nomenclature d'activités française (NAF), re-vised in 1993, and revised in 2003 was used respectively.
Source: <Japan> Ministry of Internal Affairs and Communications, “Report on the Survey of Research and Development”
<U.S.>NSF, “R&D in Industry” for each year; S&E Indicators 2010 <Germany> BMBF, “Bundesministerium für Bildung und Forschung,
“Bundesbericht Forschung 2004, 2006”; “Bundesbericht For-schung und Innovation 2008”
<France>OECD, “STAN Database” <U.K.>OST, “SET Statistics” <Korea> Korean Science and Technology Statistics Service (website)
(2) R&D expenditure per turnover amount in the business enterprise sector
Chart 1-3-7 shows the trend of the ratio of the R&D expenditure against turnover in Japan and U.S. The ratios are shown for both all industries together and for the manufacturing industry.
As far as Japan is concerned, the ratio in the man-ufacturing industry was higher than the ratio in all industries, showing Japan’s stronger R&D intensity in the manufacturing industry compared to that in the non-manufacturing industry. On the other hand, in U.S., the ratios for all industries and that for the manufacturing industry varied together at almost the same level of values. Chart 1-3-7: R&D per turnover in the business enterprise
sector
Note: Refer to Chart 1-1-4 for the definition of the business enterprise sector of
each country. <Japan>1) The contents and timing of the survey in “Report on the Survey of
Research and Development” by the Ministry of Internal Affairs and Communications were revised since the time of survey in 2002 (FY 2001 was the target) .
2) R&D expenditure in all the industries per sales amount represents such values in "all the industries other than finance and insurance industries" since FY 2001.
3) The industrial classification was made in accordance with the classification in the survey of research and development based on the Japan standard industry classification.
4) Following the revision in industrial classification, the classification in the survey of research and development was changed in the edition of 1996, 2002 and 2008.
<U.S.>1) As an industrial classification, SIC and NAICS were used until 1998 and since 1999 respectively.
2) FFRDCs have been excluded since 2001. Source: <Japan> Ministry of Internal Affairs and Communications, “Report on the
Survey of Research and Development” <U.S.> NSF, “R&D Industry”; “Science and Engineering Indicators 2010”
beginning in 2003.
0
5
10
15
20
25
30
35
1995FY
2008FY
1995 2007 1995 2006 1995 2003 1995 2005 1995 2007
R&D
Expe
nditu
re
Non-manufacturing industry
Mnufacturing industry
¥ trillion
Japan U.S. Germany France KoreaU.K.
JapanManufacturing
industry
Japan All industries
U.S. All industries
U.S. Manufacturing
industry
0
1
2
3
4
5
1981 83 85 87 89 91 93 95 97 99 01 03 05 07 2008
%
Year
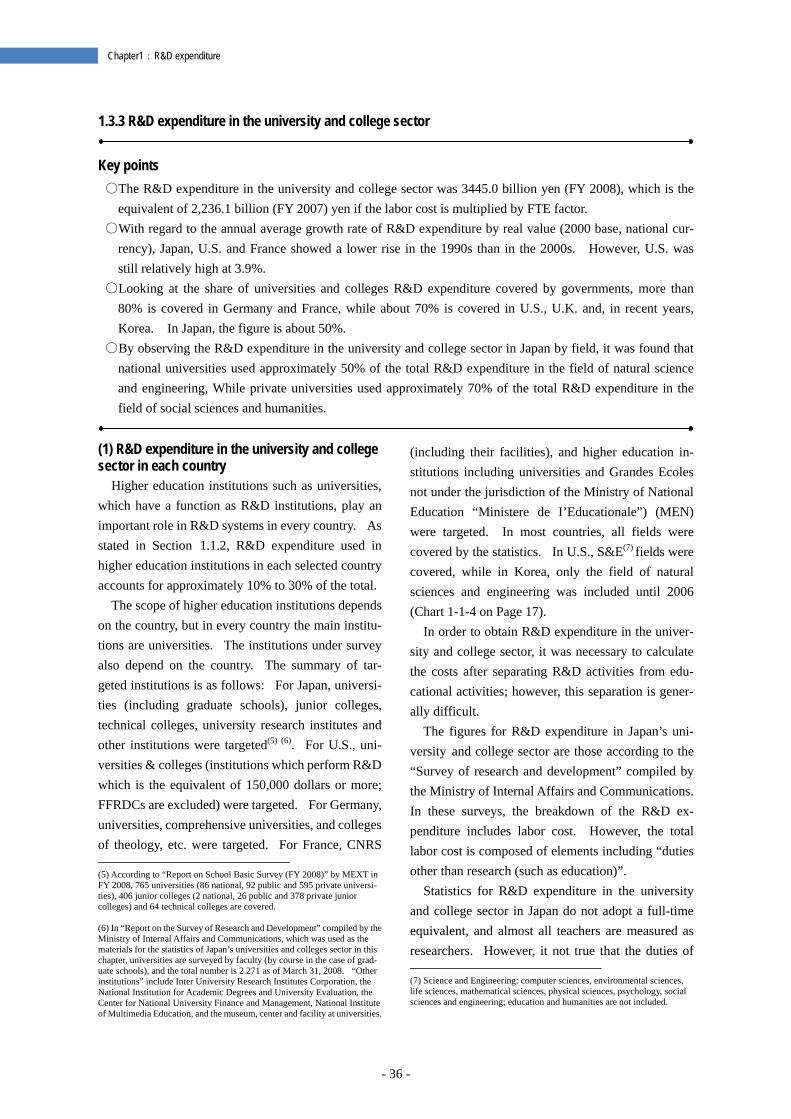
- 36 -
Chapter1:R&D expenditure
1.3.3 R&D expenditure in the university and college sector
Key points ○The R&D expenditure in the university and college sector was 3445.0 billion yen (FY 2008), which is the
equivalent of 2,236.1 billion (FY 2007) yen if the labor cost is multiplied by FTE factor. ○With regard to the annual average growth rate of R&D expenditure by real value (2000 base, national cur-
rency), Japan, U.S. and France showed a lower rise in the 1990s than in the 2000s. However, U.S. was still relatively high at 3.9%.
○Looking at the share of universities and colleges R&D expenditure covered by governments, more than 80% is covered in Germany and France, while about 70% is covered in U.S., U.K. and, in recent years, Korea. In Japan, the figure is about 50%.
○By observing the R&D expenditure in the university and college sector in Japan by field, it was found that national universities used approximately 50% of the total R&D expenditure in the field of natural science and engineering, While private universities used approximately 70% of the total R&D expenditure in the field of social sciences and humanities.
(1) R&D expenditure in the university and college sector in each country
Higher education institutions such as universities, which have a function as R&D institutions, play an important role in R&D systems in every country. As stated in Section 1.1.2, R&D expenditure used in higher education institutions in each selected country accounts for approximately 10% to 30% of the total.
The scope of higher education institutions depends on the country, but in every country the main institu-tions are universities. The institutions under survey also depend on the country. The summary of tar-geted institutions is as follows: For Japan, universi-ties (including graduate schools), junior colleges, technical colleges, university research institutes and other institutions were targeted(5) (6). For U.S., uni-versities & colleges (institutions which perform R&D which is the equivalent of 150,000 dollars or more; FFRDCs are excluded) were targeted. For Germany, universities, comprehensive universities, and colleges of theology, etc. were targeted. For France, CNRS (5) According to “Report on School Basic Survey (FY 2008)” by MEXT in FY 2008, 765 universities (86 national, 92 public and 595 private universi-ties), 406 junior colleges (2 national, 26 public and 378 private junior colleges) and 64 technical colleges are covered. (6) In “Report on the Survey of Research and Development” compiled by the Ministry of Internal Affairs and Communications, which was used as the materials for the statistics of Japan’s universities and colleges sector in this chapter, universities are surveyed by faculty (by course in the case of grad-uate schools), and the total number is 2.271 as of March 31, 2008. “Other institutions” include Inter University Research Institutes Corporation, the National Institution for Academic Degrees and University Evaluation, the Center for National University Finance and Management, National Institute of Multimedia Education, and the museum, center and facility at universities.
(including their facilities), and higher education in-stitutions including universities and Grandes Ecoles not under the jurisdiction of the Ministry of National Education “Ministere de I’Educationale”) (MEN) were targeted. In most countries, all fields were covered by the statistics. In U.S., S&E(7) fields were covered, while in Korea, only the field of natural sciences and engineering was included until 2006 (Chart 1-1-4 on Page 17).
In order to obtain R&D expenditure in the univer-sity and college sector, it was necessary to calculate the costs after separating R&D activities from edu-cational activities; however, this separation is gener-ally difficult.
The figures for R&D expenditure in Japan’s uni-versity and college sector are those according to the “Survey of research and development” compiled by the Ministry of Internal Affairs and Communications. In these surveys, the breakdown of the R&D ex-penditure includes labor cost. However, the total labor cost is composed of elements including “duties other than research (such as education)”.
Statistics for R&D expenditure in the university and college sector in Japan do not adopt a full-time equivalent, and almost all teachers are measured as researchers. However, it not true that the duties of (7) Science and Engineering: computer sciences, environmental sciences, life sciences, mathematical sciences, physical sciences, psychology, social sciences and engineering; education and humanities are not included.
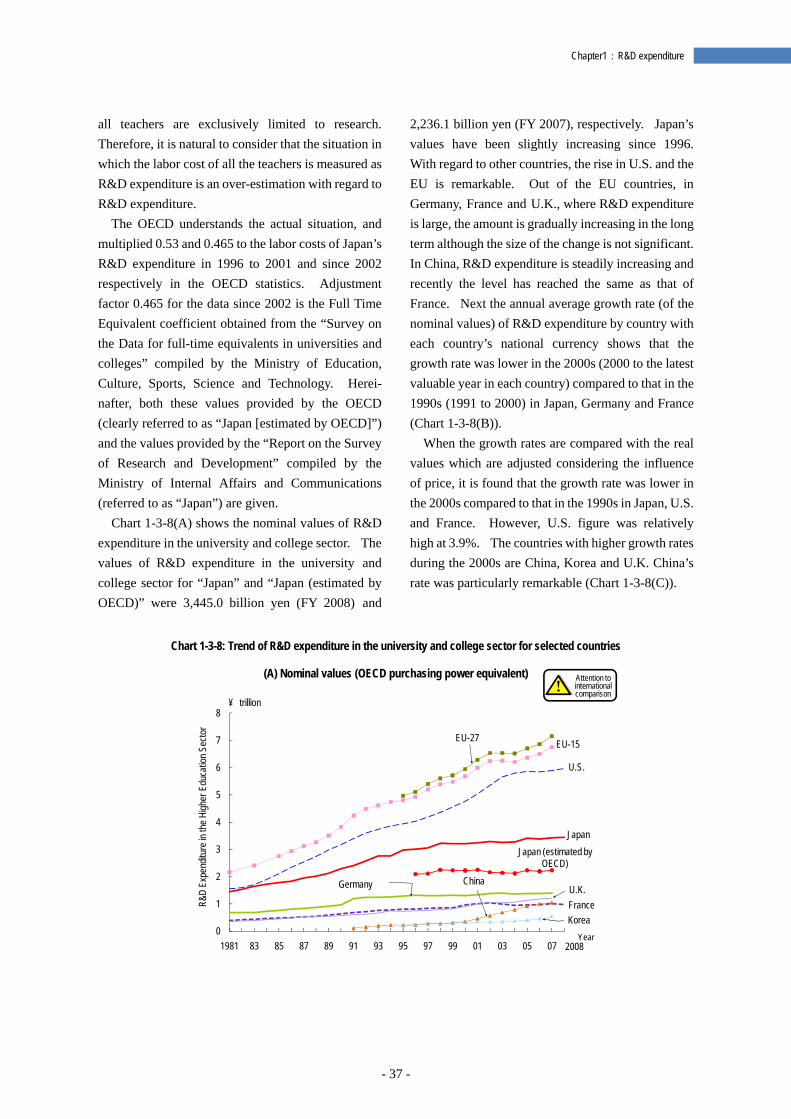
- 37 -
Chapter1:R&D expenditure
all teachers are exclusively limited to research. Therefore, it is natural to consider that the situation in which the labor cost of all the teachers is measured as R&D expenditure is an over-estimation with regard to R&D expenditure.
The OECD understands the actual situation, and multiplied 0.53 and 0.465 to the labor costs of Japan’s R&D expenditure in 1996 to 2001 and since 2002 respectively in the OECD statistics. Adjustment factor 0.465 for the data since 2002 is the Full Time Equivalent coefficient obtained from the “Survey on the Data for full-time equivalents in universities and colleges” compiled by the Ministry of Education, Culture, Sports, Science and Technology. Herei-nafter, both these values provided by the OECD (clearly referred to as “Japan [estimated by OECD]”) and the values provided by the “Report on the Survey of Research and Development” compiled by the Ministry of Internal Affairs and Communications (referred to as “Japan”) are given.
Chart 1-3-8(A) shows the nominal values of R&D expenditure in the university and college sector. The values of R&D expenditure in the university and college sector for “Japan” and “Japan (estimated by OECD)” were 3,445.0 billion yen (FY 2008) and
2,236.1 billion yen (FY 2007), respectively. Japan’s values have been slightly increasing since 1996. With regard to other countries, the rise in U.S. and the EU is remarkable. Out of the EU countries, in Germany, France and U.K., where R&D expenditure is large, the amount is gradually increasing in the long term although the size of the change is not significant. In China, R&D expenditure is steadily increasing and recently the level has reached the same as that of France. Next the annual average growth rate (of the nominal values) of R&D expenditure by country with each country’s national currency shows that the growth rate was lower in the 2000s (2000 to the latest valuable year in each country) compared to that in the 1990s (1991 to 2000) in Japan, Germany and France (Chart 1-3-8(B)).
When the growth rates are compared with the real values which are adjusted considering the influence of price, it is found that the growth rate was lower in the 2000s compared to that in the 1990s in Japan, U.S. and France. However, U.S. figure was relatively high at 3.9%. The countries with higher growth rates during the 2000s are China, Korea and U.K. China’s rate was particularly remarkable (Chart 1-3-8(C)).
Chart 1-3-8: Trend of R&D expenditure in the university and college sector for selected countries
(A) Nominal values (OECD purchasing power equivalent)
Japan (estimated by OECD)
0
1
2
3
4
5
6
7
8
1981 83 85 87 89 91 93 95 97 99 01 03 05 07
R&D
Expe
nditu
re in
the H
igher
Edu
catio
n Sec
tor
¥ trillion
EU-15EU-27
Germany
Korea
2008
China
U.S.
France
Japan
U.K.
Year
Attention to international comparison
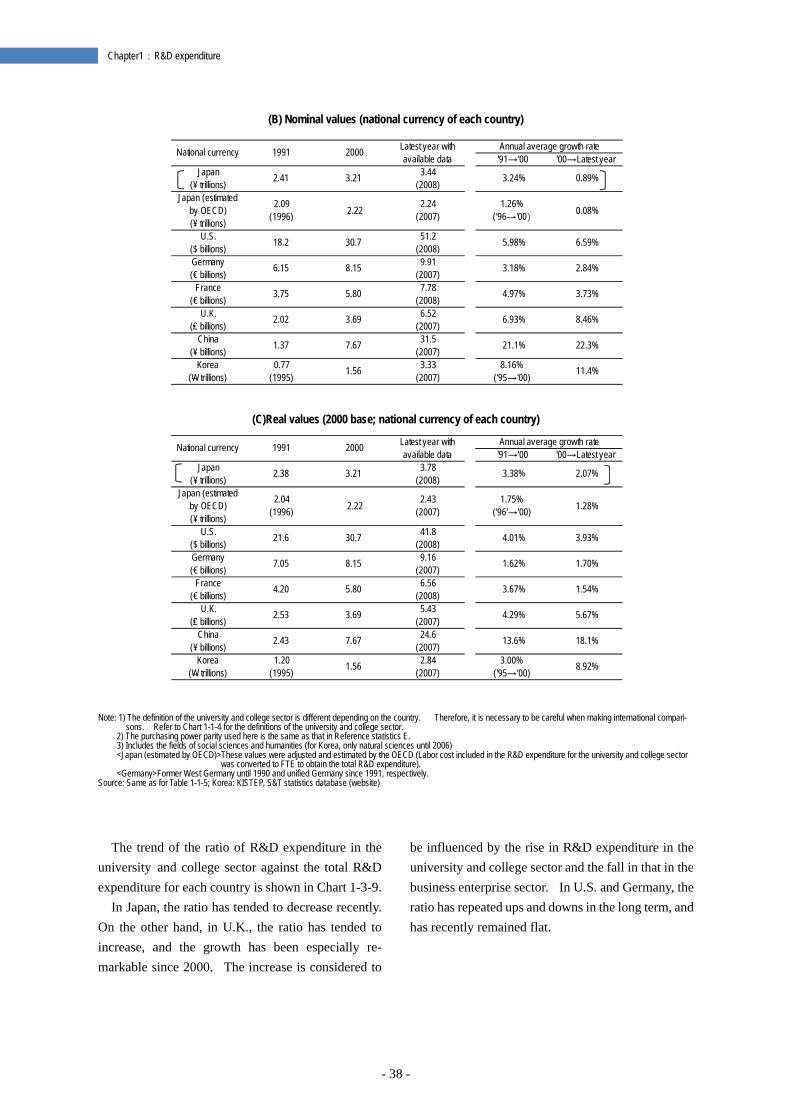
- 38 -
Chapter1:R&D expenditure
(B) Nominal values (national currency of each country)
(C)Real values (2000 base; national currency of each country)
Note: 1) The definition of the university and college sector is different depending on the country. Therefore, it is necessary to be careful when making international compari-
sons. Refer to Chart 1-1-4 for the definitions of the university and college sector. 2) The purchasing power parity used here is the same as that in Reference statistics E. 3) Includes the fields of social sciences and humanities (for Korea, only natural sciences until 2006) <Japan (estimated by OECD)>These values were adjusted and estimated by the OECD (Labor cost included in the R&D expenditure for the university and college sector
was converted to FTE to obtain the total R&D expenditure). <Germany>Former West Germany until 1990 and unified Germany since 1991, respectively.
Source: Same as for Table 1-1-5; Korea: KISTEP, S&T statistics database (website)
The trend of the ratio of R&D expenditure in the university and college sector against the total R&D expenditure for each country is shown in Chart 1-3-9.
In Japan, the ratio has tended to decrease recently. On the other hand, in U.K., the ratio has tended to increase, and the growth has been especially re-markable since 2000. The increase is considered to
be influenced by the rise in R&D expenditure in the university and college sector and the fall in that in the business enterprise sector. In U.S. and Germany, the ratio has repeated ups and downs in the long term, and has recently remained flat.
Annual average growth rate'91→'00 '00→Latest year
Japan (¥ trillions)
2.41 3.21 3.44(2008)
3.24% 0.89%
Japan (estimated by OECD) (¥ trillions)
2.09(1996) 2.22 2.24
(2007)1.26%
('96→'00)0.08%
U.S.($ billions) 18.2 30.7 51.2
(2008) 5.98% 6.59%
Germany(€ billions) 6.15 8.15 9.91
(2007) 3.18% 2.84%
France(€ billions) 3.75 5.80 7.78
(2008) 4.97% 3.73%
U.K.(₤ billions)
2.02 3.69 6.52(2007)
6.93% 8.46%
China (¥ billions) 1.37 7.67 31.5
(2007) 21.1% 22.3%
Korea(W trillions)
0.77(1995) 1.56 3.33
(2007)8.16%
('95→'00) 11.4%
National currency 1991 2000 Latest year with available data
Annual average growth rate'91→'00 '00→Latest year
Japan(¥ trillions)
2.38 3.21 3.78(2008)
3.38% 2.07%
Japan (estimatedby OECD)(¥ trillions)
2.04(1996) 2.22 2.43
(2007)1.75%
('96'→'00) 1.28%
U.S.($ billions) 21.6 30.7 41.8
(2008) 4.01% 3.93%
Germany(€ billions) 7.05 8.15 9.16
(2007) 1.62% 1.70%
France(€ billions) 4.20 5.80 6.56
(2008) 3.67% 1.54%
U.K.(₤ billions)
2.53 3.69 5.43(2007)
4.29% 5.67%
China(¥ billions) 2.43 7.67 24.6
(2007) 13.6% 18.1%
Korea(W trillions)
1.20(1995) 1.56 2.84
(2007)3.00%
('95→'00) 8.92%
National currency 1991 2000 Latest year withavailable data
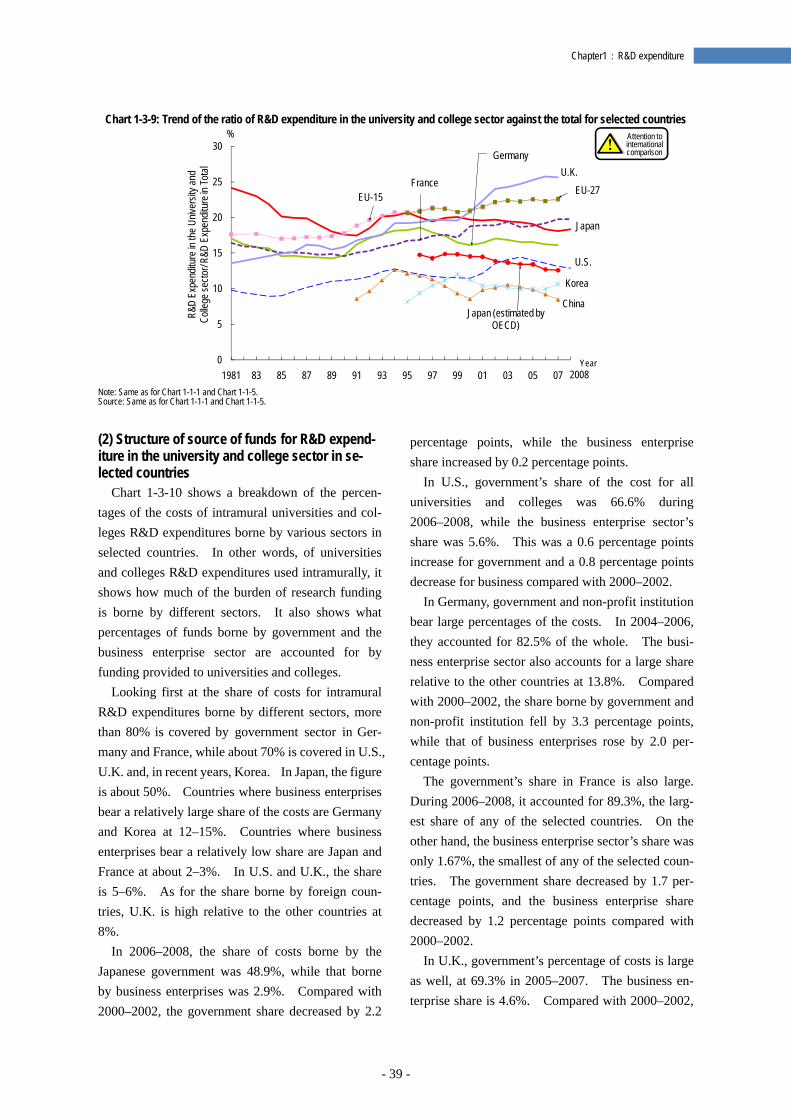
- 39 -
Chapter1:R&D expenditure
Chart 1-3-9: Trend of the ratio of R&D expenditure in the university and college sector against the total for selected countries
Note: Same as for Chart 1-1-1 and Chart 1-1-5. Source: Same as for Chart 1-1-1 and Chart 1-1-5.
(2) Structure of source of funds for R&D expend-iture in the university and college sector in se-lected countries
Chart 1-3-10 shows a breakdown of the percen-tages of the costs of intramural universities and col-leges R&D expenditures borne by various sectors in selected countries. In other words, of universities and colleges R&D expenditures used intramurally, it shows how much of the burden of research funding is borne by different sectors. It also shows what percentages of funds borne by government and the business enterprise sector are accounted for by funding provided to universities and colleges.
Looking first at the share of costs for intramural R&D expenditures borne by different sectors, more than 80% is covered by government sector in Ger-many and France, while about 70% is covered in U.S., U.K. and, in recent years, Korea. In Japan, the figure is about 50%. Countries where business enterprises bear a relatively large share of the costs are Germany and Korea at 12–15%. Countries where business enterprises bear a relatively low share are Japan and France at about 2–3%. In U.S. and U.K., the share is 5–6%. As for the share borne by foreign coun-tries, U.K. is high relative to the other countries at 8%.
In 2006–2008, the share of costs borne by the Japanese government was 48.9%, while that borne by business enterprises was 2.9%. Compared with 2000–2002, the government share decreased by 2.2
percentage points, while the business enterprise share increased by 0.2 percentage points.
In U.S., government’s share of the cost for all universities and colleges was 66.6% during 2006–2008, while the business enterprise sector’s share was 5.6%. This was a 0.6 percentage points increase for government and a 0.8 percentage points decrease for business compared with 2000–2002.
In Germany, government and non-profit institution bear large percentages of the costs. In 2004–2006, they accounted for 82.5% of the whole. The busi-ness enterprise sector also accounts for a large share relative to the other countries at 13.8%. Compared with 2000–2002, the share borne by government and non-profit institution fell by 3.3 percentage points, while that of business enterprises rose by 2.0 per-centage points.
The government’s share in France is also large. During 2006–2008, it accounted for 89.3%, the larg-est share of any of the selected countries. On the other hand, the business enterprise sector’s share was only 1.67%, the smallest of any of the selected coun-tries. The government share decreased by 1.7 per-centage points, and the business enterprise share decreased by 1.2 percentage points compared with 2000–2002.
In U.K., government’s percentage of costs is large as well, at 69.3% in 2005–2007. The business en-terprise share is 4.6%. Compared with 2000–2002,
Japan (estimated by OECD)
0
5
10
15
20
25
30
1981 83 85 87 89 91 93 95 97 99 01 03 05 07
R&D
Expe
nditu
re in
the U
niver
sity a
nd
Colle
ge se
ctor/
R&D
Expe
nditu
re in
Tota
l
2008
U.K.France
U.S.
%
EU-27
China
Korea
EU-15
Germany
Japan
Year
Attention to international comparison
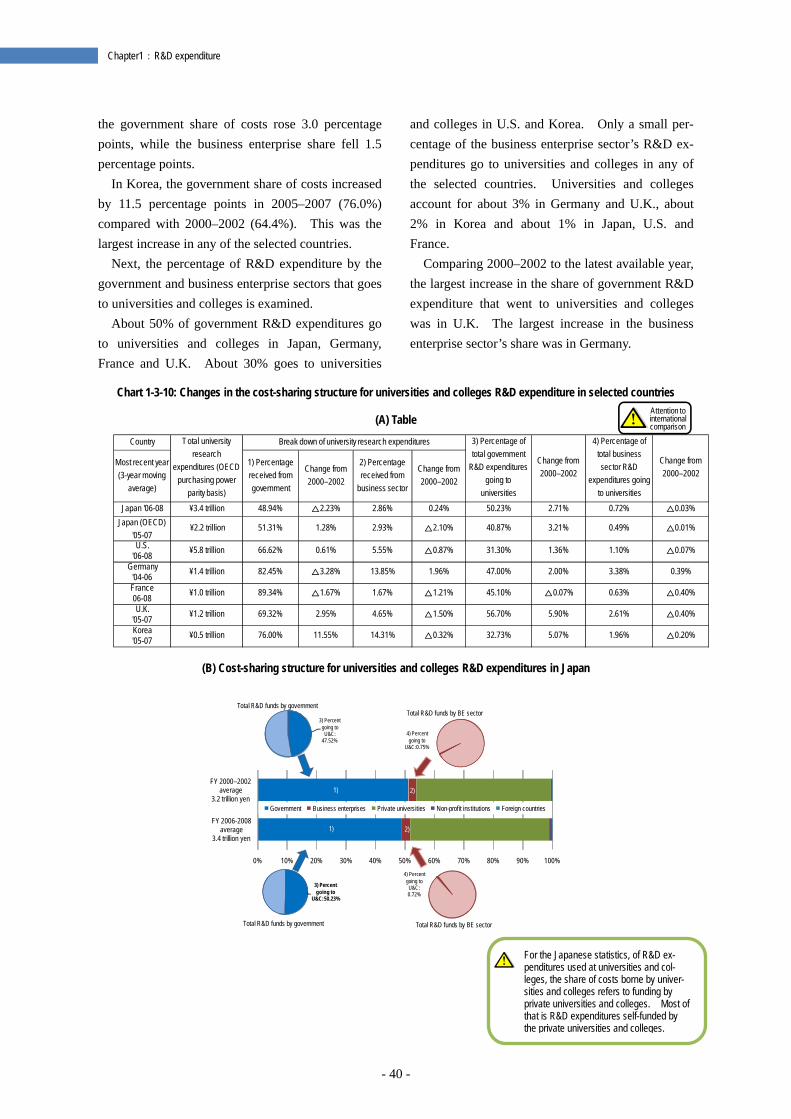
- 40 -
Chapter1:R&D expenditure
the government share of costs rose 3.0 percentage points, while the business enterprise share fell 1.5 percentage points.
In Korea, the government share of costs increased by 11.5 percentage points in 2005–2007 (76.0%) compared with 2000–2002 (64.4%). This was the largest increase in any of the selected countries.
Next, the percentage of R&D expenditure by the government and business enterprise sectors that goes to universities and colleges is examined.
About 50% of government R&D expenditures go to universities and colleges in Japan, Germany, France and U.K. About 30% goes to universities
and colleges in U.S. and Korea. Only a small per-centage of the business enterprise sector’s R&D ex-penditures go to universities and colleges in any of the selected countries. Universities and colleges account for about 3% in Germany and U.K., about 2% in Korea and about 1% in Japan, U.S. and France.
Comparing 2000–2002 to the latest available year, the largest increase in the share of government R&D expenditure that went to universities and colleges was in U.K. The largest increase in the business enterprise sector’s share was in Germany.
Chart 1-3-10: Changes in the cost-sharing structure for universities and colleges R&D expenditure in selected countries
(A) Table
(B) Cost-sharing structure for universities and colleges R&D expenditures in Japan
Country Break down of university research expenditures
Most recent year(3-year moving
average)
1) Percentagereceived fromgovernment
Change from2000–2002
2) Percentagereceived from
business sector
Change from2000–2002
Japan '06-08 ¥3.4 trillion 48.94% △2.23% 2.86% 0.24% 50.23% 2.71% 0.72% △0.03%Japan (OECD)
'05-07 ¥2.2 trillion 51.31% 1.28% 2.93% △2.10% 40.87% 3.21% 0.49% △0.01%
U.S.'06-08
Germany'04-06France06-08U.K.
'05-07Korea'05-07 76.00% 11.55%
4.65%
△0.32% 32.73%14.31%
△1.50%
△0.20%
3) Percentage oftotal government
R&D expendituresgoing to
universities
Change from2000–2002
4) Percentage oftotal businesssector R&D
expenditures goingto universities
Change from2000–2002
56.70% 5.90% 2.61% △0.40%
0.39%
△0.40%
31.30% 1.36% 1.10%
47.00% 2.00% 3.38%
45.10% △0.07% 0.63%
5.07% 1.96%¥0.5 trillion
△0.07%
¥1.2 trillion 69.32% 2.95%
¥1.4 trillion 82.45% △3.28% 13.85% 1.96%
¥1.0 trillion 89.34% △1.67% 1.67% △1.21%
△0.87%
Total universityresearch
expenditures (OECDpurchasing power
parity basis)
¥5.8 trillion 66.62% 0.61% 5.55%
For the Japanese statistics, of R&D ex-penditures used at universities and col-leges, the share of costs borne by univer-sities and colleges refers to funding by private universities and colleges. Most of that is R&D expenditures self-funded by the private universities and colleges.
Attention to international comparison
0% 10% 20% 30% 40% 50% 60% 70% 80% 90% 100%
FY 2006-2008average
3.4 trillion yen
FY 2000–2002 average
3.2 trillion yenGovernment Business enterprises Private universities Non-profit institutions Foreign countries
3) Percent going to
U&C: 47.52%
Total R&D funds by government
3) Percent going to
U&C:50.23%
Total R&D funds by government
4) Percent going to
U&C:0.75%
Total R&D funds by BE sector
4) Percent going to
U&C: 0.72%
Total R&D funds by BE sector
2)1)
1) 2)
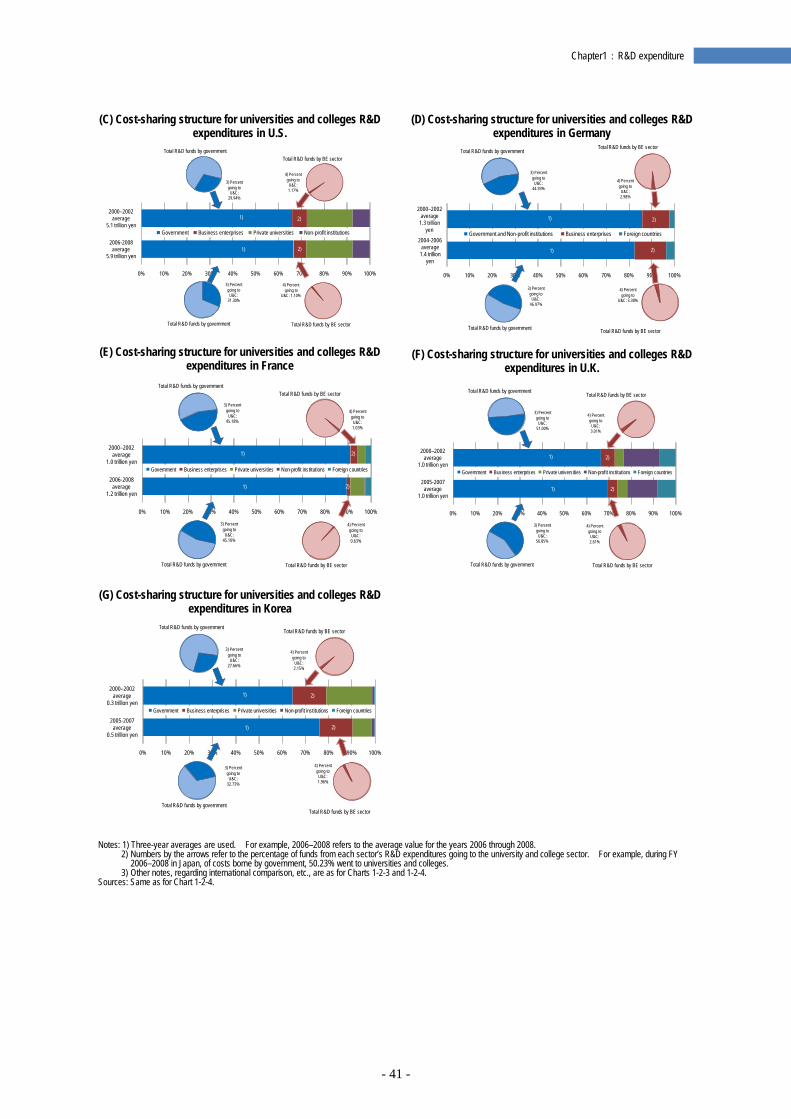
- 41 -
Chapter1:R&D expenditure
(C) Cost-sharing structure for universities and colleges R&D expenditures in U.S.
(E) Cost-sharing structure for universities and colleges R&D
expenditures in France
(G) Cost-sharing structure for universities and colleges R&D
expenditures in Korea
(D) Cost-sharing structure for universities and colleges R&D expenditures in Germany
(F) Cost-sharing structure for universities and colleges R&D
expenditures in U.K.
Notes: 1) Three-year averages are used. For example, 2006–2008 refers to the average value for the years 2006 through 2008. 2) Numbers by the arrows refer to the percentage of funds from each sector’s R&D expenditures going to the university and college sector. For example, during FY
2006–2008 in Japan, of costs borne by government, 50.23% went to universities and colleges. 3) Other notes, regarding international comparison, etc., are as for Charts 1-2-3 and 1-2-4.
Sources: Same as for Chart 1-2-4.
0% 10% 20% 30% 40% 50% 60% 70% 80% 90% 100%
2006-2008average
5.9 trillion yen
2000–2002 average
5.1 trillion yenGovernment Business enterprises Private universities Non-profit institutions
2)
2)
1)
1)
3) Percent going to
U&C: 29.94%
Total R&D funds by government
3) Percent going to
U&C: 31.30%
Total R&D funds by government
4) Percent going to
U&C: 1.17%
Total R&D funds by BE sector
4) Percent going to
U&C: 1.10%
Total R&D funds by BE sector
0% 10% 20% 30% 40% 50% 60% 70% 80% 90% 100%
2006-2008average
1.2 trillion yen
2000–2002 average
1.0 trillion yenGovernment Business enterprises Private universities Non-profit institutions Foreign countries
2)
2)
1)
1)
3) Percent going to
U&C: 45.18%
Total R&D funds by government
3) Percent going to U&C:
45.10%
Total R&D funds by government
4) Percent going to
U&C: 1.03%
Total R&D funds by BE sector
4) Percent going to
U&C: 0.63%
Total R&D funds by BE sector
0% 10% 20% 30% 40% 50% 60% 70% 80% 90% 100%
2005-2007average
0.5 trillion yen
2000–2002 average
0.3 trillion yenGovernment Business enterprises Private universities Non-profit institutions Foreign countries
2)
2)
1)
1)
3) Percent going to U&C:
27.66%
Total R&D funds by government
3) Percent going to U&C:
32.73%
Total R&D funds by government
4) Percent going to
U&C: 2.15%
Total R&D funds by BE sector
4) Percent going to U&C:1.96%
Total R&D funds by BE sector
0% 10% 20% 30% 40% 50% 60% 70% 80% 90% 100%
2004-2006average
1.4 trillion yen
2000–2002 average
1.3 trillion yen Government and Non-profit institutions Business enterprises Foreign countries
2)
2)
1)
1)
3) Percent going to
U&C: 44.93%
Total R&D funds by government
3) Percent going to
U&C: 46.97%
Total R&D funds by government
4) Percent going to
U&C: 2.98%
Total R&D funds by BE sector
4) Percent going to
U&C: 3.38%
Total R&D funds by BE sector
0% 10% 20% 30% 40% 50% 60% 70% 80% 90% 100%
2005-2007average
1.0 trillion yen
2000–2002 average
1.0 trillion yenGovernment Business enterprises Private universities Non-profit institutions Foreign countries
2)
2)
1)
1)
3) Percent going to
U&C: 51.00%
Total R&D funds by government
3) Percent going to
U&C: 56.85%
Total R&D funds by government
4) Percent going to
U&C: 3.01%
Total R&D funds by BE sector
4) Percent going to
U&C: 2.61%
Total R&D funds by BE sector
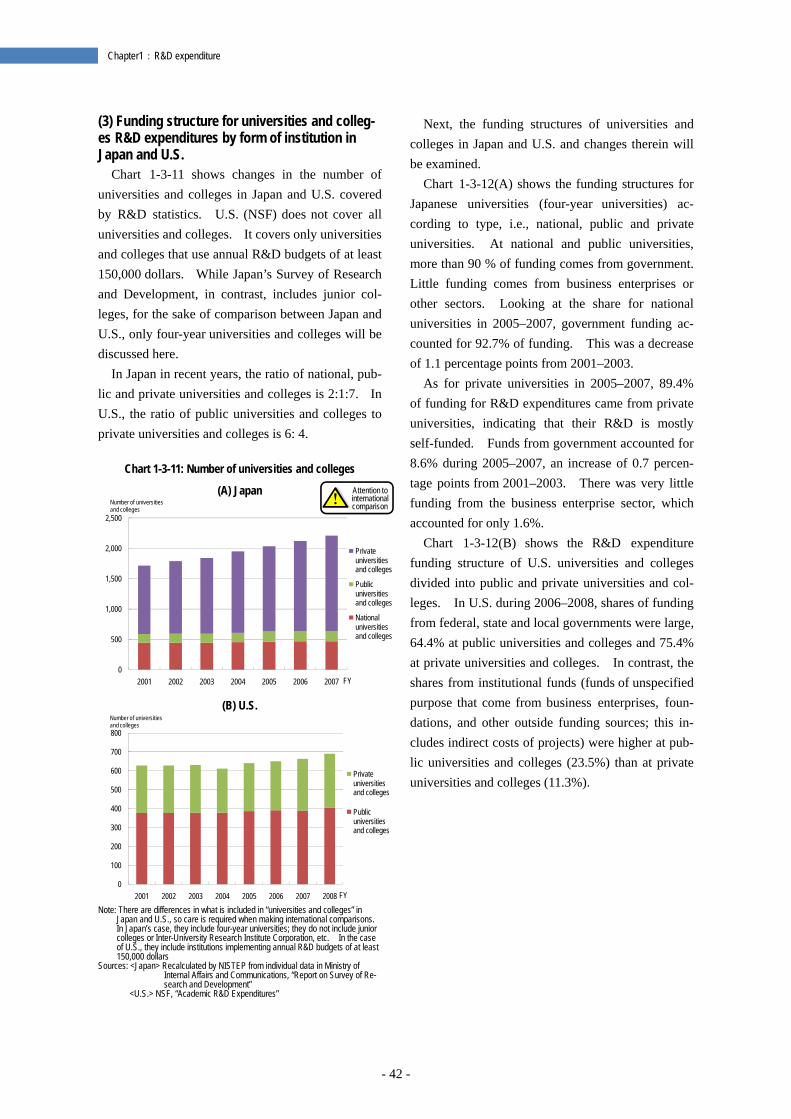
- 42 -
Chapter1:R&D expenditure
(3) Funding structure for universities and colleg-es R&D expenditures by form of institution in Japan and U.S.
Chart 1-3-11 shows changes in the number of universities and colleges in Japan and U.S. covered by R&D statistics. U.S. (NSF) does not cover all universities and colleges. It covers only universities and colleges that use annual R&D budgets of at least 150,000 dollars. While Japan’s Survey of Research and Development, in contrast, includes junior col-leges, for the sake of comparison between Japan and U.S., only four-year universities and colleges will be discussed here.
In Japan in recent years, the ratio of national, pub-lic and private universities and colleges is 2:1:7. In U.S., the ratio of public universities and colleges to private universities and colleges is 6: 4.
Chart 1-3-11: Number of universities and colleges
(A) Japan
(B) U.S.
Note: There are differences in what is included in “universities and colleges” in
Japan and U.S., so care is required when making international comparisons. In Japan’s case, they include four-year universities; they do not include junior colleges or Inter-University Research Institute Corporation, etc. In the case of U.S., they include institutions implementing annual R&D budgets of at least 150,000 dollars
Sources: <Japan> Recalculated by NISTEP from individual data in Ministry of Internal Affairs and Communications, “Report on Survey of Re-search and Development”
<U.S.> NSF, “Academic R&D Expenditures”
Next, the funding structures of universities and colleges in Japan and U.S. and changes therein will be examined.
Chart 1-3-12(A) shows the funding structures for Japanese universities (four-year universities) ac-cording to type, i.e., national, public and private universities. At national and public universities, more than 90 % of funding comes from government. Little funding comes from business enterprises or other sectors. Looking at the share for national universities in 2005–2007, government funding ac-counted for 92.7% of funding. This was a decrease of 1.1 percentage points from 2001–2003.
As for private universities in 2005–2007, 89.4% of funding for R&D expenditures came from private universities, indicating that their R&D is mostly self-funded. Funds from government accounted for 8.6% during 2005–2007, an increase of 0.7 percen-tage points from 2001–2003. There was very little funding from the business enterprise sector, which accounted for only 1.6%.
Chart 1-3-12(B) shows the R&D expenditure funding structure of U.S. universities and colleges divided into public and private universities and col-leges. In U.S. during 2006–2008, shares of funding from federal, state and local governments were large, 64.4% at public universities and colleges and 75.4% at private universities and colleges. In contrast, the shares from institutional funds (funds of unspecified purpose that come from business enterprises, foun-dations, and other outside funding sources; this in-cludes indirect costs of projects) were higher at pub-lic universities and colleges (23.5%) than at private universities and colleges (11.3%).
0
500
1,000
1,500
2,000
2,500
2001 2002 2003 2004 2005 2006 2007
Number of universities and colleges
FY
Private universities and colleges
Public universities and colleges
National universities and colleges
0
100
200
300
400
500
600
700
800
2001 2002 2003 2004 2005 2006 2007 2008
Number of universities and colleges
FY
Private universities and colleges
Public universities and colleges
Attention to international comparison
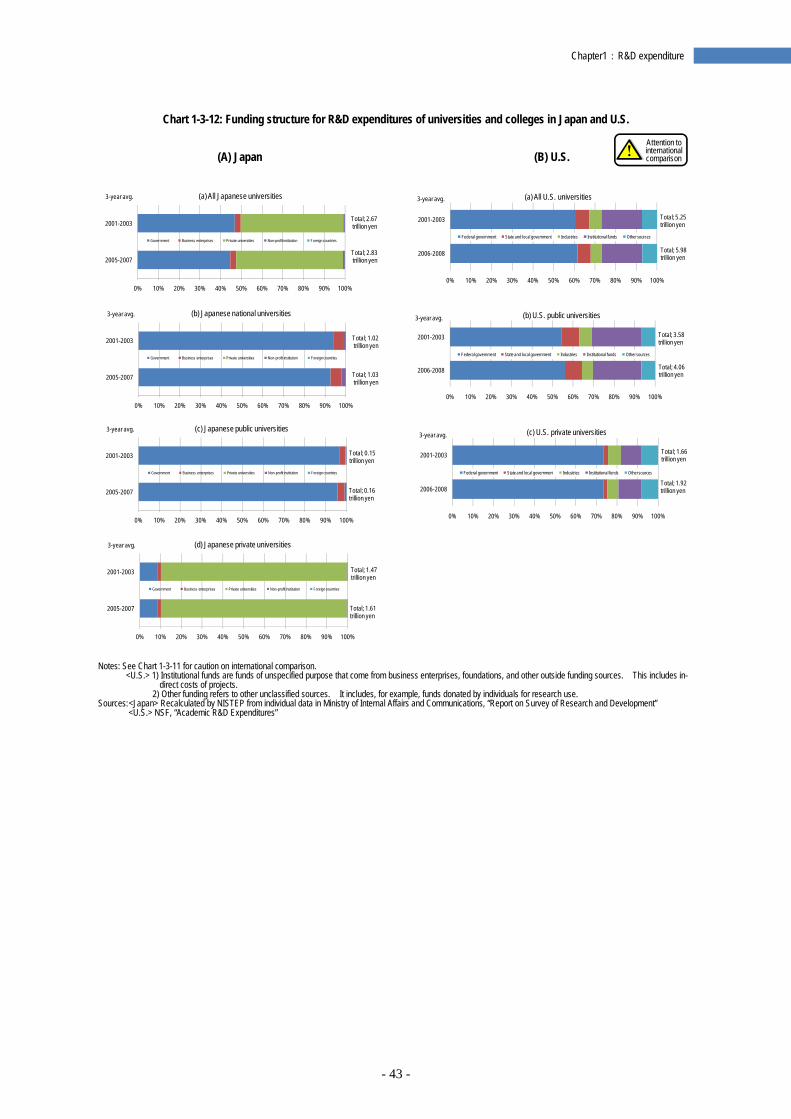
- 43 -
Chapter1:R&D expenditure
Chart 1-3-12: Funding structure for R&D expenditures of universities and colleges in Japan and U.S.
(A) Japan
(B) U.S.
Notes: See Chart 1-3-11 for caution on international comparison.
<U.S.> 1) Institutional funds are funds of unspecified purpose that come from business enterprises, foundations, and other outside funding sources. This includes in-direct costs of projects.
2) Other funding refers to other unclassified sources. It includes, for example, funds donated by individuals for research use. Sources: <Japan> Recalculated by NISTEP from individual data in Ministry of Internal Affairs and Communications, “Report on Survey of Research and Development”
<U.S.> NSF, “Academic R&D Expenditures”
0% 10% 20% 30% 40% 50% 60% 70% 80% 90% 100%
2005-2007
2001-2003
3-year avg. (b) Japanese national universities
Government Business enterprises Private universities Non-profit institution Foreign countries
Total; 1.02 trillion yen
Total; 1.03 trillion yen
0% 10% 20% 30% 40% 50% 60% 70% 80% 90% 100%
2005-2007
2001-2003
3-year avg. (c) Japanese public universities
Government Business enterprises Private universities Non-profit institution Foreign countries
Total; 0.15 trillion yen
Total; 0.16 trillion yen
0% 10% 20% 30% 40% 50% 60% 70% 80% 90% 100%
2005-2007
2001-2003
3-year avg. (d) Japanese private universities
Government Business enterprises Private universities Non-profit institution Foreign countries
Total; 1.47 trillion yen
Total; 1.61 trillion yen
0% 10% 20% 30% 40% 50% 60% 70% 80% 90% 100%
2005-2007
2001-2003
3-year avg. (a) All Japanese universities
Government Business enterprises Private universities Non-profit institution Foreign countries
Total; 2.67 trillion yen
Total; 2.83 trillion yen
0% 10% 20% 30% 40% 50% 60% 70% 80% 90% 100%
2006-2008
2001-2003
3-year avg. (c) U.S. private universities
Federal government State and local government Industries Institutional funds Other sources
Total; 1.66 trillion yen
Total; 1.92 trillion yen
0% 10% 20% 30% 40% 50% 60% 70% 80% 90% 100%
2006-2008
2001-2003
3-year avg. (b) U.S. public universities
Federal government State and local government Industries Institutional funds Other sources
Total; 3.58 trillion yen
Total; 4.06 trillion yen
0% 10% 20% 30% 40% 50% 60% 70% 80% 90% 100%
2006-2008
2001-2003
3-year avg. (a) All U.S. universities
Federal government State and local government Industries Institutional funds Other sources
Total; 5.25 trillion yen
Total; 5.98 trillion yen
Attention to international comparison
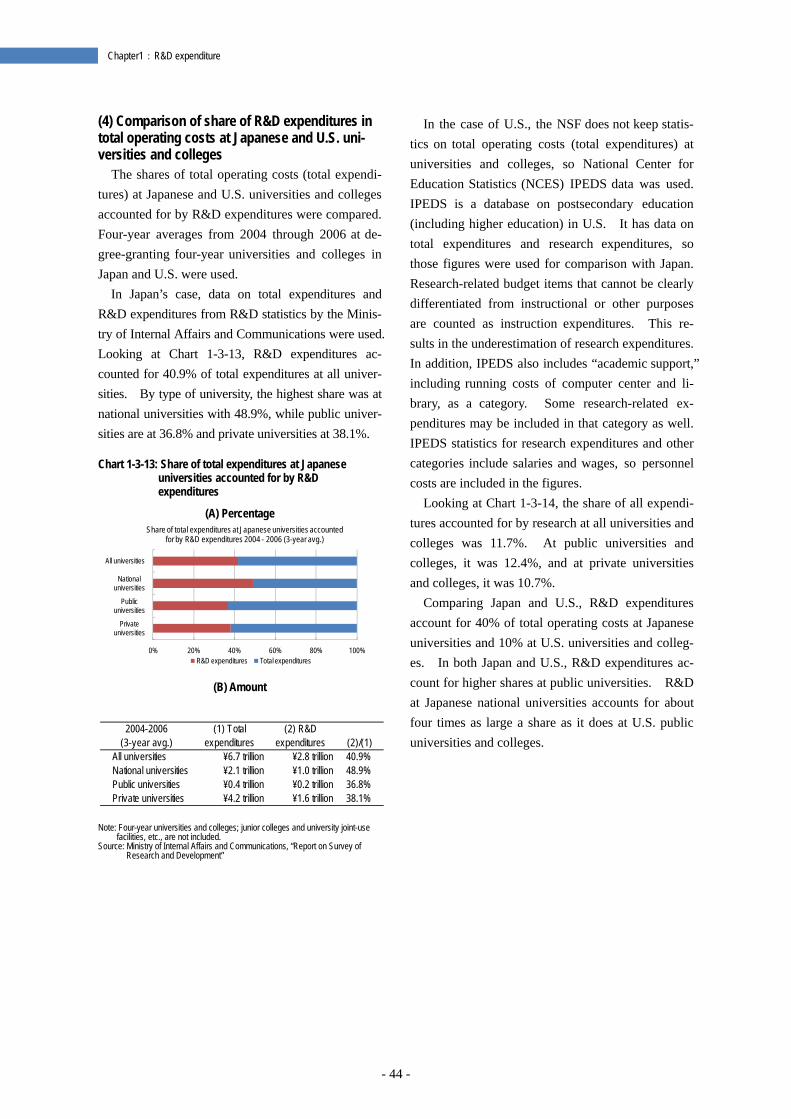
- 44 -
Chapter1:R&D expenditure
(4) Comparison of share of R&D expenditures in total operating costs at Japanese and U.S. uni-versities and colleges
The shares of total operating costs (total expendi-tures) at Japanese and U.S. universities and colleges accounted for by R&D expenditures were compared. Four-year averages from 2004 through 2006 at de-gree-granting four-year universities and colleges in Japan and U.S. were used.
In Japan’s case, data on total expenditures and R&D expenditures from R&D statistics by the Minis-try of Internal Affairs and Communications were used. Looking at Chart 1-3-13, R&D expenditures ac-counted for 40.9% of total expenditures at all univer-sities. By type of university, the highest share was at national universities with 48.9%, while public univer-sities are at 36.8% and private universities at 38.1%.
Chart 1-3-13: Share of total expenditures at Japanese
universities accounted for by R&D expenditures
(A) Percentage
(B) Amount
Note: Four-year universities and colleges; junior colleges and university joint-use
facilities, etc., are not included. Source: Ministry of Internal Affairs and Communications, “Report on Survey of
Research and Development”
In the case of U.S., the NSF does not keep statis-tics on total operating costs (total expenditures) at universities and colleges, so National Center for Education Statistics (NCES) IPEDS data was used. IPEDS is a database on postsecondary education (including higher education) in U.S. It has data on total expenditures and research expenditures, so those figures were used for comparison with Japan. Research-related budget items that cannot be clearly differentiated from instructional or other purposes are counted as instruction expenditures. This re-sults in the underestimation of research expenditures. In addition, IPEDS also includes “academic support,” including running costs of computer center and li-brary, as a category. Some research-related ex-penditures may be included in that category as well. IPEDS statistics for research expenditures and other categories include salaries and wages, so personnel costs are included in the figures.
Looking at Chart 1-3-14, the share of all expendi-tures accounted for by research at all universities and colleges was 11.7%. At public universities and colleges, it was 12.4%, and at private universities and colleges, it was 10.7%.
Comparing Japan and U.S., R&D expenditures account for 40% of total operating costs at Japanese universities and 10% at U.S. universities and colleg-es. In both Japan and U.S., R&D expenditures ac-count for higher shares at public universities. R&D at Japanese national universities accounts for about four times as large a share as it does at U.S. public universities and colleges.
0% 20% 40% 60% 80% 100%
Private universities
Public universities
National universities
All universities
R&D expenditures Total expenditures
Share of total expenditures at Japanese universities accounted for by R&D expenditures 2004 - 2006 (3-year avg.)
2004-2006(3-year avg.)
(1) Totalexpenditures
(2) R&Dexpenditures (2)/(1)
All universities ¥6.7 trillion ¥2.8 trillion 40.9%National universities ¥2.1 trillion ¥1.0 trillion 48.9%Public universities ¥0.4 trillion ¥0.2 trillion 36.8%Private universities ¥4.2 trillion ¥1.6 trillion 38.1%
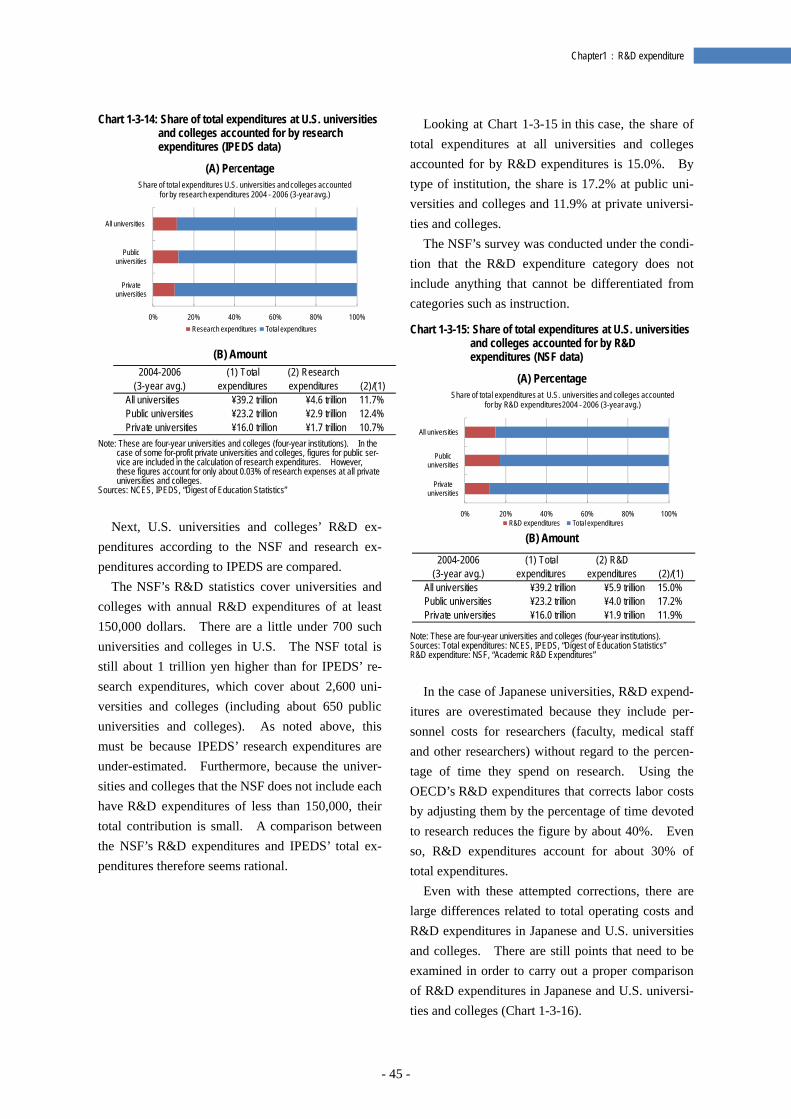
- 45 -
Chapter1:R&D expenditure
Chart 1-3-14: Share of total expenditures at U.S. universities and colleges accounted for by research expenditures (IPEDS data)
(A) Percentage
(B) Amount
Note: These are four-year universities and colleges (four-year institutions). In the
case of some for-profit private universities and colleges, figures for public ser-vice are included in the calculation of research expenditures. However, these figures account for only about 0.03% of research expenses at all private universities and colleges.
Sources: NCES, IPEDS, “Digest of Education Statistics”
Next, U.S. universities and colleges’ R&D ex-
penditures according to the NSF and research ex-penditures according to IPEDS are compared.
The NSF’s R&D statistics cover universities and colleges with annual R&D expenditures of at least 150,000 dollars. There are a little under 700 such universities and colleges in U.S. The NSF total is still about 1 trillion yen higher than for IPEDS’ re-search expenditures, which cover about 2,600 uni-versities and colleges (including about 650 public universities and colleges). As noted above, this must be because IPEDS’ research expenditures are under-estimated. Furthermore, because the univer-sities and colleges that the NSF does not include each have R&D expenditures of less than 150,000, their total contribution is small. A comparison between the NSF’s R&D expenditures and IPEDS’ total ex-penditures therefore seems rational.
Looking at Chart 1-3-15 in this case, the share of total expenditures at all universities and colleges accounted for by R&D expenditures is 15.0%. By type of institution, the share is 17.2% at public uni-versities and colleges and 11.9% at private universi-ties and colleges.
The NSF’s survey was conducted under the condi-tion that the R&D expenditure category does not include anything that cannot be differentiated from categories such as instruction.
Chart 1-3-15: Share of total expenditures at U.S. universities
and colleges accounted for by R&D expenditures (NSF data)
(A) Percentage
(B) Amount
Note: These are four-year universities and colleges (four-year institutions). Sources: Total expenditures: NCES, IPEDS, “Digest of Education Statistics” R&D expenditure: NSF, “Academic R&D Expenditures”
In the case of Japanese universities, R&D expend-
itures are overestimated because they include per-sonnel costs for researchers (faculty, medical staff and other researchers) without regard to the percen-tage of time they spend on research. Using the OECD’s R&D expenditures that corrects labor costs by adjusting them by the percentage of time devoted to research reduces the figure by about 40%. Even so, R&D expenditures account for about 30% of total expenditures.
Even with these attempted corrections, there are large differences related to total operating costs and R&D expenditures in Japanese and U.S. universities and colleges. There are still points that need to be examined in order to carry out a proper comparison of R&D expenditures in Japanese and U.S. universi-ties and colleges (Chart 1-3-16).
0% 20% 40% 60% 80% 100%
Private universities
Public universities
All universities
Share of total expenditures U.S. universities and colleges accounted for by research expenditures 2004 - 2006 (3-year avg.)
Research expenditures Total expenditures
2004-2006(3-year avg.)
(1) Totalexpenditures
(2) Researchexpenditures (2)/(1)
All universities ¥39.2 trillion ¥4.6 trillion 11.7%Public universities ¥23.2 trillion ¥2.9 trillion 12.4%Private universities ¥16.0 trillion ¥1.7 trillion 10.7%
0% 20% 40% 60% 80% 100%
Private universities
Public universities
All universities
Share of total expenditures at U.S. universities and colleges accounted for by R&D expenditures2004 - 2006 (3-year avg.)
R&D expenditures Total expenditures
2004-2006(3-year avg.)
(1) Totalexpenditures
(2) R&Dexpenditures (2)/(1)
All universities ¥39.2 trillion ¥5.9 trillion 15.0%Public universities ¥23.2 trillion ¥4.0 trillion 17.2%Private universities ¥16.0 trillion ¥1.9 trillion 11.9%
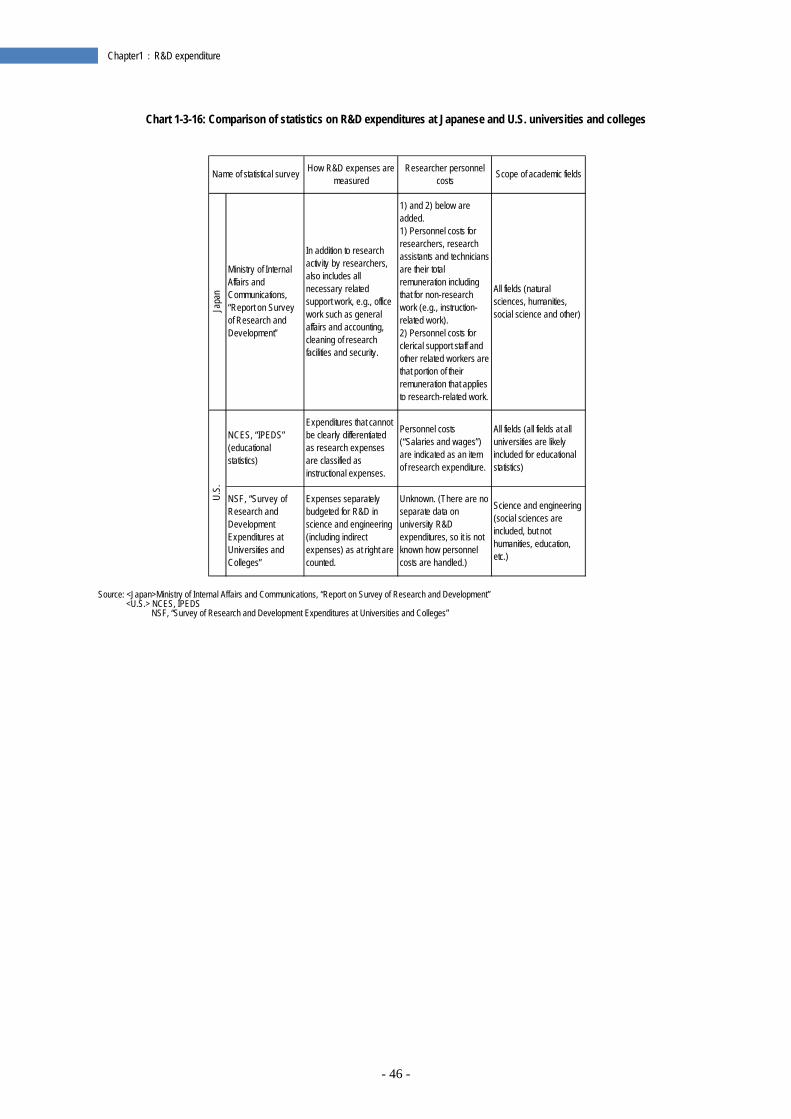
- 46 -
Chapter1:R&D expenditure
Chart 1-3-16: Comparison of statistics on R&D expenditures at Japanese and U.S. universities and colleges
Source: <Japan>Ministry of Internal Affairs and Communications, “Report on Survey of Research and Development”
<U.S.> NCES, IPEDS NSF, “Survey of Research and Development Expenditures at Universities and Colleges”
How R&D expenses aremeasured
Researcher personnelcosts Scope of academic fields
Japa
n
Ministry of InternalAffairs andCommunications,“Report on Surveyof Research andDevelopment”
In addition to researchactivity by researchers,also includes allnecessary relatedsupport work, e.g., officework such as generalaffairs and accounting,cleaning of researchfacilities and security.
1) and 2) below areadded.1) Personnel costs forresearchers, researchassistants and techniciansare their totalremuneration includingthat for non-researchwork (e.g., instruction-related work).2) Personnel costs forclerical support staff andother related workers arethat portion of theirremuneration that appliesto research-related work.
All fields (naturalsciences, humanities,social science and other)
NCES, “IPEDS”(educationalstatistics)
Expenditures that cannotbe clearly differentiatedas research expensesare classified asinstructional expenses.
Personnel costs(“Salaries and wages”)are indicated as an itemof research expenditure.
All fields (all fields at alluniversities are likelyincluded for educationalstatistics)
NSF, “Survey ofResearch andDevelopmentExpenditures atUniversities andColleges”
Expenses separatelybudgeted for R&D inscience and engineering(including indirectexpenses) as at right arecounted.
Unknown. (There are noseparate data onuniversity R&Dexpenditures, so it is notknown how personnelcosts are handled.)
Science and engineering(social sciences areincluded, but nothumanities, education,etc.)
U.S.
Name of statistical survey
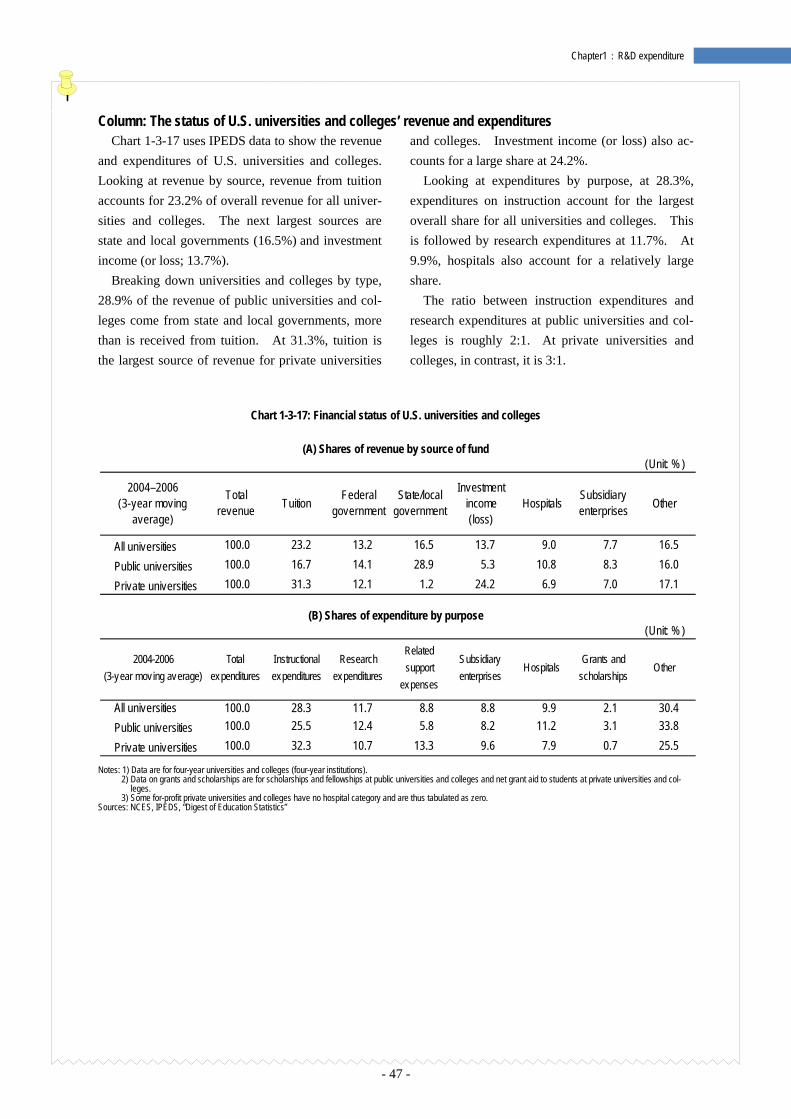
- 47 -
Chapter1:R&D expenditure
Column: The status of U.S. universities and colleges’ revenue and expenditures Chart 1-3-17 uses IPEDS data to show the revenue
and expenditures of U.S. universities and colleges. Looking at revenue by source, revenue from tuition accounts for 23.2% of overall revenue for all univer-sities and colleges. The next largest sources are state and local governments (16.5%) and investment income (or loss; 13.7%).
Breaking down universities and colleges by type, 28.9% of the revenue of public universities and col-leges come from state and local governments, more than is received from tuition. At 31.3%, tuition is the largest source of revenue for private universities
and colleges. Investment income (or loss) also ac-counts for a large share at 24.2%.
Looking at expenditures by purpose, at 28.3%, expenditures on instruction account for the largest overall share for all universities and colleges. This is followed by research expenditures at 11.7%. At 9.9%, hospitals also account for a relatively large share.
The ratio between instruction expenditures and research expenditures at public universities and col-leges is roughly 2:1. At private universities and colleges, in contrast, it is 3:1.
Chart 1-3-17: Financial status of U.S. universities and colleges
(A) Shares of revenue by source of fund
(B) Shares of expenditure by purpose
Notes: 1) Data are for four-year universities and colleges (four-year institutions).
2) Data on grants and scholarships are for scholarships and fellowships at public universities and colleges and net grant aid to students at private universities and col-leges.
3) Some for-profit private universities and colleges have no hospital category and are thus tabulated as zero. Sources: NCES, IPEDS, “Digest of Education Statistics”
(Unit: % )
2004–2006(3-year moving
average)
Totalrevenue Tuition Federal
governmentState/local
government
Investmentincome(loss)
Hospitals Subsidiaryenterprises Other
All universities 100.0 23.2 13.2 16.5 13.7 9.0 7.7 16.5
Public universities 100.0 16.7 14.1 28.9 5.3 10.8 8.3 16.0
Private universities 100.0 31.3 12.1 1.2 24.2 6.9 7.0 17.1
(Unit: % )
2004-2006(3-year moving average)
Totalexpenditures
Instructionalexpenditures
Researchexpenditures
Relatedsupport
expenses
Subsidiaryenterprises
HospitalsGrants and
scholarshipsOther
All universities 100.0 28.3 11.7 8.8 8.8 9.9 2.1 30.4Public universities 100.0 25.5 12.4 5.8 8.2 11.2 3.1 33.8
Private universities 100.0 32.3 10.7 13.3 9.6 7.9 0.7 25.5
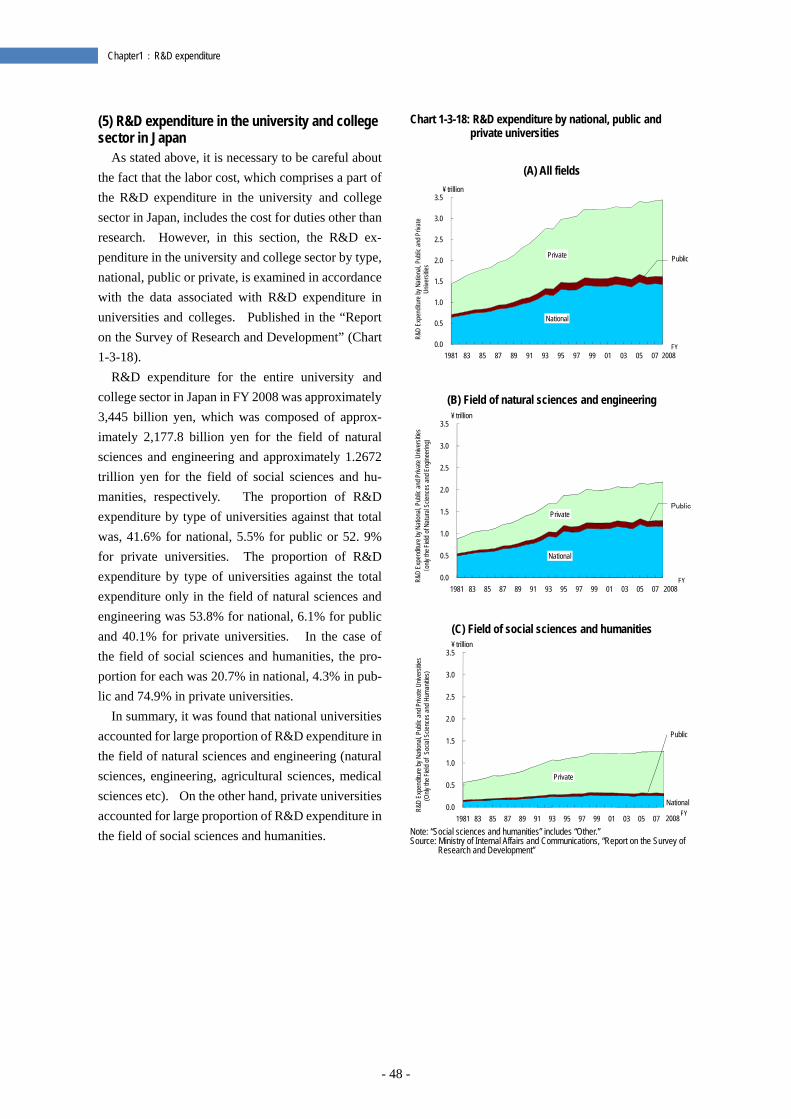
- 48 -
Chapter1:R&D expenditure
(5) R&D expenditure in the university and college sector in Japan
As stated above, it is necessary to be careful about the fact that the labor cost, which comprises a part of the R&D expenditure in the university and college sector in Japan, includes the cost for duties other than research. However, in this section, the R&D ex-penditure in the university and college sector by type, national, public or private, is examined in accordance with the data associated with R&D expenditure in universities and colleges. Published in the “Report on the Survey of Research and Development” (Chart 1-3-18).
R&D expenditure for the entire university and college sector in Japan in FY 2008 was approximately 3,445 billion yen, which was composed of approx-imately 2,177.8 billion yen for the field of natural sciences and engineering and approximately 1.2672 trillion yen for the field of social sciences and hu-manities, respectively. The proportion of R&D expenditure by type of universities against that total was, 41.6% for national, 5.5% for public or 52. 9% for private universities. The proportion of R&D expenditure by type of universities against the total expenditure only in the field of natural sciences and engineering was 53.8% for national, 6.1% for public and 40.1% for private universities. In the case of the field of social sciences and humanities, the pro-portion for each was 20.7% in national, 4.3% in pub-lic and 74.9% in private universities.
In summary, it was found that national universities accounted for large proportion of R&D expenditure in the field of natural sciences and engineering (natural sciences, engineering, agricultural sciences, medical sciences etc). On the other hand, private universities accounted for large proportion of R&D expenditure in the field of social sciences and humanities.
Chart 1-3-18: R&D expenditure by national, public and private universities
(A) All fields
(B) Field of natural sciences and engineering
(C) Field of social sciences and humanities
Note: “Social sciences and humanities” includes “Other.” Source: Ministry of Internal Affairs and Communications, “Report on the Survey of
Research and Development”
National
Private
0.0
0.5
1.0
1.5
2.0
2.5
3.0
3.5
1981 83 85 87 89 91 93 95 97 99 01 03 05 07
¥ trillion
2008
R&D
Expe
nditu
re by
Nat
ional,
Pub
lic a
nd P
rivat
e Un
ivers
ities
Public
FY
National
Private
0.0
0.5
1.0
1.5
2.0
2.5
3.0
3.5
1981 83 85 87 89 91 93 95 97 99 01 03 05 07
¥ trillion
2008
R&D
Expe
nditu
re by
Nat
ional,
Pub
lic a
nd P
rivat
e Univ
ersit
ies(o
nly th
e Fiel
d of
Nat
ural
Scien
ces a
nd E
ngine
ering
)
Public
FY
National
Private
0.0
0.5
1.0
1.5
2.0
2.5
3.0
3.5
1981 83 85 87 89 91 93 95 97 99 01 03 05 07
¥ trillion
2008
R&D
Expe
nditu
re by
Nat
ional,
Pub
lic a
nd P
rivat
e Univ
ersit
ies(O
nly th
e Fiel
d of
Soc
ial S
cienc
es an
d Hu
manit
ies)
Public
FY
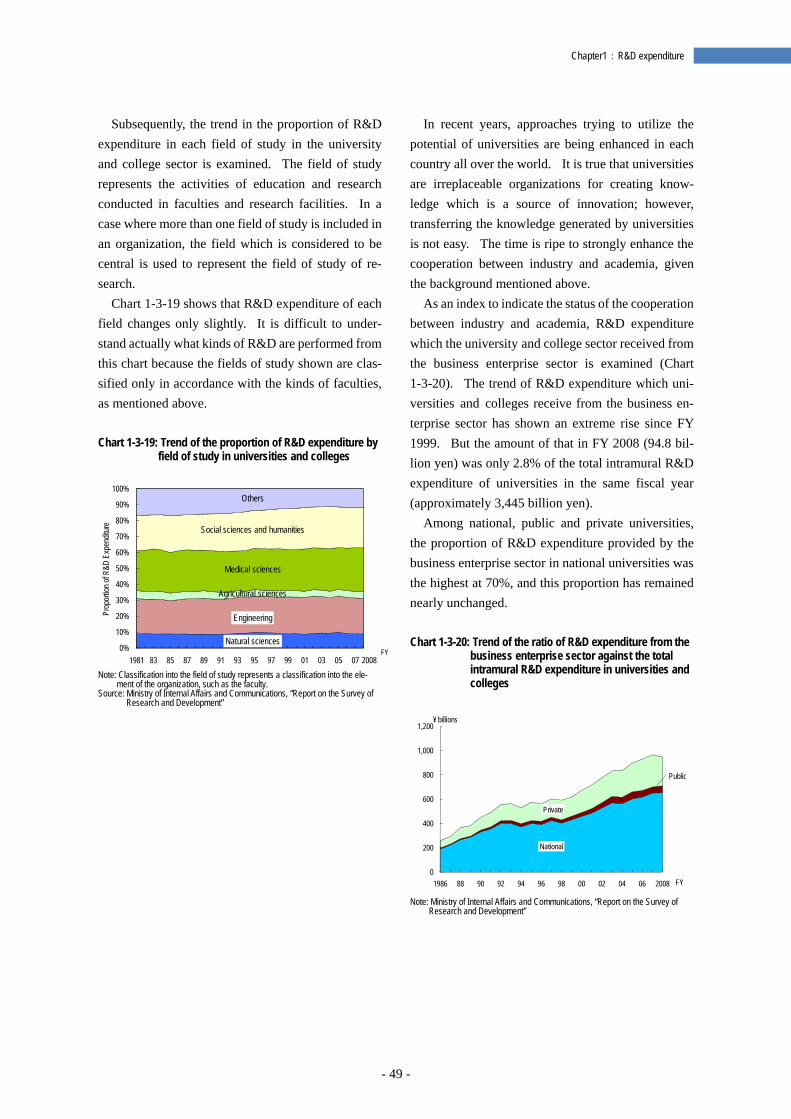
- 49 -
Chapter1:R&D expenditure
Subsequently, the trend in the proportion of R&D expenditure in each field of study in the university and college sector is examined. The field of study represents the activities of education and research conducted in faculties and research facilities. In a case where more than one field of study is included in an organization, the field which is considered to be central is used to represent the field of study of re-search.
Chart 1-3-19 shows that R&D expenditure of each field changes only slightly. It is difficult to under-stand actually what kinds of R&D are performed from this chart because the fields of study shown are clas-sified only in accordance with the kinds of faculties, as mentioned above. Chart 1-3-19: Trend of the proportion of R&D expenditure by
field of study in universities and colleges
Note: Classification into the field of study represents a classification into the ele-
ment of the organization, such as the faculty. Source: Ministry of Internal Affairs and Communications, “Report on the Survey of
Research and Development”
In recent years, approaches trying to utilize the potential of universities are being enhanced in each country all over the world. It is true that universities are irreplaceable organizations for creating know-ledge which is a source of innovation; however, transferring the knowledge generated by universities is not easy. The time is ripe to strongly enhance the cooperation between industry and academia, given the background mentioned above.
As an index to indicate the status of the cooperation between industry and academia, R&D expenditure which the university and college sector received from the business enterprise sector is examined (Chart 1-3-20). The trend of R&D expenditure which uni-versities and colleges receive from the business en-terprise sector has shown an extreme rise since FY 1999. But the amount of that in FY 2008 (94.8 bil-lion yen) was only 2.8% of the total intramural R&D expenditure of universities in the same fiscal year (approximately 3,445 billion yen).
Among national, public and private universities, the proportion of R&D expenditure provided by the business enterprise sector in national universities was the highest at 70%, and this proportion has remained nearly unchanged. Chart 1-3-20: Trend of the ratio of R&D expenditure from the
business enterprise sector against the total intramural R&D expenditure in universities and colleges
Note: Ministry of Internal Affairs and Communications, “Report on the Survey of
Research and Development”
0%
10%
20%
30%
40%
50%
60%
70%
80%
90%
100%
1981 83 85 87 89 91 93 95 97 99 01 03 05 07
Prop
ortio
n of R
&D E
xpen
ditur
e
2008
Social sciences and humanities
Agricultural sciences
Engineering
Medical sciences
Natural sciences
Others
FY
National
Private
0
200
400
600
800
1,000
1,200
1986 88 90 92 94 96 98 00 02 04 06 2008
¥ billions
FY
Public
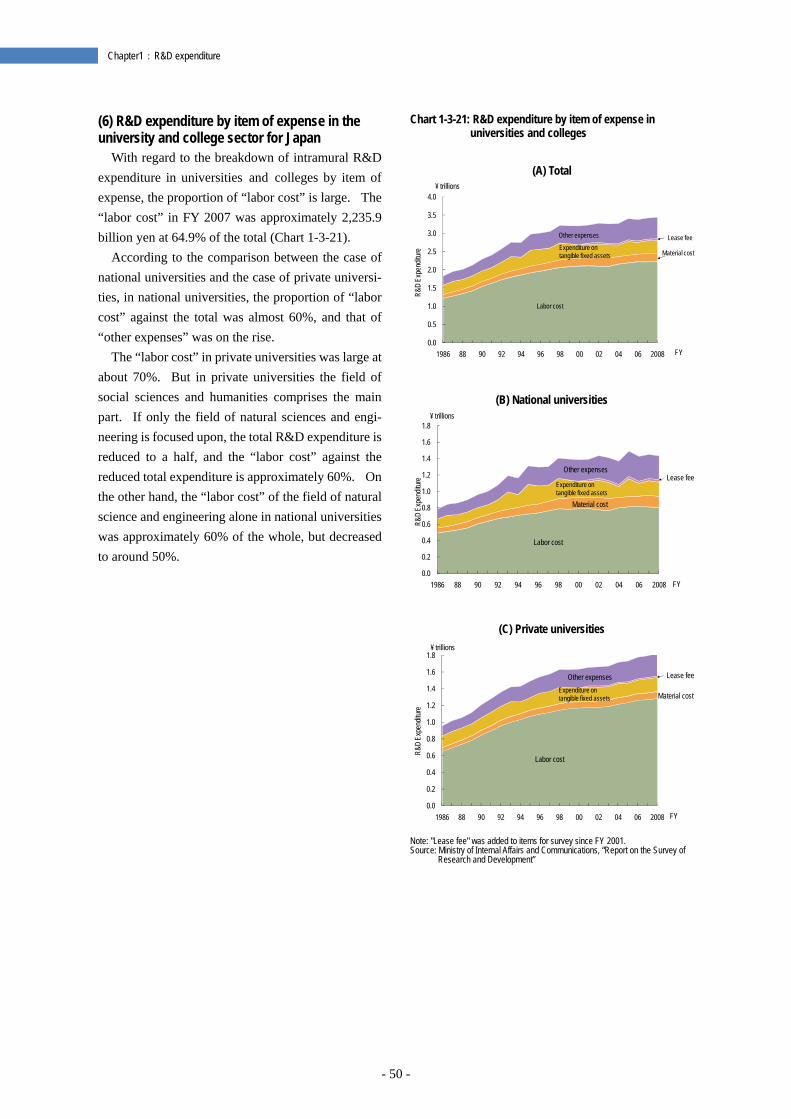
- 50 -
Chapter1:R&D expenditure
(6) R&D expenditure by item of expense in the university and college sector for Japan
With regard to the breakdown of intramural R&D expenditure in universities and colleges by item of expense, the proportion of “labor cost” is large. The “labor cost” in FY 2007 was approximately 2,235.9 billion yen at 64.9% of the total (Chart 1-3-21).
According to the comparison between the case of national universities and the case of private universi-ties, in national universities, the proportion of “labor cost” against the total was almost 60%, and that of “other expenses” was on the rise.
The “labor cost” in private universities was large at about 70%. But in private universities the field of social sciences and humanities comprises the main part. If only the field of natural sciences and engi-neering is focused upon, the total R&D expenditure is reduced to a half, and the “labor cost” against the reduced total expenditure is approximately 60%. On the other hand, the “labor cost” of the field of natural science and engineering alone in national universities was approximately 60% of the whole, but decreased to around 50%.
Chart 1-3-21: R&D expenditure by item of expense in universities and colleges
(A) Total
(B) National universities
(C) Private universities
Note: "Lease fee" was added to items for survey since FY 2001. Source: Ministry of Internal Affairs and Communications, “Report on the Survey of
Research and Development”
Labor cost
Material costExpenditure on tangible fixed assets
Lease feeOther expenses
0.0
0.5
1.0
1.5
2.0
2.5
3.0
3.5
4.0
1986 88 90 92 94 96 98 00 02 04 06 2008
R&D
Expe
nditu
re
FY
¥ trillions
Labor cost
Material cost
Expenditure on tangible fixed assets
Lease feeOther expenses
0.0
0.2
0.4
0.6
0.8
1.0
1.2
1.4
1.6
1.8
1986 88 90 92 94 96 98 00 02 04 06 2008
R&D
Expe
nditu
re
FY
¥ trillions
Labor cost
Material costExpenditure on tangible fixed assets
Lease feeOther expenses
0.0
0.2
0.4
0.6
0.8
1.0
1.2
1.4
1.6
1.8
1986 88 90 92 94 96 98 00 02 04 06 2008
R&D
Expe
nditu
re
FY
¥ trillions
- 51 -
Chapter1:R&D expenditure
1.4 R&D expenditure by type of R&D
Key points ○The expression R&D expenditure by type of R&D is a classification of R&D expenditure into that for basic
research, applied research, and development. In Japan, however, this classification has been made only for the field of natural sciences and engineering (for Korea, only natural sciences until 2006).
○Out of R&D expenditure in FY 2007 for Japan, the proportion of that for basic research was 13.7%, and a large proportion, or 48.9%, of the total was used in the university and college sector.
○Among the countries studied, in France, the proportion of R&D expenditure for basic research in the latest available year was 25.1%. In contrast, the proportion of R&D expenditure for the basic research was smallest in China at 4.7%. In Japan and U.S., the values were 13.7% and 17.4%, respectively.
1.4.1 R&D expenditure by type of R&D The expression R&D expenditure by type of R&D
represents the intramural R&D expenditure roughly classified into that for basic research, applied research and development. This classification is in accor-dance with the definition in the “Frascati Manual” by the OECD which each country has adopted. There-fore, the influence caused by responders’ subjective estimates should be taken into account. The sum-mary of the definition of characters of work in the “Frascati Manual” is as follows.
Basic research is exploratory and theoretical work mainly in order to obtain new knowledge on the causes behind phenomena and observable facts without considering any specific application or use.
Applied research is also an original exploration in order to obtain new knowledge. It is, however, mainly for certain actual purposes or objectives.
(Experimental) development is systematic work in which existing knowledge obtained by research or actual experiments is applied, for the purpose of producing new materials, products and devices, in-troducing new procedures, systems and services, or practically revising what has already been produced or introduced.
Each country seems to measure the data in accor-dance with the definition above, but the expressions used are somewhat different depending on country. For example, “experimental development” is ex-pressed as “development” in U.S. but as “develop-ment experimental” in France, explicitly including experimental work.
Germany has not publicly announced precise data
for R&D expenditure by type of R&D, and does not have any such data for the university and college sector. But measured data for R&D expenditure by type of R&D in the business enterprise sector has been published since 2001 (through the data of OECD). Also, U.K. does not have data for R&D expenditure by type of R&D in the university and college sector. Therefore, it is impossible to meas-ure the total R&D expenditure by type of R&D.
In Japan (and in Korea until 2006; all fields have been covered since 2007), only the field of natural science and engineering is covered by the measure-ment of total national R&D expenditure by type of R&D( 8 ). Therefore the nominal total of national R&D expenditure by type of R&D is different from the actual total.
(8) The definition of R&D expenditure by type of R&D in Japan’s survey of R&D expenditure, the “Survey of Research and Development” is as follows, and only the field of science and engineering is covered. Basic research: theoretical or experimental research in order to create hypotheses and theories or to obtain new knowledge on phenomena or observable facts, without considering a certain application or use. Applied research: research to determine the potential of the practical use of knowledge which was discovered by basic research in order to achieve certain objectives; research to explore additional application methods with regard to methods which are already in practical use. Development: research to introduce new materials, devices, products, systems, procedures, etc. and to revise those which already exist, by using basic research, applied research and knowledge obtained by actual expe-rience.
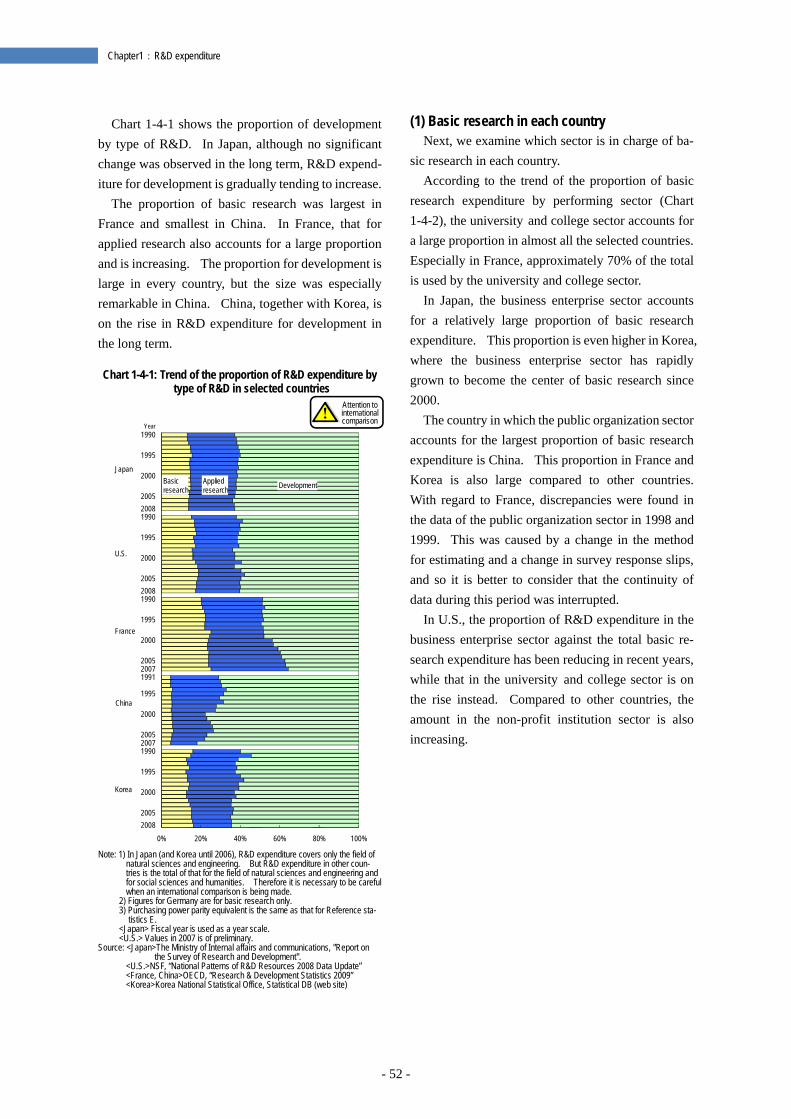
- 52 -
Chapter1:R&D expenditure
Chart 1-4-1 shows the proportion of development by type of R&D. In Japan, although no significant change was observed in the long term, R&D expend-iture for development is gradually tending to increase.
The proportion of basic research was largest in France and smallest in China. In France, that for applied research also accounts for a large proportion and is increasing. The proportion for development is large in every country, but the size was especially remarkable in China. China, together with Korea, is on the rise in R&D expenditure for development in the long term. Chart 1-4-1: Trend of the proportion of R&D expenditure by
type of R&D in selected countries
Note: 1) In Japan (and Korea until 2006), R&D expenditure covers only the field of
natural sciences and engineering. But R&D expenditure in other coun-tries is the total of that for the field of natural sciences and engineering and for social sciences and humanities. Therefore it is necessary to be careful when an international comparison is being made.
2) Figures for Germany are for basic research only. 3) Purchasing power parity equivalent is the same as that for Reference sta-
tistics E. <Japan> Fiscal year is used as a year scale. <U.S.> Values in 2007 is of preliminary.
Source: <Japan>The Ministry of Internal affairs and communications, "Report on the Survey of Research and Development".
<U.S.>NSF, “National Patterns of R&D Resources 2008 Data Update” <France, China>OECD, “Research & Development Statistics 2009” <Korea>Korea National Statistical Office, Statistical DB (web site)
(1) Basic research in each country Next, we examine which sector is in charge of ba-
sic research in each country. According to the trend of the proportion of basic
research expenditure by performing sector (Chart 1-4-2), the university and college sector accounts for a large proportion in almost all the selected countries. Especially in France, approximately 70% of the total is used by the university and college sector.
In Japan, the business enterprise sector accounts for a relatively large proportion of basic research expenditure. This proportion is even higher in Korea, where the business enterprise sector has rapidly grown to become the center of basic research since 2000.
The country in which the public organization sector accounts for the largest proportion of basic research expenditure is China. This proportion in France and Korea is also large compared to other countries. With regard to France, discrepancies were found in the data of the public organization sector in 1998 and 1999. This was caused by a change in the method for estimating and a change in survey response slips, and so it is better to consider that the continuity of data during this period was interrupted.
In U.S., the proportion of R&D expenditure in the business enterprise sector against the total basic re-search expenditure has been reducing in recent years, while that in the university and college sector is on the rise instead. Compared to other countries, the amount in the non-profit institution sector is also increasing.
0% 20% 40% 60% 80% 100%20082005
2000
1995
199020072005
2000
1995
199120072005
2000
1995
199020082005
2000
1995
199020082005
2000
1995
1990
Japan
U.S.
France
China
Year
Basicresearch
Appliedresearch Development
Korea
Attention to international comparison
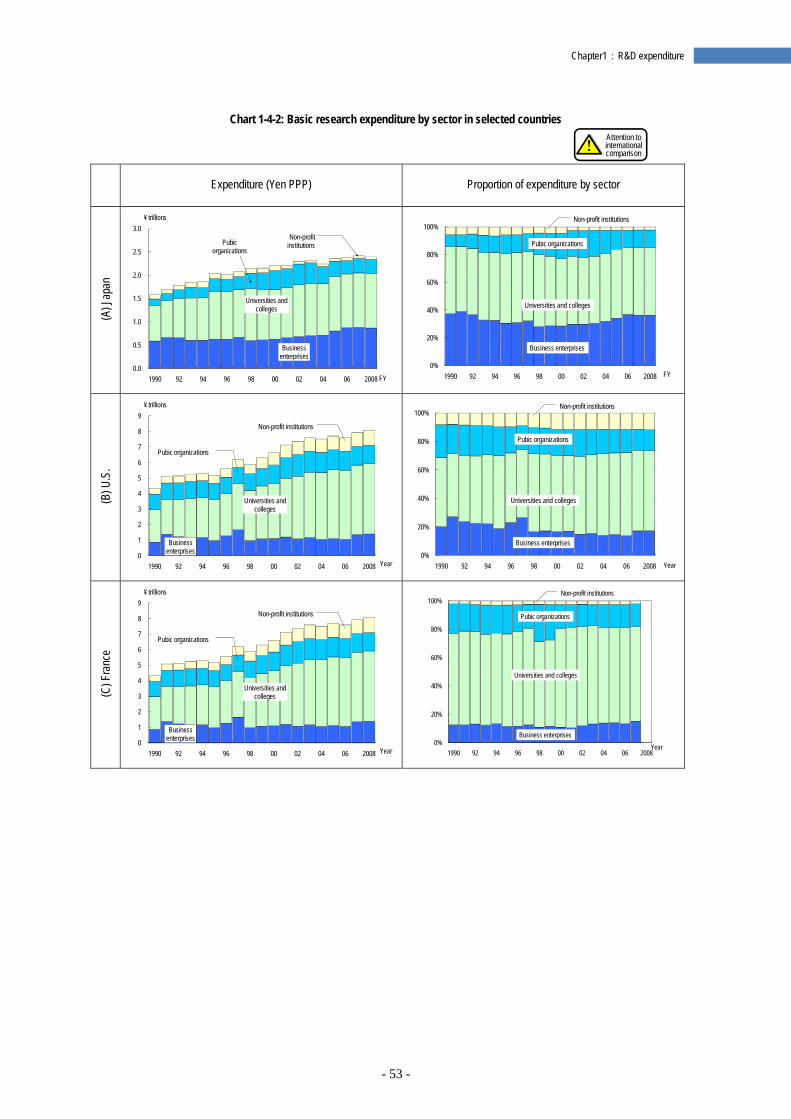
- 53 -
Chapter1:R&D expenditure
Chart 1-4-2: Basic research expenditure by sector in selected countries
Expenditure (Yen PPP) Proportion of expenditure by sector
(A) J
apan
(B) U
.S.
(C) F
ranc
e
Business enterprises
Universities and colleges
Pubic organizations
0.0
0.5
1.0
1.5
2.0
2.5
3.0
1990 92 94 96 98 00 02 04 06 2008
¥ trillions
FY
Non-profit institutions
0%
20%
40%
60%
80%
100%
1990 92 94 96 98 00 02 04 06 2008 FY
Non-profit institutions
Pubic organizations
Universities and colleges
Business enterprises
Business enterprises
Universities and colleges
0
1
2
3
4
5
6
7
8
9
1990 92 94 96 98 00 02 04 06 2008
¥ trillions
Year
Pubic organizations
Non-profit institutions
0%
20%
40%
60%
80%
100%
1990 92 94 96 98 00 02 04 06 2008 Year
Non-profit institutions
Pubic organizations
Universities and colleges
Business enterprises
Business enterprises
Universities and colleges
0
1
2
3
4
5
6
7
8
9
1990 92 94 96 98 00 02 04 06 2008
¥ trillions
Year
Pubic organizations
Non-profit institutions
0%
20%
40%
60%
80%
100%
1990 92 94 96 98 00 02 04 06 2008Year
Non-profit institutions
Pubic organizations
Universities and colleges
Business enterprises
Attention to international comparison
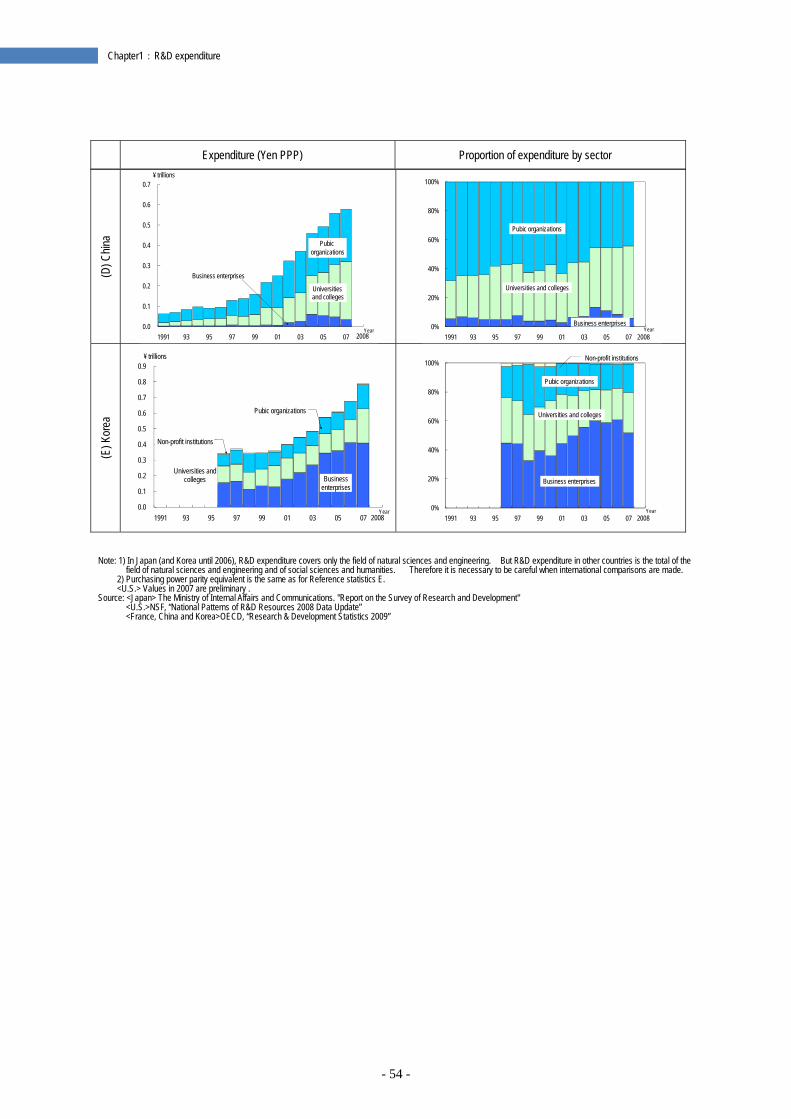
- 54 -
Chapter1:R&D expenditure
(D) C
hina
(E) K
orea
Note: 1) In Japan (and Korea until 2006), R&D expenditure covers only the field of natural sciences and engineering. But R&D expenditure in other countries is the total of the
field of natural sciences and engineering and of social sciences and humanities. Therefore it is necessary to be careful when international comparisons are made. 2) Purchasing power parity equivalent is the same as for Reference statistics E. <U.S.> Values in 2007 are preliminary .
Source: <Japan> The Ministry of Internal Affairs and Communications. "Report on the Survey of Research and Development" <U.S.>NSF, “National Patterns of R&D Resources 2008 Data Update” <France, China and Korea>OECD, “Research & Development Statistics 2009”
0.0
0.1
0.2
0.3
0.4
0.5
0.6
0.7
1991 93 95 97 99 01 03 05 07
¥ trillions
2008
Pubic organizations
Universities and colleges
Business enterprises
Year 0%
20%
40%
60%
80%
100%
1991 93 95 97 99 01 03 05 07 2008
Pubic organizations
Universities and colleges
Business enterprisesYear
Business enterprises
Universities and colleges
0.0
0.1
0.2
0.3
0.4
0.5
0.6
0.7
0.8
0.9
1991 93 95 97 99 01 03 05 07
¥ trillions
2008
Pubic organizations
Non-profit institutions
Year 0%
20%
40%
60%
80%
100%
1991 93 95 97 99 01 03 05 07 2008
Non-profit institutions
Pubic organizations
Universities and colleges
Business enterprises
Year
Expenditure (Yen PPP) Proportion of expenditure by sector
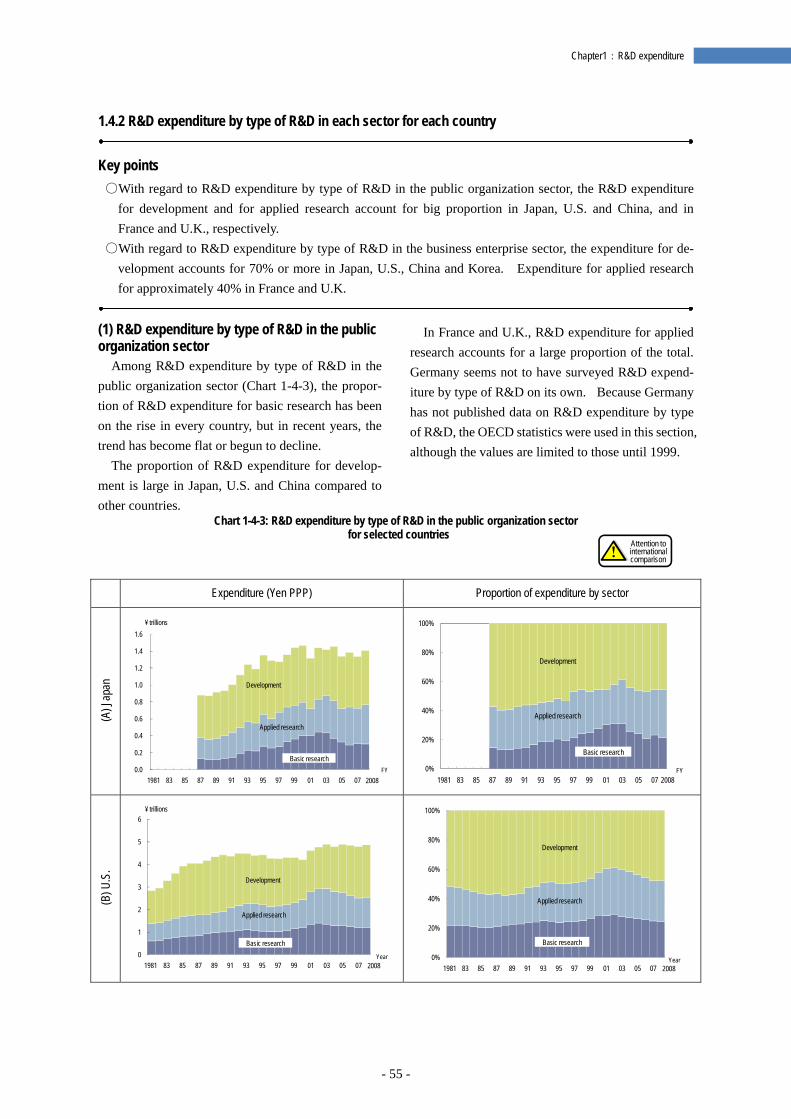
- 55 -
Chapter1:R&D expenditure
1.4.2 R&D expenditure by type of R&D in each sector for each country
Key points ○With regard to R&D expenditure by type of R&D in the public organization sector, the R&D expenditure
for development and for applied research account for big proportion in Japan, U.S. and China, and in France and U.K., respectively.
○With regard to R&D expenditure by type of R&D in the business enterprise sector, the expenditure for de-velopment accounts for 70% or more in Japan, U.S., China and Korea. Expenditure for applied research for approximately 40% in France and U.K.
(1) R&D expenditure by type of R&D in the public organization sector
Among R&D expenditure by type of R&D in the public organization sector (Chart 1-4-3), the propor-tion of R&D expenditure for basic research has been on the rise in every country, but in recent years, the trend has become flat or begun to decline.
The proportion of R&D expenditure for develop-ment is large in Japan, U.S. and China compared to other countries.
In France and U.K., R&D expenditure for applied research accounts for a large proportion of the total. Germany seems not to have surveyed R&D expend-iture by type of R&D on its own. Because Germany has not published data on R&D expenditure by type of R&D, the OECD statistics were used in this section, although the values are limited to those until 1999.
Chart 1-4-3: R&D expenditure by type of R&D in the public organization sector for selected countries
Expenditure (Yen PPP) Proportion of expenditure by sector
(A) J
apan
(B) U
.S.
Applied research
Development
0.0
0.2
0.4
0.6
0.8
1.0
1.2
1.4
1.6
1981 83 85 87 89 91 93 95 97 99 01 03 05 07
¥ trillions
2008
Basic researchFY
Applied research
Development
0%
20%
40%
60%
80%
100%
1981 83 85 87 89 91 93 95 97 99 01 03 05 07 2008
Basic research
FY
Applied research
Development
0
1
2
3
4
5
6
1981 83 85 87 89 91 93 95 97 99 01 03 05 07
¥ trillions
2008
Basic research
Year
Applied research
Development
0%
20%
40%
60%
80%
100%
1981 83 85 87 89 91 93 95 97 99 01 03 05 07 2008
Basic research
Year
Attention to international comparison
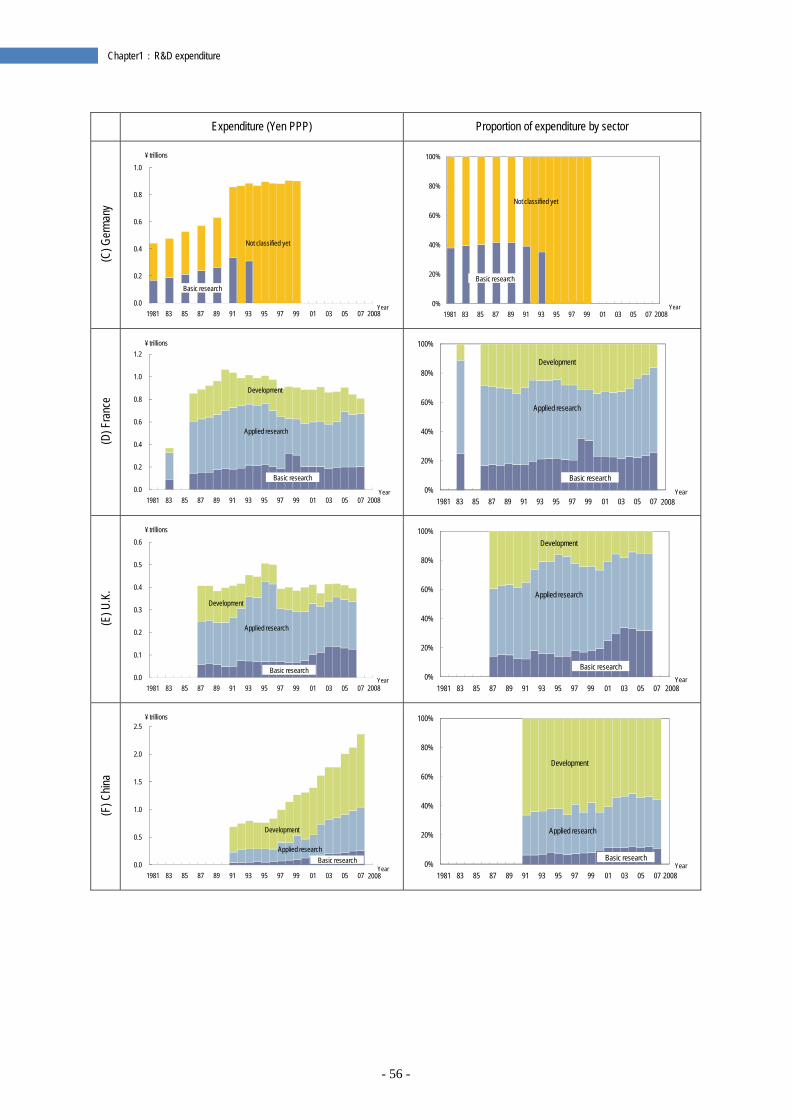
- 56 -
Chapter1:R&D expenditure
Expenditure (Yen PPP) Proportion of expenditure by sector
(C) G
erma
ny
(D) F
ranc
e
(E) U
.K.
(F) C
hina
Not classified yet
0.0
0.2
0.4
0.6
0.8
1.0
1981 83 85 87 89 91 93 95 97 99 01 03 05 07
¥ trillions
2008
Basic research
Year
Not classified yet
0%
20%
40%
60%
80%
100%
1981 83 85 87 89 91 93 95 97 99 01 03 05 07 2008
Basic research
Year
Applied research
Development
0.0
0.2
0.4
0.6
0.8
1.0
1.2
1981 83 85 87 89 91 93 95 97 99 01 03 05 07
¥ trillions
2008
Basic research
Year
Applied research
Development
0%
20%
40%
60%
80%
100%
1981 83 85 87 89 91 93 95 97 99 01 03 05 07 2008
Basic research
Year
Applied research
Development
0.0
0.1
0.2
0.3
0.4
0.5
0.6
1981 83 85 87 89 91 93 95 97 99 01 03 05 07
¥ trillions
2008
Basic researchYear
Applied research
Development
0%
20%
40%
60%
80%
100%
1981 83 85 87 89 91 93 95 97 99 01 03 05 07 2008
Basic researchYear
Applied research
Development
0.0
0.5
1.0
1.5
2.0
2.5
1981 83 85 87 89 91 93 95 97 99 01 03 05 07
¥ trillions
2008
Basic researchYear
Applied research
Development
0%
20%
40%
60%
80%
100%
1981 83 85 87 89 91 93 95 97 99 01 03 05 07 2008
Basic researchYear
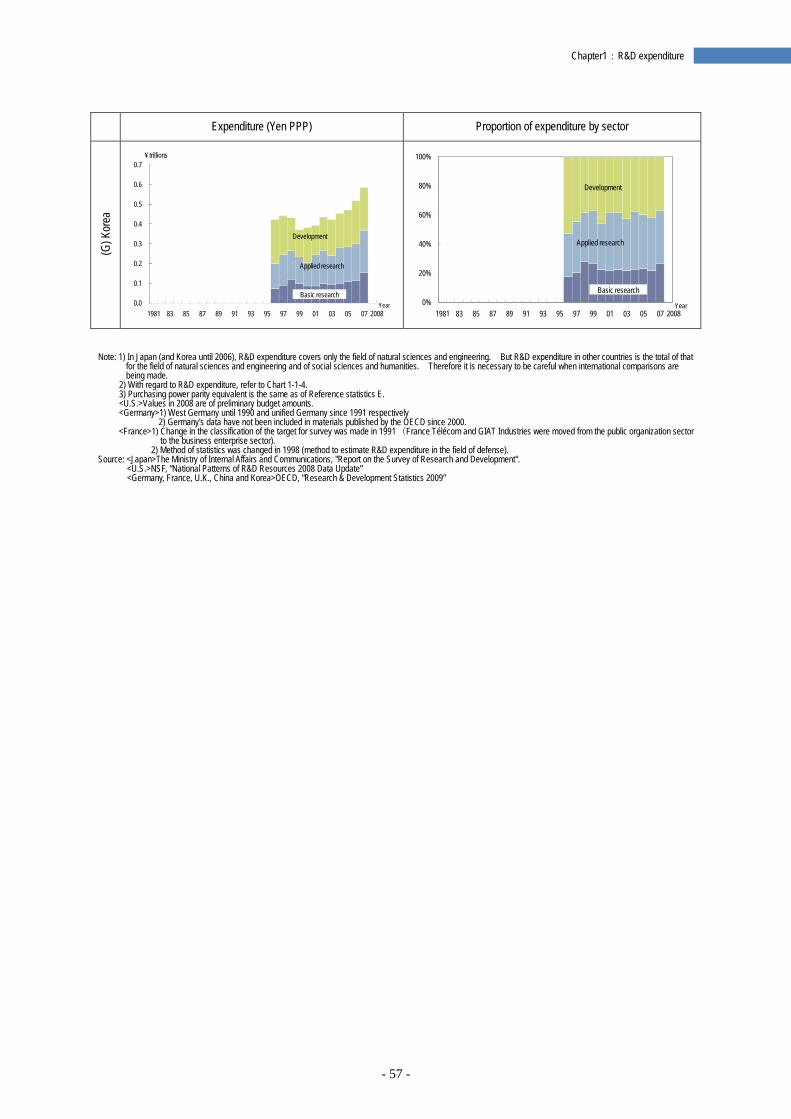
- 57 -
Chapter1:R&D expenditure
Expenditure (Yen PPP) Proportion of expenditure by sector
(G) K
orea
Note: 1) In Japan (and Korea until 2006), R&D expenditure covers only the field of natural sciences and engineering. But R&D expenditure in other countries is the total of that
for the field of natural sciences and engineering and of social sciences and humanities. Therefore it is necessary to be careful when international comparisons are being made.
2) With regard to R&D expenditure, refer to Chart 1-1-4. 3) Purchasing power parity equivalent is the same as of Reference statistics E. <U.S.>Values in 2008 are of preliminary budget amounts. <Germany>1) West Germany until 1990 and unified Germany since 1991 respectively
2) Germany's data have not been included in materials published by the OECD since 2000. <France>1) Change in the classification of the target for survey was made in 1991 (France Télécom and GIAT Industries were moved from the public organization sector
to the business enterprise sector). 2) Method of statistics was changed in 1998 (method to estimate R&D expenditure in the field of defense).
Source: <Japan>The Ministry of Internal Affairs and Communications, "Report on the Survey of Research and Development". <U.S.>NSF, “National Patterns of R&D Resources 2008 Data Update” <Germany, France, U.K., China and Korea>OECD, “Research & Development Statistics 2009”
Applied research
Development
0.0
0.1
0.2
0.3
0.4
0.5
0.6
0.7
1981 83 85 87 89 91 93 95 97 99 01 03 05 07
¥ trillions
2008
Basic researchYear
Applied research
Development
0%
20%
40%
60%
80%
100%
1981 83 85 87 89 91 93 95 97 99 01 03 05 07 2008
Basic research
Year
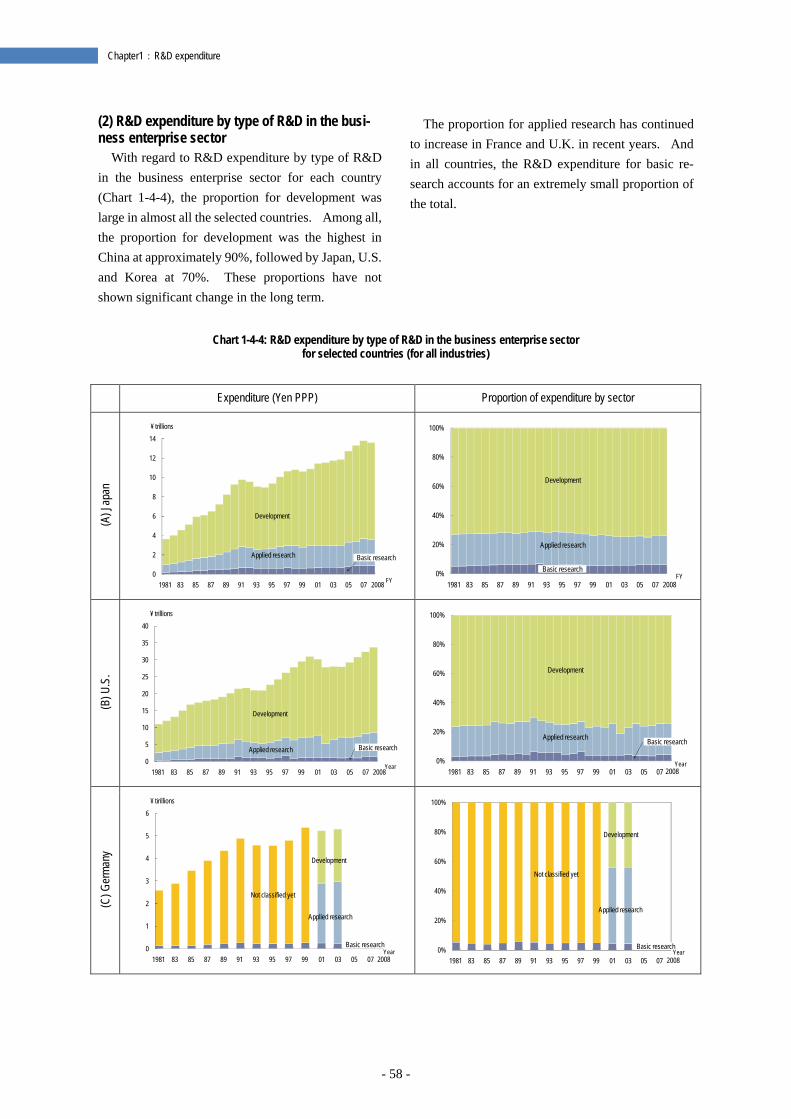
- 58 -
Chapter1:R&D expenditure
(2) R&D expenditure by type of R&D in the busi-ness enterprise sector
With regard to R&D expenditure by type of R&D in the business enterprise sector for each country (Chart 1-4-4), the proportion for development was large in almost all the selected countries. Among all, the proportion for development was the highest in China at approximately 90%, followed by Japan, U.S. and Korea at 70%. These proportions have not shown significant change in the long term.
The proportion for applied research has continued to increase in France and U.K. in recent years. And in all countries, the R&D expenditure for basic re-search accounts for an extremely small proportion of the total.
Chart 1-4-4: R&D expenditure by type of R&D in the business enterprise sector for selected countries (for all industries)
Expenditure (Yen PPP) Proportion of expenditure by sector
(A) J
apan
(B) U
.S.
(C) G
erma
ny
Applied research
Development
0
2
4
6
8
10
12
14
1981 83 85 87 89 91 93 95 97 99 01 03 05 07
¥ trillions
2008
Basic research
FY
Applied research
Development
0%
20%
40%
60%
80%
100%
1981 83 85 87 89 91 93 95 97 99 01 03 05 07 2008
Basic researchFY
Applied research
Development
0
5
10
15
20
25
30
35
40
1981 83 85 87 89 91 93 95 97 99 01 03 05 07
¥ trillions
2008
Basic research
Year
Applied research
Development
0%
20%
40%
60%
80%
100%
1981 83 85 87 89 91 93 95 97 99 01 03 05 07 2008
Basic research
Year
Applied research
Development
Not classified yet
0
1
2
3
4
5
6
1981 83 85 87 89 91 93 95 97 99 01 03 05 07
¥ tirillions
2008
Basic researchYear
Applied research
Development
Not classified yet
0%
20%
40%
60%
80%
100%
1981 83 85 87 89 91 93 95 97 99 01 03 05 07 2008
Basic researchYear
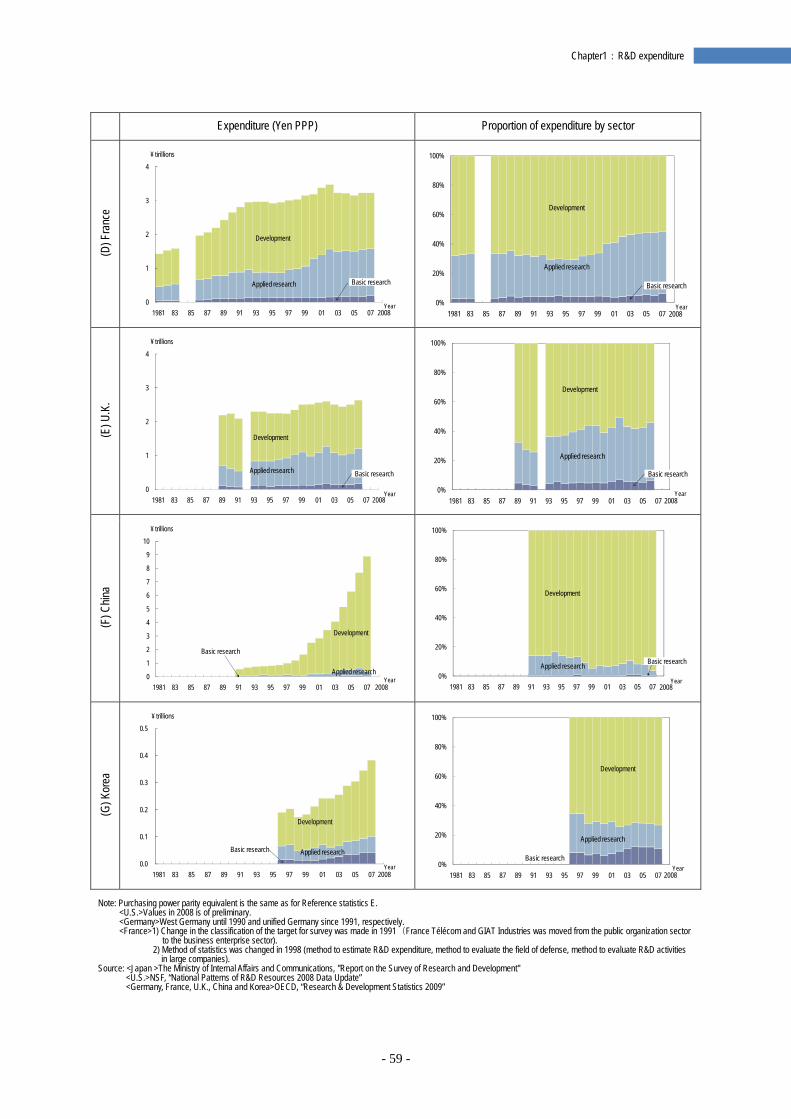
- 59 -
Chapter1:R&D expenditure
Expenditure (Yen PPP) Proportion of expenditure by sector
(D) F
ranc
e
(E) U
.K.
(F) C
hina
(G) K
orea
Note: Purchasing power parity equivalent is the same as for Reference statistics E.
<U.S.>Values in 2008 is of preliminary. <Germany>West Germany until 1990 and unified Germany since 1991, respectively. <France>1) Change in the classification of the target for survey was made in 1991(France Télécom and GIAT Industries was moved from the public organization sector
to the business enterprise sector). 2) Method of statistics was changed in 1998 (method to estimate R&D expenditure, method to evaluate the field of defense, method to evaluate R&D activities
in large companies). Source: <Japan >The Ministry of Internal Affairs and Communications, "Report on the Survey of Research and Development"
<U.S.>NSF, “National Patterns of R&D Resources 2008 Data Update” <Germany, France, U.K., China and Korea>OECD, “Research & Development Statistics 2009”
Applied research
Development
0
1
2
3
4
1981 83 85 87 89 91 93 95 97 99 01 03 05 07
¥ tirillions
2008
Basic research
Year
Applied research
Development
0%
20%
40%
60%
80%
100%
1981 83 85 87 89 91 93 95 97 99 01 03 05 07 2008
Basic research
Year
Applied research
Development
0
1
2
3
4
1981 83 85 87 89 91 93 95 97 99 01 03 05 07
¥ trillions
2008
Basic research
Year
Applied research
Development
0%
20%
40%
60%
80%
100%
1981 83 85 87 89 91 93 95 97 99 01 03 05 07 2008
Basic research
Year
Applied research
Development
0
1
2
3
4
5
6
7
8
9
10
1981 83 85 87 89 91 93 95 97 99 01 03 05 07
¥ trillions
2008
Basic research
Year
Applied research
Development
0%
20%
40%
60%
80%
100%
1981 83 85 87 89 91 93 95 97 99 01 03 05 07 2008
Basic research
Year
Applied research
Development
0.0
0.1
0.2
0.3
0.4
0.5
1981 83 85 87 89 91 93 95 97 99 01 03 05 07
¥ trillions
2008
Basic research
Year
Applied research
Development
0%
20%
40%
60%
80%
100%
1981 83 85 87 89 91 93 95 97 99 01 03 05 07 2008
Basic researchYear
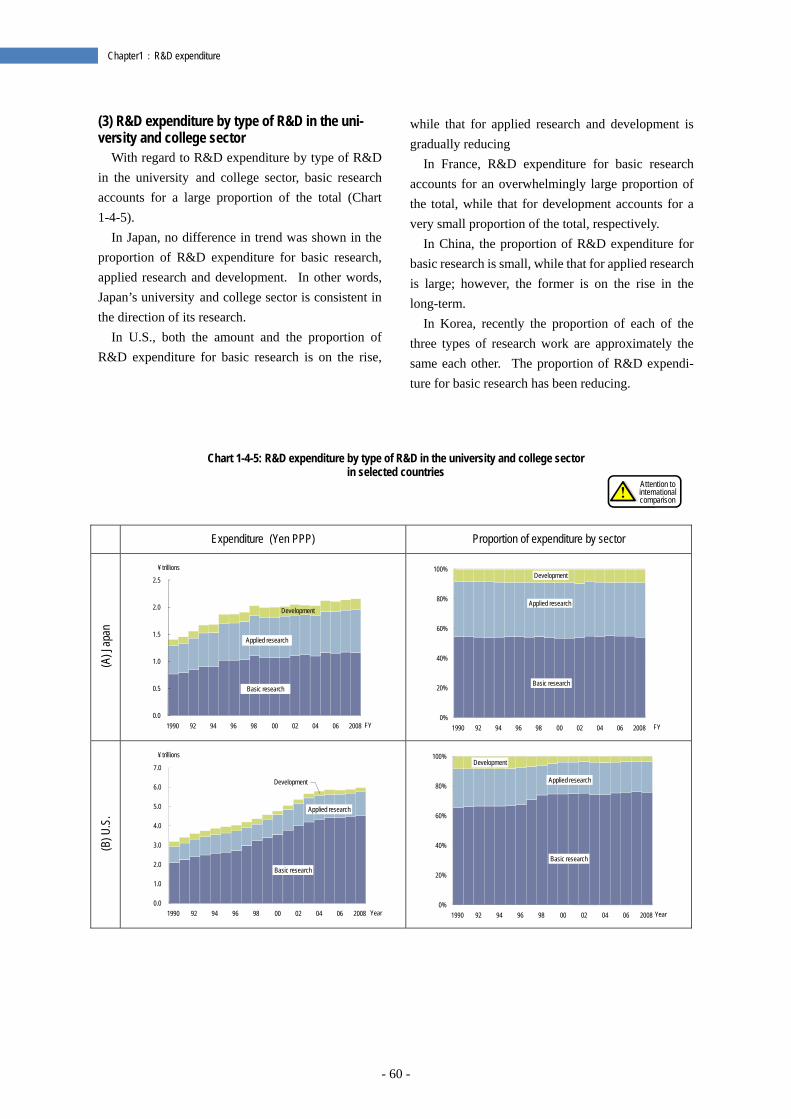
- 60 -
Chapter1:R&D expenditure
(3) R&D expenditure by type of R&D in the uni-versity and college sector
With regard to R&D expenditure by type of R&D in the university and college sector, basic research accounts for a large proportion of the total (Chart 1-4-5).
In Japan, no difference in trend was shown in the proportion of R&D expenditure for basic research, applied research and development. In other words, Japan’s university and college sector is consistent in the direction of its research.
In U.S., both the amount and the proportion of R&D expenditure for basic research is on the rise,
while that for applied research and development is gradually reducing
In France, R&D expenditure for basic research accounts for an overwhelmingly large proportion of the total, while that for development accounts for a very small proportion of the total, respectively.
In China, the proportion of R&D expenditure for basic research is small, while that for applied research is large; however, the former is on the rise in the long-term.
In Korea, recently the proportion of each of the three types of research work are approximately the same each other. The proportion of R&D expendi-ture for basic research has been reducing.
Chart 1-4-5: R&D expenditure by type of R&D in the university and college sector
in selected countries
Expenditure (Yen PPP) Proportion of expenditure by sector
(A) J
apan
(B) U
.S.
Development
0.0
0.5
1.0
1.5
2.0
2.5
1990 92 94 96 98 00 02 04 06 2008
¥ trillions
FY
Basic research
Applied research
Applied research
Development
0%
20%
40%
60%
80%
100%
1990 92 94 96 98 00 02 04 06 2008 FY
Basic research
0.0
1.0
2.0
3.0
4.0
5.0
6.0
7.0
1990 92 94 96 98 00 02 04 06 2008
¥ trillions
Year
Development
Basic research
Applied research
0%
20%
40%
60%
80%
100%
1990 92 94 96 98 00 02 04 06 2008 Year
Basic research
Applied research
Development
Attention to international comparison
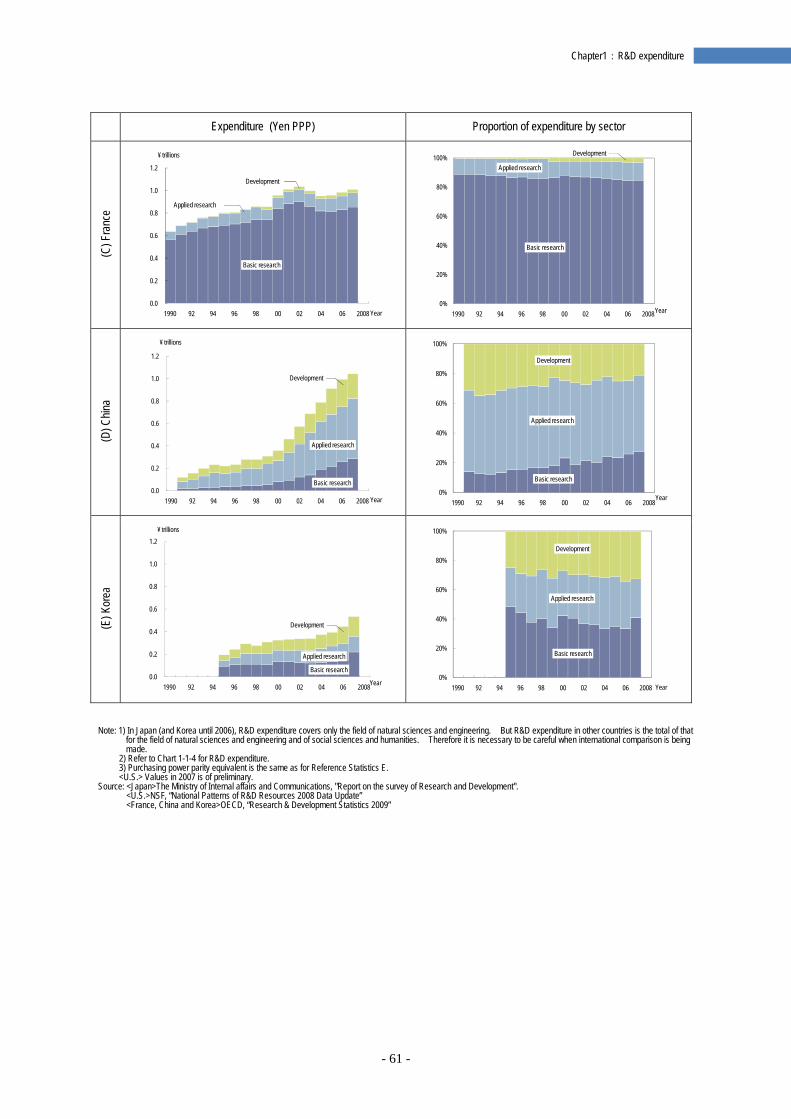
- 61 -
Chapter1:R&D expenditure
Expenditure (Yen PPP) Proportion of expenditure by sector
(C) F
ranc
e
(D) C
hina
(E) K
orea
Note: 1) In Japan (and Korea until 2006), R&D expenditure covers only the field of natural sciences and engineering. But R&D expenditure in other countries is the total of that
for the field of natural sciences and engineering and of social sciences and humanities. Therefore it is necessary to be careful when international comparison is being made.
2) Refer to Chart 1-1-4 for R&D expenditure. 3) Purchasing power parity equivalent is the same as for Reference Statistics E. <U.S.> Values in 2007 is of preliminary.
Source: <Japan>The Ministry of Internal affairs and Communications, "Report on the survey of Research and Development". <U.S.>NSF, “National Patterns of R&D Resources 2008 Data Update” <France, China and Korea>OECD, “Research & Development Statistics 2009”
0.0
0.2
0.4
0.6
0.8
1.0
1.2
1990 92 94 96 98 00 02 04 06 2008
¥ trillions
Year
Development
Basic research
Applied research
0%
20%
40%
60%
80%
100%
1990 92 94 96 98 00 02 04 06 2008 Year
Development
Basic research
Applied research
0.0
0.2
0.4
0.6
0.8
1.0
1.2
1990 92 94 96 98 00 02 04 06 2008
¥ trillions
Year
Basic research
Applied research
Development
0%
20%
40%
60%
80%
100%
1990 92 94 96 98 00 02 04 06 2008 Year
Basic research
Applied research
Development
0.0
0.2
0.4
0.6
0.8
1.0
1.2
1990 92 94 96 98 00 02 04 06 2008
¥ trillions
Year
Basic research
Applied research
Development
0%
20%
40%
60%
80%
100%
1990 92 94 96 98 00 02 04 06 2008 Year
Basic research
Applied research
Development

- 63 -
Chapter 2:R&D personnel
Chapter 2:R&D personnel Human resources, which are the basis for supporting scientific and technological activities, will be discussed
here. In this chapter, R&D personnel, and more specifically, the status of researchers and research assistants in Japan and in selected countries will be explained. Concerning the present available data on the number of re-searchers, there are differences in definition of a researcher, and the methods of measurement applied are not unified across each country. Therefore, it could be said that this data is not suitable for strict international com-parison. But even so, this data can be used to understand the condition of R&D personnel in each country if it is born in mind that there are differences in the scopes and levels of researchers in each country.
2.1 International comparison of the number of researchers in each country
Key points ○The definition and measurement of researchers in each country are conducted in line with the Frascati Ma-
nual. However, the actual methods used for the investigations are often different in each country. In partic-ular, the university and college sector are excluded from the coverage of R&D statistical surveys in some countries. Also some countries set special conditions regarding the scope of the range of the surveys. Also there are countries which apply the full-time equivalent (FTE) method in surveying the number of re-searchers. And there are other countries which apply actual head counting (HC) for this purpose. Therefore, it could be said that there are many contributing factors which reduce the performance of the international comparability. In addition, in U.S., the number of researchers belonging to some sectors is not reported to the OECD. This forces the OECD to utilize estimated figures as a substitute. For the reasons given above, it is necessary to be careful in making international comparisons and trend comparisons of the number of re-searchers.
○In 2009, the number of researchers in Japan was a total of about 660,000, if the number of researchers working at universities and colleges is calculated by using the FTE method. The number is about 890,000 in the head count method. In recent years, the number of researchers in China has greatly increased. But the number of researchers per capita still lags behind compared to the other selected countries.
○If comparing the number of researchers by sector, in every country, the business enterprise sector has the largest proportion. On the other hand, when studying the number of female researchers by sector, the per-centage hired by the business enterprise sector is small in every country.
2.1.1 Methods for measuring the number of re-searchers in each country
According to the Frascati Manual issued by the OECD, “researchers” are defined as “professionals engaged in the conception or creation of new know-ledge, products, processes, methods, and systems and engaged also in the management of the projects concerned (1).” (1) In Japan the definition of a “researcher” is based on the terms written on the “Report on the Survey of Research and Development” issued by the Ministry of Internal Affairs and Communications. In the statistics of this Ministry, the field of “research” is classified into “basic research”, “applied research”, and “development” and the “regular researchers” conducting such research are considered to be quite close to the “R&D scientists and engi-neers” mentioned in the Frascati Manual.
To measure the number of researchers, similar to the method adapted to measure R&D expenditure, a questionnaire survey is used in general, but for some sectors in some countries data obtained from other survey is used.
- 64 -
Chapter 2:R&D personnel
In addition, there are two kinds of methods used to measure the number of researchers. One method is to measure the research work by converting it into “full-time equivalents” (FTE)(2). In this case, R&D activities are separated from other activities and the number of hours engaged in actual R&D activity is used as the basis for measuring the number of re-searchers. This method is widely accepted interna-tionally, in which by giving consideration to the ac-tivities of the researchers, the measurement of the number of researchers is performed by deducting the time consumed for other activities besides R&D ac-tivity(3).
The other method is to classify all activities as R&D activities, even when the research content of work is combined with other activities, and to meas-ure the number of researchers according to the actual number found by head counting (HC).
Chart 2-1-1 shows the definition and measurement method of researchers for 4 sectors which are the same as the performing sectors of R&D expenditure in each country (The data for each country was measured by FTE conversion. And indication is giv-en in the exceptional cases where the HC value was utilized.). All the countries conduct their measure-ments of researchers according to the questionnaire survey as indicated in the Frascati Manual issued by the OECD and based on its definition of researchers. But in some sectors, questionnaire surveys were not performed or the FTE value measurements were not carried out, which caused the differences by country and by sector. In particular, differences can be clear-ly seen according to the country regarding the mea-surements of researchers working in the university and college sector.
(2) For example, for researchers working at higher educational institutes such as universities and colleges, there are many cases when they are engaged in education together with their research work. The way to meas-ure the manpower of the portion of activities engaged in actual research work rather than treating above mentioned kinds of researchers (called “part-time researchers”) as the same level as “full-time researchers” is called the “full-time equivalent”. Specifically, for example, if a researcher dedicates 60% of his/or her working time to R&D activities on annual basis, the value for this person as a researcher would be “0.6 people”. (3) In 1975, the OECD issued a recommendation that the full-time equiva-lent method should be applied to measure the manpower of researchers who are hired. The majority of OECD member countries have adopted the FTE method. The necessity of the FTE method and its principles are provided in the Frascati Manual issued by the OECD, which also provides international standards on the surveying methods for R&D statistics. The 2002 edition advises using both the HC and FTE methods.
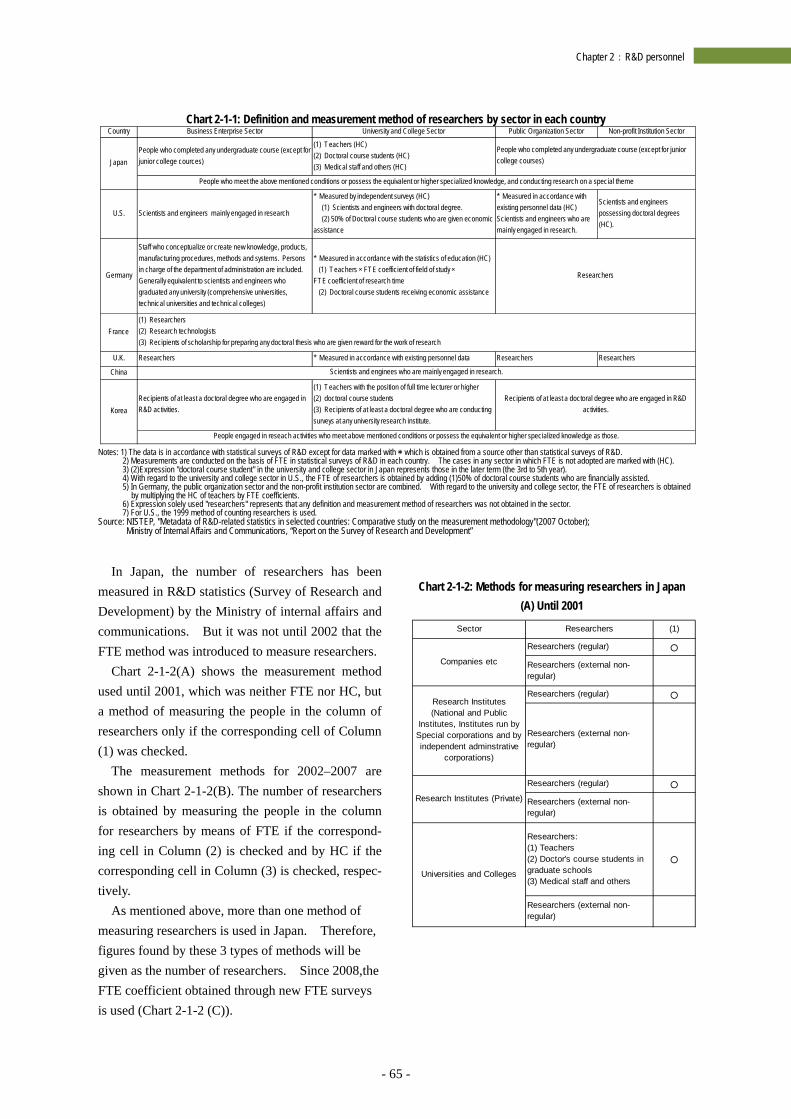
- 65 -
Chapter 2:R&D personnel
Chart 2-1-1: Definition and measurement method of researchers by sector in each country
Notes: 1) The data is in accordance with statistical surveys of R&D except for data marked with*which is obtained from a source other than statistical surveys of R&D.
2) Measurements are conducted on the basis of FTE in statistical surveys of R&D in each country. The cases in any sector in which FTE is not adopted are marked with (HC). 3) (2)Expression "doctoral course student" in the university and college sector in Japan represents those in the later term (the 3rd to 5th year). 4) With regard to the university and college sector in U.S., the FTE of researchers is obtained by adding (1)50% of doctoral course students who are financially assisted. 5) In Germany, the public organization sector and the non-profit institution sector are combined. With regard to the university and college sector, the FTE of researchers is obtained
by multiplying the HC of teachers by FTE coefficients. 6) Expression solely used "researchers" represents that any definition and measurement method of researchers was not obtained in the sector. 7) For U.S., the 1999 method of counting researchers is used.
Source: NISTEP, "Metadata of R&D-related statistics in selected countries: Comparative study on the measurement methodology"(2007 October); Ministry of Internal Affairs and Communications, “Report on the Survey of Research and Development”
In Japan, the number of researchers has been measured in R&D statistics (Survey of Research and Development) by the Ministry of internal affairs and communications. But it was not until 2002 that the FTE method was introduced to measure researchers.
Chart 2-1-2(A) shows the measurement method used until 2001, which was neither FTE nor HC, but a method of measuring the people in the column of researchers only if the corresponding cell of Column (1) was checked.
The measurement methods for 2002–2007 are shown in Chart 2-1-2(B). The number of researchers is obtained by measuring the people in the column for researchers by means of FTE if the correspond-ing cell in Column (2) is checked and by HC if the corresponding cell in Column (3) is checked, respec-tively.
As mentioned above, more than one method of measuring researchers is used in Japan. Therefore, figures found by these 3 types of methods will be given as the number of researchers. Since 2008,the FTE coefficient obtained through new FTE surveys is used (Chart 2-1-2 (C)).
Chart 2-1-2: Methods for measuring researchers in Japan (A) Until 2001
Country Business Enterprise Sector University and College Sector Public Organization Sector Non-profit Institution Sector
People who completed any undergraduate course (except forjunior college cources)
(1) Teachers (HC)(2) Doctoral course students (HC)(3) Medical staff and others (HC)
U.S. Scientists and engineers mainly engaged in research
* Measured by independent surveys (HC) (1) Scientists and engineers with doctoral degree. (2) 50% of Doctoral course students who are given economicassistance
* Measured in accordance withexisting personnel data (HC)Scientists and engineers who aremainly engaged in research.
Scientists and engineerspossessing doctoral degrees(HC).
Germany
Staff who conceptualize or create new knowledge, products,manufacturing procedures, methods and systems. Personsin charge of the department of administration are included.Generally equivalent to scientists and engineers whograduated any university (comprehensive universities,technical universities and technical colleges)
* Measured in accordance with the statistics of education (HC) (1) Teachers × FTE coefficient of field of study ×FTE coefficient of research time (2) Doctoral course students receiving economic assistance
Researchers
France
U.K. Researchers * Measured in accordance with existing personnel data Researchers Researchers
China
Recipients of at least a doctoral degree who are engaged inR&D activities.
(1) Teachers with the position of full time lecturer or higher(2) doctoral course students(3) Recipients of at least a doctoral degree who are conductingsurveys at any university research institute.
Scientists and enginees who are mainly engaged in research.
KoreaRecipients of at least a doctoral degree who are engaged in R&D
activities.
People engaged in reseach activities who meet above mentioned conditions or possess the equivalent or higher specialized knowledge as those.
JapanPeople who completed any undergraduate course (except for juniorcollege courses)
People who meet the above mentioned conditions or possess the equivalent or higher specialized knowledge, and conducting research on a special theme
(1) Researchers(2) Research technologists(3) Recipients of scholarship for preparing any doctoral thesis who are given reward for the work of research
Sector Researchers (1)
Researchers (regular) ○
Researchers (external non-regular)
Researchers (regular) ○
Researchers (external non-regular)
Researchers (regular) ○
Researchers (external non-regular)
Researchers:(1) Teachers(2) Doctor's course students ingraduate schools(3) Medical staff and others
○
Researchers (external non-regular)
Companies etc
Research Institutes(National and Public
Institutes, Institutes run bySpecial corporations and byindependent adminstrative
corporations)
Research Institutes (Private)
Universities and Colleges
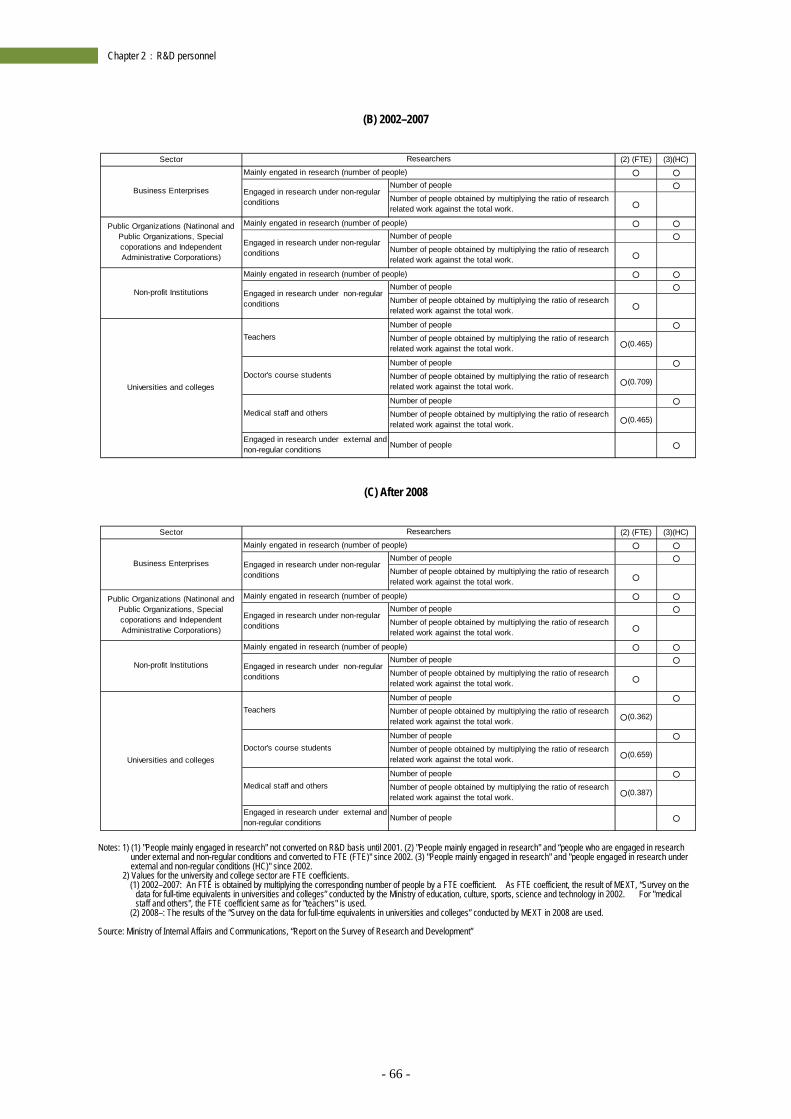
- 66 -
Chapter 2:R&D personnel
(B) 2002–2007
(C) After 2008
Notes: 1) (1) "People mainly engaged in research" not converted on R&D basis until 2001. (2) "People mainly engaged in research" and “people who are engaged in research
under external and non-regular conditions and converted to FTE (FTE)" since 2002. (3) "People mainly engaged in research" and "people engaged in research under external and non-regular conditions (HC)" since 2002.
2) Values for the university and college sector are FTE coefficients. (1) 2002–2007: An FTE is obtained by multiplying the corresponding number of people by a FTE coefficient. As FTE coefficient, the result of MEXT, “Survey on the
data for full-time equivalents in universities and colleges” conducted by the Ministry of education, culture, sports, science and technology in 2002. For "medical staff and others", the FTE coefficient same as for "teachers" is used.
(2) 2008–: The results of the “Survey on the data for full-time equivalents in universities and colleges” conducted by MEXT in 2008 are used.
Source: Ministry of Internal Affairs and Communications, “Report on the Survey of Research and Development”
Sector (2) (FTE) (3)(HC)Mainly engated in research (number of people) ○ ○
Number of people ○
Number of people obtained by multiplying the ratio of researchrelated work against the total work. ○
Mainly engated in research (number of people) ○ ○
Number of people ○
Number of people obtained by multiplying the ratio of researchrelated work against the total work. ○
Mainly engated in research (number of people) ○ ○
Number of people ○
Number of people obtained by multiplying the ratio of researchrelated work against the total work. ○
Number of people ○
Number of people obtained by multiplying the ratio of researchrelated work against the total work. ○(0.465)
Number of people ○
Number of people obtained by multiplying the ratio of researchrelated work against the total work. ○(0.709)
Number of people ○
Number of people obtained by multiplying the ratio of researchrelated work against the total work. ○(0.465)
Engaged in research under external andnon-regular conditions Number of people ○
Engaged in research under non-regularconditions
Non-profit Institutions
Engaged in research under non-regularconditions
Engaged in research under non-regularconditions
Business Enterprises
Public Organizations (Natinonal andPublic Organizations, Specialcoporations and IndependentAdministrative Corporations)
Researchers
Teachers
Universities and collegesDoctor's course students
Medical staff and others
Sector (2) (FTE) (3)(HC)Mainly engated in research (number of people) ○ ○
Number of people ○
Number of people obtained by multiplying the ratio of researchrelated work against the total work. ○
Mainly engated in research (number of people) ○ ○
Number of people ○
Number of people obtained by multiplying the ratio of researchrelated work against the total work. ○
Mainly engated in research (number of people) ○ ○
Number of people ○
Number of people obtained by multiplying the ratio of researchrelated work against the total work. ○
Number of people ○
Number of people obtained by multiplying the ratio of researchrelated work against the total work. ○(0.362)
Number of people ○
Number of people obtained by multiplying the ratio of researchrelated work against the total work. ○(0.659)
Number of people ○
Number of people obtained by multiplying the ratio of researchrelated work against the total work. ○(0.387)
Engaged in research under external andnon-regular conditions Number of people ○
Non-profit Institutions Engaged in research under non-regularconditions
Universities and colleges
Teachers
Doctor's course students
Medical staff and others
Business Enterprises Engaged in research under non-regularconditions
Public Organizations (Natinonal andPublic Organizations, Specialcoporations and IndependentAdministrative Corporations)
Engaged in research under non-regularconditions
Researchers
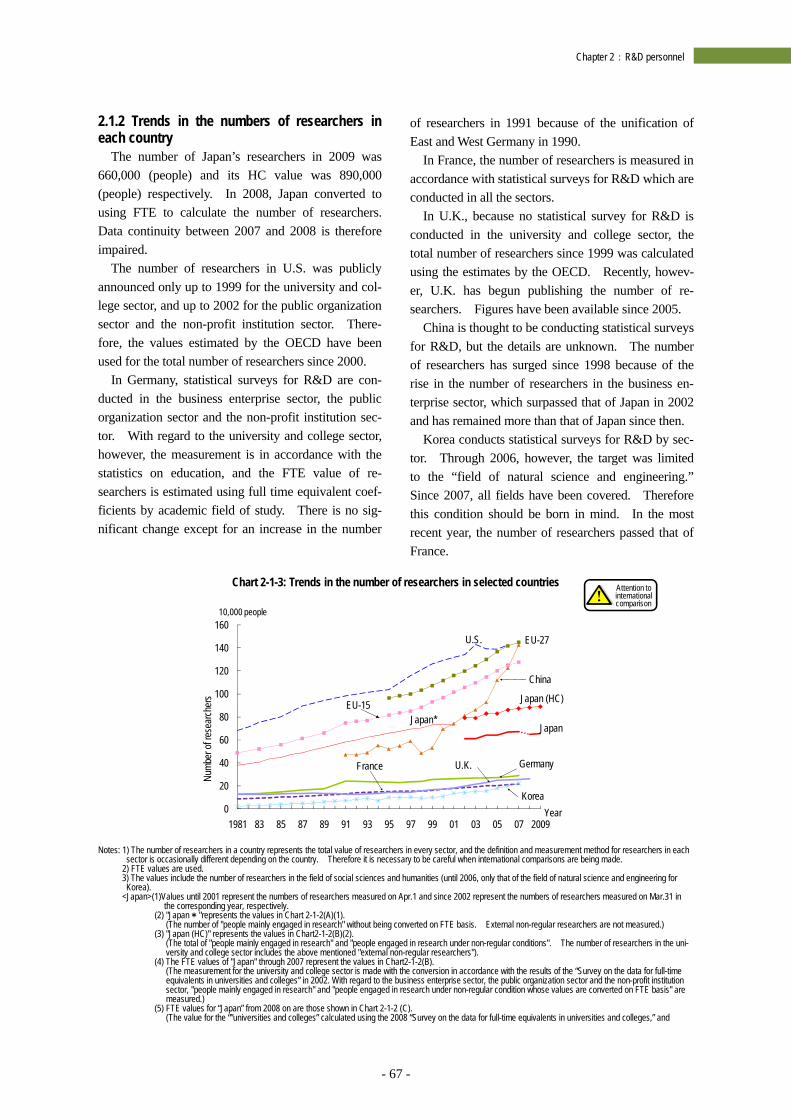
- 67 -
Chapter 2:R&D personnel
2.1.2 Trends in the numbers of researchers in each country
The number of Japan’s researchers in 2009 was 660,000 (people) and its HC value was 890,000 (people) respectively. In 2008, Japan converted to using FTE to calculate the number of researchers. Data continuity between 2007 and 2008 is therefore impaired.
The number of researchers in U.S. was publicly announced only up to 1999 for the university and col-lege sector, and up to 2002 for the public organization sector and the non-profit institution sector. There-fore, the values estimated by the OECD have been used for the total number of researchers since 2000.
In Germany, statistical surveys for R&D are con-ducted in the business enterprise sector, the public organization sector and the non-profit institution sec-tor. With regard to the university and college sector, however, the measurement is in accordance with the statistics on education, and the FTE value of re-searchers is estimated using full time equivalent coef-ficients by academic field of study. There is no sig-nificant change except for an increase in the number
of researchers in 1991 because of the unification of East and West Germany in 1990.
In France, the number of researchers is measured in accordance with statistical surveys for R&D which are conducted in all the sectors.
In U.K., because no statistical survey for R&D is conducted in the university and college sector, the total number of researchers since 1999 was calculated using the estimates by the OECD. Recently, howev-er, U.K. has begun publishing the number of re-searchers. Figures have been available since 2005.
China is thought to be conducting statistical surveys for R&D, but the details are unknown. The number of researchers has surged since 1998 because of the rise in the number of researchers in the business en-terprise sector, which surpassed that of Japan in 2002 and has remained more than that of Japan since then.
Korea conducts statistical surveys for R&D by sec-tor. Through 2006, however, the target was limited to the “field of natural science and engineering.” Since 2007, all fields have been covered. Therefore this condition should be born in mind. In the most recent year, the number of researchers passed that of France.
Chart 2-1-3: Trends in the number of researchers in selected countries
Notes: 1) The number of researchers in a country represents the total value of researchers in every sector, and the definition and measurement method for researchers in each
sector is occasionally different depending on the country. Therefore it is necessary to be careful when international comparisons are being made. 2) FTE values are used. 3) The values include the number of researchers in the field of social sciences and humanities (until 2006, only that of the field of natural science and engineering for Korea).
<Japan>(1)Values until 2001 represent the numbers of researchers measured on Apr.1 and since 2002 represent the numbers of researchers measured on Mar.31 in the corresponding year, respectively.
(2) "Japan*"represents the values in Chart 2-1-2(A)(1). (The number of "people mainly engaged in research" without being converted on FTE basis. External non-regular researchers are not measured.) (3) "Japan (HC)" represents the values in Chart2-1-2(B)(2). (The total of "people mainly engaged in research" and "people engaged in research under non-regular conditions". The number of researchers in the uni-
versity and college sector includes the above mentioned "external non-regular researchers"). (4) The FTE values of "Japan" through 2007 represent the values in Chart2-1-2(B).
(The measurement for the university and college sector is made with the conversion in accordance with the results of the “Survey on the data for full-time equivalents in universities and colleges” in 2002. With regard to the business enterprise sector, the public organization sector and the non-profit institution sector, "people mainly engaged in research" and "people engaged in research under non-regular condition whose values are converted on FTE basis" are measured.)
(5) FTE values for “Japan” from 2008 on are those shown in Chart 2-1-2 (C). (The value for the “”universities and colleges” calculated using the 2008 “Survey on the data for full-time equivalents in universities and colleges,” and
Japan*Japan
0
20
40
60
80
100
120
140
160
1981 83 85 87 89 91 93 95 97 99 01 03 05 07 2009
Numb
er of
rese
arch
ers
10,000 people
Year
U.S.
Japan (HC)
GermanyFrance U.K.
China
EU-15
Korea
EU-27
Attention to international comparison
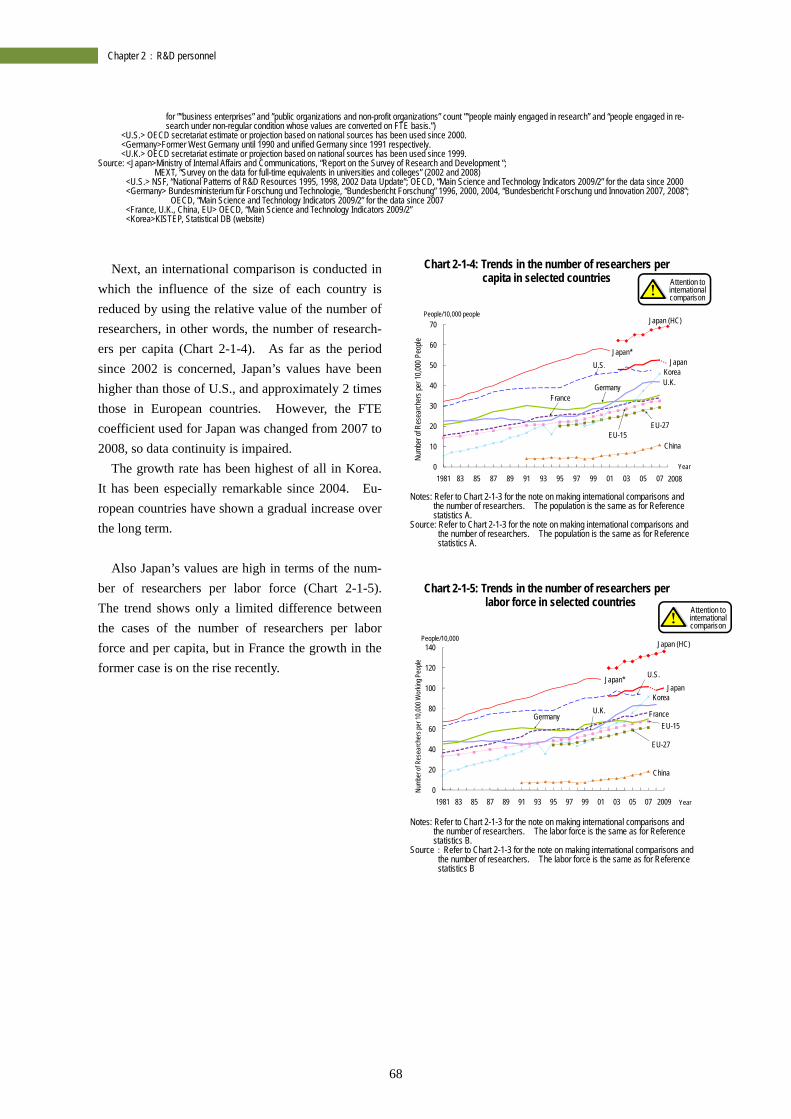
68
Chapter 2:R&D personnel
for ”“business enterprises” and ”public organizations and non-profit organizations” count ”“people mainly engaged in research” and “people engaged in re-search under non-regular condition whose values are converted on FTE basis.”)
<U.S.> OECD secretariat estimate or projection based on national sources has been used since 2000. <Germany>Former West Germany until 1990 and unified Germany since 1991 respectively. <U.K.> OECD secretariat estimate or projection based on national sources has been used since 1999.
Source: <Japan>Ministry of Internal Affairs and Communications, “Report on the Survey of Research and Development ”; MEXT, “Survey on the data for full-time equivalents in universities and colleges” (2002 and 2008)
<U.S.> NSF, “National Patterns of R&D Resources 1995, 1998, 2002 Data Update”; OECD, “Main Science and Technology Indicators 2009/2” for the data since 2000 <Germany> Bundesministerium für Forschung und Technologie, “Bundesbericht Forschung” 1996, 2000, 2004, “Bundesbericht Forschung und Innovation 2007, 2008”;
OECD, “Main Science and Technology Indicators 2009/2” for the data since 2007 <France, U.K., China, EU> OECD, “Main Science and Technology Indicators 2009/2” <Korea>KISTEP, Statistical DB (website)
Next, an international comparison is conducted in which the influence of the size of each country is reduced by using the relative value of the number of researchers, in other words, the number of research-ers per capita (Chart 2-1-4). As far as the period since 2002 is concerned, Japan’s values have been higher than those of U.S., and approximately 2 times those in European countries. However, the FTE coefficient used for Japan was changed from 2007 to 2008, so data continuity is impaired.
The growth rate has been highest of all in Korea. It has been especially remarkable since 2004. Eu-ropean countries have shown a gradual increase over the long term.
Also Japan’s values are high in terms of the num-
ber of researchers per labor force (Chart 2-1-5). The trend shows only a limited difference between the cases of the number of researchers per labor force and per capita, but in France the growth in the former case is on the rise recently.
Chart 2-1-4: Trends in the number of researchers per capita in selected countries
Notes: Refer to Chart 2-1-3 for the note on making international comparisons and
the number of researchers. The population is the same as for Reference statistics A.
Source: Refer to Chart 2-1-3 for the note on making international comparisons and the number of researchers. The population is the same as for Reference statistics A.
Chart 2-1-5: Trends in the number of researchers per
labor force in selected countries
Notes: Refer to Chart 2-1-3 for the note on making international comparisons and
the number of researchers. The labor force is the same as for Reference statistics B.
Source:Refer to Chart 2-1-3 for the note on making international comparisons and the number of researchers. The labor force is the same as for Reference statistics B
Japan (HC)
Japan*
0
10
20
30
40
50
60
70
1981 83 85 87 89 91 93 95 97 99 01 03 05 07
Numb
er of
Res
earch
ers p
er 1
0,000
Peo
ple
2008
People/10,000 people
U.S.
GermanyFrance
U.K.
EU-15China
Japan
EU-27
Korea
Year
Japan*
0
20
40
60
80
100
120
140
1981 83 85 87 89 91 93 95 97 99 01 03 05 07 2009
Numb
er of
Res
earch
ers p
er 10
,000
Wor
king P
eople
People/10,000
Year
U.S.
Japan (HC)
Germany FranceU.K.
EU-15
China
Japan
EU-27
Korea
Attention to international comparison
Attention to international comparison
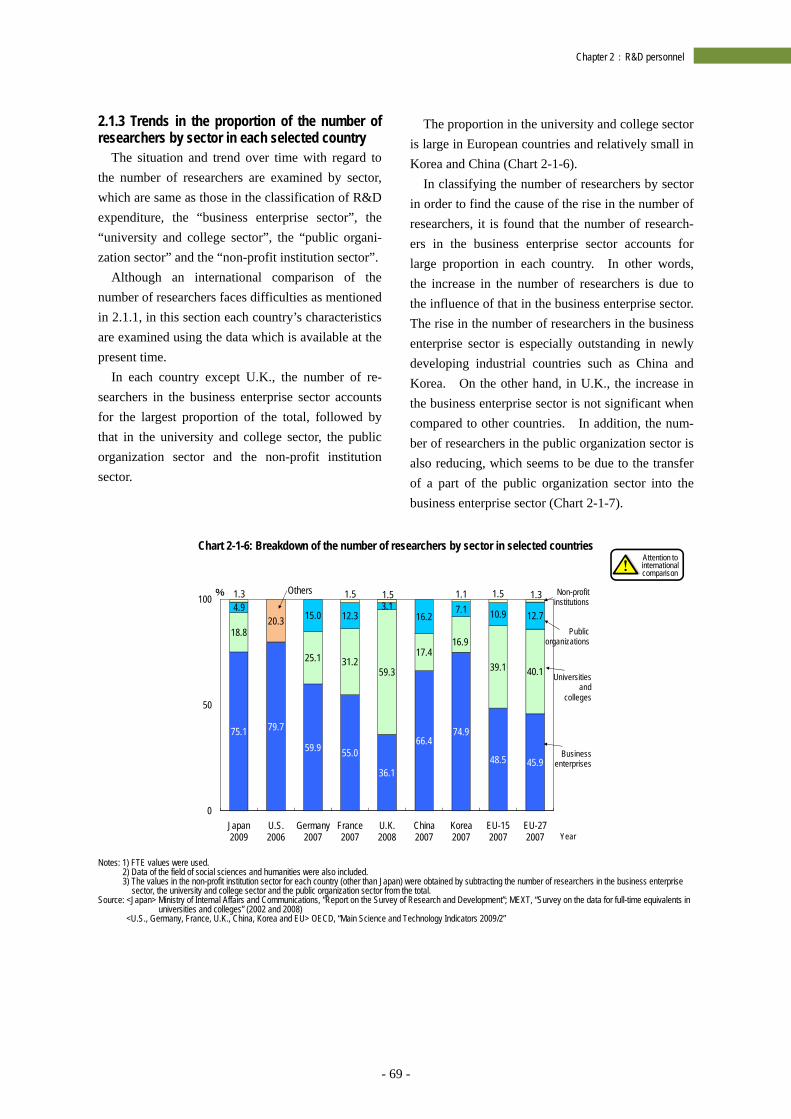
- 69 -
Chapter 2:R&D personnel
2.1.3 Trends in the proportion of the number of researchers by sector in each selected country
The situation and trend over time with regard to the number of researchers are examined by sector, which are same as those in the classification of R&D expenditure, the “business enterprise sector”, the “university and college sector”, the “public organi-zation sector” and the “non-profit institution sector”.
Although an international comparison of the number of researchers faces difficulties as mentioned in 2.1.1, in this section each country’s characteristics are examined using the data which is available at the present time.
In each country except U.K., the number of re-searchers in the business enterprise sector accounts for the largest proportion of the total, followed by that in the university and college sector, the public organization sector and the non-profit institution sector.
The proportion in the university and college sector is large in European countries and relatively small in Korea and China (Chart 2-1-6).
In classifying the number of researchers by sector in order to find the cause of the rise in the number of researchers, it is found that the number of research-ers in the business enterprise sector accounts for large proportion in each country. In other words, the increase in the number of researchers is due to the influence of that in the business enterprise sector. The rise in the number of researchers in the business enterprise sector is especially outstanding in newly developing industrial countries such as China and Korea. On the other hand, in U.K., the increase in the business enterprise sector is not significant when compared to other countries. In addition, the num-ber of researchers in the public organization sector is also reducing, which seems to be due to the transfer of a part of the public organization sector into the business enterprise sector (Chart 2-1-7).
Chart 2-1-6: Breakdown of the number of researchers by sector in selected countries
Notes: 1) FTE values were used.
2) Data of the field of social sciences and humanities were also included. 3) The values in the non-profit institution sector for each country (other than Japan) were obtained by subtracting the number of researchers in the business enterprise
sector, the university and college sector and the public organization sector from the total. Source: <Japan> Ministry of Internal Affairs and Communications, “Report on the Survey of Research and Development”; MEXT, “Survey on the data for full-time equivalents in
universities and colleges” (2002 and 2008) <U.S., Germany, France, U.K., China, Korea and EU> OECD, “Main Science and Technology Indicators 2009/2”
75.1 79.7
59.9 55.0
36.1
66.474.9
48.5 45.9
18.8
25.1 31.259.3
17.416.9
39.1 40.1
4.915.0 12.3
3.116.2
7.1 10.9 12.7
1.3 1.5 1.5 1.1 1.5 1.3
20.3
0
50
100
Japan2009
U.S.2006
Germany2007
France2007
U.K.2008
China2007
Korea2007
EU-152007
EU-272007
% Non-profit institutions
Public organizations
Universitiesand
colleges
Business enterprises
Others
Year
Attention to international comparison
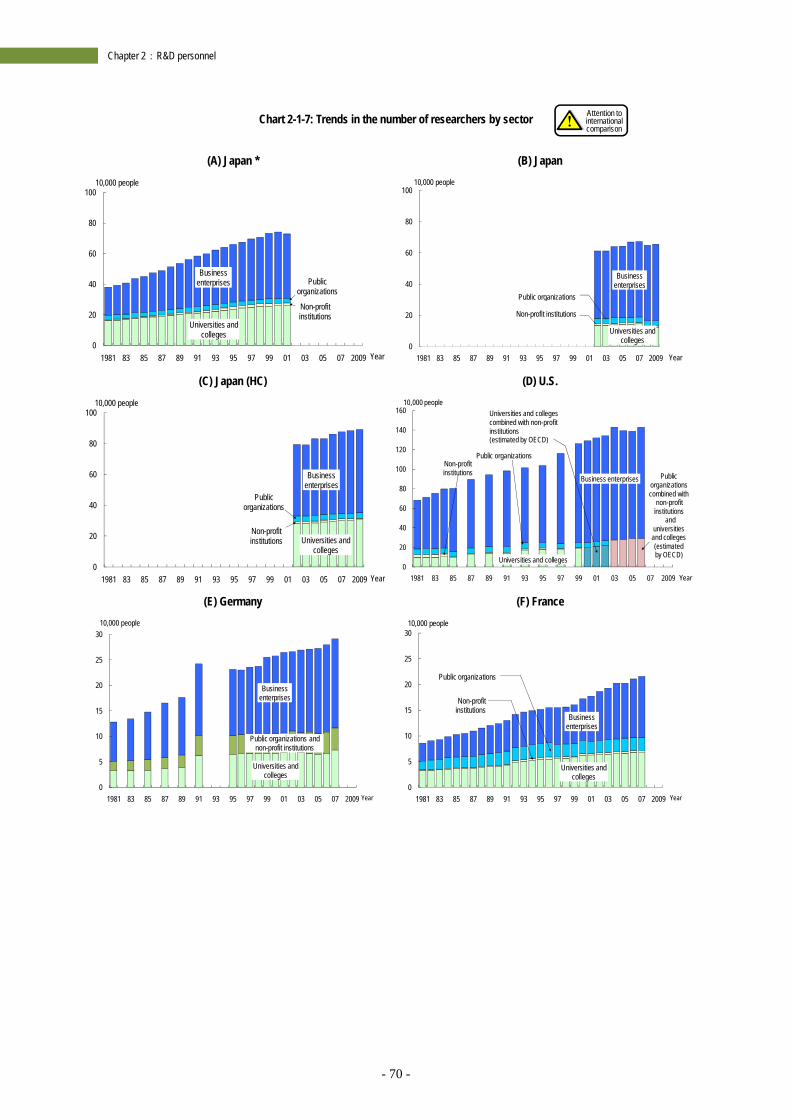
- 70 -
Chapter 2:R&D personnel
Chart 2-1-7: Trends in the number of researchers by sector
(A) Japan * (B) Japan
(C) Japan (HC) (D) U.S.
(E) Germany (F) France
Universities and colleges
Non-profit institutions
Public organizations
Business enterprises
0
20
40
60
80
100
1981 83 85 87 89 91 93 95 97 99 01 03 05 07 2009
10,000 people
Year
Universities and colleges
Business enterprises
0
20
40
60
80
100
1981 83 85 87 89 91 93 95 97 99 01 03 05 07 2009
10,000 people
Year
Non-profit institutions
Public organizations
Universities and colleges
Non-profit institutions
Public organizations
Business enterprises
0
20
40
60
80
100
1981 83 85 87 89 91 93 95 97 99 01 03 05 07 2009
10,000 people
Year
Publicorganizations combined with
non-profit institutions
and universitiesand colleges (estimated by OECD)
Non-profit institutions
Public organizations
Business enterprises
0
20
40
60
80
100
120
140
160
1981 83 85 87 89 91 93 95 97 99 01 03 05 07 2009
10,000 people
Year
Universities and colleges
Universities and colleges combined with non-profit institutions (estimated by OECD)
Universities and colleges
Business enterprises
0
5
10
15
20
25
30
1981 83 85 87 89 91 93 95 97 99 01 03 05 07 2009
10,000 people
Year
Public organizations and non-profit institutions
Universities and colleges
Business enterprises
0
5
10
15
20
25
30
1981 83 85 87 89 91 93 95 97 99 01 03 05 07 2009
10,000 people
Year
Public organizations
Non-profit institutions
Attention to international comparison
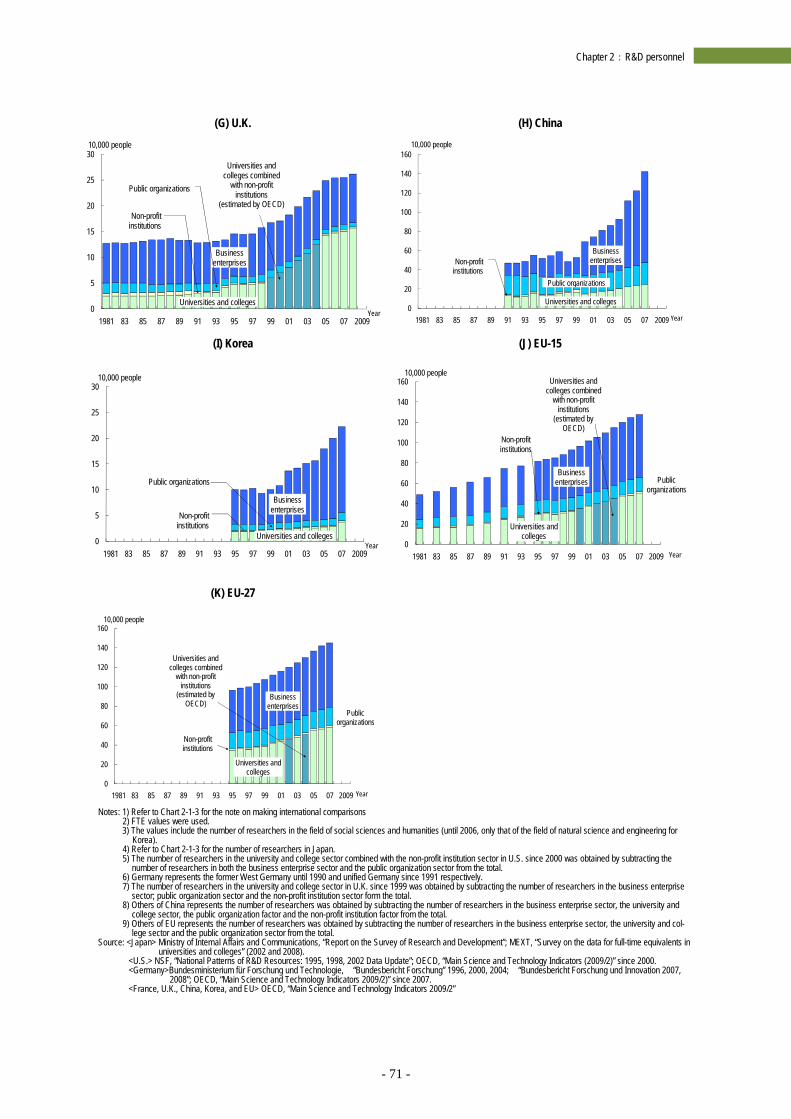
- 71 -
Chapter 2:R&D personnel
(G) U.K. (H) China
(I) Korea (J) EU-15
(K) EU-27
Notes: 1) Refer to Chart 2-1-3 for the note on making international comparisons 2) FTE values were used. 3) The values include the number of researchers in the field of social sciences and humanities (until 2006, only that of the field of natural science and engineering for
Korea). 4) Refer to Chart 2-1-3 for the number of researchers in Japan. 5) The number of researchers in the university and college sector combined with the non-profit institution sector in U.S. since 2000 was obtained by subtracting the
number of researchers in both the business enterprise sector and the public organization sector from the total. 6) Germany represents the former West Germany until 1990 and unified Germany since 1991 respectively. 7) The number of researchers in the university and college sector in U.K. since 1999 was obtained by subtracting the number of researchers in the business enterprise
sector; public organization sector and the non-profit institution sector form the total. 8) Others of China represents the number of researchers was obtained by subtracting the number of researchers in the business enterprise sector, the university and
college sector, the public organization factor and the non-profit institution factor from the total. 9) Others of EU represents the number of researchers was obtained by subtracting the number of researchers in the business enterprise sector, the university and col-
lege sector and the public organization sector from the total. Source: <Japan> Ministry of Internal Affairs and Communications, “Report on the Survey of Research and Development”; MEXT, “Survey on the data for full-time equivalents in
universities and colleges” (2002 and 2008). <U.S.> NSF, “National Patterns of R&D Resources: 1995, 1998, 2002 Data Update”; OECD, “Main Science and Technology Indicators (2009/2)” since 2000. <Germany>Bundesministerium für Forschung und Technologie, “Bundesbericht Forschung” 1996, 2000, 2004; “Bundesbericht Forschung und Innovation 2007,
2008”; OECD, “Main Science and Technology Indicators 2009/2)” since 2007. <France, U.K., China, Korea, and EU> OECD, “Main Science and Technology Indicators 2009/2”
Business enterprises
0
5
10
15
20
25
30
1981 83 85 87 89 91 93 95 97 99 01 03 05 07 2009
10,000 people
Year
Public organizations
Non-profit institutions
Universities and colleges combined
with non-profit institutions
(estimated by OECD)
Universities and colleges
Business enterprises
0
20
40
60
80
100
120
140
160
1981 83 85 87 89 91 93 95 97 99 01 03 05 07 2009
10,000 people
Year
Non-profit institutions
Public organizations
Universities and colleges
Business enterprises
0
5
10
15
20
25
30
1981 83 85 87 89 91 93 95 97 99 01 03 05 07 2009
10,000 people
Year
Public organizations
Non-profit institutions
Universities and collegesUniversities and
colleges
Non-profit institutions
Universities and colleges combined
with non-profit institutions
(estimated by OECD)
Public organizations
Business enterprises
0
20
40
60
80
100
120
140
160
1981 83 85 87 89 91 93 95 97 99 01 03 05 07 2009
10,000 people
Year
Universities and colleges combined
with non-profit institutions
(estimated by OECD)
Universities and colleges
Non-profit institutions
Public organizations
Business enterprises
0
20
40
60
80
100
120
140
160
1981 83 85 87 89 91 93 95 97 99 01 03 05 07 2009
10,000 people
Year
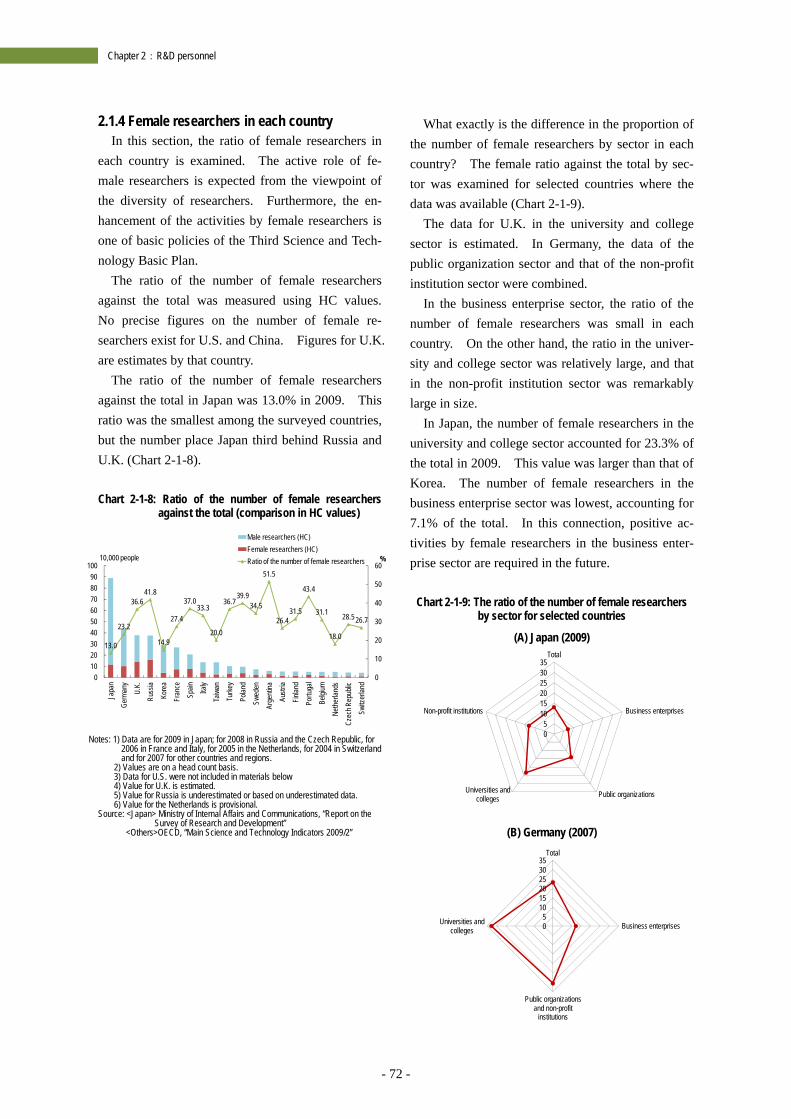
- 72 -
Chapter 2:R&D personnel
2.1.4 Female researchers in each country In this section, the ratio of female researchers in
each country is examined. The active role of fe-male researchers is expected from the viewpoint of the diversity of researchers. Furthermore, the en-hancement of the activities by female researchers is one of basic policies of the Third Science and Tech-nology Basic Plan.
The ratio of the number of female researchers against the total was measured using HC values. No precise figures on the number of female re-searchers exist for U.S. and China. Figures for U.K. are estimates by that country.
The ratio of the number of female researchers against the total in Japan was 13.0% in 2009. This ratio was the smallest among the surveyed countries, but the number place Japan third behind Russia and U.K. (Chart 2-1-8). Chart 2-1-8: Ratio of the number of female researchers
against the total (comparison in HC values)
Notes: 1) Data are for 2009 in Japan; for 2008 in Russia and the Czech Republic, for
2006 in France and Italy, for 2005 in the Netherlands, for 2004 in Switzerland and for 2007 for other countries and regions.
2) Values are on a head count basis. 3) Data for U.S. were not included in materials below 4) Value for U.K. is estimated. 5) Value for Russia is underestimated or based on underestimated data. 6) Value for the Netherlands is provisional.
Source: <Japan> Ministry of Internal Affairs and Communications, “Report on the Survey of Research and Development”
<Others>OECD, “Main Science and Technology Indicators 2009/2”
What exactly is the difference in the proportion of the number of female researchers by sector in each country? The female ratio against the total by sec-tor was examined for selected countries where the data was available (Chart 2-1-9).
The data for U.K. in the university and college sector is estimated. In Germany, the data of the public organization sector and that of the non-profit institution sector were combined.
In the business enterprise sector, the ratio of the number of female researchers was small in each country. On the other hand, the ratio in the univer-sity and college sector was relatively large, and that in the non-profit institution sector was remarkably large in size.
In Japan, the number of female researchers in the university and college sector accounted for 23.3% of the total in 2009. This value was larger than that of Korea. The number of female researchers in the business enterprise sector was lowest, accounting for 7.1% of the total. In this connection, positive ac-tivities by female researchers in the business enter-prise sector are required in the future.
Chart 2-1-9: The ratio of the number of female researchers by sector for selected countries
(A) Japan (2009)
(B) Germany (2007)
13.0
23.2
36.6 41.8
14.9
27.4
37.0 33.3
20.0
36.7 39.9
34.5
51.5
26.4 31.5
43.4
31.1
18.0
28.5 26.7
0
10
20
30
40
50
60
0102030405060708090
100
Japa
nGe
rman
yU.
K.Ru
ssia
Kore
aFr
ance
Spain Ita
lyTa
iwan
Turk
eyPo
land
Swed
enAr
gent
inaAu
stria
Finlan
dPo
rtuga
lBe
lgium
Neth
erlan
dsCz
ech R
epub
licSw
itzer
land
%10,000 people
Male researchers (HC)Female researchers (HC)Ratio of the number of female researchers
05
101520253035
Total
Business enterprises
Public organizationsUniversities and colleges
Non-profit institutions
05
101520253035
Total
Business enterprises
Public organizations and non-profit
institutions
Universities and colleges
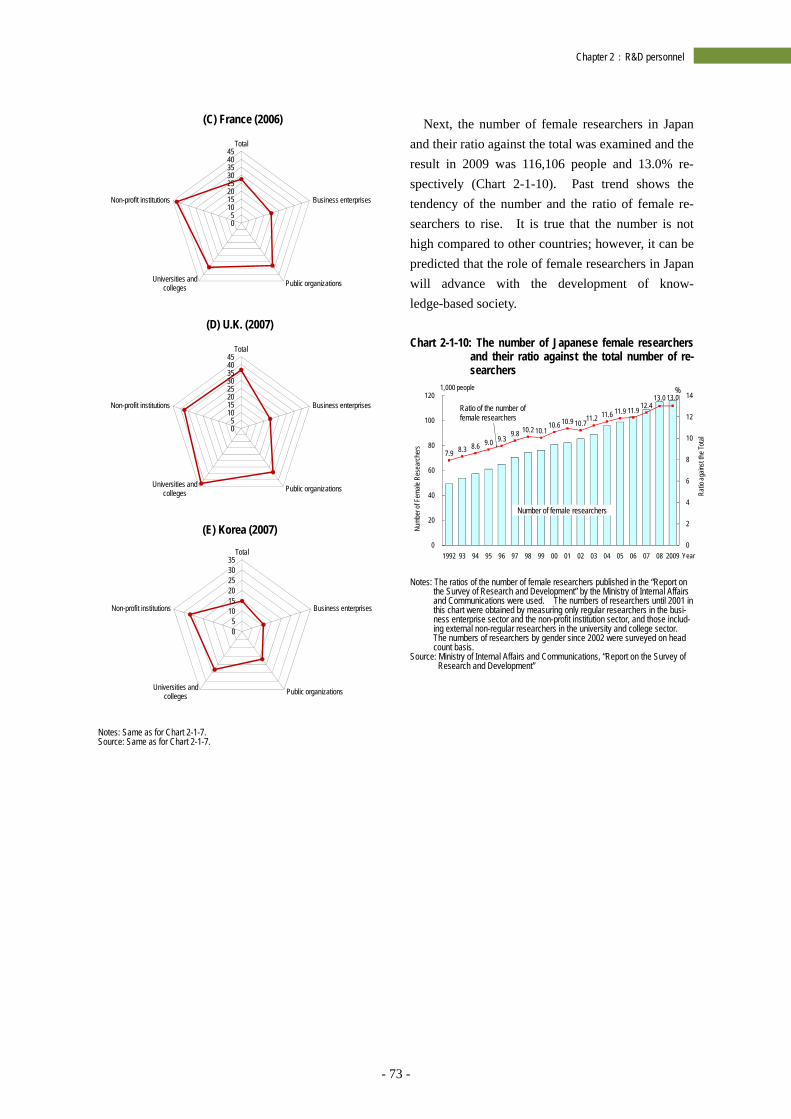
- 73 -
Chapter 2:R&D personnel
(C) France (2006)
(D) U.K. (2007)
(E) Korea (2007)
Notes: Same as for Chart 2-1-7. Source: Same as for Chart 2-1-7.
Next, the number of female researchers in Japan and their ratio against the total was examined and the result in 2009 was 116,106 people and 13.0% re-spectively (Chart 2-1-10). Past trend shows the tendency of the number and the ratio of female re-searchers to rise. It is true that the number is not high compared to other countries; however, it can be predicted that the role of female researchers in Japan will advance with the development of know-ledge-based society. Chart 2-1-10: The number of Japanese female researchers
and their ratio against the total number of re-searchers
Notes: The ratios of the number of female researchers published in the “Report on
the Survey of Research and Development” by the Ministry of Internal Affairs and Communications were used. The numbers of researchers until 2001 in this chart were obtained by measuring only regular researchers in the busi-ness enterprise sector and the non-profit institution sector, and those includ-ing external non-regular researchers in the university and college sector. The numbers of researchers by gender since 2002 were surveyed on head count basis.
Source: Ministry of Internal Affairs and Communications, “Report on the Survey of Research and Development”
05
1015202530354045
Total
Business enterprises
Public organizationsUniversities and colleges
Non-profit institutions
05
1015202530354045
Total
Business enterprises
Public organizationsUniversities and colleges
Non-profit institutions
05
101520253035
Total
Business enterprises
Public organizationsUniversities and colleges
Non-profit institutions
7.9 8.3 8.6 9.0 9.3 9.8 10.2 10.1
10.6 10.9 10.7 11.2 11.6 11.9 11.9 12.4
13.0 13.0
0
2
4
6
8
10
12
14
0
20
40
60
80
100
120
1992 93 94 95 96 97 98 99 00 01 02 03 04 05 06 07 08 2009
Ratio
again
st th
e Tot
al
Numb
er of
Fem
ale R
esea
rche
rs
Year
Number of female researchers
Ratio of the number of female researchers
1,000 people %
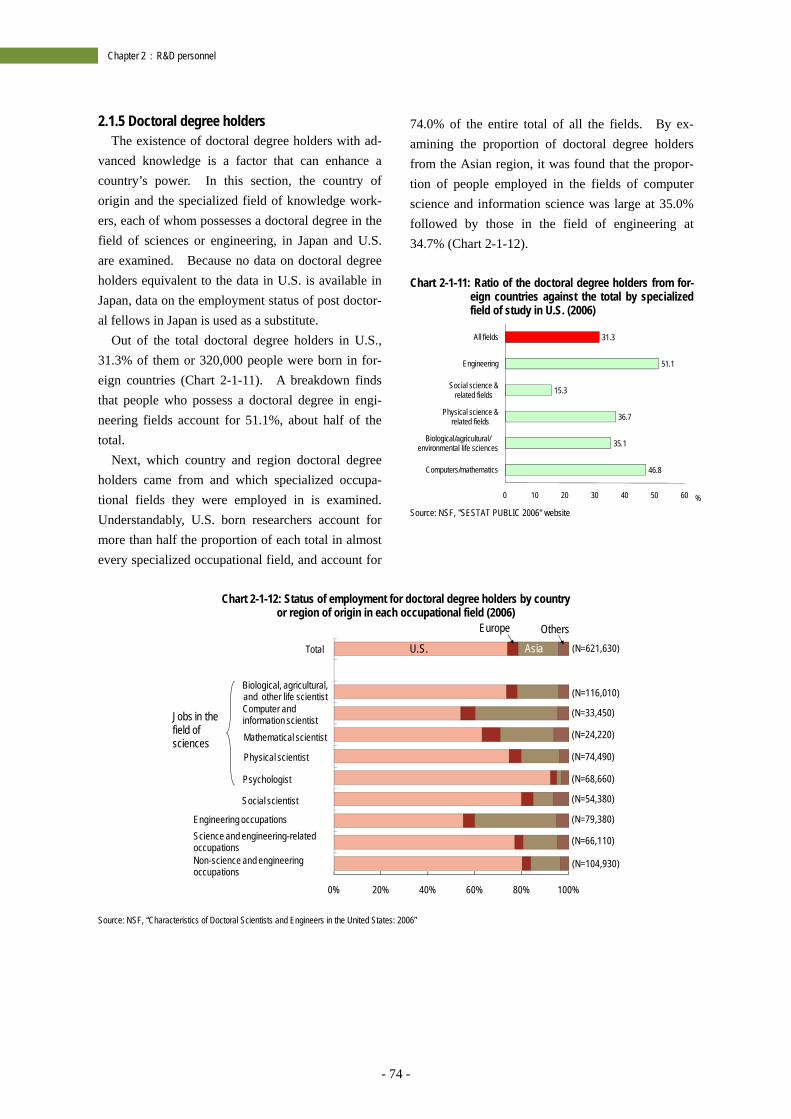
- 74 -
Chapter 2:R&D personnel
2.1.5 Doctoral degree holders The existence of doctoral degree holders with ad-
vanced knowledge is a factor that can enhance a country’s power. In this section, the country of origin and the specialized field of knowledge work-ers, each of whom possesses a doctoral degree in the field of sciences or engineering, in Japan and U.S. are examined. Because no data on doctoral degree holders equivalent to the data in U.S. is available in Japan, data on the employment status of post doctor-al fellows in Japan is used as a substitute.
Out of the total doctoral degree holders in U.S., 31.3% of them or 320,000 people were born in for-eign countries (Chart 2-1-11). A breakdown finds that people who possess a doctoral degree in engi-neering fields account for 51.1%, about half of the total.
Next, which country and region doctoral degree holders came from and which specialized occupa-tional fields they were employed in is examined. Understandably, U.S. born researchers account for more than half the proportion of each total in almost every specialized occupational field, and account for
74.0% of the entire total of all the fields. By ex-amining the proportion of doctoral degree holders from the Asian region, it was found that the propor-tion of people employed in the fields of computer science and information science was large at 35.0% followed by those in the field of engineering at 34.7% (Chart 2-1-12). Chart 2-1-11: Ratio of the doctoral degree holders from for-
eign countries against the total by specialized field of study in U.S. (2006)
Source: NSF, "SESTAT PUBLIC 2006" website
Chart 2-1-12: Status of employment for doctoral degree holders by country
or region of origin in each occupational field (2006)
Source: NSF, “Characteristics of Doctoral Scientists and Engineers in the United States: 2006”
46.8
35.1
36.7
15.3
51.1
31.3
0 10 20 30 40 50 60
Computers/mathematics
Biological/agricultural/environmental life sciences
Physical science & related fields
Social science & related fields
Engineering
All fields
%
Social scientist
Psychologist
Physical scientist
Mathematical scientist
Computer and information scientist
Biological, agricultural, and other life scientist
Total
0% 20% 40% 60% 80% 100%
(N=116,010)
(N=74,490)
(N=33,450)
(N=24,220)
(N=68,660)
(N=66,110)
(N=54,380)
(N=79,380)
(N=104,930)
U.S. Asia
Europe Others
Jobs in the field of sciences
(N=621,630)
Engineering occupationsScience and engineering-related occupationsNon-science and engineering occupations
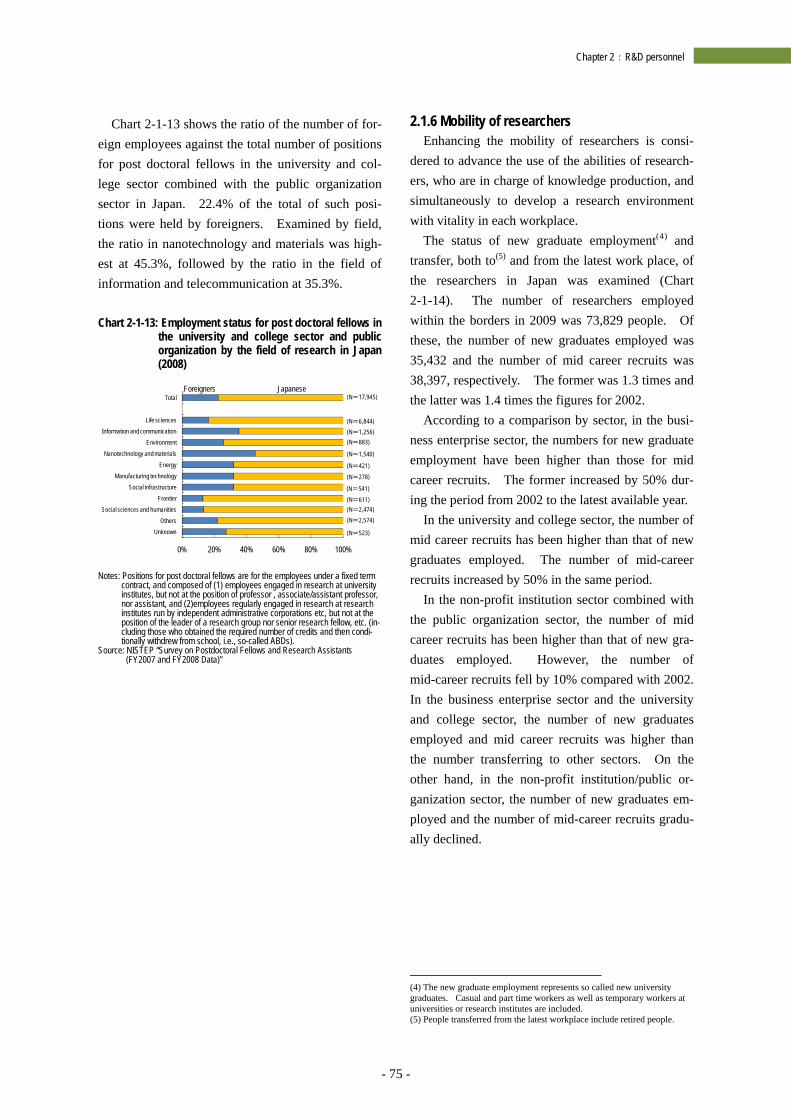
- 75 -
Chapter 2:R&D personnel
Chart 2-1-13 shows the ratio of the number of for-eign employees against the total number of positions for post doctoral fellows in the university and col-lege sector combined with the public organization sector in Japan. 22.4% of the total of such posi-tions were held by foreigners. Examined by field, the ratio in nanotechnology and materials was high-est at 45.3%, followed by the ratio in the field of information and telecommunication at 35.3%. Chart 2-1-13: Employment status for post doctoral fellows in
the university and college sector and public organization by the field of research in Japan (2008)
Notes: Positions for post doctoral fellows are for the employees under a fixed term
contract, and composed of (1) employees engaged in research at university institutes, but not at the position of professor , associate/assistant professor, nor assistant, and (2)employees regularly engaged in research at research institutes run by independent administrative corporations etc, but not at the position of the leader of a research group nor senior research fellow, etc. (in-cluding those who obtained the required number of credits and then condi-tionally withdrew from school, i.e., so-called ABDs).
Source: NISTEP “Survey on Postdoctoral Fellows and Research Assistants (FY2007 and FY2008 Data)”
2.1.6 Mobility of researchers Enhancing the mobility of researchers is consi-
dered to advance the use of the abilities of research-ers, who are in charge of knowledge production, and simultaneously to develop a research environment with vitality in each workplace.
The status of new graduate employment(4) and transfer, both to(5) and from the latest work place, of the researchers in Japan was examined (Chart 2-1-14). The number of researchers employed within the borders in 2009 was 73,829 people. Of these, the number of new graduates employed was 35,432 and the number of mid career recruits was 38,397, respectively. The former was 1.3 times and the latter was 1.4 times the figures for 2002.
According to a comparison by sector, in the busi-ness enterprise sector, the numbers for new graduate employment have been higher than those for mid career recruits. The former increased by 50% dur-ing the period from 2002 to the latest available year.
In the university and college sector, the number of mid career recruits has been higher than that of new graduates employed. The number of mid-career recruits increased by 50% in the same period.
In the non-profit institution sector combined with the public organization sector, the number of mid career recruits has been higher than that of new gra-duates employed. However, the number of mid-career recruits fell by 10% compared with 2002. In the business enterprise sector and the university and college sector, the number of new graduates employed and mid career recruits was higher than the number transferring to other sectors. On the other hand, in the non-profit institution/public or-ganization sector, the number of new graduates em-ployed and the number of mid-career recruits gradu-ally declined.
(4) The new graduate employment represents so called new university graduates. Casual and part time workers as well as temporary workers at universities or research institutes are included. (5) People transferred from the latest workplace include retired people.
Foreigners Japanese
0% 20% 40% 60% 80% 100%
UnknownOthers
Social sciences and humanitiesFrontier
Social infrastructureManufacturing technology
Energy
Nanotechnology and materialsEnvironment
Information and communicationLife sciences
Total (N=17,945)
(N=6,844)(N=1,256)(N=883)
(N=1,540)
(N=421)(N=278)
(N=541)(N=611)(N=2,474)(N=2,574)
(N=523)
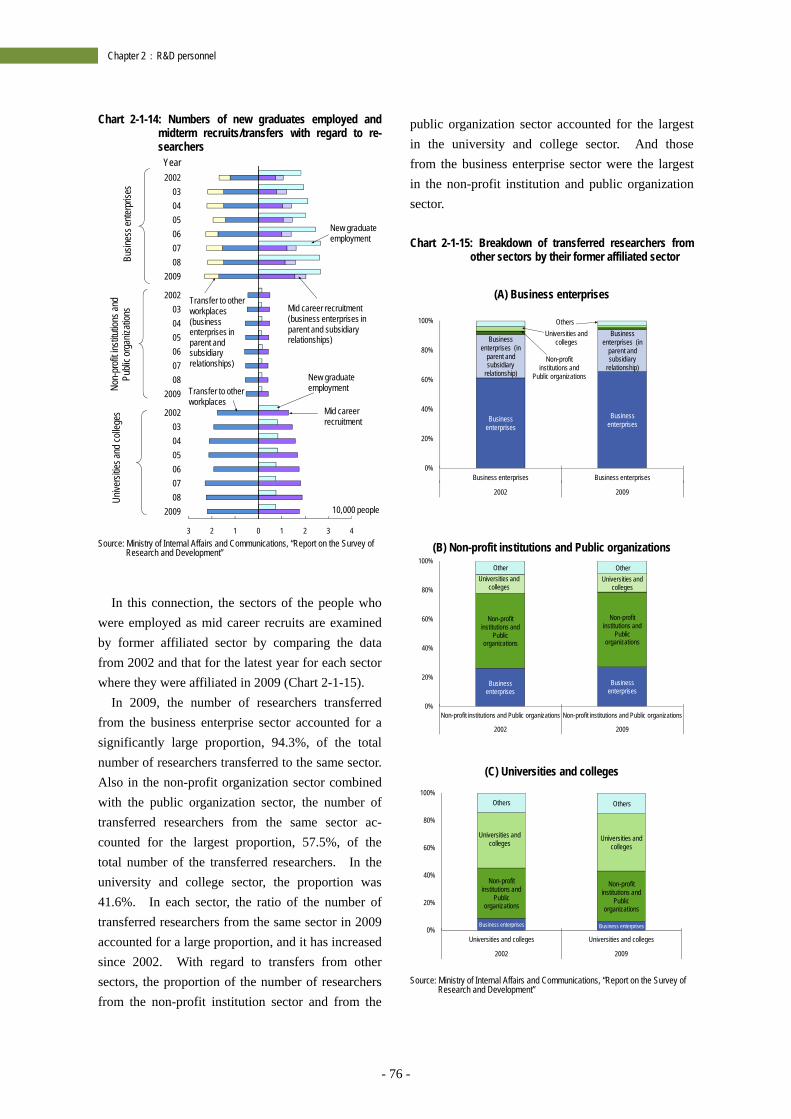
- 76 -
Chapter 2:R&D personnel
Chart 2-1-14: Numbers of new graduates employed and midterm recruits/transfers with regard to re-searchers
Source: Ministry of Internal Affairs and Communications, “Report on the Survey of
Research and Development”
In this connection, the sectors of the people who were employed as mid career recruits are examined by former affiliated sector by comparing the data from 2002 and that for the latest year for each sector where they were affiliated in 2009 (Chart 2-1-15).
In 2009, the number of researchers transferred from the business enterprise sector accounted for a significantly large proportion, 94.3%, of the total number of researchers transferred to the same sector. Also in the non-profit organization sector combined with the public organization sector, the number of transferred researchers from the same sector ac-counted for the largest proportion, 57.5%, of the total number of the transferred researchers. In the university and college sector, the proportion was 41.6%. In each sector, the ratio of the number of transferred researchers from the same sector in 2009 accounted for a large proportion, and it has increased since 2002. With regard to transfers from other sectors, the proportion of the number of researchers from the non-profit institution sector and from the
public organization sector accounted for the largest in the university and college sector. And those from the business enterprise sector were the largest in the non-profit institution and public organization sector. Chart 2-1-15: Breakdown of transferred researchers from
other sectors by their former affiliated sector
(A) Business enterprises
(B) Non-profit institutions and Public organizations
(C) Universities and colleges
Source: Ministry of Internal Affairs and Communications, “Report on the Survey of
Research and Development”
3 2 1 0 1 2 3 4
2009080706050403
2002
2009080706050403
2002
2009080706050403
2002
10,000 people
Non-
profi
t insti
tution
s and
Pu
blic o
rgan
izatio
nsBu
sines
s ente
rpris
esUn
iversi
ties a
nd co
llege
s
Year
Transfer to other workplaces (business enterprises in parent and subsidiary relationships)
New graduate employment
Transfer to other workplaces
Mid career recruitment (business enterprises in parent and subsidiary relationships)
Mid career recruitment
New graduate employment
Businessenterprises
Businessenterprises
Businessenterprises (in
parent and subsidiary
relationship)
Businessenterprises (in
parent and subsidiary
relationship)Non-profit
institutions and Public organizations
Universities and colleges
Others
0%
20%
40%
60%
80%
100%
Business enterprises Business enterprises
2002 2009
Businessenterprises
Businessenterprises
Non-profitinstitutions and
Publicorganizations
Non-profitinstitutions and
Publicorganizations
Universities and colleges
Universities and colleges
Other Other
0%
20%
40%
60%
80%
100%
Non-profit institutions and Public organizations Non-profit institutions and Public organizations
2002 2009
Business enterprises Business enterprises
Non-profitinstitutions and
Publicorganizations
Non-profitinstitutions and
Publicorganizations
Universities and colleges
Universities and colleges
Others Others
0%
20%
40%
60%
80%
100%
Universities and colleges Universities and colleges
2002 2009
- 77 -
Chapter 2:R&D personnel
2.2 Researchers by sector
Key points ○The number of researchers in the public organization sector can significantly change due to the privatiza-
tion of public organizations and depending on changes to the scope of the statistics for R&D. ○The number of researchers in the public organization sector per 10,000-person population in the latest
available year was 5.3 in Germany, which was the highest value, followed by 4.2 in France. Japan’s value was 2.6. However, the number of researchers in local governments (state governments, etc.) in Japan and Germany was included in the data above, while that for France was not included. The value for U.S., whose data did not include the number of researchers in local governments, was 1.7.
○Looking at the numbers of researchers in the business enterprise sector, Japan and U.S. show a rising trend over the long term, while China in recent years has shown a sharp upward trend. In Germany and U.K., numbers have been flat. With regard to the proportion of the number of researchers by industry, the ratio of those in the manufacturing industry to the non-manufacturing industry in Japan was approximately 90% to 10%, and in U.S. was approximately 60% to 40%. The trends of both countries are different in this way.
○The number of researchers in the university and college sector in Japan in accordance with the statistics by the OECD was extremely large compared to other countries (180,000 people (2006) in Japan, while 190,000 people (1999) in U.S.). But if the number of researchers in the university and college sector is measured using the statistics for education, the value is not necessarily extremely large (250,000 people in Japan compared to 740,000 people in U.S. (both in 2006)).
2.2.1 Researchers in the public organization sec-tor (1) Researchers in public organizations in each country
Below is a summary of what “public organizations” in this section represent. Bearing in mind the dif-ferences for each country, the number of researchers in public organizations by country is examined.
In Japan, “national” institutes (such as national testing and research institutes), “public” institutes (such as public testing and research institutes), and special and public administrative corporations (non-profit) are included.
In U.S., research institutes run by the federal gov-ernment are included.
In Germany, research institutes run by the federal government and local governments and other public research institutes, non-profit institutions (receiving 160,000 Euros or more as public funds) and the re-search institutes except for higher education institu-tions are included.
In France, types of research institutes such as scientific and technical research public establishment
“Etablissement public a caractere scientifique et technologique” (EPST) (except for CNRS) and commercial and industrial research public estab-lishment “Etablissement Public a Caractere Indus-triel et Commercial” (EPIC) are included.
In U.K., research institutes run by the central gov-ernment and decentralized governments and research councils are included.
In China, research institutes run by the central government are included. And in Korea, national and public research institutes, government supported research institutes and national and public hospitals are included.
With regard to the trends in the number of re-searchers, Japan did not show a significant change in the public organization sector in the long term. U.S., Germany, France and U.K., however, have shown remarkable fluctuation. The main reasons are considered to be the transfer of some public or-ganizations into the business enterprise sector, the change in surveying methods for measuring the number of researchers, etc. For example, in U.K., the “UK Atomic Energy Authority” which belonged
- 78 -
Chapter 2:R&D personnel
to the public organization sector in 1985 was trans-ferred to the business enterprise sector, and DERA(6) ceased operations in 2000.
The number of researchers in the public organiza-tion sector in China is extremely large compared to that in other countries; however, at 1.8, the ratio of the former per 10,000-person population is not so remarkable (see chart 2-2-1(B)) In U.K., both the number of researchers and the ratio of the number of researchers per 10,000-person population are small (Chart 2-2-1 (A, B)).
(6) The Defense Evaluation and Research Agency (DERA).
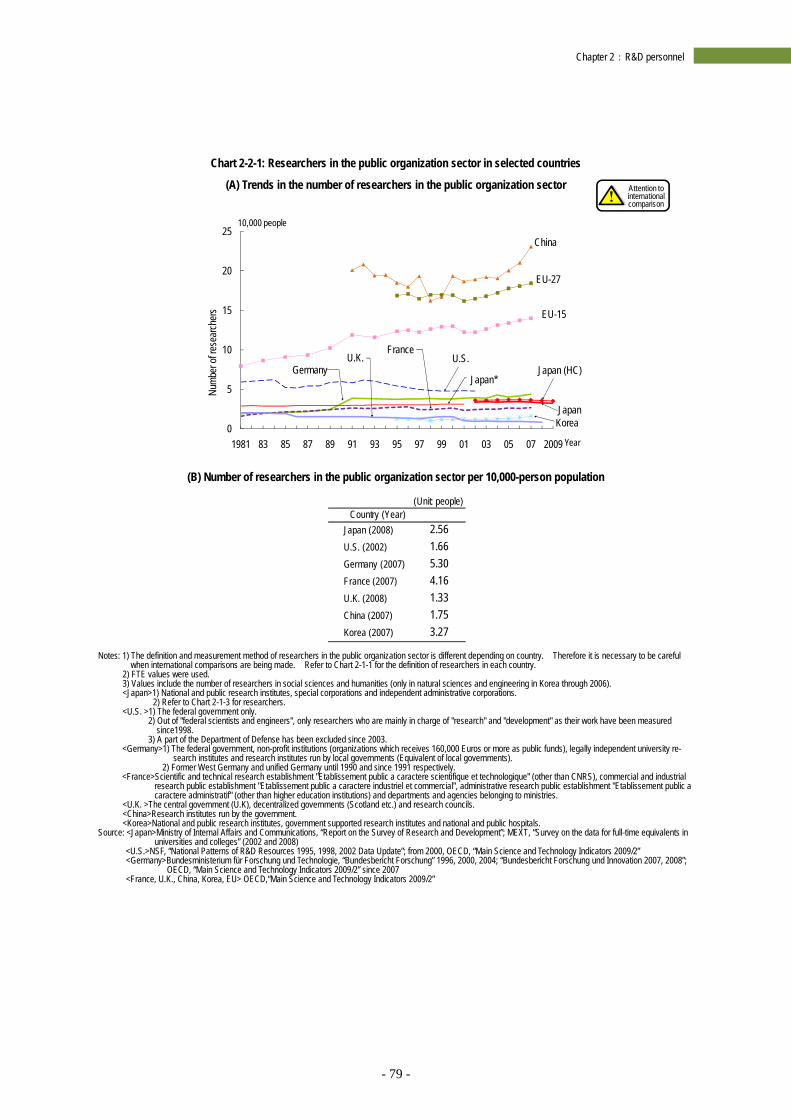
- 79 -
Chapter 2:R&D personnel
Chart 2-2-1: Researchers in the public organization sector in selected countries
(A) Trends in the number of researchers in the public organization sector
(B) Number of researchers in the public organization sector per 10,000-person population
Notes: 1) The definition and measurement method of researchers in the public organization sector is different depending on country. Therefore it is necessary to be careful
when international comparisons are being made. Refer to Chart 2-1-1 for the definition of researchers in each country. 2) FTE values were used. 3) Values include the number of researchers in social sciences and humanities (only in natural sciences and engineering in Korea through 2006). <Japan>1) National and public research institutes, special corporations and independent administrative corporations.
2) Refer to Chart 2-1-3 for researchers. <U.S. >1) The federal government only.
2) Out of "federal scientists and engineers", only researchers who are mainly in charge of "research" and "development" as their work have been measured since1998.
3) A part of the Department of Defense has been excluded since 2003. <Germany>1) The federal government, non-profit institutions (organizations which receives 160,000 Euros or more as public funds), legally independent university re-
search institutes and research institutes run by local governments (Equivalent of local governments). 2) Former West Germany and unified Germany until 1990 and since 1991 respectively.
<France>Scientific and technical research establishment "Etablissement public a caractere scientifique et technologique" (other than CNRS), commercial and industrial research public establishment "Etablissement public a caractere industriel et commercial", administrative research public establishment "Etablissement public a caractere administratif" (other than higher education institutions) and departments and agencies belonging to ministries.
<U.K. >The central government (U.K), decentralized governments (Scotland etc.) and research councils. <China>Research institutes run by the government. <Korea>National and public research institutes, government supported research institutes and national and public hospitals.
Source: <Japan>Ministry of Internal Affairs and Communications, “Report on the Survey of Research and Development”; MEXT, “Survey on the data for full-time equivalents in universities and colleges” (2002 and 2008)
<U.S.>NSF, “National Patterns of R&D Resources 1995, 1998, 2002 Data Update”; from 2000, OECD, “Main Science and Technology Indicators 2009/2” <Germany>Bundesministerium für Forschung und Technologie, “Bundesbericht Forschung” 1996, 2000, 2004; “Bundesbericht Forschung und Innovation 2007, 2008”;
OECD, “Main Science and Technology Indicators 2009/2” since 2007 <France, U.K., China, Korea, EU> OECD,“Main Science and Technology Indicators 2009/2”
Japan
0
5
10
15
20
25
1981 83 85 87 89 91 93 95 97 99 01 03 05 07 2009
Numb
er of
rese
arch
ers
Year
10,000 people
China
EU-15
FranceU.K.
GermanyJapan*
U.S.Japan (HC)
Korea
EU-27
(Unit: people)Country (Year)
Japan (2008) 2.56U.S. (2002) 1.66Germany (2007) 5.30France (2007) 4.16U.K. (2008) 1.33China (2007) 1.75Korea (2007) 3.27
Attention to international comparison
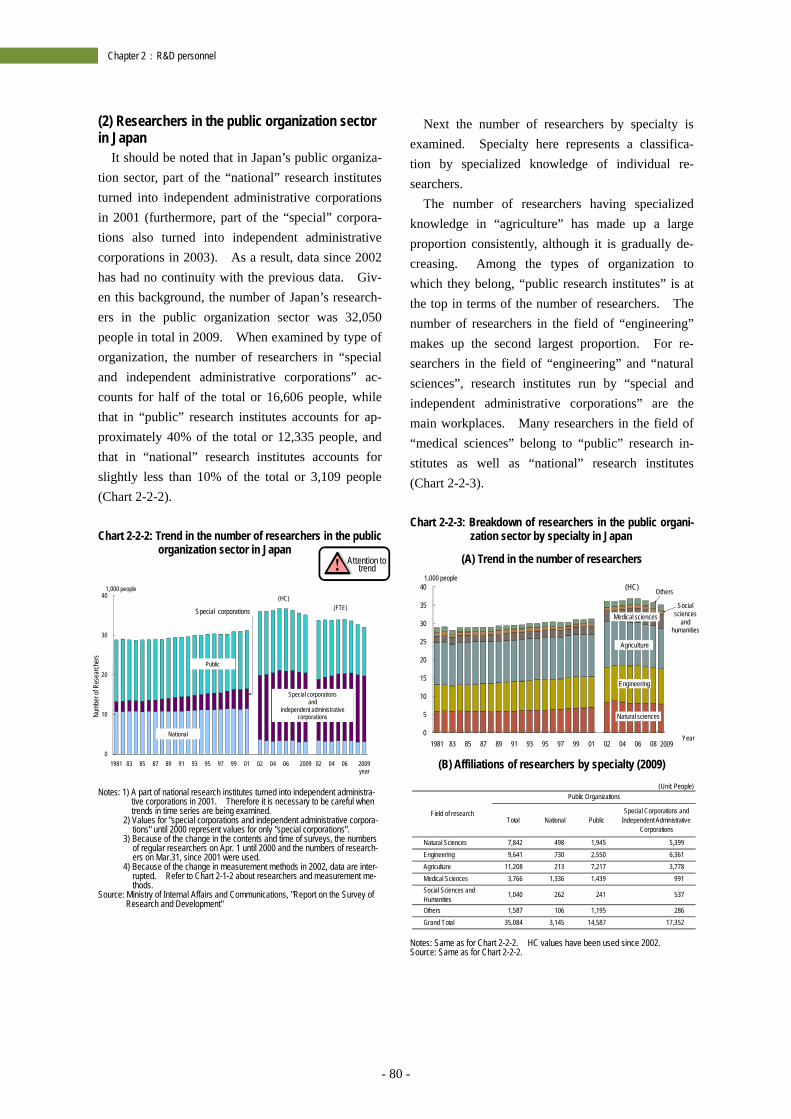
- 80 -
Chapter 2:R&D personnel
(2) Researchers in the public organization sector in Japan
It should be noted that in Japan’s public organiza-tion sector, part of the “national” research institutes turned into independent administrative corporations in 2001 (furthermore, part of the “special” corpora-tions also turned into independent administrative corporations in 2003). As a result, data since 2002 has had no continuity with the previous data. Giv-en this background, the number of Japan’s research-ers in the public organization sector was 32,050 people in total in 2009. When examined by type of organization, the number of researchers in “special and independent administrative corporations” ac-counts for half of the total or 16,606 people, while that in “public” research institutes accounts for ap-proximately 40% of the total or 12,335 people, and that in “national” research institutes accounts for slightly less than 10% of the total or 3,109 people (Chart 2-2-2). Chart 2-2-2: Trend in the number of researchers in the public
organization sector in Japan
Notes: 1) A part of national research institutes turned into independent administra-
tive corporations in 2001. Therefore it is necessary to be careful when trends in time series are being examined.
2) Values for "special corporations and independent administrative corpora-tions" until 2000 represent values for only "special corporations”.
3) Because of the change in the contents and time of surveys, the numbers of regular researchers on Apr. 1 until 2000 and the numbers of research-ers on Mar.31, since 2001 were used.
4) Because of the change in measurement methods in 2002, data are inter-rupted. Refer to Chart 2-1-2 about researchers and measurement me-thods.
Source: Ministry of Internal Affairs and Communications, "Report on the Survey of Research and Development"
Next the number of researchers by specialty is examined. Specialty here represents a classifica-tion by specialized knowledge of individual re-searchers.
The number of researchers having specialized knowledge in “agriculture” has made up a large proportion consistently, although it is gradually de-creasing. Among the types of organization to which they belong, “public research institutes” is at the top in terms of the number of researchers. The number of researchers in the field of “engineering” makes up the second largest proportion. For re-searchers in the field of “engineering” and “natural sciences”, research institutes run by “special and independent administrative corporations” are the main workplaces. Many researchers in the field of “medical sciences” belong to “public” research in-stitutes as well as “national” research institutes (Chart 2-2-3). Chart 2-2-3: Breakdown of researchers in the public organi-
zation sector by specialty in Japan
(A) Trend in the number of researchers
(B) Affiliations of researchers by specialty (2009)
Notes: Same as for Chart 2-2-2. HC values have been used since 2002. Source: Same as for Chart 2-2-2.
0
10
20
30
40
1981 83 85 87 89 91 93 95 97 99 01 02 04 06 2009 02 04 06 2009 year
Numb
er of
Rese
arch
ers
(FTE)
1,000 people
Special corporations and
independent administrative corporations
Public
National
(HC)
Special corporations
Natural sciences
Engineering
Social sciences
and humanities
0
5
10
15
20
25
30
35
40
1981 83 85 87 89 91 93 95 97 99 01 02 04 06 08
1,000 people
2009
Agriculture
Medical sciences
Others(HC)
Year
(Unit: People)
Total National PublicSpecial Corporations and
Independent AdministrativeCorporations
Natural Sciences 7,842 498 1,945 5,399Engineering 9,641 730 2,550 6,361Agriculture 11,208 213 7,217 3,778Medical Sciences 3,766 1,336 1,439 991Social Sciences andHumanities 1,040 262 241 537
Others 1,587 106 1,195 286Grand Total 35,084 3,145 14,587 17,352
Public Organizations
Field of research
Attention to trend
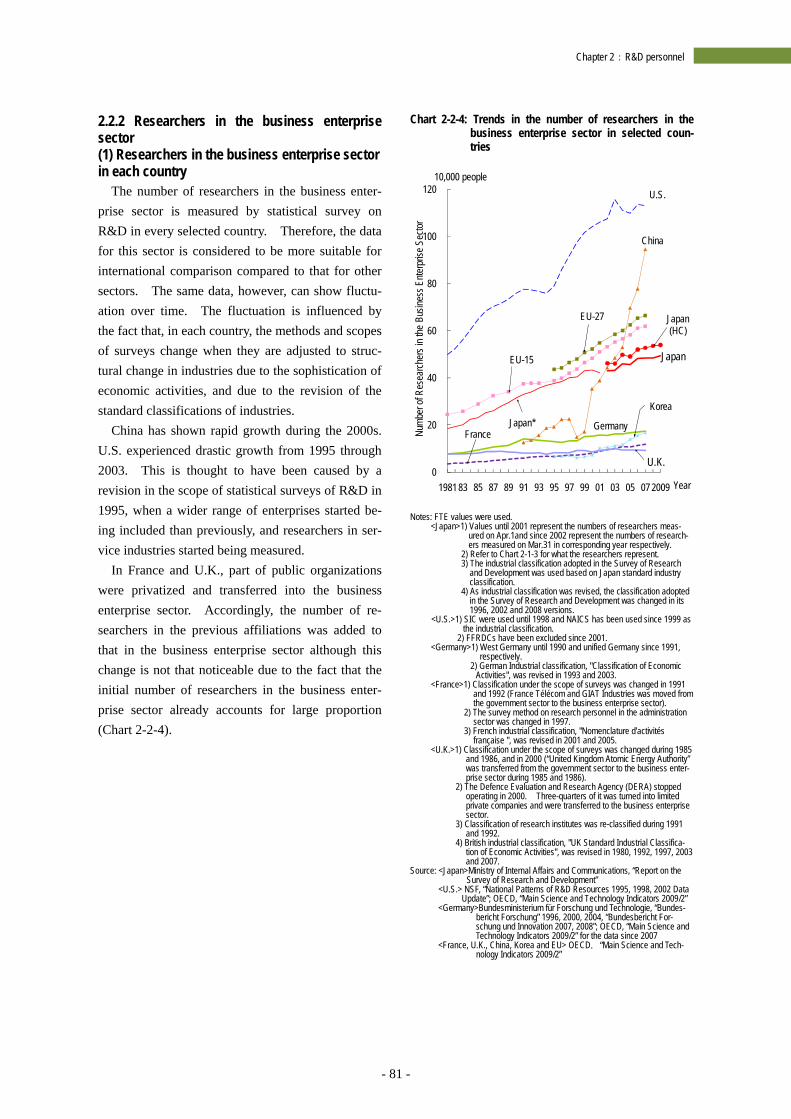
- 81 -
Chapter 2:R&D personnel
2.2.2 Researchers in the business enterprise sector (1) Researchers in the business enterprise sector in each country
The number of researchers in the business enter-prise sector is measured by statistical survey on R&D in every selected country. Therefore, the data for this sector is considered to be more suitable for international comparison compared to that for other sectors. The same data, however, can show fluctu-ation over time. The fluctuation is influenced by the fact that, in each country, the methods and scopes of surveys change when they are adjusted to struc-tural change in industries due to the sophistication of economic activities, and due to the revision of the standard classifications of industries.
China has shown rapid growth during the 2000s. U.S. experienced drastic growth from 1995 through 2003. This is thought to have been caused by a revision in the scope of statistical surveys of R&D in 1995, when a wider range of enterprises started be-ing included than previously, and researchers in ser-vice industries started being measured.
In France and U.K., part of public organizations were privatized and transferred into the business enterprise sector. Accordingly, the number of re-searchers in the previous affiliations was added to that in the business enterprise sector although this change is not that noticeable due to the fact that the initial number of researchers in the business enter-prise sector already accounts for large proportion (Chart 2-2-4).
Chart 2-2-4: Trends in the number of researchers in the business enterprise sector in selected coun-tries
Notes: FTE values were used.
<Japan>1) Values until 2001 represent the numbers of researchers meas-ured on Apr.1and since 2002 represent the numbers of research-ers measured on Mar.31 in corresponding year respectively.
2) Refer to Chart 2-1-3 for what the researchers represent. 3) The industrial classification adopted in the Survey of Research
and Development was used based on Japan standard industry classification.
4) As industrial classification was revised, the classification adopted in the Survey of Research and Development was changed in its 1996, 2002 and 2008 versions.
<U.S.>1) SIC were used until 1998 and NAICS has been used since 1999 as the industrial classification.
2) FFRDCs have been excluded since 2001. <Germany>1) West Germany until 1990 and unified Germany since 1991,
respectively. 2) German Industrial classification, "Classification of Economic
Activities", was revised in 1993 and 2003. <France>1) Classification under the scope of surveys was changed in 1991
and 1992 (France Télécom and GIAT Industries was moved from the government sector to the business enterprise sector).
2) The survey method on research personnel in the administration sector was changed in 1997.
3) French industrial classification, "Nomenclature d'activités française ", was revised in 2001 and 2005.
<U.K.>1) Classification under the scope of surveys was changed during 1985 and 1986, and in 2000 (“United Kingdom Atomic Energy Authority” was transferred from the government sector to the business enter-prise sector during 1985 and 1986).
2) The Defence Evaluation and Research Agency (DERA) stopped operating in 2000. Three-quarters of it was turned into limited private companies and were transferred to the business enterprise sector.
3) Classification of research institutes was re-classified during 1991 and 1992.
4) British industrial classification, "UK Standard Industrial Classifica-tion of Economic Activities", was revised in 1980, 1992, 1997, 2003 and 2007.
Source: <Japan>Ministry of Internal Affairs and Communications, “Report on the Survey of Research and Development”
<U.S.> NSF, “National Patterns of R&D Resources 1995, 1998, 2002 Data Update”; OECD, “Main Science and Technology Indicators 2009/2”
<Germany>Bundesministerium für Forschung und Technologie, “Bundes-bericht Forschung” 1996, 2000, 2004, “Bundesbericht For-schung und Innovation 2007, 2008”; OECD, “Main Science and Technology Indicators 2009/2” for the data since 2007
<France, U.K., China, Korea and EU> OECD,“Main Science and Tech-nology Indicators 2009/2”
Japan*
0
20
40
60
80
100
120
1981 83 85 87 89 91 93 95 97 99 01 03 05 07 2009
Numb
er of
Res
earch
ers i
n the
Bus
iness
Ente
rpris
e Sec
tor
Year
10,000 peopleU.S.
Korea
Japan(HC)
Germany
China
EU-27
JapanEU-15
France
U.K.
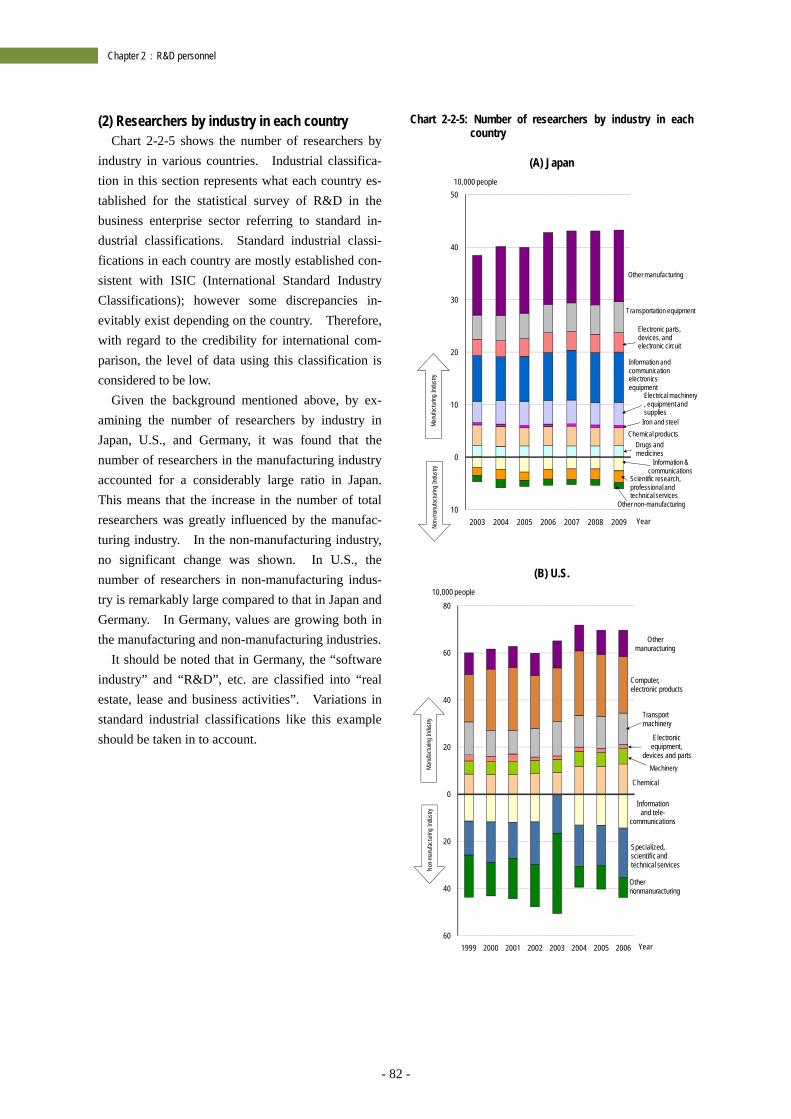
- 82 -
Chapter 2:R&D personnel
(2) Researchers by industry in each country Chart 2-2-5 shows the number of researchers by
industry in various countries. Industrial classifica-tion in this section represents what each country es-tablished for the statistical survey of R&D in the business enterprise sector referring to standard in-dustrial classifications. Standard industrial classi-fications in each country are mostly established con-sistent with ISIC (International Standard Industry Classifications); however some discrepancies in-evitably exist depending on the country. Therefore, with regard to the credibility for international com-parison, the level of data using this classification is considered to be low.
Given the background mentioned above, by ex-amining the number of researchers by industry in Japan, U.S., and Germany, it was found that the number of researchers in the manufacturing industry accounted for a considerably large ratio in Japan. This means that the increase in the number of total researchers was greatly influenced by the manufac-turing industry. In the non-manufacturing industry, no significant change was shown. In U.S., the number of researchers in non-manufacturing indus-try is remarkably large compared to that in Japan and Germany. In Germany, values are growing both in the manufacturing and non-manufacturing industries.
It should be noted that in Germany, the “software industry” and “R&D”, etc. are classified into “real estate, lease and business activities”. Variations in standard industrial classifications like this example should be taken in to account.
Chart 2-2-5: Number of researchers by industry in each country
(A) Japan
(B) U.S.
Information & communications
Drugs and medicines
Chemical productsIron and steel
Electrical machinery , equipment and supplies
Information and communication electronics equipment
Electronic parts, devices, and electronic circuit
10
0
10
20
30
40
50
2003 2004 2005 2006 2007 2008 2009
10,000 people
Year
Other manufacturing
Transportation equipment
Manu
factur
ingInd
ustry
Non-m
anufa
cturin
gInd
ustry
Scientific research, professional and technical services
Other non-manufacturing
Chemical
Information and tele-
communications
Specialized, scientific and technical services
Machinery
Othernonmanuracturing
Electronic equipment,
devices and parts
Transport machinery
Computer, electronic products
Other manuracturing
60
40
20
0
20
40
60
80
1999 2000 2001 2002 2003 2004 2005 2006
10,000 people
Year
Manu
factur
ingInd
ustry
Non-m
anuf
actu
ring
Indu
stry
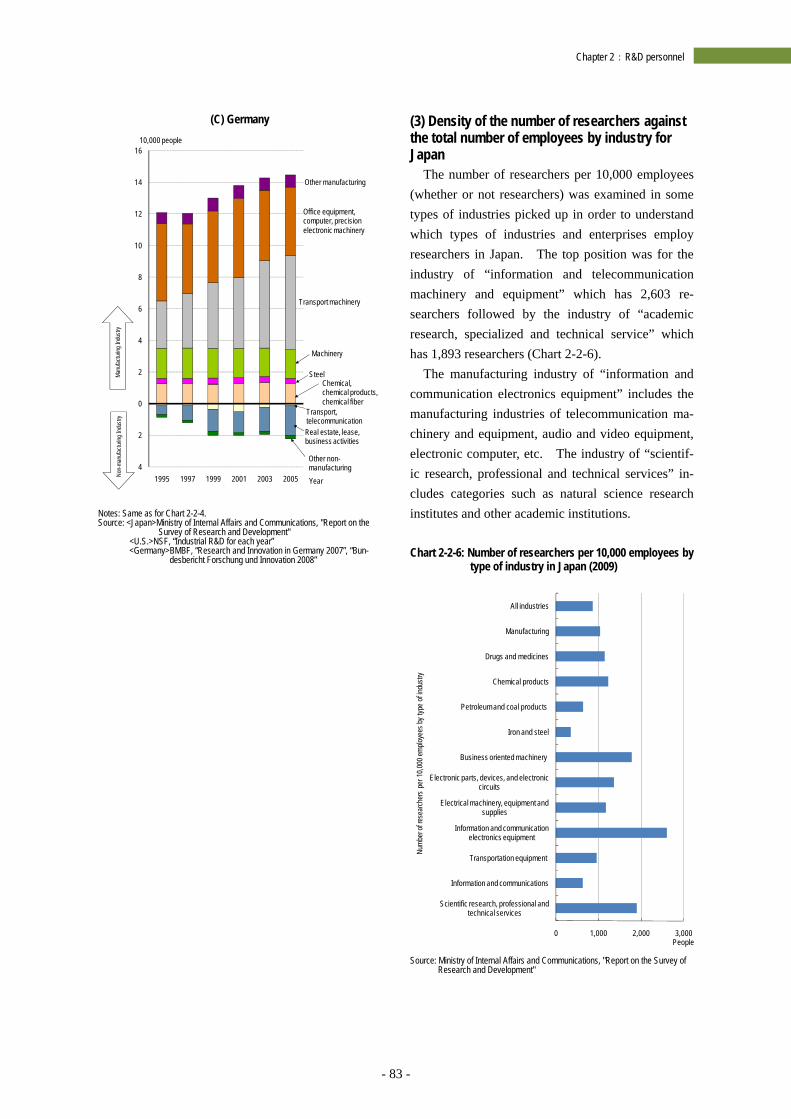
- 83 -
Chapter 2:R&D personnel
(C) Germany
Notes: Same as for Chart 2-2-4. Source: <Japan>Ministry of Internal Affairs and Communications, "Report on the
Survey of Research and Development" <U.S.>NSF, “Industrial R&D for each year” <Germany>BMBF, “Research and Innovation in Germany 2007”, “Bun-
desbericht Forschung und Innovation 2008”
(3) Density of the number of researchers against the total number of employees by industry for Japan
The number of researchers per 10,000 employees (whether or not researchers) was examined in some types of industries picked up in order to understand which types of industries and enterprises employ researchers in Japan. The top position was for the industry of “information and telecommunication machinery and equipment” which has 2,603 re-searchers followed by the industry of “academic research, specialized and technical service” which has 1,893 researchers (Chart 2-2-6).
The manufacturing industry of “information and communication electronics equipment” includes the manufacturing industries of telecommunication ma-chinery and equipment, audio and video equipment, electronic computer, etc. The industry of “scientif-ic research, professional and technical services” in-cludes categories such as natural science research institutes and other academic institutions. Chart 2-2-6: Number of researchers per 10,000 employees by
type of industry in Japan (2009)
Source: Ministry of Internal Affairs and Communications, "Report on the Survey of
Research and Development"
4
2
0
2
4
6
8
10
12
14
16
1995 1997 1999 2001 2003 2005
10,000 people
Year
Manu
factur
ingInd
ustry
Non-m
anufa
cturin
gInd
ustry
Other manufacturing
Machinery
SteelChemical,chemical products, chemical fiber
Transport machinery
Office equipment, computer, precision electronic machinery
Transport, telecommunicationReal estate, lease, business activities
Other non-manufacturing
0 1,000 2,000 3,000
Scientific research, professional and technical services
Information and communications
Transportation equipment
Information and communication electronics equipment
Electrical machinery, equipment and supplies
Electronic parts, devices, and electronic circuits
Business oriented machinery
Iron and steel
Petroleum and coal products
Chemical products
Drugs and medicines
Manufacturing
All industries
People
Num
ber o
f res
earch
ers
per 1
0,00
0 em
ploye
es b
y typ
e of
indu
stry
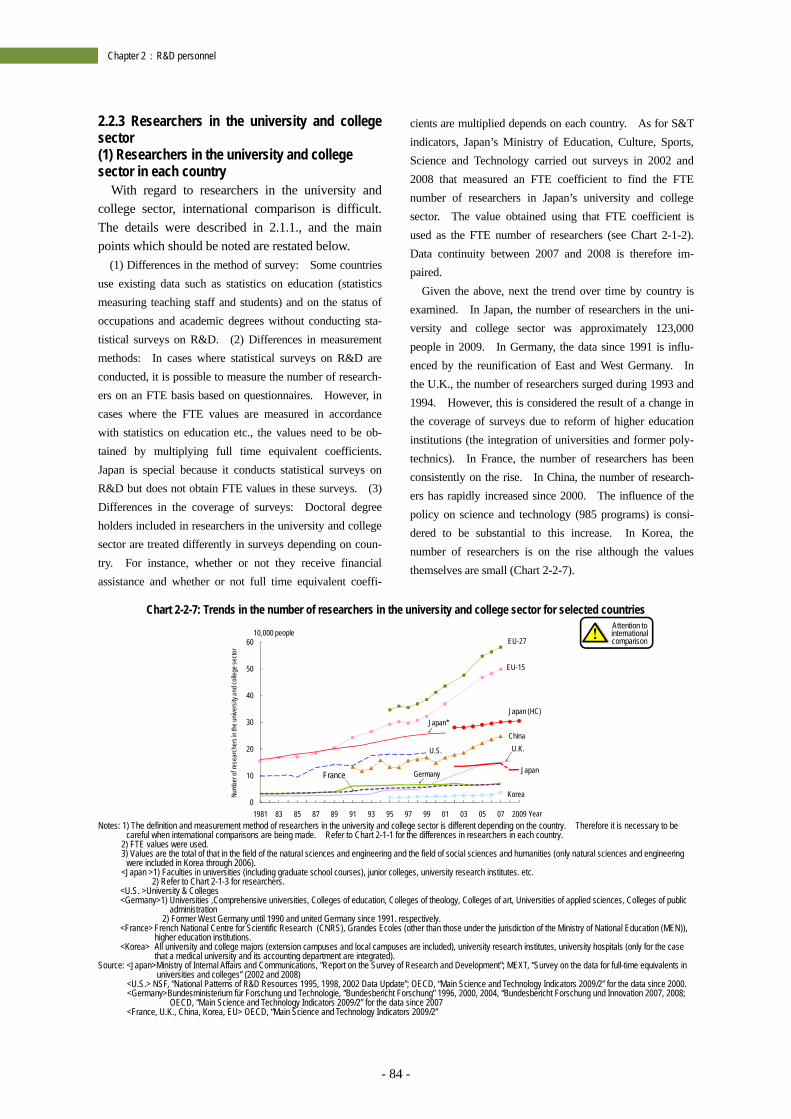
- 84 -
Chapter 2:R&D personnel
2.2.3 Researchers in the university and college sector (1) Researchers in the university and college sector in each country
With regard to researchers in the university and college sector, international comparison is difficult. The details were described in 2.1.1., and the main points which should be noted are restated below.
(1) Differences in the method of survey: Some countries use existing data such as statistics on education (statistics measuring teaching staff and students) and on the status of occupations and academic degrees without conducting sta-tistical surveys on R&D. (2) Differences in measurement methods: In cases where statistical surveys on R&D are conducted, it is possible to measure the number of research-ers on an FTE basis based on questionnaires. However, in cases where the FTE values are measured in accordance with statistics on education etc., the values need to be ob-tained by multiplying full time equivalent coefficients. Japan is special because it conducts statistical surveys on R&D but does not obtain FTE values in these surveys. (3) Differences in the coverage of surveys: Doctoral degree holders included in researchers in the university and college sector are treated differently in surveys depending on coun-try. For instance, whether or not they receive financial assistance and whether or not full time equivalent coeffi-
cients are multiplied depends on each country. As for S&T indicators, Japan’s Ministry of Education, Culture, Sports, Science and Technology carried out surveys in 2002 and 2008 that measured an FTE coefficient to find the FTE number of researchers in Japan’s university and college sector. The value obtained using that FTE coefficient is used as the FTE number of researchers (see Chart 2-1-2). Data continuity between 2007 and 2008 is therefore im-paired.
Given the above, next the trend over time by country is examined. In Japan, the number of researchers in the uni-versity and college sector was approximately 123,000 people in 2009. In Germany, the data since 1991 is influ-enced by the reunification of East and West Germany. In the U.K., the number of researchers surged during 1993 and 1994. However, this is considered the result of a change in the coverage of surveys due to reform of higher education institutions (the integration of universities and former poly-technics). In France, the number of researchers has been consistently on the rise. In China, the number of research-ers has rapidly increased since 2000. The influence of the policy on science and technology (985 programs) is consi-dered to be substantial to this increase. In Korea, the number of researchers is on the rise although the values themselves are small (Chart 2-2-7).
Chart 2-2-7: Trends in the number of researchers in the university and college sector for selected countries
Notes: 1) The definition and measurement method of researchers in the university and college sector is different depending on the country. Therefore it is necessary to be
careful when international comparisons are being made. Refer to Chart 2-1-1 for the differences in researchers in each country. 2) FTE values were used. 3) Values are the total of that in the field of the natural sciences and engineering and the field of social sciences and humanities (only natural sciences and engineering
were included in Korea through 2006). <Japan >1) Faculties in universities (including graduate school courses), junior colleges, university research institutes. etc.
2) Refer to Chart 2-1-3 for researchers. <U.S. >University & Colleges <Germany>1) Universities ,Comprehensive universities, Colleges of education, Colleges of theology, Colleges of art, Universities of applied sciences, Colleges of public
administration 2) Former West Germany until 1990 and united Germany since 1991. respectively.
<France> French National Centre for Scientific Research (CNRS), Grandes Ecoles (other than those under the jurisdiction of the Ministry of National Education (MEN)), higher education institutions.
<Korea> All university and college majors (extension campuses and local campuses are included), university research institutes, university hospitals (only for the case that a medical university and its accounting department are integrated).
Source: <Japan>Ministry of Internal Affairs and Communications, "Report on the Survey of Research and Development"; MEXT, “Survey on the data for full-time equivalents in universities and colleges” (2002 and 2008)
<U.S.> NSF, “National Patterns of R&D Resources 1995, 1998, 2002 Data Update”; OECD, “Main Science and Technology Indicators 2009/2” for the data since 2000. <Germany>Bundesministerium für Forschung und Technologie, “Bundesbericht Forschung” 1996, 2000, 2004, “Bundesbericht Forschung und Innovation 2007, 2008;
OECD, “Main Science and Technology Indicators 2009/2” for the data since 2007 <France, U.K., China, Korea, EU> OECD, “Main Science and Technology Indicators 2009/2”
Japan*
0
10
20
30
40
50
60
1981 83 85 87 89 91 93 95 97 99 01 03 05 07 2009
Numb
er of
rese
arch
ers i
n the
unive
rsity
and c
olleg
e sec
tor
Year
10,000 people
U.S.
Japan (HC)
GermanyFrance
U.K.
Japan
China
EU-27
Korea
EU-15
Attention to international comparison
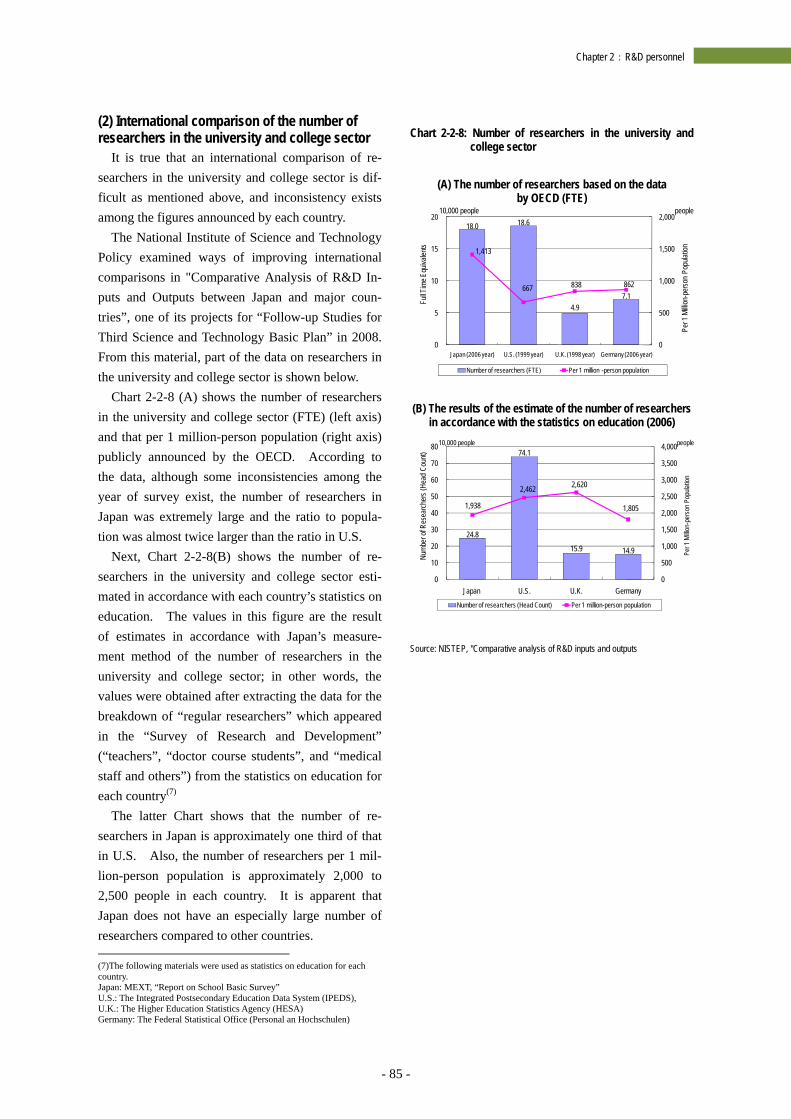
- 85 -
Chapter 2:R&D personnel
(2) International comparison of the number of researchers in the university and college sector
It is true that an international comparison of re-searchers in the university and college sector is dif-ficult as mentioned above, and inconsistency exists among the figures announced by each country.
The National Institute of Science and Technology Policy examined ways of improving international comparisons in "Comparative Analysis of R&D In-puts and Outputs between Japan and major coun-tries”, one of its projects for “Follow-up Studies for Third Science and Technology Basic Plan” in 2008. From this material, part of the data on researchers in the university and college sector is shown below.
Chart 2-2-8 (A) shows the number of researchers in the university and college sector (FTE) (left axis) and that per 1 million-person population (right axis) publicly announced by the OECD. According to the data, although some inconsistencies among the year of survey exist, the number of researchers in Japan was extremely large and the ratio to popula-tion was almost twice larger than the ratio in U.S.
Next, Chart 2-2-8(B) shows the number of re-searchers in the university and college sector esti-mated in accordance with each country’s statistics on education. The values in this figure are the result of estimates in accordance with Japan’s measure-ment method of the number of researchers in the university and college sector; in other words, the values were obtained after extracting the data for the breakdown of “regular researchers” which appeared in the “Survey of Research and Development” (“teachers”, “doctor course students”, and “medical staff and others”) from the statistics on education for each country(7)
The latter Chart shows that the number of re-searchers in Japan is approximately one third of that in U.S. Also, the number of researchers per 1 mil-lion-person population is approximately 2,000 to 2,500 people in each country. It is apparent that Japan does not have an especially large number of researchers compared to other countries. (7)The following materials were used as statistics on education for each country. Japan: MEXT, “Report on School Basic Survey” U.S.: The Integrated Postsecondary Education Data System (IPEDS), U.K.: The Higher Education Statistics Agency (HESA) Germany: The Federal Statistical Office (Personal an Hochschulen)
Chart 2-2-8: Number of researchers in the university and
college sector
(A) The number of researchers based on the data by OECD (FTE)
(B) The results of the estimate of the number of researchers
in accordance with the statistics on education (2006)
Source: NISTEP, "Comparative analysis of R&D inputs and outputs
18.0 18.6
4.9 7.1
1,413
667 838 862
0
500
1,000
1,500
2,000
0
5
10
15
20
Japan (2006 year) U.S. (1999 year) U.K. (1998 year) Germany (2006 year)
Per 1
Milli
on-p
erso
n Po
pulat
ion
Full T
ime E
quiva
lents
Number of researchers (FTE) Per 1 million -person population
10,000 people people
24.8
74.1
15.9 14.9
1,938
2,462 2,620
1,805
0
500
1,000
1,500
2,000
2,500
3,000
3,500
4,000
0
10
20
30
40
50
60
70
80
Japan U.S. U.K. Germany
Per 1
Millio
n-pe
rson
Pop
ulatio
n
Numb
er of
Res
earch
ers (
Head
Cou
nt)
Number of researchers (Head Count) Per 1 million-person population
10,000 people people
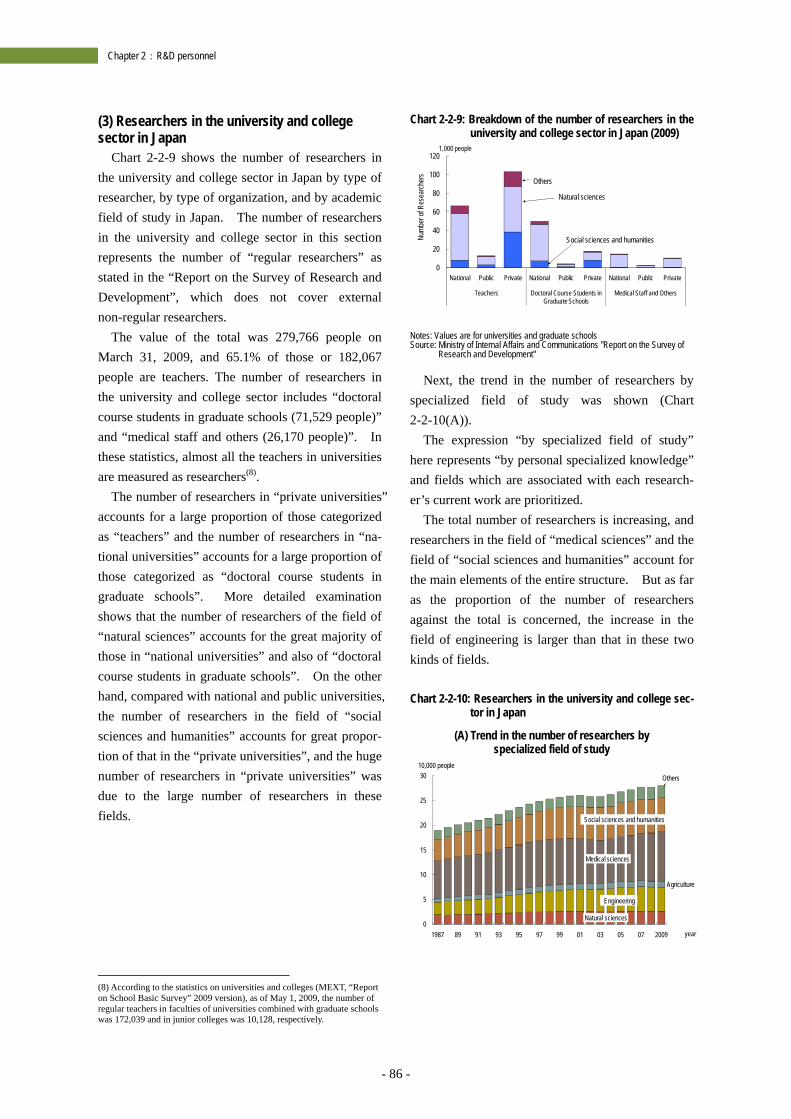
- 86 -
Chapter 2:R&D personnel
(3) Researchers in the university and college sector in Japan
Chart 2-2-9 shows the number of researchers in the university and college sector in Japan by type of researcher, by type of organization, and by academic field of study in Japan. The number of researchers in the university and college sector in this section represents the number of “regular researchers” as stated in the “Report on the Survey of Research and Development”, which does not cover external non-regular researchers.
The value of the total was 279,766 people on March 31, 2009, and 65.1% of those or 182,067 people are teachers. The number of researchers in the university and college sector includes “doctoral course students in graduate schools (71,529 people)” and “medical staff and others (26,170 people)”. In these statistics, almost all the teachers in universities are measured as researchers(8).
The number of researchers in “private universities” accounts for a large proportion of those categorized as “teachers” and the number of researchers in “na-tional universities” accounts for a large proportion of those categorized as “doctoral course students in graduate schools”. More detailed examination shows that the number of researchers of the field of “natural sciences” accounts for the great majority of those in “national universities” and also of “doctoral course students in graduate schools”. On the other hand, compared with national and public universities, the number of researchers in the field of “social sciences and humanities” accounts for great propor-tion of that in the “private universities”, and the huge number of researchers in “private universities” was due to the large number of researchers in these fields.
(8) According to the statistics on universities and colleges (MEXT, “Report on School Basic Survey” 2009 version), as of May 1, 2009, the number of regular teachers in faculties of universities combined with graduate schools was 172,039 and in junior colleges was 10,128, respectively.
Chart 2-2-9: Breakdown of the number of researchers in the university and college sector in Japan (2009)
Notes: Values are for universities and graduate schools Source: Ministry of Internal Affairs and Communications "Report on the Survey of
Research and Development"
Next, the trend in the number of researchers by specialized field of study was shown (Chart 2-2-10(A)).
The expression “by specialized field of study” here represents “by personal specialized knowledge” and fields which are associated with each research-er’s current work are prioritized.
The total number of researchers is increasing, and researchers in the field of “medical sciences” and the field of “social sciences and humanities” account for the main elements of the entire structure. But as far as the proportion of the number of researchers against the total is concerned, the increase in the field of engineering is larger than that in these two kinds of fields. Chart 2-2-10: Researchers in the university and college sec-
tor in Japan
(A) Trend in the number of researchers by specialized field of study
0
20
40
60
80
100
120
National Public Private National Public Private National Public Private
Teachers Doctoral Course Students in Graduate Schools
Medical Staff and Others
Numb
er of
Res
earch
ers
1,000 people
Natural sciences
Social sciences and humanities
Others
Natural sciences
Medical sciences
0
5
10
15
20
25
30
1987 89 91 93 95 97 99 01 03 05 07 2009
10,000 people
year
Social sciences and humanities
Engineering
Others
Agriculture
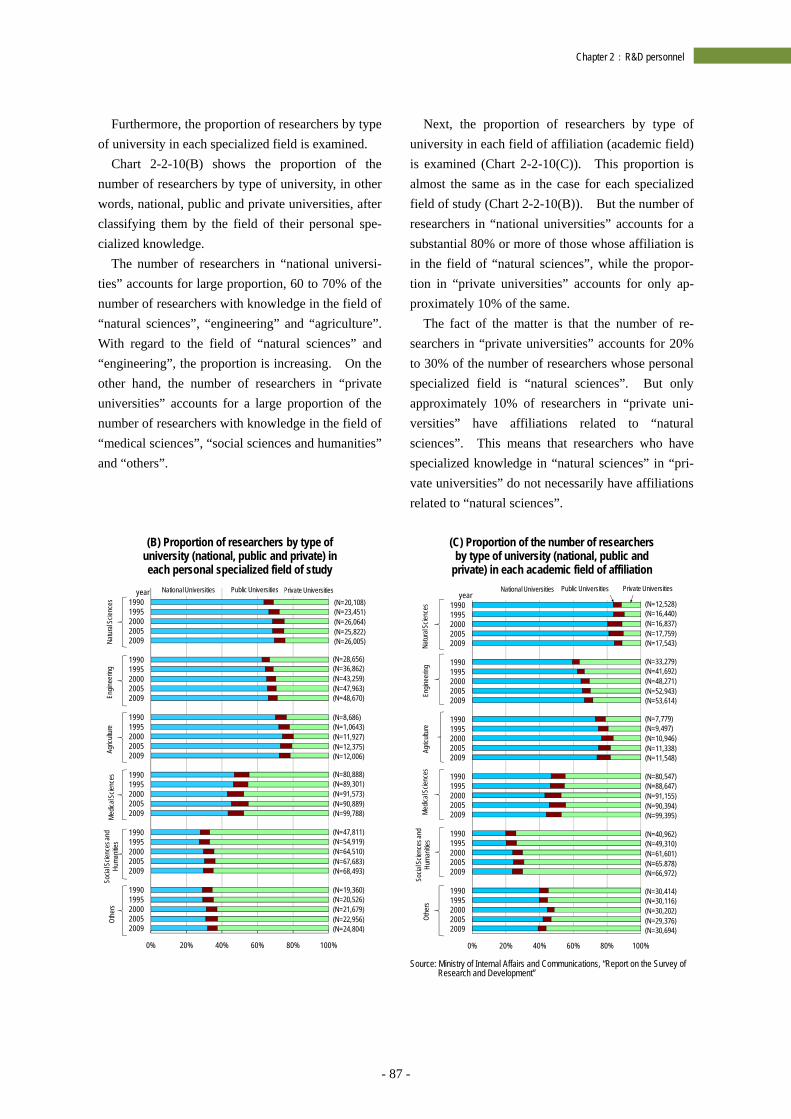
- 87 -
Chapter 2:R&D personnel
Furthermore, the proportion of researchers by type of university in each specialized field is examined.
Chart 2-2-10(B) shows the proportion of the number of researchers by type of university, in other words, national, public and private universities, after classifying them by the field of their personal spe-cialized knowledge.
The number of researchers in “national universi-ties” accounts for large proportion, 60 to 70% of the number of researchers with knowledge in the field of “natural sciences”, “engineering” and “agriculture”. With regard to the field of “natural sciences” and “engineering”, the proportion is increasing. On the other hand, the number of researchers in “private universities” accounts for a large proportion of the number of researchers with knowledge in the field of “medical sciences”, “social sciences and humanities” and “others”.
(B) Proportion of researchers by type of university (national, public and private) in each personal specialized field of study
Next, the proportion of researchers by type of university in each field of affiliation (academic field) is examined (Chart 2-2-10(C)). This proportion is almost the same as in the case for each specialized field of study (Chart 2-2-10(B)). But the number of researchers in “national universities” accounts for a substantial 80% or more of those whose affiliation is in the field of “natural sciences”, while the propor-tion in “private universities” accounts for only ap-proximately 10% of the same.
The fact of the matter is that the number of re-searchers in “private universities” accounts for 20% to 30% of the number of researchers whose personal specialized field is “natural sciences”. But only approximately 10% of researchers in “private uni-versities” have affiliations related to “natural sciences”. This means that researchers who have specialized knowledge in “natural sciences” in “pri-vate universities” do not necessarily have affiliations related to “natural sciences”.
(C) Proportion of the number of researchers by type of university (national, public and
private) in each academic field of affiliation
Source: Ministry of Internal Affairs and Communications, “Report on the Survey of
Research and Development”
0% 20% 40% 60% 80% 100%
20092005200019951990
20092005200019951990
20092005200019951990
20092005200019951990
20092005200019951990
20092005200019951990
year
Socia
lScie
nces
and
Huma
nities
Natur
al Sc
ience
sEn
ginee
ring
Agric
ultur
eMe
dical
Scien
ces
Othe
rs
National Universities Private UniversitiesPublic Universities
(N=20,108)(N=23,451)(N=26,064)(N=25,822)(N=26,005)
(N=19,360)(N=20,526)(N=21,679)(N=22,956)(N=24,804)
(N=47,811)(N=54,919)(N=64,510)(N=67,683)(N=68,493)
(N=80,888)(N=89,301)(N=91,573)(N=90,889)(N=99,788)
(N=8,686)(N=1,0643)(N=11,927)(N=12,375)(N=12,006)
(N=28,656)(N=36,862)(N=43,259)(N=47,963)(N=48,670)
0% 20% 40% 60% 80% 100%
20092005200019951990
20092005200019951990
20092005200019951990
20092005200019951990
20092005200019951990
20092005200019951990
year
(N=30,414)(N=30,116)(N=30,202)(N=29,376)(N=30,694)
(N=12,528)(N=16,440)(N=16,837)(N=17,759)(N=17,543)
(N=33,279)(N=41,692)(N=48,271)(N=52,943)(N=53,614)
(N=7,779)(N=9,497)(N=10,946)(N=11,338)(N=11,548)
(N=80,547)(N=88,647)(N=91,155)(N=90,394)(N=99,395)
(N=40,962)(N=49,310)(N=61,601)(N=65.878)(N=66,972)
Natur
al Sc
ience
sAg
ricult
ure
Medic
al Sc
ience
sSo
cial S
cienc
es an
d Hu
manit
iesOt
hers
National Universities Private UniversitiesPublic Universities
Engin
eerin
g
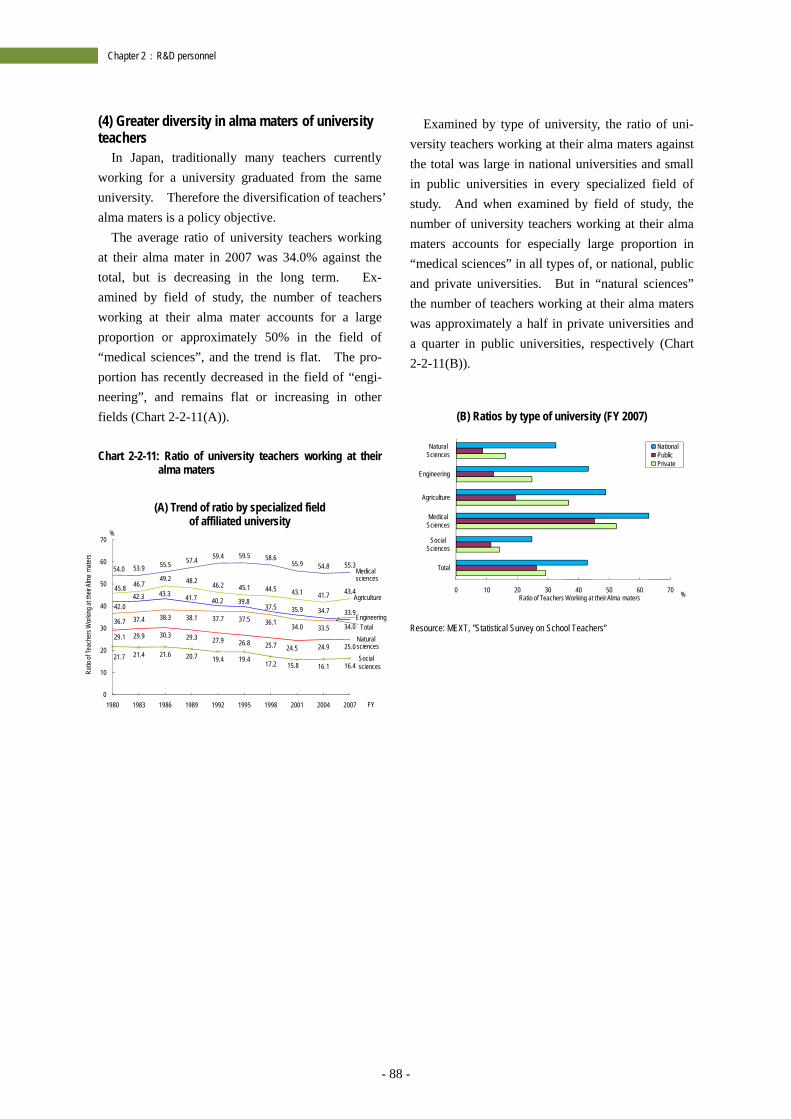
- 88 -
Chapter 2:R&D personnel
(4) Greater diversity in alma maters of university teachers
In Japan, traditionally many teachers currently working for a university graduated from the same university. Therefore the diversification of teachers’ alma maters is a policy objective.
The average ratio of university teachers working at their alma mater in 2007 was 34.0% against the total, but is decreasing in the long term. Ex-amined by field of study, the number of teachers working at their alma mater accounts for a large proportion or approximately 50% in the field of “medical sciences”, and the trend is flat. The pro-portion has recently decreased in the field of “engi-neering”, and remains flat or increasing in other fields (Chart 2-2-11(A)). Chart 2-2-11: Ratio of university teachers working at their
alma maters
(A) Trend of ratio by specialized field of affiliated university
Examined by type of university, the ratio of uni-versity teachers working at their alma maters against the total was large in national universities and small in public universities in every specialized field of study. And when examined by field of study, the number of university teachers working at their alma maters accounts for especially large proportion in “medical sciences” in all types of, or national, public and private universities. But in “natural sciences” the number of teachers working at their alma maters was approximately a half in private universities and a quarter in public universities, respectively (Chart 2-2-11(B)).
(B) Ratios by type of university (FY 2007)
Resource: MEXT, "Statistical Survey on School Teachers”
36.7 37.4 38.3 38.1 37.7 37.5 36.1 34.0 33.5 34.0
21.7 21.4 21.6 20.7 19.4 19.4 17.2 15.8 16.1 16.4
29.1 29.9 30.3 29.3 27.9 26.8 25.7 24.5 24.9 25.0
42.042.3 43.3 41.7 40.2 39.8
37.5 35.9 34.7 33.9
45.8 46.749.2 48.2 46.2 45.1 44.5 43.1 41.7 43.4
54.0 53.9 55.5 57.4 59.4 59.5 58.655.9 54.8 55.3
0
10
20
30
40
50
60
70
1980 1983 1986 1989 1992 1995 1998 2001 2004 2007
Ratio
of Te
ache
rs W
orkin
g at t
heir A
lma
mate
rs
FY
%
Social sciences
Naturalsciences
Engineering
Agriculture
Medicalsciences
Total
0 10 20 30 40 50 60 70
Total
Social Sciences
Medical Sciences
Agriculture
Engineering
Natural Sciences
Ratio of Teachers Working at their Alma maters
NationalPublicPrivate
%
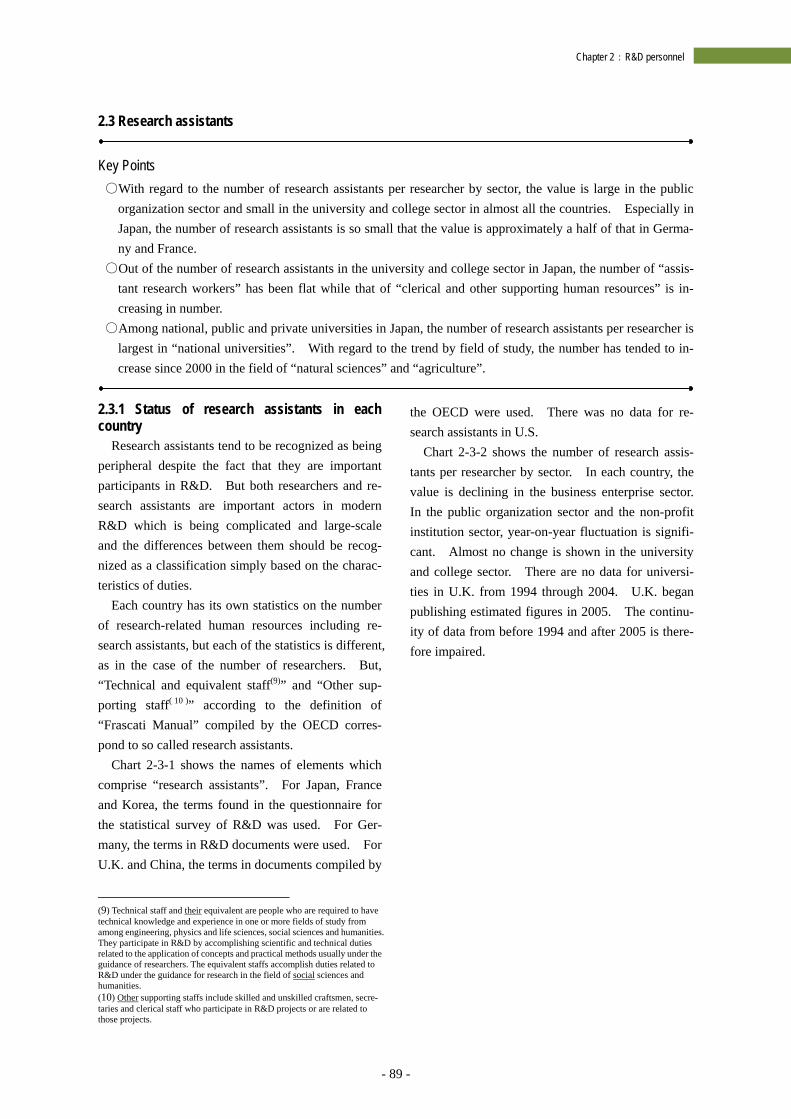
- 89 -
Chapter 2:R&D personnel
2.3 Research assistants
Key Points ○With regard to the number of research assistants per researcher by sector, the value is large in the public
organization sector and small in the university and college sector in almost all the countries. Especially in Japan, the number of research assistants is so small that the value is approximately a half of that in Germa-ny and France.
○Out of the number of research assistants in the university and college sector in Japan, the number of “assis-tant research workers” has been flat while that of “clerical and other supporting human resources” is in-creasing in number.
○Among national, public and private universities in Japan, the number of research assistants per researcher is largest in “national universities”. With regard to the trend by field of study, the number has tended to in-crease since 2000 in the field of “natural sciences” and “agriculture”.
2.3.1 Status of research assistants in each country
Research assistants tend to be recognized as being peripheral despite the fact that they are important participants in R&D. But both researchers and re-search assistants are important actors in modern R&D which is being complicated and large-scale and the differences between them should be recog-nized as a classification simply based on the charac-teristics of duties.
Each country has its own statistics on the number of research-related human resources including re-search assistants, but each of the statistics is different, as in the case of the number of researchers. But, “Technical and equivalent staff(9)” and “Other sup-porting staff( 10 )” according to the definition of “Frascati Manual” compiled by the OECD corres-pond to so called research assistants.
Chart 2-3-1 shows the names of elements which comprise “research assistants”. For Japan, France and Korea, the terms found in the questionnaire for the statistical survey of R&D was used. For Ger-many, the terms in R&D documents were used. For U.K. and China, the terms in documents compiled by
(9) Technical staff and their equivalent are people who are required to have technical knowledge and experience in one or more fields of study from among engineering, physics and life sciences, social sciences and humanities. They participate in R&D by accomplishing scientific and technical duties related to the application of concepts and practical methods usually under the guidance of researchers. The equivalent staffs accomplish duties related to R&D under the guidance for research in the field of social sciences and humanities. (10) Other supporting staffs include skilled and unskilled craftsmen, secre-taries and clerical staff who participate in R&D projects or are related to those projects.
the OECD were used. There was no data for re-search assistants in U.S.
Chart 2-3-2 shows the number of research assis-tants per researcher by sector. In each country, the value is declining in the business enterprise sector. In the public organization sector and the non-profit institution sector, year-on-year fluctuation is signifi-cant. Almost no change is shown in the university and college sector. There are no data for universi-ties in U.K. from 1994 through 2004. U.K. began publishing estimated figures in 2005. The continu-ity of data from before 1994 and after 2005 is there-fore impaired.
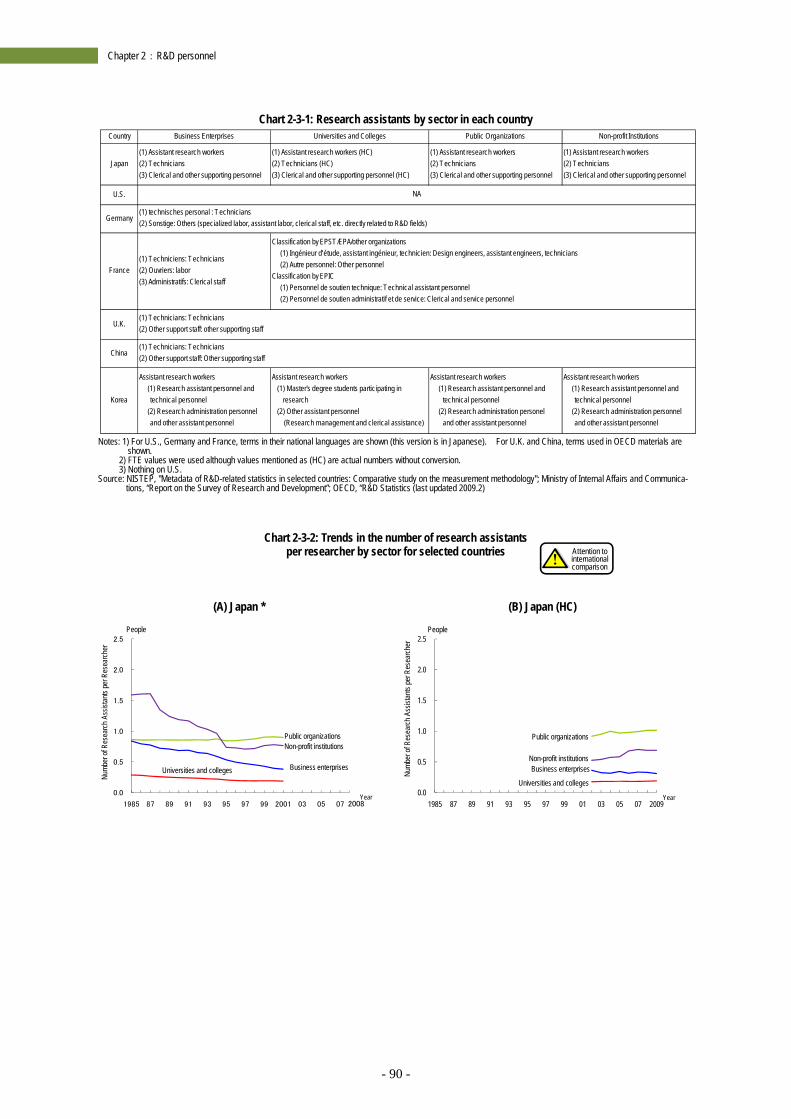
- 90 -
Chapter 2:R&D personnel
Chart 2-3-1: Research assistants by sector in each country
Notes: 1) For U.S., Germany and France, terms in their national languages are shown (this version is in Japanese). For U.K. and China, terms used in OECD materials are
shown. 2) FTE values were used although values mentioned as (HC) are actual numbers without conversion. 3) Nothing on U.S.
Source: NISTEP, "Metadata of R&D-related statistics in selected countries: Comparative study on the measurement methodology"; Ministry of Internal Affairs and Communica-tions, “Report on the Survey of Research and Development”; OECD, “R&D Statistics (last updated 2009.2)
Chart 2-3-2: Trends in the number of research assistants per researcher by sector for selected countries
(A) Japan *
(B) Japan (HC)
Country Business Enterprises Universities and Colleges Public Organizations Non-profit Institutions
Japan(1) Assistant research workers(2) Technicians(3) Clerical and other supporting personnel
(1) Assistant research workers (HC)(2) Technicians (HC)(3) Clerical and other supporting personnel (HC)
(1) Assistant research workers(2) Technicians(3) Clerical and other supporting personnel
(1) Assistant research workers(2) Technicians(3) Clerical and other supporting personnel
U.S.
Germany
France(1) Techniciens: Technicians(2) Ouvriers: labor(3) Administratifs: Clerical staff
U.K.
China
Korea
Assistant research workers (1) Research assistant personnel and technical personnel (2) Research administration personnel and other assistant personnel
Assistant research workers (1) Master's degree students participating in research (2) Other assistant personnel (Research management and clerical assistance)
Assistant research workers (1) Research assistant personnel and technical personnel (2) Research administration personel and other assistant personnel
Assistant research workers (1) Research assistant personnel and technical personnel (2) Research administration personnel and other assistant personnel
NA
(1) technisches personal : Technicians(2) Sonstige: Others (specialized labor, assistant labor, clerical staff, etc. directly related to R&D fields)
Classification by EPST/EPA/other organizations (1) Ingénieur d’étude, assistant ingénieur, technicien: Design engineers, assistant engineers, technicians (2) Autre personnel: Other personnelClassification by EPIC (1) Personnel de soutien technique: Technical assistant personnel (2) Personnel de soutien administratif et de service: Clerical and service personnel
(1) Technicians: Technicians(2) Other support staff: other supporting staff
(1) Technicians: Technicians(2) Other support staff: Other supporting staff
0.0
0.5
1.0
1.5
2.0
2.5
1985 87 89 91 93 95 97 99 2001 03 05 07 2008
Universities and colleges
Non-profit institutions
Business enterprises
Numb
er of
Res
earch
Ass
istan
ts pe
r Res
earch
er
People
Public organizations
Year 0.0
0.5
1.0
1.5
2.0
2.5
1985 87 89 91 93 95 97 99 01 03 05 07 2009
Universities and colleges
Non-profit institutionsBusiness enterprisesNu
mber
of R
esea
rch A
ssist
ants
per R
esea
rcher
People
Public organizations
Year
Attention to international comparison
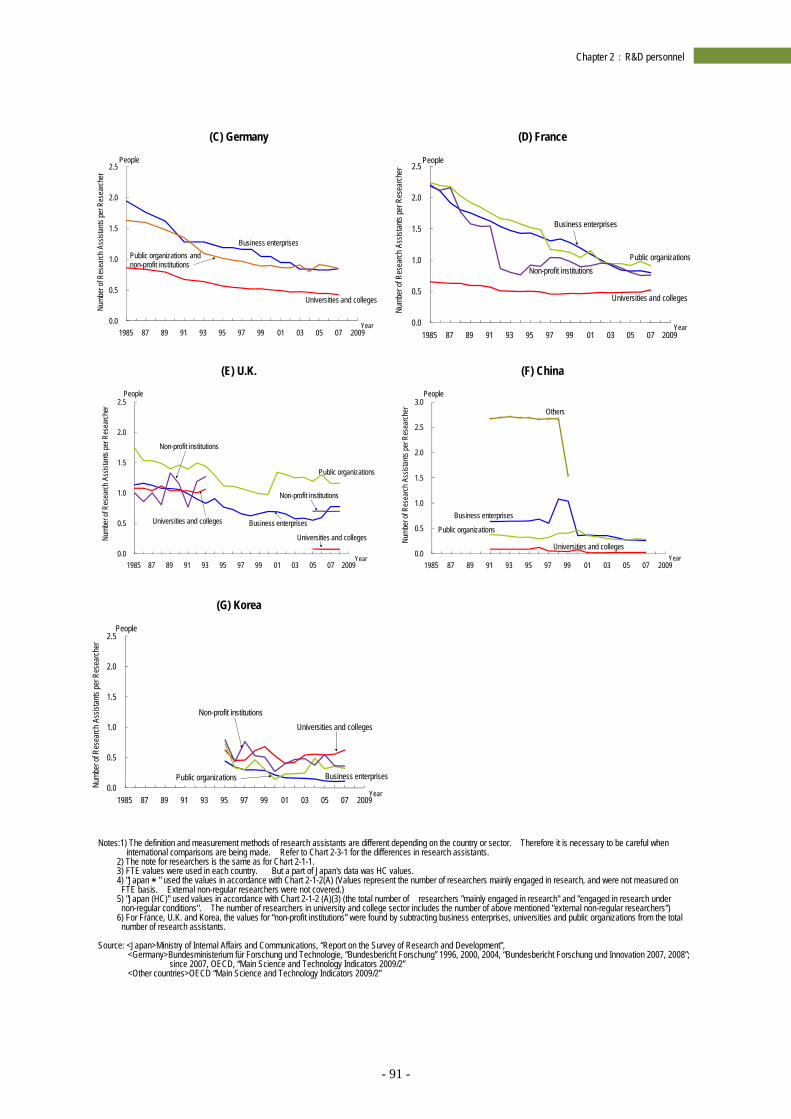
- 91 -
Chapter 2:R&D personnel
(C) Germany
(D) France
(E) U.K.
(F) China
(G) Korea
Notes:1) The definition and measurement methods of research assistants are different depending on the country or sector. Therefore it is necessary to be careful when
international comparisons are being made. Refer to Chart 2-3-1 for the differences in research assistants. 2) The note for researchers is the same as for Chart 2-1-1. 3) FTE values were used in each country. But a part of Japan's data was HC values. 4) "Japan*" used the values in accordance with Chart 2-1-2(A) (Values represent the number of researchers mainly engaged in research, and were not measured on
FTE basis. External non-regular researchers were not covered.) 5) "Japan (HC)" used values in accordance with Chart 2-1-2 (A)(3) (the total number of researchers "mainly engaged in research" and "engaged in research under
non-regular conditions". The number of researchers in university and college sector includes the number of above mentioned "external non-regular researchers") 6) For France, U.K. and Korea, the values for “non-profit institutions” were found by subtracting business enterprises, universities and public organizations from the total
number of research assistants.
Source: <Japan>Ministry of Internal Affairs and Communications, “Report on the Survey of Research and Development”, <Germany>Bundesministerium für Forschung und Technologie, “Bundesbericht Forschung” 1996, 2000, 2004, “Bundesbericht Forschung und Innovation 2007, 2008”;
since 2007, OECD, “Main Science and Technology Indicators 2009/2” <Other countries>OECD “Main Science and Technology Indicators 2009/2”
0.0
0.5
1.0
1.5
2.0
2.5
1985 87 89 91 93 95 97 99 01 03 05 07 2009
Business enterprises
Numb
er of
Rese
arch
Ass
istan
ts pe
r Res
earch
er
People
Public organizations and non-profit institutions
Year
Universities and colleges
0.0
0.5
1.0
1.5
2.0
2.5
1985 87 89 91 93 95 97 99 01 03 05 07 2009
Universities and colleges
Non-profit institutions
Business enterprises
Numb
er of
Res
earch
Ass
istan
ts pe
r Res
earch
er
People
Public organizations
Year
0.0
0.5
1.0
1.5
2.0
2.5
1985 87 89 91 93 95 97 99 01 03 05 07 2009
Universities and colleges
Non-profit institutions
Business enterprises
Numb
er of
Res
earch
Ass
istan
ts pe
r Res
earch
er
People
Public organizations
Year
Universities and colleges
Non-profit institutions
0.0
0.5
1.0
1.5
2.0
2.5
3.0
1985 87 89 91 93 95 97 99 01 03 05 07 2009
Others
Business enterprises
Numb
er of
Res
earch
Ass
istan
ts pe
r Res
earch
erPeople
Public organizations
YearUniversities and colleges
0.0
0.5
1.0
1.5
2.0
2.5
1985 87 89 91 93 95 97 99 01 03 05 07 2009
Non-profit institutions
Business enterprises
Numb
er of
Res
earch
Ass
istan
ts pe
r Res
earch
er
People
Public organizations
Year
Universities and colleges
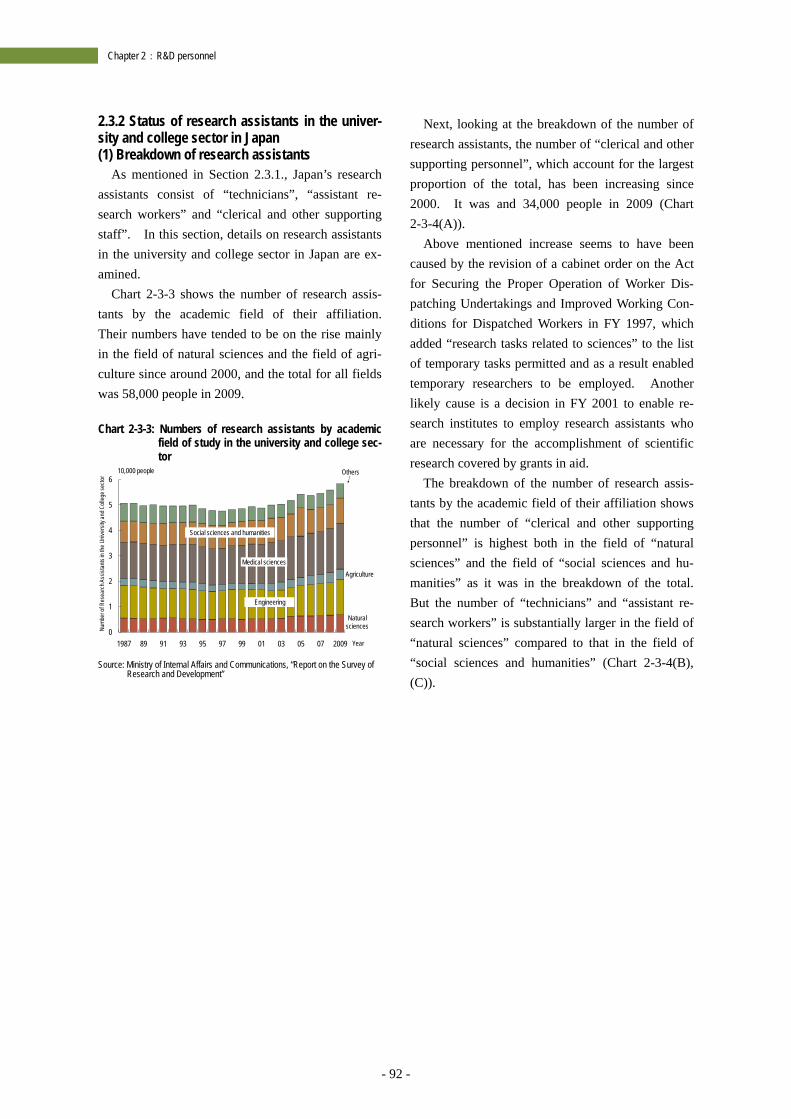
- 92 -
Chapter 2:R&D personnel
2.3.2 Status of research assistants in the univer-sity and college sector in Japan (1) Breakdown of research assistants
As mentioned in Section 2.3.1., Japan’s research assistants consist of “technicians”, “assistant re-search workers” and “clerical and other supporting staff”. In this section, details on research assistants in the university and college sector in Japan are ex-amined.
Chart 2-3-3 shows the number of research assis-tants by the academic field of their affiliation. Their numbers have tended to be on the rise mainly in the field of natural sciences and the field of agri-culture since around 2000, and the total for all fields was 58,000 people in 2009.
Chart 2-3-3: Numbers of research assistants by academic
field of study in the university and college sec-tor
Source: Ministry of Internal Affairs and Communications, “Report on the Survey of
Research and Development”
Next, looking at the breakdown of the number of research assistants, the number of “clerical and other supporting personnel”, which account for the largest proportion of the total, has been increasing since 2000. It was and 34,000 people in 2009 (Chart 2-3-4(A)).
Above mentioned increase seems to have been caused by the revision of a cabinet order on the Act for Securing the Proper Operation of Worker Dis-patching Undertakings and Improved Working Con-ditions for Dispatched Workers in FY 1997, which added “research tasks related to sciences” to the list of temporary tasks permitted and as a result enabled temporary researchers to be employed. Another likely cause is a decision in FY 2001 to enable re-search institutes to employ research assistants who are necessary for the accomplishment of scientific research covered by grants in aid.
The breakdown of the number of research assis-tants by the academic field of their affiliation shows that the number of “clerical and other supporting personnel” is highest both in the field of “natural sciences” and the field of “social sciences and hu-manities” as it was in the breakdown of the total. But the number of “technicians” and “assistant re-search workers” is substantially larger in the field of “natural sciences” compared to that in the field of “social sciences and humanities” (Chart 2-3-4(B), (C)).
Naturalsciences
Medical sciences
0
1
2
3
4
5
6
1987 89 91 93 95 97 99 01 03 05 07 2009
10,000 people
Year
Social sciences and humanities
Others
Engineering
Agriculture
Numb
er of
Res
earc
h Ass
istan
ts in
the
Unive
rsity
and C
olleg
e sec
tor
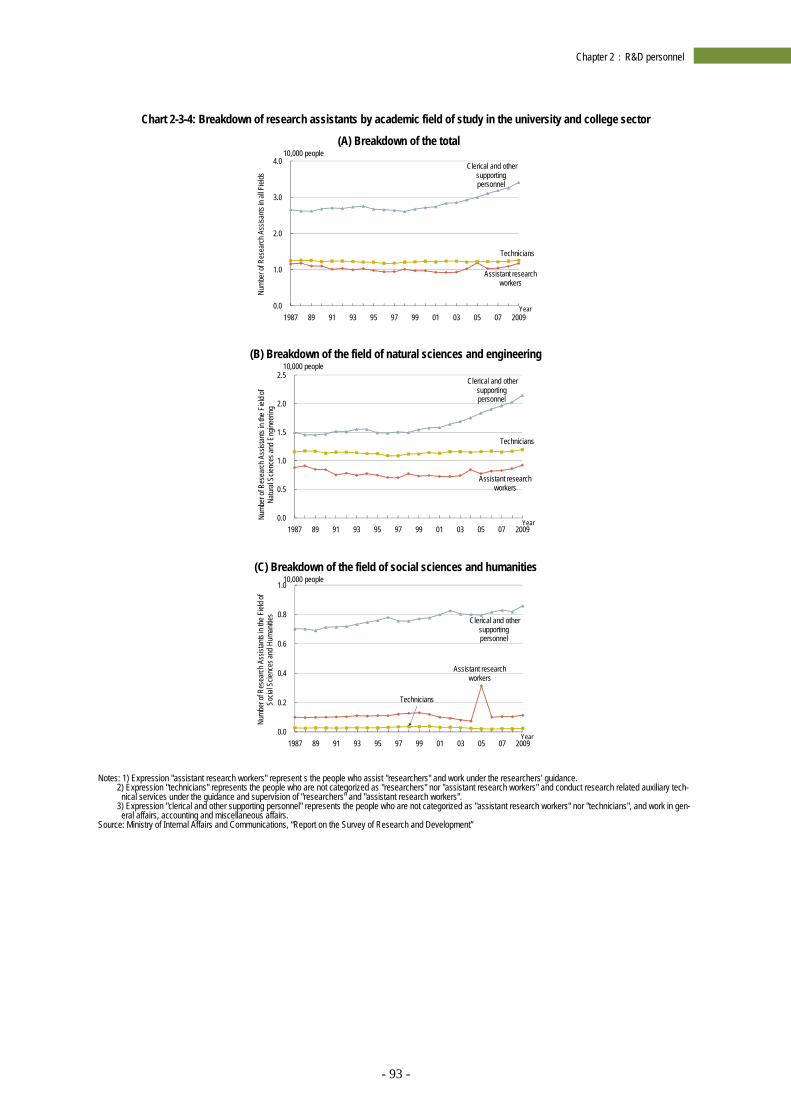
- 93 -
Chapter 2:R&D personnel
Chart 2-3-4: Breakdown of research assistants by academic field of study in the university and college sector
(A) Breakdown of the total
(B) Breakdown of the field of natural sciences and engineering
(C) Breakdown of the field of social sciences and humanities
Notes: 1) Expression "assistant research workers" represent s the people who assist "researchers" and work under the researchers' guidance.
2) Expression "technicians" represents the people who are not categorized as "researchers" nor "assistant research workers" and conduct research related auxiliary tech-nical services under the guidance and supervision of "researchers" and "assistant research workers".
3) Expression "clerical and other supporting personnel" represents the people who are not categorized as "assistant research workers" nor "technicians", and work in gen-eral affairs, accounting and miscellaneous affairs.
Source: Ministry of Internal Affairs and Communications, “Report on the Survey of Research and Development”
Assistant research workers
Technicians
Clerical and other supporting personnel
0.0
1.0
2.0
3.0
4.0
1987 89 91 93 95 97 99 01 03 05 07 2009
Numb
er of
Res
earch
Ass
isants
in al
l Fiel
ds
10,000 people
Year
Assistant research workers
Technicians
Clerical and other supporting personnel
0.0
0.5
1.0
1.5
2.0
2.5
1987 89 91 93 95 97 99 01 03 05 07 2009
Numb
er of
Res
earch
Ass
istan
ts in
the F
ield o
f Na
tural
Scien
ces a
nd E
ngine
ering
10,000 people
Year
Assistant research workers
Technicians
Clerical and other supporting personnel
0.0
0.2
0.4
0.6
0.8
1.0
1987 89 91 93 95 97 99 01 03 05 07 2009
Numb
er of
Res
earch
Ass
istan
ts in
the F
ield o
f So
cial S
cienc
es an
d Hu
manit
ies
10,000 people
Year
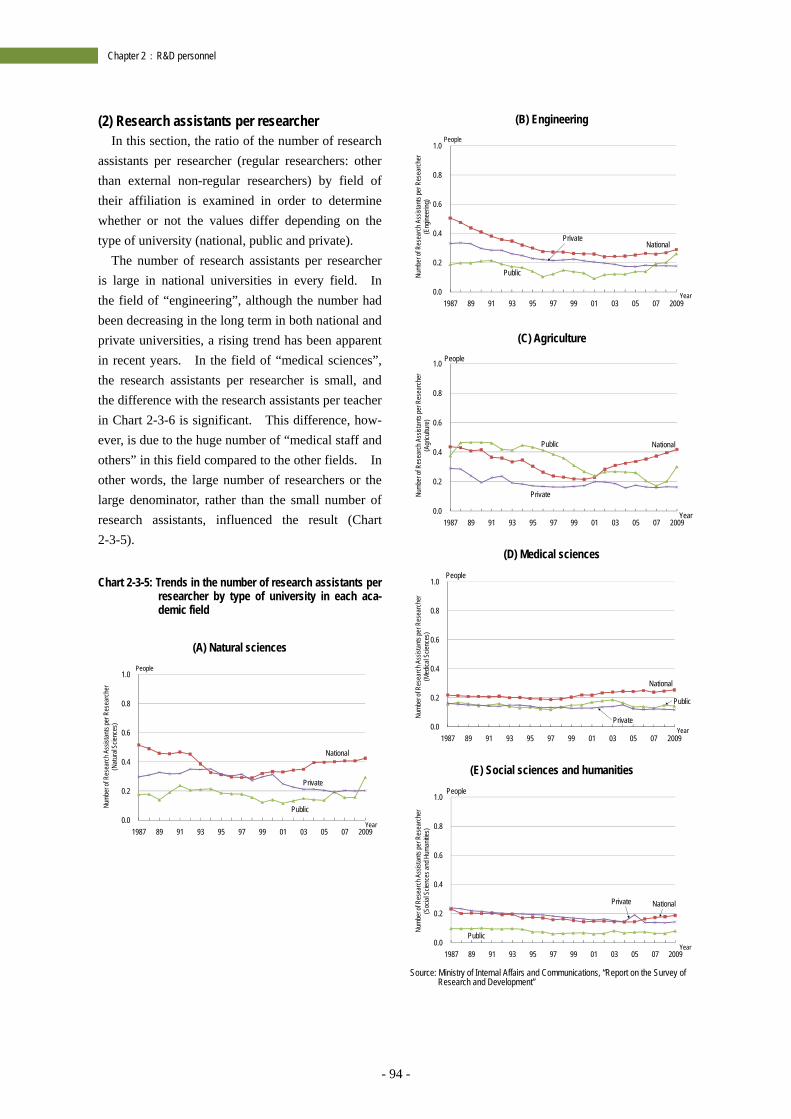
- 94 -
Chapter 2:R&D personnel
(2) Research assistants per researcher In this section, the ratio of the number of research
assistants per researcher (regular researchers: other than external non-regular researchers) by field of their affiliation is examined in order to determine whether or not the values differ depending on the type of university (national, public and private).
The number of research assistants per researcher is large in national universities in every field. In the field of “engineering”, although the number had been decreasing in the long term in both national and private universities, a rising trend has been apparent in recent years. In the field of “medical sciences”, the research assistants per researcher is small, and the difference with the research assistants per teacher in Chart 2-3-6 is significant. This difference, how-ever, is due to the huge number of “medical staff and others” in this field compared to the other fields. In other words, the large number of researchers or the large denominator, rather than the small number of research assistants, influenced the result (Chart 2-3-5). Chart 2-3-5: Trends in the number of research assistants per
researcher by type of university in each aca-demic field
(A) Natural sciences
(B) Engineering
(C) Agriculture
(D) Medical sciences
(E) Social sciences and humanities
Source: Ministry of Internal Affairs and Communications, “Report on the Survey of
Research and Development”
0.0
0.2
0.4
0.6
0.8
1.0
1987 89 91 93 95 97 99 01 03 05 07 2009
People
Year
National
Public
Private
Numb
er of
Res
earc
hAss
istan
ts pe
r Res
earc
her
(Nat
ural
Scien
ces)
0.0
0.2
0.4
0.6
0.8
1.0
1987 89 91 93 95 97 99 01 03 05 07 2009
People
Year
National
Public
Private
Numb
er of
Res
earc
h Ass
istan
ts pe
r Res
earc
her
(Eng
ineer
ing)
0.0
0.2
0.4
0.6
0.8
1.0
1987 89 91 93 95 97 99 01 03 05 07 2009
People
Year
Public National
PrivateNumb
er of
Res
earc
h Ass
istan
ts pe
r Res
earc
her
(Agr
icultu
re)
0.0
0.2
0.4
0.6
0.8
1.0
1987 89 91 93 95 97 99 01 03 05 07 2009
People
Year
National
Public
PrivateNumb
er of
Res
earc
hAss
istan
ts pe
r Res
earc
her
(Med
ical S
cienc
es)
0.0
0.2
0.4
0.6
0.8
1.0
1987 89 91 93 95 97 99 01 03 05 07 2009
People
Year
Private
Public
National
Numb
er of
Res
earc
h Ass
istan
tspe
r Res
earc
her
(Soc
ial S
cienc
es an
d Hum
anitie
s)
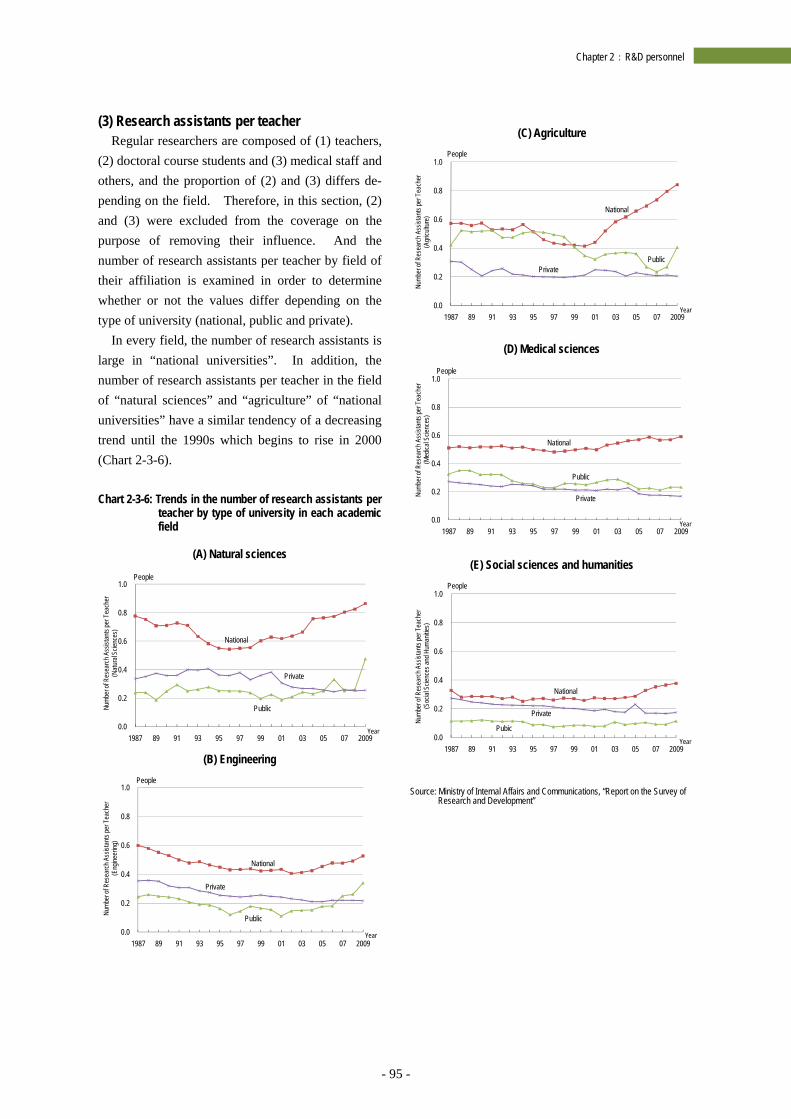
- 95 -
Chapter 2:R&D personnel
(3) Research assistants per teacher Regular researchers are composed of (1) teachers,
(2) doctoral course students and (3) medical staff and others, and the proportion of (2) and (3) differs de-pending on the field. Therefore, in this section, (2) and (3) were excluded from the coverage on the purpose of removing their influence. And the number of research assistants per teacher by field of their affiliation is examined in order to determine whether or not the values differ depending on the type of university (national, public and private).
In every field, the number of research assistants is large in “national universities”. In addition, the number of research assistants per teacher in the field of “natural sciences” and “agriculture” of “national universities” have a similar tendency of a decreasing trend until the 1990s which begins to rise in 2000 (Chart 2-3-6). Chart 2-3-6: Trends in the number of research assistants per
teacher by type of university in each academic field
(A) Natural sciences
(B) Engineering
(C) Agriculture
(D) Medical sciences
(E) Social sciences and humanities
Source: Ministry of Internal Affairs and Communications, “Report on the Survey of
Research and Development”
0.0
0.2
0.4
0.6
0.8
1.0
1987 89 91 93 95 97 99 01 03 05 07 2009
People
Year
Private
Public
National
Numb
er of
Res
earc
h Ass
istan
ts pe
r Tea
cher
(N
atur
al Sc
ience
s)
0.0
0.2
0.4
0.6
0.8
1.0
1987 89 91 93 95 97 99 01 03 05 07 2009
People
Year
National
Public
Private
Numb
er of
Res
earc
h Ass
istan
ts pe
r Tea
cher
(Eng
ineer
ing)
0.0
0.2
0.4
0.6
0.8
1.0
1987 89 91 93 95 97 99 01 03 05 07 2009
People
Year
Private
National
Public
Numb
er of
Res
earc
h Ass
istan
ts pe
r Tea
cher
(A
gricu
lture
)
0.0
0.2
0.4
0.6
0.8
1.0
1987 89 91 93 95 97 99 01 03 05 07 2009
People
Year
National
Public
PrivateNumb
er of
Res
earc
h Ass
istan
ts pe
r Tea
cher
(Med
icalS
cienc
es)
0.0
0.2
0.4
0.6
0.8
1.0
1987 89 91 93 95 97 99 01 03 05 07 2009
People
Year
National
Private
Pubic
Numb
er of
Res
earc
h Ass
istan
ts pe
r Tea
cher
(S
ocial
Scie
nces
and H
uman
ities)

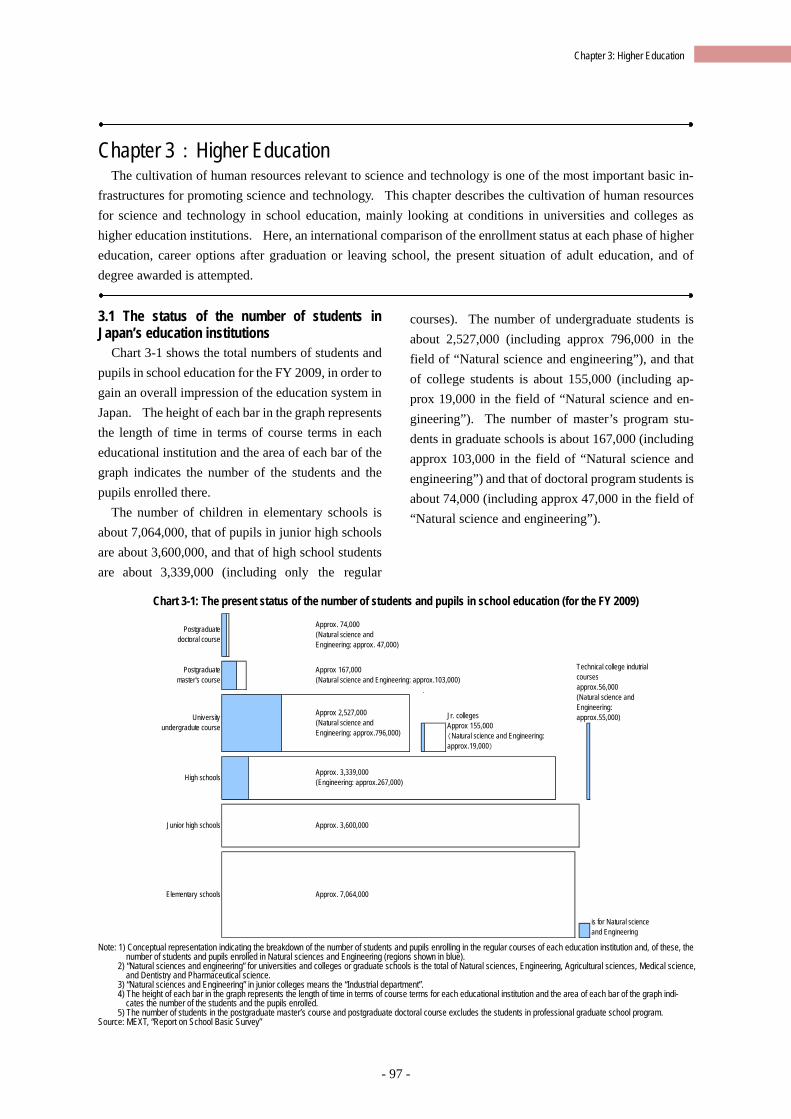
- 97 -
Chapter 3: Higher Education
Chapter 3:Higher Education
The cultivation of human resources relevant to science and technology is one of the most important basic in-frastructures for promoting science and technology. This chapter describes the cultivation of human resources for science and technology in school education, mainly looking at conditions in universities and colleges as higher education institutions. Here, an international comparison of the enrollment status at each phase of higher education, career options after graduation or leaving school, the present situation of adult education, and of degree awarded is attempted.
3.1 The status of the number of students in Japan’s education institutions
Chart 3-1 shows the total numbers of students and pupils in school education for the FY 2009, in order to gain an overall impression of the education system in Japan. The height of each bar in the graph represents the length of time in terms of course terms in each educational institution and the area of each bar of the graph indicates the number of the students and the pupils enrolled there.
The number of children in elementary schools is about 7,064,000, that of pupils in junior high schools are about 3,600,000, and that of high school students are about 3,339,000 (including only the regular
courses). The number of undergraduate students is about 2,527,000 (including approx 796,000 in the field of “Natural science and engineering”), and that of college students is about 155,000 (including ap-prox 19,000 in the field of “Natural science and en-gineering”). The number of master’s program stu-dents in graduate schools is about 167,000 (including approx 103,000 in the field of “Natural science and engineering”) and that of doctoral program students is about 74,000 (including approx 47,000 in the field of “Natural science and engineering”).
Chart 3-1: The present status of the number of students and pupils in school education (for the FY 2009)
Note: 1) Conceptual representation indicating the breakdown of the number of students and pupils enrolling in the regular courses of each education institution and, of these, the
number of students and pupils enrolled in Natural sciences and Engineering (regions shown in blue). 2) “Natural sciences and engineering” for universities and colleges or graduate schools is the total of Natural sciences, Engineering, Agricultural sciences, Medical science,
and Dentistry and Pharmaceutical science. 3) “Natural sciences and Engineering” in junior colleges means the “Industrial department”. 4) The height of each bar in the graph represents the length of time in terms of course terms for each educational institution and the area of each bar of the graph indi-
cates the number of the students and the pupils enrolled. 5) The number of students in the postgraduate master’s course and postgraduate doctoral course excludes the students in professional graduate school program.
Source: MEXT, “Report on School Basic Survey”
短
Technical college indutrialcoursesapprox.56,000(Natural science andEngineering:approx.55,000)
is for Natural scienceand Engineering
Jr. collegesApprox 155,000(Natural science and Engineering:approx.19,000)
Approx. 3,339,000(Engineering: approx.267,000)
Postgraduatedoctoral course
Approx. 74,000(Natural science andEngineering: approx. 47,000)
Postgraduatemaster's course
Approx 167,000(Natural science and Engineering: approx.103,000)
High schools
Elementary schools Approx. 7,064,000
Junior high schools Approx. 3,600,000
Universityundergradute course
Approx 2,527,000(Natural science andEngineering: approx.796,000)
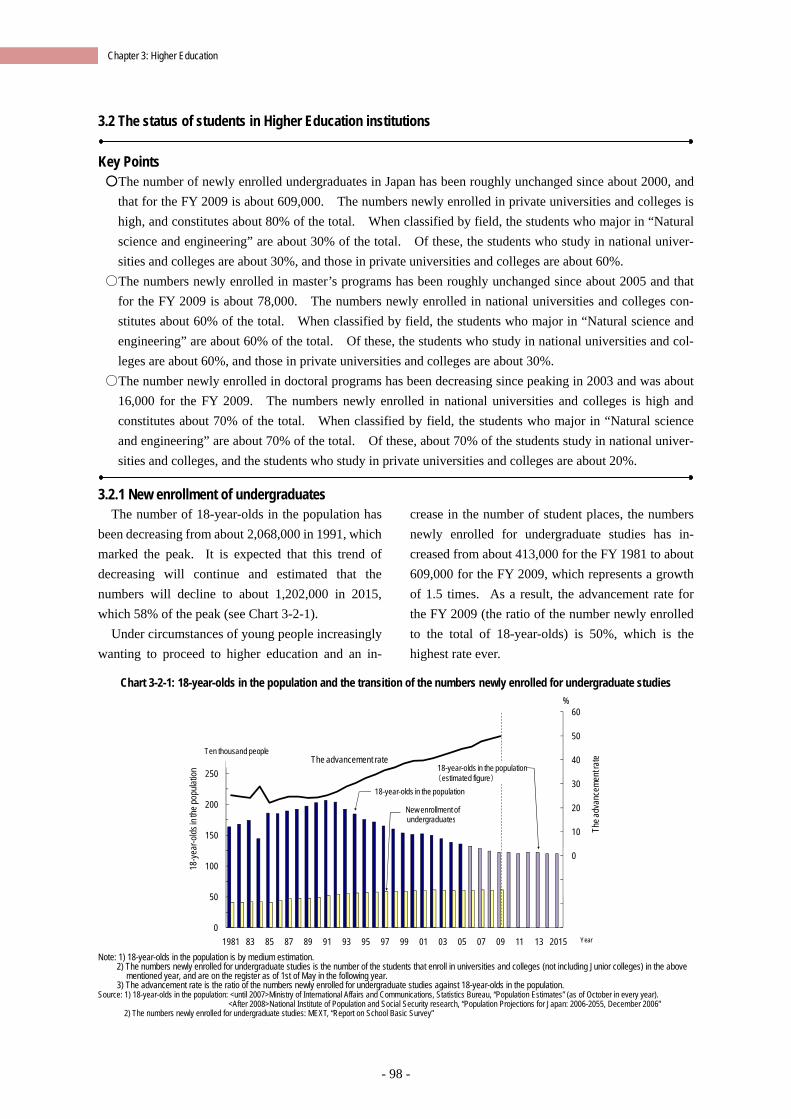
- 98 -
Chapter 3: Higher Education
3.2 The status of students in Higher Education institutions
Key Points ○The number of newly enrolled undergraduates in Japan has been roughly unchanged since about 2000, and
that for the FY 2009 is about 609,000. The numbers newly enrolled in private universities and colleges is high, and constitutes about 80% of the total. When classified by field, the students who major in “Natural science and engineering” are about 30% of the total. Of these, the students who study in national univer-sities and colleges are about 30%, and those in private universities and colleges are about 60%.
○The numbers newly enrolled in master’s programs has been roughly unchanged since about 2005 and that for the FY 2009 is about 78,000. The numbers newly enrolled in national universities and colleges con-stitutes about 60% of the total. When classified by field, the students who major in “Natural science and engineering” are about 60% of the total. Of these, the students who study in national universities and col-leges are about 60%, and those in private universities and colleges are about 30%.
○The number newly enrolled in doctoral programs has been decreasing since peaking in 2003 and was about 16,000 for the FY 2009. The numbers newly enrolled in national universities and colleges is high and constitutes about 70% of the total. When classified by field, the students who major in “Natural science and engineering” are about 70% of the total. Of these, about 70% of the students study in national univer-sities and colleges, and the students who study in private universities and colleges are about 20%.
3.2.1 New enrollment of undergraduates The number of 18-year-olds in the population has
been decreasing from about 2,068,000 in 1991, which marked the peak. It is expected that this trend of decreasing will continue and estimated that the numbers will decline to about 1,202,000 in 2015, which 58% of the peak (see Chart 3-2-1).
Under circumstances of young people increasingly wanting to proceed to higher education and an in-
crease in the number of student places, the numbers newly enrolled for undergraduate studies has in-creased from about 413,000 for the FY 1981 to about 609,000 for the FY 2009, which represents a growth of 1.5 times. As a result, the advancement rate for the FY 2009 (the ratio of the number newly enrolled to the total of 18-year-olds) is 50%, which is the highest rate ever.
Chart 3-2-1: 18-year-olds in the population and the transition of the numbers newly enrolled for undergraduate studies
Note: 1) 18-year-olds in the population is by medium estimation.
2) The numbers newly enrolled for undergraduate studies is the number of the students that enroll in universities and colleges (not including Junior colleges) in the above mentioned year, and are on the register as of 1st of May in the following year.
3) The advancement rate is the ratio of the numbers newly enrolled for undergraduate studies against 18-year-olds in the population. Source: 1) 18-year-olds in the population: <until 2007>Ministry of International Affairs and Communications, Statistics Bureau, “Population Estimates” (as of October in every year).
<After 2008>National Institute of Population and Social Security research, “Population Projections for Japan: 2006-2055, December 2006” 2) The numbers newly enrolled for undergraduate studies: MEXT, “Report on School Basic Survey”
(30)
(20)
(10)
0
10
20
30
40
50
60
0
50
100
150
200
250
300
350
1981 83 85 87 89 91 93 95 97 99 01 03 05 07 09 11 13 2015
The a
dvan
ceme
nt ra
te
Year
%
Ten thousand peopleThe advancement rate
18-y
ear-o
lds in
the p
opula
tion
18-year-olds in the population
New enrollment ofundergraduates
18-year-olds in the population(estimated figure)
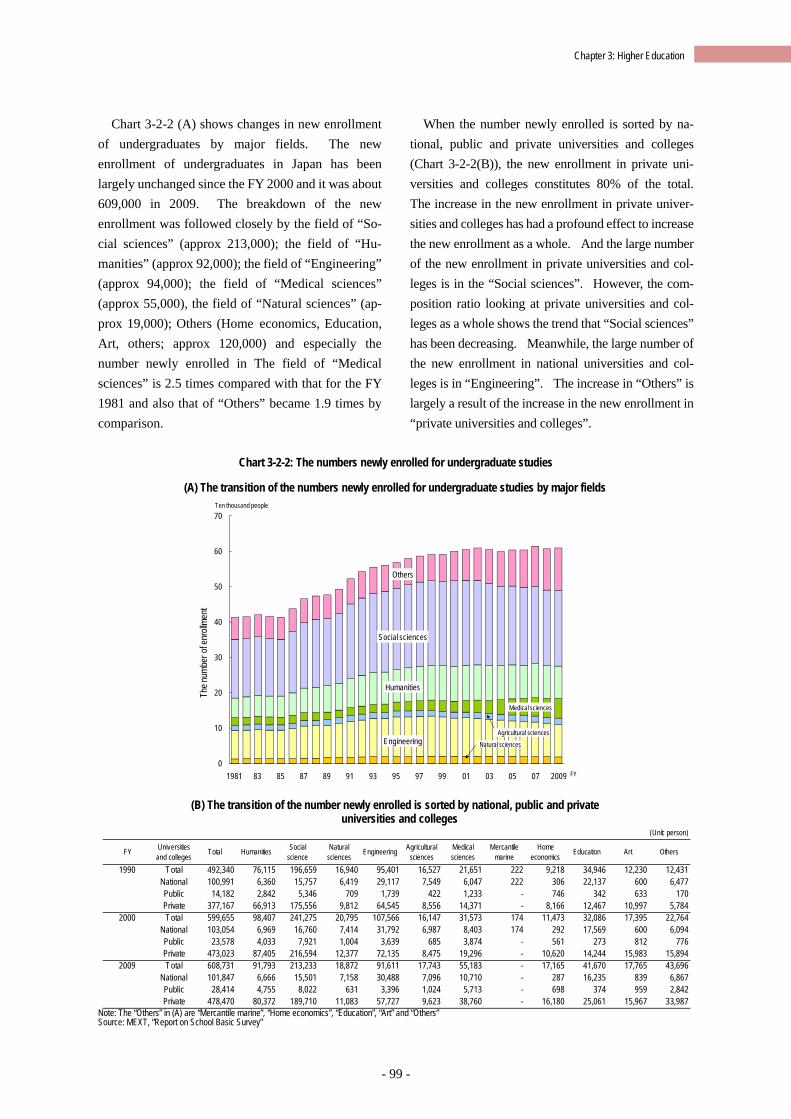
- 99 -
Chapter 3: Higher Education
Chart 3-2-2 (A) shows changes in new enrollment of undergraduates by major fields. The new enrollment of undergraduates in Japan has been largely unchanged since the FY 2000 and it was about 609,000 in 2009. The breakdown of the new enrollment was followed closely by the field of “So-cial sciences” (approx 213,000); the field of “Hu-manities” (approx 92,000); the field of “Engineering” (approx 94,000); the field of “Medical sciences” (approx 55,000), the field of “Natural sciences” (ap-prox 19,000); Others (Home economics, Education, Art, others; approx 120,000) and especially the number newly enrolled in The field of “Medical sciences” is 2.5 times compared with that for the FY 1981 and also that of “Others” became 1.9 times by comparison.
When the number newly enrolled is sorted by na-tional, public and private universities and colleges (Chart 3-2-2(B)), the new enrollment in private uni-versities and colleges constitutes 80% of the total. The increase in the new enrollment in private univer-sities and colleges has had a profound effect to increase the new enrollment as a whole. And the large number of the new enrollment in private universities and col-leges is in the “Social sciences”. However, the com-position ratio looking at private universities and col-leges as a whole shows the trend that “Social sciences” has been decreasing. Meanwhile, the large number of the new enrollment in national universities and col-leges is in “Engineering”. The increase in “Others” is largely a result of the increase in the new enrollment in “private universities and colleges”.
Chart 3-2-2: The numbers newly enrolled for undergraduate studies
(A) The transition of the numbers newly enrolled for undergraduate studies by major fields
(B) The transition of the number newly enrolled is sorted by national, public and private
universities and colleges
Note: The “Others” in (A) are “Mercantile marine”, “Home economics”, “Education”, “Art” and “Others” Source: MEXT, “Report on School Basic Survey”
0
10
20
30
40
50
60
70
1981 83 85 87 89 91 93 95 97 99 01 03 05 07 2009
The n
umbe
r of e
nroll
ment
Social sciences
Humanities
Engineering
Others
Ten thousand people
Agricultural sciences
FY
Medical sciences
Natural sciences
(Unit: person)
FY Universitiesand colleges Total Humanities Social
scienceNatural
sciences Engineering Agriculturalsciences
Medicalsciences
Mercantilemarine
Homeeconomics Education Art Others
1990 Total 492,340 76,115 196,659 16,940 95,401 16,527 21,651 222 9,218 34,946 12,230 12,431National 100,991 6,360 15,757 6,419 29,117 7,549 6,047 222 306 22,137 600 6,477Public 14,182 2,842 5,346 709 1,739 422 1,233 - 746 342 633 170Private 377,167 66,913 175,556 9,812 64,545 8,556 14,371 - 8,166 12,467 10,997 5,784
2000 Total 599,655 98,407 241,275 20,795 107,566 16,147 31,573 174 11,473 32,086 17,395 22,764National 103,054 6,969 16,760 7,414 31,792 6,987 8,403 174 292 17,569 600 6,094Public 23,578 4,033 7,921 1,004 3,639 685 3,874 - 561 273 812 776Private 473,023 87,405 216,594 12,377 72,135 8,475 19,296 - 10,620 14,244 15,983 15,894
2009 Total 608,731 91,793 213,233 18,872 91,611 17,743 55,183 - 17,165 41,670 17,765 43,696National 101,847 6,666 15,501 7,158 30,488 7,096 10,710 - 287 16,235 839 6,867Public 28,414 4,755 8,022 631 3,396 1,024 5,713 - 698 374 959 2,842Private 478,470 80,372 189,710 11,083 57,727 9,623 38,760 - 16,180 25,061 15,967 33,987
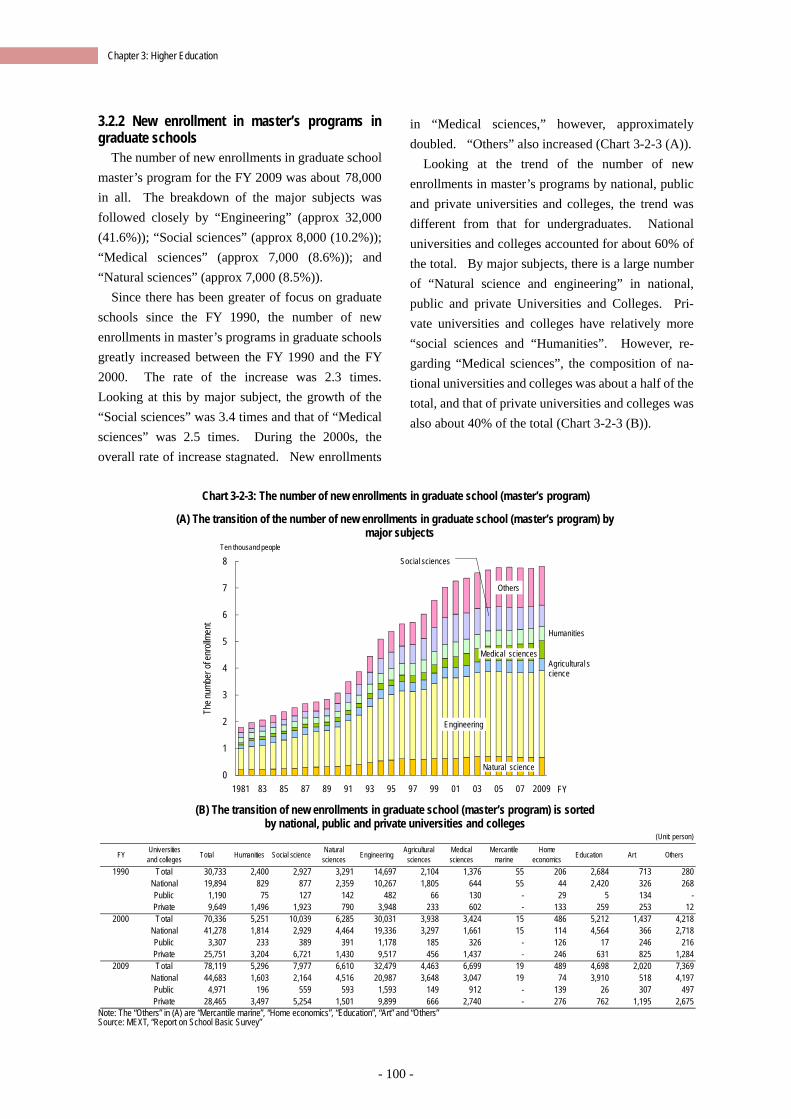
- 100 -
Chapter 3: Higher Education
3.2.2 New enrollment in master’s programs in graduate schools
The number of new enrollments in graduate school master’s program for the FY 2009 was about 78,000 in all. The breakdown of the major subjects was followed closely by “Engineering” (approx 32,000 (41.6%)); “Social sciences” (approx 8,000 (10.2%)); “Medical sciences” (approx 7,000 (8.6%)); and “Natural sciences” (approx 7,000 (8.5%)).
Since there has been greater of focus on graduate schools since the FY 1990, the number of new enrollments in master’s programs in graduate schools greatly increased between the FY 1990 and the FY 2000. The rate of the increase was 2.3 times. Looking at this by major subject, the growth of the “Social sciences” was 3.4 times and that of “Medical sciences” was 2.5 times. During the 2000s, the overall rate of increase stagnated. New enrollments
in “Medical sciences,” however, approximately doubled. “Others” also increased (Chart 3-2-3 (A)).
Looking at the trend of the number of new enrollments in master’s programs by national, public and private universities and colleges, the trend was different from that for undergraduates. National universities and colleges accounted for about 60% of the total. By major subjects, there is a large number of “Natural science and engineering” in national, public and private Universities and Colleges. Pri-vate universities and colleges have relatively more “social sciences and “Humanities”. However, re-garding “Medical sciences”, the composition of na-tional universities and colleges was about a half of the total, and that of private universities and colleges was also about 40% of the total (Chart 3-2-3 (B)).
Chart 3-2-3: The number of new enrollments in graduate school (master’s program)
(A) The transition of the number of new enrollments in graduate school (master’s program) by
major subjects
0
1
2
3
4
5
6
7
8
1981 83 85 87 89 91 93 95 97 99 01 03 05 07 2009
The n
umbe
r of e
nroll
ment
FY
Ten thousand people
Humanities
Natural science
Engineering
Agricultural science
Medical sciences
Others
Social sciences
(B) The transition of new enrollments in graduate school (master’s program) is sorted
by national, public and private universities and colleges
Note: The “Others” in (A) are “Mercantile marine”, “Home economics”, “Education”, “Art” and “Others” Source: MEXT, “Report on School Basic Survey”
(Unit: person)
FY Universitiesand colleges Total Humanities Social science Natural
sciences Engineering Agriculturalsciences
Medicalsciences
Mercantilemarine
Homeeconomics Education Art Others
1990 Total 30,733 2,400 2,927 3,291 14,697 2,104 1,376 55 206 2,684 713 280National 19,894 829 877 2,359 10,267 1,805 644 55 44 2,420 326 268Public 1,190 75 127 142 482 66 130 - 29 5 134 -Private 9,649 1,496 1,923 790 3,948 233 602 - 133 259 253 12
2000 Total 70,336 5,251 10,039 6,285 30,031 3,938 3,424 15 486 5,212 1,437 4,218National 41,278 1,814 2,929 4,464 19,336 3,297 1,661 15 114 4,564 366 2,718Public 3,307 233 389 391 1,178 185 326 - 126 17 246 216Private 25,751 3,204 6,721 1,430 9,517 456 1,437 - 246 631 825 1,284
2009 Total 78,119 5,296 7,977 6,610 32,479 4,463 6,699 19 489 4,698 2,020 7,369National 44,683 1,603 2,164 4,516 20,987 3,648 3,047 19 74 3,910 518 4,197Public 4,971 196 559 593 1,593 149 912 - 139 26 307 497Private 28,465 3,497 5,254 1,501 9,899 666 2,740 - 276 762 1,195 2,675
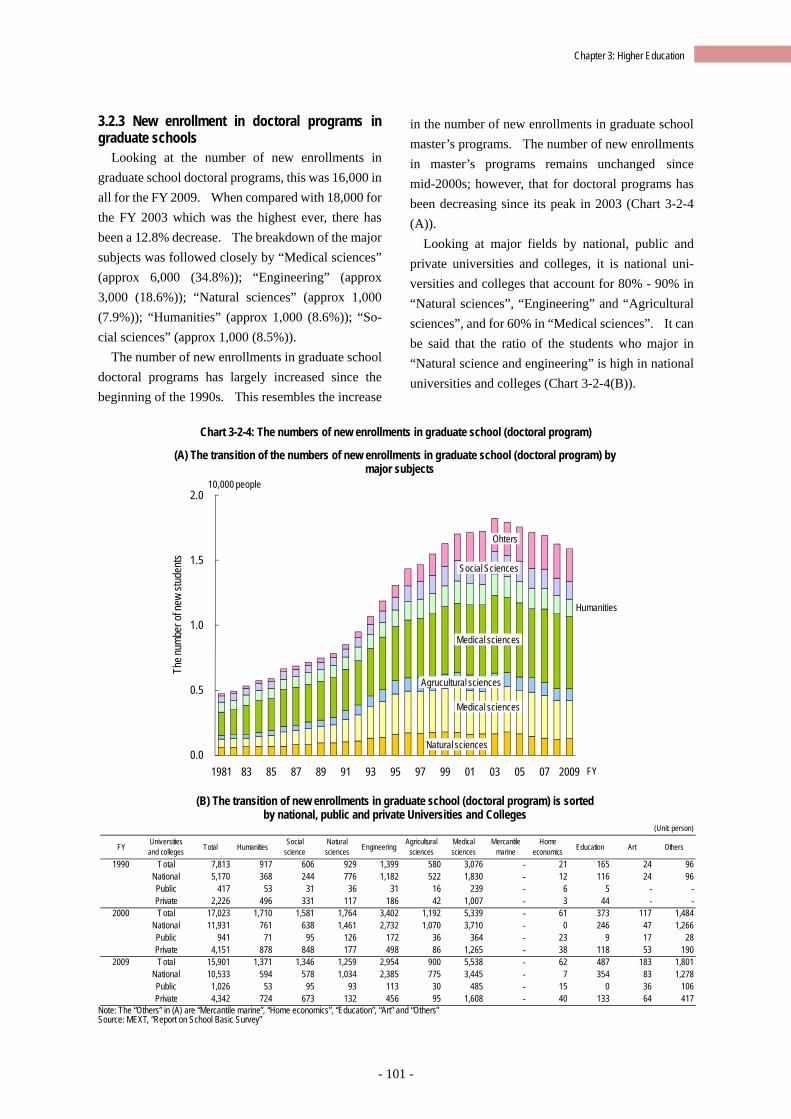
- 101 -
Chapter 3: Higher Education
3.2.3 New enrollment in doctoral programs in graduate schools
Looking at the number of new enrollments in graduate school doctoral programs, this was 16,000 in all for the FY 2009. When compared with 18,000 for the FY 2003 which was the highest ever, there has been a 12.8% decrease. The breakdown of the major subjects was followed closely by “Medical sciences” (approx 6,000 (34.8%)); “Engineering” (approx 3,000 (18.6%)); “Natural sciences” (approx 1,000 (7.9%)); “Humanities” (approx 1,000 (8.6%)); “So-cial sciences” (approx 1,000 (8.5%)).
The number of new enrollments in graduate school doctoral programs has largely increased since the beginning of the 1990s. This resembles the increase
in the number of new enrollments in graduate school master’s programs. The number of new enrollments in master’s programs remains unchanged since mid-2000s; however, that for doctoral programs has been decreasing since its peak in 2003 (Chart 3-2-4 (A)).
Looking at major fields by national, public and private universities and colleges, it is national uni-versities and colleges that account for 80% - 90% in “Natural sciences”, “Engineering” and “Agricultural sciences”, and for 60% in “Medical sciences”. It can be said that the ratio of the students who major in “Natural science and engineering” is high in national universities and colleges (Chart 3-2-4(B)).
Chart 3-2-4: The numbers of new enrollments in graduate school (doctoral program)
(A) The transition of the numbers of new enrollments in graduate school (doctoral program) by
major subjects
(B) The transition of new enrollments in graduate school (doctoral program) is sorted by national, public and private Universities and Colleges
Note: The “Others” in (A) are “Mercantile marine”, “Home economics”, “Education”, “Art” and “Others” Source: MEXT, “Report on School Basic Survey”
0.0
0.5
1.0
1.5
2.0
1981 83 85 87 89 91 93 95 97 99 01 03 05 07 2009
The n
umbe
r of n
ew st
uden
ts
10,000 people
FY
Humanities
Social Sciences
Natural sciences
Medical sciences
Agrucultural sciences
Medical sciences
Ohters
(Unit: person)
FY Universitiesand colleges Total Humanities Social
scienceNatural
sciences Engineering Agriculturalsciences
Medicalsciences
Mercantilemarine
Homeeconomics Education Art Others
1990 Total 7,813 917 606 929 1,399 580 3,076 - 21 165 24 96National 5,170 368 244 776 1,182 522 1,830 - 12 116 24 96Public 417 53 31 36 31 16 239 - 6 5 - -Private 2,226 496 331 117 186 42 1,007 - 3 44 - -
2000 Total 17,023 1,710 1,581 1,764 3,402 1,192 5,339 - 61 373 117 1,484National 11,931 761 638 1,461 2,732 1,070 3,710 - 0 246 47 1,266Public 941 71 95 126 172 36 364 - 23 9 17 28Private 4,151 878 848 177 498 86 1,265 - 38 118 53 190
2009 Total 15,901 1,371 1,346 1,259 2,954 900 5,538 - 62 487 183 1,801National 10,533 594 578 1,034 2,385 775 3,445 - 7 354 83 1,278Public 1,026 53 95 93 113 30 485 - 15 0 36 106Private 4,342 724 673 132 456 95 1,608 - 40 133 64 417
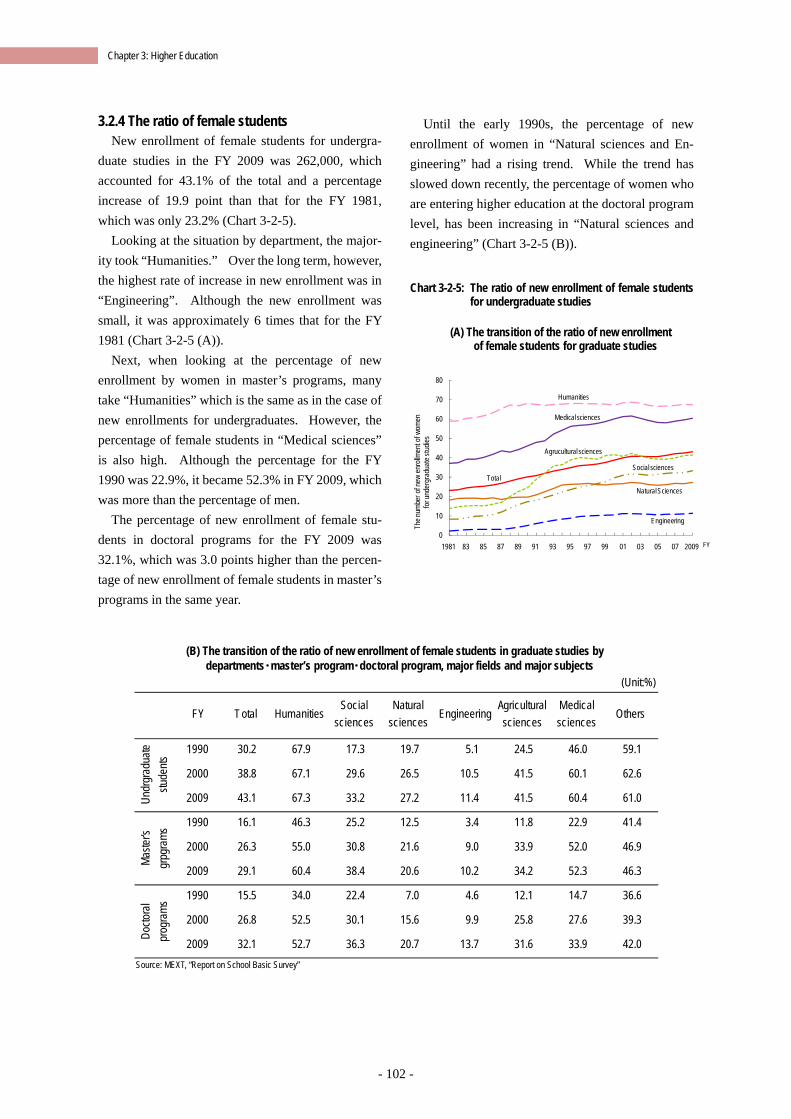
- 102 -
Chapter 3: Higher Education
3.2.4 The ratio of female students New enrollment of female students for undergra-
duate studies in the FY 2009 was 262,000, which accounted for 43.1% of the total and a percentage increase of 19.9 point than that for the FY 1981, which was only 23.2% (Chart 3-2-5).
Looking at the situation by department, the major-ity took “Humanities.” Over the long term, however, the highest rate of increase in new enrollment was in “Engineering”. Although the new enrollment was small, it was approximately 6 times that for the FY 1981 (Chart 3-2-5 (A)).
Next, when looking at the percentage of new enrollment by women in master’s programs, many take “Humanities” which is the same as in the case of new enrollments for undergraduates. However, the percentage of female students in “Medical sciences” is also high. Although the percentage for the FY 1990 was 22.9%, it became 52.3% in FY 2009, which was more than the percentage of men.
The percentage of new enrollment of female stu-dents in doctoral programs for the FY 2009 was 32.1%, which was 3.0 points higher than the percen-tage of new enrollment of female students in master’s programs in the same year.
Until the early 1990s, the percentage of new enrollment of women in “Natural sciences and En-gineering” had a rising trend. While the trend has slowed down recently, the percentage of women who are entering higher education at the doctoral program level, has been increasing in “Natural sciences and engineering” (Chart 3-2-5 (B)). Chart 3-2-5: The ratio of new enrollment of female students
for undergraduate studies
(A) The transition of the ratio of new enrollment of female students for graduate studies
(B) The transition of the ratio of new enrollment of female students in graduate studies by
departments・master’s program・doctoral program, major fields and major subjects
Source: MEXT, “Report on School Basic Survey”
0
10
20
30
40
50
60
70
80
1981 83 85 87 89 91 93 95 97 99 01 03 05 07 2009
The n
umbe
r of n
ew e
nroll
ment
of w
omen
fo
r und
ergr
adua
te st
udies
Total
Humanities
Medical sciences
Agrucultural sciences
Natural Sciences
FY
Social sciences
Engineering
(Unit:%)
FY Total HumanitiesSocial
sciencesNatural
sciencesEngineering
Agriculturalsciences
Medicalsciences
Others
1990 30.2 67.9 17.3 19.7 5.1 24.5 46.0 59.1
2000 38.8 67.1 29.6 26.5 10.5 41.5 60.1 62.6
2009 43.1 67.3 33.2 27.2 11.4 41.5 60.4 61.0
1990 16.1 46.3 25.2 12.5 3.4 11.8 22.9 41.4
2000 26.3 55.0 30.8 21.6 9.0 33.9 52.0 46.9
2009 29.1 60.4 38.4 20.6 10.2 34.2 52.3 46.3
1990 15.5 34.0 22.4 7.0 4.6 12.1 14.7 36.6
2000 26.8 52.5 30.1 15.6 9.9 25.8 27.6 39.3
2009 32.1 52.7 36.3 20.7 13.7 31.6 33.9 42.0
Undr
grad
uate
stude
ntsMa
ster's
grpg
rams
Docto
ral
prog
rams
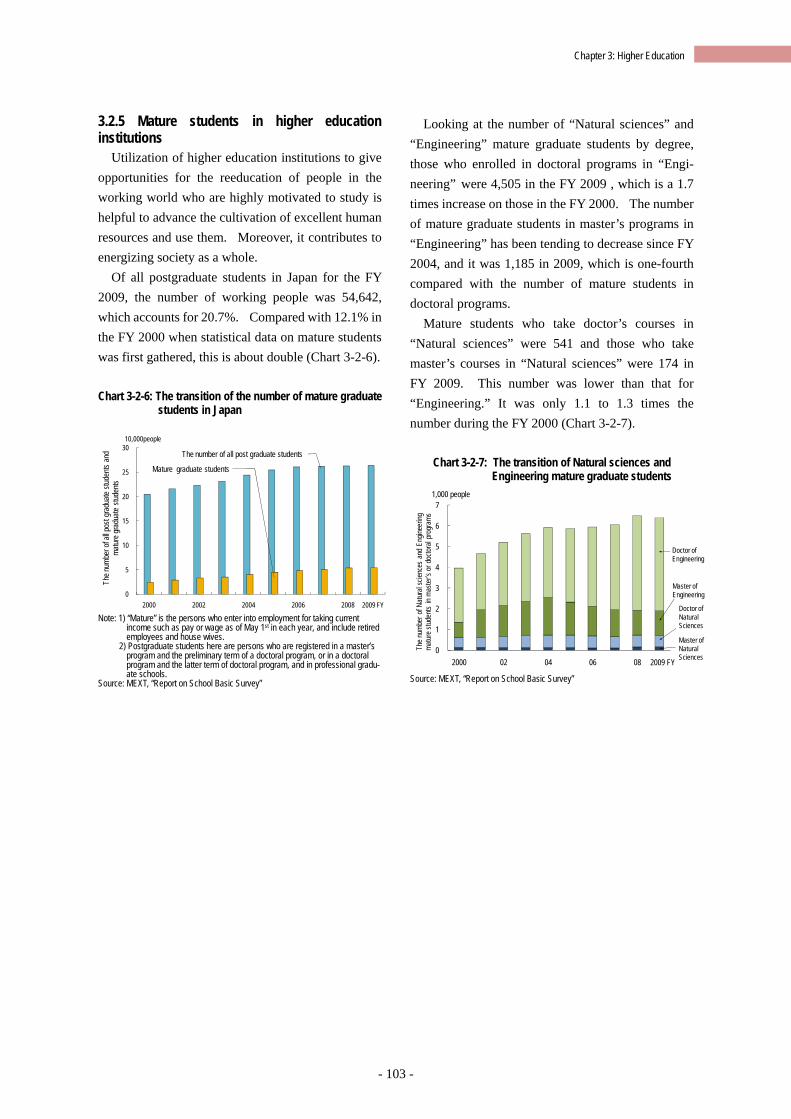
- 103 -
Chapter 3: Higher Education
3.2.5 Mature students in higher education institutions
Utilization of higher education institutions to give opportunities for the reeducation of people in the working world who are highly motivated to study is helpful to advance the cultivation of excellent human resources and use them. Moreover, it contributes to energizing society as a whole.
Of all postgraduate students in Japan for the FY 2009, the number of working people was 54,642, which accounts for 20.7%. Compared with 12.1% in the FY 2000 when statistical data on mature students was first gathered, this is about double (Chart 3-2-6). Chart 3-2-6: The transition of the number of mature graduate
students in Japan
Note: 1) “Mature” is the persons who enter into employment for taking current
income such as pay or wage as of May 1st in each year, and include retired employees and house wives.
2) Postgraduate students here are persons who are registered in a master’s program and the preliminary term of a doctoral program, or in a doctoral program and the latter term of doctoral program, and in professional gradu-ate schools.
Source: MEXT, “Report on School Basic Survey”
Looking at the number of “Natural sciences” and “Engineering” mature graduate students by degree, those who enrolled in doctoral programs in “Engi-neering” were 4,505 in the FY 2009 , which is a 1.7 times increase on those in the FY 2000. The number of mature graduate students in master’s programs in “Engineering” has been tending to decrease since FY 2004, and it was 1,185 in 2009, which is one-fourth compared with the number of mature students in doctoral programs.
Mature students who take doctor’s courses in “Natural sciences” were 541 and those who take master’s courses in “Natural sciences” were 174 in FY 2009. This number was lower than that for “Engineering.” It was only 1.1 to 1.3 times the number during the FY 2000 (Chart 3-2-7).
Chart 3-2-7: The transition of Natural sciences and Engineering mature graduate students
Source: MEXT, “Report on School Basic Survey”
0
5
10
15
20
25
30
2000 2002 2004 2006 2008
The n
umbe
r of a
ll pos
t gra
duate
stud
ents
and
matur
e gra
duate
stud
ents
10,000people
2009 FY
Mature graduate students
The number of all post graduate students
0
1
2
3
4
5
6
7
2000 02 04 06 08
The n
umbe
r of N
atura
l scie
nces
and
Eng
ineer
ing
matur
e stud
ents
in ma
ster’s
or d
octor
al pr
ogra
ms
1,000 people
2009 FY
Master of Natural Sciences
Doctor of Natural Sciences
Doctor ofEngineering
Master of Engineering
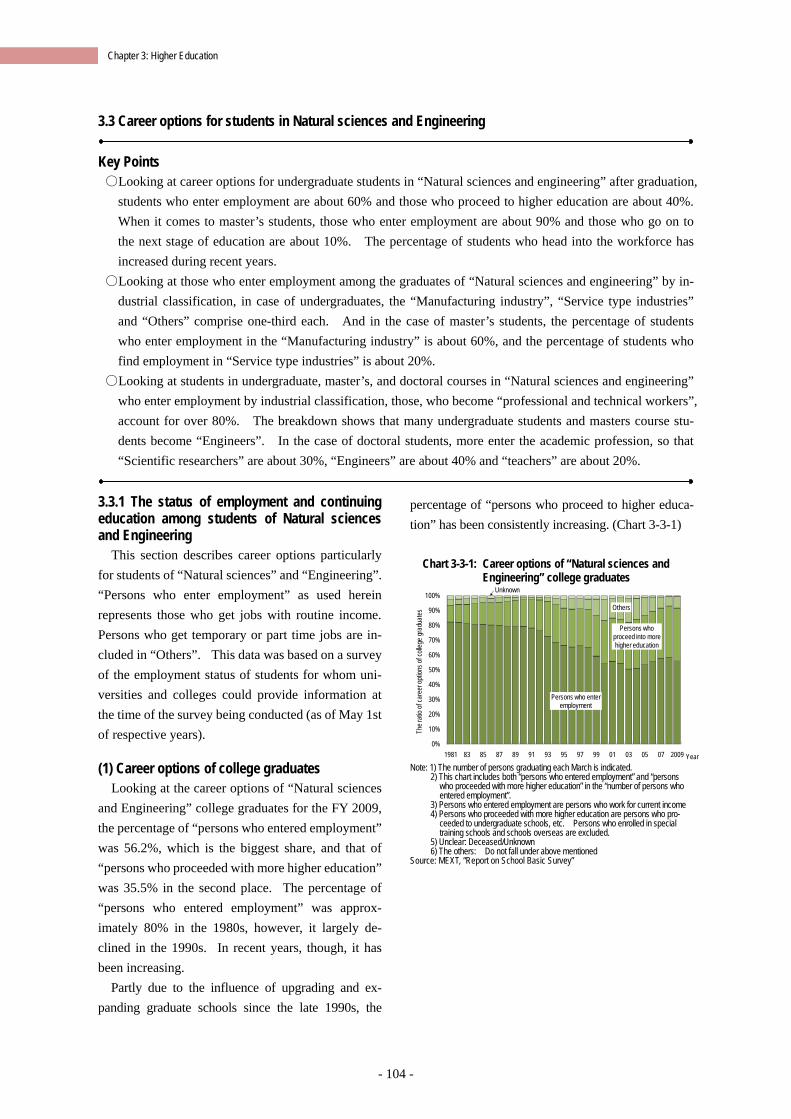
- 104 -
Chapter 3: Higher Education
3.3 Career options for students in Natural sciences and Engineering
Key Points ○Looking at career options for undergraduate students in “Natural sciences and engineering” after graduation,
students who enter employment are about 60% and those who proceed to higher education are about 40%. When it comes to master’s students, those who enter employment are about 90% and those who go on to the next stage of education are about 10%. The percentage of students who head into the workforce has increased during recent years.
○Looking at those who enter employment among the graduates of “Natural sciences and engineering” by in-dustrial classification, in case of undergraduates, the “Manufacturing industry”, “Service type industries” and “Others” comprise one-third each. And in the case of master’s students, the percentage of students who enter employment in the “Manufacturing industry” is about 60%, and the percentage of students who find employment in “Service type industries” is about 20%.
○Looking at students in undergraduate, master’s, and doctoral courses in “Natural sciences and engineering” who enter employment by industrial classification, those, who become “professional and technical workers”, account for over 80%. The breakdown shows that many undergraduate students and masters course stu-dents become “Engineers”. In the case of doctoral students, more enter the academic profession, so that “Scientific researchers” are about 30%, “Engineers” are about 40% and “teachers” are about 20%.
3.3.1 The status of employment and continuing education among students of Natural sciences and Engineering
This section describes career options particularly for students of “Natural sciences” and “Engineering”. “Persons who enter employment” as used herein represents those who get jobs with routine income. Persons who get temporary or part time jobs are in-cluded in “Others”. This data was based on a survey of the employment status of students for whom uni-versities and colleges could provide information at the time of the survey being conducted (as of May 1st of respective years). (1) Career options of college graduates
Looking at the career options of “Natural sciences and Engineering” college graduates for the FY 2009, the percentage of “persons who entered employment” was 56.2%, which is the biggest share, and that of “persons who proceeded with more higher education” was 35.5% in the second place. The percentage of “persons who entered employment” was approx-imately 80% in the 1980s, however, it largely de-clined in the 1990s. In recent years, though, it has been increasing.
Partly due to the influence of upgrading and ex-panding graduate schools since the late 1990s, the
percentage of “persons who proceed to higher educa-tion” has been consistently increasing. (Chart 3-3-1)
Chart 3-3-1: Career options of “Natural sciences and Engineering” college graduates
Note: 1) The number of persons graduating each March is indicated.
2) This chart includes both “persons who entered employment” and “persons who proceeded with more higher education” in the “number of persons who entered employment”.
3) Persons who entered employment are persons who work for current income 4) Persons who proceeded with more higher education are persons who pro-
ceeded to undergraduate schools, etc. Persons who enrolled in special training schools and schools overseas are excluded.
5) Unclear: Deceased/Unknown 6) The others: Do not fall under above mentioned
Source: MEXT, “Report on School Basic Survey”
Persons who enter employment
Persons who proceed into more higher education
Others
Unknown
0%
10%
20%
30%
40%
50%
60%
70%
80%
90%
100%
1981 83 85 87 89 91 93 95 97 99 01 03 05 07 2009
The r
atio
of ca
reer
optio
ns of
colle
ge g
radu
ates
Year
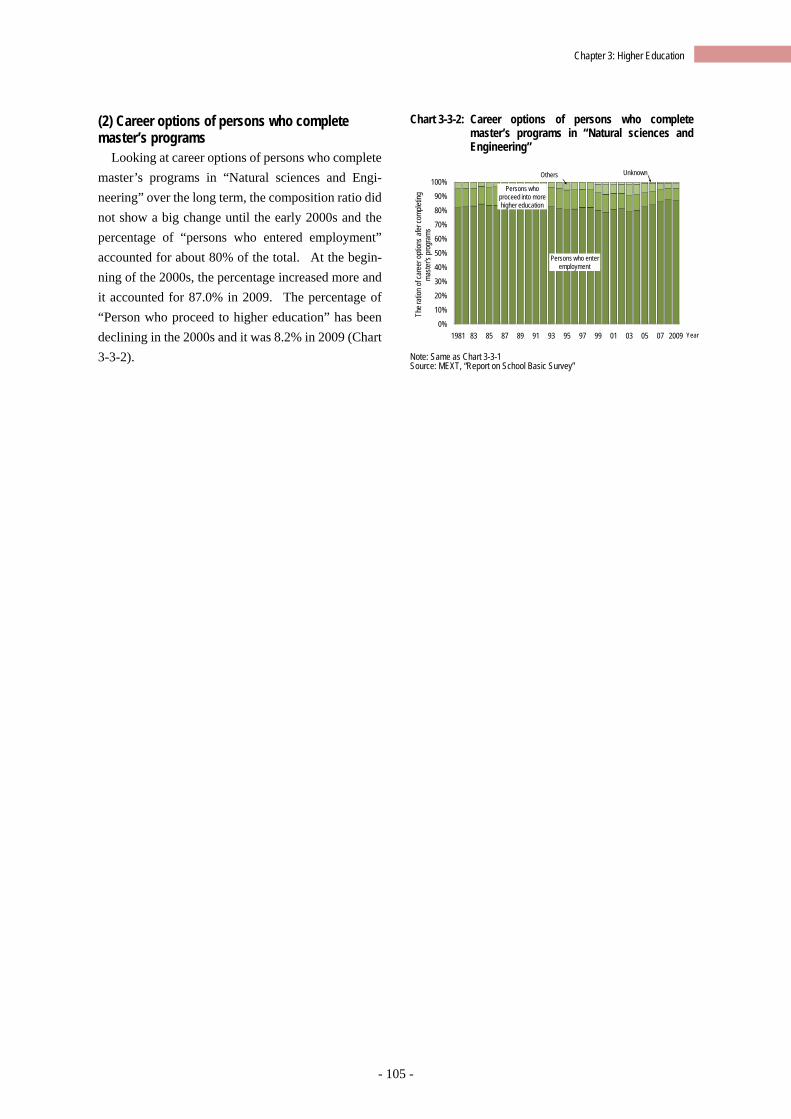
- 105 -
Chapter 3: Higher Education
(2) Career options of persons who complete master’s programs
Looking at career options of persons who complete master’s programs in “Natural sciences and Engi-neering” over the long term, the composition ratio did not show a big change until the early 2000s and the percentage of “persons who entered employment” accounted for about 80% of the total. At the begin-ning of the 2000s, the percentage increased more and it accounted for 87.0% in 2009. The percentage of “Person who proceed to higher education” has been declining in the 2000s and it was 8.2% in 2009 (Chart 3-3-2).
Chart 3-3-2: Career options of persons who complete master’s programs in “Natural sciences and Engineering”
Note: Same as Chart 3-3-1 Source: MEXT, “Report on School Basic Survey”
Persons who enter employment
Persons who proceed into more higher education
Others Unknown
0%
10%
20%
30%
40%
50%
60%
70%
80%
90%
100%
1981 83 85 87 89 91 93 95 97 99 01 03 05 07 2009
The r
ation
of c
aree
r opti
ons a
fer co
mplet
ing
maste
r's pr
ogra
ms
Year
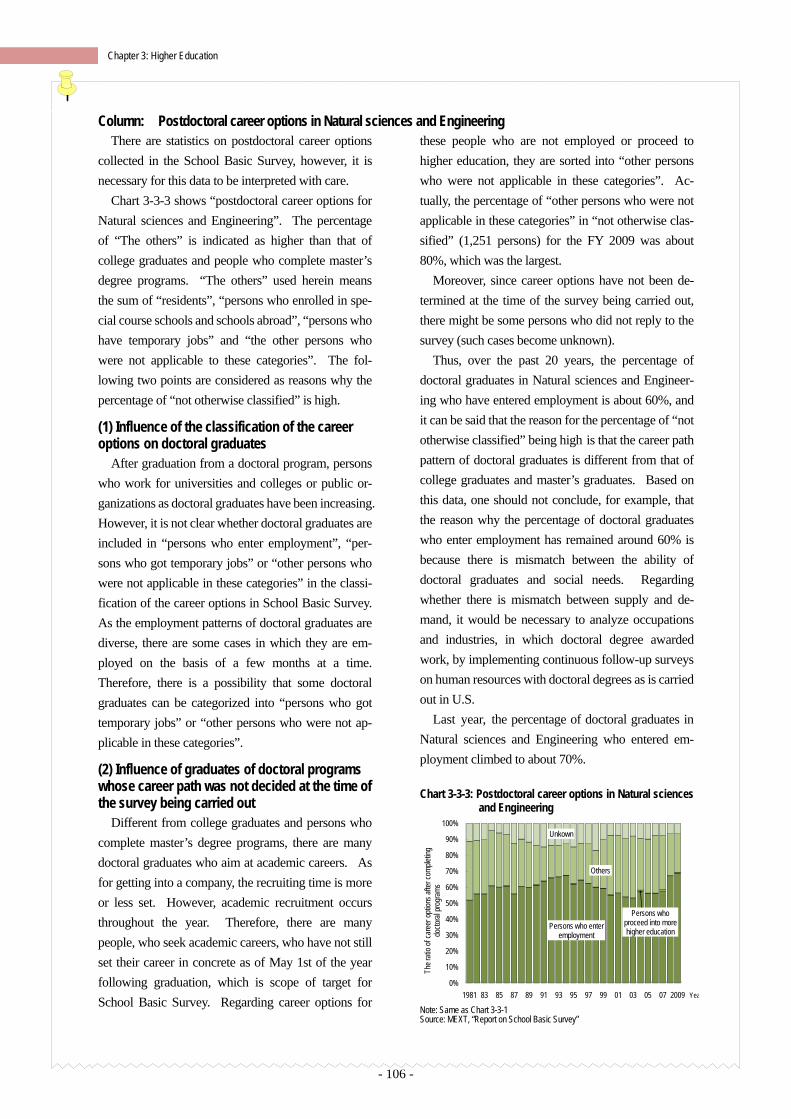
- 106 -
Chapter 3: Higher Education
Column: Postdoctoral career options in Natural sciences and Engineering There are statistics on postdoctoral career options
collected in the School Basic Survey, however, it is necessary for this data to be interpreted with care.
Chart 3-3-3 shows “postdoctoral career options for Natural sciences and Engineering”. The percentage of “The others” is indicated as higher than that of college graduates and people who complete master’s degree programs. “The others” used herein means the sum of “residents”, “persons who enrolled in spe-cial course schools and schools abroad”, “persons who have temporary jobs” and “the other persons who were not applicable to these categories”. The fol-lowing two points are considered as reasons why the percentage of “not otherwise classified” is high.
(1) Influence of the classification of the career options on doctoral graduates
After graduation from a doctoral program, persons who work for universities and colleges or public or-ganizations as doctoral graduates have been increasing. However, it is not clear whether doctoral graduates are included in “persons who enter employment”, “per-sons who got temporary jobs” or “other persons who were not applicable in these categories” in the classi-fication of the career options in School Basic Survey. As the employment patterns of doctoral graduates are diverse, there are some cases in which they are em-ployed on the basis of a few months at a time. Therefore, there is a possibility that some doctoral graduates can be categorized into “persons who got temporary jobs” or “other persons who were not ap-plicable in these categories”.
(2) Influence of graduates of doctoral programs whose career path was not decided at the time of the survey being carried out
Different from college graduates and persons who complete master’s degree programs, there are many doctoral graduates who aim at academic careers. As for getting into a company, the recruiting time is more or less set. However, academic recruitment occurs throughout the year. Therefore, there are many people, who seek academic careers, who have not still set their career in concrete as of May 1st of the year following graduation, which is scope of target for School Basic Survey. Regarding career options for
these people who are not employed or proceed to higher education, they are sorted into “other persons who were not applicable in these categories”. Ac-tually, the percentage of “other persons who were not applicable in these categories” in “not otherwise clas-sified” (1,251 persons) for the FY 2009 was about 80%, which was the largest.
Moreover, since career options have not been de-termined at the time of the survey being carried out, there might be some persons who did not reply to the survey (such cases become unknown).
Thus, over the past 20 years, the percentage of doctoral graduates in Natural sciences and Engineer-ing who have entered employment is about 60%, and it can be said that the reason for the percentage of “not otherwise classified” being high is that the career path pattern of doctoral graduates is different from that of college graduates and master’s graduates. Based on this data, one should not conclude, for example, that the reason why the percentage of doctoral graduates who enter employment has remained around 60% is because there is mismatch between the ability of doctoral graduates and social needs. Regarding whether there is mismatch between supply and de-mand, it would be necessary to analyze occupations and industries, in which doctoral degree awarded work, by implementing continuous follow-up surveys on human resources with doctoral degrees as is carried out in U.S.
Last year, the percentage of doctoral graduates in Natural sciences and Engineering who entered em-ployment climbed to about 70%. Chart 3-3-3: Postdoctoral career options in Natural sciences
and Engineering
Note: Same as Chart 3-3-1 Source: MEXT, “Report on School Basic Survey”
Persons who enter employment
Persons who proceed into more higher education
Others
Unkown
0%
10%
20%
30%
40%
50%
60%
70%
80%
90%
100%
1981 83 85 87 89 91 93 95 97 99 01 03 05 07 2009
The r
atio o
f car
eer o
ption
s afte
r com
pletin
g do
ctora
l pro
gram
s
Year
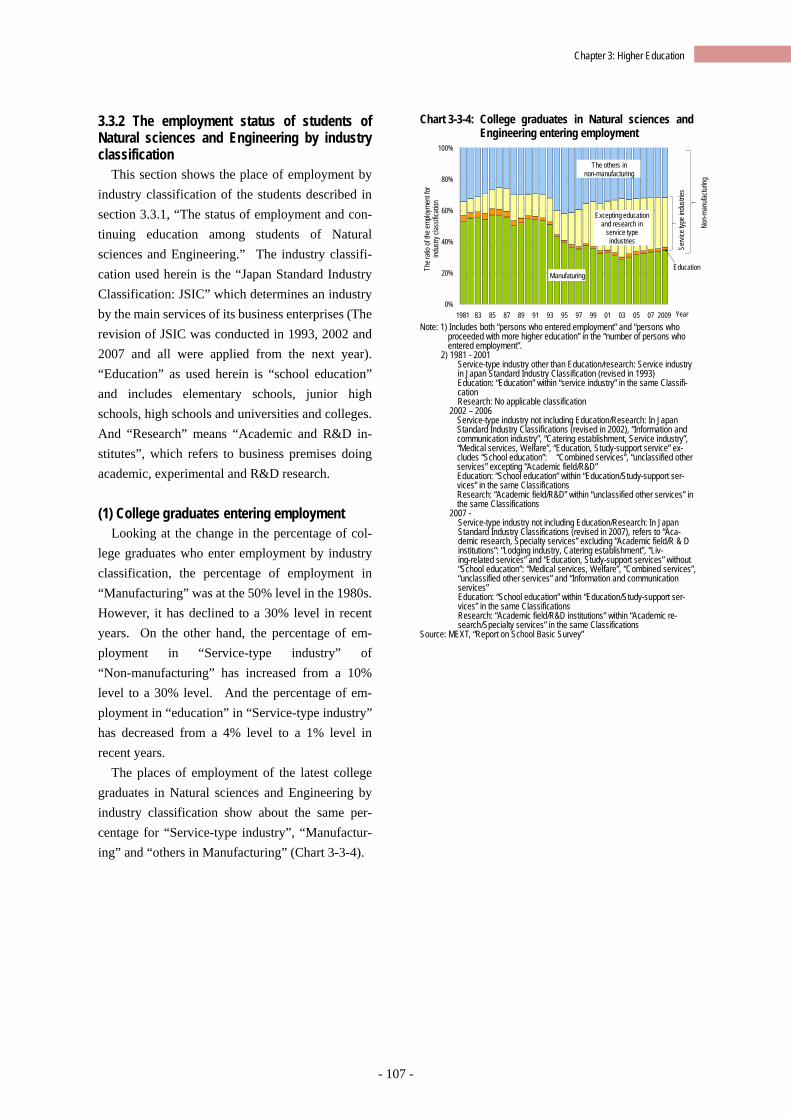
- 107 -
Chapter 3: Higher Education
3.3.2 The employment status of students of Natural sciences and Engineering by industry classification
This section shows the place of employment by industry classification of the students described in section 3.3.1, “The status of employment and con-tinuing education among students of Natural sciences and Engineering.” The industry classifi-cation used herein is the “Japan Standard Industry Classification: JSIC” which determines an industry by the main services of its business enterprises (The revision of JSIC was conducted in 1993, 2002 and 2007 and all were applied from the next year). “Education” as used herein is “school education” and includes elementary schools, junior high schools, high schools and universities and colleges. And “Research” means “Academic and R&D in-stitutes”, which refers to business premises doing academic, experimental and R&D research. (1) College graduates entering employment
Looking at the change in the percentage of col-lege graduates who enter employment by industry classification, the percentage of employment in “Manufacturing” was at the 50% level in the 1980s. However, it has declined to a 30% level in recent years. On the other hand, the percentage of em-ployment in “Service-type industry” of “Non-manufacturing” has increased from a 10% level to a 30% level. And the percentage of em-ployment in “education” in “Service-type industry” has decreased from a 4% level to a 1% level in recent years.
The places of employment of the latest college graduates in Natural sciences and Engineering by industry classification show about the same per-centage for “Service-type industry”, “Manufactur-ing” and “others in Manufacturing” (Chart 3-3-4).
Chart 3-3-4: College graduates in Natural sciences and Engineering entering employment
Note: 1) Includes both “persons who entered employment” and “persons who
proceeded with more higher education” in the “number of persons who entered employment”.
2) 1981 - 2001 Service-type industry other than Education/research: Service industry in Japan Standard Industry Classification (revised in 1993) Education: “Education” within “service industry” in the same Classifi-cation Research: No applicable classification
2002 – 2006 Service-type industry not including Education/Research: In Japan Standard Industry Classifications (revised in 2002), “Information and communication industry”, “Catering establishment, Service industry”, “Medical services, Welfare”, “Education, Study-support service” ex-cludes “School education”: “Combined services”, “unclassified other services” excepting “Academic field/R&D” Education: “School education” within “Education/Study-support ser-vices” in the same Classifications Research: “Academic field/R&D” within “unclassified other services” in the same Classifications
2007 - Service-type industry not including Education/Research: In Japan Standard Industry Classifications (revised in 2007), refers to “Aca-demic research, Specialty services” excluding “Academic field/R & D institutions”: “Lodging industry, Catering establishment”, “Liv-ing-related services” and “Education, Study-support services” without “School education”: “Medical services, Welfare”, “Combined services”, “unclassified other services” and “Information and communication services” Education: “School education” within “Education/Study-support ser-vices” in the same Classifications Research: “Academic field/R&D institutions” within “Academic re-search/Specialty services” in the same Classifications
Source: MEXT, “Report on School Basic Survey”
Education
Excepting education and research in
service type industries
0%
20%
40%
60%
80%
100%
1981 83 85 87 89 91 93 95 97 99 01 03 05 07 2009
The r
atio o
f the e
mploy
ment
for
indus
try cl
assif
icatio
n
Year
The others in non-manufacturing
Manufaturing
Servi
cetyp
e ind
ustrie
s
Non-
manu
factur
ing
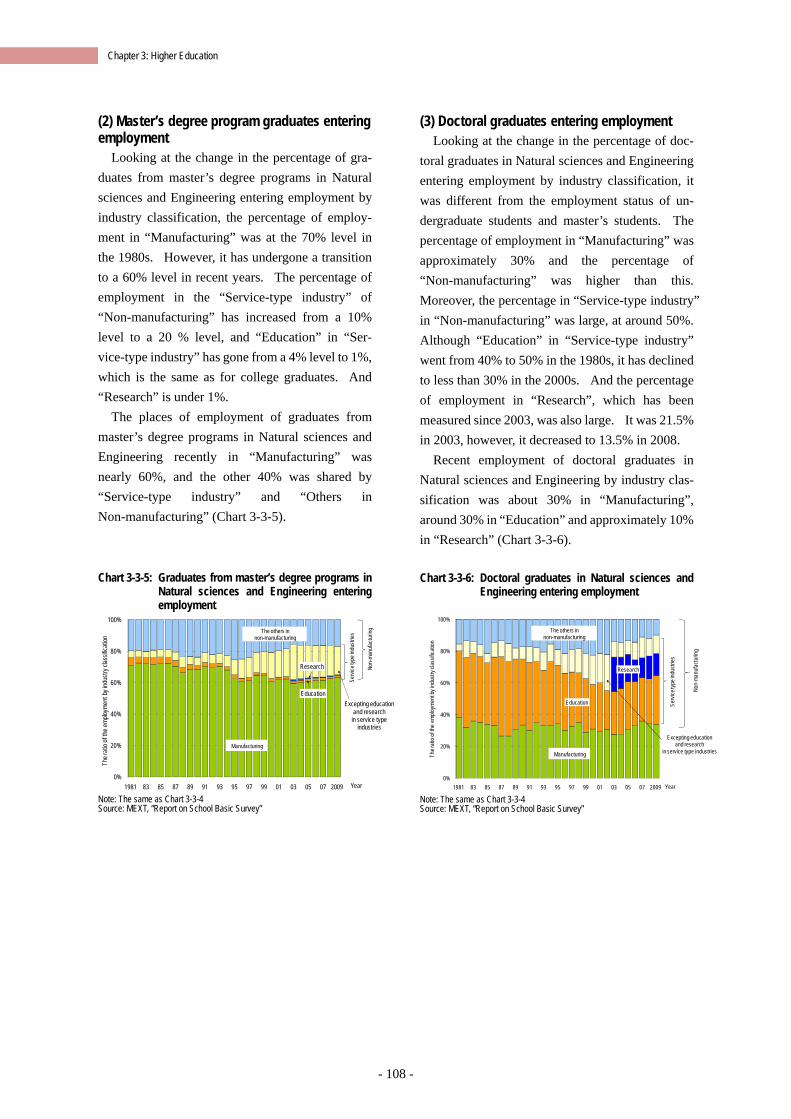
- 108 -
Chapter 3: Higher Education
(2) Master’s degree program graduates entering employment
Looking at the change in the percentage of gra-duates from master’s degree programs in Natural sciences and Engineering entering employment by industry classification, the percentage of employ-ment in “Manufacturing” was at the 70% level in the 1980s. However, it has undergone a transition to a 60% level in recent years. The percentage of employment in the “Service-type industry” of “Non-manufacturing” has increased from a 10% level to a 20 % level, and “Education” in “Ser-vice-type industry” has gone from a 4% level to 1%, which is the same as for college graduates. And “Research” is under 1%.
The places of employment of graduates from master’s degree programs in Natural sciences and Engineering recently in “Manufacturing” was nearly 60%, and the other 40% was shared by “Service-type industry” and “Others in Non-manufacturing” (Chart 3-3-5).
Chart 3-3-5: Graduates from master’s degree programs in
Natural sciences and Engineering entering employment
Note: The same as Chart 3-3-4 Source: MEXT, “Report on School Basic Survey”
(3) Doctoral graduates entering employment Looking at the change in the percentage of doc-
toral graduates in Natural sciences and Engineering entering employment by industry classification, it was different from the employment status of un-dergraduate students and master’s students. The percentage of employment in “Manufacturing” was approximately 30% and the percentage of “Non-manufacturing” was higher than this. Moreover, the percentage in “Service-type industry” in “Non-manufacturing” was large, at around 50%. Although “Education” in “Service-type industry” went from 40% to 50% in the 1980s, it has declined to less than 30% in the 2000s. And the percentage of employment in “Research”, which has been measured since 2003, was also large. It was 21.5% in 2003, however, it decreased to 13.5% in 2008.
Recent employment of doctoral graduates in Natural sciences and Engineering by industry clas-sification was about 30% in “Manufacturing”, around 30% in “Education” and approximately 10% in “Research” (Chart 3-3-6). Chart 3-3-6: Doctoral graduates in Natural sciences and
Engineering entering employment
Note: The same as Chart 3-3-4 Source: MEXT, “Report on School Basic Survey”
Education
Research
Excepting education and research
in service type industries
0%
20%
40%
60%
80%
100%
1981 83 85 87 89 91 93 95 97 99 01 03 05 07 2009
The r
atio
of th
e emp
loyme
nt b
y ind
ustry
clas
sifica
tion
Year
Manufacturing
Serv
ice ty
pe in
dustr
ies
Non-
manu
factu
ringThe others in
non-manufacturing
Education
Research
Excepting education and research
in service type industries
0%
20%
40%
60%
80%
100%
1981 83 85 87 89 91 93 95 97 99 01 03 05 07 2009
The r
atio
of th
e em
ploym
ent b
y ind
ustry
clas
sifica
tion
Year
Manufacturing
The others in non-manufacturing
Serv
ice ty
pe in
dustr
ies
Non-
manu
factu
ring
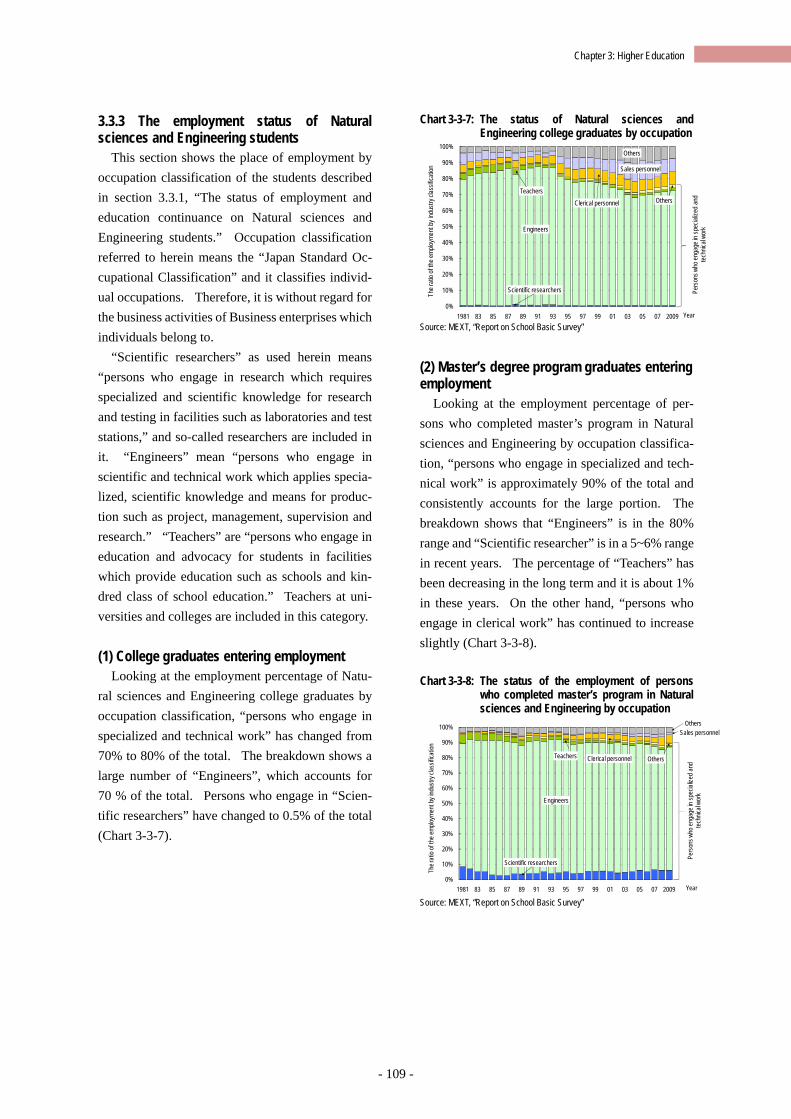
- 109 -
Chapter 3: Higher Education
3.3.3 The employment status of Natural sciences and Engineering students
This section shows the place of employment by occupation classification of the students described in section 3.3.1, “The status of employment and education continuance on Natural sciences and Engineering students.” Occupation classification referred to herein means the “Japan Standard Oc-cupational Classification” and it classifies individ-ual occupations. Therefore, it is without regard for the business activities of Business enterprises which individuals belong to.
“Scientific researchers” as used herein means “persons who engage in research which requires specialized and scientific knowledge for research and testing in facilities such as laboratories and test stations,” and so-called researchers are included in it. “Engineers” mean “persons who engage in scientific and technical work which applies specia-lized, scientific knowledge and means for produc-tion such as project, management, supervision and research.” “Teachers” are “persons who engage in education and advocacy for students in facilities which provide education such as schools and kin-dred class of school education.” Teachers at uni-versities and colleges are included in this category. (1) College graduates entering employment
Looking at the employment percentage of Natu-ral sciences and Engineering college graduates by occupation classification, “persons who engage in specialized and technical work” has changed from 70% to 80% of the total. The breakdown shows a large number of “Engineers”, which accounts for 70 % of the total. Persons who engage in “Scien-tific researchers” have changed to 0.5% of the total (Chart 3-3-7).
Chart 3-3-7: The status of Natural sciences and Engineering college graduates by occupation
Source: MEXT, “Report on School Basic Survey” (2) Master’s degree program graduates entering employment
Looking at the employment percentage of per-sons who completed master’s program in Natural sciences and Engineering by occupation classifica-tion, “persons who engage in specialized and tech-nical work” is approximately 90% of the total and consistently accounts for the large portion. The breakdown shows that “Engineers” is in the 80% range and “Scientific researcher” is in a 5~6% range in recent years. The percentage of “Teachers” has been decreasing in the long term and it is about 1% in these years. On the other hand, “persons who engage in clerical work” has continued to increase slightly (Chart 3-3-8). Chart 3-3-8: The status of the employment of persons
who completed master’s program in Natural sciences and Engineering by occupation
Source: MEXT, “Report on School Basic Survey”
Scientific researchers
Engineers
TeachersOthersClerical personnel
Sales personnel
Others
0%
10%
20%
30%
40%
50%
60%
70%
80%
90%
100%
1981 83 85 87 89 91 93 95 97 99 01 03 05 07 2009 Year
The r
atio
of th
e emp
loyme
nt b
y ind
ustry
clas
sifica
tion
Pers
ons w
ho en
gage
in sp
ecial
ized
and
tech
nical
work
Scientific researchers
Engineers
Teachers OthersClerical personnel
Sales personnelOthers
0%
10%
20%
30%
40%
50%
60%
70%
80%
90%
100%
1981 83 85 87 89 91 93 95 97 99 01 03 05 07 2009 Year
The r
atio
of th
e emp
loyme
nt b
y ind
ustry
clas
sifica
tion
Pers
ons w
ho en
gage
in sp
ecial
ized
and
tech
nical
work
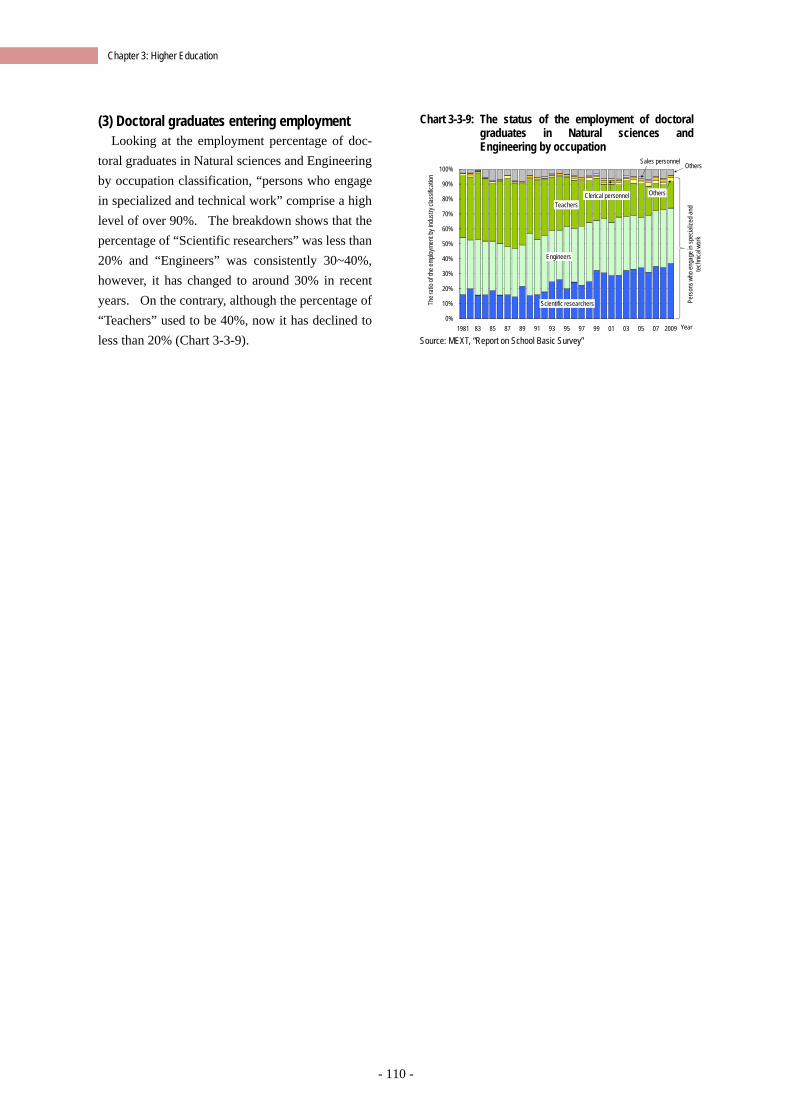
- 110 -
Chapter 3: Higher Education
(3) Doctoral graduates entering employment Looking at the employment percentage of doc-
toral graduates in Natural sciences and Engineering by occupation classification, “persons who engage in specialized and technical work” comprise a high level of over 90%. The breakdown shows that the percentage of “Scientific researchers” was less than 20% and “Engineers” was consistently 30~40%, however, it has changed to around 30% in recent years. On the contrary, although the percentage of “Teachers” used to be 40%, now it has declined to less than 20% (Chart 3-3-9).
Chart 3-3-9: The status of the employment of doctoral graduates in Natural sciences and Engineering by occupation
Source: MEXT, “Report on School Basic Survey”
Scientific researchers
Engineers
Teachers
OthersClerical personnel
Sales personnel Others
0%
10%
20%
30%
40%
50%
60%
70%
80%
90%
100%
1981 83 85 87 89 91 93 95 97 99 01 03 05 07 2009 Year
The r
atio
of th
e emp
loyme
nt b
y ind
ustry
clas
sifica
tion
Pers
ons w
ho en
gage
in sp
ecial
ized
and
tech
nical
work
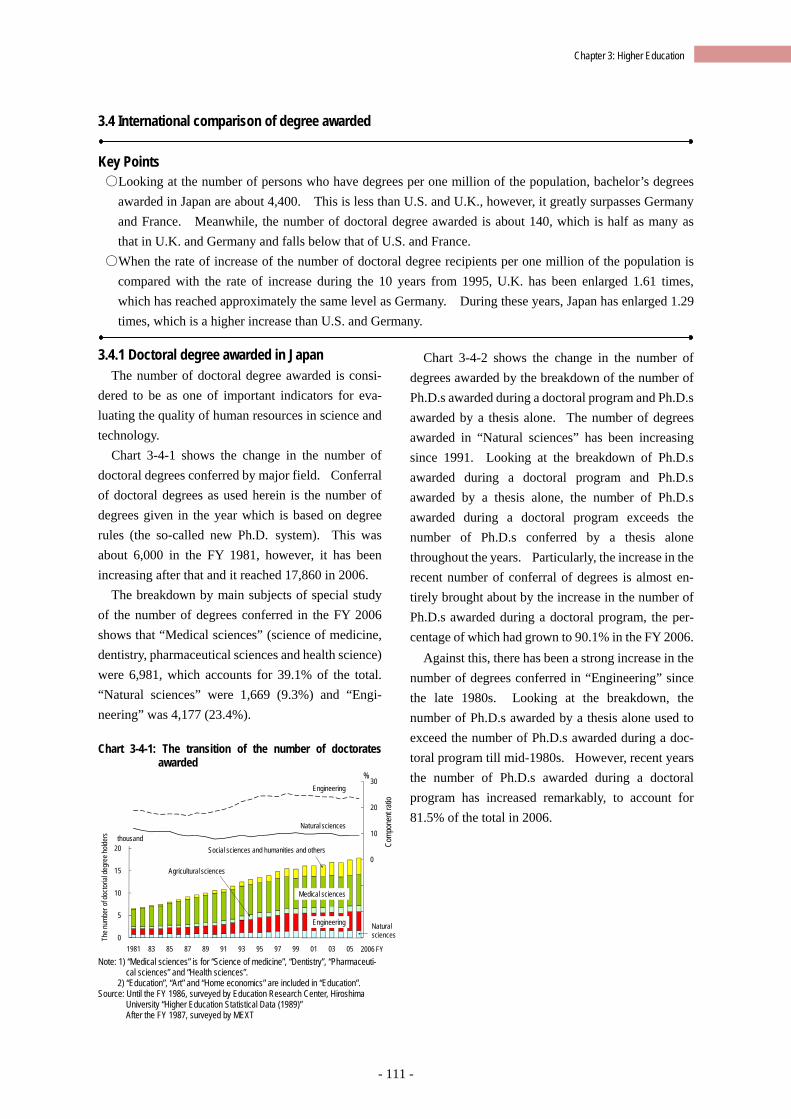
- 111 -
Chapter 3: Higher Education
3.4 International comparison of degree awarded
Key Points ○Looking at the number of persons who have degrees per one million of the population, bachelor’s degrees
awarded in Japan are about 4,400. This is less than U.S. and U.K., however, it greatly surpasses Germany and France. Meanwhile, the number of doctoral degree awarded is about 140, which is half as many as that in U.K. and Germany and falls below that of U.S. and France.
○When the rate of increase of the number of doctoral degree recipients per one million of the population is compared with the rate of increase during the 10 years from 1995, U.K. has been enlarged 1.61 times, which has reached approximately the same level as Germany. During these years, Japan has enlarged 1.29 times, which is a higher increase than U.S. and Germany.
3.4.1 Doctoral degree awarded in Japan
The number of doctoral degree awarded is consi-dered to be as one of important indicators for eva-luating the quality of human resources in science and technology.
Chart 3-4-1 shows the change in the number of doctoral degrees conferred by major field. Conferral of doctoral degrees as used herein is the number of degrees given in the year which is based on degree rules (the so-called new Ph.D. system). This was about 6,000 in the FY 1981, however, it has been increasing after that and it reached 17,860 in 2006.
The breakdown by main subjects of special study of the number of degrees conferred in the FY 2006 shows that “Medical sciences” (science of medicine, dentistry, pharmaceutical sciences and health science) were 6,981, which accounts for 39.1% of the total. “Natural sciences” were 1,669 (9.3%) and “Engi-neering” was 4,177 (23.4%). Chart 3-4-1: The transition of the number of doctorates
awarded
Note: 1) “Medical sciences” is for “Science of medicine”, “Dentistry”, “Pharmaceuti-
cal sciences” and “Health sciences”. 2) “Education”, “Art” and “Home economics” are included in “Education”.
Source: Until the FY 1986, surveyed by Education Research Center, Hiroshima University “Higher Education Statistical Data (1989)” After the FY 1987, surveyed by MEXT
Chart 3-4-2 shows the change in the number of degrees awarded by the breakdown of the number of Ph.D.s awarded during a doctoral program and Ph.D.s awarded by a thesis alone. The number of degrees awarded in “Natural sciences” has been increasing since 1991. Looking at the breakdown of Ph.D.s awarded during a doctoral program and Ph.D.s awarded by a thesis alone, the number of Ph.D.s awarded during a doctoral program exceeds the number of Ph.D.s conferred by a thesis alone throughout the years. Particularly, the increase in the recent number of conferral of degrees is almost en-tirely brought about by the increase in the number of Ph.D.s awarded during a doctoral program, the per-centage of which had grown to 90.1% in the FY 2006.
Against this, there has been a strong increase in the number of degrees conferred in “Engineering” since the late 1980s. Looking at the breakdown, the number of Ph.D.s awarded by a thesis alone used to exceed the number of Ph.D.s awarded during a doc-toral program till mid-1980s. However, recent years the number of Ph.D.s awarded during a doctoral program has increased remarkably, to account for 81.5% of the total in 2006.
(30)
(20)
(10)
0
10
20
30
0
5
10
15
20
25
30
35
1981 83 85 87 89 91 93 95 97 99 01 03 05 2006 FY
Comp
onen
t rati
o
Engineering
Natural sciencesthousand
%
Social sciences and humanities and others
Natural sciences
Agricultural sciences
Medical sciences
Engineering
The n
umbe
r of d
octo
rial d
egre
e hold
ers
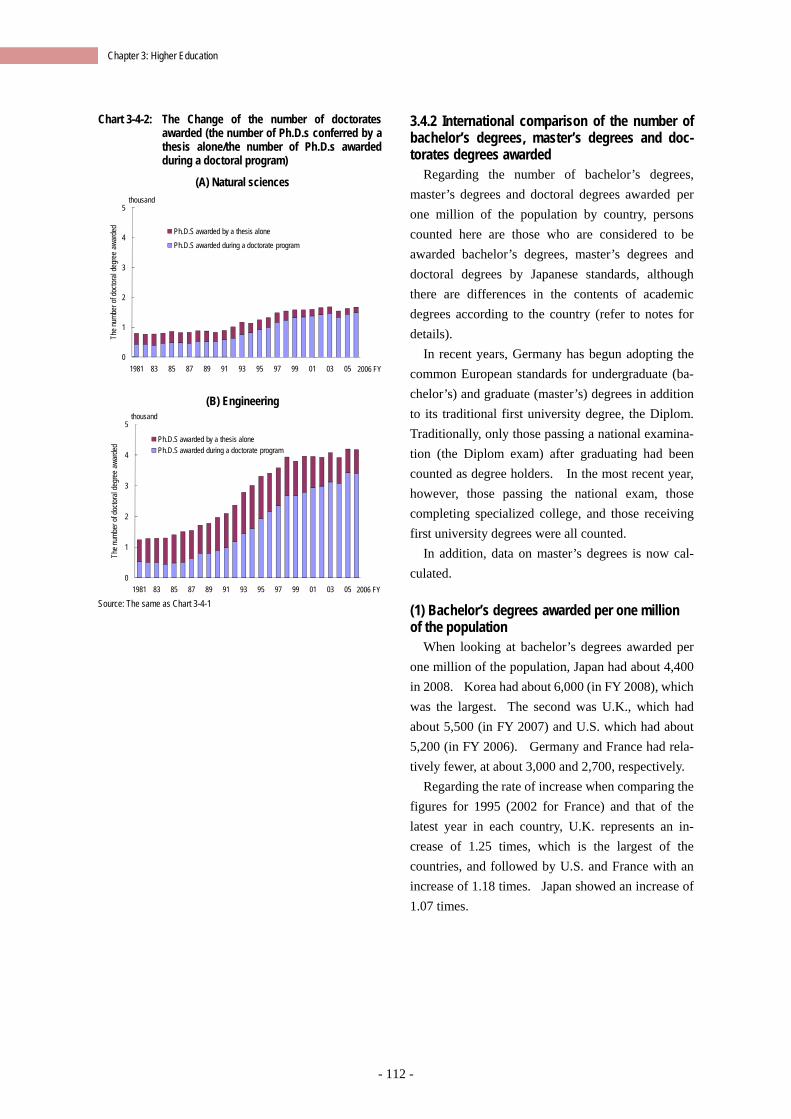
- 112 -
Chapter 3: Higher Education
Chart 3-4-2: The Change of the number of doctorates awarded (the number of Ph.D.s conferred by a thesis alone/the number of Ph.D.s awarded during a doctoral program)
(A) Natural sciences
(B) Engineering
Source: The same as Chart 3-4-1
3.4.2 International comparison of the number of bachelor’s degrees, master’s degrees and doc-torates degrees awarded
Regarding the number of bachelor’s degrees, master’s degrees and doctoral degrees awarded per one million of the population by country, persons counted here are those who are considered to be awarded bachelor’s degrees, master’s degrees and doctoral degrees by Japanese standards, although there are differences in the contents of academic degrees according to the country (refer to notes for details).
In recent years, Germany has begun adopting the common European standards for undergraduate (ba-chelor’s) and graduate (master’s) degrees in addition to its traditional first university degree, the Diplom. Traditionally, only those passing a national examina-tion (the Diplom exam) after graduating had been counted as degree holders. In the most recent year, however, those passing the national exam, those completing specialized college, and those receiving first university degrees were all counted.
In addition, data on master’s degrees is now cal-culated.
(1) Bachelor’s degrees awarded per one million of the population
When looking at bachelor’s degrees awarded per one million of the population, Japan had about 4,400 in 2008. Korea had about 6,000 (in FY 2008), which was the largest. The second was U.K., which had about 5,500 (in FY 2007) and U.S. which had about 5,200 (in FY 2006). Germany and France had rela-tively fewer, at about 3,000 and 2,700, respectively.
Regarding the rate of increase when comparing the figures for 1995 (2002 for France) and that of the latest year in each country, U.K. represents an in-crease of 1.25 times, which is the largest of the countries, and followed by U.S. and France with an increase of 1.18 times. Japan showed an increase of 1.07 times.
0
1
2
3
4
5
1981 83 85 87 89 91 93 95 97 99 01 03 05
The n
umbe
r of d
octor
al de
gree
awa
rded
thousand
Ph.D.S awarded by a thesis alone
Ph.D.S awarded during a doctorate program
2006 FY
0
1
2
3
4
5
1981 83 85 87 89 91 93 95 97 99 01 03 05
The n
umbe
r of d
octor
al de
gree a
ward
ed
thousand
Ph.D.S awarded by a thesis alonePh.D.S awarded during a doctorate program
2006 FY
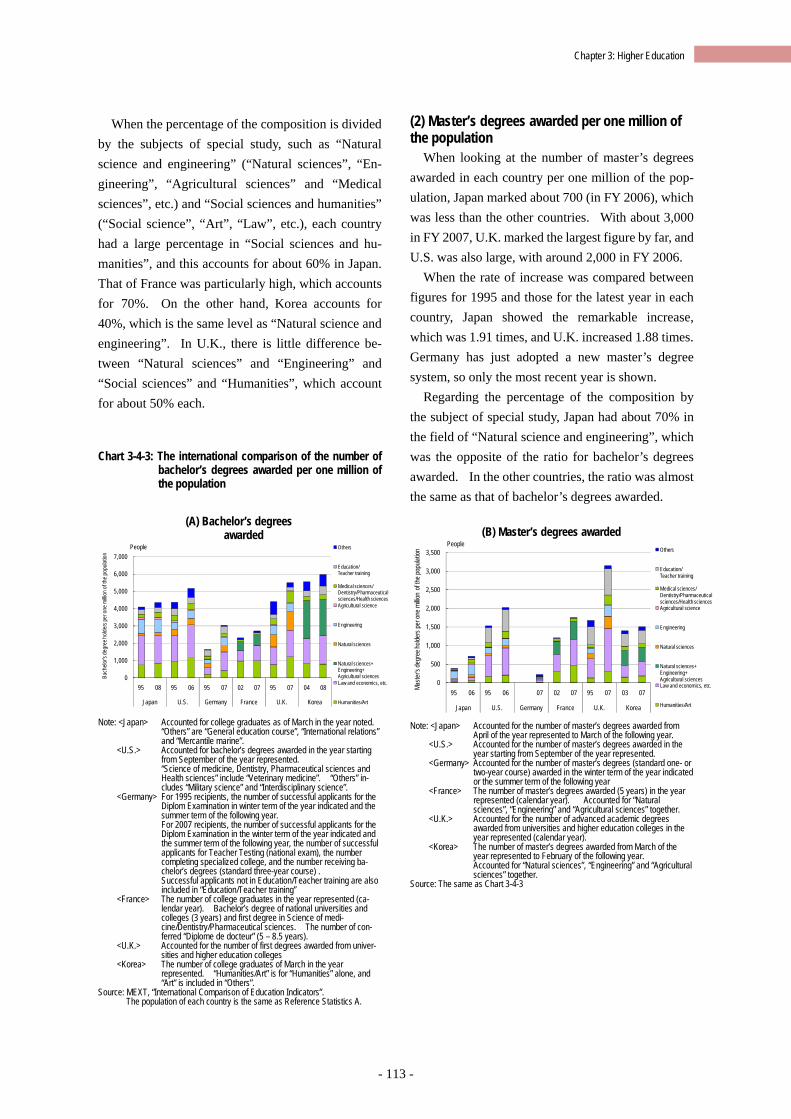
- 113 -
Chapter 3: Higher Education
When the percentage of the composition is divided by the subjects of special study, such as “Natural science and engineering” (“Natural sciences”, “En-gineering”, “Agricultural sciences” and “Medical sciences”, etc.) and “Social sciences and humanities” (“Social science”, “Art”, “Law”, etc.), each country had a large percentage in “Social sciences and hu-manities”, and this accounts for about 60% in Japan. That of France was particularly high, which accounts for 70%. On the other hand, Korea accounts for 40%, which is the same level as “Natural science and engineering”. In U.K., there is little difference be-tween “Natural sciences” and “Engineering” and “Social sciences” and “Humanities”, which account for about 50% each. Chart 3-4-3: The international comparison of the number of
bachelor’s degrees awarded per one million of the population
(A) Bachelor’s degrees
awarded
Note: <Japan> Accounted for college graduates as of March in the year noted. “Others” are “General education course”, “International relations”
and “Mercantile marine”. <U.S.> Accounted for bachelor’s degrees awarded in the year starting
from September of the year represented. “Science of medicine, Dentistry, Pharmaceutical sciences and
Health sciences” include “Veterinary medicine”. “Others” in-cludes “Military science” and “Interdisciplinary science”.
<Germany> For 1995 recipients, the number of successful applicants for the Diplom Examination in winter term of the year indicated and the summer term of the following year. For 2007 recipients, the number of successful applicants for the Diplom Examination in the winter term of the year indicated and the summer term of the following year, the number of successful applicants for Teacher Testing (national exam), the number completing specialized college, and the number receiving ba-chelor’s degrees (standard three-year course) .
Successful applicants not in Education/Teacher training are also included in “Education/Teacher training”
<France> The number of college graduates in the year represented (ca-lendar year). Bachelor’s degree of national universities and colleges (3 years) and first degree in Science of medi-cine/Dentistry/Pharmaceutical sciences. The number of con-ferred “Diplome de docteur” (5 – 8.5 years).
<U.K.> Accounted for the number of first degrees awarded from univer-sities and higher education colleges
<Korea> The number of college graduates of March in the year represented. “Humanities/Art” is for “Humanities” alone, and “Art” is included in “Others”.
Source: MEXT, “International Comparison of Education Indicators”. The population of each country is the same as Reference Statistics A.
(2) Master’s degrees awarded per one million of the population
When looking at the number of master’s degrees awarded in each country per one million of the pop-ulation, Japan marked about 700 (in FY 2006), which was less than the other countries. With about 3,000 in FY 2007, U.K. marked the largest figure by far, and U.S. was also large, with around 2,000 in FY 2006.
When the rate of increase was compared between figures for 1995 and those for the latest year in each country, Japan showed the remarkable increase, which was 1.91 times, and U.K. increased 1.88 times. Germany has just adopted a new master’s degree system, so only the most recent year is shown.
Regarding the percentage of the composition by the subject of special study, Japan had about 70% in the field of “Natural science and engineering”, which was the opposite of the ratio for bachelor’s degrees awarded. In the other countries, the ratio was almost the same as that of bachelor’s degrees awarded.
(B) Master’s degrees awarded
Note: <Japan> Accounted for the number of master’s degrees awarded from
April of the year represented to March of the following year. <U.S.> Accounted for the number of master’s degrees awarded in the
year starting from September of the year represented. <Germany> Accounted for the number of master’s degrees (standard one- or
two-year course) awarded in the winter term of the year indicated or the summer term of the following year
<France> The number of master’s degrees awarded (5 years) in the year represented (calendar year). Accounted for “Natural sciences”, “Engineering” and “Agricultural sciences” together.
<U.K.> Accounted for the number of advanced academic degrees awarded from universities and higher education colleges in the year represented (calendar year).
<Korea> The number of master’s degrees awarded from March of the year represented to February of the following year.
Accounted for “Natural sciences”, “Engineering” and “Agricultural sciences” together.
Source: The same as Chart 3-4-3
0
1,000
2,000
3,000
4,000
5,000
6,000
7,000
95 08 95 06 95 07 02 07 95 07 04 08
Japan U.S. Germany France U.K. Korea
Bach
elor's
degr
ee ho
lders
per o
ne m
illion
of th
e pop
ulatio
n
Others
Education/Teacher training
Medical sciences/ Dentistry/Pharmaceutical sciences/Health sciencesAgricultural science
Engineering
Natural sciences
Natural sciences+Engineering+Agricultural sciencesLaw and economics, etc.
Humanities/Art
People
0
500
1,000
1,500
2,000
2,500
3,000
3,500
95 06 95 06 07 02 07 95 07 03 07
Japan U.S. Germany France U.K. Korea
Maste
r's de
gree
holde
rs pe
r one
millio
n of
the p
opula
tion Others
Education/Teacher training
Medical sciences/ Dentistry/Pharmaceutical sciences/Health sciencesAgricultural science
Engineering
Natural sciences
Natural sciences+Engineering+Agricultural sciencesLaw and economics, etc.
Humanities/Art
People
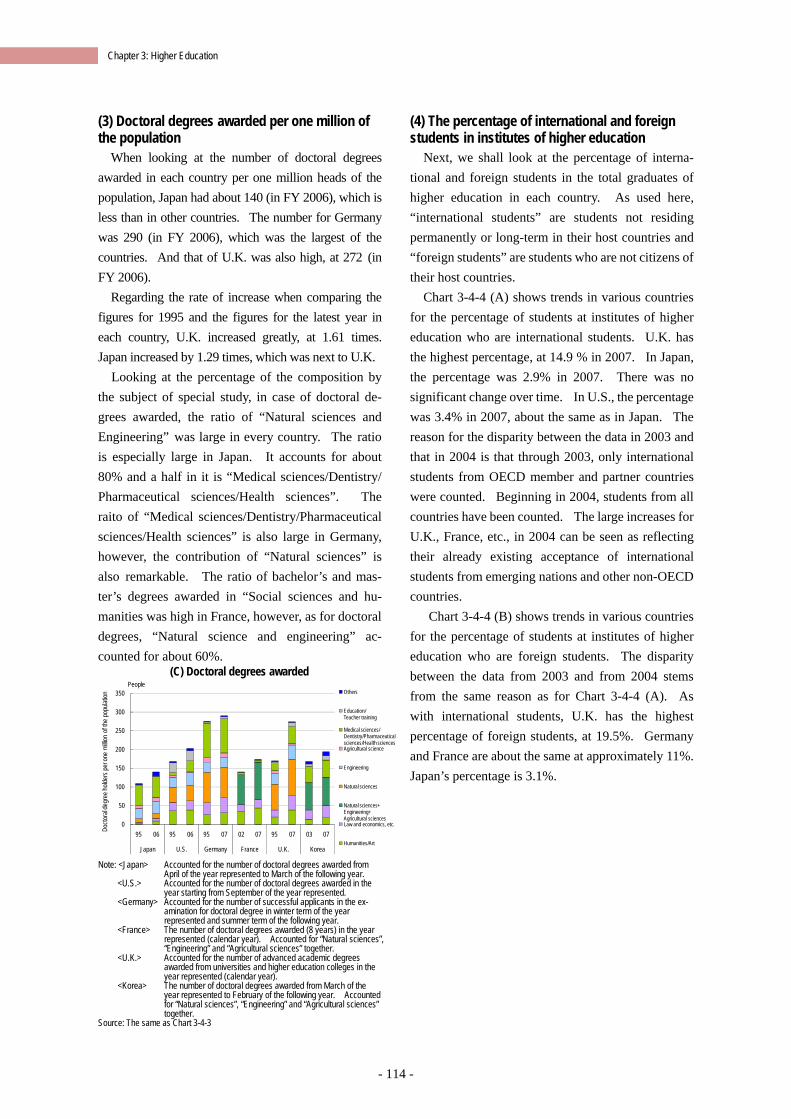
- 114 -
Chapter 3: Higher Education
(3) Doctoral degrees awarded per one million of the population
When looking at the number of doctoral degrees awarded in each country per one million heads of the population, Japan had about 140 (in FY 2006), which is less than in other countries. The number for Germany was 290 (in FY 2006), which was the largest of the countries. And that of U.K. was also high, at 272 (in FY 2006).
Regarding the rate of increase when comparing the figures for 1995 and the figures for the latest year in each country, U.K. increased greatly, at 1.61 times. Japan increased by 1.29 times, which was next to U.K.
Looking at the percentage of the composition by the subject of special study, in case of doctoral de-grees awarded, the ratio of “Natural sciences and Engineering” was large in every country. The ratio is especially large in Japan. It accounts for about 80% and a half in it is “Medical sciences/Dentistry/ Pharmaceutical sciences/Health sciences”. The raito of “Medical sciences/Dentistry/Pharmaceutical sciences/Health sciences” is also large in Germany, however, the contribution of “Natural sciences” is also remarkable. The ratio of bachelor’s and mas-ter’s degrees awarded in “Social sciences and hu-manities was high in France, however, as for doctoral degrees, “Natural science and engineering” ac-counted for about 60%.
(C) Doctoral degrees awarded
Note: <Japan> Accounted for the number of doctoral degrees awarded from
April of the year represented to March of the following year. <U.S.> Accounted for the number of doctoral degrees awarded in the
year starting from September of the year represented. <Germany> Accounted for the number of successful applicants in the ex-
amination for doctoral degree in winter term of the year represented and summer term of the following year.
<France> The number of doctoral degrees awarded (8 years) in the year represented (calendar year). Accounted for “Natural sciences”, “Engineering” and “Agricultural sciences” together.
<U.K.> Accounted for the number of advanced academic degrees awarded from universities and higher education colleges in the year represented (calendar year).
<Korea> The number of doctoral degrees awarded from March of the year represented to February of the following year. Accounted for “Natural sciences”, “Engineering” and “Agricultural sciences” together.
Source: The same as Chart 3-4-3
(4) The percentage of international and foreign students in institutes of higher education
Next, we shall look at the percentage of interna-tional and foreign students in the total graduates of higher education in each country. As used here, “international students” are students not residing permanently or long-term in their host countries and “foreign students” are students who are not citizens of their host countries.
Chart 3-4-4 (A) shows trends in various countries for the percentage of students at institutes of higher education who are international students. U.K. has the highest percentage, at 14.9 % in 2007. In Japan, the percentage was 2.9% in 2007. There was no significant change over time. In U.S., the percentage was 3.4% in 2007, about the same as in Japan. The reason for the disparity between the data in 2003 and that in 2004 is that through 2003, only international students from OECD member and partner countries were counted. Beginning in 2004, students from all countries have been counted. The large increases for U.K., France, etc., in 2004 can be seen as reflecting their already existing acceptance of international students from emerging nations and other non-OECD countries.
Chart 3-4-4 (B) shows trends in various countries for the percentage of students at institutes of higher education who are foreign students. The disparity between the data from 2003 and from 2004 stems from the same reason as for Chart 3-4-4 (A). As with international students, U.K. has the highest percentage of foreign students, at 19.5%. Germany and France are about the same at approximately 11%. Japan’s percentage is 3.1%.
0
50
100
150
200
250
300
350
95 06 95 06 95 07 02 07 95 07 03 07
Japan U.S. Germany France U.K. Korea
Docto
ral d
egre
e hold
ers p
er on
e mi
llion
of th
e pop
ulatio
n Others
Education/Teacher training
Medical sciences/ Dentistry/Pharmaceutical sciences/Health sciencesAgricultural science
Engineering
Natural sciences
Natural sciences+Engineering+Agricultural sciencesLaw and economics, etc.
Humanities/Art
People
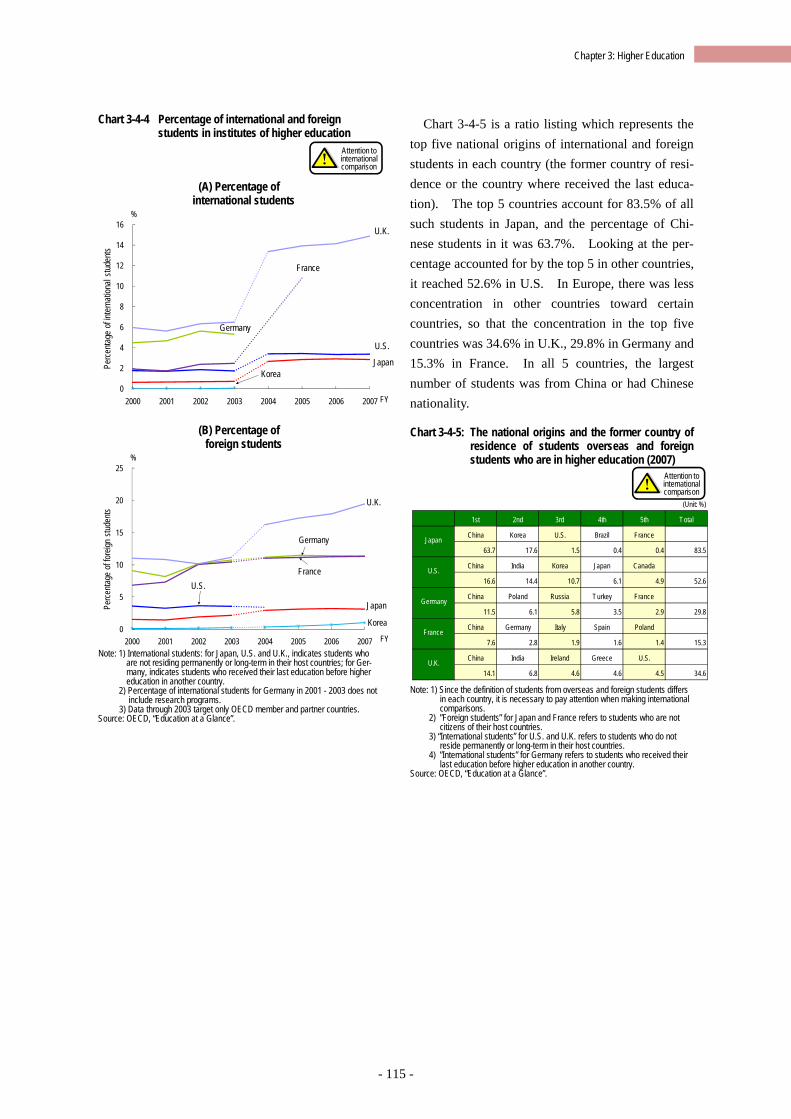
- 115 -
Chapter 3: Higher Education
Chart 3-4-4 Percentage of international and foreign students in institutes of higher education
(A) Percentage of international students
(B) Percentage of foreign students
Note: 1) International students: for Japan, U.S. and U.K., indicates students who
are not residing permanently or long-term in their host countries; for Ger-many, indicates students who received their last education before higher education in another country.
2) Percentage of international students for Germany in 2001 - 2003 does not include research programs.
3) Data through 2003 target only OECD member and partner countries. Source: OECD, “Education at a Glance”.
Chart 3-4-5 is a ratio listing which represents the top five national origins of international and foreign students in each country (the former country of resi-dence or the country where received the last educa-tion). The top 5 countries account for 83.5% of all such students in Japan, and the percentage of Chi-nese students in it was 63.7%. Looking at the per-centage accounted for by the top 5 in other countries, it reached 52.6% in U.S. In Europe, there was less concentration in other countries toward certain countries, so that the concentration in the top five countries was 34.6% in U.K., 29.8% in Germany and 15.3% in France. In all 5 countries, the largest number of students was from China or had Chinese nationality. Chart 3-4-5: The national origins and the former country of
residence of students overseas and foreign students who are in higher education (2007)
Note: 1) Since the definition of students from overseas and foreign students differs
in each country, it is necessary to pay attention when making international comparisons.
2) ”Foreign students” for Japan and France refers to students who are not citizens of their host countries.
3) “International students” for U.S. and U.K. refers to students who do not reside permanently or long-term in their host countries.
4) ”International students” for Germany refers to students who received their last education before higher education in another country.
Source: OECD, “Education at a Glance”.
0
2
4
6
8
10
12
14
16
2000 2001 2002 2003 2004 2005 2006 2007
Perce
ntage
of in
terna
tiona
l stud
ents
FY
Germany
Korea
France
Japan
%
U.S.
U.K.
0
5
10
15
20
25
2000 2001 2002 2003 2004 2005 2006 2007
Perce
ntage
of fo
reign
stud
ents
FY
Japan
Germany
Korea
France
%
U.S.
U.K. (Unit: %)
1st 2nd 3rd 4th 5th Total
China Korea U.S. Brazil France
63.7 17.6 1.5 0.4 0.4 83.5
China India Korea Japan Canada
16.6 14.4 10.7 6.1 4.9 52.6
China Poland Russia Turkey France
11.5 6.1 5.8 3.5 2.9 29.8
China Germany Italy Spain Poland
7.6 2.8 1.9 1.6 1.4 15.3
China India Ireland Greece U.S.
14.1 6.8 4.6 4.6 4.5 34.6
Japan
U.S.
Germany
U.K.
France
Attention to international comparison
Attention to international comparison
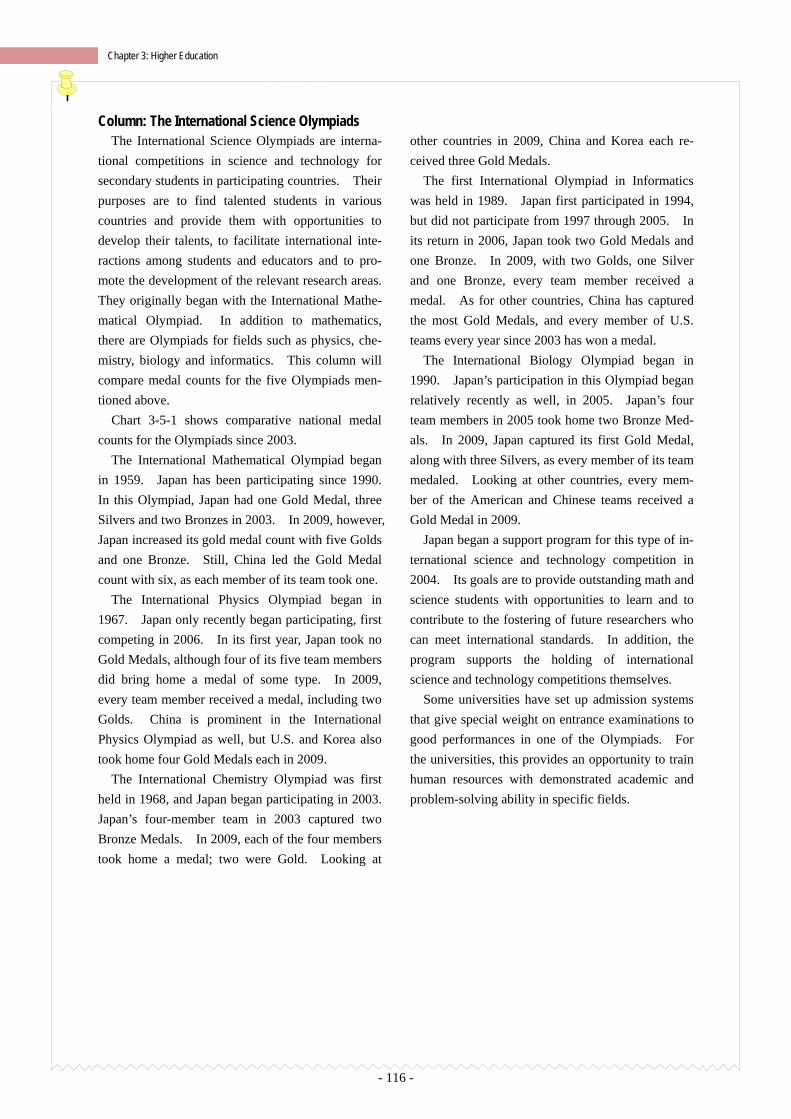
- 116 -
Chapter 3: Higher Education
Column: The International Science Olympiads The International Science Olympiads are interna-
tional competitions in science and technology for secondary students in participating countries. Their purposes are to find talented students in various countries and provide them with opportunities to develop their talents, to facilitate international inte-ractions among students and educators and to pro-mote the development of the relevant research areas. They originally began with the International Mathe-matical Olympiad. In addition to mathematics, there are Olympiads for fields such as physics, che-mistry, biology and informatics. This column will compare medal counts for the five Olympiads men-tioned above.
Chart 3-5-1 shows comparative national medal counts for the Olympiads since 2003.
The International Mathematical Olympiad began in 1959. Japan has been participating since 1990. In this Olympiad, Japan had one Gold Medal, three Silvers and two Bronzes in 2003. In 2009, however, Japan increased its gold medal count with five Golds and one Bronze. Still, China led the Gold Medal count with six, as each member of its team took one.
The International Physics Olympiad began in 1967. Japan only recently began participating, first competing in 2006. In its first year, Japan took no Gold Medals, although four of its five team members did bring home a medal of some type. In 2009, every team member received a medal, including two Golds. China is prominent in the International Physics Olympiad as well, but U.S. and Korea also took home four Gold Medals each in 2009.
The International Chemistry Olympiad was first held in 1968, and Japan began participating in 2003. Japan’s four-member team in 2003 captured two Bronze Medals. In 2009, each of the four members took home a medal; two were Gold. Looking at
other countries in 2009, China and Korea each re-ceived three Gold Medals.
The first International Olympiad in Informatics was held in 1989. Japan first participated in 1994, but did not participate from 1997 through 2005. In its return in 2006, Japan took two Gold Medals and one Bronze. In 2009, with two Golds, one Silver and one Bronze, every team member received a medal. As for other countries, China has captured the most Gold Medals, and every member of U.S. teams every year since 2003 has won a medal.
The International Biology Olympiad began in 1990. Japan’s participation in this Olympiad began relatively recently as well, in 2005. Japan’s four team members in 2005 took home two Bronze Med-als. In 2009, Japan captured its first Gold Medal, along with three Silvers, as every member of its team medaled. Looking at other countries, every mem-ber of the American and Chinese teams received a Gold Medal in 2009.
Japan began a support program for this type of in-ternational science and technology competition in 2004. Its goals are to provide outstanding math and science students with opportunities to learn and to contribute to the fostering of future researchers who can meet international standards. In addition, the program supports the holding of international science and technology competitions themselves.
Some universities have set up admission systems that give special weight on entrance examinations to good performances in one of the Olympiads. For the universities, this provides an opportunity to train human resources with demonstrated academic and problem-solving ability in specific fields.
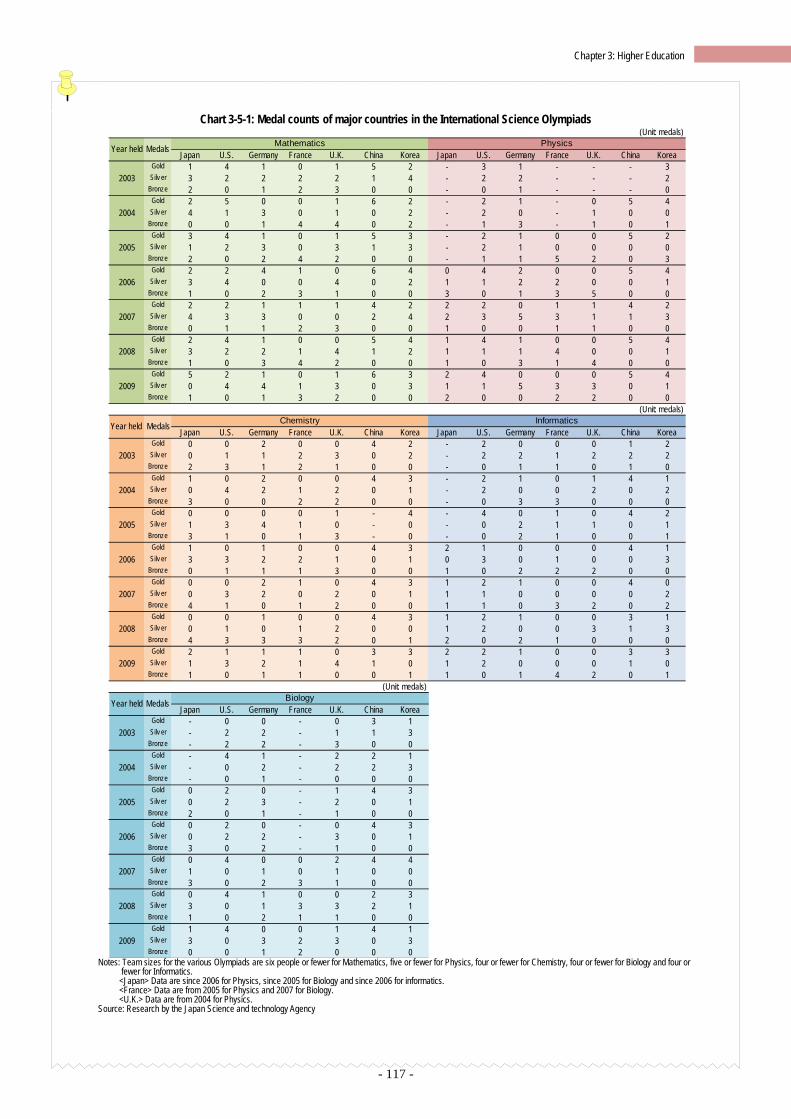
- 117 -
Chapter 3: Higher Education
Chart 3-5-1: Medal counts of major countries in the International Science Olympiads
Notes: Team sizes for the various Olympiads are six people or fewer for Mathematics, five or fewer for Physics, four or fewer for Chemistry, four or fewer for Biology and four or
fewer for Informatics. <Japan> Data are since 2006 for Physics, since 2005 for Biology and since 2006 for informatics. <France> Data are from 2005 for Physics and 2007 for Biology. <U.K.> Data are from 2004 for Physics.
Source: Research by the Japan Science and technology Agency
(Unit: medals)Mathematics Physics
Japan U.S. Germany France U.K. China Korea Japan U.S. Germany France U.K. China KoreaGold 1 4 1 0 1 5 2 - 3 1 - - - 3
2003 Silv er 3 2 2 2 2 1 4 - 2 2 - - - 2Bronze 2 0 1 2 3 0 0 - 0 1 - - - 0
Gold 2 5 0 0 1 6 2 - 2 1 - 0 5 42004 Silv er 4 1 3 0 1 0 2 - 2 0 - 1 0 0
Bronze 0 0 1 4 4 0 2 - 1 3 - 1 0 1Gold 3 4 1 0 1 5 3 - 2 1 0 0 5 2
2005 Silv er 1 2 3 0 3 1 3 - 2 1 0 0 0 0Bronze 2 0 2 4 2 0 0 - 1 1 5 2 0 3
Gold 2 2 4 1 0 6 4 0 4 2 0 0 5 42006 Silv er 3 4 0 0 4 0 2 1 1 2 2 0 0 1
Bronze 1 0 2 3 1 0 0 3 0 1 3 5 0 0Gold 2 2 1 1 1 4 2 2 2 0 1 1 4 2
2007 Silv er 4 3 3 0 0 2 4 2 3 5 3 1 1 3Bronze 0 1 1 2 3 0 0 1 0 0 1 1 0 0
Gold 2 4 1 0 0 5 4 1 4 1 0 0 5 42008 Silv er 3 2 2 1 4 1 2 1 1 1 4 0 0 1
Bronze 1 0 3 4 2 0 0 1 0 3 1 4 0 0Gold 5 2 1 0 1 6 3 2 4 0 0 0 5 4
2009 Silv er 0 4 4 1 3 0 3 1 1 5 3 3 0 1Bronze 1 0 1 3 2 0 0 2 0 0 2 2 0 0
(Unit: medals)Chemistry Informatics
Japan U.S. Germany France U.K. China Korea Japan U.S. Germany France U.K. China KoreaGold 0 0 2 0 0 4 2 - 2 0 0 0 1 2
2003 Silv er 0 1 1 2 3 0 2 - 2 2 1 2 2 2Bronze 2 3 1 2 1 0 0 - 0 1 1 0 1 0
Gold 1 0 2 0 0 4 3 - 2 1 0 1 4 12004 Silv er 0 4 2 1 2 0 1 - 2 0 0 2 0 2
Bronze 3 0 0 2 2 0 0 - 0 3 3 0 0 0Gold 0 0 0 0 1 - 4 - 4 0 1 0 4 2
2005 Silv er 1 3 4 1 0 - 0 - 0 2 1 1 0 1Bronze 3 1 0 1 3 - 0 - 0 2 1 0 0 1
Gold 1 0 1 0 0 4 3 2 1 0 0 0 4 12006 Silv er 3 3 2 2 1 0 1 0 3 0 1 0 0 3
Bronze 0 1 1 1 3 0 0 1 0 2 2 2 0 0Gold 0 0 2 1 0 4 3 1 2 1 0 0 4 0
2007 Silv er 0 3 2 0 2 0 1 1 1 0 0 0 0 2Bronze 4 1 0 1 2 0 0 1 1 0 3 2 0 2
Gold 0 0 1 0 0 4 3 1 2 1 0 0 3 12008 Silv er 0 1 0 1 2 0 0 1 2 0 0 3 1 3
Bronze 4 3 3 3 2 0 1 2 0 2 1 0 0 0Gold 2 1 1 1 0 3 3 2 2 1 0 0 3 3
2009 Silv er 1 3 2 1 4 1 0 1 2 0 0 0 1 0Bronze 1 0 1 1 0 0 1 1 0 1 4 2 0 1
(Unit: medals)Biology
Japan U.S. Germany France U.K. China KoreaGold - 0 0 - 0 3 1
2003 Silv er - 2 2 - 1 1 3Bronze - 2 2 - 3 0 0
Gold - 4 1 - 2 2 12004 Silv er - 0 2 - 2 2 3
Bronze - 0 1 - 0 0 0Gold 0 2 0 - 1 4 3
2005 Silv er 0 2 3 - 2 0 1Bronze 2 0 1 - 1 0 0
Gold 0 2 0 - 0 4 32006 Silv er 0 2 2 - 3 0 1
Bronze 3 0 2 - 1 0 0Gold 0 4 0 0 2 4 4
2007 Silv er 1 0 1 0 1 0 0Bronze 3 0 2 3 1 0 0
Gold 0 4 1 0 0 2 32008 Silv er 3 0 1 3 3 2 1
Bronze 1 0 2 1 1 0 0Gold 1 4 0 0 1 4 1
2009 Silv er 3 0 3 2 3 0 3Bronze 0 0 1 2 0 0 0
Year held Medals
Year held Medals
Year held Medals

- 119 -
Chapter 4:The output of R&D
Chapter 4:The output of R&D
In recent years, accountability for investments in R&D has become strongly demanded, and understanding the output of R&D has become a major theme. This chapter introduces changes in and features of the world’s and main countries’ R&D activities, focusing attention on scientific papers and patents as measurable output of such R&D activities.
4.1 Scientific Papers
Key Points ○The quantity of papers, which are the output of the world’s research activities, has consistently shown an
upward trend. ○Research activities themselves have changed from the activities of a single country into joint activities
that are conducted by multiple countries. Now international co-authorship papers have increased, and a difference has emerged between the “degree of participation (whole counting) in the production of papers in the world” and the “degree of contribution (fractional counting) to the production of papers in the world”.
○Regarding the numbers of papers produced in Japan (the average from 2007–2009), in terms of the “de-gree of participation in the production of papers in the world” Japan is ranked fifth in the world, after U.S., China, U.K. and Germany. Meanwhile, although in terms of the “degree of contribution to the produc-tion of papers in the world” Japan ranks third, behind U.S. and China, it outranks U.K. and Germany.
○China has increased both in terms of the “degree of participation in the production of papers in the world” and the “degree of contribution to the production of papers in the world” since the late 1990s, holding second place in the world during the latter half of the 2000s.
○Looking at the balance of the fields in Japan, the share of Chemistry has decreased and that of Clinical medicine has increased.
○On the other hand, looking at the field portfolios in main countries by world share, Japan has more weight on Chemistry, Material science and Physics, and less weight on Computer science/Mathematics, Envi-ronment/Geoscience, Basic life sciences and Clinical medicine. In U.S. and U.K., there is much weight placed on Basic life sciences and Clinical medicine.
○The percentage of international co-authorship for 2009 was 50% for Germany, 51% for U.K. and 51% for France,
while U.S. was 32% and Japan was 26%.
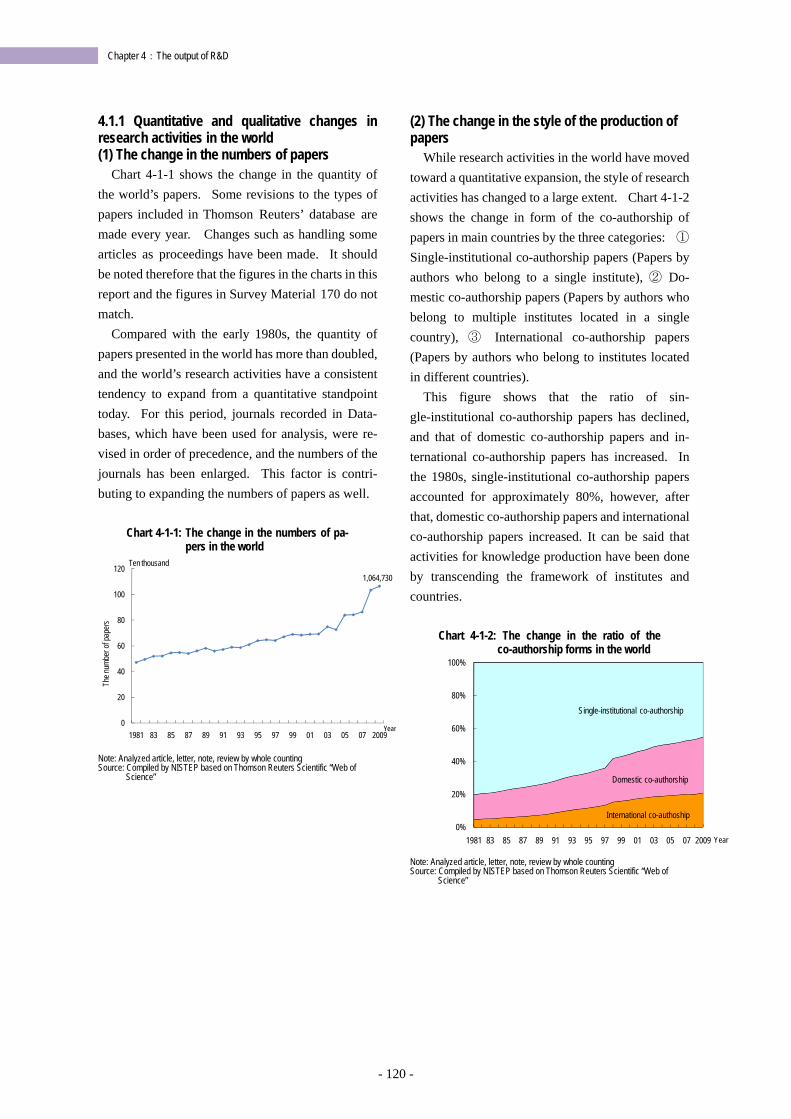
- 120 -
Chapter 4:The output of R&D
4.1.1 Quantitative and qualitative changes in research activities in the world (1) The change in the numbers of papers
Chart 4-1-1 shows the change in the quantity of the world’s papers. Some revisions to the types of papers included in Thomson Reuters’ database are made every year. Changes such as handling some articles as proceedings have been made. It should be noted therefore that the figures in the charts in this report and the figures in Survey Material 170 do not match.
Compared with the early 1980s, the quantity of papers presented in the world has more than doubled, and the world’s research activities have a consistent tendency to expand from a quantitative standpoint today. For this period, journals recorded in Data-bases, which have been used for analysis, were re-vised in order of precedence, and the numbers of the journals has been enlarged. This factor is contri-buting to expanding the numbers of papers as well.
Chart 4-1-1: The change in the numbers of pa-
pers in the world
Note: Analyzed article, letter, note, review by whole counting Source: Compiled by NISTEP based on Thomson Reuters Scientific “Web of
Science”
(2) The change in the style of the production of papers
While research activities in the world have moved toward a quantitative expansion, the style of research activities has changed to a large extent. Chart 4-1-2 shows the change in form of the co-authorship of papers in main countries by the three categories: ① Single-institutional co-authorship papers (Papers by authors who belong to a single institute), ② Do-mestic co-authorship papers (Papers by authors who belong to multiple institutes located in a single country), ③ International co-authorship papers (Papers by authors who belong to institutes located in different countries).
This figure shows that the ratio of sin-gle-institutional co-authorship papers has declined, and that of domestic co-authorship papers and in-ternational co-authorship papers has increased. In the 1980s, single-institutional co-authorship papers accounted for approximately 80%, however, after that, domestic co-authorship papers and international co-authorship papers increased. It can be said that activities for knowledge production have been done by transcending the framework of institutes and countries.
Chart 4-1-2: The change in the ratio of the co-authorship forms in the world
Note: Analyzed article, letter, note, review by whole counting Source: Compiled by NISTEP based on Thomson Reuters Scientific “Web of
Science”
1,064,730
0
20
40
60
80
100
120
1981 83 85 87 89 91 93 95 97 99 01 03 05 07 2009
The n
umbe
r of p
aper
s
Ten thousand
Year
0%
20%
40%
60%
80%
100%
1981 83 85 87 89 91 93 95 97 99 01 03 05 07 2009
Domestic co-authorship
Single-institutional co-authorship
International co-authoship
Year
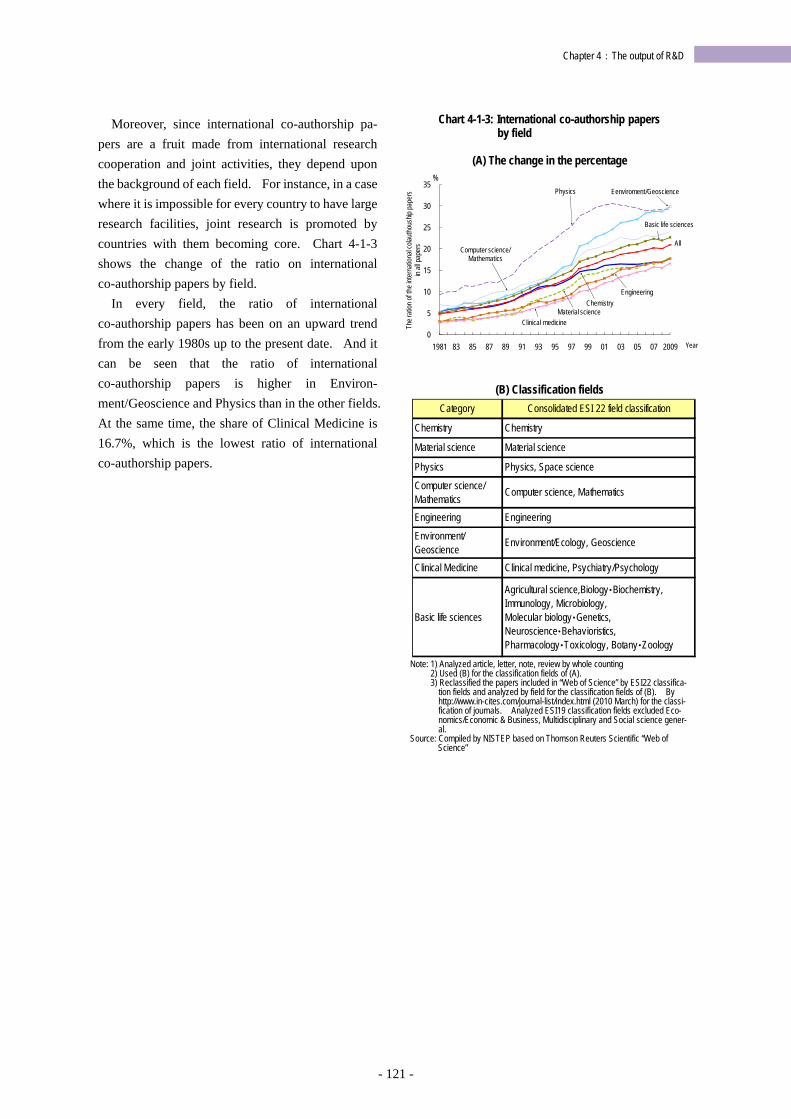
- 121 -
Chapter 4:The output of R&D
Moreover, since international co-authorship pa-pers are a fruit made from international research cooperation and joint activities, they depend upon the background of each field. For instance, in a case where it is impossible for every country to have large research facilities, joint research is promoted by countries with them becoming core. Chart 4-1-3 shows the change of the ratio on international co-authorship papers by field.
In every field, the ratio of international co-authorship papers has been on an upward trend from the early 1980s up to the present date. And it can be seen that the ratio of international co-authorship papers is higher in Environ-ment/Geoscience and Physics than in the other fields. At the same time, the share of Clinical Medicine is 16.7%, which is the lowest ratio of international co-authorship papers.
Chart 4-1-3: International co-authorship papers by field
(A) The change in the percentage
(B) Classification fields
Note: 1) Analyzed article, letter, note, review by whole counting
2) Used (B) for the classification fields of (A). 3) Reclassified the papers included in “Web of Science” by ESI22 classifica-
tion fields and analyzed by field for the classification fields of (B). By http://www.in-cites.com/journal-list/index.html (2010 March) for the classi-fication of journals. Analyzed ESI19 classification fields excluded Eco-nomics/Economic & Business, Multidisciplinary and Social science gener-al.
Source: Compiled by NISTEP based on Thomson Reuters Scientific “Web of Science”
0
5
10
15
20
25
30
35
1981 83 85 87 89 91 93 95 97 99 01 03 05 07 2009 Year
%Physics
Engineering
Basic life sciences
Clinical medicine
Eenviroment/Geoscience
Computer science/Mathematics
Material scienceChemistry
All
The r
ation
of th
e int
erna
tiona
l cola
utho
uship
pape
rs
in all
pap
ers
Category Consolidated ESI 22 field classification
Chemistry Chemistry
Material science Material science
Physics Physics, Space science
Computer science/ Mathematics Computer science, Mathematics
Engineering Engineering
Environment/Geoscience Environment/Ecology, Geoscience
Clinical Medicine Clinical medicine, Psychiatry/Psychology
Basic life sciences
Agricultural science,Biology Biochemistry, Immunology, Microbiology, Molecular biology Genetics, Neuroscience Behavioristics, Pharmacology Toxicology, Botany Zoology
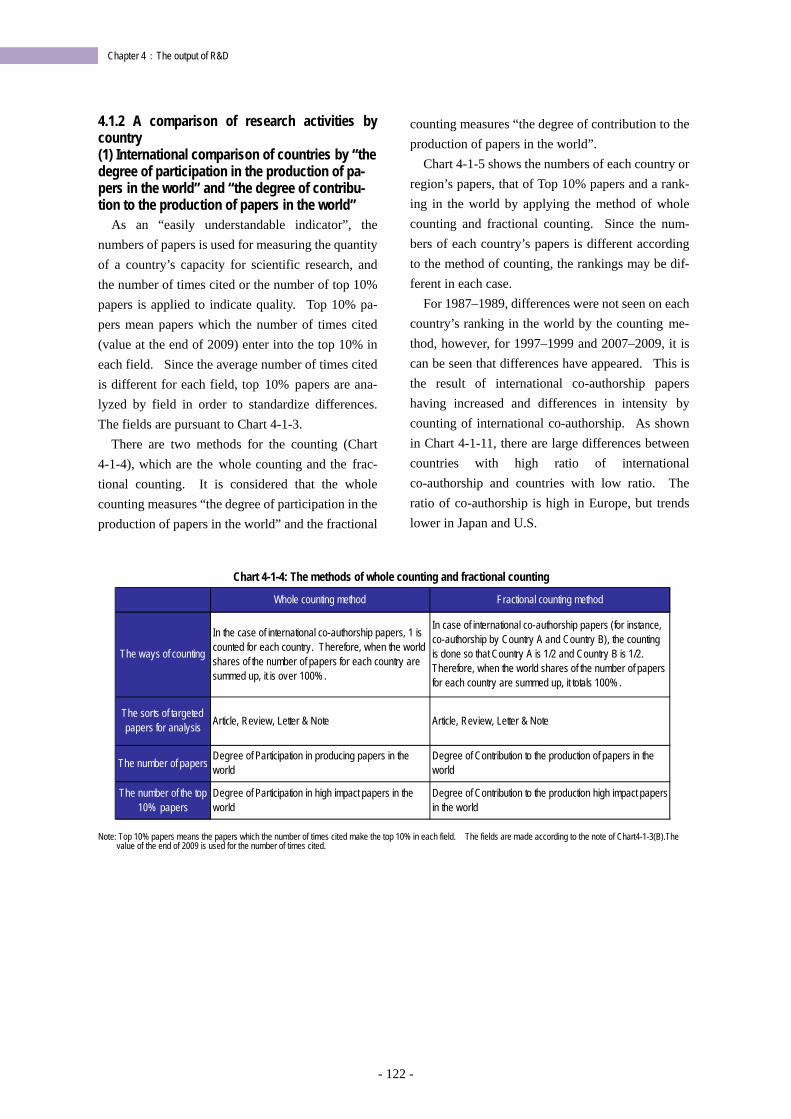
- 122 -
Chapter 4:The output of R&D
4.1.2 A comparison of research activities by country (1) International comparison of countries by “the degree of participation in the production of pa-pers in the world” and “the degree of contribu-tion to the production of papers in the world”
As an “easily understandable indicator”, the numbers of papers is used for measuring the quantity of a country’s capacity for scientific research, and the number of times cited or the number of top 10% papers is applied to indicate quality. Top 10% pa-pers mean papers which the number of times cited (value at the end of 2009) enter into the top 10% in each field. Since the average number of times cited is different for each field, top 10% papers are ana-lyzed by field in order to standardize differences. The fields are pursuant to Chart 4-1-3.
There are two methods for the counting (Chart 4-1-4), which are the whole counting and the frac-tional counting. It is considered that the whole counting measures “the degree of participation in the production of papers in the world” and the fractional
counting measures “the degree of contribution to the production of papers in the world”.
Chart 4-1-5 shows the numbers of each country or region’s papers, that of Top 10% papers and a rank-ing in the world by applying the method of whole counting and fractional counting. Since the num-bers of each country’s papers is different according to the method of counting, the rankings may be dif-ferent in each case.
For 1987–1989, differences were not seen on each country’s ranking in the world by the counting me-thod, however, for 1997–1999 and 2007–2009, it is can be seen that differences have appeared. This is the result of international co-authorship papers having increased and differences in intensity by counting of international co-authorship. As shown in Chart 4-1-11, there are large differences between countries with high ratio of international co-authorship and countries with low ratio. The ratio of co-authorship is high in Europe, but trends lower in Japan and U.S.
Chart 4-1-4: The methods of whole counting and fractional counting
Note: Top 10% papers means the papers which the number of times cited make the top 10% in each field. The fields are made according to the note of Chart4-1-3(B).The
value of the end of 2009 is used for the number of times cited.
Whole counting method Fractional counting method
The ways of counting
In the case of international co-authorship papers, 1 is counted for each country. Therefore, when the world shares of the number of papers for each country are summed up, it is over 100% .
In case of international co-authorship papers (for instance, co-authorship by Country A and Country B), the counting is done so that Country A is 1/2 and Country B is 1/2. Therefore, when the world shares of the number of papers for each country are summed up, it totals 100% .
The sorts of targeted papers for analysis Article, Review, Letter & Note Article, Review, Letter & Note
The number of papers Degree of Participation in producing papers in the world
Degree of Contribution to the production of papers in the world
The number of the top 10% papers
Degree of Participation in high impact papers in the world
Degree of Contribution to the production high impact papers in the world
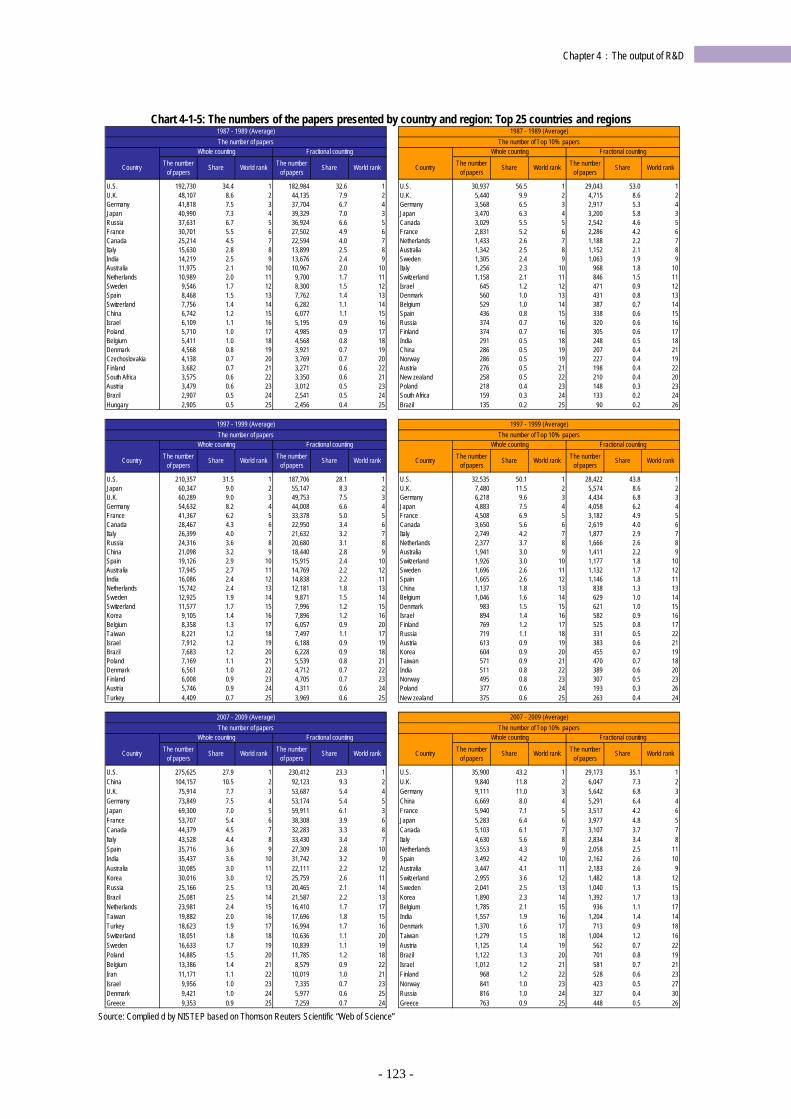
- 123 -
Chapter 4:The output of R&D
Chart 4-1-5: The numbers of the papers presented by country and region: Top 25 countries and regions
Source: Complied d by NISTEP based on Thomson Reuters Scientific “Web of Science”
Country The number of papers Share World rank The number
of papers Share World rank Country The number of papers Share World rank The number
of papers Share World rank
U.S. 192,730 34.4 1 182,984 32.6 1 U.S. 30,937 56.5 1 29,043 53.0 1U.K. 48,107 8.6 2 44,135 7.9 2 U.K. 5,440 9.9 2 4,715 8.6 2Germany 41,818 7.5 3 37,704 6.7 4 Germany 3,568 6.5 3 2,917 5.3 4Japan 40,990 7.3 4 39,329 7.0 3 Japan 3,470 6.3 4 3,200 5.8 3Russia 37,631 6.7 5 36,924 6.6 5 Canada 3,029 5.5 5 2,542 4.6 5France 30,701 5.5 6 27,502 4.9 6 France 2,831 5.2 6 2,286 4.2 6Canada 25,214 4.5 7 22,594 4.0 7 Netherlands 1,433 2.6 7 1,188 2.2 7Italy 15,630 2.8 8 13,899 2.5 8 Australia 1,342 2.5 8 1,152 2.1 8India 14,219 2.5 9 13,676 2.4 9 Sweden 1,305 2.4 9 1,063 1.9 9Australia 11,975 2.1 10 10,967 2.0 10 Italy 1,256 2.3 10 968 1.8 10Netherlands 10,989 2.0 11 9,700 1.7 11 Switzerland 1,158 2.1 11 846 1.5 11Sweden 9,546 1.7 12 8,300 1.5 12 Israel 645 1.2 12 471 0.9 12Spain 8,468 1.5 13 7,762 1.4 13 Denmark 560 1.0 13 431 0.8 13Switzerland 7,756 1.4 14 6,282 1.1 14 Belgium 529 1.0 14 387 0.7 14China 6,742 1.2 15 6,077 1.1 15 Spain 436 0.8 15 338 0.6 15Israel 6,109 1.1 16 5,195 0.9 16 Russia 374 0.7 16 320 0.6 16Poland 5,710 1.0 17 4,985 0.9 17 Finland 374 0.7 16 305 0.6 17Belgium 5,411 1.0 18 4,568 0.8 18 India 291 0.5 18 248 0.5 18Denmark 4,568 0.8 19 3,921 0.7 19 China 286 0.5 19 207 0.4 21Czechoslovakia 4,138 0.7 20 3,769 0.7 20 Norway 286 0.5 19 227 0.4 19Finland 3,682 0.7 21 3,271 0.6 22 Austria 276 0.5 21 198 0.4 22South Africa 3,575 0.6 22 3,350 0.6 21 New zealand 258 0.5 22 210 0.4 20Austria 3,479 0.6 23 3,012 0.5 23 Poland 218 0.4 23 148 0.3 23Brazil 2,907 0.5 24 2,541 0.5 24 South Africa 159 0.3 24 133 0.2 24Hungary 2,905 0.5 25 2,456 0.4 25 Brazil 135 0.2 25 90 0.2 26
Country The number of papers
Share World rank The number of papers
Share World rank Country The number of papers
Share World rank The number of papers
Share World rank
U.S. 210,357 31.5 1 187,706 28.1 1 U.S. 32,535 50.1 1 28,422 43.8 1Japan 60,347 9.0 2 55,147 8.3 2 U.K. 7,480 11.5 2 5,574 8.6 2U.K. 60,289 9.0 3 49,753 7.5 3 Germany 6,218 9.6 3 4,434 6.8 3Germany 54,632 8.2 4 44,008 6.6 4 Japan 4,883 7.5 4 4,058 6.2 4France 41,367 6.2 5 33,378 5.0 5 France 4,508 6.9 5 3,182 4.9 5Canada 28,467 4.3 6 22,950 3.4 6 Canada 3,650 5.6 6 2,619 4.0 6Italy 26,399 4.0 7 21,632 3.2 7 Italy 2,749 4.2 7 1,877 2.9 7Russia 24,316 3.6 8 20,680 3.1 8 Netherlands 2,377 3.7 8 1,666 2.6 8China 21,098 3.2 9 18,440 2.8 9 Australia 1,941 3.0 9 1,411 2.2 9Spain 19,126 2.9 10 15,915 2.4 10 Switzerland 1,926 3.0 10 1,177 1.8 10Australia 17,945 2.7 11 14,769 2.2 12 Sweden 1,696 2.6 11 1,132 1.7 12India 16,086 2.4 12 14,838 2.2 11 Spain 1,665 2.6 12 1,146 1.8 11Netherlands 15,742 2.4 13 12,181 1.8 13 China 1,137 1.8 13 838 1.3 13Sweden 12,925 1.9 14 9,871 1.5 14 Belgium 1,046 1.6 14 629 1.0 14Switzerland 11,577 1.7 15 7,996 1.2 15 Denmark 983 1.5 15 621 1.0 15Korea 9,105 1.4 16 7,896 1.2 16 Israel 894 1.4 16 582 0.9 16Belgium 8,358 1.3 17 6,057 0.9 20 Finland 769 1.2 17 525 0.8 17Taiwan 8,221 1.2 18 7,497 1.1 17 Russia 719 1.1 18 331 0.5 22Israel 7,912 1.2 19 6,188 0.9 19 Austria 613 0.9 19 383 0.6 21Brazil 7,683 1.2 20 6,228 0.9 18 Korea 604 0.9 20 455 0.7 19Poland 7,169 1.1 21 5,539 0.8 21 Taiwan 571 0.9 21 470 0.7 18Denmark 6,561 1.0 22 4,712 0.7 22 India 511 0.8 22 389 0.6 20Finland 6,008 0.9 23 4,705 0.7 23 Norway 495 0.8 23 307 0.5 23Austria 5,746 0.9 24 4,311 0.6 24 Poland 377 0.6 24 193 0.3 26Turkey 4,409 0.7 25 3,969 0.6 25 New zealand 375 0.6 25 263 0.4 24
Country The number of papers
Share World rank The number of papers
Share World rank Country The number of papers
Share World rank The number of papers
Share World rank
U.S. 275,625 27.9 1 230,412 23.3 1 U.S. 35,900 43.2 1 29,173 35.1 1China 104,157 10.5 2 92,123 9.3 2 U.K. 9,840 11.8 2 6,047 7.3 2U.K. 75,914 7.7 3 53,687 5.4 4 Germany 9,111 11.0 3 5,642 6.8 3Germany 73,849 7.5 4 53,174 5.4 5 China 6,669 8.0 4 5,291 6.4 4Japan 69,300 7.0 5 59,911 6.1 3 France 5,940 7.1 5 3,517 4.2 6France 53,707 5.4 6 38,308 3.9 6 Japan 5,283 6.4 6 3,977 4.8 5Canada 44,379 4.5 7 32,283 3.3 8 Canada 5,103 6.1 7 3,107 3.7 7Italy 43,528 4.4 8 33,430 3.4 7 Italy 4,630 5.6 8 2,834 3.4 8Spain 35,716 3.6 9 27,309 2.8 10 Netherlands 3,553 4.3 9 2,058 2.5 11India 35,437 3.6 10 31,742 3.2 9 Spain 3,492 4.2 10 2,162 2.6 10Australia 30,085 3.0 11 22,111 2.2 12 Australia 3,447 4.1 11 2,183 2.6 9Korea 30,016 3.0 12 25,759 2.6 11 Switzerland 2,955 3.6 12 1,482 1.8 12Russia 25,166 2.5 13 20,465 2.1 14 Sweden 2,041 2.5 13 1,040 1.3 15Brazil 25,081 2.5 14 21,587 2.2 13 Korea 1,890 2.3 14 1,392 1.7 13Netherlands 23,981 2.4 15 16,410 1.7 17 Belgium 1,785 2.1 15 936 1.1 17Taiwan 19,882 2.0 16 17,696 1.8 15 India 1,557 1.9 16 1,204 1.4 14Turkey 18,623 1.9 17 16,994 1.7 16 Denmark 1,370 1.6 17 713 0.9 18Switzerland 18,051 1.8 18 10,636 1.1 20 Taiwan 1,279 1.5 18 1,004 1.2 16Sweden 16,633 1.7 19 10,839 1.1 19 Austria 1,125 1.4 19 562 0.7 22Poland 14,885 1.5 20 11,785 1.2 18 Brazil 1,122 1.3 20 701 0.8 19Belgium 13,386 1.4 21 8,579 0.9 22 Israel 1,012 1.2 21 581 0.7 21Iran 11,171 1.1 22 10,019 1.0 21 Finland 968 1.2 22 528 0.6 23Israel 9,956 1.0 23 7,335 0.7 23 Norway 841 1.0 23 423 0.5 27Denmark 9,421 1.0 24 5,977 0.6 25 Russia 816 1.0 24 327 0.4 30Greece 9,353 0.9 25 7,259 0.7 24 Greece 763 0.9 25 448 0.5 26
Whole counting Fractional counting Whole counting Fractional counting
1987 - 1989 (Average) 1987 - 1989 (Average)The number of papers The number of Top 10% papers
Whole counting Fractional counting Whole counting Fractional counting
1997 - 1999 (Average) 1997 - 1999 (Average)The number of papers The number of Top 10% papers
Whole counting Fractional counting Whole counting Fractional counting
2007 - 2009 (Average) 2007 - 2009 (Average)The number of papers The number of Top 10% papers
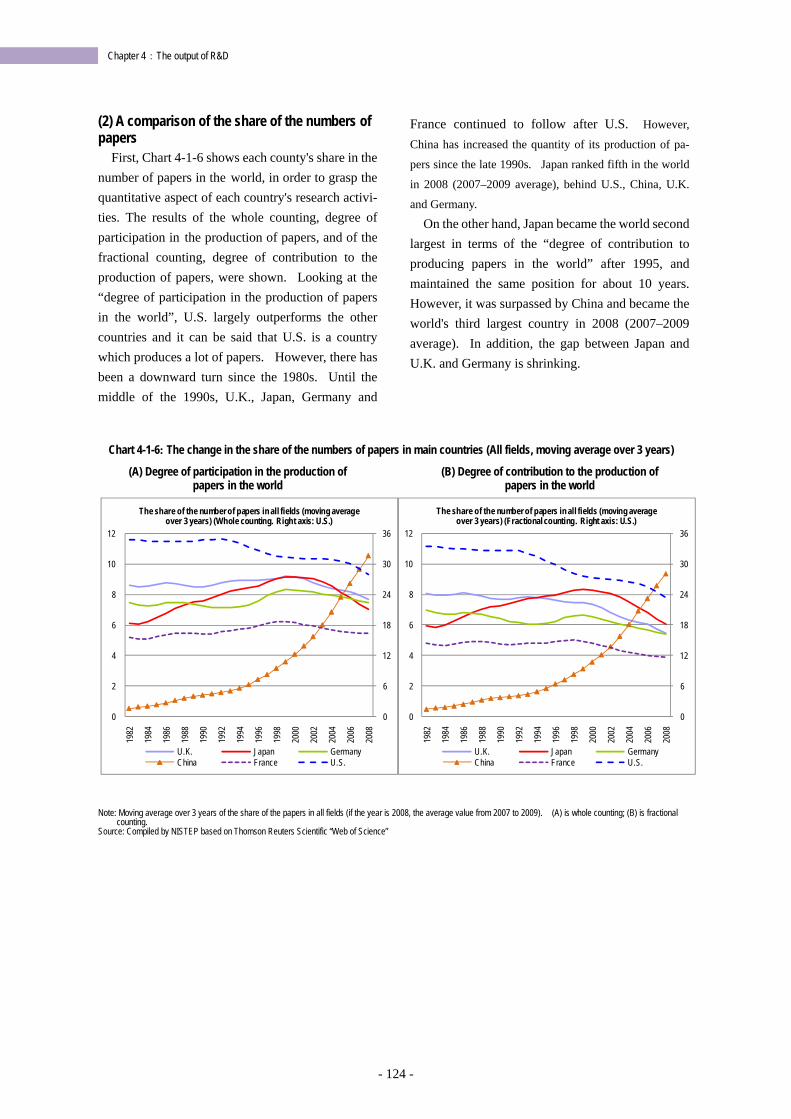
- 124 -
Chapter 4:The output of R&D
(2) A comparison of the share of the numbers of papers
First, Chart 4-1-6 shows each county's share in the number of papers in the world, in order to grasp the quantitative aspect of each country's research activi-ties. The results of the whole counting, degree of participation in the production of papers, and of the fractional counting, degree of contribution to the production of papers, were shown. Looking at the “degree of participation in the production of papers in the world”, U.S. largely outperforms the other countries and it can be said that U.S. is a country which produces a lot of papers. However, there has been a downward turn since the 1980s. Until the middle of the 1990s, U.K., Japan, Germany and
France continued to follow after U.S. However,
China has increased the quantity of its production of pa-
pers since the late 1990s. Japan ranked fifth in the world
in 2008 (2007–2009 average), behind U.S., China, U.K.
and Germany. On the other hand, Japan became the world second
largest in terms of the “degree of contribution to producing papers in the world” after 1995, and maintained the same position for about 10 years. However, it was surpassed by China and became the world's third largest country in 2008 (2007–2009 average). In addition, the gap between Japan and U.K. and Germany is shrinking.
Chart 4-1-6: The change in the share of the numbers of papers in main countries (All fields, moving average over 3 years)
(A) Degree of participation in the production of papers in the world
(B) Degree of contribution to the production of papers in the world
Note: Moving average over 3 years of the share of the papers in all fields (if the year is 2008, the average value from 2007 to 2009). (A) is whole counting; (B) is fractional
counting. Source: Compiled by NISTEP based on Thomson Reuters Scientific “Web of Science”
0
6
12
18
24
30
36
0
2
4
6
8
10
12
1982
1984
1986
1988
1990
1992
1994
1996
1998
2000
2002
2004
2006
2008
The share of the number of papers in all fields (moving average over 3 years) (Whole counting. Right axis: U.S.)
U.K. Japan GermanyChina France U.S.
0
6
12
18
24
30
36
0
2
4
6
8
10
12
1982
1984
1986
1988
1990
1992
1994
1996
1998
2000
2002
2004
2006
2008
The share of the number of papers in all fields (moving average over 3 years) (Fractional counting. Right axis: U.S.)
U.K. Japan GermanyChina France U.S.
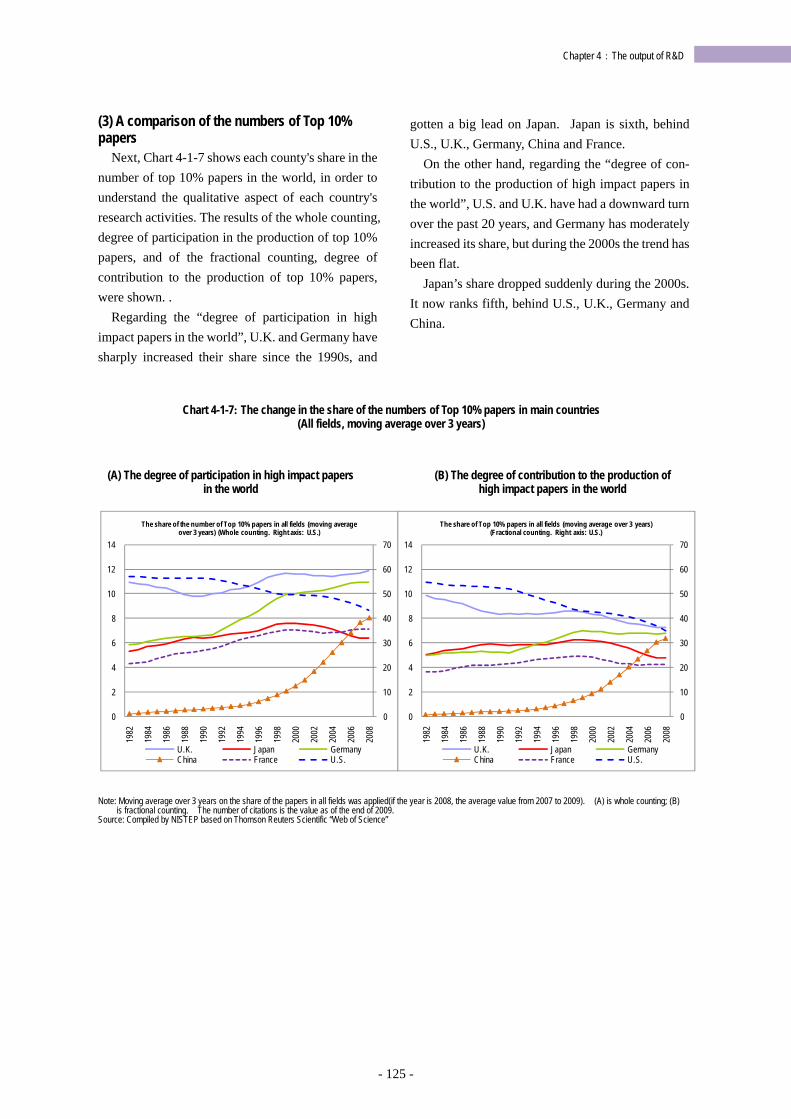
- 125 -
Chapter 4:The output of R&D
(3) A comparison of the numbers of Top 10% papers
Next, Chart 4-1-7 shows each county's share in the number of top 10% papers in the world, in order to understand the qualitative aspect of each country's research activities. The results of the whole counting, degree of participation in the production of top 10% papers, and of the fractional counting, degree of contribution to the production of top 10% papers, were shown. .
Regarding the “degree of participation in high impact papers in the world”, U.K. and Germany have sharply increased their share since the 1990s, and
gotten a big lead on Japan. Japan is sixth, behind U.S., U.K., Germany, China and France.
On the other hand, regarding the “degree of con-tribution to the production of high impact papers in the world”, U.S. and U.K. have had a downward turn over the past 20 years, and Germany has moderately increased its share, but during the 2000s the trend has been flat.
Japan’s share dropped suddenly during the 2000s. It now ranks fifth, behind U.S., U.K., Germany and China.
Chart 4-1-7: The change in the share of the numbers of Top 10% papers in main countries (All fields, moving average over 3 years)
(A) The degree of participation in high impact papers in the world
(B) The degree of contribution to the production of
high impact papers in the world
Note: Moving average over 3 years on the share of the papers in all fields was applied(if the year is 2008, the average value from 2007 to 2009). (A) is whole counting; (B)
is fractional counting. The number of citations is the value as of the end of 2009. Source: Compiled by NISTEP based on Thomson Reuters Scientific “Web of Science”
0
10
20
30
40
50
60
70
0
2
4
6
8
10
12
14
1982
1984
1986
1988
1990
1992
1994
1996
1998
2000
2002
2004
2006
2008
The share of the number of Top 10% papers in all fields (moving average over 3 years) (Whole counting. Right axis: U.S.)
U.K. Japan GermanyChina France U.S.
0
10
20
30
40
50
60
70
0
2
4
6
8
10
12
14
1982
1984
1986
1988
1990
1992
1994
1996
1998
2000
2002
2004
2006
2008
The share of Top 10% papers in all fields (moving average over 3 years) (Fractional counting. Right axis: U.S.)
U.K. Japan GermanyChina France U.S.
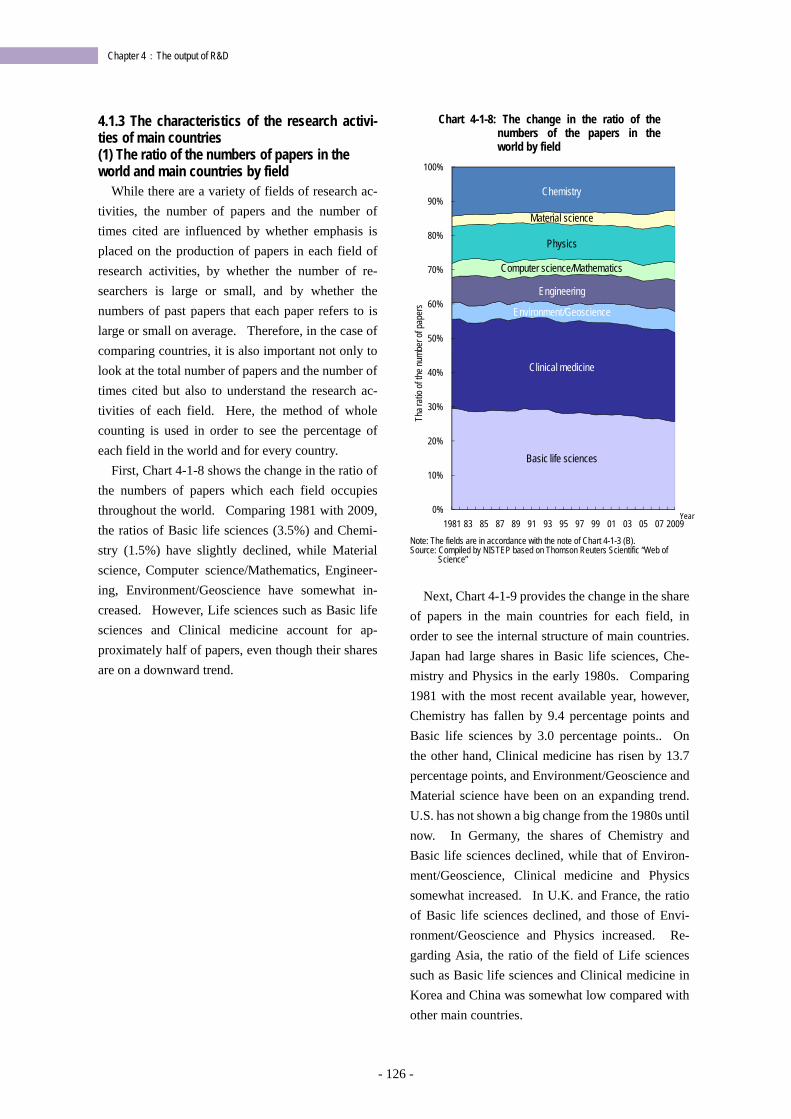
- 126 -
Chapter 4:The output of R&D
4.1.3 The characteristics of the research activi-ties of main countries (1) The ratio of the numbers of papers in the world and main countries by field
While there are a variety of fields of research ac-tivities, the number of papers and the number of times cited are influenced by whether emphasis is placed on the production of papers in each field of research activities, by whether the number of re-searchers is large or small, and by whether the numbers of past papers that each paper refers to is large or small on average. Therefore, in the case of comparing countries, it is also important not only to look at the total number of papers and the number of times cited but also to understand the research ac-tivities of each field. Here, the method of whole counting is used in order to see the percentage of each field in the world and for every country.
First, Chart 4-1-8 shows the change in the ratio of the numbers of papers which each field occupies throughout the world. Comparing 1981 with 2009, the ratios of Basic life sciences (3.5%) and Chemi-stry (1.5%) have slightly declined, while Material science, Computer science/Mathematics, Engineer-ing, Environment/Geoscience have somewhat in-creased. However, Life sciences such as Basic life sciences and Clinical medicine account for ap-proximately half of papers, even though their shares are on a downward trend.
Chart 4-1-8: The change in the ratio of the numbers of the papers in the world by field
Note: The fields are in accordance with the note of Chart 4-1-3 (B). Source: Compiled by NISTEP based on Thomson Reuters Scientific “Web of
Science”
Next, Chart 4-1-9 provides the change in the share
of papers in the main countries for each field, in order to see the internal structure of main countries. Japan had large shares in Basic life sciences, Che-mistry and Physics in the early 1980s. Comparing 1981 with the most recent available year, however, Chemistry has fallen by 9.4 percentage points and Basic life sciences by 3.0 percentage points.. On the other hand, Clinical medicine has risen by 13.7 percentage points, and Environment/Geoscience and Material science have been on an expanding trend. U.S. has not shown a big change from the 1980s until now. In Germany, the shares of Chemistry and Basic life sciences declined, while that of Environ-ment/Geoscience, Clinical medicine and Physics somewhat increased. In U.K. and France, the ratio of Basic life sciences declined, and those of Envi-ronment/Geoscience and Physics increased. Re-garding Asia, the ratio of the field of Life sciences such as Basic life sciences and Clinical medicine in Korea and China was somewhat low compared with other main countries.
0%
10%
20%
30%
40%
50%
60%
70%
80%
90%
100%
1981 83 85 87 89 91 93 95 97 99 01 03 05 07 2009
Tha r
atio
of th
e num
ber o
f pap
ers
Year
Environment/Geoscience
Clinical medicine
Material science
Chemistry
Physics
Computer science/Mathematics
Engineering
Basic life sciences
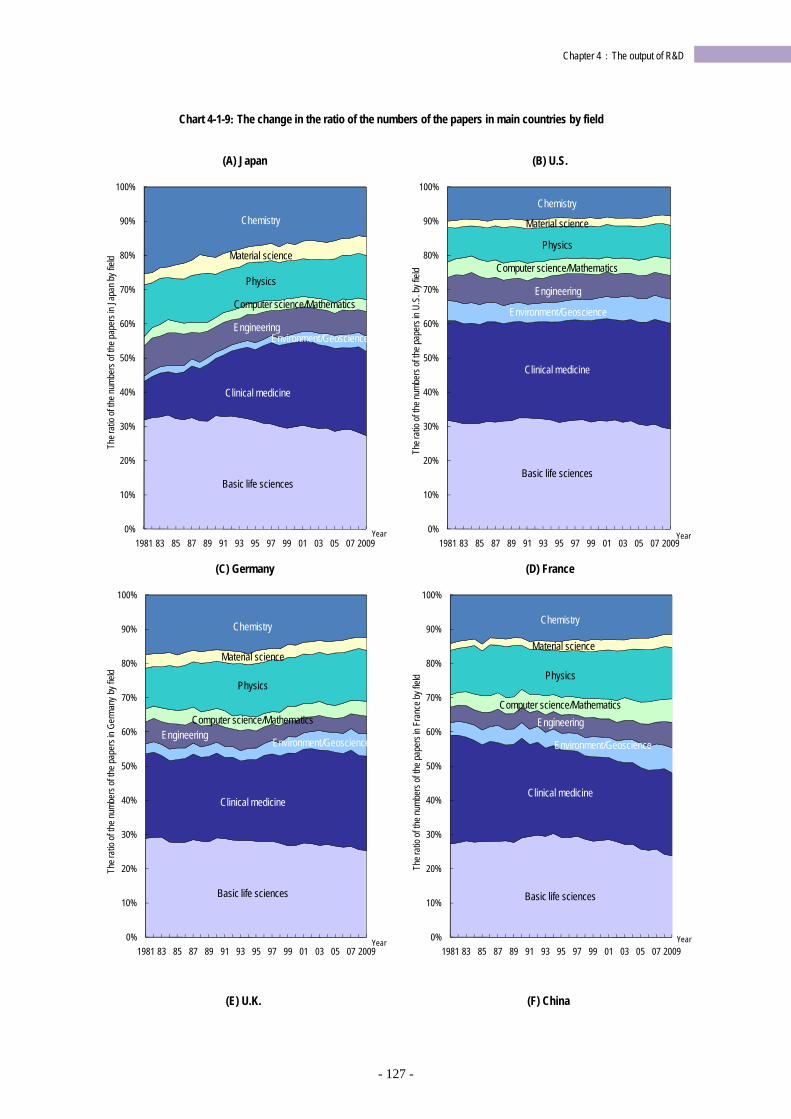
- 127 -
Chapter 4:The output of R&D
Chart 4-1-9: The change in the ratio of the numbers of the papers in main countries by field
(A) Japan (B) U.S.
(C) Germany (D) France
(E) U.K. (F) China
0%
10%
20%
30%
40%
50%
60%
70%
80%
90%
100%
1981 83 85 87 89 91 93 95 97 99 01 03 05 07 2009
The r
atio
of th
e num
bers
of th
e pap
ers i
n Ja
pan b
y fiel
d
Year
Environment/Geoscience
Clinical medicine
Material science
Chemistry
Physics
Computer science/Mathematics
Engineering
Basic life sciences
0%
10%
20%
30%
40%
50%
60%
70%
80%
90%
100%
1981 83 85 87 89 91 93 95 97 99 01 03 05 07 2009
The r
atio
of th
e num
bers
of th
e pap
ers i
n U.
S. by
field
Year
Environment/Geoscience
Clinical medicine
Material science
Chemistry
Physics
Computer science/Mathematics
Engineering
Basic life sciences
0%
10%
20%
30%
40%
50%
60%
70%
80%
90%
100%
1981 83 85 87 89 91 93 95 97 99 01 03 05 07 2009
The r
atio
of th
e num
bers
of th
e pap
ers i
n Ge
rman
y by f
ield
Year
Environment/Geoscience
Clinical medicine
Material science
Chemistry
Physics
Computer science/MathematicsEngineering
Basic life sciences
0%
10%
20%
30%
40%
50%
60%
70%
80%
90%
100%
1981 83 85 87 89 91 93 95 97 99 01 03 05 07 2009
The r
atio
of th
e num
bers
of th
e pap
ers i
n Fr
ance
by fie
ld
Year
Environment/Geoscience
Clinical medicine
Material science
Chemistry
Physics
Computer science/MathematicsEngineering
Basic life sciences
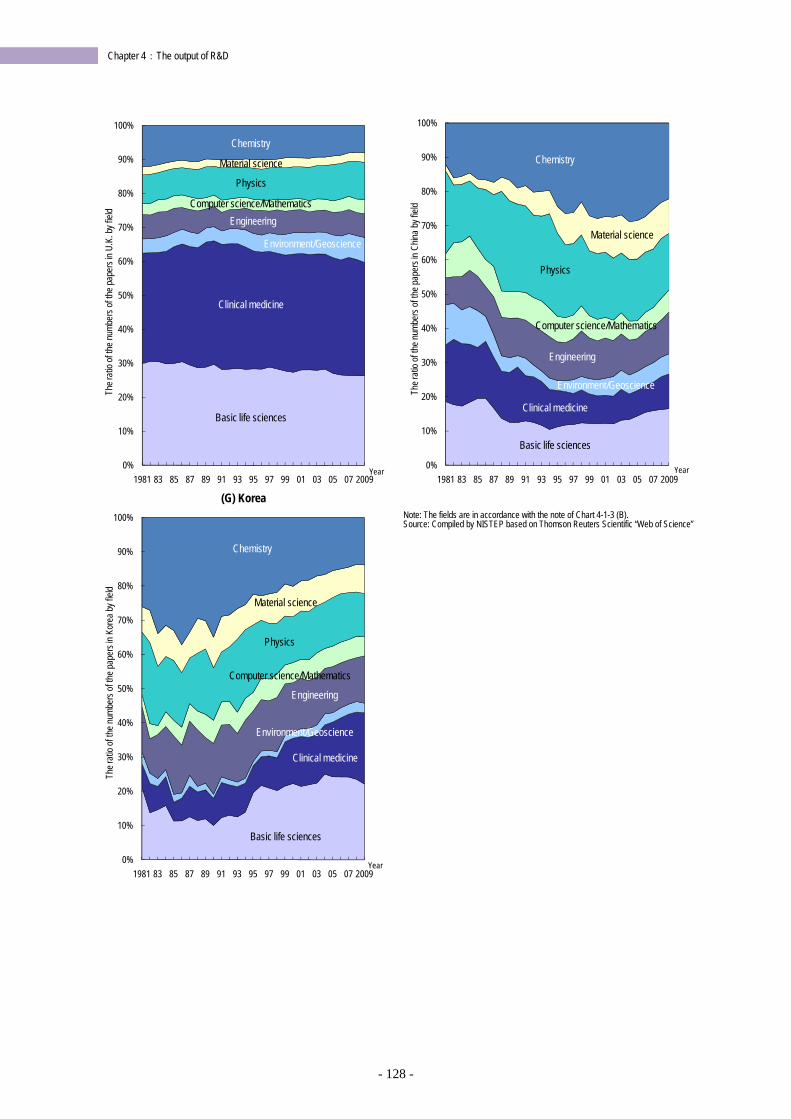
- 128 -
Chapter 4:The output of R&D
(G) Korea
Note: The fields are in accordance with the note of Chart 4-1-3 (B). Source: Compiled by NISTEP based on Thomson Reuters Scientific “Web of Science”
0%
10%
20%
30%
40%
50%
60%
70%
80%
90%
100%
1981 83 85 87 89 91 93 95 97 99 01 03 05 07 2009
The r
atio
of th
e num
bers
of th
e pap
ers i
n U.
K. by
field
Year
Environment/Geoscience
Clinical medicine
Material science
Chemistry
Physics
Computer science/MathematicsEngineering
Basic life sciences
0%
10%
20%
30%
40%
50%
60%
70%
80%
90%
100%
1981 83 85 87 89 91 93 95 97 99 01 03 05 07 2009
The r
atio
of th
e num
bers
of th
e pap
ers i
n Ch
ina b
y fiel
d
Year
Environment/Geoscience
Clinical medicine
Material science
Chemistry
Physics
Computer science/Mathematics
Engineering
Basic life sciences
0%
10%
20%
30%
40%
50%
60%
70%
80%
90%
100%
1981 83 85 87 89 91 93 95 97 99 01 03 05 07 2009
The r
atio
of th
e num
bers
of th
e pap
ers i
n Ko
rea b
y fiel
d
Year
Environment/Geoscience
Clinical medicine
Material science
Chemistry
Physics
Computer science/Mathematics
Engineering
Basic life sciences
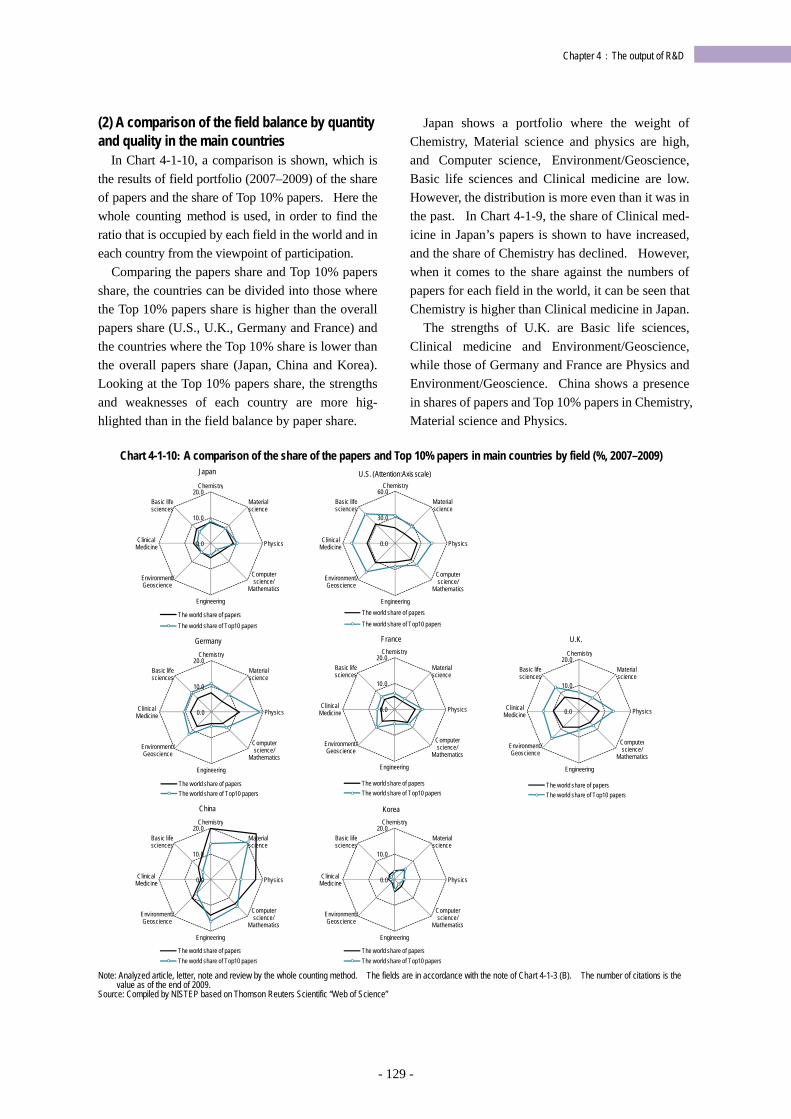
- 129 -
Chapter 4:The output of R&D
(2) A comparison of the field balance by quantity and quality in the main countries
In Chart 4-1-10, a comparison is shown, which is the results of field portfolio (2007–2009) of the share of papers and the share of Top 10% papers. Here the whole counting method is used, in order to find the ratio that is occupied by each field in the world and in each country from the viewpoint of participation.
Comparing the papers share and Top 10% papers share, the countries can be divided into those where the Top 10% papers share is higher than the overall papers share (U.S., U.K., Germany and France) and the countries where the Top 10% share is lower than the overall papers share (Japan, China and Korea). Looking at the Top 10% papers share, the strengths and weaknesses of each country are more hig-hlighted than in the field balance by paper share.
Japan shows a portfolio where the weight of Chemistry, Material science and physics are high, and Computer/science, Environment/Geoscience, Basic life sciences and Clinical medicine are low. However, the distribution is more even than it was in the past. In Chart 4-1-9, the share of Clinical med-icine in Japan’s papers is shown to have increased, and the share of Chemistry has declined. However, when it comes to the share against the numbers of papers for each field in the world, it can be seen that Chemistry is higher than Clinical medicine in Japan.
The strengths of U.K. are Basic life sciences, Clinical medicine and Environment/Geoscience, while those of Germany and France are Physics and Environment/Geoscience. China shows a presence in shares of papers and Top 10% papers in Chemistry, Material science and Physics.
Chart 4-1-10: A comparison of the share of the papers and Top 10% papers in main countries by field (%, 2007–2009)
Note: Analyzed article, letter, note and review by the whole counting method. The fields are in accordance with the note of Chart 4-1-3 (B). The number of citations is the
value as of the end of 2009. Source: Compiled by NISTEP based on Thomson Reuters Scientific “Web of Science”
0.0
30.0
60.0 Chemistry
Materialscience
Physics
Computerscience/
Mathematics
Engineering
Environment/Geoscience
ClinicalMedicine
Basic lifesciences
U.S. (Attention:Axis scale)
The world share of papersThe world share of Top10 papers
0.0
10.0
20.0 Chemistry
Materialscience
Physics
Computerscience/
Mathematics
Engineering
Environment/Geoscience
ClinicalMedicine
Basic lifesciences
U.K.
The world share of papersThe world share of Top10 papers
0.0
10.0
20.0 Chemistry
Materialscience
Physics
Computerscience/
Mathematics
Engineering
Environment/Geoscience
ClinicalMedicine
Basic lifesciences
Japan
The world share of papersThe world share of Top10 papers
0.0
10.0
20.0 Chemistry
Materialscience
Physics
Computerscience/
Mathematics
Engineering
Environment/Geoscience
ClinicalMedicine
Basic lifesciences
Germany
The world share of papersThe world share of Top10 papers
0.0
10.0
20.0 Chemistry
Materialscience
Physics
Computerscience/
Mathematics
Engineering
Environment/Geoscience
ClinicalMedicine
Basic lifesciences
China
The world share of papersThe world share of Top10 papers
0.0
10.0
20.0 Chemistry
Materialscience
Physics
Computerscience/
Mathematics
Engineering
Environment/Geoscience
ClinicalMedicine
Basic lifesciences
France
The world share of papersThe world share of Top10 papers
0.0
10.0
20.0 Chemistry
Materialscience
Physics
Computerscience/
Mathematics
Engineering
Environment/Geoscience
ClinicalMedicine
Basic lifesciences
Korea
The world share of papersThe world share of Top10 papers
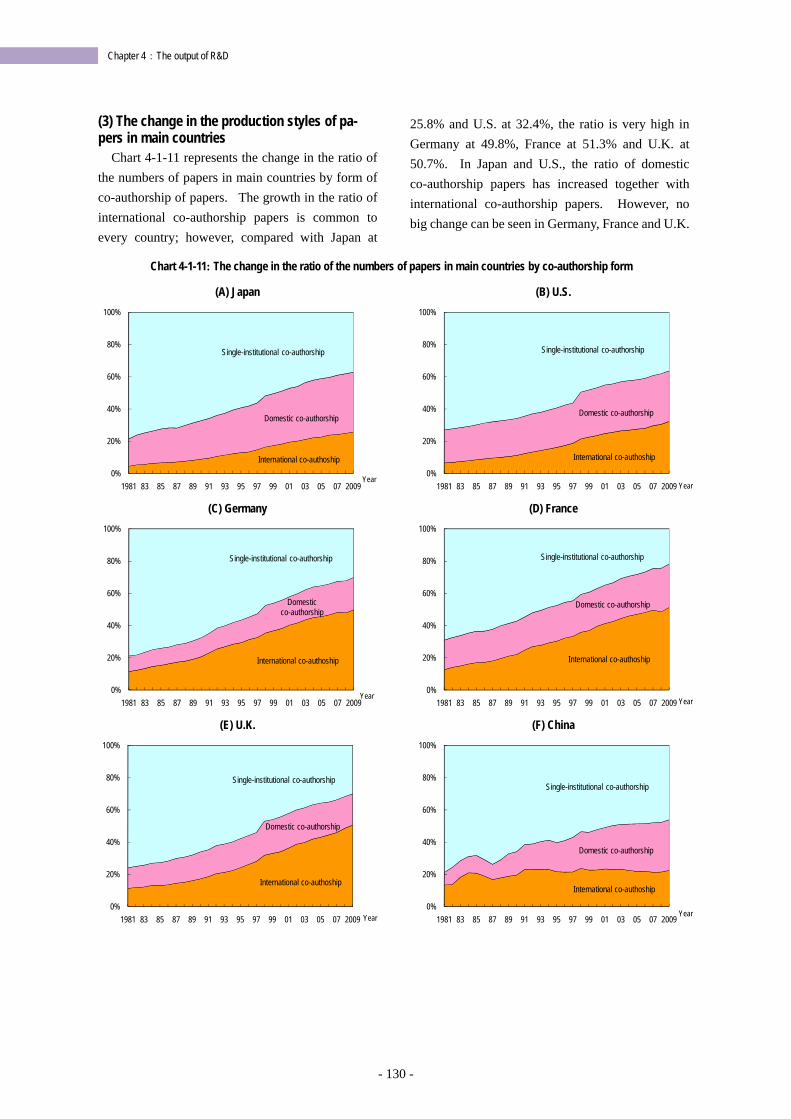
- 130 -
Chapter 4:The output of R&D
(3) The change in the production styles of pa-pers in main countries
Chart 4-1-11 represents the change in the ratio of the numbers of papers in main countries by form of co-authorship of papers. The growth in the ratio of international co-authorship papers is common to every country; however, compared with Japan at
25.8% and U.S. at 32.4%, the ratio is very high in Germany at 49.8%, France at 51.3% and U.K. at 50.7%. In Japan and U.S., the ratio of domestic co-authorship papers has increased together with international co-authorship papers. However, no big change can be seen in Germany, France and U.K.
Chart 4-1-11: The change in the ratio of the numbers of papers in main countries by co-authorship form
(A) Japan (B) U.S.
(C) Germany (D) France
(E) U.K. (F) China
0%
20%
40%
60%
80%
100%
1981 83 85 87 89 91 93 95 97 99 01 03 05 07 2009
Domestic co-authorship
Single-institutional co-authorship
International co-authoship
Year0%
20%
40%
60%
80%
100%
1981 83 85 87 89 91 93 95 97 99 01 03 05 07 2009
Domestic co-authorship
Single-institutional co-authorship
International co-authoship
Year
0%
20%
40%
60%
80%
100%
1981 83 85 87 89 91 93 95 97 99 01 03 05 07 2009
Domesticco-authorship
Single-institutional co-authorship
International co-authoship
Year0%
20%
40%
60%
80%
100%
1981 83 85 87 89 91 93 95 97 99 01 03 05 07 2009
Domestic co-authorship
Single-institutional co-authorship
International co-authoship
Year
0%
20%
40%
60%
80%
100%
1981 83 85 87 89 91 93 95 97 99 01 03 05 07 2009
Domestic co-authorship
Single-institutional co-authorship
International co-authoship
Year0%
20%
40%
60%
80%
100%
1981 83 85 87 89 91 93 95 97 99 01 03 05 07 2009
Domestic co-authorship
Single-institutional co-authorship
International co-authoship
Year
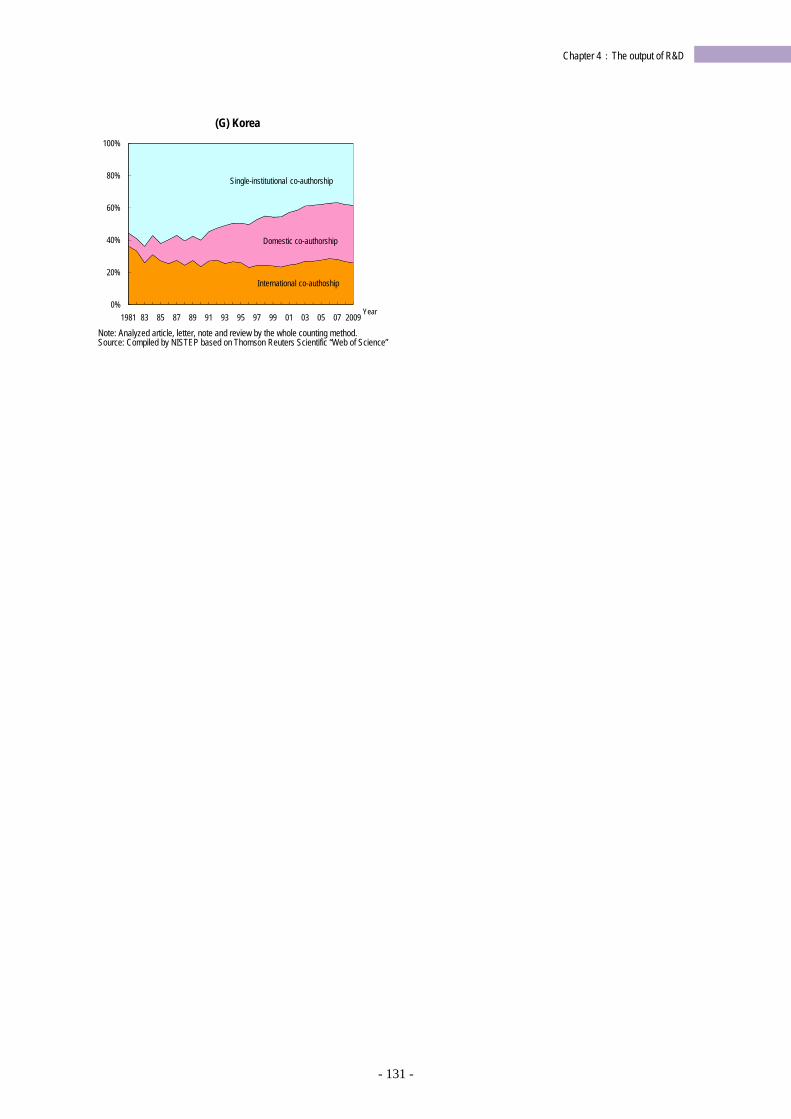
- 131 -
Chapter 4:The output of R&D
(G) Korea
Note: Analyzed article, letter, note and review by the whole counting method. Source: Compiled by NISTEP based on Thomson Reuters Scientific “Web of Science”
0%
20%
40%
60%
80%
100%
1981 83 85 87 89 91 93 95 97 99 01 03 05 07 2009
Domestic co-authorship
Single-institutional co-authorship
International co-authoship
Year
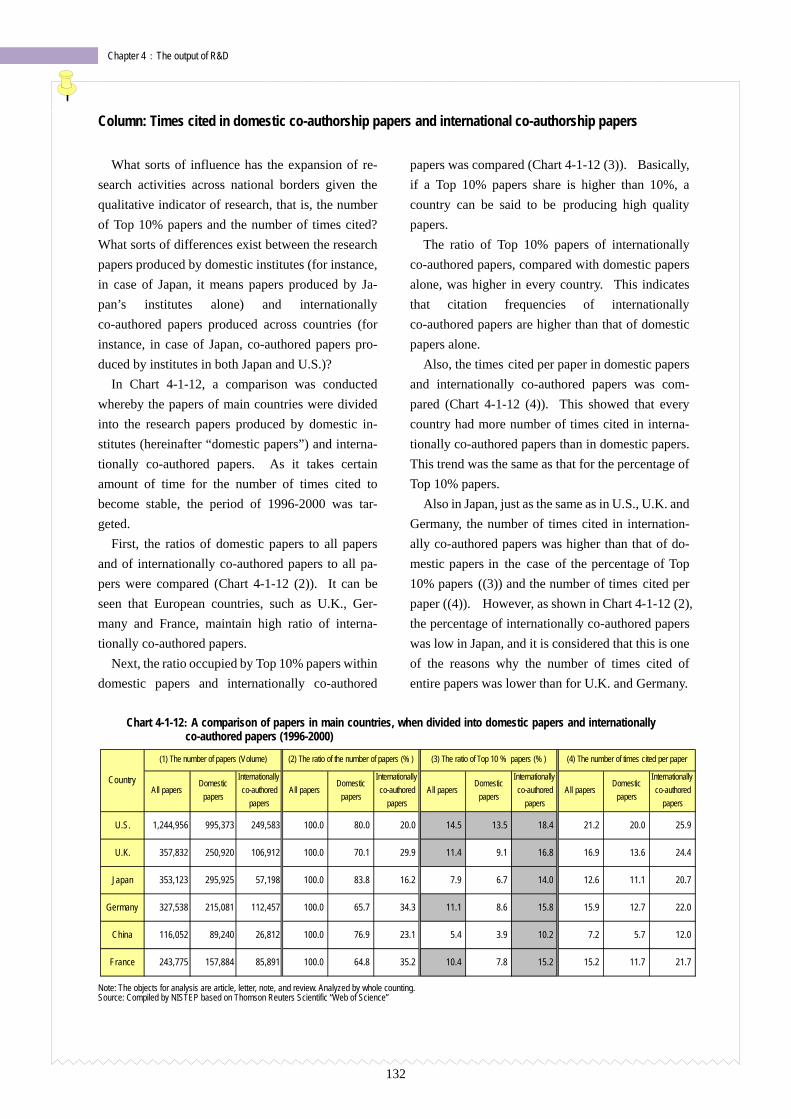
132
Chapter 4:The output of R&D
Column: Times cited in domestic co-authorship papers and international co-authorship papers
What sorts of influence has the expansion of re-search activities across national borders given the qualitative indicator of research, that is, the number of Top 10% papers and the number of times cited? What sorts of differences exist between the research papers produced by domestic institutes (for instance, in case of Japan, it means papers produced by Ja-pan’s institutes alone) and internationally co-authored papers produced across countries (for instance, in case of Japan, co-authored papers pro-duced by institutes in both Japan and U.S.)?
In Chart 4-1-12, a comparison was conducted whereby the papers of main countries were divided into the research papers produced by domestic in-stitutes (hereinafter “domestic papers”) and interna-tionally co-authored papers. As it takes certain amount of time for the number of times cited to become stable, the period of 1996-2000 was tar-geted.
First, the ratios of domestic papers to all papers and of internationally co-authored papers to all pa-pers were compared (Chart 4-1-12 (2)). It can be seen that European countries, such as U.K., Ger-many and France, maintain high ratio of interna-tionally co-authored papers.
Next, the ratio occupied by Top 10% papers within domestic papers and internationally co-authored
papers was compared (Chart 4-1-12 (3)). Basically, if a Top 10% papers share is higher than 10%, a country can be said to be producing high quality papers.
The ratio of Top 10% papers of internationally co-authored papers, compared with domestic papers alone, was higher in every country. This indicates that citation frequencies of internationally co-authored papers are higher than that of domestic papers alone.
Also, the times cited per paper in domestic papers and internationally co-authored papers was com-pared (Chart 4-1-12 (4)). This showed that every country had more number of times cited in interna-tionally co-authored papers than in domestic papers. This trend was the same as that for the percentage of Top 10% papers.
Also in Japan, just as the same as in U.S., U.K. and Germany, the number of times cited in internation-ally co-authored papers was higher than that of do-mestic papers in the case of the percentage of Top 10% papers ((3)) and the number of times cited per paper ((4)). However, as shown in Chart 4-1-12 (2), the percentage of internationally co-authored papers was low in Japan, and it is considered that this is one of the reasons why the number of times cited of entire papers was lower than for U.K. and Germany.
Chart 4-1-12: A comparison of papers in main countries, when divided into domestic papers and internationally
co-authored papers (1996-2000)
Note: The objects for analysis are article, letter, note, and review. Analyzed by whole counting. Source: Compiled by NISTEP based on Thomson Reuters Scientific “Web of Science”
All papersDomestic
papers
Internationallyco-authored
papersAll papers
Domesticpapers
Internationallyco-authored
papersAll papers
Domesticpapers
Internationallyco-authored
papersAll papers
Domesticpapers
Internationallyco-authored
papers
U.S. 1,244,956 995,373 249,583 100.0 80.0 20.0 14.5 13.5 18.4 21.2 20.0 25.9
U.K. 357,832 250,920 106,912 100.0 70.1 29.9 11.4 9.1 16.8 16.9 13.6 24.4
Japan 353,123 295,925 57,198 100.0 83.8 16.2 7.9 6.7 14.0 12.6 11.1 20.7
Germany 327,538 215,081 112,457 100.0 65.7 34.3 11.1 8.6 15.8 15.9 12.7 22.0
China 116,052 89,240 26,812 100.0 76.9 23.1 5.4 3.9 10.2 7.2 5.7 12.0
France 243,775 157,884 85,891 100.0 64.8 35.2 10.4 7.8 15.2 15.2 11.7 21.7
(4) The number of times cited per paper
Country
(1) The number of papers (Volume) (2) The ratio of the number of papers (% ) (3) The ratio of Top 10 % papers (% )
- 133 -
Chapter 4:The output of R&D
4.2 Patents
Key Points ○The numbers of patent applications had been increasing with an annual average growth rate of about 5%
since the mid 1990s, and reached 1.85 million for 2007. ○The numbers of patent applications to the Japan Patent Office (hereinafter “JPO”) have been about
400,000 over these past several years. The numbers of patent applications to U.S. Patent and Trademark Office (hereinafter “USPTO”) have been rapidly increasing, and it was more than that to JPO in 2006. The applications to JPO from Non-Residents have been increased, and accounted for over 15% of all in 2006. However, this ratio is small compared with that of USPTO, about a half of whose applications are from Non-Residents.
○All main countries including Japan have increased their numbers of patent applications. However, there has been a slight leveling off over the past few years. Even under these circumstances, Patent applica-tions from China have steadily increased. Many Chinese applications, however, are to the State Intel-lectual Property Office of the P.R.C. (hereinafter SIPO), and China’s presence in the world is still small. Korea has been applying for patents to patent offices in main country and has strengthened its world presence.
○Looking at the numbers of patent applications to JPO, USPTO and The European Patent Office (hereinaf-ter EPO), Japan has shown a big presence since 10 years ago. Looking at the applications by technical field, Japan has a big share in Nanotechnology and Information and communication technology.
○The relation between patents and scientific papers has been getting stronger. The Science Linkage, which indicates the degree to which patent literature cites scientific literature, has been increasing. From 1996-1998 to 2006–2008, the Science Linkage in all fields increased from 1.9 to 3.1. The value of Medical and chemical manufacturing is highest. Science Linkage has recently increased in “Petro-leum/Coal product manufacturing.”
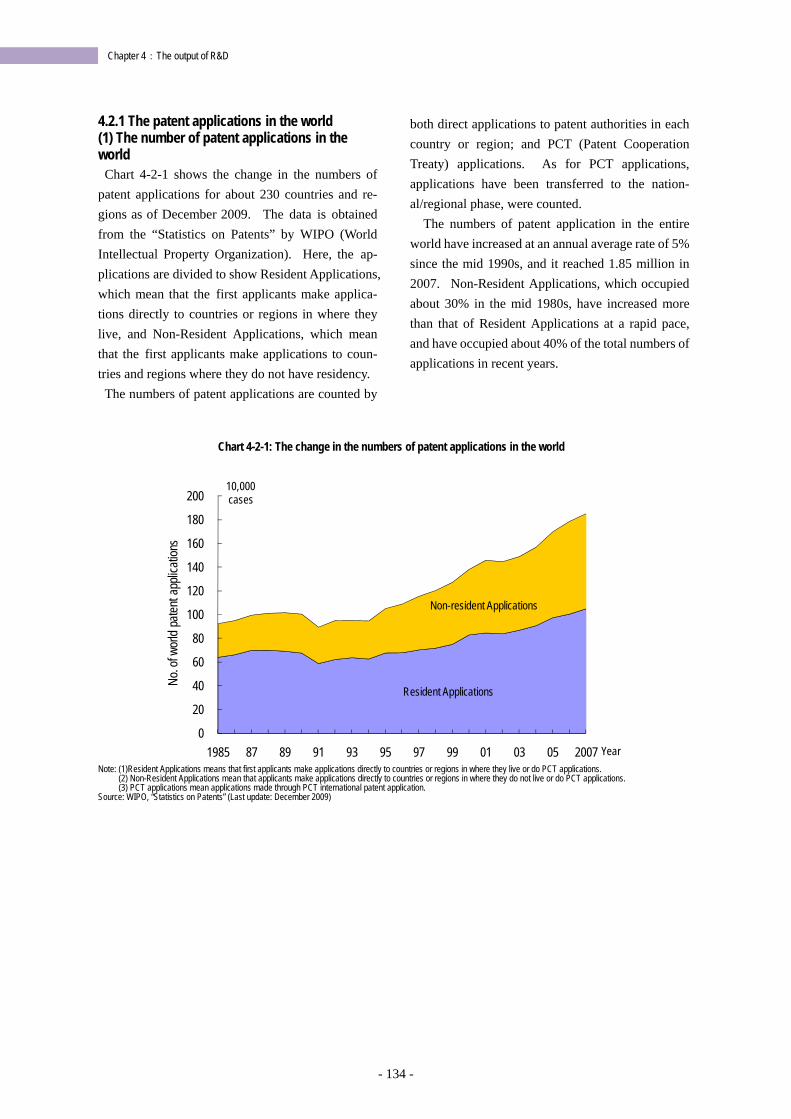
- 134 -
Chapter 4:The output of R&D
4.2.1 The patent applications in the world (1) The number of patent applications in the world Chart 4-2-1 shows the change in the numbers of
patent applications for about 230 countries and re-gions as of December 2009. The data is obtained from the “Statistics on Patents” by WIPO (World Intellectual Property Organization). Here, the ap-plications are divided to show Resident Applications, which mean that the first applicants make applica-tions directly to countries or regions in where they live, and Non-Resident Applications, which mean that the first applicants make applications to coun-tries and regions where they do not have residency. The numbers of patent applications are counted by
both direct applications to patent authorities in each country or region; and PCT (Patent Cooperation Treaty) applications. As for PCT applications, applications have been transferred to the nation-al/regional phase, were counted.
The numbers of patent application in the entire world have increased at an annual average rate of 5% since the mid 1990s, and it reached 1.85 million in 2007. Non-Resident Applications, which occupied about 30% in the mid 1980s, have increased more than that of Resident Applications at a rapid pace, and have occupied about 40% of the total numbers of applications in recent years.
Chart 4-2-1: The change in the numbers of patent applications in the world
Note: (1)Resident Applications means that first applicants make applications directly to countries or regions in where they live or do PCT applications.
(2) Non-Resident Applications mean that applicants make applications directly to countries or regions in where they do not live or do PCT applications. (3) PCT applications mean applications made through PCT international patent application.
Source: WIPO, “Statistics on Patents” (Last update: December 2009)
0
20
40
60
80
100
120
140
160
180
200
1985 87 89 91 93 95 97 99 01 03 05 2007
10,000cases
Year
No. o
f wor
ld pa
tent a
pplic
ation
s
Non-resident Applications
Resident Applications
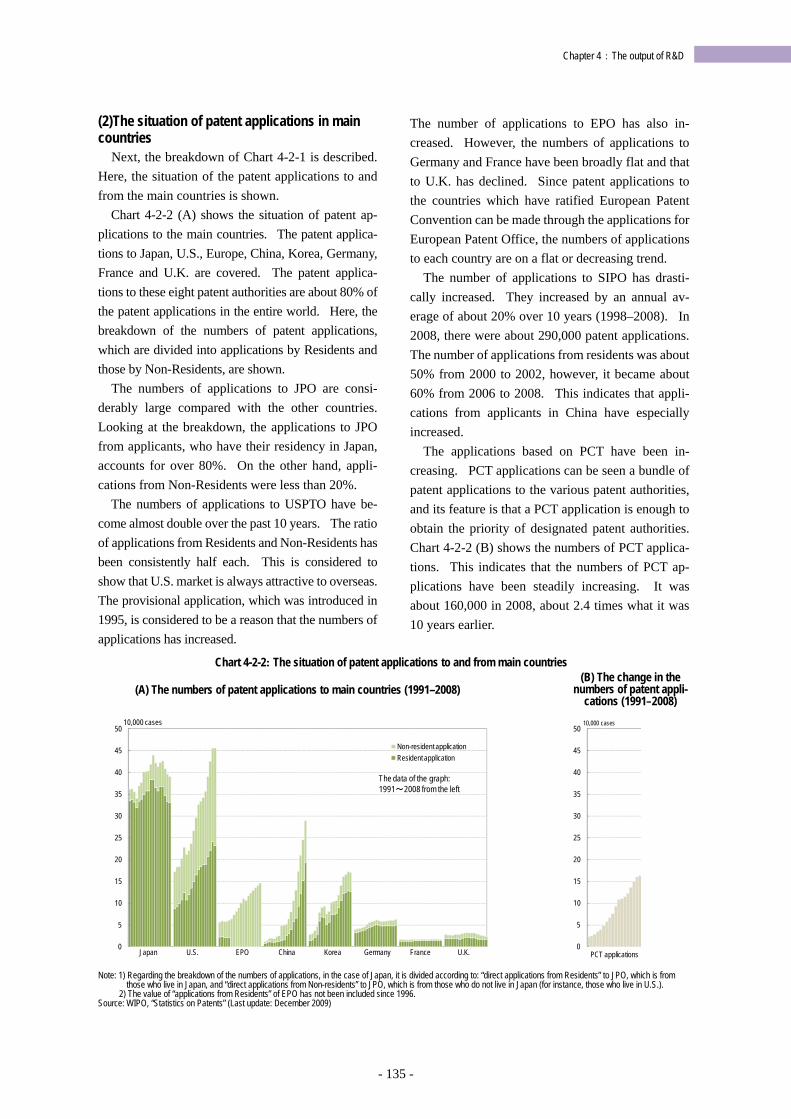
- 135 -
Chapter 4:The output of R&D
(2)The situation of patent applications in main countries
Next, the breakdown of Chart 4-2-1 is described. Here, the situation of the patent applications to and from the main countries is shown.
Chart 4-2-2 (A) shows the situation of patent ap-plications to the main countries. The patent applica-tions to Japan, U.S., Europe, China, Korea, Germany, France and U.K. are covered. The patent applica-tions to these eight patent authorities are about 80% of the patent applications in the entire world. Here, the breakdown of the numbers of patent applications, which are divided into applications by Residents and those by Non-Residents, are shown.
The numbers of applications to JPO are consi-derably large compared with the other countries. Looking at the breakdown, the applications to JPO from applicants, who have their residency in Japan, accounts for over 80%. On the other hand, appli-cations from Non-Residents were less than 20%.
The numbers of applications to USPTO have be-come almost double over the past 10 years. The ratio of applications from Residents and Non-Residents has been consistently half each. This is considered to show that U.S. market is always attractive to overseas. The provisional application, which was introduced in 1995, is considered to be a reason that the numbers of applications has increased.
The number of applications to EPO has also in-creased. However, the numbers of applications to Germany and France have been broadly flat and that to U.K. has declined. Since patent applications to the countries which have ratified European Patent Convention can be made through the applications for European Patent Office, the numbers of applications to each country are on a flat or decreasing trend.
The number of applications to SIPO has drasti-cally increased. They increased by an annual av-erage of about 20% over 10 years (1998–2008). In 2008, there were about 290,000 patent applications. The number of applications from residents was about 50% from 2000 to 2002, however, it became about 60% from 2006 to 2008. This indicates that appli-cations from applicants in China have especially increased.
The applications based on PCT have been in-creasing. PCT applications can be seen a bundle of patent applications to the various patent authorities, and its feature is that a PCT application is enough to obtain the priority of designated patent authorities. Chart 4-2-2 (B) shows the numbers of PCT applica-tions. This indicates that the numbers of PCT ap-plications have been steadily increasing. It was about 160,000 in 2008, about 2.4 times what it was 10 years earlier.
Chart 4-2-2: The situation of patent applications to and from main countries
(A) The numbers of patent applications to main countries (1991–2008) (B) The change in the
numbers of patent appli-cations (1991–2008)
Note: 1) Regarding the breakdown of the numbers of applications, in the case of Japan, it is divided according to: “direct applications from Residents” to JPO, which is from
those who live in Japan, and “direct applications from Non-residents” to JPO, which is from those who do not live in Japan (for instance, those who live in U.S.). 2) The value of “applications from Residents” of EPO has not been included since 1996.
Source: WIPO, “Statistics on Patents” (Last update: December 2009)
0
5
10
15
20
25
30
35
40
45
5010,000 cases
Non-resident applicationResident application
The data of the graph:1991~2008 from the left
Japan U.S. Germany France U.K.KoreaChinaEPO0
5
10
15
20
25
30
35
40
45
50
PCT applications
10,000 cases
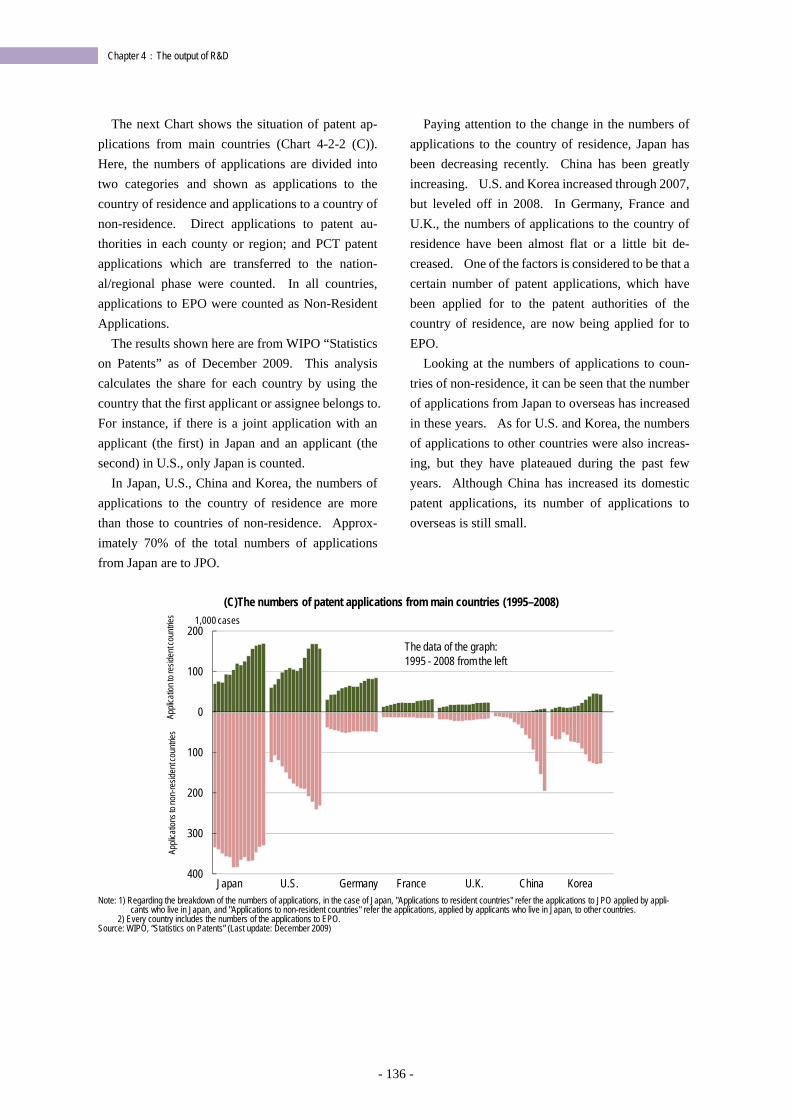
- 136 -
Chapter 4:The output of R&D
The next Chart shows the situation of patent ap-plications from main countries (Chart 4-2-2 (C)). Here, the numbers of applications are divided into two categories and shown as applications to the country of residence and applications to a country of non-residence. Direct applications to patent au-thorities in each county or region; and PCT patent applications which are transferred to the nation-al/regional phase were counted. In all countries, applications to EPO were counted as Non-Resident Applications.
The results shown here are from WIPO “Statistics on Patents” as of December 2009. This analysis calculates the share for each country by using the country that the first applicant or assignee belongs to. For instance, if there is a joint application with an applicant (the first) in Japan and an applicant (the second) in U.S., only Japan is counted.
In Japan, U.S., China and Korea, the numbers of applications to the country of residence are more than those to countries of non-residence. Approx-imately 70% of the total numbers of applications from Japan are to JPO.
Paying attention to the change in the numbers of applications to the country of residence, Japan has been decreasing recently. China has been greatly increasing. U.S. and Korea increased through 2007, but leveled off in 2008. In Germany, France and U.K., the numbers of applications to the country of residence have been almost flat or a little bit de-creased. One of the factors is considered to be that a certain number of patent applications, which have been applied for to the patent authorities of the country of residence, are now being applied for to EPO.
Looking at the numbers of applications to coun-tries of non-residence, it can be seen that the number of applications from Japan to overseas has increased in these years. As for U.S. and Korea, the numbers of applications to other countries were also increas-ing, but they have plateaued during the past few years. Although China has increased its domestic patent applications, its number of applications to overseas is still small.
(C)The numbers of patent applications from main countries (1995–2008)
Note: 1) Regarding the breakdown of the numbers of applications, in the case of Japan, "Applications to resident countries" refer the applications to JPO applied by appli-
cants who live in Japan, and "Applications to non-resident countries" refer the applications, applied by applicants who live in Japan, to other countries. 2) Every country includes the numbers of the applications to EPO.
Source: WIPO, “Statistics on Patents” (Last update: December 2009)
400
300
200
100
0
100
2001,000 cases
The data of the graph:1995 - 2008 from the left
Appli
catio
n to r
eside
nt co
untrie
sAp
plica
tions
to no
n-re
siden
t cou
ntries
Japan U.S. Germany France U.K. China Korea
- 137 -
Chapter 4:The output of R&D
4.2.2 The patent applications to trilateral pa-tent offices from the main countries
One of the points that makes an international comparison of the numbers of patent applications difficult is that a patent right is a principle of ter-ritorial jurisdiction and applications are often applied to several countries in which applicants want to have patent rights. Generally, in terms of applications made to Country A, applications from Country A comprise the majority (Home advantage). In order to improve international comparability in light of this point, the applica-tions to the trilateral patent offices, JPO, EPO and USPTO, are analyzed here.
The number of the world’s patent applications in 2007 was approximately 1.85 Million, as shown in Chart 4-2-1. The numbers of applica-tions to the trilateral patent offices accounted for about 54% of the world’s patent applications. In recent years, the numbers of patent applications to China and Korea have been rapidly increasing, and the weight of the trilateral patent offices in the world has been declining.
Chart 4-2-3 shows the share of the main coun-tries of patent applications to JPO, EPO and USPTO. The results shown here are from WIPO, “Statistics on patents,” December 2009. In this analysis, when there are multiple applicants, the country of the first applicant or assignee is used to calculate each country’s share. For example, an application jointly submitted by a Japanese first applicant and an American second applicant would be counted only as a Japanese application.
Looking at the each country’s share of applica-tions to the Japan Patent Office (Chart 4-2-3 (A)), Japan had an overwhelming share at about 85% from 2006 to 2008. U.S. has kept second place over the past 10 years, however, its share did not reach 10%. The share of Germany was in third place (approximately 2.0% during 2006–2008). The number of applications from Korea have grown recently (approximately 1.6% during 2006–2008), and now it is closing in on Germany.
Looking at national shares of applications to EPO (Chart 4-2-3 (B)), Japan presented the next largest number to U.S. and Germany. By main countries’ shares of patent applications from 2006 to 2008, U.S. share was about 26%, which is in first place. Germany’s share was about 18%, while Japan’s was around 16%. France (about 6%) and U.K. (about 4%) followed them. Also here, the growth of Korea was shown, it became about 3% from 2006 to 2008.
Looking at national shares of applications to USPTO (Chart 4-2-3 (C)), the share of U.S. was the largest. It has accounted for at least 50% since 1996. Japan has had the second largest share, at about 20% since 1996. The share of Germany was in third place, which was at about 5% from 2006 to 2008. Korea has been steadily expanding its share. At about 5%, almost the same as Germany’s share, it was in fourth place.
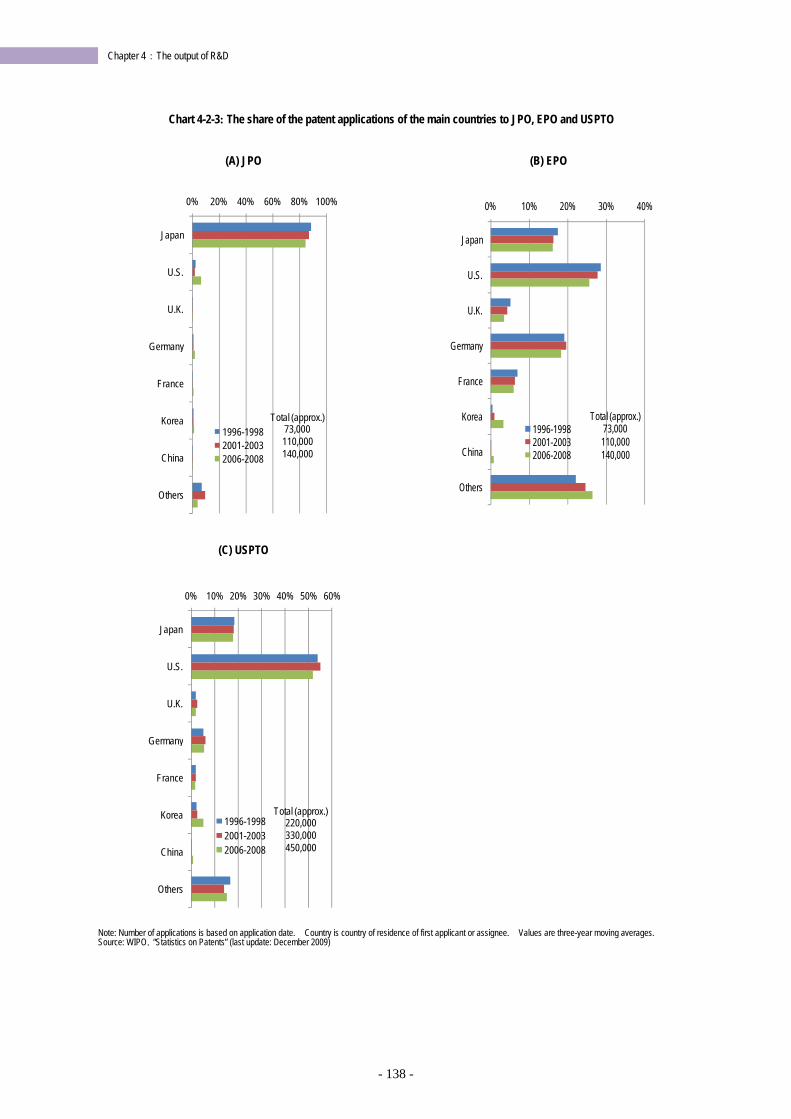
- 138 -
Chapter 4:The output of R&D
Chart 4-2-3: The share of the patent applications of the main countries to JPO, EPO and USPTO
(A) JPO (B) EPO
(C) USPTO
Note: Number of applications is based on application date. Country is country of residence of first applicant or assignee. Values are three-year moving averages. Source: WIPO,“Statistics on Patents” (last update: December 2009)
0% 20% 40% 60% 80% 100%
Japan
U.S.
U.K.
Germany
France
Korea
China
Others
1996-19982001-20032006-2008
Total (approx.)73,000110,000140,000
0% 10% 20% 30% 40%
Japan
U.S.
U.K.
Germany
France
Korea
China
Others
1996-19982001-20032006-2008
Total (approx.)73,000110,000140,000
0% 10% 20% 30% 40% 50% 60%
Japan
U.S.
U.K.
Germany
France
Korea
China
Others
1996-19982001-20032006-2008
Total (approx.)220,000330,000450,000
- 139 -
Chapter 4:The output of R&D
4.2.3 The patent applications by technological field
Next, the result of the analysis of the parent applications by technological field is described. The applications to EPO and USPTO were ana-lyzed in order to do an international comparison by technological field. Technological fields for analysis are targeted in four technological fields: Biotechnology; Renewable energy; Information and communication technology; and Nanotech-nology.
The patent applications for Biotechnology, Renewable energy and Information and commu-nication technology were extracted by using In-ternational Patent Classification (IPC). The same definition is also used in the patent analysis of OECD. The patent applications for USPTO are classified by United States Patent Classifica-tion (USPC). Therefore, the technological clas-sification was done by using the concordance table of USPC and International Patent Classifi-cation (IPC) and transforming International Patent Classification (IPC) into USPC.
Regarding Nanotechnology, the classification called Y01N by EPO was used. At present, there is no unified definition for Nanotechnology in the world. Therefore, EPO defines Nanotechnology on it own accord. And then, based on it, the ap-plications relating to Nanotechnology are ex-tracted from the patent applications to major pa-tent authorities in the world and given the tag of Y01N. The patent applications with Y01N tags for EPO and USPTO were analyzed.
The patent applications to JPO were excluded here. The reason was that due to a problem on the patent database, the extraction accuracy of the patent applications on Nanotechnology was low.
(1) The patent applications to EPO by field Looking at the situation of applications to EPO
by technological field, Japan has a large share in Nanotechnology and Information and communi-cation technology. The share of Nanotechnology was approximately 30% from 1996 to 1998; however, it was approximately 20% from 2006 to 2008. The share of Japan in Biotechnology is about 10%, and it was less than about 17% of Japan’s share as a whole.
Shares for Biotechnology and Nanotechnology are large for U.S., while Germany had a relatively large share in Renewable energy and U.K. in Biotechnology and Renewable energy. The share of Korea has been increasing over the past 10 years. Especially, the growth in Information and communication technology and Nanotechnology is remarkable (Chart 4-2-4).
Although China’s shares are increasing, it still has a small presence compared with the other six countries. (2) The granted patents in USPTO by field
Looking at the granted patent in USPTO by field, Japan has a large share in Nanotechnology and Information and communication technology, the same as in the case of EPO. Its share of Nanotechnology from 2006 to 2008 was about 26%.
Germany has a relatively large share in Re-newable energy, as does U.K. in Biotechnology and Renewable energy. Regarding Korea, it is apparent that growth in its shares in Information and communications technology and Nanotech-nology are especially large (Chart 4-2-5).
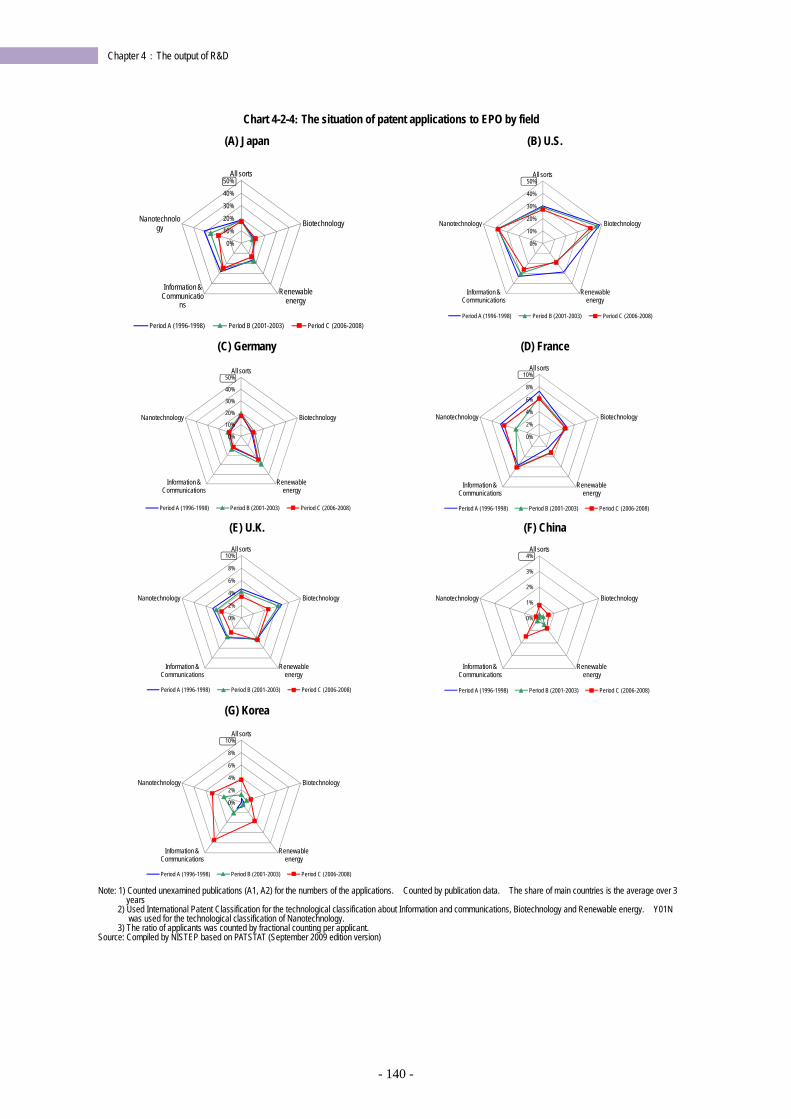
- 140 -
Chapter 4:The output of R&D
Chart 4-2-4: The situation of patent applications to EPO by field
(A) Japan (B) U.S.
(C) Germany (D) France
(E) U.K. (F) China
(G) Korea
Note: 1) Counted unexamined publications (A1, A2) for the numbers of the applications. Counted by publication data. The share of main countries is the average over 3 years
2) Used International Patent Classification for the technological classification about Information and communications, Biotechnology and Renewable energy. Y01N was used for the technological classification of Nanotechnology.
3) The ratio of applicants was counted by fractional counting per applicant. Source: Compiled by NISTEP based on PATSTAT (September 2009 edition version)
0%
10%
20%
30%
40%
50%All sorts
Biotechnology
Renewable energy
Information & Communicatio
ns
Nanotechnology
Period A (1996-1998) Period B (2001-2003) Period C (2006-2008)
0%
10%
20%
30%
40%
50%All sorts
Biotechnology
Renewable energy
Information & Communications
Nanotechnology
Period A (1996-1998) Period B (2001-2003) Period C (2006-2008)
0%
10%
20%
30%
40%
50%All sorts
Biotechnology
Renewable energy
Information & Communications
Nanotechnology
Period A (1996-1998) Period B (2001-2003) Period C (2006-2008)
0%
2%
4%
6%
8%
10%All sorts
Biotechnology
Renewable energy
Information & Communications
Nanotechnology
Period A (1996-1998) Period B (2001-2003) Period C (2006-2008)
0%
2%
4%
6%
8%
10%All sorts
Biotechnology
Renewable energy
Information & Communications
Nanotechnology
Period A (1996-1998) Period B (2001-2003) Period C (2006-2008)
0%
1%
2%
3%
4%All sorts
Biotechnology
Renewable energy
Information & Communications
Nanotechnology
Period A (1996-1998) Period B (2001-2003) Period C (2006-2008)
0%
2%
4%
6%
8%
10%All sorts
Biotechnology
Renewable energy
Information & Communications
Nanotechnology
Period A (1996-1998) Period B (2001-2003) Period C (2006-2008)
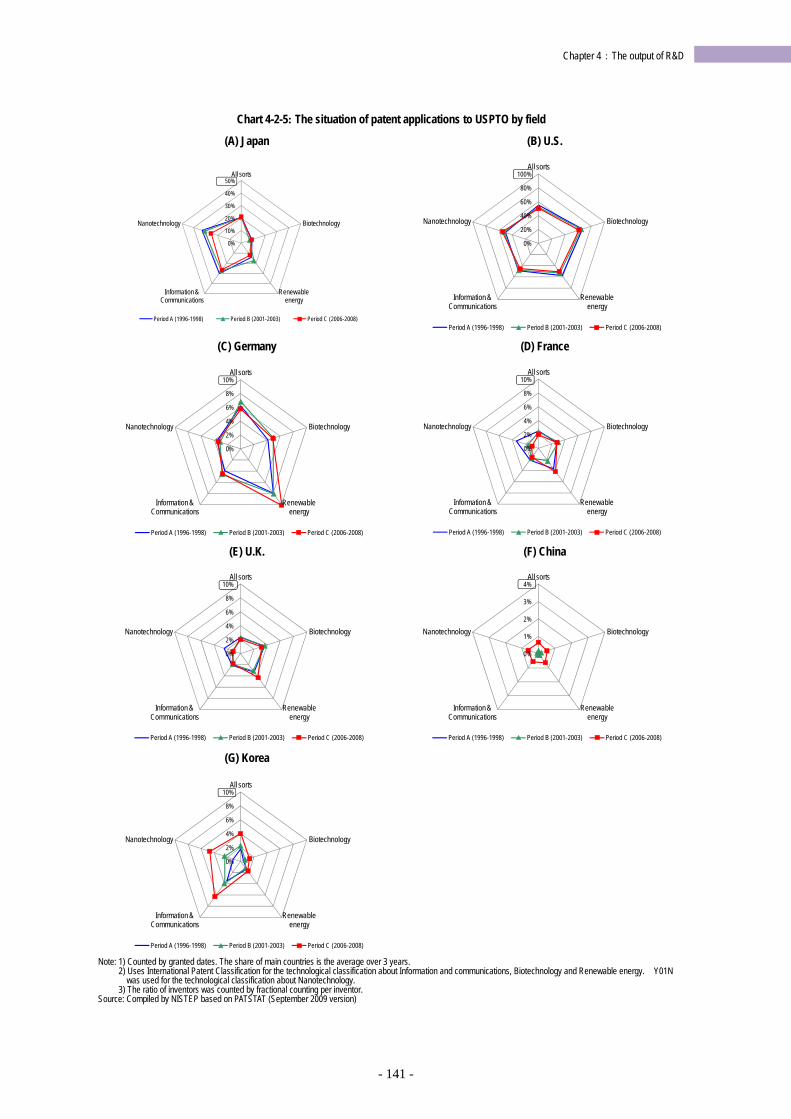
- 141 -
Chapter 4:The output of R&D
Chart 4-2-5: The situation of patent applications to USPTO by field
(A) Japan (B) U.S.
(C) Germany (D) France
(E) U.K. (F) China
(G) Korea
Note: 1) Counted by granted dates. The share of main countries is the average over 3 years. 2) Uses International Patent Classification for the technological classification about Information and communications, Biotechnology and Renewable energy. Y01N
was used for the technological classification about Nanotechnology. 3) The ratio of inventors was counted by fractional counting per inventor.
Source: Compiled by NISTEP based on PATSTAT (September 2009 version)
0%
10%
20%
30%
40%
50%All sorts
Biotechnology
Renewable energy
Information & Communications
Nanotechnology
Period A (1996-1998) Period B (2001-2003) Period C (2006-2008)
0%
20%
40%
60%
80%
100%All sorts
Biotechnology
Renewable energy
Information & Communications
Nanotechnology
Period A (1996-1998) Period B (2001-2003) Period C (2006-2008)
0%
2%
4%
6%
8%
10%All sorts
Biotechnology
Renewable energy
Information & Communications
Nanotechnology
Period A (1996-1998) Period B (2001-2003) Period C (2006-2008)
0%
2%
4%
6%
8%
10%All sorts
Biotechnology
Renewable energy
Information & Communications
Nanotechnology
Period A (1996-1998) Period B (2001-2003) Period C (2006-2008)
0%
2%
4%
6%
8%
10%All sorts
Biotechnology
Renewable energy
Information & Communications
Nanotechnology
Period A (1996-1998) Period B (2001-2003) Period C (2006-2008)
0%
1%
2%
3%
4%All sorts
Biotechnology
Renewable energy
Information & Communications
Nanotechnology
Period A (1996-1998) Period B (2001-2003) Period C (2006-2008)
0%
2%
4%
6%
8%
10%All sorts
Biotechnology
Renewable energy
Information & Communications
Nanotechnology
Period A (1996-1998) Period B (2001-2003) Period C (2006-2008)
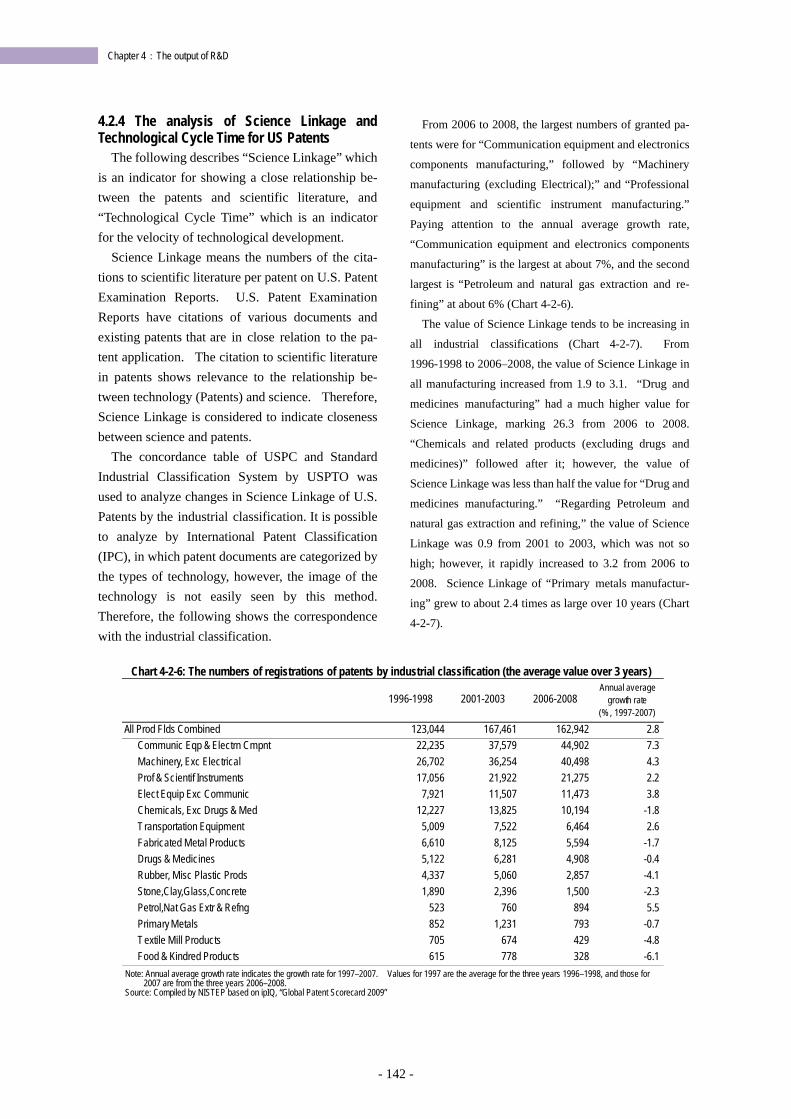
- 142 -
Chapter 4:The output of R&D
4.2.4 The analysis of Science Linkage and Technological Cycle Time for US Patents
The following describes “Science Linkage” which is an indicator for showing a close relationship be-tween the patents and scientific literature, and “Technological Cycle Time” which is an indicator for the velocity of technological development.
Science Linkage means the numbers of the cita-tions to scientific literature per patent on U.S. Patent Examination Reports. U.S. Patent Examination Reports have citations of various documents and existing patents that are in close relation to the pa-tent application. The citation to scientific literature in patents shows relevance to the relationship be-tween technology (Patents) and science. Therefore, Science Linkage is considered to indicate closeness between science and patents.
The concordance table of USPC and Standard Industrial Classification System by USPTO was used to analyze changes in Science Linkage of U.S. Patents by the industrial classification. It is possible to analyze by International Patent Classification (IPC), in which patent documents are categorized by the types of technology, however, the image of the technology is not easily seen by this method. Therefore, the following shows the correspondence with the industrial classification.
From 2006 to 2008, the largest numbers of granted pa-
tents were for “Communication equipment and electronics
components manufacturing,” followed by “Machinery
manufacturing (excluding Electrical);” and “Professional
equipment and scientific instrument manufacturing.”
Paying attention to the annual average growth rate,
“Communication equipment and electronics components
manufacturing” is the largest at about 7%, and the second
largest is “Petroleum and natural gas extraction and re-
fining” at about 6% (Chart 4-2-6). The value of Science Linkage tends to be increasing in
all industrial classifications (Chart 4-2-7). From
1996-1998 to 2006–2008, the value of Science Linkage in
all manufacturing increased from 1.9 to 3.1. “Drug and
medicines manufacturing” had a much higher value for
Science Linkage, marking 26.3 from 2006 to 2008.
“Chemicals and related products (excluding drugs and
medicines)” followed after it; however, the value of
Science Linkage was less than half the value for “Drug and
medicines manufacturing.” “Regarding Petroleum and
natural gas extraction and refining,” the value of Science
Linkage was 0.9 from 2001 to 2003, which was not so
high; however, it rapidly increased to 3.2 from 2006 to
2008. Science Linkage of “Primary metals manufactur-
ing” grew to about 2.4 times as large over 10 years (Chart
4-2-7).
Chart 4-2-6: The numbers of registrations of patents by industrial classification (the average value over 3 years)
Note: Annual average growth rate indicates the growth rate for 1997–2007. Values for 1997 are the average for the three years 1996–1998, and those for
2007 are from the three years 2006–2008. Source: Compiled by NISTEP based on ipIQ, “Global Patent Scorecard 2009”
1996-1998 2001-2003 2006-2008Annual average
growth rate(% , 1997-2007)
All Prod Flds Combined 123,044 167,461 162,942 2.8Communic Eqp & Electrn Cmpnt 22,235 37,579 44,902 7.3Machinery, Exc Electrical 26,702 36,254 40,498 4.3Prof & Scientif Instruments 17,056 21,922 21,275 2.2Elect Equip Exc Communic 7,921 11,507 11,473 3.8Chemicals, Exc Drugs & Med 12,227 13,825 10,194 -1.8Transportation Equipment 5,009 7,522 6,464 2.6Fabricated Metal Products 6,610 8,125 5,594 -1.7Drugs & Medicines 5,122 6,281 4,908 -0.4Rubber, Misc Plastic Prods 4,337 5,060 2,857 -4.1Stone,Clay,Glass,Concrete 1,890 2,396 1,500 -2.3Petrol,Nat Gas Extr & Refng 523 760 894 5.5Primary Metals 852 1,231 793 -0.7Textile Mill Products 705 674 429 -4.8Food & Kindred Products 615 778 328 -6.1
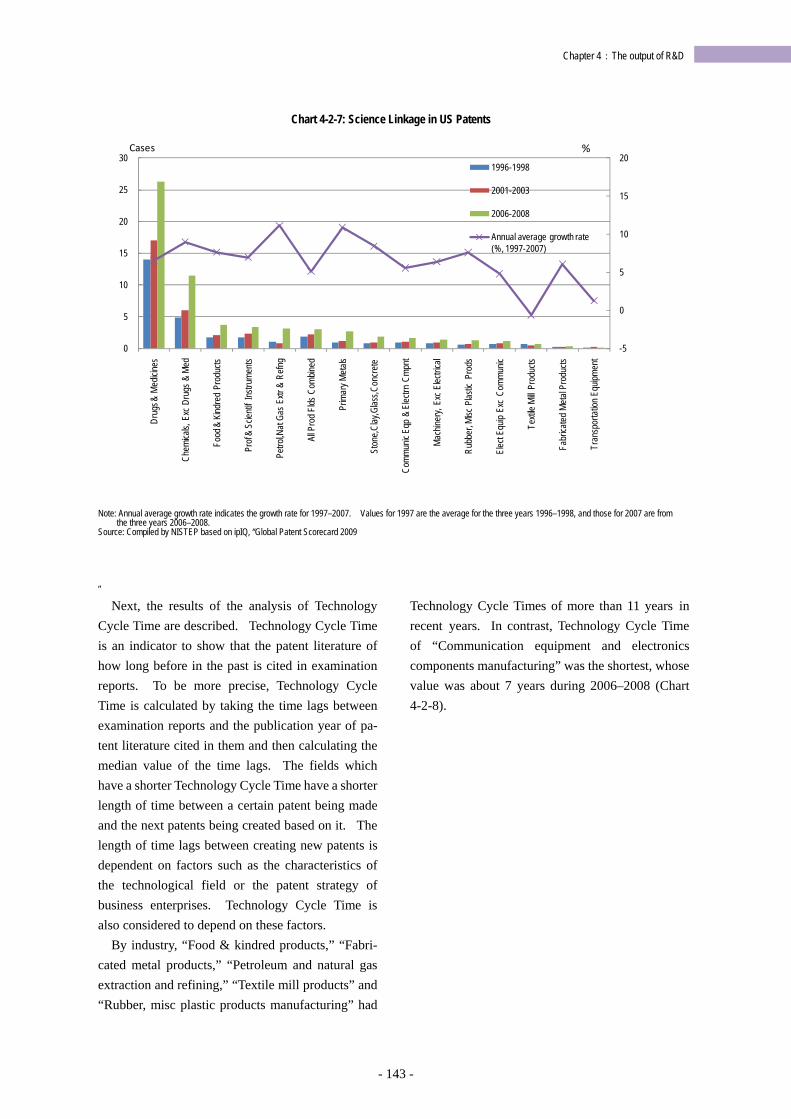
- 143 -
Chapter 4:The output of R&D
Chart 4-2-7: Science Linkage in US Patents
Note: Annual average growth rate indicates the growth rate for 1997–2007. Values for 1997 are the average for the three years 1996–1998, and those for 2007 are from
the three years 2006–2008. Source: Compiled by NISTEP based on ipIQ, “Global Patent Scorecard 2009
”
Next, the results of the analysis of Technology Cycle Time are described. Technology Cycle Time is an indicator to show that the patent literature of how long before in the past is cited in examination reports. To be more precise, Technology Cycle Time is calculated by taking the time lags between examination reports and the publication year of pa-tent literature cited in them and then calculating the median value of the time lags. The fields which have a shorter Technology Cycle Time have a shorter length of time between a certain patent being made and the next patents being created based on it. The length of time lags between creating new patents is dependent on factors such as the characteristics of the technological field or the patent strategy of business enterprises. Technology Cycle Time is also considered to depend on these factors.
By industry, “Food & kindred products,” “Fabri-cated metal products,” “Petroleum and natural gas extraction and refining,” “Textile mill products” and “Rubber, misc plastic products manufacturing” had
Technology Cycle Times of more than 11 years in recent years. In contrast, Technology Cycle Time of “Communication equipment and electronics components manufacturing” was the shortest, whose value was about 7 years during 2006–2008 (Chart 4-2-8).
-5
0
5
10
15
20
0
5
10
15
20
25
30 Dr
ugs &
Med
icines
Chem
icals,
Exc
Dru
gs &
Med
Food
& Kin
dred
Pro
ducts
Prof
& Sc
ientif
Instru
ments
Petro
l,Nat
Gas E
xtr &
Refn
g
All P
rod F
lds C
ombin
ed
Prim
ary M
etals
Ston
e,Clay
,Glas
s,Con
crete
Comm
unic
Eqp
& Ele
ctrn
Cmpn
t
Mach
inery,
Exc
Elec
trical
Rubb
er, M
isc P
lastic
Pro
ds
Elect
Equip
Exc
Com
munic
Texti
le Mi
ll Pro
ducts
Fabr
icated
Meta
l Pro
ducts
Tran
spor
tation
Equ
ipmen
t
1996-1998
2001-2003
2006-2008
Annual average growth rate (%, 1997-2007)
Cases %
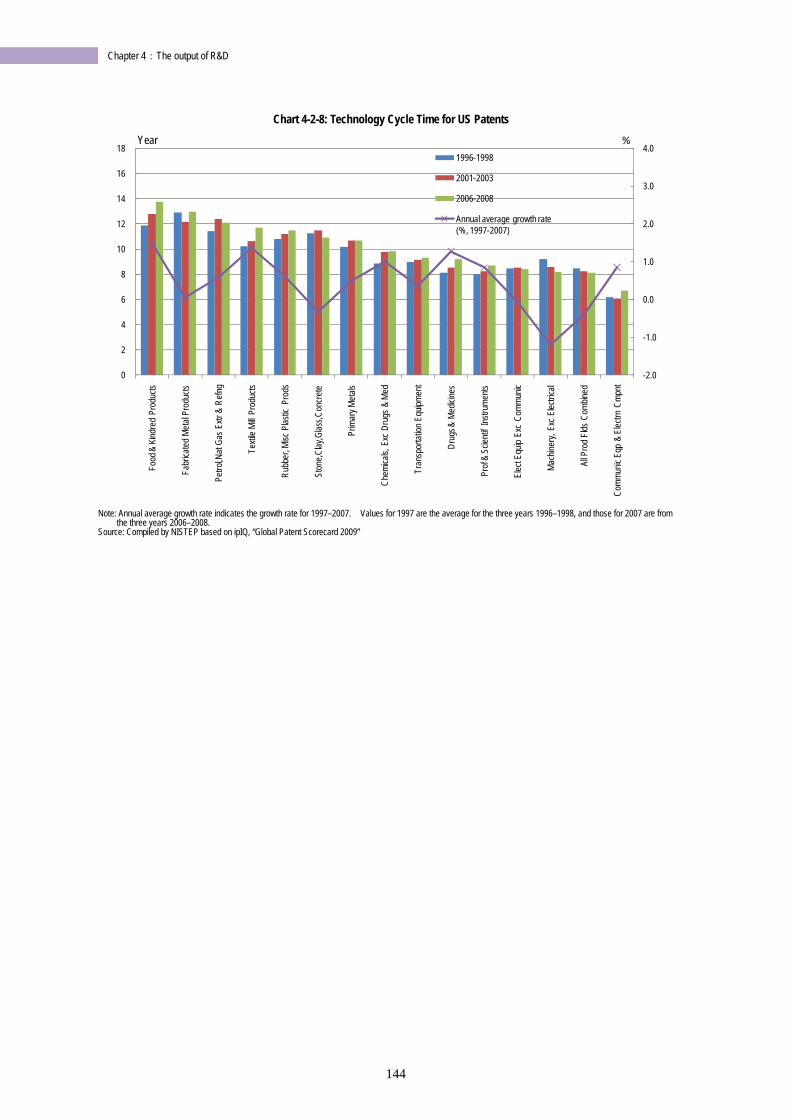
144
Chapter 4:The output of R&D
Chart 4-2-8: Technology Cycle Time for US Patents
Note: Annual average growth rate indicates the growth rate for 1997–2007. Values for 1997 are the average for the three years 1996–1998, and those for 2007 are from
the three years 2006–2008. Source: Compiled by NISTEP based on ipIQ, “Global Patent Scorecard 2009”
-2.0
-1.0
0.0
1.0
2.0
3.0
4.0
0
2
4
6
8
10
12
14
16
18 Fo
od &
Kindr
ed P
rodu
cts
Fabr
icated
Meta
l Pro
ducts
Petro
l,Nat
Gas E
xtr &
Refn
g
Texti
le Mi
ll Pro
ducts
Rubb
er, M
isc P
lastic
Pro
ds
Ston
e,Clay
,Glas
s,Con
crete
Prim
ary M
etals
Chem
icals,
Exc
Dru
gs &
Med
Tran
spor
tation
Equ
ipmen
t
Drug
s & M
edicin
es
Prof
& Sc
ientif
Instru
ments
Elect
Equip
Exc
Com
munic
Mach
inery,
Exc
Elec
trical
All P
rod F
lds C
ombin
ed
Comm
unic
Eqp
& Ele
ctrn
Cmpn
t
1996-1998
2001-2003
2006-2008
Annual average growth rate (%, 1997-2007)
Year %
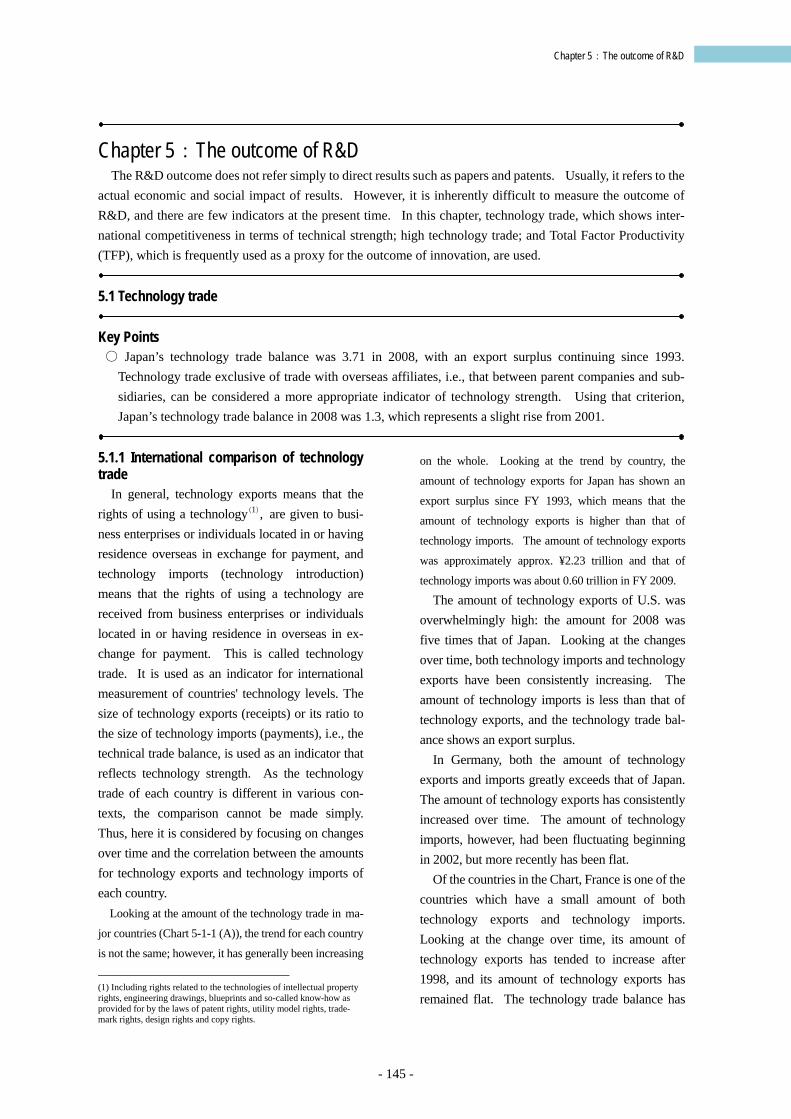
- 145 -
Chapter 5:The outcome of R&D
Chapter 5:The outcome of R&D The R&D outcome does not refer simply to direct results such as papers and patents. Usually, it refers to the
actual economic and social impact of results. However, it is inherently difficult to measure the outcome of R&D, and there are few indicators at the present time. In this chapter, technology trade, which shows inter-national competitiveness in terms of technical strength; high technology trade; and Total Factor Productivity (TFP), which is frequently used as a proxy for the outcome of innovation, are used.
5.1 Technology trade
Key Points ○ Japan’s technology trade balance was 3.71 in 2008, with an export surplus continuing since 1993.
Technology trade exclusive of trade with overseas affiliates, i.e., that between parent companies and sub-sidiaries, can be considered a more appropriate indicator of technology strength. Using that criterion, Japan’s technology trade balance in 2008 was 1.3, which represents a slight rise from 2001.
5.1.1 International comparison of technology trade
In general, technology exports means that the rights of using a technology(1), are given to busi-ness enterprises or individuals located in or having residence overseas in exchange for payment, and technology imports (technology introduction) means that the rights of using a technology are received from business enterprises or individuals located in or having residence in overseas in ex-change for payment. This is called technology trade. It is used as an indicator for international measurement of countries' technology levels. The size of technology exports (receipts) or its ratio to the size of technology imports (payments), i.e., the technical trade balance, is used as an indicator that reflects technology strength. As the technology trade of each country is different in various con-texts, the comparison cannot be made simply. Thus, here it is considered by focusing on changes over time and the correlation between the amounts for technology exports and technology imports of each country.
Looking at the amount of the technology trade in ma-
jor countries (Chart 5-1-1 (A)), the trend for each country
is not the same; however, it has generally been increasing
(1) Including rights related to the technologies of intellectual property rights, engineering drawings, blueprints and so-called know-how as provided for by the laws of patent rights, utility model rights, trade-mark rights, design rights and copy rights.
on the whole. Looking at the trend by country, the
amount of technology exports for Japan has shown an
export surplus since FY 1993, which means that the
amount of technology exports is higher than that of
technology imports. The amount of technology exports
was approximately approx. ¥2.23 trillion and that of
technology imports was about 0.60 trillion in FY 2009. The amount of technology exports of U.S. was
overwhelmingly high: the amount for 2008 was five times that of Japan. Looking at the changes over time, both technology imports and technology exports have been consistently increasing. The amount of technology imports is less than that of technology exports, and the technology trade bal-ance shows an export surplus.
In Germany, both the amount of technology exports and imports greatly exceeds that of Japan. The amount of technology exports has consistently increased over time. The amount of technology imports, however, had been fluctuating beginning in 2002, but more recently has been flat.
Of the countries in the Chart, France is one of the countries which have a small amount of both technology exports and technology imports. Looking at the change over time, its amount of technology exports has tended to increase after 1998, and its amount of technology exports has remained flat. The technology trade balance has
- 146 -
Chapter 5:The outcome of R&D
had an export surplus since 2000. (Note that the most recent year for which French statistics were available is 2003.)
Regarding U.K., it is necessary to be careful
when looking at the change over time because the ways of gathering statistics was changed after 1996. However, the amount of technology exports has tended to be flat in recent years.
Chart 5-1-1: The technology trade of main countries
(A) The trend in the amount of technology trade
(B) The trend in the technology trade balance
Note :<Japan> Data are for fiscal years.
The sorts of technology trade are as follows (excluding trademark rights): (1) Patent rights, utility model rights and copy rights (2)Design rights (3)Each kind of technological know-how provision and technical guidance (excluding free provision) (4)Technological aid for developing countries (including government-commissioned works)
<U.S.> Through 2000, only royalties and licenses. For 2001–2005, research, development and testing services were added. Since 2006, computers, data processing services, etc., have been included.
<Germany>West Germany until 1990. Until 1985 includes patents, know-how, trademarks, and design. From 1986, additionally included technical services, com-puter services and R&D in industrial fields.
<U.K.>from 1984, included oil companies. From 1996, includes patents, inventions, know-how, trademarks, design and services related to technology and R&D. Statistical reference E was used for purchasing power parity conversion.
Source :<Japan> Ministry of Internal Affairs and Communications, “Report on the Survey of Research and Development.” <U.S., Germany, France, U.K. and Korea>OECD, “Main Science and Technology Indicators 2009/2.”
8
6
4
2
0
2
4
6
8
10
12
Japan(1991~2008)
Germany(1991~2008)
France(1991~2003)
U.K.(1991~2008)
Trillion yen
Trillion yen
U.S.(1991~2008)
Korea(2001~2007)
The a
mou
nt o
f tec
hnol
ogy
impo
rtsTh
e am
ount
of
techn
olog
y exp
orts
0
1
2
3
4
5
6
7
8
9
10
11
12
1981 83 85 87 89 91 93 95 97 99 01 03 05 07
The t
exch
nolog
y tra
de ba
lance
2008
Japan
U.S.
France
Germany
U.K.
Year
- 147 -
Chapter 5:The outcome of R&D
Looking at the technology trade balance (the amount of technology exports/the amount of tech-nology imports), the technology trade balance of Japan has increased since it was more than 1 for the first time in 1993, and the amount of the FY 2008 marked the high figure of 3.71.
The technology trade balance of U.S. is tending to decrease in the long run. It has been below that of Japan since 2001, and had an export surplus of 1.70 in 2008.
The technology trade balance of Germany passed 1 in 2003, and has been gradually increasing since then.
That of France was over 1 for the first time in 2000, and has shown high figures since then. It marked 1.6 in 2003.
U.K.’s technology trade balance began growing in the 1990s. It surpassed 2.3 in 2003, but has been slowly declining in recent years.
When the data on technology trade is looked at, it can be seen that a significant ratio of technology trade among nations is accounted for technology transfers within corporate groups such as technolo-gy trade with affiliated companies overseas. Technology trade with affiliated companies is an indicator for international transfer of technical knowledge; however, it is not a strong indicator for the international competitiveness of technological strength. When technology trade is used as an indicator for seeing each country’s technological strength, it is better to consider it by excluding technology transfers within corporate groups. Thus, regarding the amount of technology exports and imports of Japan and U.S. whose data it is available, technology trade between affiliated com-panies and that between other companies are com-pared.
In Japan’s survey(2), “Parent companies and sub-sidiaries” is defined as where the controlling share is over 50% in the capital ties between technology exporters and importers. With this definition,
(2)Ministry of Internal Affairs and Communications, “Report on the Survey of Research and Development” was a survey conducted on the Source of the technology trade of Japan by dividing it into the amount of the technology trade of parent companies and subsidiaries, and that for companies excluding parent companies and subsidiaries, since the survey for the FY 2002.
technology trade among parent companies and sub-sidiaries, and that among other companies are sur-veyed.
The amount of technology exports in Japan, for which the export between parent companies and subsidiaries were excluded, was approx. ¥0.66 tril-lion in the FY 2008, which accounted for 29.4% of the total. In the FY 2001, it was approx. ¥0.54 trillion and accounted for 43.3% of the total. Compared with the FY 2008 and the FY 2001, there was a decrease of 13.9 points. However, technol-ogy exports greatly increased. The amount of technology trade was ¥0.6 trillion in the FY 2008, and companies excluding parent companies and subsidiaries accounted for 85.4% for the total. Looking at the ratio of the total in the long run, it has consistently had a proportion of over 80%.
In the data for U.S., technology trade of “asso-ciated companies” is defined as the companies which own directly or indirectly 10% or more of voting rights or shares.
The amount of technology exports of companies excluding associated companies in 2007 was approx. ¥2.85 trillion and accounted for 28.7% of the total. Compared with 1999 (approx.¥1.68 trillion, 26.2%) at the time of changing U.S. industry classification to the current one, the amount of technology exports of companies excluding associated companies has in-creased to 1.7 times as much; however, the percen-tage of the total is 28.7%, which shows less change. Regarding the amount of technology imports, the amount of technology imports of companies ex-cluding associated companies was approx. ¥0.65 trillion in 2007, which accounted for 21.5% of the total. Compared with it being approx. ¥0.44 trillion and 20.9% of the total in 1999, the amount of tech-nology imports of companies excluding associated companies has increased by to 1.5 times, with a slight increase of 0.7 percentage points in the ratio.
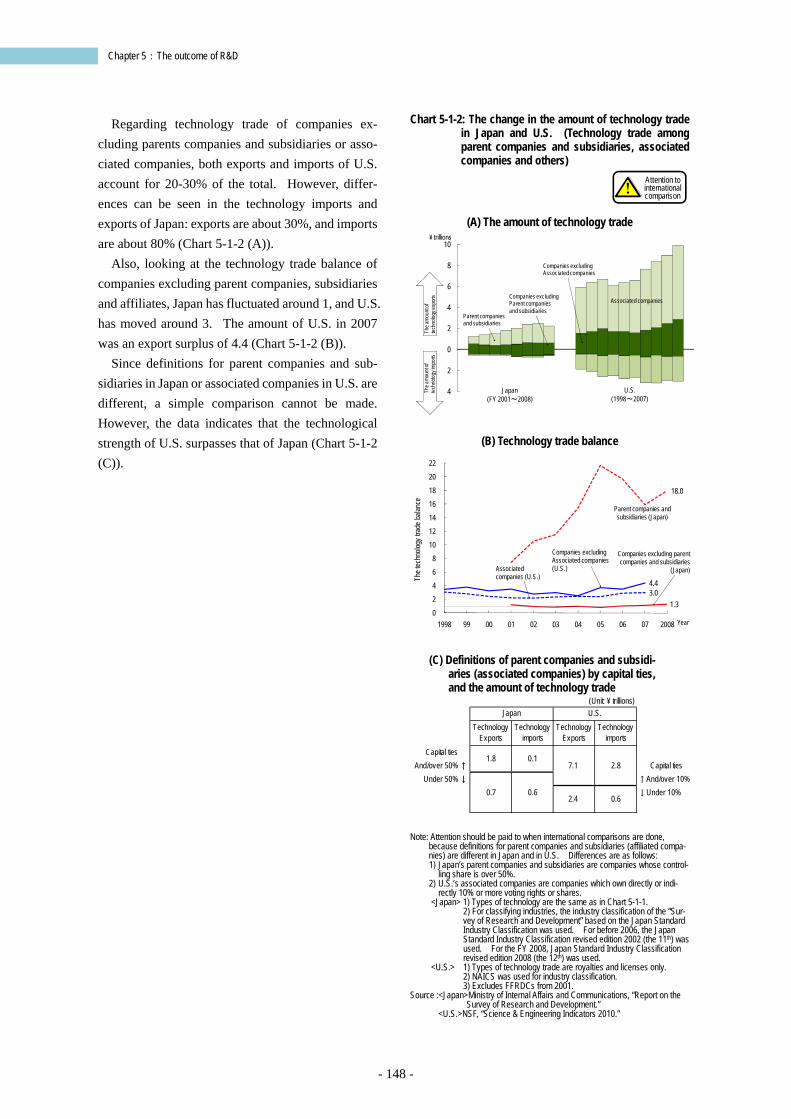
- 148 -
Chapter 5:The outcome of R&D
Regarding technology trade of companies ex-cluding parents companies and subsidiaries or asso-ciated companies, both exports and imports of U.S. account for 20-30% of the total. However, differ-ences can be seen in the technology imports and exports of Japan: exports are about 30%, and imports are about 80% (Chart 5-1-2 (A)).
Also, looking at the technology trade balance of companies excluding parent companies, subsidiaries and affiliates, Japan has fluctuated around 1, and U.S. has moved around 3. The amount of U.S. in 2007 was an export surplus of 4.4 (Chart 5-1-2 (B)).
Since definitions for parent companies and sub-sidiaries in Japan or associated companies in U.S. are different, a simple comparison cannot be made. However, the data indicates that the technological strength of U.S. surpasses that of Japan (Chart 5-1-2 (C)).
Chart 5-1-2: The change in the amount of technology trade in Japan and U.S. (Technology trade among parent companies and subsidiaries, associated companies and others)
(A) The amount of technology trade
(B) Technology trade balance
(C) Definitions of parent companies and subsidi-
aries (associated companies) by capital ties, and the amount of technology trade
Note: Attention should be paid to when international comparisons are done,
because definitions for parent companies and subsidiaries (affiliated compa-nies) are different in Japan and in U.S. Differences are as follows: 1) Japan’s parent companies and subsidiaries are companies whose control-
ling share is over 50%. 2) U.S.’s associated companies are companies which own directly or indi-
rectly 10% or more voting rights or shares. <Japan> 1) Types of technology are the same as in Chart 5-1-1. 2) For classifying industries, the industry classification of the “Sur-
vey of Research and Development” based on the Japan Standard Industry Classification was used. For before 2006, the Japan Standard Industry Classification revised edition 2002 (the 11th) was used. For the FY 2008, Japan Standard Industry Classification revised edition 2008 (the 12th) was used.
<U.S.> 1) Types of technology trade are royalties and licenses only. 2) NAICS was used for industry classification. 3) Excludes FFRDCs from 2001.
Source :<Japan>Ministry of Internal Affairs and Communications, “Report on the Survey of Research and Development.”
<U.S.>NSF, “Science & Engineering Indicators 2010.”
4
2
0
2
4
6
8
10¥ trillions
U.S.(1998~2007)
Japan(FY 2001~2008)
Associated companiesCompanies excluding Parent companies and subsidiaries
The a
moun
t of
techn
ology
expo
rtsTh
e amo
unto
f tec
hnolo
gy im
ports
Parent companies and subsidiaries
Companies excluding Associated companies
4.4 3.0
1.3
18.0
0 2 4 6 8
10 12 14 16 18 20 22
1998 99 00 01 02 03 04 05 06 07 2008
The t
echn
ology
trad
e ba
lance
Year
Companies excluding parentcompanies and subsidiaries
(Japan)
Parent companies and subsidiaries (Japan)
Companies excluding Associated companies(U.S.)Associated
companies (U.S.)
(Unit: ¥ trillions)
Technology Exports
Technology imports
Technology Exports
Technology imports
Capital tiesAnd/over 50%↑ 7.1 2.8 Capital ties
Under 50%↓ ↑And/over 10%0.7 0.6 ↓Under 10%
1.8 0.1
2.4 0.6
Japan U.S.
Attention to international comparison
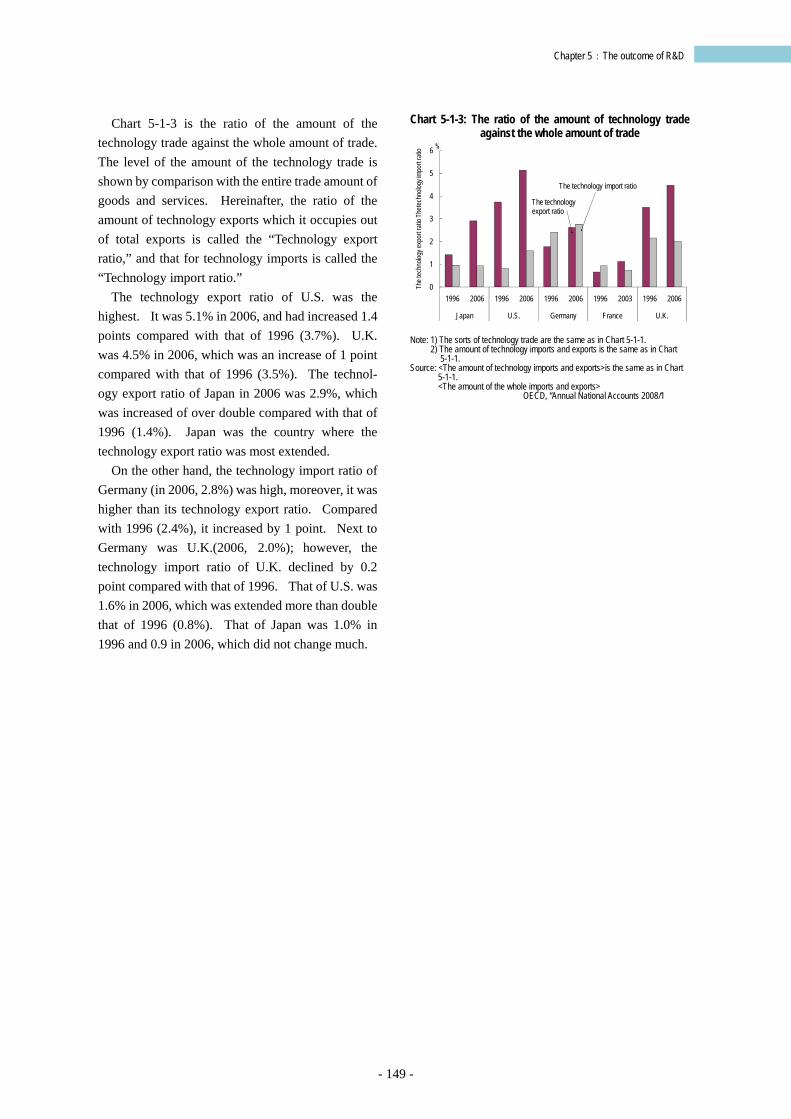
- 149 -
Chapter 5:The outcome of R&D
Chart 5-1-3 is the ratio of the amount of the technology trade against the whole amount of trade. The level of the amount of the technology trade is shown by comparison with the entire trade amount of goods and services. Hereinafter, the ratio of the amount of technology exports which it occupies out of total exports is called the “Technology export ratio,” and that for technology imports is called the “Technology import ratio.”
The technology export ratio of U.S. was the highest. It was 5.1% in 2006, and had increased 1.4 points compared with that of 1996 (3.7%). U.K. was 4.5% in 2006, which was an increase of 1 point compared with that of 1996 (3.5%). The technol-ogy export ratio of Japan in 2006 was 2.9%, which was increased of over double compared with that of 1996 (1.4%). Japan was the country where the technology export ratio was most extended.
On the other hand, the technology import ratio of Germany (in 2006, 2.8%) was high, moreover, it was higher than its technology export ratio. Compared with 1996 (2.4%), it increased by 1 point. Next to Germany was U.K.(2006, 2.0%); however, the technology import ratio of U.K. declined by 0.2 point compared with that of 1996. That of U.S. was 1.6% in 2006, which was extended more than double that of 1996 (0.8%). That of Japan was 1.0% in 1996 and 0.9 in 2006, which did not change much.
Chart 5-1-3: The ratio of the amount of technology trade against the whole amount of trade
Note: 1) The sorts of technology trade are the same as in Chart 5-1-1.
2) The amount of technology imports and exports is the same as in Chart 5-1-1.
Source: <The amount of technology imports and exports>is the same as in Chart 5-1-1. <The amount of the whole imports and exports>
OECD, “Annual National Accounts 2008/1
0
1
2
3
4
5
6
1996 2006 1996 2006 1996 2006 1996 2003 1996 2006
Japan U.S. Germany France U.K.
The t
echn
ology
expo
rt ra
tio T
hete
chno
logy i
mpor
t rat
io %
The technology export ratio
The technology import ratio
- 150 -
Chapter 5:The outcome of R&D
5.1.2 The Technology Trade of Japan
Key Points ○Looking at the amount of technology exports of Japan, “Transportation equipment manufacturing” ac-
counts for about 50% of all industries, and it is followed by “Drugs and medicines”, which accounts for about 10% of all industries. Regarding “Transportation equipment manufacturing”, the ratio of parent companies and subsidiaries is approximately 90%. However, that of “Drugs and medicines” remains at approximately 50%. “Drugs and medicines” can be said to be an industry involving more international technology transfer for technology exports in Japan, many of which transactions are made among parent companies and subsidiaries.
○Most transactions for technology imports in Japan are made in companies excluding parent companies and subsidiaries.
○Looking at the partners of technology exports from Japan, U.S. accounts for 36.7% of them all, which is first, and China follows it at 12.1%. U.K. accounts for 5.6%, which is third place. On the other hand, regarding technology imports, U.S. accounts for 68.9% of the total, and Germany, France and U.K. follow it with about 5% each.
(1) Technology trade by industry classification
Looking at the technology trade of Japan by in-dustry classification, the industry which had the largest amount of technology exports in the FY 2008 was “Transportation equipment manufacturing.” The amount was approx. ¥1.05 trillion and ac-counted for 47.2% of the entire industries. It was followed by “Drugs and medicines” (approx. ¥0.29 trillion 12.9%) and “Information and communica-tion electronics equipment” (approx. ¥0.24 trillion, 11.0%). Compared with the FY 2003, there was an 11.09 point decrease in the ratio of “Transportation equipment manufacturing”, a 3.9 point increase in that of “Drugs and medicines” and a 1.4 point in-crease in that of “Information and communication electronics equipment.”
On the other hand, looking at in the FY 2008, the industry which had the large amount of technology imports was “Information and communication elec-tronics equipment.” The amount was approx. ¥0.27 trillion and accounted for 45.3% of the entire indus-tries. It was followed by “Drugs and medicines” (¥58.7 billion, 9.8%), and “Chemical products” (¥39.6 billion, 6.6%). Compared with the FY 2003, there was a large increase of 18.5 points in the ratio of “Information and communication electronics equipment”, and a 6.5 point decline in “Information
and communications”(Chart 5-1-4 (A)). Looking at the amount of technology trade of
parent companies and subsidiaries and that of com-panies excluding parent companies and subsidiaries by industry classification, parent companies and subsidiaries in most industries have a large amount for technology trade. The trade among parent companies and subsidiaries in “Transportation equipment manufacturing” accounts for about 90% of trade in the industry, and that in the “Information and communications” accounts for about 80%. In the FY 2003, the trade among parent companies and subsidiaries in the “Information and communica-tions” was about 60%. Compared to this, it can be said that transactions among parent companies and subsidiaries increased more. In contrast, the ratio of technology trade among companies excluding par-ent companies and subsidiaries in “Drugs and me-dicines” and “Chemical products” is large. “Drugs and medicines” accounts for about 50%, and “Chemical products” for approximately 60%. That of “Drugs and medicines” in the FY 2003 was around 70%.
In technology imports, the ratio of companies ex-cluding parent companies and subsidiaries was do-minant in most industries (Chart 5-1-4 (B and C)).
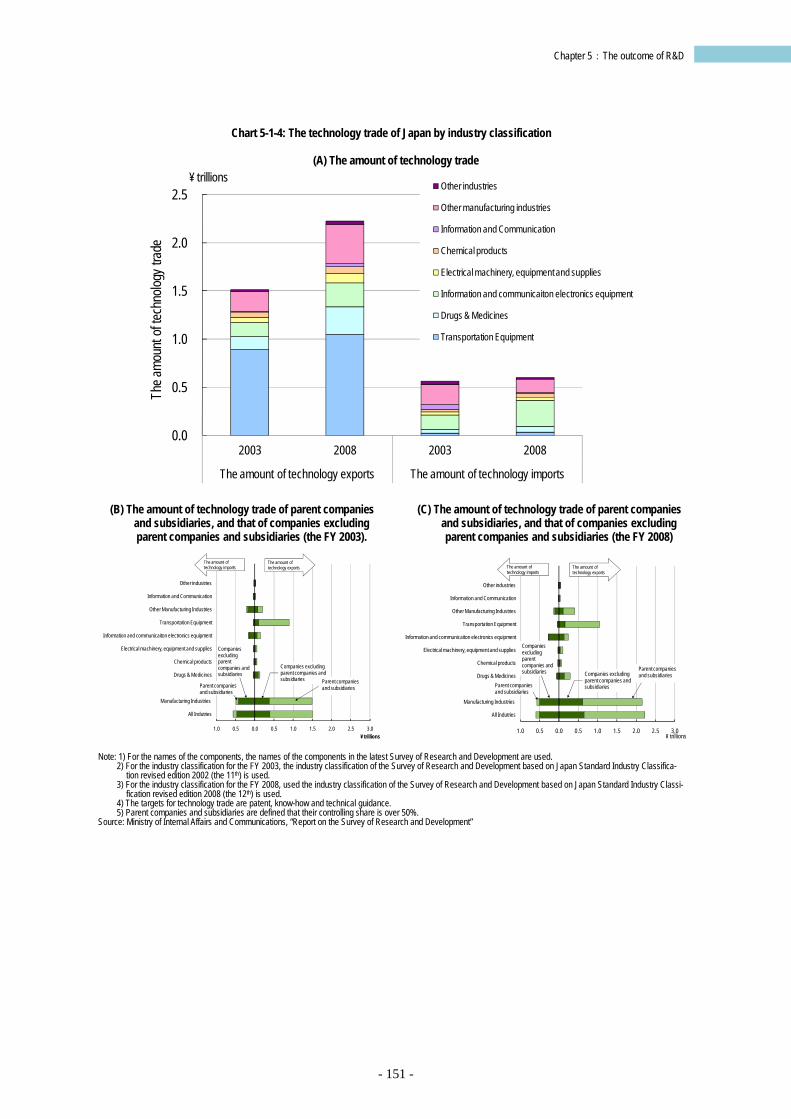
- 151 -
Chapter 5:The outcome of R&D
Chart 5-1-4: The technology trade of Japan by industry classification
(A) The amount of technology trade
(B) The amount of technology trade of parent companies
and subsidiaries, and that of companies excluding parent companies and subsidiaries (the FY 2003).
(C) The amount of technology trade of parent companies and subsidiaries, and that of companies excluding parent companies and subsidiaries (the FY 2008)
Note: 1) For the names of the components, the names of the components in the latest Survey of Research and Development are used.
2) For the industry classification for the FY 2003, the industry classification of the Survey of Research and Development based on Japan Standard Industry Classifica-tion revised edition 2002 (the 11th) is used.
3) For the industry classification for the FY 2008, used the industry classification of the Survey of Research and Development based on Japan Standard Industry Classi-fication revised edition 2008 (the 12th) is used.
4) The targets for technology trade are patent, know-how and technical guidance. 5) Parent companies and subsidiaries are defined that their controlling share is over 50%.
Source: Ministry of Internal Affairs and Communications, “Report on the Survey of Research and Development”
0.0
0.5
1.0
1.5
2.0
2.5
2003 2008 2003 2008
The amount of technology exports The amount of technology imports
The a
moun
t of te
chno
logy t
rade
¥ trillionsOther industries
Other manufacturing industries
Information and Communication
Chemical products
Electrical machinery, equipment and supplies
Information and communicaiton electronics equipment
Drugs & Medicines
Transportation Equipment
1.0 0.5 0.0 0.5 1.0 1.5 2.0 2.5 3.0
All Indutries
Manufacturing Industries
Drugs & Medicines
Chemical products
Electrical machinery, equipment and supplies
Information and communicaiton electronics equipment
Transportation Equipment
Other Manufacturing Industries
Information and Communication
Other industries
¥ trillions
Companies excluding parent companies and subsidiaries
Companies excluding parent companies and subsidiaries
The amount of technology imports
The amount of technology exports
Parent companiesand subsidiaries
Parent companiesand subsidiaries
- 152 -
Chapter 5:The outcome of R&D
(2) Technology trade by industry classification and partner
In this section, the relations in terms of technol-ogy between Japan and other countries are explained, by using technology trade statistics looking from the view point of industry classification and partner.
Chart 5-1-5 (A and B) shows how much trade Japan does in terms of technology trade with main countries and whether its partners are parent com-panies and subsidiaries or companies excluding these. Japan’s amount of technology exports, which means the amount received from partners, was ex-ceptionally large from U.S. It was approx.¥0.82 trillion. Of this, the amount from companies ex-cluding parent companies and subsidiaries was ap-prox. ¥0.22 trillion which accounted for 26.8% of the total. China followed it with approx.¥0.27 tril-lion. Of this, the amount from companies excluding parent companies and subsidiaries was ¥0.12 trillion, which accounted for 44.2% of the total. Germany showed a large ratio of companies excluding parent companies and subsidiaries, which accounted for 57.8% of the total. The total amount of technology trade with the other countries except the 6 countries described herein was greater than that of U.S. Thailand, Taiwan and Canada, etc. were included in the other countries.
Japan’s amount of technology imports, which means the amount paid to partners, was also excep-tionally large toward U.S. It was approx. ¥0.41 trillion. The ratio of companies excluding parent companies and subsidiaries accounted for 85.8%. Germany followed it, with ¥25.3 billion. The ratio of companies excluding parent companies and sub-sidiaries accounted for 89.0%.
The left side of Chart 5-1-5 (C) is for the amount of technology exports, and the right side of the Chart is for the amount of technology imports showing partners, industry classification, and whether parent companies and subsidiaries or companies excluding parent companies and subsidiaries.
Looking at technology exports by partner country, U.S. had a large amount in “Transportation equip-ment manufacturing,” but almost all transactions in this industry were between parent companies and subsidiaries. In “Information and communication electronics equipment”, trade exclusive of that be-tween parent companies and subsidiaries was com-mon, accounting for 85.7%. As for trade with U.K., “Drugs and medicines” was large, as was trade ex-clusive of that between parent companies and sub-sidiaries, at 82%. There was a large amount of trade with China in “Transportation equipment manufac-turing”, with transactions exclusive of that between parent companies and subsidiaries, which accounted for 75.6%. “Other industries” accounted for the largest value of trade with Korea. Those industries included “Ceramics, stone and clay products”, and “Electronic parts, devices and electronics circuits”.
As for technology imports, the largest amount from U.S. was in “Information and communication electronics equipment”. From Germany, the larg-est amount was in “Pharmaceutical manufacturing,” and from U.K. it was in “Information and commu-nication electronics equipment”. With each country, trade exclusive of that between parent companies and subsidiaries accounted for almost all transactions.
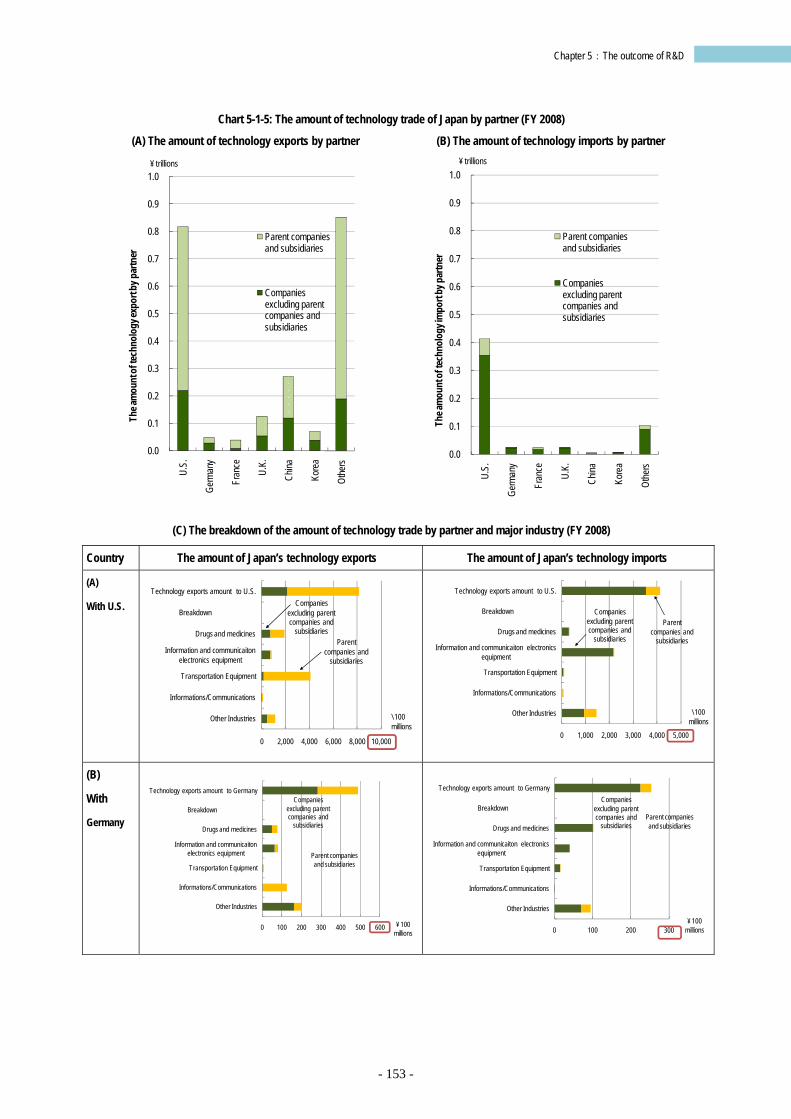
- 153 -
Chapter 5:The outcome of R&D
Chart 5-1-5: The amount of technology trade of Japan by partner (FY 2008)
(A) The amount of technology exports by partner (B) The amount of technology imports by partner
(C) The breakdown of the amount of technology trade by partner and major industry (FY 2008)
Country The amount of Japan’s technology exports The amount of Japan’s technology imports
(A)
With U.S.
(B)
With
Germany
0.0
0.1
0.2
0.3
0.4
0.5
0.6
0.7
0.8
0.9
1.0 U.
S.
Germ
any
Fran
ce
U.K.
China
Kore
a
Othe
rs
The a
mou
nt of
tech
nolo
gy ex
port
by p
artn
er
¥ trillions
Parent companies and subsidiaries
Companies excluding parent companies and subsidiaries
0.0
0.1
0.2
0.3
0.4
0.5
0.6
0.7
0.8
0.9
1.0
U.S.
Germ
any
Fran
ce
U.K.
China
Kore
a
Othe
rs
The a
mou
nt of
tech
nolo
gy im
port
by p
artn
er
¥ trillions
Parent companies and subsidiaries
Companies excluding parent companies and subsidiaries
Companies excluding parent companies and
subsidiariesParent
companies and subsidiaries
0 2,000 4,000 6,000 8,000 10,000
Other Industries
Informations/Communications
Transportation Equipment
Information and communicaiton electronics equipment
Drugs and medicines
Breakdown
Technology exports amount to U.S.
\ 100 millions
Companies excluding parent companies and
subsidiaries
Parent companies and
subsidiaries
0 1,000 2,000 3,000 4,000 5,000
Other Industries
Informations/Communications
Transportation Equipment
Information and communicaiton electronics equipment
Drugs and medicines
Breakdown
Technology exports amount to U.S.
\ 100 millions
Companies excluding parent companies and
subsidiaries
Parent companies and subsidiaries
0 100 200 300 400 500 600
Other Industries
Informations/Communications
Transportation Equipment
Information and communicaiton electronics equipment
Drugs and medicines
Breakdown
Technology exports amount to Germany
¥ 100 millions
Companies excluding parent companies and
subsidiariesParent companies and subsidiaries
0 100 200 300
Other Industries
Informations/Communications
Transportation Equipment
Information and communicaiton electronics equipment
Drugs and medicines
Breakdown
Technology exports amount to Germany
¥ 100 millions
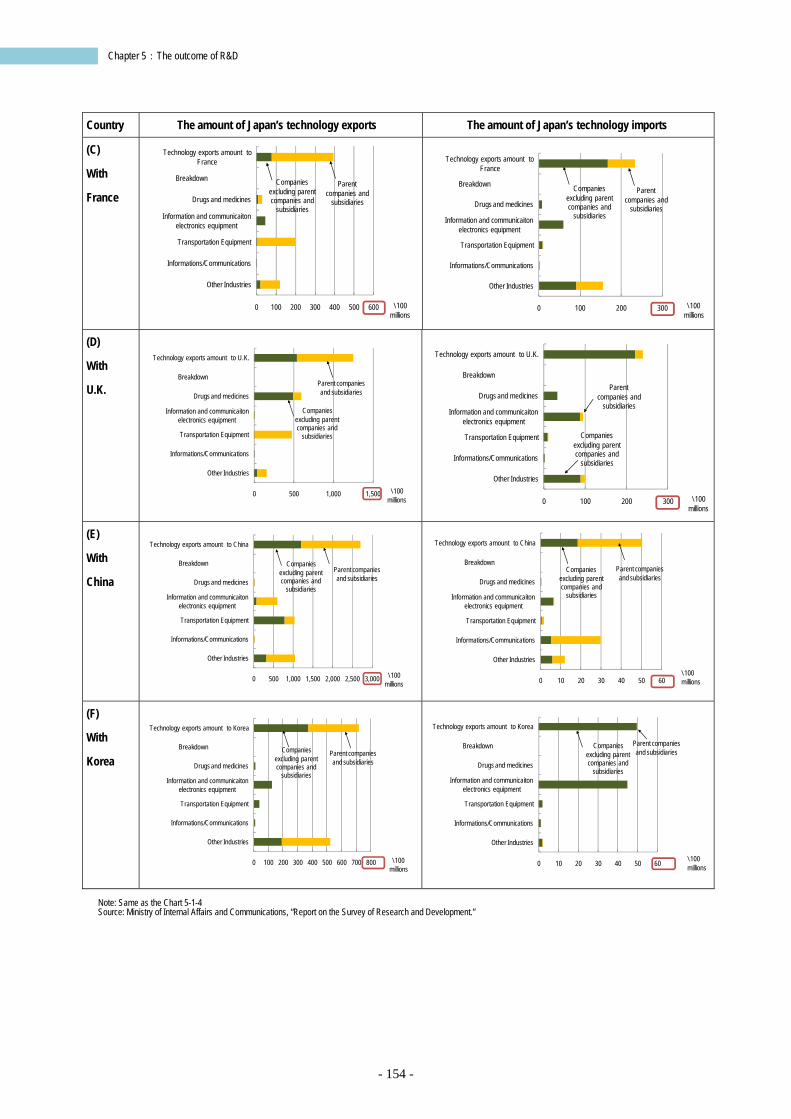
- 154 -
Chapter 5:The outcome of R&D
Country The amount of Japan’s technology exports The amount of Japan’s technology imports
(C)
With
France
(D)
With
U.K.
(E)
With
China
(F)
With
Korea
Note: Same as the Chart 5-1-4 Source: Ministry of Internal Affairs and Communications, “Report on the Survey of Research and Development.”
Companies excluding parent companies and
subsidiaries
Parent companies and
subsidiaries
0 100 200 300 400 500 600
Other Industries
Informations/Communications
Transportation Equipment
Information and communicaiton electronics equipment
Drugs and medicines
Breakdown
Technology exports amount to France
\ 100 millions
Companies excluding parent companies and
subsidiaries
Parent companies and
subsidiaries
0 100 200 300
Other Industries
Informations/Communications
Transportation Equipment
Information and communicaiton electronics equipment
Drugs and medicines
Breakdown
Technology exports amount to France
\ 100 millions
Companies excluding parent companies and
subsidiaries
Parent companies and subsidiaries
0 500 1,000 1,500
Other Industries
Informations/Communications
Transportation Equipment
Information and communicaiton electronics equipment
Drugs and medicines
Breakdown
Technology exports amount to U.K.
\ 100 millions
Companies excluding parent companies and
subsidiaries
Parent companies and
subsidiaries
0 100 200 300
Other Industries
Informations/Communications
Transportation Equipment
Information and communicaiton electronics equipment
Drugs and medicines
Breakdown
Technology exports amount to U.K.
\ 100 millions
Companies excluding parent companies and
subsidiaries
Parent companies and subsidiaries
0 500 1,000 1,500 2,000 2,500 3,000
Other Industries
Informations/Communications
Transportation Equipment
Information and communicaiton electronics equipment
Drugs and medicines
Breakdown
Technology exports amount to China
\ 100 millions
Companies excluding parent companies and
subsidiaries
Parent companies and subsidiaries
0 10 20 30 40 50 60
Other Industries
Informations/Communications
Transportation Equipment
Information and communicaiton electronics equipment
Drugs and medicines
Breakdown
Technology exports amount to China
\ 100 millions
Companies excluding parent companies and
subsidiaries
Parent companies and subsidiaries
0 100 200 300 400 500 600 700 800
Other Industries
Informations/Communications
Transportation Equipment
Information and communicaiton electronics equipment
Drugs and medicines
Breakdown
Technology exports amount to Korea
\ 100 millions
Companies excluding parent companies and
subsidiaries
Parent companies and subsidiaries
0 10 20 30 40 50 60
Other Industries
Informations/Communications
Transportation Equipment
Information and communicaiton electronics equipment
Drugs and medicines
Breakdown
Technology exports amount to Korea
\ 100 millions
- 155 -
Chapter 5:The outcome of R&D
5.2 High-technology industry trade
Key Points ○The high-technology industry trade of the entire world increased by 70 percent in the past six years.
Especially, the “Radio, Television and Communication Equipment” industry was the largest, which ac-counted for about 40% of the total.
○Looking by country, the trade scale of U.S. was large and is tending to expand. However, China has in-creased its trade amount rapidly during recent years and to the value of its exports has surpassed that of U.S. The trade amount of Germany has also rapidly expanded. Japan has followed it, and is in fourth place.
○The trade balance of Japan’s high-technology industry had an export surplus of over 3 in the early 1990s. After that, the trade balance tended to decrease and it was an export surplus of over 1.3 in 2008. Korea has been on an upward trend in recent years and passed Japan in 2003. China’s 2008 figure was even with Japan’s at 1.3. Europe has moved around 1 since 1990s, and U.S. has shifted to less than 1 since 2000, which means it now has an import surplus.
○Looking at it by field, the “Radio, Television and Communication Equipment” industry showed a large ratio, and particularly the amount of the imports and the exports of China have been larger than those of U.S. in recent years.
○The “Radio, Television and Communication Equipment” industry and the “Medical, Precision and Optical Instruments” industry of Japan have an export surplus. The “Aircraft and Spacecraft” industry of U.S. has an export surplus, and the “Pharmaceuticals,” “Medical, Precision and Optical Instruments” and “Air-craft and Spacecraft” industries of Germany have an export surplus.
The trade amount of the high-technology industry
is not the direct data of knowledge in science and technology like the technology trade, but is an indi-rect indicator of the knowledge which has been turned to practical use in product development. High-technology industry referred to herein follows the classifications found in the OECD statistics: “Pharmaceuticals”, “Office, Accounting and Com-puting Machinery”, “Radio, Television and Com-munication Equipment”, “Medical, Precision and Optical Instruments”, and “Aircraft and Spacecraft”.
In Chart 5-2-1, regarding 30 OECD mem-ber-countries and 17 Non-OECD countries and re-gions (3), the change in the total amount of the trade amount(4) (export amount and import amount) of high-technology industry is shown. This can be considered as the high-technology trade of the entire world. In this, the “Radio, Television and Com-
(3) Algeria, Brazil, Chile, China, Estonia, Hong Kong, India, Indonesia, Israel, Malaysia, the Philippines, Russia, Singapore, Slovenia, Thailand, Taiwan, and South Africa (4) Summed up the amount which each country trades with other coun-tries.
munication Equipment” is the largest. The ratio in the total is also large; however, it has been tending to decrease compared with 2000. On the other hand, “Pharmaceuticals” and “Medical, Precision and Optical Instruments” have been tending to increase. Chart 5-2-2 shows the change in the trade balance of the entire high-technology industry. Japan’s trade balance is large, however, it has been tending to decrease in the long run since its peak in 1984. And it was overtaken by Korea in 2003. In 2008, Chi-na’s trade balance pulled even with Japan’s at 1.3. The trade balance of U.S., Germany, France and U.K. has been fluctuating around 1.
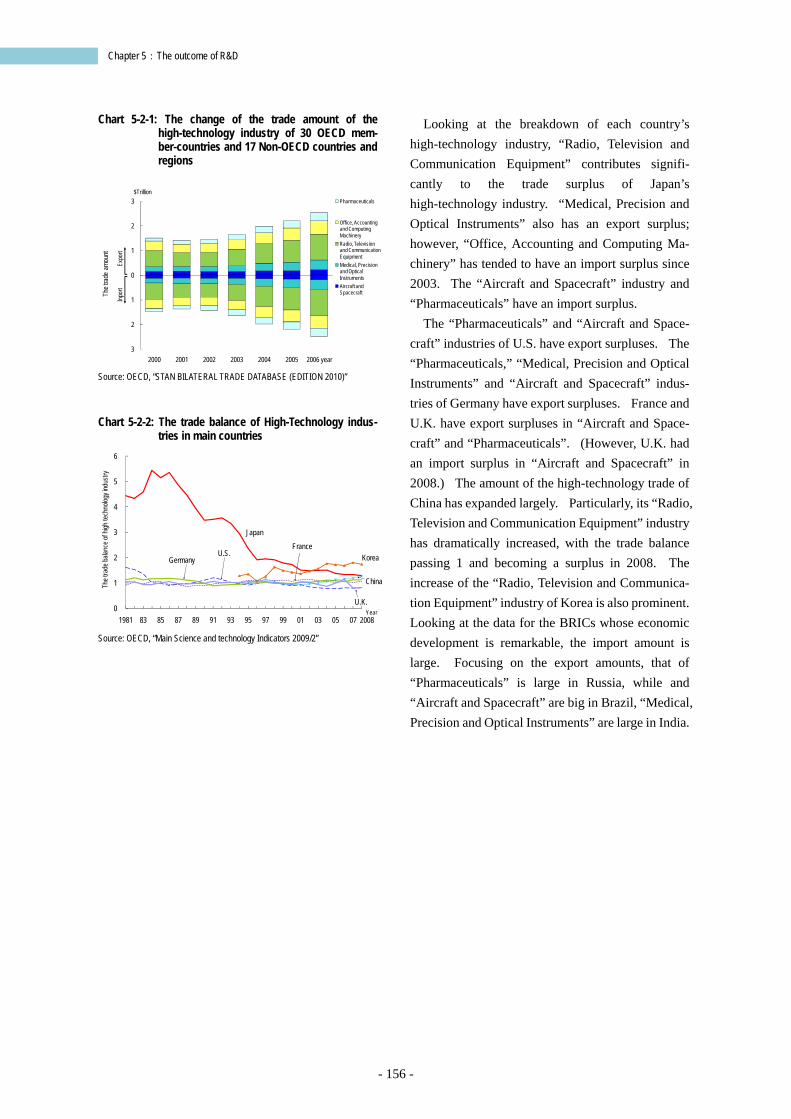
- 156 -
Chapter 5:The outcome of R&D
Chart 5-2-1: The change of the trade amount of the high-technology industry of 30 OECD mem-ber-countries and 17 Non-OECD countries and regions
Source: OECD, “STAN BILATERAL TRADE DATABASE (EDITION 2010)”
Chart 5-2-2: The trade balance of High-Technology indus-
tries in main countries
Source: OECD, “Main Science and technology Indicators 2009/2”
Looking at the breakdown of each country’s high-technology industry, “Radio, Television and Communication Equipment” contributes signifi-cantly to the trade surplus of Japan’s high-technology industry. “Medical, Precision and Optical Instruments” also has an export surplus; however, “Office, Accounting and Computing Ma-chinery” has tended to have an import surplus since 2003. The “Aircraft and Spacecraft” industry and “Pharmaceuticals” have an import surplus.
The “Pharmaceuticals” and “Aircraft and Space-craft” industries of U.S. have export surpluses. The “Pharmaceuticals,” “Medical, Precision and Optical Instruments” and “Aircraft and Spacecraft” indus-tries of Germany have export surpluses. France and U.K. have export surpluses in “Aircraft and Space-craft” and “Pharmaceuticals”. (However, U.K. had an import surplus in “Aircraft and Spacecraft” in 2008.) The amount of the high-technology trade of China has expanded largely. Particularly, its “Radio, Television and Communication Equipment” industry has dramatically increased, with the trade balance passing 1 and becoming a surplus in 2008. The increase of the “Radio, Television and Communica-tion Equipment” industry of Korea is also prominent. Looking at the data for the BRICs whose economic development is remarkable, the import amount is large. Focusing on the export amounts, that of “Pharmaceuticals” is large in Russia, while and “Aircraft and Spacecraft” are big in Brazil, “Medical, Precision and Optical Instruments” are large in India.
3
2
1
0
1
2
3
2000 2001 2002 2003 2004 2005 2006 year
The t
rade
amo
unt
Pharmaceuticals
Office, Accounting and Computing MachineryRadio, Television and Communication EquipmentMedical, Precision and Optical InstrumentsAircraft and Spacecraft
$Trillion
Expo
rtIn
port
China
0
1
2
3
4
5
6
1981 83 85 87 89 91 93 95 97 99 01 03 05 07
The t
rade
balan
ce of
high
tech
nolog
y ind
ustry
2008
Japan
FranceU.S.
U.K.
Germany Korea
Year
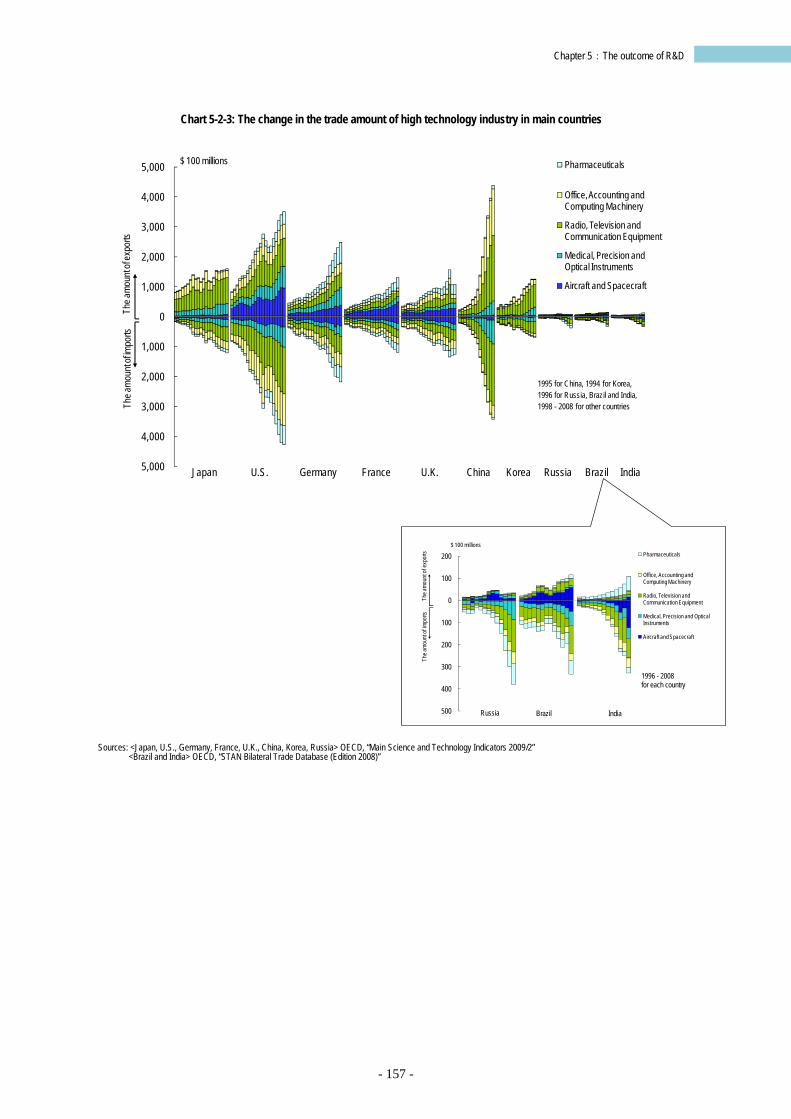
- 157 -
Chapter 5:The outcome of R&D
Chart 5-2-3: The change in the trade amount of high technology industry in main countries
Sources: <Japan, U.S., Germany, France, U.K., China, Korea, Russia> OECD, “Main Science and Technology Indicators 2009/2”
<Brazil and India> OECD, “STAN Bilateral Trade Database (Edition 2008)”
5,000
4,000
3,000
2,000
1,000
0
1,000
2,000
3,000
4,000
5,000 Pharmaceuticals
Office, Accounting and Computing Machinery
Radio, Television and Communication Equipment
Medical, Precision and Optical Instruments
Aircraft and Spacecraft
The a
moun
t of e
xpor
tsTh
e amo
unt o
f impo
rts
$ 100 millions
1995 for China, 1994 for Korea, 1996 for Russia, Brazil and India, 1998 - 2008 for other countries
Japan Germany France U.K. KoreaU.S. China Russia Brazil India
500
400
300
200
100
0
100
200 Pharmaceuticals
Office, Accounting and Computing Machinery
Radio, Television and Communication Equipment
Medical, Precision and Optical Instruments
Aircraft and Spacecraft
$ 100 millions
1996 - 2008 for each country
Russia Brazil India
The a
moun
t of e
xpor
tsTh
e amo
unt o
f impo
rts
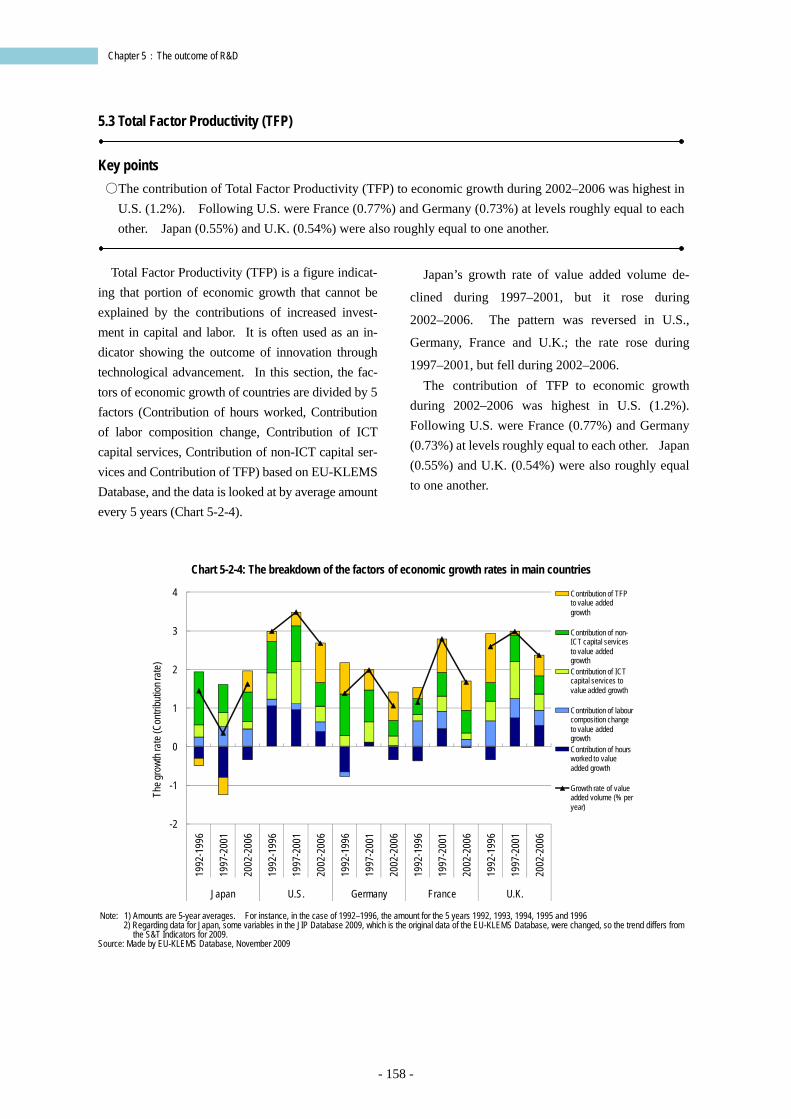
- 158 -
Chapter 5:The outcome of R&D
5.3 Total Factor Productivity (TFP)
Key points ○The contribution of Total Factor Productivity (TFP) to economic growth during 2002–2006 was highest in
U.S. (1.2%). Following U.S. were France (0.77%) and Germany (0.73%) at levels roughly equal to each other. Japan (0.55%) and U.K. (0.54%) were also roughly equal to one another.
Total Factor Productivity (TFP) is a figure indicat-
ing that portion of economic growth that cannot be explained by the contributions of increased invest-ment in capital and labor. It is often used as an in-dicator showing the outcome of innovation through technological advancement. In this section, the fac-tors of economic growth of countries are divided by 5 factors (Contribution of hours worked, Contribution of labor composition change, Contribution of ICT capital services, Contribution of non-ICT capital ser-vices and Contribution of TFP) based on EU-KLEMS Database, and the data is looked at by average amount every 5 years (Chart 5-2-4).
Japan’s growth rate of value added volume de-
clined during 1997–2001, but it rose during
2002–2006. The pattern was reversed in U.S.,
Germany, France and U.K.; the rate rose during
1997–2001, but fell during 2002–2006. The contribution of TFP to economic growth
during 2002–2006 was highest in U.S. (1.2%). Following U.S. were France (0.77%) and Germany (0.73%) at levels roughly equal to each other. Japan (0.55%) and U.K. (0.54%) were also roughly equal to one another.
Chart 5-2-4: The breakdown of the factors of economic growth rates in main countries
Note: 1) Amounts are 5-year averages. For instance, in the case of 1992–1996, the amount for the 5 years 1992, 1993, 1994, 1995 and 1996
2) Regarding data for Japan, some variables in the JIP Database 2009, which is the original data of the EU-KLEMS Database, were changed, so the trend differs from the S&T Indicators for 2009.
Source: Made by EU-KLEMS Database, November 2009
-2
-1
0
1
2
3
4
1992
-199
6
1997
-200
1
2002
-200
6
1992
-199
6
1997
-200
1
2002
-200
6
1992
-199
6
1997
-200
1
2002
-200
6
1992
-199
6
1997
-200
1
2002
-200
6
1992
-199
6
1997
-200
1
2002
-200
6
Japan U.S. Germany France U.K.
The g
rowt
h rat
e (Co
ntrib
ution
rate
)
Contribution of TFP to value added growth
Contribution of non-ICT capital services to value added growthContribution of ICT capital services to value added growth
Contribution of labour composition change to value added growthContribution of hours worked to value added growth
Growth rate of value added volume (% per year)

Reference materials

- 159 -
Reference Materials:Indicators for the regions
Reference Materials: Indicators for the regions
Here, regarding the following 7 items representing the situation of the output of scientific technology activities, the distributions or the changes in the values for the prefecture of Japan indicated are given.
1. The number of graduate students in national, public and private Universities and Colleges 2. The number of papers (all fields) 3. The number of papers (the field of Life sciences) 4. The number of papers (the field of Natural sciences and Engineering) 5. The balance of the papers between the field of Life sciences and the field of Natural sciences and
Engineering 6. The number of patent applications 7. The number of inventors
In making these charts, the methods of grouping by the prefecture were standardized as far as possible.
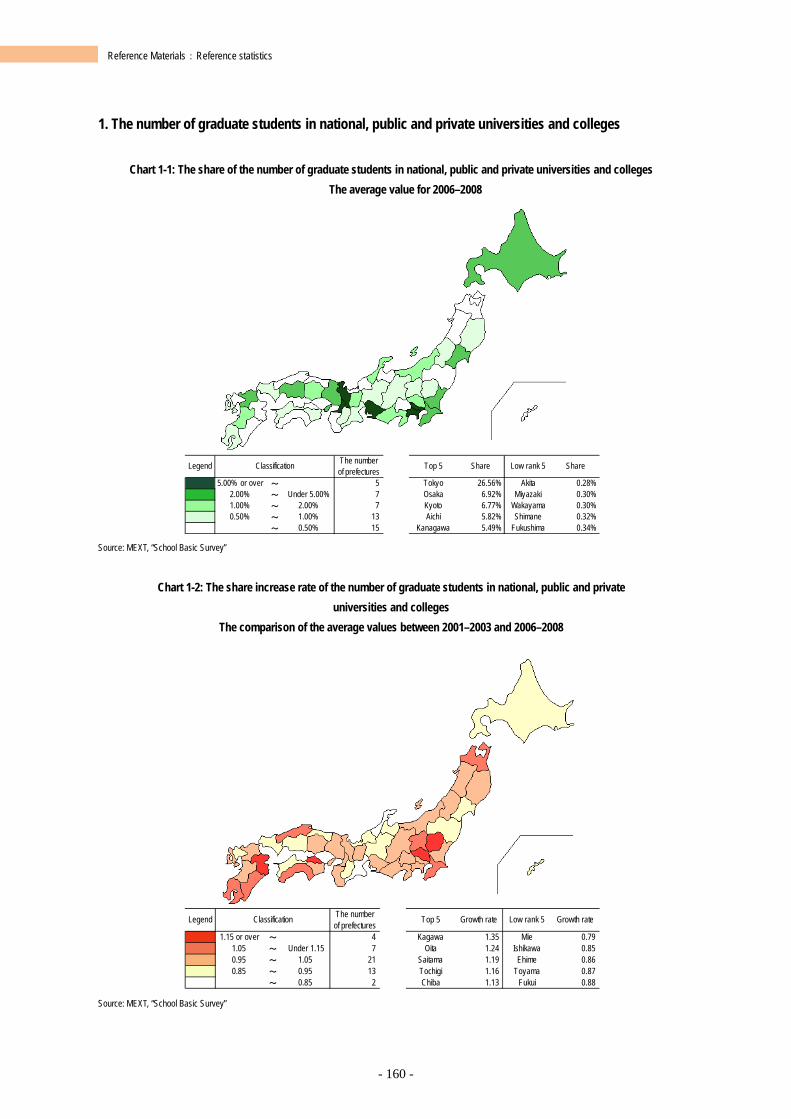
- 160 -
Reference Materials:Reference statistics
1. The number of graduate students in national, public and private universities and colleges
Chart 1-1: The share of the number of graduate students in national, public and private universities and colleges The average value for 2006–2008
Source: MEXT, “School Basic Survey”
Chart 1-2: The share increase rate of the number of graduate students in national, public and private
universities and colleges The comparison of the average values between 2001–2003 and 2006–2008
Source: MEXT, “School Basic Survey”
Legend The numberof prefectures Top 5 Share Low rank 5 Share
5.00% or over ~ 5 Tokyo 26.56% Akita 0.28%2.00% ~ Under 5.00% 7 Osaka 6.92% Miyazaki 0.30%1.00% ~ 2.00% 7 Kyoto 6.77% Wakayama 0.30%0.50% ~ 1.00% 13 Aichi 5.82% Shimane 0.32%
~ 0.50% 15 Kanagawa 5.49% Fukushima 0.34%
Classification
Legend The numberof prefectures Top 5 Growth rate Low rank 5 Growth rate
1.15 or over ~ 4 Kagawa 1.35 Mie 0.791.05 ~ Under 1.15 7 Oita 1.24 Ishikawa 0.850.95 ~ 1.05 21 Saitama 1.19 Ehime 0.860.85 ~ 0.95 13 Tochigi 1.16 Toyama 0.87
~ 0.85 2 Chiba 1.13 Fukui 0.88
Classification
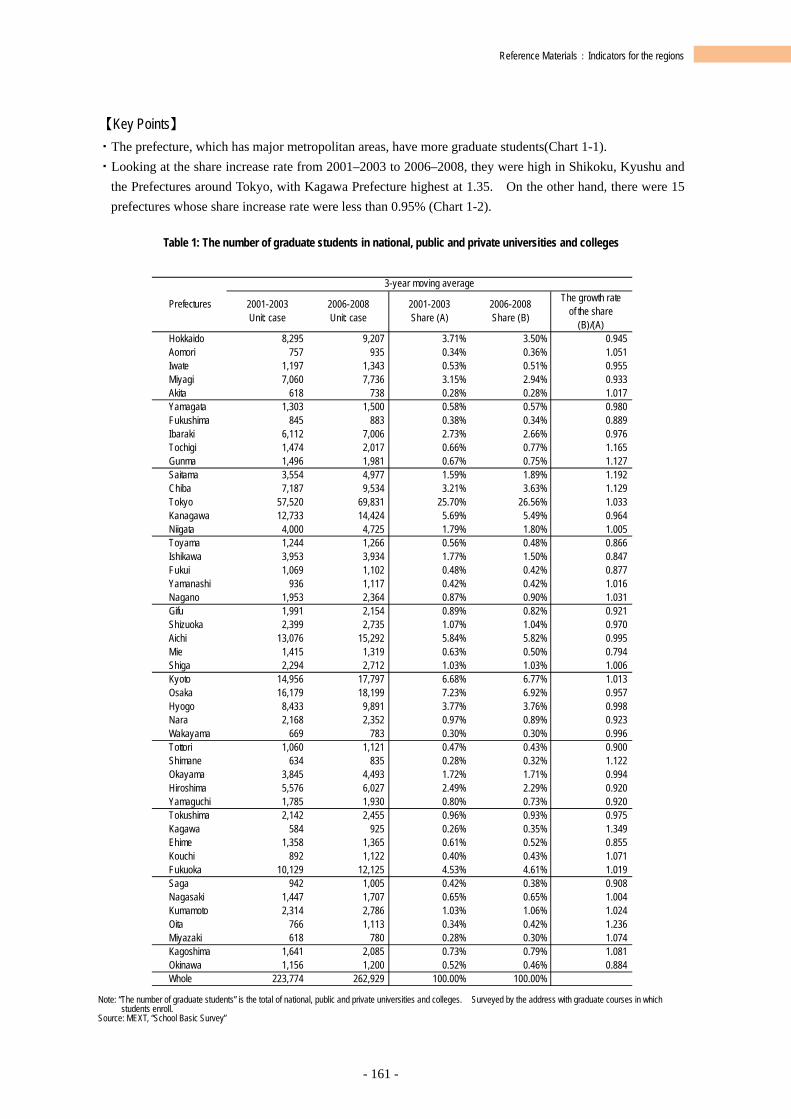
- 161 -
Reference Materials:Indicators for the regions
【Key Points】 ・The prefecture, which has major metropolitan areas, have more graduate students(Chart 1-1). ・Looking at the share increase rate from 2001–2003 to 2006–2008, they were high in Shikoku, Kyushu and
the Prefectures around Tokyo, with Kagawa Prefecture highest at 1.35. On the other hand, there were 15 prefectures whose share increase rate were less than 0.95% (Chart 1-2).
Table 1: The number of graduate students in national, public and private universities and colleges
Note: “The number of graduate students” is the total of national, public and private universities and colleges. Surveyed by the address with graduate courses in which students enroll.
Source: MEXT, “School Basic Survey”
2001-2003Unit: case
2006-2008Unit: case
2001-2003Share (A)
2006-2008Share (B)
The growth rateof the share
(B)/(A)Hokkaido 8,295 9,207 3.71% 3.50% 0.945Aomori 757 935 0.34% 0.36% 1.051Iwate 1,197 1,343 0.53% 0.51% 0.955Miyagi 7,060 7,736 3.15% 2.94% 0.933Akita 618 738 0.28% 0.28% 1.017Yamagata 1,303 1,500 0.58% 0.57% 0.980Fukushima 845 883 0.38% 0.34% 0.889Ibaraki 6,112 7,006 2.73% 2.66% 0.976Tochigi 1,474 2,017 0.66% 0.77% 1.165Gunma 1,496 1,981 0.67% 0.75% 1.127Saitama 3,554 4,977 1.59% 1.89% 1.192Chiba 7,187 9,534 3.21% 3.63% 1.129Tokyo 57,520 69,831 25.70% 26.56% 1.033Kanagawa 12,733 14,424 5.69% 5.49% 0.964Niigata 4,000 4,725 1.79% 1.80% 1.005Toyama 1,244 1,266 0.56% 0.48% 0.866Ishikawa 3,953 3,934 1.77% 1.50% 0.847Fukui 1,069 1,102 0.48% 0.42% 0.877Yamanashi 936 1,117 0.42% 0.42% 1.016Nagano 1,953 2,364 0.87% 0.90% 1.031Gifu 1,991 2,154 0.89% 0.82% 0.921Shizuoka 2,399 2,735 1.07% 1.04% 0.970Aichi 13,076 15,292 5.84% 5.82% 0.995Mie 1,415 1,319 0.63% 0.50% 0.794Shiga 2,294 2,712 1.03% 1.03% 1.006Kyoto 14,956 17,797 6.68% 6.77% 1.013Osaka 16,179 18,199 7.23% 6.92% 0.957Hyogo 8,433 9,891 3.77% 3.76% 0.998Nara 2,168 2,352 0.97% 0.89% 0.923Wakayama 669 783 0.30% 0.30% 0.996Tottori 1,060 1,121 0.47% 0.43% 0.900Shimane 634 835 0.28% 0.32% 1.122Okayama 3,845 4,493 1.72% 1.71% 0.994Hiroshima 5,576 6,027 2.49% 2.29% 0.920Yamaguchi 1,785 1,930 0.80% 0.73% 0.920Tokushima 2,142 2,455 0.96% 0.93% 0.975Kagawa 584 925 0.26% 0.35% 1.349Ehime 1,358 1,365 0.61% 0.52% 0.855Kouchi 892 1,122 0.40% 0.43% 1.071Fukuoka 10,129 12,125 4.53% 4.61% 1.019Saga 942 1,005 0.42% 0.38% 0.908Nagasaki 1,447 1,707 0.65% 0.65% 1.004Kumamoto 2,314 2,786 1.03% 1.06% 1.024Oita 766 1,113 0.34% 0.42% 1.236Miyazaki 618 780 0.28% 0.30% 1.074Kagoshima 1,641 2,085 0.73% 0.79% 1.081Okinawa 1,156 1,200 0.52% 0.46% 0.884Whole 223,774 262,929 100.00% 100.00%
Prefectures
3-year moving average
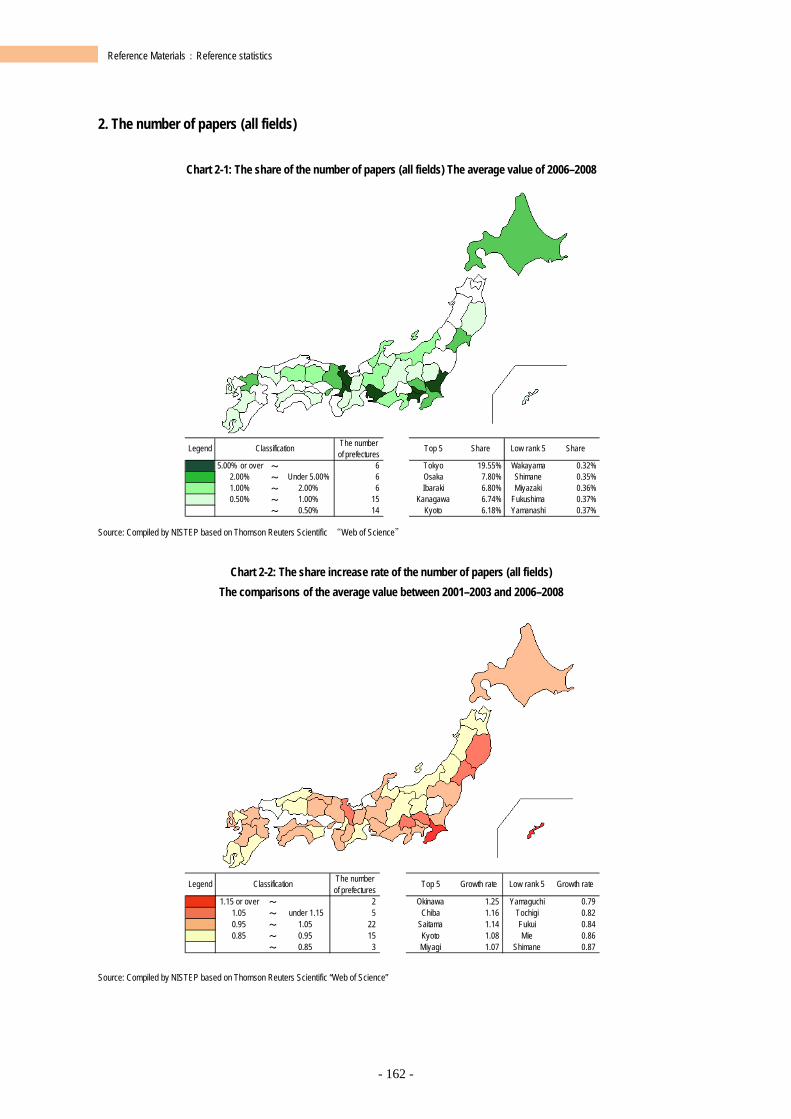
- 162 -
Reference Materials:Reference statistics
2. The number of papers (all fields)
Chart 2-1: The share of the number of papers (all fields) The average value of 2006–2008
Source: Compiled by NISTEP based on Thomson Reuters Scientific “Web of Science”
Chart 2-2: The share increase rate of the number of papers (all fields)
The comparisons of the average value between 2001–2003 and 2006–2008
Source: Compiled by NISTEP based on Thomson Reuters Scientific “Web of Science”
Legend The numberof prefectures
Top 5 Share Low rank 5 Share
5.00% or over ~ 6 Tokyo 19.55% Wakayama 0.32%2.00% ~ Under 5.00% 6 Osaka 7.80% Shimane 0.35%1.00% ~ 2.00% 6 Ibaraki 6.80% Miyazaki 0.36%0.50% ~ 1.00% 15 Kanagawa 6.74% Fukushima 0.37%
~ 0.50% 14 Kyoto 6.18% Yamanashi 0.37%
Classification
Legend The numberof prefectures
Top 5 Growth rate Low rank 5 Growth rate
1.15 or over ~ 2 Okinawa 1.25 Yamaguchi 0.791.05 ~ under 1.15 5 Chiba 1.16 Tochigi 0.820.95 ~ 1.05 22 Saitama 1.14 Fukui 0.840.85 ~ 0.95 15 Kyoto 1.08 Mie 0.86
~ 0.85 3 Miyagi 1.07 Shimane 0.87
Classification
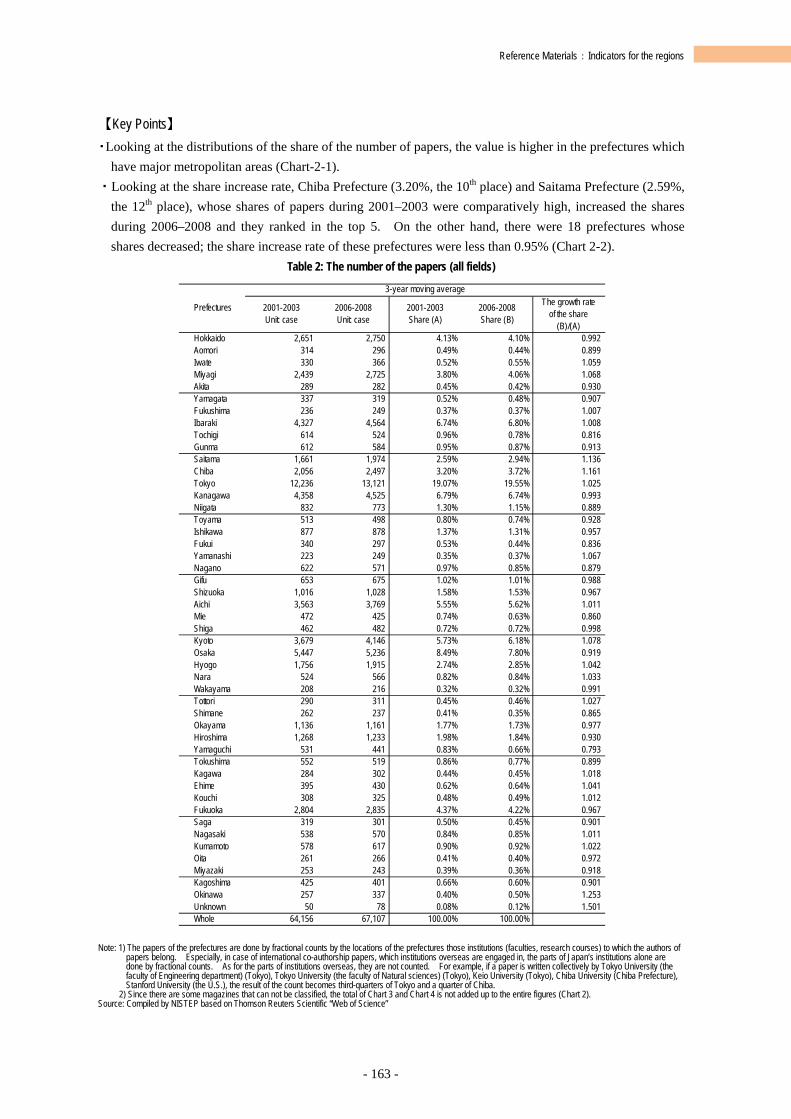
- 163 -
Reference Materials:Indicators for the regions
【Key Points】 ・Looking at the distributions of the share of the number of papers, the value is higher in the prefectures which
have major metropolitan areas (Chart-2-1). ・Looking at the share increase rate, Chiba Prefecture (3.20%, the 10th place) and Saitama Prefecture (2.59%,
the 12th place), whose shares of papers during 2001–2003 were comparatively high, increased the shares during 2006–2008 and they ranked in the top 5. On the other hand, there were 18 prefectures whose shares decreased; the share increase rate of these prefectures were less than 0.95% (Chart 2-2).
Table 2: The number of the papers (all fields)
Note: 1) The papers of the prefectures are done by fractional counts by the locations of the prefectures those institutions (faculties, research courses) to which the authors of
papers belong. Especially, in case of international co-authorship papers, which institutions overseas are engaged in, the parts of Japan’s institutions alone are done by fractional counts. As for the parts of institutions overseas, they are not counted. For example, if a paper is written collectively by Tokyo University (the faculty of Engineering department) (Tokyo), Tokyo University (the faculty of Natural sciences) (Tokyo), Keio University (Tokyo), Chiba University (Chiba Prefecture), Stanford University (the U.S.), the result of the count becomes third-quarters of Tokyo and a quarter of Chiba.
2) Since there are some magazines that can not be classified, the total of Chart 3 and Chart 4 is not added up to the entire figures (Chart 2). Source: Compiled by NISTEP based on Thomson Reuters Scientific “Web of Science”
2001-2003Unit: case
2006-2008Unit: case
2001-2003Share (A)
2006-2008Share (B)
The growth rate of the share
(B)/(A)Hokkaido 2,651 2,750 4.13% 4.10% 0.992Aomori 314 296 0.49% 0.44% 0.899Iwate 330 366 0.52% 0.55% 1.059Miyagi 2,439 2,725 3.80% 4.06% 1.068Akita 289 282 0.45% 0.42% 0.930Yamagata 337 319 0.52% 0.48% 0.907Fukushima 236 249 0.37% 0.37% 1.007Ibaraki 4,327 4,564 6.74% 6.80% 1.008Tochigi 614 524 0.96% 0.78% 0.816Gunma 612 584 0.95% 0.87% 0.913Saitama 1,661 1,974 2.59% 2.94% 1.136Chiba 2,056 2,497 3.20% 3.72% 1.161Tokyo 12,236 13,121 19.07% 19.55% 1.025Kanagawa 4,358 4,525 6.79% 6.74% 0.993Niigata 832 773 1.30% 1.15% 0.889Toyama 513 498 0.80% 0.74% 0.928Ishikawa 877 878 1.37% 1.31% 0.957Fukui 340 297 0.53% 0.44% 0.836Yamanashi 223 249 0.35% 0.37% 1.067Nagano 622 571 0.97% 0.85% 0.879Gifu 653 675 1.02% 1.01% 0.988Shizuoka 1,016 1,028 1.58% 1.53% 0.967Aichi 3,563 3,769 5.55% 5.62% 1.011Mie 472 425 0.74% 0.63% 0.860Shiga 462 482 0.72% 0.72% 0.998Kyoto 3,679 4,146 5.73% 6.18% 1.078Osaka 5,447 5,236 8.49% 7.80% 0.919Hyogo 1,756 1,915 2.74% 2.85% 1.042Nara 524 566 0.82% 0.84% 1.033Wakayama 208 216 0.32% 0.32% 0.991Tottori 290 311 0.45% 0.46% 1.027Shimane 262 237 0.41% 0.35% 0.865Okayama 1,136 1,161 1.77% 1.73% 0.977Hiroshima 1,268 1,233 1.98% 1.84% 0.930Yamaguchi 531 441 0.83% 0.66% 0.793Tokushima 552 519 0.86% 0.77% 0.899Kagawa 284 302 0.44% 0.45% 1.018Ehime 395 430 0.62% 0.64% 1.041Kouchi 308 325 0.48% 0.49% 1.012Fukuoka 2,804 2,835 4.37% 4.22% 0.967Saga 319 301 0.50% 0.45% 0.901Nagasaki 538 570 0.84% 0.85% 1.011Kumamoto 578 617 0.90% 0.92% 1.022Oita 261 266 0.41% 0.40% 0.972Miyazaki 253 243 0.39% 0.36% 0.918Kagoshima 425 401 0.66% 0.60% 0.901Okinawa 257 337 0.40% 0.50% 1.253Unknown 50 78 0.08% 0.12% 1.501Whole 64,156 67,107 100.00% 100.00%
Prefectures
3-year moving average
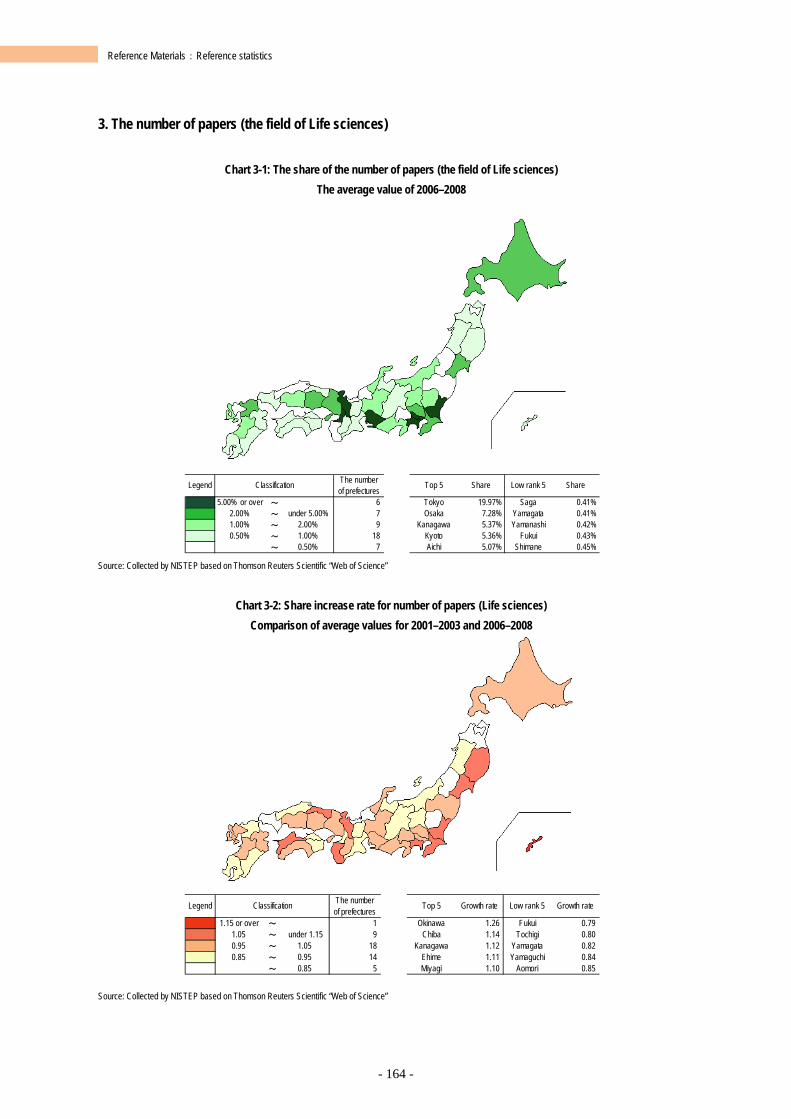
- 164 -
Reference Materials:Reference statistics
3. The number of papers (the field of Life sciences)
Chart 3-1: The share of the number of papers (the field of Life sciences) The average value of 2006–2008
Source: Collected by NISTEP based on Thomson Reuters Scientific “Web of Science”
Chart 3-2: Share increase rate for number of papers (Life sciences)
Comparison of average values for 2001–2003 and 2006–2008
Source: Collected by NISTEP based on Thomson Reuters Scientific “Web of Science”
Legend The numberof prefectures Top 5 Share Low rank 5 Share
5.00% or over ~ 6 Tokyo 19.97% Saga 0.41%2.00% ~ under 5.00% 7 Osaka 7.28% Yamagata 0.41%1.00% ~ 2.00% 9 Kanagawa 5.37% Yamanashi 0.42%0.50% ~ 1.00% 18 Kyoto 5.36% Fukui 0.43%
~ 0.50% 7 Aichi 5.07% Shimane 0.45%
Classification
Legend The numberof prefectures Top 5 Growth rate Low rank 5 Growth rate
1.15 or over ~ 1 Okinawa 1.26 Fukui 0.791.05 ~ under 1.15 9 Chiba 1.14 Tochigi 0.800.95 ~ 1.05 18 Kanagawa 1.12 Yamagata 0.820.85 ~ 0.95 14 Ehime 1.11 Yamaguchi 0.84
~ 0.85 5 Miyagi 1.10 Aomori 0.85
Classification
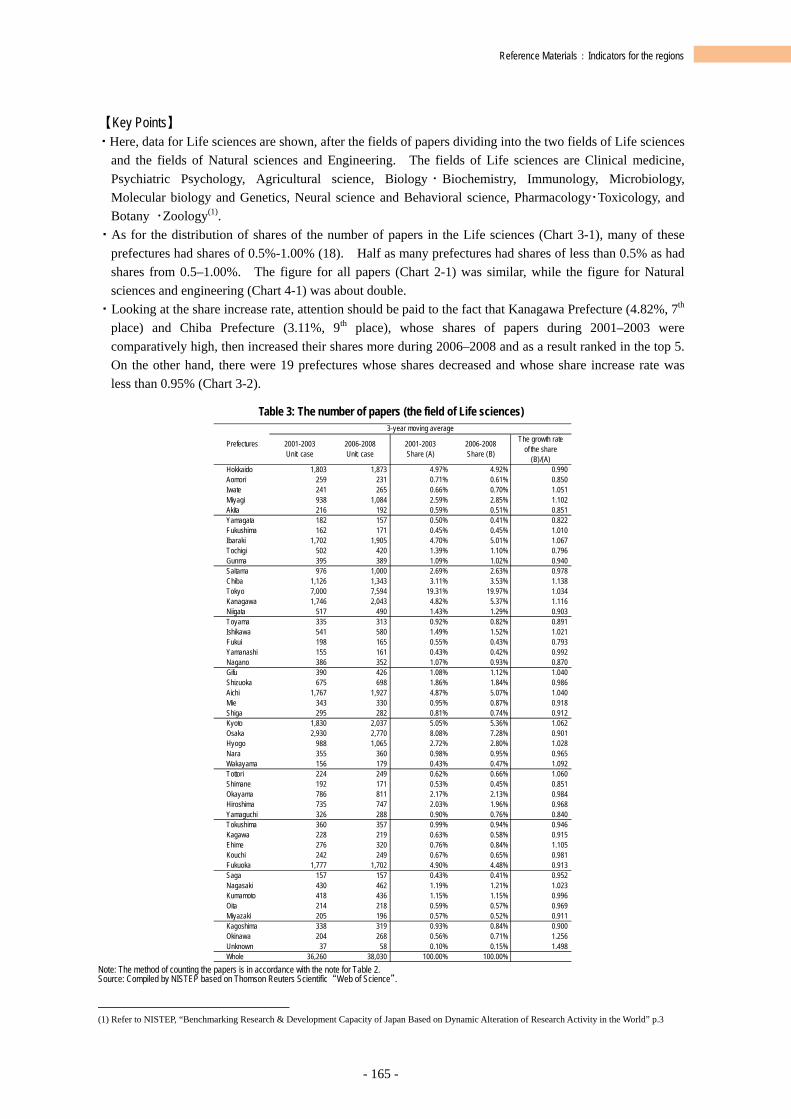
- 165 -
Reference Materials:Indicators for the regions
【Key Points】 ・Here, data for Life sciences are shown, after the fields of papers dividing into the two fields of Life sciences
and the fields of Natural sciences and Engineering. The fields of Life sciences are Clinical medicine, Psychiatric Psychology, Agricultural science, Biology ・ Biochemistry, Immunology, Microbiology, Molecular biology and Genetics, Neural science and Behavioral science, Pharmacology・Toxicology, and Botany ・Zoology(1).
・As for the distribution of shares of the number of papers in the Life sciences (Chart 3-1), many of these prefectures had shares of 0.5%-1.00% (18). Half as many prefectures had shares of less than 0.5% as had shares from 0.5–1.00%. The figure for all papers (Chart 2-1) was similar, while the figure for Natural sciences and engineering (Chart 4-1) was about double.
・Looking at the share increase rate, attention should be paid to the fact that Kanagawa Prefecture (4.82%, 7th place) and Chiba Prefecture (3.11%, 9th place), whose shares of papers during 2001–2003 were comparatively high, then increased their shares more during 2006–2008 and as a result ranked in the top 5. On the other hand, there were 19 prefectures whose shares decreased and whose share increase rate was less than 0.95% (Chart 3-2).
Table 3: The number of papers (the field of Life sciences)
Note: The method of counting the papers is in accordance with the note for Table 2. Source: Compiled by NISTEP based on Thomson Reuters Scientific “Web of Science”.
(1) Refer to NISTEP, “Benchmarking Research & Development Capacity of Japan Based on Dynamic Alteration of Research Activity in the World” p.3
2001-2003Unit: case
2006-2008Unit: case
2001-2003Share (A)
2006-2008Share (B)
The growth rate of the share
(B)/(A)Hokkaido 1,803 1,873 4.97% 4.92% 0.990Aomori 259 231 0.71% 0.61% 0.850Iwate 241 265 0.66% 0.70% 1.051Miyagi 938 1,084 2.59% 2.85% 1.102Akita 216 192 0.59% 0.51% 0.851Yamagata 182 157 0.50% 0.41% 0.822Fukushima 162 171 0.45% 0.45% 1.010Ibaraki 1,702 1,905 4.70% 5.01% 1.067Tochigi 502 420 1.39% 1.10% 0.796Gunma 395 389 1.09% 1.02% 0.940Saitama 976 1,000 2.69% 2.63% 0.978Chiba 1,126 1,343 3.11% 3.53% 1.138Tokyo 7,000 7,594 19.31% 19.97% 1.034Kanagawa 1,746 2,043 4.82% 5.37% 1.116Niigata 517 490 1.43% 1.29% 0.903Toyama 335 313 0.92% 0.82% 0.891Ishikawa 541 580 1.49% 1.52% 1.021Fukui 198 165 0.55% 0.43% 0.793Yamanashi 155 161 0.43% 0.42% 0.992Nagano 386 352 1.07% 0.93% 0.870Gifu 390 426 1.08% 1.12% 1.040Shizuoka 675 698 1.86% 1.84% 0.986Aichi 1,767 1,927 4.87% 5.07% 1.040Mie 343 330 0.95% 0.87% 0.918Shiga 295 282 0.81% 0.74% 0.912Kyoto 1,830 2,037 5.05% 5.36% 1.062Osaka 2,930 2,770 8.08% 7.28% 0.901Hyogo 988 1,065 2.72% 2.80% 1.028Nara 355 360 0.98% 0.95% 0.965Wakayama 156 179 0.43% 0.47% 1.092Tottori 224 249 0.62% 0.66% 1.060Shimane 192 171 0.53% 0.45% 0.851Okayama 786 811 2.17% 2.13% 0.984Hiroshima 735 747 2.03% 1.96% 0.968Yamaguchi 326 288 0.90% 0.76% 0.840Tokushima 360 357 0.99% 0.94% 0.946Kagawa 228 219 0.63% 0.58% 0.915Ehime 276 320 0.76% 0.84% 1.105Kouchi 242 249 0.67% 0.65% 0.981Fukuoka 1,777 1,702 4.90% 4.48% 0.913Saga 157 157 0.43% 0.41% 0.952Nagasaki 430 462 1.19% 1.21% 1.023Kumamoto 418 436 1.15% 1.15% 0.996Oita 214 218 0.59% 0.57% 0.969Miyazaki 205 196 0.57% 0.52% 0.911Kagoshima 338 319 0.93% 0.84% 0.900Okinawa 204 268 0.56% 0.71% 1.256Unknown 37 58 0.10% 0.15% 1.498Whole 36,260 38,030 100.00% 100.00%
Prefectures
3-year moving average
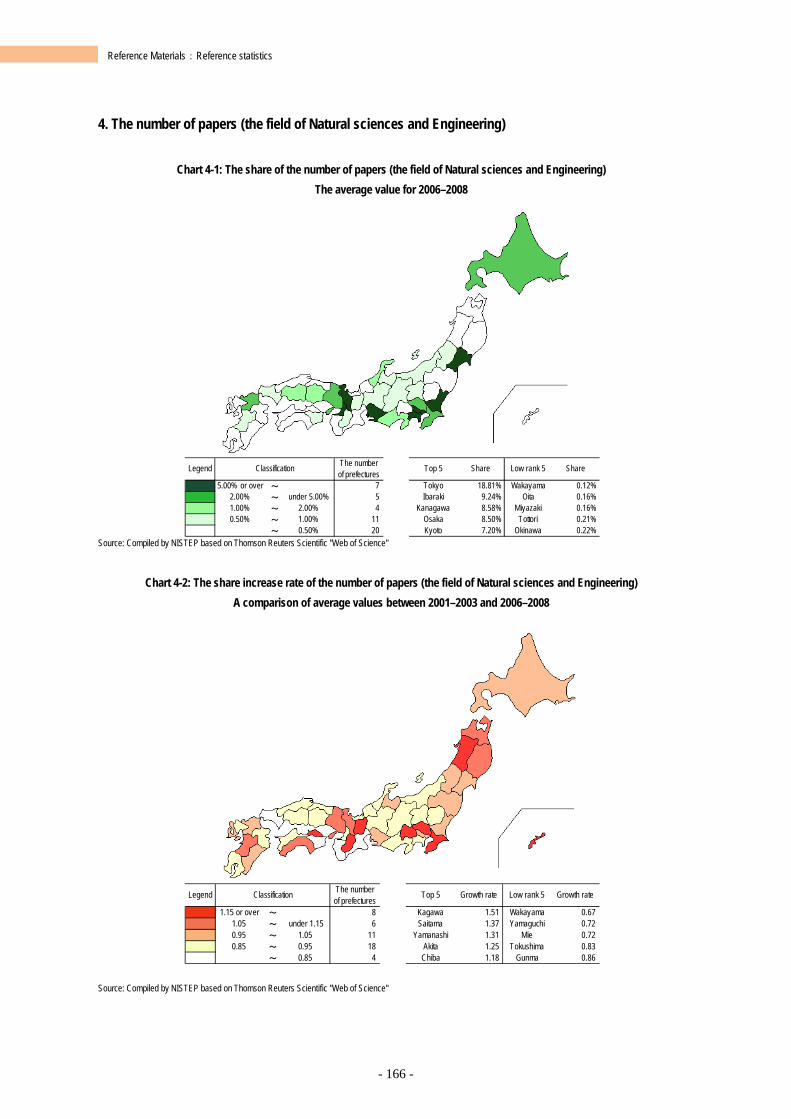
- 166 -
Reference Materials:Reference statistics
4. The number of papers (the field of Natural sciences and Engineering)
Chart 4-1: The share of the number of papers (the field of Natural sciences and Engineering) The average value for 2006–2008
Source: Compiled by NISTEP based on Thomson Reuters Scientific "Web of Science"
Chart 4-2: The share increase rate of the number of papers (the field of Natural sciences and Engineering)
A comparison of average values between 2001–2003 and 2006–2008
Source: Compiled by NISTEP based on Thomson Reuters Scientific "Web of Science"
Legend The numberof prefectures
Top 5 Share Low rank 5 Share
5.00% or over ~ 7 Tokyo 18.81% Wakayama 0.12%2.00% ~ under 5.00% 5 Ibaraki 9.24% Oita 0.16%1.00% ~ 2.00% 4 Kanagawa 8.58% Miyazaki 0.16%0.50% ~ 1.00% 11 Osaka 8.50% Tottori 0.21%
~ 0.50% 20 Kyoto 7.20% Okinawa 0.22%
Classification
Legend The numberof prefectures
Top 5 Growth rate Low rank 5 Growth rate
1.15 or over ~ 8 Kagawa 1.51 Wakayama 0.671.05 ~ under 1.15 6 Saitama 1.37 Yamaguchi 0.720.95 ~ 1.05 11 Yamanashi 1.31 Mie 0.720.85 ~ 0.95 18 Akita 1.25 Tokushima 0.83
~ 0.85 4 Chiba 1.18 Gunma 0.86
Classification
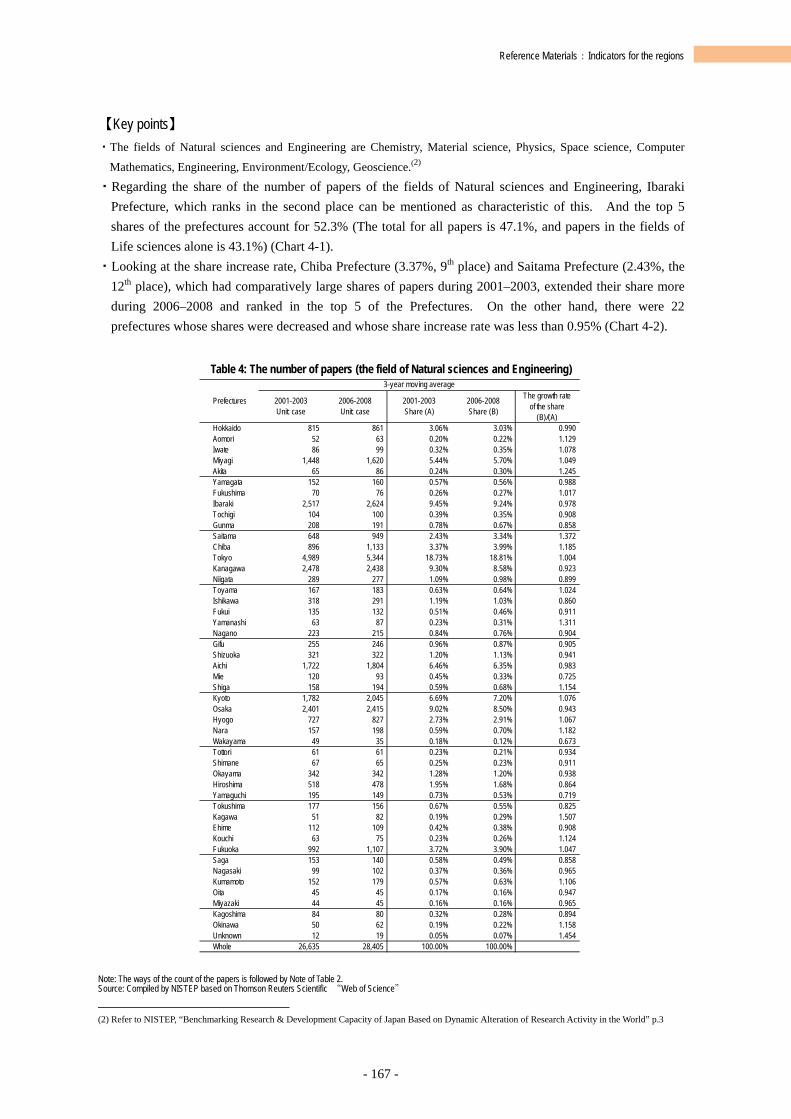
- 167 -
Reference Materials:Indicators for the regions
【Key points】 ・The fields of Natural sciences and Engineering are Chemistry, Material science, Physics, Space science, Computer
Mathematics, Engineering, Environment/Ecology, Geoscience.(2) ・Regarding the share of the number of papers of the fields of Natural sciences and Engineering, Ibaraki
Prefecture, which ranks in the second place can be mentioned as characteristic of this. And the top 5 shares of the prefectures account for 52.3% (The total for all papers is 47.1%, and papers in the fields of Life sciences alone is 43.1%) (Chart 4-1).
・Looking at the share increase rate, Chiba Prefecture (3.37%, 9th place) and Saitama Prefecture (2.43%, the 12th place), which had comparatively large shares of papers during 2001–2003, extended their share more during 2006–2008 and ranked in the top 5 of the Prefectures. On the other hand, there were 22 prefectures whose shares were decreased and whose share increase rate was less than 0.95% (Chart 4-2).
Table 4: The number of papers (the field of Natural sciences and Engineering)
Note: The ways of the count of the papers is followed by Note of Table 2. Source: Compiled by NISTEP based on Thomson Reuters Scientific “Web of Science”
(2) Refer to NISTEP, “Benchmarking Research & Development Capacity of Japan Based on Dynamic Alteration of Research Activity in the World” p.3
2001-2003Unit: case
2006-2008Unit: case
2001-2003Share (A)
2006-2008Share (B)
The growth rate of the share
(B)/(A)Hokkaido 815 861 3.06% 3.03% 0.990Aomori 52 63 0.20% 0.22% 1.129Iwate 86 99 0.32% 0.35% 1.078Miyagi 1,448 1,620 5.44% 5.70% 1.049Akita 65 86 0.24% 0.30% 1.245Yamagata 152 160 0.57% 0.56% 0.988Fukushima 70 76 0.26% 0.27% 1.017Ibaraki 2,517 2,624 9.45% 9.24% 0.978Tochigi 104 100 0.39% 0.35% 0.908Gunma 208 191 0.78% 0.67% 0.858Saitama 648 949 2.43% 3.34% 1.372Chiba 896 1,133 3.37% 3.99% 1.185Tokyo 4,989 5,344 18.73% 18.81% 1.004Kanagawa 2,478 2,438 9.30% 8.58% 0.923Niigata 289 277 1.09% 0.98% 0.899Toyama 167 183 0.63% 0.64% 1.024Ishikawa 318 291 1.19% 1.03% 0.860Fukui 135 132 0.51% 0.46% 0.911Yamanashi 63 87 0.23% 0.31% 1.311Nagano 223 215 0.84% 0.76% 0.904Gifu 255 246 0.96% 0.87% 0.905Shizuoka 321 322 1.20% 1.13% 0.941Aichi 1,722 1,804 6.46% 6.35% 0.983Mie 120 93 0.45% 0.33% 0.725Shiga 158 194 0.59% 0.68% 1.154Kyoto 1,782 2,045 6.69% 7.20% 1.076Osaka 2,401 2,415 9.02% 8.50% 0.943Hyogo 727 827 2.73% 2.91% 1.067Nara 157 198 0.59% 0.70% 1.182Wakayama 49 35 0.18% 0.12% 0.673Tottori 61 61 0.23% 0.21% 0.934Shimane 67 65 0.25% 0.23% 0.911Okayama 342 342 1.28% 1.20% 0.938Hiroshima 518 478 1.95% 1.68% 0.864Yamaguchi 195 149 0.73% 0.53% 0.719Tokushima 177 156 0.67% 0.55% 0.825Kagawa 51 82 0.19% 0.29% 1.507Ehime 112 109 0.42% 0.38% 0.908Kouchi 63 75 0.23% 0.26% 1.124Fukuoka 992 1,107 3.72% 3.90% 1.047Saga 153 140 0.58% 0.49% 0.858Nagasaki 99 102 0.37% 0.36% 0.965Kumamoto 152 179 0.57% 0.63% 1.106Oita 45 45 0.17% 0.16% 0.947Miyazaki 44 45 0.16% 0.16% 0.965Kagoshima 84 80 0.32% 0.28% 0.894Okinawa 50 62 0.19% 0.22% 1.158Unknown 12 19 0.05% 0.07% 1.454Whole 26,635 28,405 100.00% 100.00%
Prefectures
3-year moving average
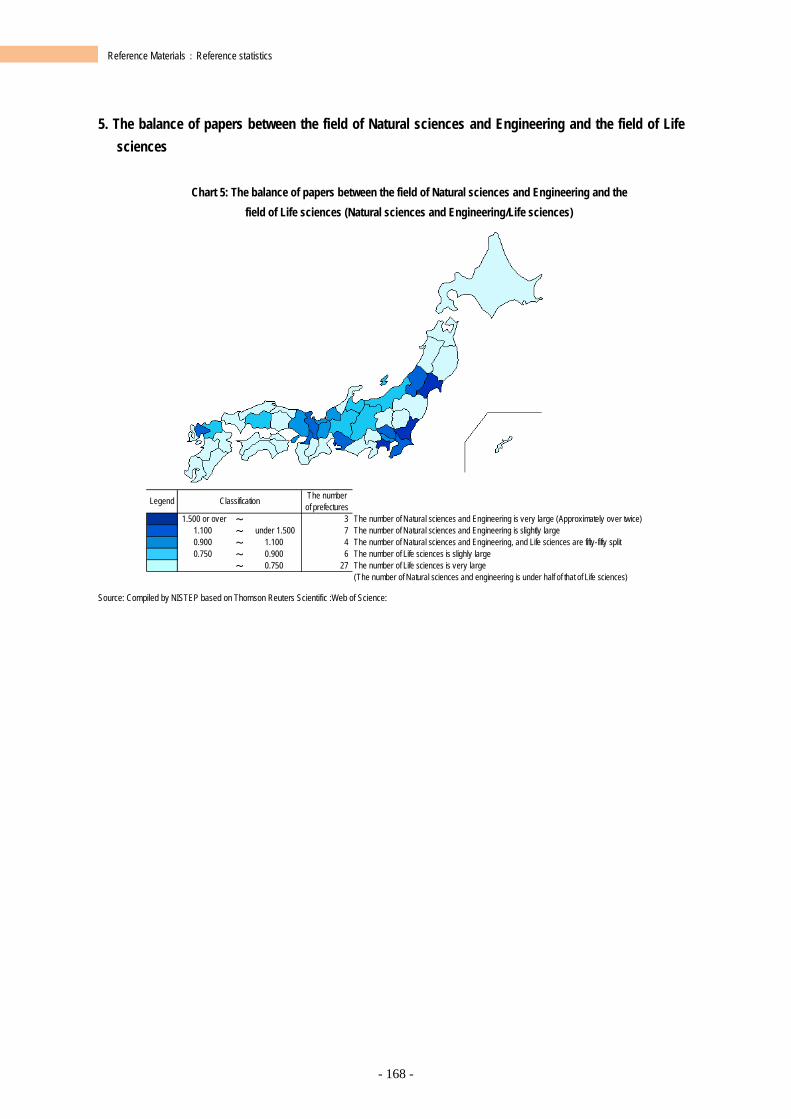
- 168 -
Reference Materials:Reference statistics
5. The balance of papers between the field of Natural sciences and Engineering and the field of Life sciences
Chart 5: The balance of papers between the field of Natural sciences and Engineering and the
field of Life sciences (Natural sciences and Engineering/Life sciences)
Source: Compiled by NISTEP based on Thomson Reuters Scientific :Web of Science:
Legend The number of prefectures
1.500 or over ~ 3 The number of Natural sciences and Engineering is very large (Approximately over twice) 1.100 ~ under 1.500 7 The number of Natural sciences and Engineering is slightly large0.900 ~ 1.100 4 The number of Natural sciences and Engineering, and Life sciences are fifty-fifty split0.750 ~ 0.900 6 The number of Life sciences is slighly large
~ 0.750 27 The number of Life sciences is very large(The number of Natural sciences and engineering is under half of that of Life sciences)
Classification
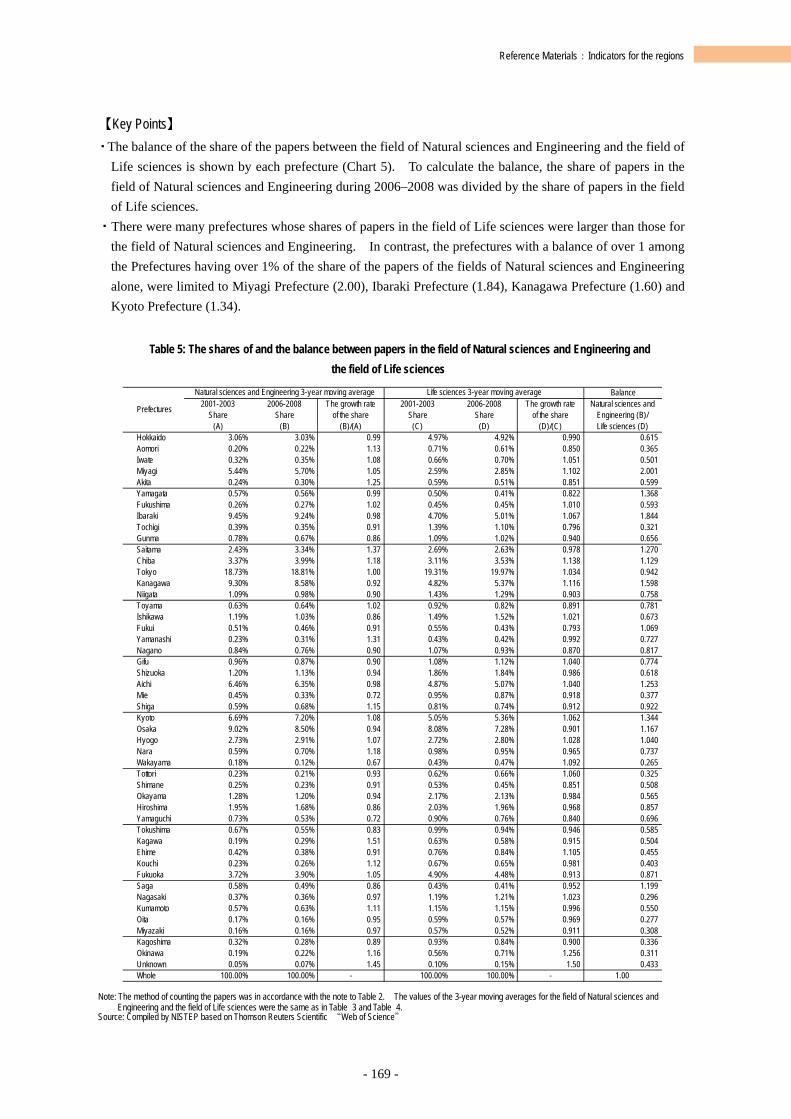
- 169 -
Reference Materials:Indicators for the regions
【Key Points】 ・The balance of the share of the papers between the field of Natural sciences and Engineering and the field of
Life sciences is shown by each prefecture (Chart 5). To calculate the balance, the share of papers in the field of Natural sciences and Engineering during 2006–2008 was divided by the share of papers in the field of Life sciences.
・There were many prefectures whose shares of papers in the field of Life sciences were larger than those for the field of Natural sciences and Engineering. In contrast, the prefectures with a balance of over 1 among the Prefectures having over 1% of the share of the papers of the fields of Natural sciences and Engineering alone, were limited to Miyagi Prefecture (2.00), Ibaraki Prefecture (1.84), Kanagawa Prefecture (1.60) and Kyoto Prefecture (1.34).
Table 5: The shares of and the balance between papers in the field of Natural sciences and Engineering and
the field of Life sciences
Note: The method of counting the papers was in accordance with the note to Table 2. The values of the 3-year moving averages for the field of Natural sciences and
Engineering and the field of Life sciences were the same as in Table 3 and Table 4. Source: Compiled by NISTEP based on Thomson Reuters Scientific “Web of Science”
Balance2001-2003
Share(A)
2006-2008Share
(B)
The growth rate of the share
(B)/(A)
2001-2003Share
(C)
2006-2008Share
(D)
The growth rate of the share
(D)/(C)
Natural sciences and Engineering (B)/Life sciences (D)
Hokkaido 3.06% 3.03% 0.99 4.97% 4.92% 0.990 0.615Aomori 0.20% 0.22% 1.13 0.71% 0.61% 0.850 0.365Iwate 0.32% 0.35% 1.08 0.66% 0.70% 1.051 0.501Miyagi 5.44% 5.70% 1.05 2.59% 2.85% 1.102 2.001Akita 0.24% 0.30% 1.25 0.59% 0.51% 0.851 0.599Yamagata 0.57% 0.56% 0.99 0.50% 0.41% 0.822 1.368Fukushima 0.26% 0.27% 1.02 0.45% 0.45% 1.010 0.593Ibaraki 9.45% 9.24% 0.98 4.70% 5.01% 1.067 1.844Tochigi 0.39% 0.35% 0.91 1.39% 1.10% 0.796 0.321Gunma 0.78% 0.67% 0.86 1.09% 1.02% 0.940 0.656Saitama 2.43% 3.34% 1.37 2.69% 2.63% 0.978 1.270Chiba 3.37% 3.99% 1.18 3.11% 3.53% 1.138 1.129Tokyo 18.73% 18.81% 1.00 19.31% 19.97% 1.034 0.942Kanagawa 9.30% 8.58% 0.92 4.82% 5.37% 1.116 1.598Niigata 1.09% 0.98% 0.90 1.43% 1.29% 0.903 0.758Toyama 0.63% 0.64% 1.02 0.92% 0.82% 0.891 0.781Ishikawa 1.19% 1.03% 0.86 1.49% 1.52% 1.021 0.673Fukui 0.51% 0.46% 0.91 0.55% 0.43% 0.793 1.069Yamanashi 0.23% 0.31% 1.31 0.43% 0.42% 0.992 0.727Nagano 0.84% 0.76% 0.90 1.07% 0.93% 0.870 0.817Gifu 0.96% 0.87% 0.90 1.08% 1.12% 1.040 0.774Shizuoka 1.20% 1.13% 0.94 1.86% 1.84% 0.986 0.618Aichi 6.46% 6.35% 0.98 4.87% 5.07% 1.040 1.253Mie 0.45% 0.33% 0.72 0.95% 0.87% 0.918 0.377Shiga 0.59% 0.68% 1.15 0.81% 0.74% 0.912 0.922Kyoto 6.69% 7.20% 1.08 5.05% 5.36% 1.062 1.344Osaka 9.02% 8.50% 0.94 8.08% 7.28% 0.901 1.167Hyogo 2.73% 2.91% 1.07 2.72% 2.80% 1.028 1.040Nara 0.59% 0.70% 1.18 0.98% 0.95% 0.965 0.737Wakayama 0.18% 0.12% 0.67 0.43% 0.47% 1.092 0.265Tottori 0.23% 0.21% 0.93 0.62% 0.66% 1.060 0.325Shimane 0.25% 0.23% 0.91 0.53% 0.45% 0.851 0.508Okayama 1.28% 1.20% 0.94 2.17% 2.13% 0.984 0.565Hiroshima 1.95% 1.68% 0.86 2.03% 1.96% 0.968 0.857Yamaguchi 0.73% 0.53% 0.72 0.90% 0.76% 0.840 0.696Tokushima 0.67% 0.55% 0.83 0.99% 0.94% 0.946 0.585Kagawa 0.19% 0.29% 1.51 0.63% 0.58% 0.915 0.504Ehime 0.42% 0.38% 0.91 0.76% 0.84% 1.105 0.455Kouchi 0.23% 0.26% 1.12 0.67% 0.65% 0.981 0.403Fukuoka 3.72% 3.90% 1.05 4.90% 4.48% 0.913 0.871Saga 0.58% 0.49% 0.86 0.43% 0.41% 0.952 1.199Nagasaki 0.37% 0.36% 0.97 1.19% 1.21% 1.023 0.296Kumamoto 0.57% 0.63% 1.11 1.15% 1.15% 0.996 0.550Oita 0.17% 0.16% 0.95 0.59% 0.57% 0.969 0.277Miyazaki 0.16% 0.16% 0.97 0.57% 0.52% 0.911 0.308Kagoshima 0.32% 0.28% 0.89 0.93% 0.84% 0.900 0.336Okinawa 0.19% 0.22% 1.16 0.56% 0.71% 1.256 0.311Unknown 0.05% 0.07% 1.45 0.10% 0.15% 1.50 0.433Whole 100.00% 100.00% - 100.00% 100.00% - 1.00
Life sciences 3-year moving averageNatural sciences and Engineering 3-year moving average
Prefectures
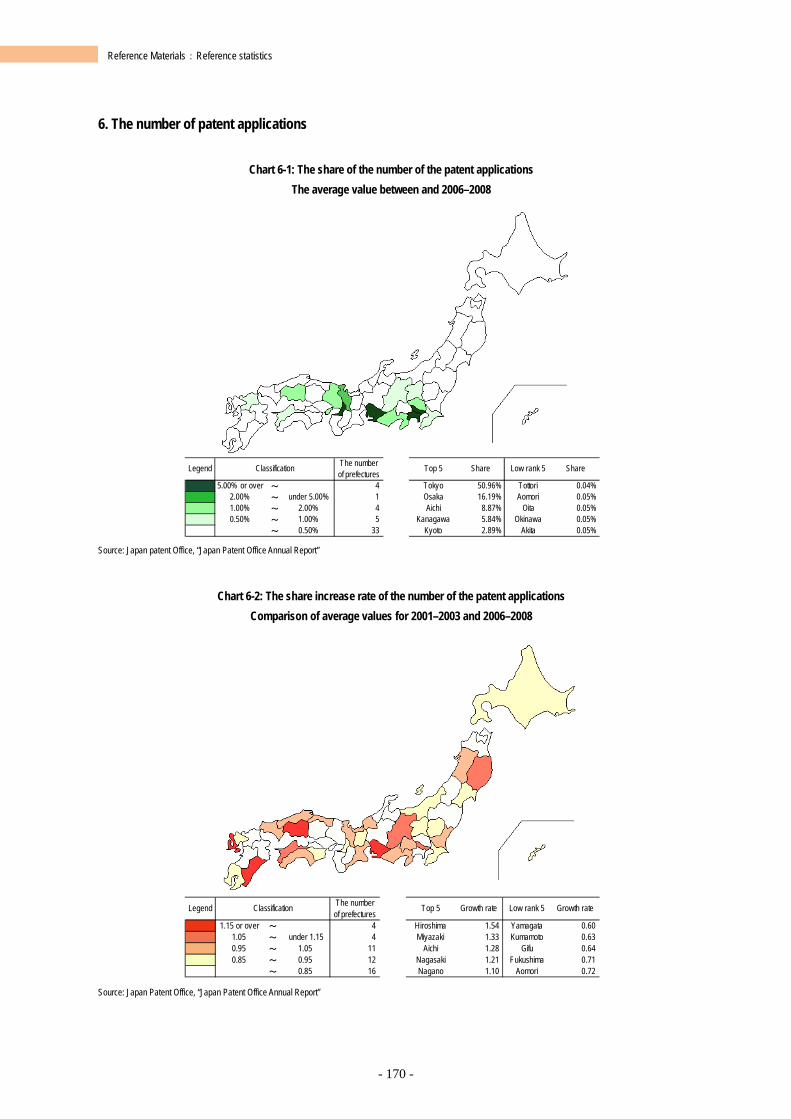
- 170 -
Reference Materials:Reference statistics
6. The number of patent applications
Chart 6-1: The share of the number of the patent applications The average value between and 2006–2008
Source: Japan patent Office, “Japan Patent Office Annual Report”
Chart 6-2: The share increase rate of the number of the patent applications Comparison of average values for 2001–2003 and 2006–2008
Source: Japan Patent Office, “Japan Patent Office Annual Report”
Legend The numberof prefectures
Top 5 Share Low rank 5 Share
5.00% or over ~ 4 Tokyo 50.96% Tottori 0.04%2.00% ~ under 5.00% 1 Osaka 16.19% Aomori 0.05%1.00% ~ 2.00% 4 Aichi 8.87% Oita 0.05%0.50% ~ 1.00% 5 Kanagawa 5.84% Okinawa 0.05%
~ 0.50% 33 Kyoto 2.89% Akita 0.05%
Classification
Legend The numberof prefectures
Top 5 Growth rate Low rank 5 Growth rate
1.15 or over ~ 4 Hiroshima 1.54 Yamagata 0.601.05 ~ under 1.15 4 Miyazaki 1.33 Kumamoto 0.630.95 ~ 1.05 11 Aichi 1.28 Gifu 0.640.85 ~ 0.95 12 Nagasaki 1.21 Fukushima 0.71
~ 0.85 16 Nagano 1.10 Aomori 0.72
Classification
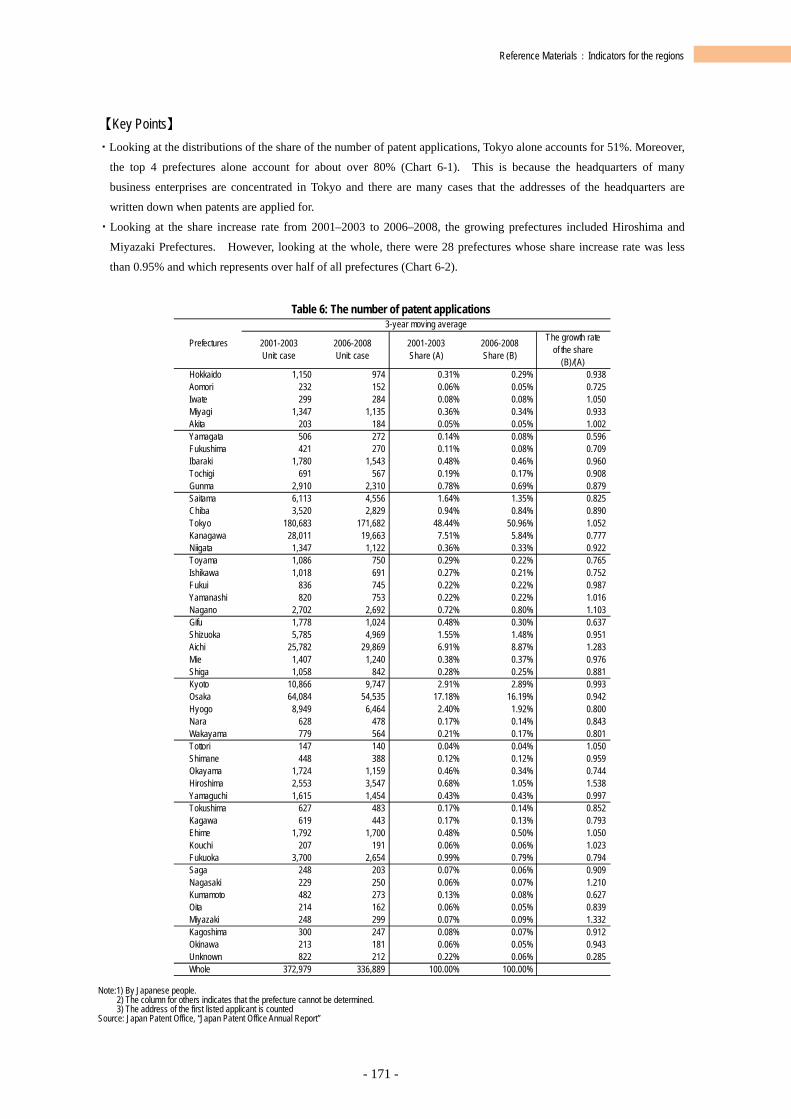
- 171 -
Reference Materials:Indicators for the regions
【Key Points】 ・Looking at the distributions of the share of the number of patent applications, Tokyo alone accounts for 51%. Moreover,
the top 4 prefectures alone account for about over 80% (Chart 6-1). This is because the headquarters of many
business enterprises are concentrated in Tokyo and there are many cases that the addresses of the headquarters are
written down when patents are applied for. ・Looking at the share increase rate from 2001–2003 to 2006–2008, the growing prefectures included Hiroshima and
Miyazaki Prefectures. However, looking at the whole, there were 28 prefectures whose share increase rate was less
than 0.95% and which represents over half of all prefectures (Chart 6-2).
Table 6: The number of patent applications
Note:1) By Japanese people.
2) The column for others indicates that the prefecture cannot be determined. 3) The address of the first listed applicant is counted
Source: Japan Patent Office, “Japan Patent Office Annual Report”
2001-2003Unit: case
2006-2008Unit: case
2001-2003Share (A)
2006-2008Share (B)
The growth rate of the share
(B)/(A)Hokkaido 1,150 974 0.31% 0.29% 0.938Aomori 232 152 0.06% 0.05% 0.725Iwate 299 284 0.08% 0.08% 1.050Miyagi 1,347 1,135 0.36% 0.34% 0.933Akita 203 184 0.05% 0.05% 1.002Yamagata 506 272 0.14% 0.08% 0.596Fukushima 421 270 0.11% 0.08% 0.709Ibaraki 1,780 1,543 0.48% 0.46% 0.960Tochigi 691 567 0.19% 0.17% 0.908Gunma 2,910 2,310 0.78% 0.69% 0.879Saitama 6,113 4,556 1.64% 1.35% 0.825Chiba 3,520 2,829 0.94% 0.84% 0.890Tokyo 180,683 171,682 48.44% 50.96% 1.052Kanagawa 28,011 19,663 7.51% 5.84% 0.777Niigata 1,347 1,122 0.36% 0.33% 0.922Toyama 1,086 750 0.29% 0.22% 0.765Ishikawa 1,018 691 0.27% 0.21% 0.752Fukui 836 745 0.22% 0.22% 0.987Yamanashi 820 753 0.22% 0.22% 1.016Nagano 2,702 2,692 0.72% 0.80% 1.103Gifu 1,778 1,024 0.48% 0.30% 0.637Shizuoka 5,785 4,969 1.55% 1.48% 0.951Aichi 25,782 29,869 6.91% 8.87% 1.283Mie 1,407 1,240 0.38% 0.37% 0.976Shiga 1,058 842 0.28% 0.25% 0.881Kyoto 10,866 9,747 2.91% 2.89% 0.993Osaka 64,084 54,535 17.18% 16.19% 0.942Hyogo 8,949 6,464 2.40% 1.92% 0.800Nara 628 478 0.17% 0.14% 0.843Wakayama 779 564 0.21% 0.17% 0.801Tottori 147 140 0.04% 0.04% 1.050Shimane 448 388 0.12% 0.12% 0.959Okayama 1,724 1,159 0.46% 0.34% 0.744Hiroshima 2,553 3,547 0.68% 1.05% 1.538Yamaguchi 1,615 1,454 0.43% 0.43% 0.997Tokushima 627 483 0.17% 0.14% 0.852Kagawa 619 443 0.17% 0.13% 0.793Ehime 1,792 1,700 0.48% 0.50% 1.050Kouchi 207 191 0.06% 0.06% 1.023Fukuoka 3,700 2,654 0.99% 0.79% 0.794Saga 248 203 0.07% 0.06% 0.909Nagasaki 229 250 0.06% 0.07% 1.210Kumamoto 482 273 0.13% 0.08% 0.627Oita 214 162 0.06% 0.05% 0.839Miyazaki 248 299 0.07% 0.09% 1.332Kagoshima 300 247 0.08% 0.07% 0.912Okinawa 213 181 0.06% 0.05% 0.943Unknown 822 212 0.22% 0.06% 0.285Whole 372,979 336,889 100.00% 100.00%
Prefectures
3-year moving average
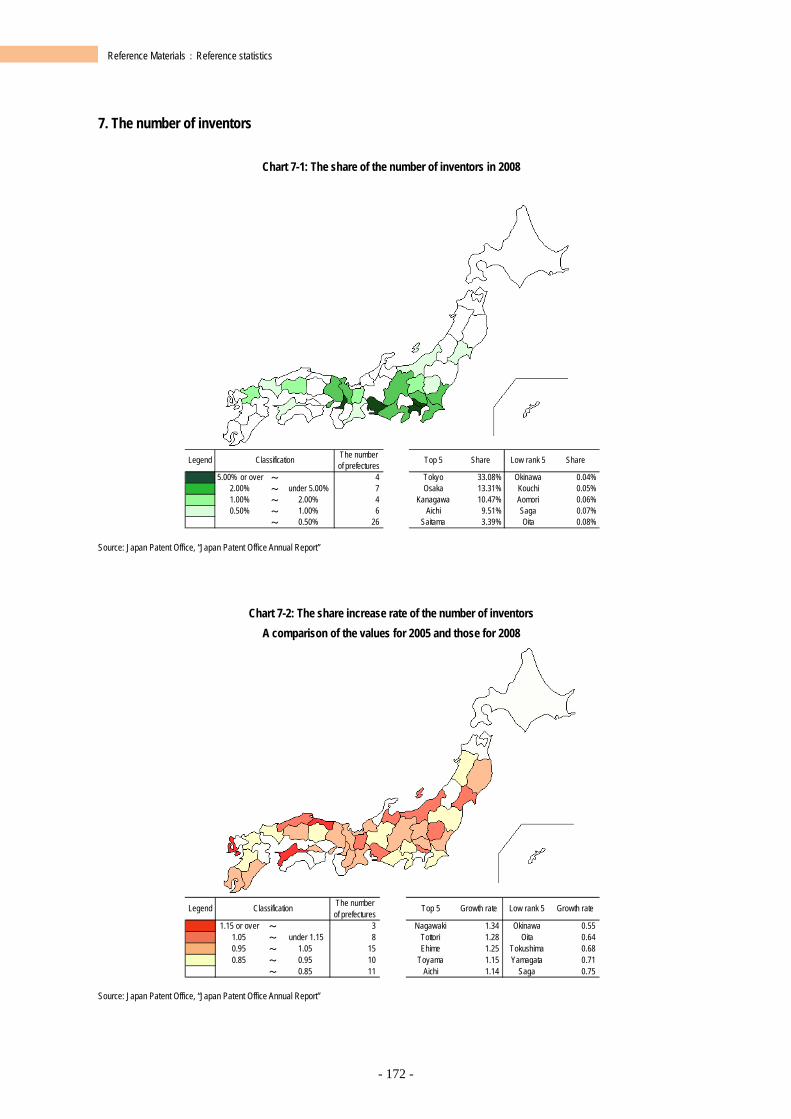
- 172 -
Reference Materials:Reference statistics
7. The number of inventors
Chart 7-1: The share of the number of inventors in 2008
Source: Japan Patent Office, “Japan Patent Office Annual Report”
Chart 7-2: The share increase rate of the number of inventors A comparison of the values for 2005 and those for 2008
Source: Japan Patent Office, “Japan Patent Office Annual Report”
Legend The numberof prefectures Top 5 Share Low rank 5 Share
5.00% or over ~ 4 Tokyo 33.08% Okinawa 0.04%2.00% ~ under 5.00% 7 Osaka 13.31% Kouchi 0.05%1.00% ~ 2.00% 4 Kanagawa 10.47% Aomori 0.06%0.50% ~ 1.00% 6 Aichi 9.51% Saga 0.07%
~ 0.50% 26 Saitama 3.39% Oita 0.08%
Classification
Legend The numberof prefectures Top 5 Growth rate Low rank 5 Growth rate
1.15 or over ~ 3 Nagawaki 1.34 Okinawa 0.551.05 ~ under 1.15 8 Tottori 1.28 Oita 0.640.95 ~ 1.05 15 Ehime 1.25 Tokushima 0.680.85 ~ 0.95 10 Toyama 1.15 Yamagata 0.71
~ 0.85 11 Aichi 1.14 Saga 0.75
Classification
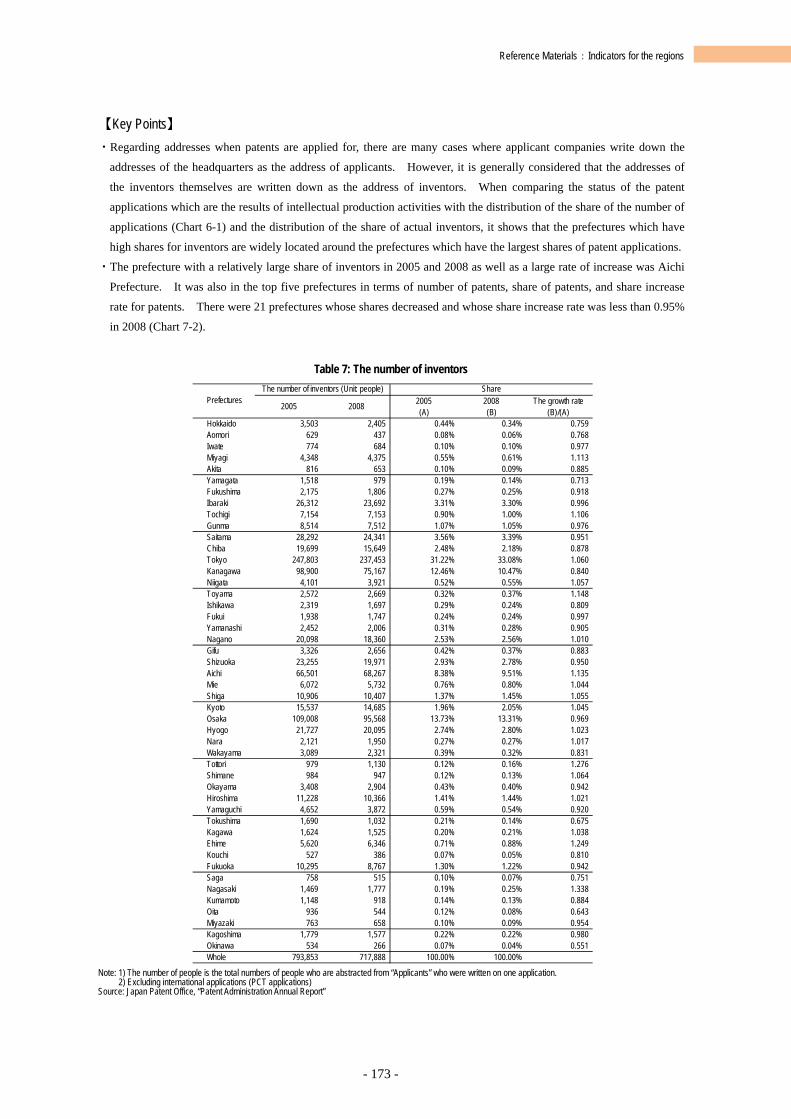
- 173 -
Reference Materials:Indicators for the regions
【Key Points】 ・Regarding addresses when patents are applied for, there are many cases where applicant companies write down the
addresses of the headquarters as the address of applicants. However, it is generally considered that the addresses of
the inventors themselves are written down as the address of inventors. When comparing the status of the patent
applications which are the results of intellectual production activities with the distribution of the share of the number of
applications (Chart 6-1) and the distribution of the share of actual inventors, it shows that the prefectures which have
high shares for inventors are widely located around the prefectures which have the largest shares of patent applications. ・The prefecture with a relatively large share of inventors in 2005 and 2008 as well as a large rate of increase was Aichi
Prefecture. It was also in the top five prefectures in terms of number of patents, share of patents, and share increase
rate for patents. There were 21 prefectures whose shares decreased and whose share increase rate was less than 0.95%
in 2008 (Chart 7-2).
Table 7: The number of inventors
Note: 1) The number of people is the total numbers of people who are abstracted from “Applicants” who were written on one application.
2) Excluding international applications (PCT applications) Source: Japan Patent Office, “Patent Administration Annual Report”
2005 2008 2005(A)
2008(B)
The growth rate(B)/(A)
Hokkaido 3,503 2,405 0.44% 0.34% 0.759Aomori 629 437 0.08% 0.06% 0.768Iwate 774 684 0.10% 0.10% 0.977Miyagi 4,348 4,375 0.55% 0.61% 1.113Akita 816 653 0.10% 0.09% 0.885Yamagata 1,518 979 0.19% 0.14% 0.713Fukushima 2,175 1,806 0.27% 0.25% 0.918Ibaraki 26,312 23,692 3.31% 3.30% 0.996Tochigi 7,154 7,153 0.90% 1.00% 1.106Gunma 8,514 7,512 1.07% 1.05% 0.976Saitama 28,292 24,341 3.56% 3.39% 0.951Chiba 19,699 15,649 2.48% 2.18% 0.878Tokyo 247,803 237,453 31.22% 33.08% 1.060Kanagawa 98,900 75,167 12.46% 10.47% 0.840Niigata 4,101 3,921 0.52% 0.55% 1.057Toyama 2,572 2,669 0.32% 0.37% 1.148Ishikawa 2,319 1,697 0.29% 0.24% 0.809Fukui 1,938 1,747 0.24% 0.24% 0.997Yamanashi 2,452 2,006 0.31% 0.28% 0.905Nagano 20,098 18,360 2.53% 2.56% 1.010Gifu 3,326 2,656 0.42% 0.37% 0.883Shizuoka 23,255 19,971 2.93% 2.78% 0.950Aichi 66,501 68,267 8.38% 9.51% 1.135Mie 6,072 5,732 0.76% 0.80% 1.044Shiga 10,906 10,407 1.37% 1.45% 1.055Kyoto 15,537 14,685 1.96% 2.05% 1.045Osaka 109,008 95,568 13.73% 13.31% 0.969Hyogo 21,727 20,095 2.74% 2.80% 1.023Nara 2,121 1,950 0.27% 0.27% 1.017Wakayama 3,089 2,321 0.39% 0.32% 0.831Tottori 979 1,130 0.12% 0.16% 1.276Shimane 984 947 0.12% 0.13% 1.064Okayama 3,408 2,904 0.43% 0.40% 0.942Hiroshima 11,228 10,366 1.41% 1.44% 1.021Yamaguchi 4,652 3,872 0.59% 0.54% 0.920Tokushima 1,690 1,032 0.21% 0.14% 0.675Kagawa 1,624 1,525 0.20% 0.21% 1.038Ehime 5,620 6,346 0.71% 0.88% 1.249Kouchi 527 386 0.07% 0.05% 0.810Fukuoka 10,295 8,767 1.30% 1.22% 0.942Saga 758 515 0.10% 0.07% 0.751Nagasaki 1,469 1,777 0.19% 0.25% 1.338Kumamoto 1,148 918 0.14% 0.13% 0.884Oita 936 544 0.12% 0.08% 0.643Miyazaki 763 658 0.10% 0.09% 0.954Kagoshima 1,779 1,577 0.22% 0.22% 0.980Okinawa 534 266 0.07% 0.04% 0.551Whole 793,853 717,888 100.00% 100.00%
PrefecturesThe number of inventors (Unit: people) Share
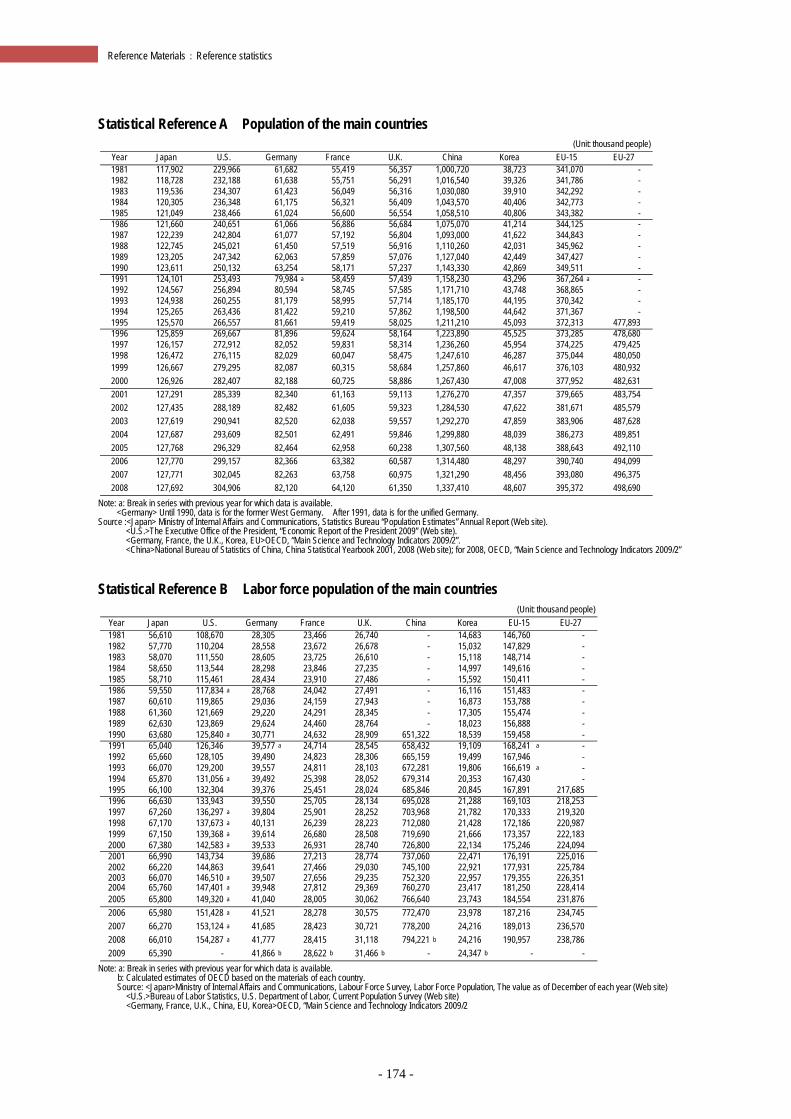
- 174 -
Reference Materials:Reference statistics
Statistical Reference A Population of the main countries
Note: a: Break in series with previous year for which data is available.
<Germany> Until 1990, data is for the former West Germany. After 1991, data is for the unified Germany. Source :<Japan> Ministry of Internal Affairs and Communications, Statistics Bureau “Population Estimates” Annual Report (Web site).
<U.S.>The Executive Office of the President, “Economic Report of the President 2009” (Web site). <Germany, France, the U.K., Korea, EU>OECD, “Main Science and Technology Indicators 2009/2”. <China>National Bureau of Statistics of China, China Statistical Yearbook 2001, 2008 (Web site); for 2008, OECD, “Main Science and Technology Indicators 2009/2”
Statistical Reference B Labor force population of the main countries
Note: a: Break in series with previous year for which data is available.
b: Calculated estimates of OECD based on the materials of each country. Source: <Japan>Ministry of Internal Affairs and Communications, Labour Force Survey, Labor Force Population, The value as of December of each year (Web site)
<U.S.>Bureau of Labor Statistics, U.S. Department of Labor, Current Population Survey (Web site) <Germany, France, U.K., China, EU, Korea>OECD, “Main Science and Technology Indicators 2009/2
(Unit: thousand people)Year Japan U.S. Germany France U.K. China Korea EU-15 EU-271981 117,902 229,966 61,682 55,419 56,357 1,000,720 38,723 341,070 -1982 118,728 232,188 61,638 55,751 56,291 1,016,540 39,326 341,786 -1983 119,536 234,307 61,423 56,049 56,316 1,030,080 39,910 342,292 -1984 120,305 236,348 61,175 56,321 56,409 1,043,570 40,406 342,773 -1985 121,049 238,466 61,024 56,600 56,554 1,058,510 40,806 343,382 -1986 121,660 240,651 61,066 56,886 56,684 1,075,070 41,214 344,125 -1987 122,239 242,804 61,077 57,192 56,804 1,093,000 41,622 344,843 -1988 122,745 245,021 61,450 57,519 56,916 1,110,260 42,031 345,962 -1989 123,205 247,342 62,063 57,859 57,076 1,127,040 42,449 347,427 -1990 123,611 250,132 63,254 58,171 57,237 1,143,330 42,869 349,511 -1991 124,101 253,493 79,984 a 58,459 57,439 1,158,230 43,296 367,264 a -1992 124,567 256,894 80,594 58,745 57,585 1,171,710 43,748 368,865 -1993 124,938 260,255 81,179 58,995 57,714 1,185,170 44,195 370,342 -1994 125,265 263,436 81,422 59,210 57,862 1,198,500 44,642 371,367 -1995 125,570 266,557 81,661 59,419 58,025 1,211,210 45,093 372,313 477,8931996 125,859 269,667 81,896 59,624 58,164 1,223,890 45,525 373,285 478,6801997 126,157 272,912 82,052 59,831 58,314 1,236,260 45,954 374,225 479,4251998 126,472 276,115 82,029 60,047 58,475 1,247,610 46,287 375,044 480,0501999 126,667 279,295 82,087 60,315 58,684 1,257,860 46,617 376,103 480,9322000 126,926 282,407 82,188 60,725 58,886 1,267,430 47,008 377,952 482,6312001 127,291 285,339 82,340 61,163 59,113 1,276,270 47,357 379,665 483,7542002 127,435 288,189 82,482 61,605 59,323 1,284,530 47,622 381,671 485,5792003 127,619 290,941 82,520 62,038 59,557 1,292,270 47,859 383,906 487,6282004 127,687 293,609 82,501 62,491 59,846 1,299,880 48,039 386,273 489,8512005 127,768 296,329 82,464 62,958 60,238 1,307,560 48,138 388,643 492,1102006 127,770 299,157 82,366 63,382 60,587 1,314,480 48,297 390,740 494,0992007 127,771 302,045 82,263 63,758 60,975 1,321,290 48,456 393,080 496,3752008 127,692 304,906 82,120 64,120 61,350 1,337,410 48,607 395,372 498,690
(Unit: thousand people)Year Japan U.S. Germany France U.K. China Korea EU-15 EU-271981 56,610 108,670 28,305 23,466 26,740 - 14,683 146,760 -1982 57,770 110,204 28,558 23,672 26,678 - 15,032 147,829 -1983 58,070 111,550 28,605 23,725 26,610 - 15,118 148,714 -1984 58,650 113,544 28,298 23,846 27,235 - 14,997 149,616 -1985 58,710 115,461 28,434 23,910 27,486 - 15,592 150,411 -1986 59,550 117,834 a 28,768 24,042 27,491 - 16,116 151,483 -1987 60,610 119,865 29,036 24,159 27,943 - 16,873 153,788 -1988 61,360 121,669 29,220 24,291 28,345 - 17,305 155,474 -1989 62,630 123,869 29,624 24,460 28,764 - 18,023 156,888 -1990 63,680 125,840 a 30,771 24,632 28,909 651,322 18,539 159,458 -1991 65,040 126,346 39,577 a 24,714 28,545 658,432 19,109 168,241 a -1992 65,660 128,105 39,490 24,823 28,306 665,159 19,499 167,946 -1993 66,070 129,200 39,557 24,811 28,103 672,281 19,806 166,619 a -1994 65,870 131,056 a 39,492 25,398 28,052 679,314 20,353 167,430 -1995 66,100 132,304 39,376 25,451 28,024 685,846 20,845 167,891 217,6851996 66,630 133,943 39,550 25,705 28,134 695,028 21,288 169,103 218,2531997 67,260 136,297 a 39,804 25,901 28,252 703,968 21,782 170,333 219,3201998 67,170 137,673 a 40,131 26,239 28,223 712,080 21,428 172,186 220,9871999 67,150 139,368 a 39,614 26,680 28,508 719,690 21,666 173,357 222,1832000 67,380 142,583 a 39,533 26,931 28,740 726,800 22,134 175,246 224,0942001 66,990 143,734 39,686 27,213 28,774 737,060 22,471 176,191 225,0162002 66,220 144,863 39,641 27,466 29,030 745,100 22,921 177,931 225,7842003 66,070 146,510 a 39,507 27,656 29,235 752,320 22,957 179,355 226,3512004 65,760 147,401 a 39,948 27,812 29,369 760,270 23,417 181,250 228,4142005 65,800 149,320 a 41,040 28,005 30,062 766,640 23,743 184,554 231,8762006 65,980 151,428 a 41,521 28,278 30,575 772,470 23,978 187,216 234,7452007 66,270 153,124 a 41,685 28,423 30,721 778,200 24,216 189,013 236,5702008 66,010 154,287 a 41,777 28,415 31,118 794,221 b 24,216 190,957 238,7862009 65,390 - 41,866 b 28,622 b 31,466 b - 24,347 b - -
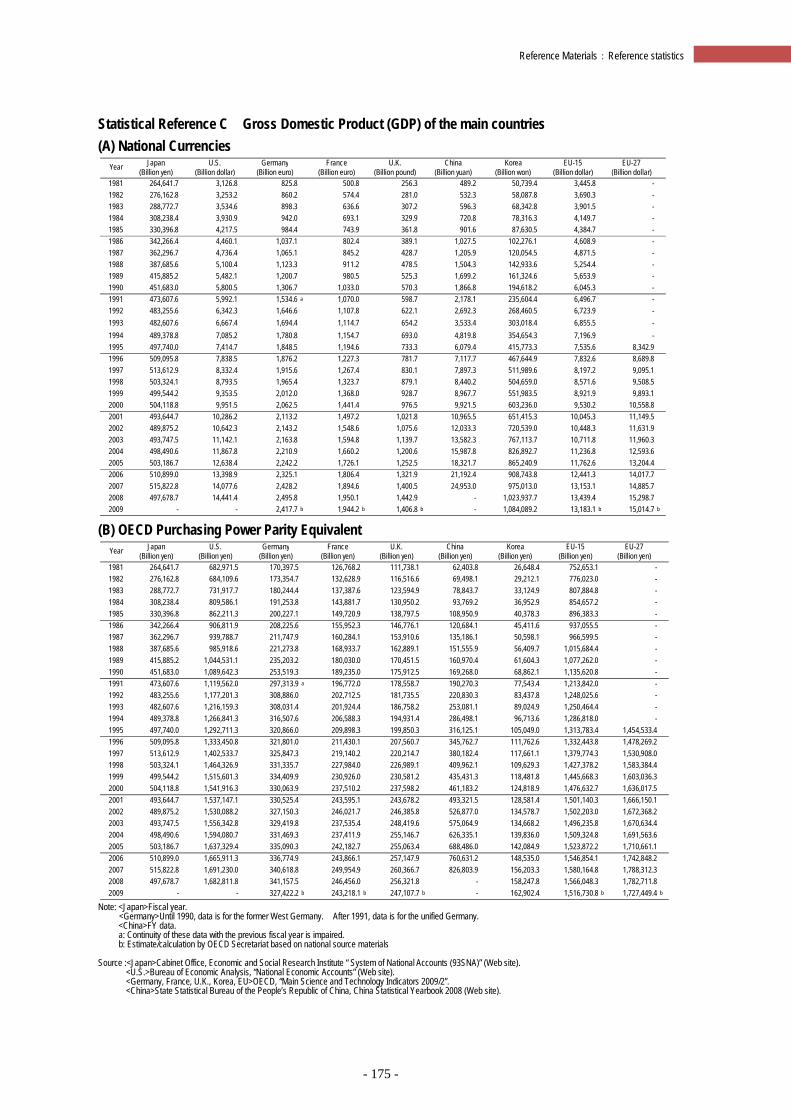
- 175 -
Reference Materials:Reference statistics
Statistical Reference C Gross Domestic Product (GDP) of the main countries (A) National Currencies
(B) OECD Purchasing Power Parity Equivalent
Note: <Japan>Fiscal year.
<Germany>Until 1990, data is for the former West Germany. After 1991, data is for the unified Germany. <China>FY data. a: Continuity of these data with the previous fiscal year is impaired. b: Estimate/calculation by OECD Secretariat based on national source materials
Source :<Japan>Cabinet Office, Economic and Social Research Institute “ System of National Accounts (93SNA)” (Web site). <U.S.>Bureau of Economic Analysis, “National Economic Accounts” (Web site). <Germany, France, U.K., Korea, EU>OECD, “Main Science and Technology Indicators 2009/2”. <China>State Statistical Bureau of the People’s Republic of China, China Statistical Yearbook 2008 (Web site).
Japan U.S. Germany France U.K. China Korea EU-15 EU-27(Billion yen) (Billion dollar) (Billion euro) (Billion euro) (Billion pound) (Billion yuan) (Billion won) (Billion dollar) (Billion dollar)
1981 264,641.7 3,126.8 825.8 500.8 256.3 489.2 50,739.4 3,445.8 -1982 276,162.8 3,253.2 860.2 574.4 281.0 532.3 58,087.8 3,690.3 -1983 288,772.7 3,534.6 898.3 636.6 307.2 596.3 68,342.8 3,901.5 -1984 308,238.4 3,930.9 942.0 693.1 329.9 720.8 78,316.3 4,149.7 -1985 330,396.8 4,217.5 984.4 743.9 361.8 901.6 87,630.5 4,384.7 -1986 342,266.4 4,460.1 1,037.1 802.4 389.1 1,027.5 102,276.1 4,608.9 -1987 362,296.7 4,736.4 1,065.1 845.2 428.7 1,205.9 120,054.5 4,871.5 -1988 387,685.6 5,100.4 1,123.3 911.2 478.5 1,504.3 142,933.6 5,254.4 -1989 415,885.2 5,482.1 1,200.7 980.5 525.3 1,699.2 161,324.6 5,653.9 -1990 451,683.0 5,800.5 1,306.7 1,033.0 570.3 1,866.8 194,618.2 6,045.3 -1991 473,607.6 5,992.1 1,534.6 a 1,070.0 598.7 2,178.1 235,604.4 6,496.7 -1992 483,255.6 6,342.3 1,646.6 1,107.8 622.1 2,692.3 268,460.5 6,723.9 -1993 482,607.6 6,667.4 1,694.4 1,114.7 654.2 3,533.4 303,018.4 6,855.5 -1994 489,378.8 7,085.2 1,780.8 1,154.7 693.0 4,819.8 354,654.3 7,196.9 -1995 497,740.0 7,414.7 1,848.5 1,194.6 733.3 6,079.4 415,773.3 7,535.6 8,342.91996 509,095.8 7,838.5 1,876.2 1,227.3 781.7 7,117.7 467,644.9 7,832.6 8,689.81997 513,612.9 8,332.4 1,915.6 1,267.4 830.1 7,897.3 511,989.6 8,197.2 9,095.11998 503,324.1 8,793.5 1,965.4 1,323.7 879.1 8,440.2 504,659.0 8,571.6 9,508.51999 499,544.2 9,353.5 2,012.0 1,368.0 928.7 8,967.7 551,983.5 8,921.9 9,893.12000 504,118.8 9,951.5 2,062.5 1,441.4 976.5 9,921.5 603,236.0 9,530.2 10,558.82001 493,644.7 10,286.2 2,113.2 1,497.2 1,021.8 10,965.5 651,415.3 10,045.3 11,149.52002 489,875.2 10,642.3 2,143.2 1,548.6 1,075.6 12,033.3 720,539.0 10,448.3 11,631.92003 493,747.5 11,142.1 2,163.8 1,594.8 1,139.7 13,582.3 767,113.7 10,711.8 11,960.32004 498,490.6 11,867.8 2,210.9 1,660.2 1,200.6 15,987.8 826,892.7 11,236.8 12,593.62005 503,186.7 12,638.4 2,242.2 1,726.1 1,252.5 18,321.7 865,240.9 11,762.6 13,204.42006 510,899.0 13,398.9 2,325.1 1,806.4 1,321.9 21,192.4 908,743.8 12,441.3 14,017.72007 515,822.8 14,077.6 2,428.2 1,894.6 1,400.5 24,953.0 975,013.0 13,153.1 14,885.72008 497,678.7 14,441.4 2,495.8 1,950.1 1,442.9 - 1,023,937.7 13,439.4 15,298.72009 - - 2,417.7 b 1,944.2 b 1,406.8 b - 1,084,089.2 13,183.1 b 15,014.7 b
Year
Japan U.S. Germany France U.K. China Korea EU-15 EU-27(Billion yen) (Billion yen) (Billion yen) (Billion yen) (Billion yen) (Billion yen) (Billion yen) (Billion yen) (Billion yen)
1981 264,641.7 682,971.5 170,397.5 126,768.2 111,738.1 62,403.8 26,648.4 752,653.1 -1982 276,162.8 684,109.6 173,354.7 132,628.9 116,516.6 69,498.1 29,212.1 776,023.0 -1983 288,772.7 731,917.7 180,244.4 137,387.6 123,594.9 78,843.7 33,124.9 807,884.8 -1984 308,238.4 809,586.1 191,253.8 143,881.7 130,950.2 93,769.2 36,952.9 854,657.2 -1985 330,396.8 862,211.3 200,227.1 149,720.9 138,797.5 108,950.9 40,378.3 896,383.3 -1986 342,266.4 906,811.9 208,225.6 155,952.3 146,776.1 120,684.1 45,411.6 937,055.5 -1987 362,296.7 939,788.7 211,747.9 160,284.1 153,910.6 135,186.1 50,598.1 966,599.5 -1988 387,685.6 985,918.6 221,273.8 168,933.7 162,889.1 151,555.9 56,409.7 1,015,684.4 -1989 415,885.2 1,044,531.1 235,203.2 180,030.0 170,451.5 160,970.4 61,604.3 1,077,262.0 -1990 451,683.0 1,089,642.3 253,519.3 189,235.0 175,912.5 169,268.0 68,862.1 1,135,620.8 -1991 473,607.6 1,119,562.0 297,313.9 a 196,772.0 178,558.7 190,270.3 77,543.4 1,213,842.0 -1992 483,255.6 1,177,201.3 308,886.0 202,712.5 181,735.5 220,830.3 83,437.8 1,248,025.6 -1993 482,607.6 1,216,159.3 308,031.4 201,924.4 186,758.2 253,081.1 89,024.9 1,250,464.4 -1994 489,378.8 1,266,841.3 316,507.6 206,588.3 194,931.4 286,498.1 96,713.6 1,286,818.0 -1995 497,740.0 1,292,711.3 320,866.0 209,898.3 199,850.3 316,125.1 105,049.0 1,313,783.4 1,454,533.41996 509,095.8 1,333,450.8 321,801.0 211,430.1 207,560.7 345,762.7 111,762.6 1,332,443.8 1,478,269.21997 513,612.9 1,402,533.7 325,847.3 219,140.2 220,214.7 380,182.4 117,661.1 1,379,774.3 1,530,908.01998 503,324.1 1,464,326.9 331,335.7 227,984.0 226,989.1 409,962.1 109,629.3 1,427,378.2 1,583,384.41999 499,544.2 1,515,601.3 334,409.9 230,926.0 230,581.2 435,431.3 118,481.8 1,445,668.3 1,603,036.32000 504,118.8 1,541,916.3 330,063.9 237,510.2 237,598.2 461,183.2 124,818.9 1,476,632.7 1,636,017.52001 493,644.7 1,537,147.1 330,525.4 243,595.1 243,678.2 493,321.5 128,581.4 1,501,140.3 1,666,150.12002 489,875.2 1,530,088.2 327,150.3 246,021.7 246,385.8 526,877.0 134,578.7 1,502,203.0 1,672,368.22003 493,747.5 1,556,342.8 329,419.8 237,535.4 248,419.6 575,064.9 134,668.2 1,496,235.8 1,670,634.42004 498,490.6 1,594,080.7 331,469.3 237,411.9 255,146.7 626,335.1 139,836.0 1,509,324.8 1,691,563.62005 503,186.7 1,637,329.4 335,090.3 242,182.7 255,063.4 688,486.0 142,084.9 1,523,872.2 1,710,661.12006 510,899.0 1,665,911.3 336,774.9 243,866.1 257,147.9 760,631.2 148,535.0 1,546,854.1 1,742,848.22007 515,822.8 1,691,230.0 340,618.8 249,954.9 260,366.7 826,803.9 156,203.3 1,580,164.8 1,788,312.32008 497,678.7 1,682,811.8 341,157.5 246,456.0 256,321.8 - 158,247.8 1,566,048.3 1,782,711.82009 - - 327,422.2 b 243,218.1 b 247,107.7 b - 162,902.4 1,516,730.8 b 1,727,449.4 b
Year
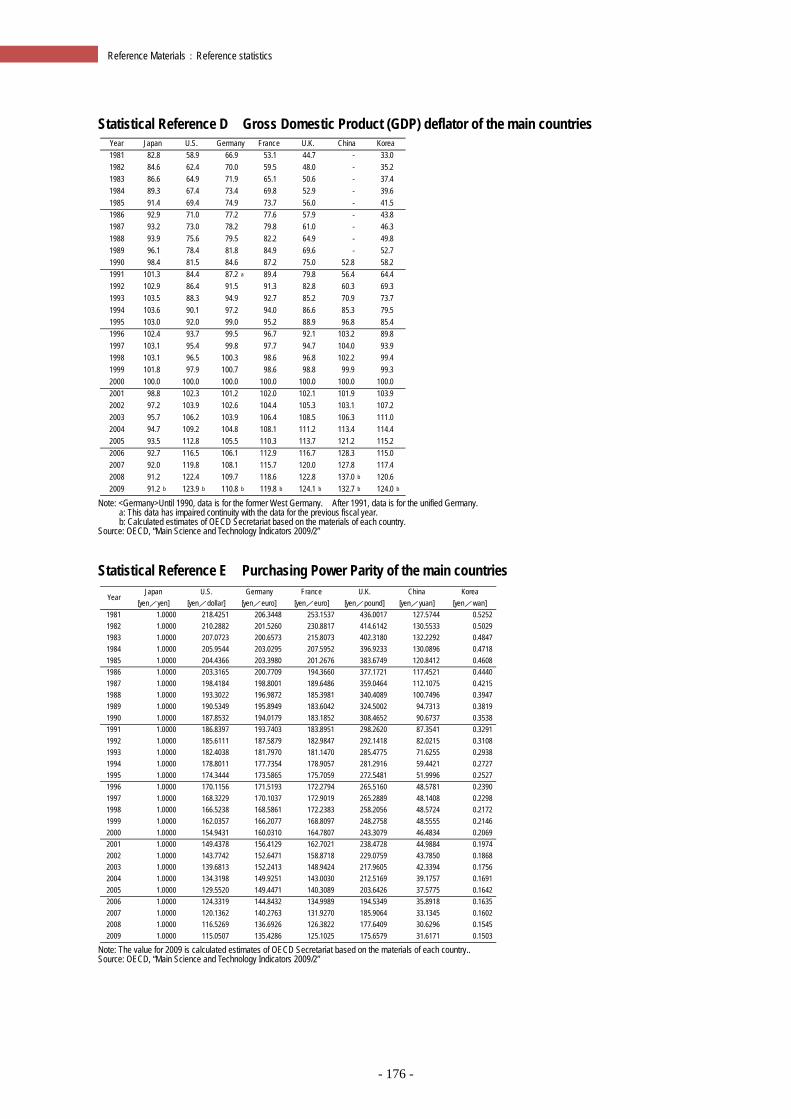
- 176 -
Reference Materials:Reference statistics
Statistical Reference D Gross Domestic Product (GDP) deflator of the main countries
Note: <Germany>Until 1990, data is for the former West Germany. After 1991, data is for the unified Germany.
a: This data has impaired continuity with the data for the previous fiscal year. b: Calculated estimates of OECD Secretariat based on the materials of each country.
Source: OECD, “Main Science and Technology Indicators 2009/2”
Statistical Reference E Purchasing Power Parity of the main countries
Note: The value for 2009 is calculated estimates of OECD Secretariat based on the materials of each country.. Source: OECD, “Main Science and Technology Indicators 2009/2”
Year Japan U.S. Germany France U.K. China Korea1981 82.8 58.9 66.9 53.1 44.7 - 33.01982 84.6 62.4 70.0 59.5 48.0 - 35.21983 86.6 64.9 71.9 65.1 50.6 - 37.41984 89.3 67.4 73.4 69.8 52.9 - 39.61985 91.4 69.4 74.9 73.7 56.0 - 41.51986 92.9 71.0 77.2 77.6 57.9 - 43.81987 93.2 73.0 78.2 79.8 61.0 - 46.31988 93.9 75.6 79.5 82.2 64.9 - 49.81989 96.1 78.4 81.8 84.9 69.6 - 52.71990 98.4 81.5 84.6 87.2 75.0 52.8 58.21991 101.3 84.4 87.2 a 89.4 79.8 56.4 64.41992 102.9 86.4 91.5 91.3 82.8 60.3 69.31993 103.5 88.3 94.9 92.7 85.2 70.9 73.71994 103.6 90.1 97.2 94.0 86.6 85.3 79.51995 103.0 92.0 99.0 95.2 88.9 96.8 85.41996 102.4 93.7 99.5 96.7 92.1 103.2 89.81997 103.1 95.4 99.8 97.7 94.7 104.0 93.91998 103.1 96.5 100.3 98.6 96.8 102.2 99.41999 101.8 97.9 100.7 98.6 98.8 99.9 99.32000 100.0 100.0 100.0 100.0 100.0 100.0 100.02001 98.8 102.3 101.2 102.0 102.1 101.9 103.92002 97.2 103.9 102.6 104.4 105.3 103.1 107.22003 95.7 106.2 103.9 106.4 108.5 106.3 111.02004 94.7 109.2 104.8 108.1 111.2 113.4 114.42005 93.5 112.8 105.5 110.3 113.7 121.2 115.22006 92.7 116.5 106.1 112.9 116.7 128.3 115.02007 92.0 119.8 108.1 115.7 120.0 127.8 117.42008 91.2 122.4 109.7 118.6 122.8 137.0 b 120.62009 91.2 b 123.9 b 110.8 b 119.8 b 124.1 b 132.7 b 124.0 b
YearJapan
[yen/yen]U.S.
[yen/dollar]Germany
[yen/euro]France
[yen/euro]U.K.
[yen/pound]China
[yen/yuan]Korea
[yen/wan]1981 1.0000 218.4251 206.3448 253.1537 436.0017 127.5744 0.52521982 1.0000 210.2882 201.5260 230.8817 414.6142 130.5533 0.50291983 1.0000 207.0723 200.6573 215.8073 402.3180 132.2292 0.48471984 1.0000 205.9544 203.0295 207.5952 396.9233 130.0896 0.47181985 1.0000 204.4366 203.3980 201.2676 383.6749 120.8412 0.46081986 1.0000 203.3165 200.7709 194.3660 377.1721 117.4521 0.44401987 1.0000 198.4184 198.8001 189.6486 359.0464 112.1075 0.42151988 1.0000 193.3022 196.9872 185.3981 340.4089 100.7496 0.39471989 1.0000 190.5349 195.8949 183.6042 324.5002 94.7313 0.38191990 1.0000 187.8532 194.0179 183.1852 308.4652 90.6737 0.35381991 1.0000 186.8397 193.7403 183.8951 298.2620 87.3541 0.32911992 1.0000 185.6111 187.5879 182.9847 292.1418 82.0215 0.31081993 1.0000 182.4038 181.7970 181.1470 285.4775 71.6255 0.29381994 1.0000 178.8011 177.7354 178.9057 281.2916 59.4421 0.27271995 1.0000 174.3444 173.5865 175.7059 272.5481 51.9996 0.25271996 1.0000 170.1156 171.5193 172.2794 265.5160 48.5781 0.23901997 1.0000 168.3229 170.1037 172.9019 265.2889 48.1408 0.22981998 1.0000 166.5238 168.5861 172.2383 258.2056 48.5724 0.21721999 1.0000 162.0357 166.2077 168.8097 248.2758 48.5555 0.21462000 1.0000 154.9431 160.0310 164.7807 243.3079 46.4834 0.20692001 1.0000 149.4378 156.4129 162.7021 238.4728 44.9884 0.19742002 1.0000 143.7742 152.6471 158.8718 229.0759 43.7850 0.18682003 1.0000 139.6813 152.2413 148.9424 217.9605 42.3394 0.17562004 1.0000 134.3198 149.9251 143.0030 212.5169 39.1757 0.16912005 1.0000 129.5520 149.4471 140.3089 203.6426 37.5775 0.16422006 1.0000 124.3319 144.8432 134.9989 194.5349 35.8918 0.16352007 1.0000 120.1362 140.2763 131.9270 185.9064 33.1345 0.16022008 1.0000 116.5269 136.6926 126.3822 177.6409 30.6296 0.15452009 1.0000 115.0507 135.4286 125.1025 175.6579 31.6171 0.1503
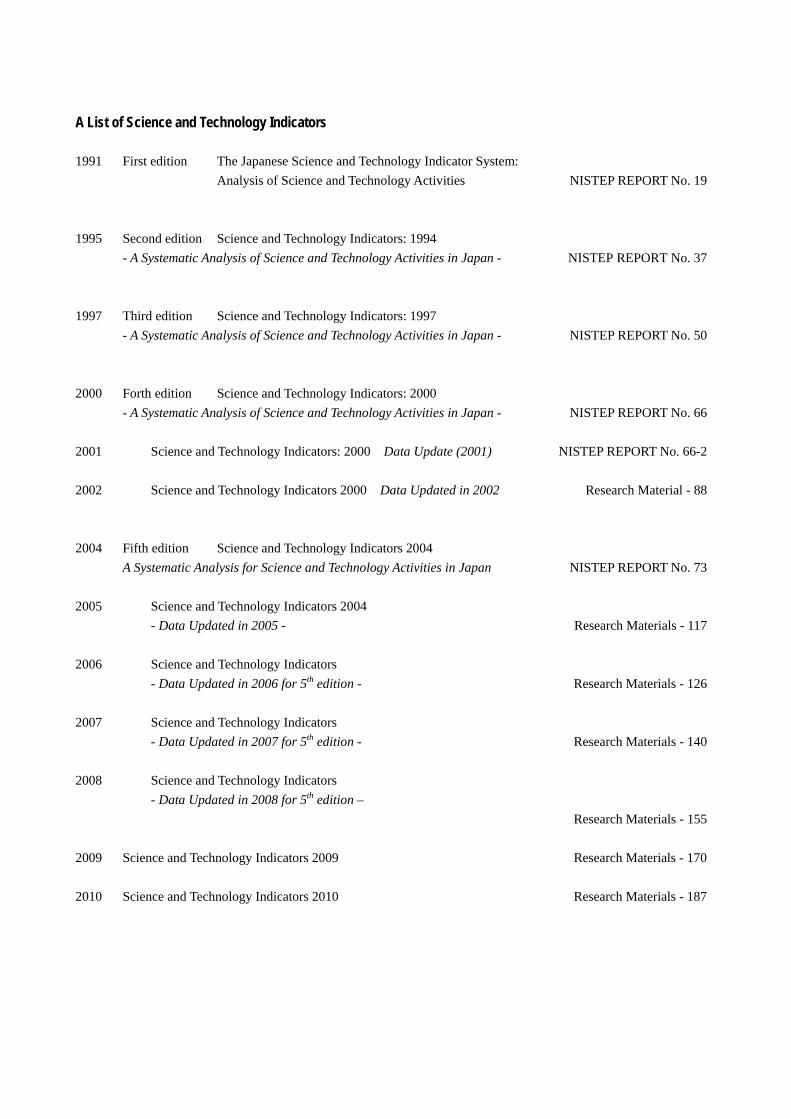
A List of Science and Technology Indicators 1991 First edition The Japanese Science and Technology Indicator System:
Analysis of Science and Technology Activities NISTEP REPORT No. 19 1995 Second edition Science and Technology Indicators: 1994 - A Systematic Analysis of Science and Technology Activities in Japan - NISTEP REPORT No. 37 1997 Third edition Science and Technology Indicators: 1997 - A Systematic Analysis of Science and Technology Activities in Japan - NISTEP REPORT No. 50 2000 Forth edition Science and Technology Indicators: 2000 - A Systematic Analysis of Science and Technology Activities in Japan - NISTEP REPORT No. 66 2001 Science and Technology Indicators: 2000 Data Update (2001) NISTEP REPORT No. 66-2 2002 Science and Technology Indicators 2000 Data Updated in 2002 Research Material - 88 2004 Fifth edition Science and Technology Indicators 2004 A Systematic Analysis for Science and Technology Activities in Japan NISTEP REPORT No. 73 2005 Science and Technology Indicators 2004 - Data Updated in 2005 - Research Materials - 117 2006 Science and Technology Indicators - Data Updated in 2006 for 5th edition - Research Materials - 126 2007 Science and Technology Indicators - Data Updated in 2007 for 5th edition - Research Materials - 140 2008 Science and Technology Indicators - Data Updated in 2008 for 5th edition – Research Materials - 155 2009 Science and Technology Indicators 2009 Research Materials - 170 2010 Science and Technology Indicators 2010 Research Materials - 187
Authors Yumiko KANDA Senior Research Fellow, Research Units for Science and Technology Analysis and Indicators
[Total coordination and overall editing] Ayaka SAKA Senior Research Fellow, Research Units for Science and Technology Analysis and Indicators [Chapter 4 4.1 Papers] Masatsura IGAMI Senior Research Fellow, Research Units for Science and Technology Analysis and Indicators [Chapter 4 4.2 Patents] Terutaka KUWAHARA Deputy Director General, NISTEP (Director, Research Unit for Science and
Technology Analysis and Indicators, through May 31, 2010) [Director of the overall production]
Hiroyuki TOMIZAWA Director, Research Unit for Science and Technology Analysis and Indicators, from June 1, 2010 [Review]
Cooperators Fujio NIWA Affiliated Fellow, Research Units for Science and Technology Analysis and Indicators (Honor Professor, National Graduate Institute for Policy Studies) Tomohiro IJICHI Affiliated Fellow, 1st Theory Oriented Research Group (Professor, Seijo University Faculty of Social Innovation) Eiji ISHIBASHI Deputy Director, Research Units for Science and Technology Analysis and Indicators Chiemi YAMADA Clerical Assistant, Research Units for Science and Technology Analysis and Indicators Naomi SASAKI Research Units for Science and Technology Analysis and Indicators (January–March 2010: Contract basis assistant for updating data)


Research Material - 187
Japanese Science and Technology
Indicators 2010Jan. 2011
Research Unit for Science and Technology Analysis and IndicatorsNational Institute of Science and Technology Policy, MEXT
Research Material - 187
Japanese Science and Technology Indicators 2010NISTEP, M
EXT