Embed Size (px)
Citation preview
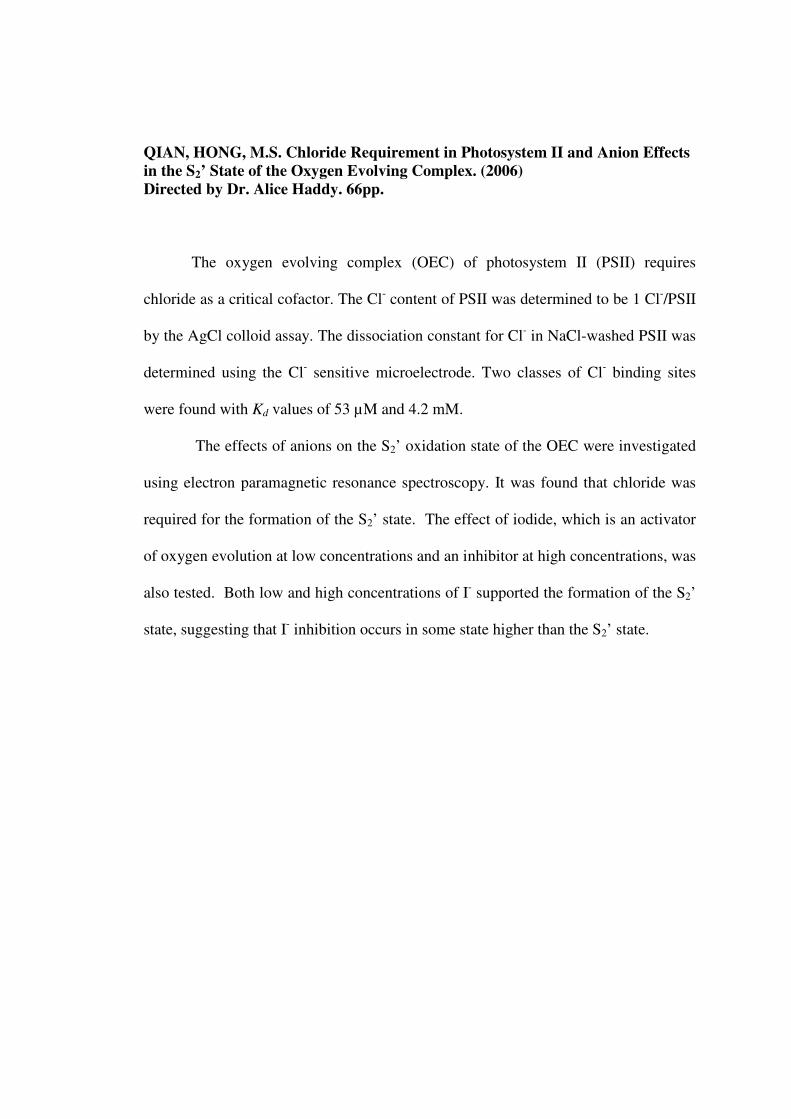
QIAN, HONG, M.S. Chloride Requirement in Photosystem II and Anion Effects in the S2’ State of the Oxygen Evolving Complex. (2006)Directed by Dr. Alice Haddy. 66pp.
The oxygen evolving complex (OEC) of photosystem II (PSII) requires
chloride as a critical cofactor. The Cl- content of PSII was determined to be 1 Cl-/PSII
by the AgCl colloid assay. The dissociation constant for Cl- in NaCl-washed PSII was
determined using the Cl- sensitive microelectrode. Two classes of Cl- binding sites
were found with Kd values of 53 µM and 4.2 mM.
The effects of anions on the S2’ oxidation state of the OEC were investigated
using electron paramagnetic resonance spectroscopy. It was found that chloride was
required for the formation of the S2’ state. The effect of iodide, which is an activator
of oxygen evolution at low concentrations and an inhibitor at high concentrations, was
also tested. Both low and high concentrations of I- supported the formation of the S2’
state, suggesting that I- inhibition occurs in some state higher than the S2’ state.
CHLORIDE REQUIREMENT IN PHOTOSYSTEM II AND ANION EFFECTS IN
THE S2’ STATE OF THE OXYGEN EVOLVING COMPLEX
By
Hong Qian
A Thesis Submitted toThe Faculty of The Graduate School at
The University of North Carolina at GreensboroIn Partial Fulfillment
of the Requirements for the DegreeMaster of Science
Greensboro2006
Approved by
_______________________Committee Chair

ii
APPROVAL PAGE
This thesis has been approved by the following committee of the
Faculty of the Graduate School at the University of North Carolina at Greensboro.
Committee Chair _______________________________
Committee Members ______________________________
______________________________
____________________________Date of Acceptance by Committee
____________________________Date of Final Oral Examination

iii
ACKNOWLEDGEMENTS
This research was founded by grants from the National Science Foundation
and the Dreyfus Foundation.
I wish to thank Dr. Alice Haddy who performed the EPR spectroscopy on all
of the samples recorded in this thesis.
This work is dedicated to Dr. Alice Haddy and my family.
iv
TABLE OF CONTENTS
Page
APPROVAL PAGE.......................................................................................................ii
ACKNOWLEDGEMENTS......................................................................................... iii
CHAPTER
I. INTRODUCTION ..........................................................................................1
1. Background Information...................................................................22. Principle of EPR Spectroscopy........................................................103. EPR Spectroscopy of Photosystem II ..............................................16
II. OVERVIEW OF EXPERIMENTS...............................................................22
1. Chloride Determination ...................................................................222. Anion Effects on the S2’ State .........................................................23
III. MATERIALS AND METHODS..................................................................25
1. Reagents...........................................................................................252. General Methods for PSII ................................................................253. Cl- Determination Procedures ..........................................................284. EPR Spectroscopy............................................................................31
IV. RESULTS AND DISCUSSION: CHLORIDE DETERMINATION..........34
1. Chloride Determination in PSII by AgCl Colloid Assay................352. Chloride Determination in PSII using A Cl- Sensitive Microelectrode .....................................................................................423. Determination of Dissociation Constant for Chloride .....................43
V. RESULTS AND DISCUSSION: ANION EFFECTS ON THE S2’ STATE48
1. Time Dependence of S2’ Signal Formation .....................................502. Iodide effect on the S2’ signals ........................................................53
VI. CONCLUSION.............................................................................................57
REFERENCES ............................................................................................................62
1
CHAPTER I
INTRODUCTION
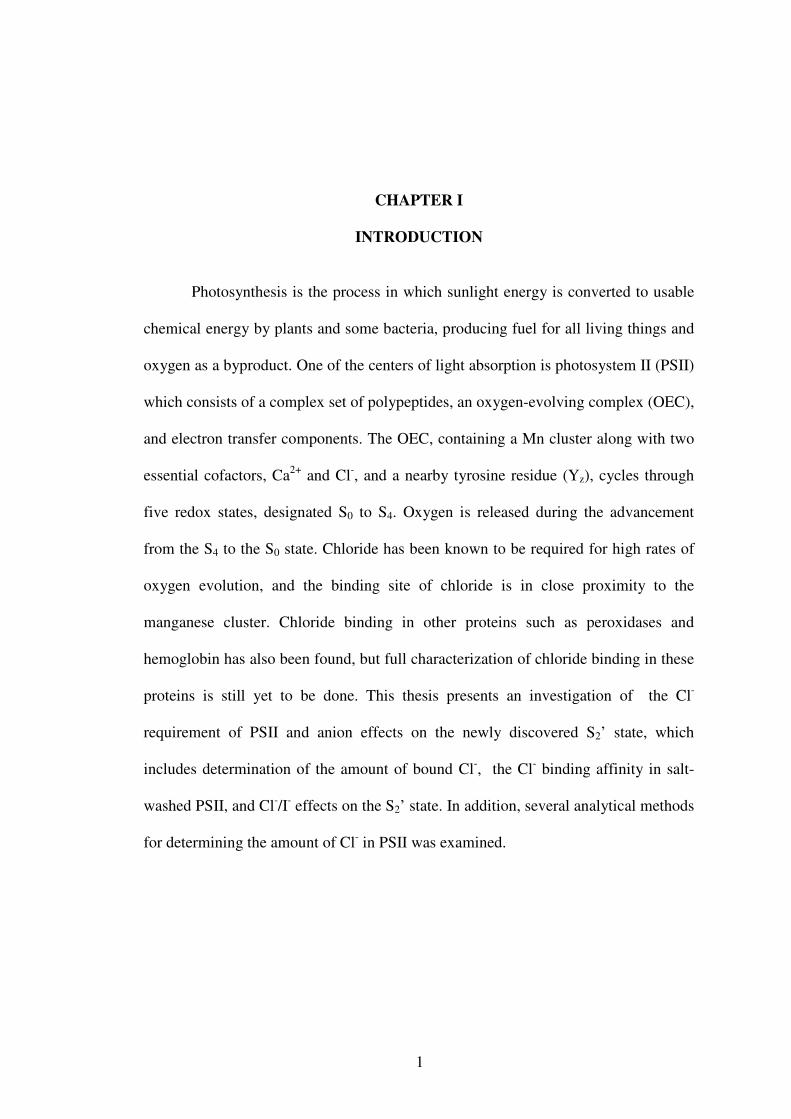
Photosynthesis is the process in which sunlight energy is converted to usable
chemical energy by plants and some bacteria, producing fuel for all living things and
oxygen as a byproduct. One of the centers of light absorption is photosystem II (PSII)
which consists of a complex set of polypeptides, an oxygen-evolving complex (OEC),
and electron transfer components. The OEC, containing a Mn cluster along with two
essential cofactors, Ca2+ and Cl-, and a nearby tyrosine residue (Yz), cycles through
five redox states, designated S0 to S4. Oxygen is released during the advancement
from the S4 to the S0 state. Chloride has been known to be required for high rates of
oxygen evolution, and the binding site of chloride is in close proximity to the
manganese cluster. Chloride binding in other proteins such as peroxidases and
hemoglobin has also been found, but full characterization of chloride binding in these
proteins is still yet to be done. This thesis presents an investigation of the Cl-
requirement of PSII and anion effects on the newly discovered S2’ state, which
includes determination of the amount of bound Cl-, the Cl- binding affinity in salt-
washed PSII, and Cl-/I- effects on the S2’ state. In addition, several analytical methods
for determining the amount of Cl- in PSII was examined.
2
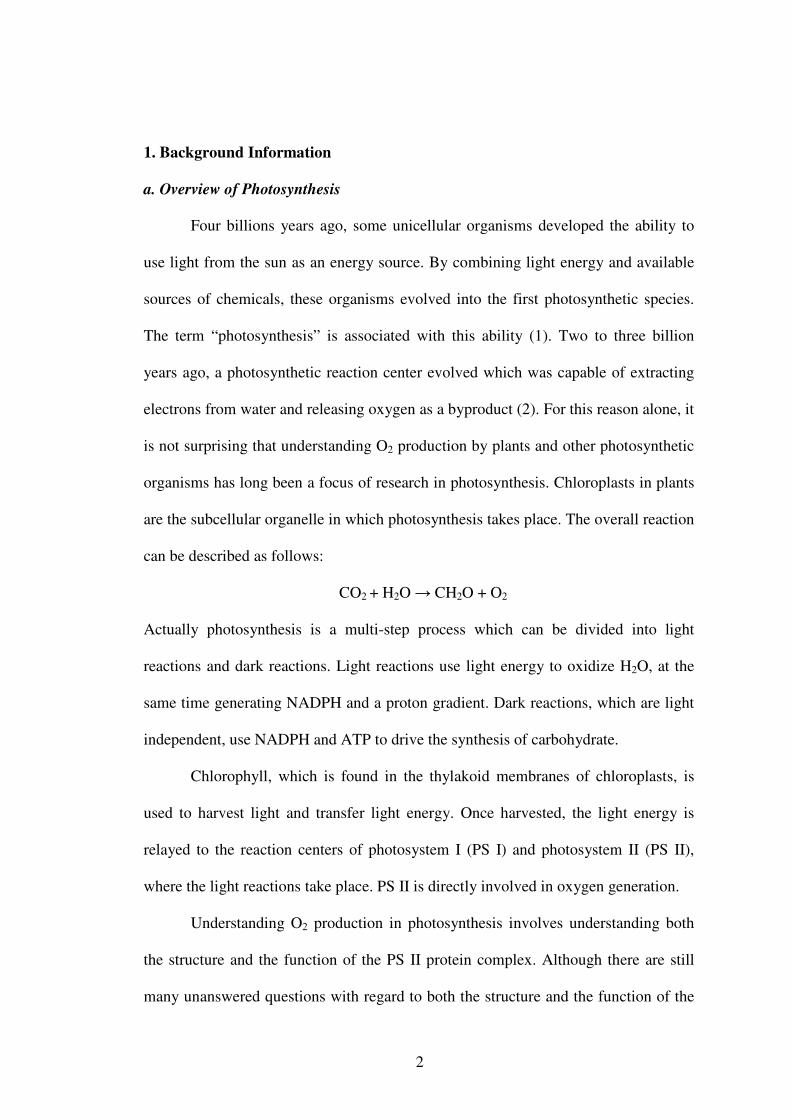
1. Background Information
a. Overview of Photosynthesis
Four billions years ago, some unicellular organisms developed the ability to
use light from the sun as an energy source. By combining light energy and available
sources of chemicals, these organisms evolved into the first photosynthetic species.
The term “photosynthesis” is associated with this ability (1). Two to three billion
years ago, a photosynthetic reaction center evolved which was capable of extracting
electrons from water and releasing oxygen as a byproduct (2). For this reason alone, it
is not surprising that understanding O2 production by plants and other photosynthetic
organisms has long been a focus of research in photosynthesis. Chloroplasts in plants
are the subcellular organelle in which photosynthesis takes place. The overall reaction
can be described as follows:
CO2 + H2O → CH2O + O2
Actually photosynthesis is a multi-step process which can be divided into light
reactions and dark reactions. Light reactions use light energy to oxidize H2O, at the
same time generating NADPH and a proton gradient. Dark reactions, which are light
independent, use NADPH and ATP to drive the synthesis of carbohydrate.
Chlorophyll, which is found in the thylakoid membranes of chloroplasts, is
used to harvest light and transfer light energy. Once harvested, the light energy is
relayed to the reaction centers of photosystem I (PS I) and photosystem II (PS II),
where the light reactions take place. PS II is directly involved in oxygen generation.
Understanding O2 production in photosynthesis involves understanding both
the structure and the function of the PS II protein complex. Although there are still
many unanswered questions with regard to both the structure and the function of the
3
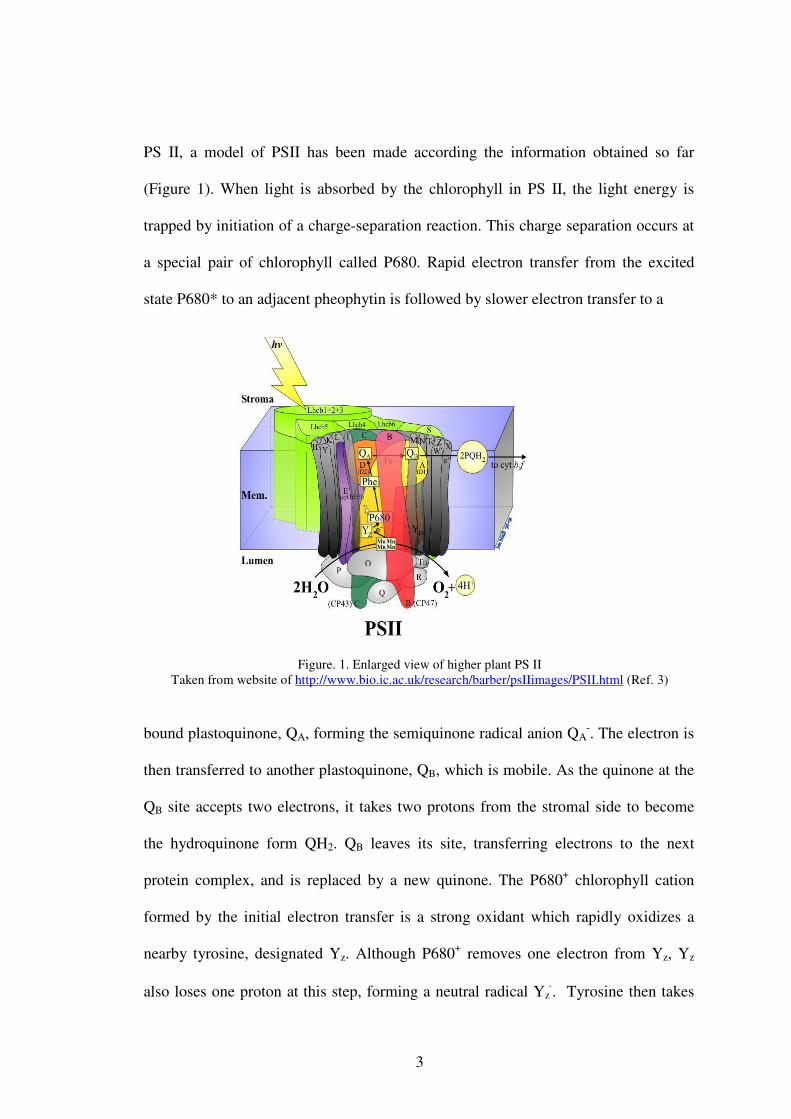
PS II, a model of PSII has been made according the information obtained so far
(Figure 1). When light is absorbed by the chlorophyll in PS II, the light energy is
trapped by initiation of a charge-separation reaction. This charge separation occurs at
a special pair of chlorophyll called P680. Rapid electron transfer from the excited
state P680* to an adjacent pheophytin is followed by slower electron transfer to a
Figure. 1. Enlarged view of higher plant PS II Taken from website of http://www.bio.ic.ac.uk/research/barber/psIIimages/PSII.html (Ref. 3)
bound plastoquinone, QA, forming the semiquinone radical anion QA-. The electron is
then transferred to another plastoquinone, QB, which is mobile. As the quinone at the
QB site accepts two electrons, it takes two protons from the stromal side to become
the hydroquinone form QH2. QB leaves its site, transferring electrons to the next
protein complex, and is replaced by a new quinone. The P680+ chlorophyll cation
formed by the initial electron transfer is a strong oxidant which rapidly oxidizes a
nearby tyrosine, designated Yz. Although P680+ removes one electron from Yz, Yz
also loses one proton at this step, forming a neutral radical Yz⋅. Tyrosine then takes
4
an electron and a proton from the manganese cluster and/or another amino acid
residue of the OEC. To replace its lost electrons and protons, the OEC strips electrons
and protons away from H2O, and then O2 is released.
The OEC is therefore the site at which water binds and is oxidized to oxygen.
The OEC, with its core of four Mn ions, Ca2+ and Cl-, accumulates the energy needed
to oxidize water to oxygen, as it transfers electrons to P680. After water is oxidized to
oxygen, the OEC resets to its most reduced state.
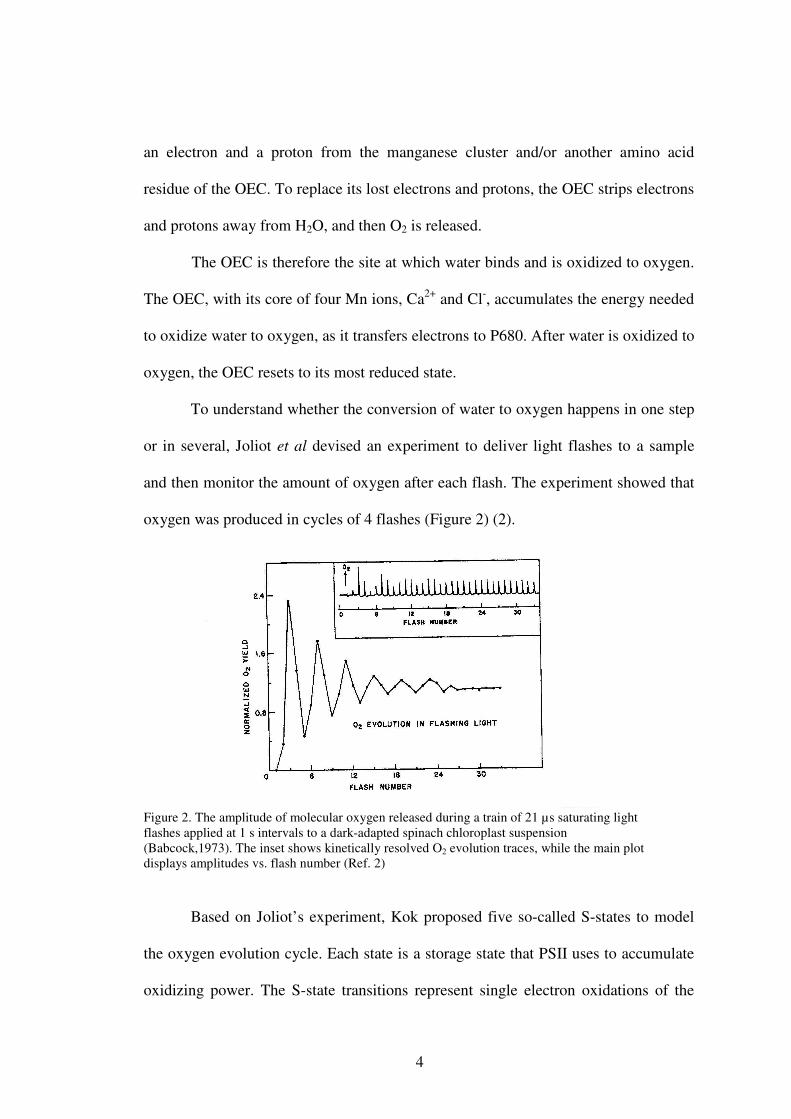
To understand whether the conversion of water to oxygen happens in one step
or in several, Joliot et al devised an experiment to deliver light flashes to a sample
and then monitor the amount of oxygen after each flash. The experiment showed that
oxygen was produced in cycles of 4 flashes (Figure 2) (2).
Figure 2. The amplitude of molecular oxygen released during a train of 21 µs saturating light flashes applied at 1 s intervals to a dark-adapted spinach chloroplast suspension (Babcock,1973). The inset shows kinetically resolved O2 evolution traces, while the main plot displays amplitudes vs. flash number (Ref. 2)
Based on Joliot’s experiment, Kok proposed five so-called S-states to model
the oxygen evolution cycle. Each state is a storage state that PSII uses to accumulate
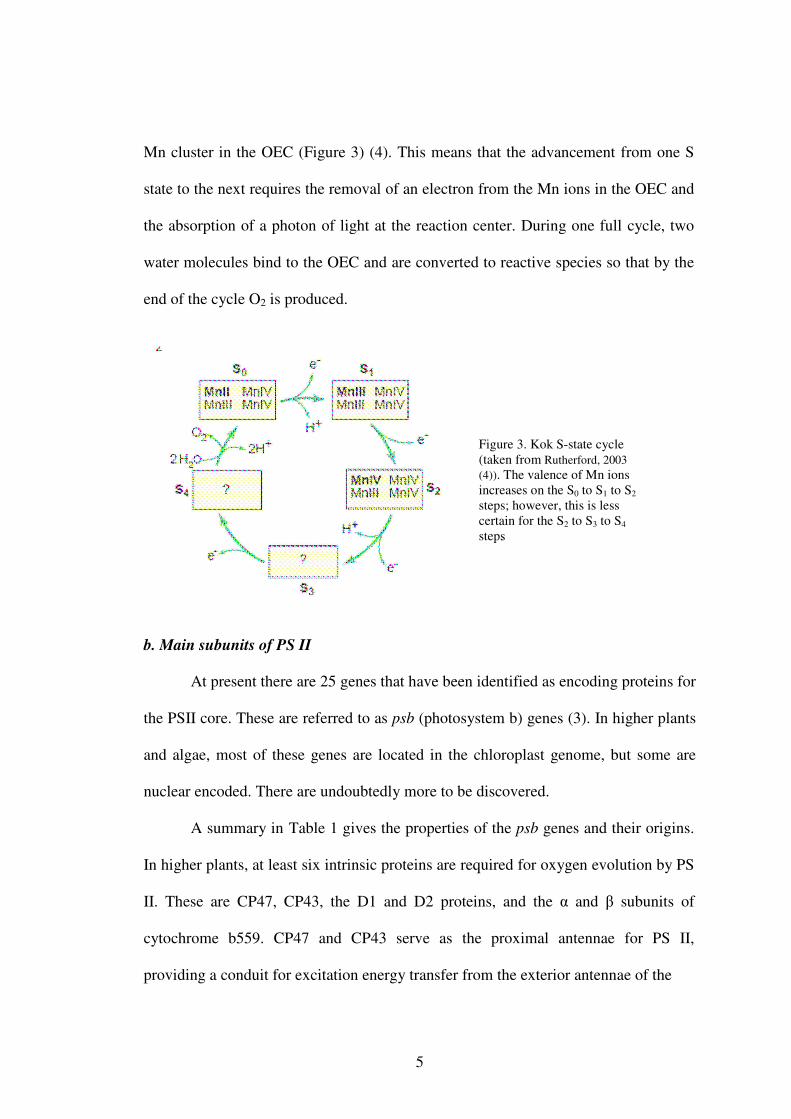
oxidizing power. The S-state transitions represent single electron oxidations of the
5
Mn cluster in the OEC (Figure 3) (4). This means that the advancement from one S
state to the next requires the removal of an electron from the Mn ions in the OEC and
the absorption of a photon of light at the reaction center. During one full cycle, two
water molecules bind to the OEC and are converted to reactive species so that by the
end of the cycle O2 is produced.
Figure 3. Kok S-state cycle (taken from Rutherford, 2003(4)). The valence of Mn ions increases on the S0 to S1 to S2
steps; however, this is less certain for the S2 to S3 to S4
steps.
b. Main subunits of PS II
At present there are 25 genes that have been identified as encoding proteins for
the PSII core. These are referred to as psb (photosystem b) genes (3). In higher plants
and algae, most of these genes are located in the chloroplast genome, but some are
nuclear encoded. There are undoubtedly more to be discovered.
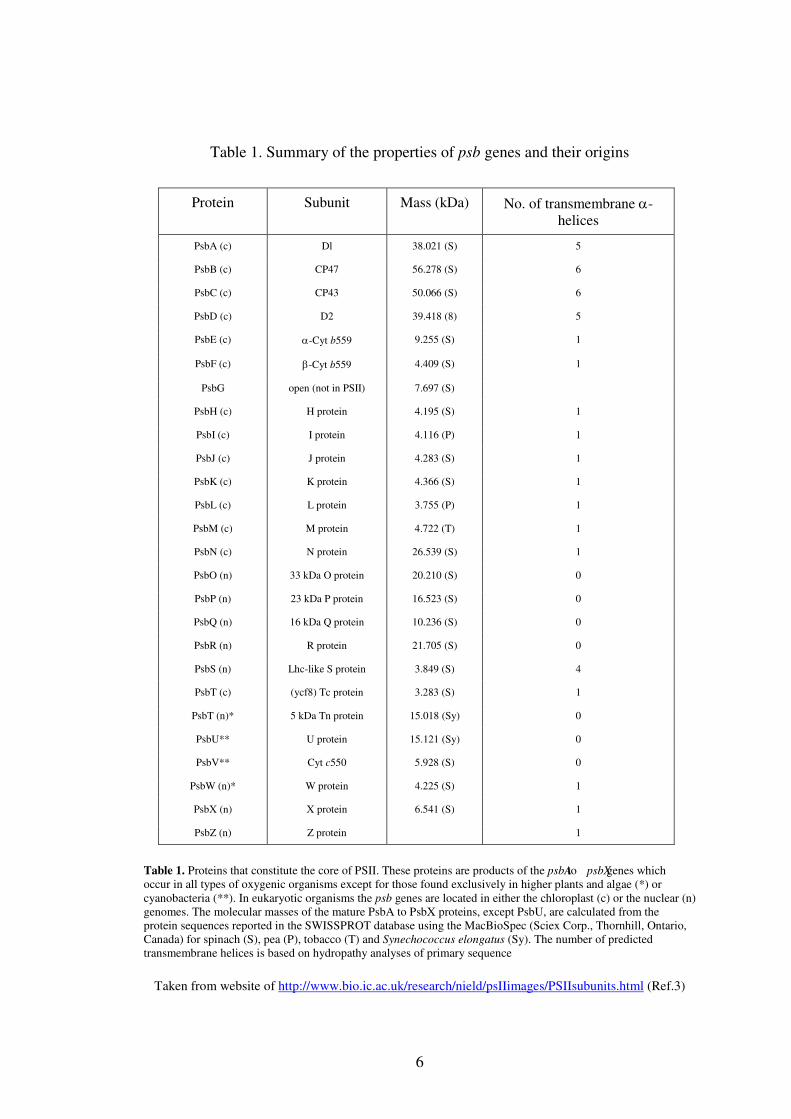
A summary in Table 1 gives the properties of the psb genes and their origins.
In higher plants, at least six intrinsic proteins are required for oxygen evolution by PS
II. These are CP47, CP43, the D1 and D2 proteins, and the α and β subunits of
cytochrome b559. CP47 and CP43 serve as the proximal antennae for PS II,
providing a conduit for excitation energy transfer from the exterior antennae of the
6
Table 1. Summary of the properties of psb genes and their origins
Table 1. Proteins that constitute the core of PSII. These proteins are products of the psbA to psbX genes which occur in all types of oxygenic organisms except for those found exclusively in higher plants and algae (*) or cyanobacteria (**). In eukaryotic organisms the psb genes are located in either the chloroplast (c) or the nuclear (n) genomes. The molecular masses of the mature PsbA to PsbX proteins, except PsbU, are calculated from the protein sequences reported in the SWISSPROT database using the MacBioSpec (Sciex Corp., Thornhill, Ontario, Canada) for spinach (S), pea (P), tobacco (T) and Synechococcus elongatus (Sy). The number of predicted transmembrane helices is based on hydropathy analyses of primary sequence
Taken from website of http://www.bio.ic.ac.uk/research/nield/psIIimages/PSIIsubunits.html (Ref.3)
Protein Subunit Mass (kDa) No. of transmembrane α-helices
PsbA (c) Dl 38.021 (S) 5
PsbB (c) CP47 56.278 (S) 6
PsbC (c) CP43 50.066 (S) 6
PsbD (c) D2 39.418 (8) 5
PsbE (c) α-Cyt b559 9.255 (S) 1
PsbF (c) β-Cyt b559 4.409 (S) 1
PsbG open (not in PSII) 7.697 (S)
PsbH (c) H protein 4.195 (S) 1
PsbI (c) I protein 4.116 (P) 1
PsbJ (c) J protein 4.283 (S) 1
PsbK (c) K protein 4.366 (S) 1
PsbL (c) L protein 3.755 (P) 1
PsbM (c) M protein 4.722 (T) 1
PsbN (c) N protein 26.539 (S) 1
PsbO (n) 33 kDa O protein 20.210 (S) 0
PsbP (n) 23 kDa P protein 16.523 (S) 0
PsbQ (n) 16 kDa Q protein 10.236 (S) 0
PsbR (n) R protein 21.705 (S) 0
PsbS (n) Lhc-like S protein 3.849 (S) 4
PsbT (c) (ycf8) Tc protein 3.283 (S) 1
PsbT (n)* 5 kDa Tn protein 15.018 (Sy) 0
PsbU** U protein 15.121 (Sy) 0
PsbV** Cyt c550 5.928 (S) 0
PsbW (n)* W protein 4.225 (S) 1
PsbX (n) X protein 6.541 (S) 1
PsbZ (n) Z protein 1
7
photosystem to the reaction center. It is also believed that they interact with proteins
associated with the site of water oxidation (15). Biochemical and genetic evidence
indicates that CP47 and CP43 may help form the binding site for extrinsic proteins to
PS II. The structurally analogous D1 and D2 proteins are at the core of PS II and
provide binding sites for a number of important redox-active cofactors in PS II.
Cytochrome b559 (cyt b559) is a heme protein in which the heme group is ligated by
the two histidine residues in α and β subunits. Many different functions have been
postulated for this cytochrome and the most favored is its possible protective role
against photoinduced damage of the reaction center. Deletion of the genes for any of
these intrinsic proteins results in the complete loss of oxygen evolution activity.
Additionally many low molecular mass components appear to be associated with PS
II, although the functions of these proteins remain obscure (6).
Three extrinsic proteins with molecular masses of 33, 23, and 17 kDa are
required for high rates of oxygen evolution. The 33 kDa protein has been termed the
manganese-stabilizing protein (MSP) due to its stabilization of the manganese cluster.
The 33 kDa protein is much more tightly associated with the intrinsic PS II proteins
than are the 23 and 17 kDa proteins. In the absence of the 33 kDa protein, high
concentrations of chloride and calcium are required to maintain the integrity of the
manganese cluster (7). The 23 and 17 kDa proteins appear to modulate the calcium
and chloride requirements for efficient oxygen evolution. Treatment with high
concentration NaCl (1-2 M) can almost totally remove the 23 and 17 kDa proteins
from PSII and reduced the oxygen evolution activity significantly. Most of the lost
activity can be recovered by the addition of moderate concentrations of calcium and
8
chloride (8, 9). These three extrinsic proteins interact with intrinsic proteins to yield
fully functional oxygen evolving complexes.
c. Manganese cluster
The oxygen evolving complex (OEC) of PS II comprises a tetranuclear Mn
cluster, a redox-active tyrosine Yz and the cofactors Ca2+ and Cl-. The Mn cluster
acts both as a catalytic site for water oxidation and as a device for the accumulation of
oxidizing equivalents from the reaction center. According to the Kok cycle, the
oxidation of water is a four-electron transfer process: the electrons are removed from
S0 to S4 and O2 is evolved at S3 to S4 to S0 (10). The point in the cycle where water
binds is unknown. The S1 state is a dark stable state. The S2 and S3 states are unstable
at room temperature, decaying back to the S1 state in about a minute. The S4 state is a
transition state with a lifetime of about 1 ms, spontaneously decaying to the S0 state
upon oxygen evolution. At least two, probably all four, Mn atoms are actively
involved in the OEC (11). However the Mn valence states remain to be resolved. The
most recent x-ray crystallography structure of the Mn cluster was at 3.5 Å solution
(Figure 4). The electron density of the Mn cluster was found to fit a cubane-like
Mn3CaO4 with the fourth Mn ion extending from one corner (12). Three of the
manganese ions and the calcium ion are located at four corners of the cube, while the
oxygen atoms are at the other corners of the cube. The fourth Mn ion is ligated by one
of the oxygens of the cube. This corresponds to the “3+1” Mn tetramer model that
was proposed based on EPR spectroscopy (2). The Mn ions in the X-ray
crystallography structure have only four or five ligands each, which are less than the
required six ligands, indicating that water molecules are probably bound to the cluster
9
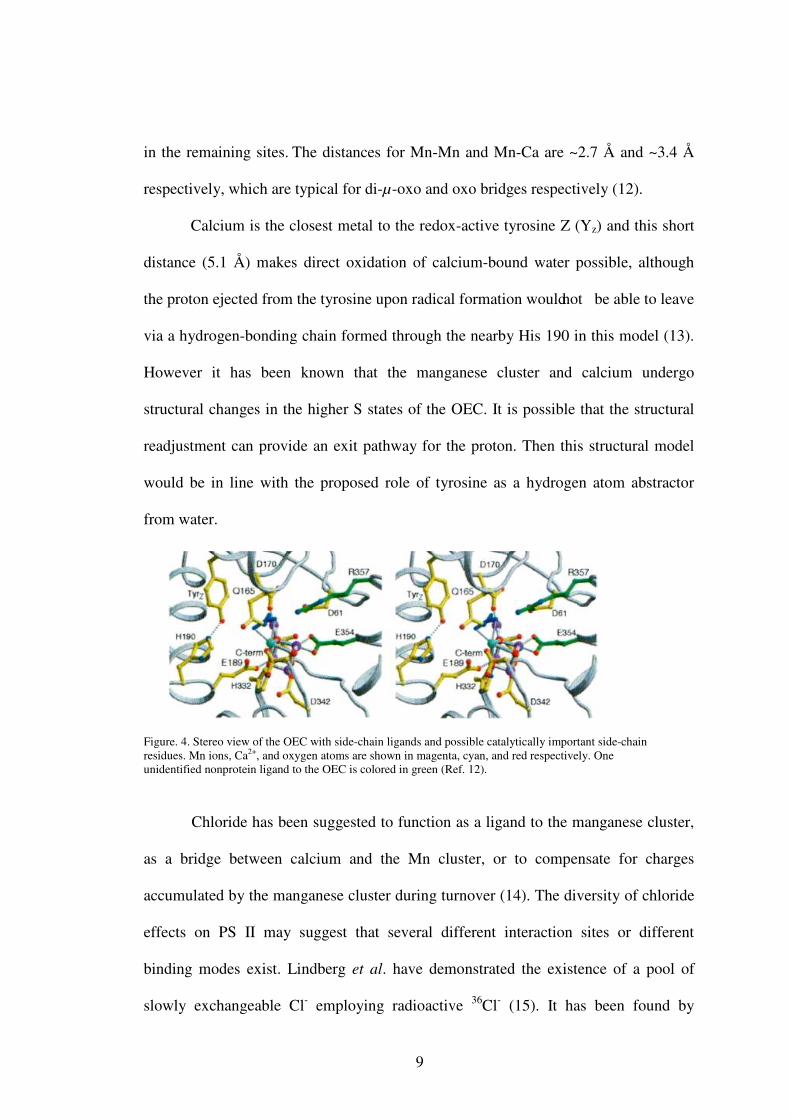
in the remaining sites. The distances for Mn-Mn and Mn-Ca are ~2.7 Å and ~3.4 Å
respectively, which are typical for di-µ-oxo and oxo bridges respectively (12).
Calcium is the closest metal to the redox-active tyrosine Z (Yz) and this short
distance (5.1 Å) makes direct oxidation of calcium-bound water possible, although
the proton ejected from the tyrosine upon radical formation would not be able to leave
via a hydrogen-bonding chain formed through the nearby His 190 in this model (13).
However it has been known that the manganese cluster and calcium undergo
structural changes in the higher S states of the OEC. It is possible that the structural
readjustment can provide an exit pathway for the proton. Then this structural model
would be in line with the proposed role of tyrosine as a hydrogen atom abstractor
from water.
Figure. 4. Stereo view of the OEC with side-chain ligands and possible catalytically important side-chain residues. Mn ions, Ca2+, and oxygen atoms are shown in magenta, cyan, and red respectively. One unidentified nonprotein ligand to the OEC is colored in green (Ref. 12).
Chloride has been suggested to function as a ligand to the manganese cluster,
as a bridge between calcium and the Mn cluster, or to compensate for charges
accumulated by the manganese cluster during turnover (14). The diversity of chloride
effects on PS II may suggest that several different interaction sites or different
binding modes exist. Lindberg et al. have demonstrated the existence of a pool of
slowly exchangeable Cl- employing radioactive 36Cl- (15). It has been found by

10
electron paramagnetic resonance (EPR) spectroscopy that the S2 state modification
occurs in the absence of chloride, thereby inhibiting oxygen evolution. The affinity
for Cl- is one order of magnitude lower in the S2 state than in the S1 state (16). It has
also been suggested that chloride stabilizes the structure of the OEC after removal of
the 23 and 17 kDa proteins. A high concentration of chloride is required to maintain
the integrity of the Mn cluster when the 33 kDa protein is removed. However
questions concerning the number of chloride ions required for function and their
locations still remain unanswered.
2. Principle of EPR Spectroscopy
Electron paramagnetic resonance (EPR) spectroscopy can be applied to
species having one or more unpaired electrons. Diamagnetic systems are invisible to
EPR, since all of their electrons are paired and there is a net spin S = 0 (where S is
the highest electron spin quantum number). Commonly encountered paramagnetic
species include organic radicals, transition metals and triplet states. The spin of an
electron and its associated magnetic moment are the basis of EPR spectroscopy. The
electron has two spin states, Ms= +1/2 and Ms = -1/2. In the absence of an applied
magnetic field, the two spin states are of equal energy, but split apart in the presence
of a magnetic field. The energy of each state is given by:
E= gµBB0Ms = ±1/2 gµBB0 (1-1)
Here is B0 the strength of the applied magnetic field in Gauss, µB is the Bohr
magneton, Ms is the electron spin quantum number and g is a proportional factor
equal to 2.00232 for a free electron. The value of the g-factor may vary in the range
1.4 to 3.0 for radicals and transition metals. The g-factor is independent of field
direction only in isotropic systems or motionally averaged systems which include
11
dilute liquid solutions of low viscosity and systems with local octahedral symmetry
and so on. In anisotropic systems, the value of the g-factor relies on the orientation of
the spin system relative to the magnetic field and is described by principal axis values
gx, gy and gz. In axial systems, gx = gy = g┴ and gz = g||. In rhombic systems, the
principal g-factors for all three axes are different, gx ≠ gy ≠ gz. The anisotropy of the
g-factors is very helpful in understanding the structure surrounding the atom in
question.
When an appropriate frequency of radiation is applied to the system, a
transition between the two energy levels can occur and be observed by EPR. The
frequency (ν) required is directly proportional to the strength of the magnetic field,
according to Planck’s law:
∆E = hν = gµBB0 (1-2)
Usually the frequency is in the microwave region such as 9.5 and 35 GHz for the
magnetic fields typically used.
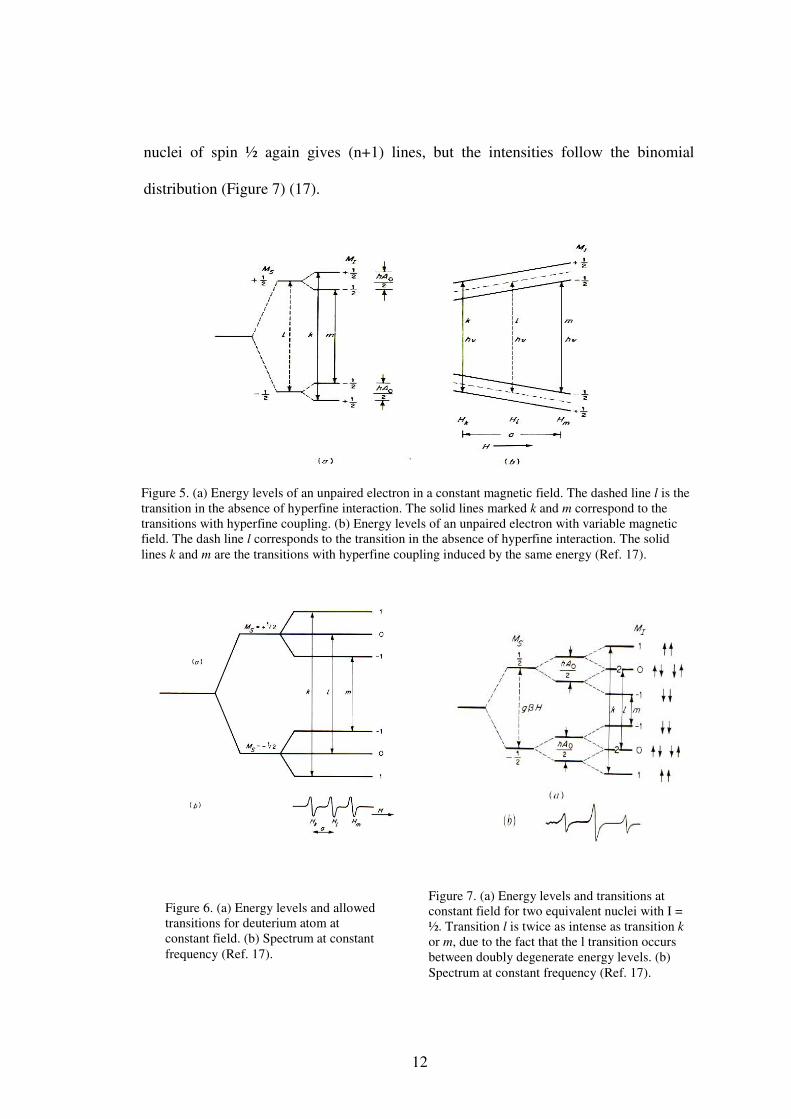
If the electron can interact with a neighboring nuclear magnetic dipole, the
two energy levels must be further split (Figure 5) (17), in a process which is called
hyperfine coupling. In this case, two transitions can be observed in Figure 5,
corresponding to two lines in the EPR spectrum. The energy of each level is given by
E = gµBB0Ms + aMsMI (1-3)
Here MI is the nuclear spin quantum number for the neighboring nucleus, and a is the
hyperfine coupling constant, which can be obtained by measuring the separation of
the two lines in gauss. Theoretically, coupling to a single nucleus of spin n/2 gives
(n+1) lines, which have equal intensities (Figure 6) (17); coupling to n equivalent
12
nuclei of spin ½ again gives (n+1) lines, but the intensities follow the binomial
distribution (Figure 7) (17).
Figure 5. (a) Energy levels of an unpaired electron in a constant magnetic field. The dashed line l is the transition in the absence of hyperfine interaction. The solid lines marked k and m correspond to the transitions with hyperfine coupling. (b) Energy levels of an unpaired electron with variable magnetic field. The dash line l corresponds to the transition in the absence of hyperfine interaction. The solid lines k and m are the transitions with hyperfine coupling induced by the same energy (Ref. 17).
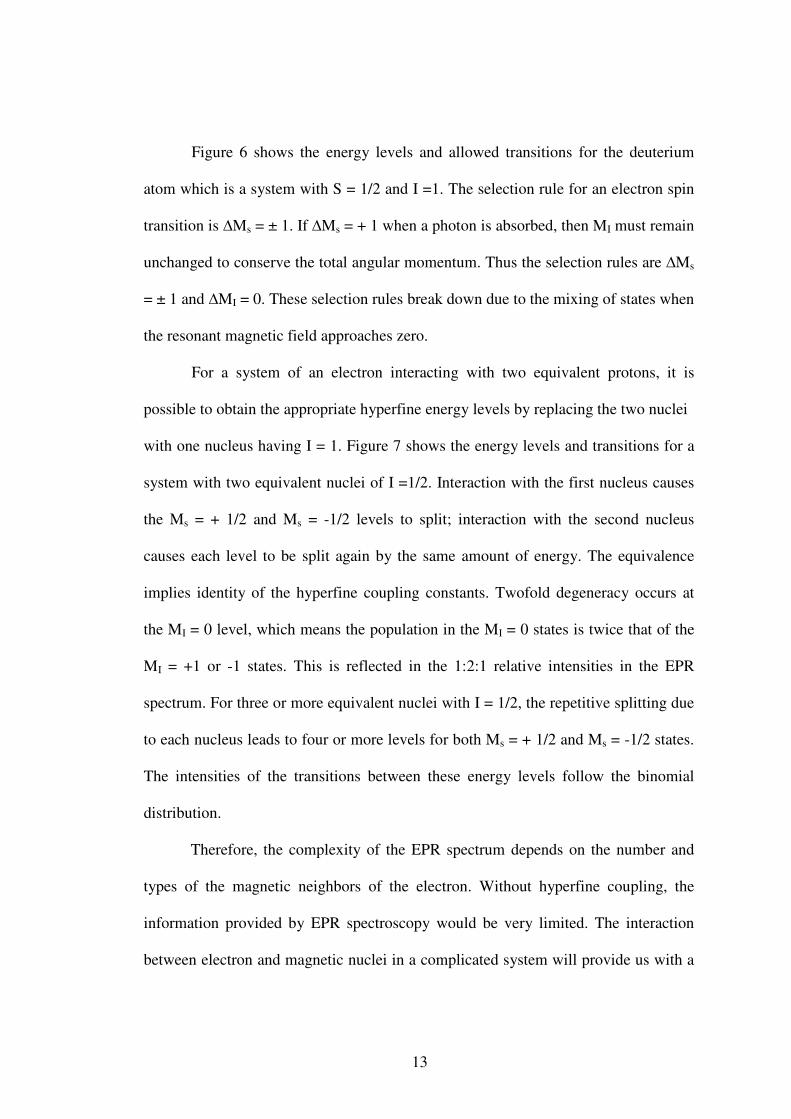
Figure 6. (a) Energy levels and allowed transitions for deuterium atom at constant field. (b) Spectrum at constant frequency (Ref. 17).
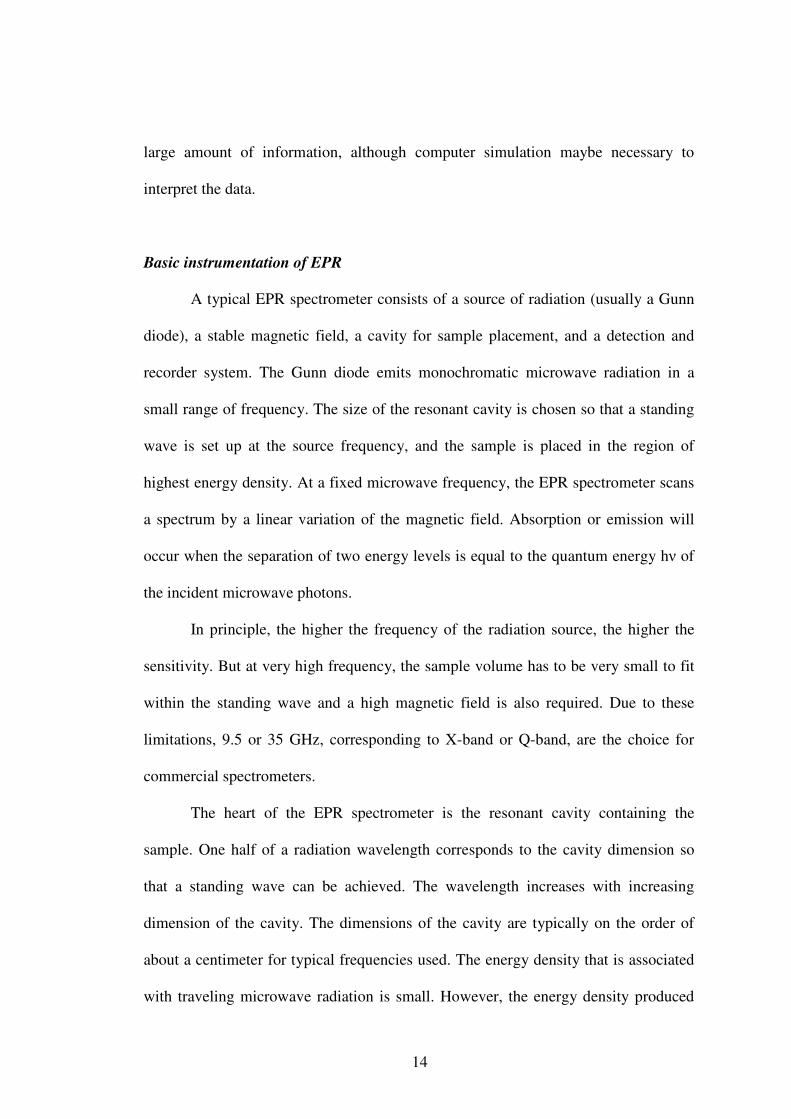
Figure 7. (a) Energy levels and transitions at constant field for two equivalent nuclei with I = ½. Transition l is twice as intense as transition kor m, due to the fact that the l transition occurs between doubly degenerate energy levels. (b) Spectrum at constant frequency (Ref. 17).
13
Figure 6 shows the energy levels and allowed transitions for the deuterium
atom which is a system with S = 1/2 and I =1. The selection rule for an electron spin
transition is ∆Ms = ± 1. If ∆Ms = + 1 when a photon is absorbed, then MI must remain
unchanged to conserve the total angular momentum. Thus the selection rules are ∆Ms
= ± 1 and ∆MI = 0. These selection rules break down due to the mixing of states when
the resonant magnetic field approaches zero.
For a system of an electron interacting with two equivalent protons, it is
possible to obtain the appropriate hyperfine energy levels by replacing the two nuclei
with one nucleus having I = 1. Figure 7 shows the energy levels and transitions for a
system with two equivalent nuclei of I =1/2. Interaction with the first nucleus causes
the Ms = + 1/2 and Ms = -1/2 levels to split; interaction with the second nucleus
causes each level to be split again by the same amount of energy. The equivalence
implies identity of the hyperfine coupling constants. Twofold degeneracy occurs at
the MI = 0 level, which means the population in the MI = 0 states is twice that of the
MI = +1 or -1 states. This is reflected in the 1:2:1 relative intensities in the EPR
spectrum. For three or more equivalent nuclei with I = 1/2, the repetitive splitting due
to each nucleus leads to four or more levels for both Ms = + 1/2 and Ms = -1/2 states.
The intensities of the transitions between these energy levels follow the binomial
distribution.
Therefore, the complexity of the EPR spectrum depends on the number and
types of the magnetic neighbors of the electron. Without hyperfine coupling, the
information provided by EPR spectroscopy would be very limited. The interaction
between electron and magnetic nuclei in a complicated system will provide us with a
14
large amount of information, although computer simulation maybe necessary to
interpret the data.
Basic instrumentation of EPR
A typical EPR spectrometer consists of a source of radiation (usually a Gunn
diode), a stable magnetic field, a cavity for sample placement, and a detection and
recorder system. The Gunn diode emits monochromatic microwave radiation in a
small range of frequency. The size of the resonant cavity is chosen so that a standing
wave is set up at the source frequency, and the sample is placed in the region of
highest energy density. At a fixed microwave frequency, the EPR spectrometer scans
a spectrum by a linear variation of the magnetic field. Absorption or emission will
occur when the separation of two energy levels is equal to the quantum energy hν of
the incident microwave photons.
In principle, the higher the frequency of the radiation source, the higher the
sensitivity. But at very high frequency, the sample volume has to be very small to fit
within the standing wave and a high magnetic field is also required. Due to these
limitations, 9.5 or 35 GHz, corresponding to X-band or Q-band, are the choice for
commercial spectrometers.
The heart of the EPR spectrometer is the resonant cavity containing the
sample. One half of a radiation wavelength corresponds to the cavity dimension so
that a standing wave can be achieved. The wavelength increases with increasing
dimension of the cavity. The dimensions of the cavity are typically on the order of
about a centimeter for typical frequencies used. The energy density that is associated
with traveling microwave radiation is small. However, the energy density produced
15
by resonance is considerably large and can be stored in the standing waves of the
resonant cavity. The standing wave pattern or mode determines the relative position
of maximum electric and magnetic fields. The sample is placed in the location where
the magnetic field is at a maximum.
The most commonly used detector is a silicon crystal which acts as a
microwave rectifier. It converts the microwave power into an electrical current. At
incident power level higher than 1 milliwatt, the detector current is proportional to the
square root of the microwave power and the detector is called a linear detector. For
quantitative signal intensity measurement, the detector should operate in the linear
region. For the detector used in most commercial instruments, the best results are
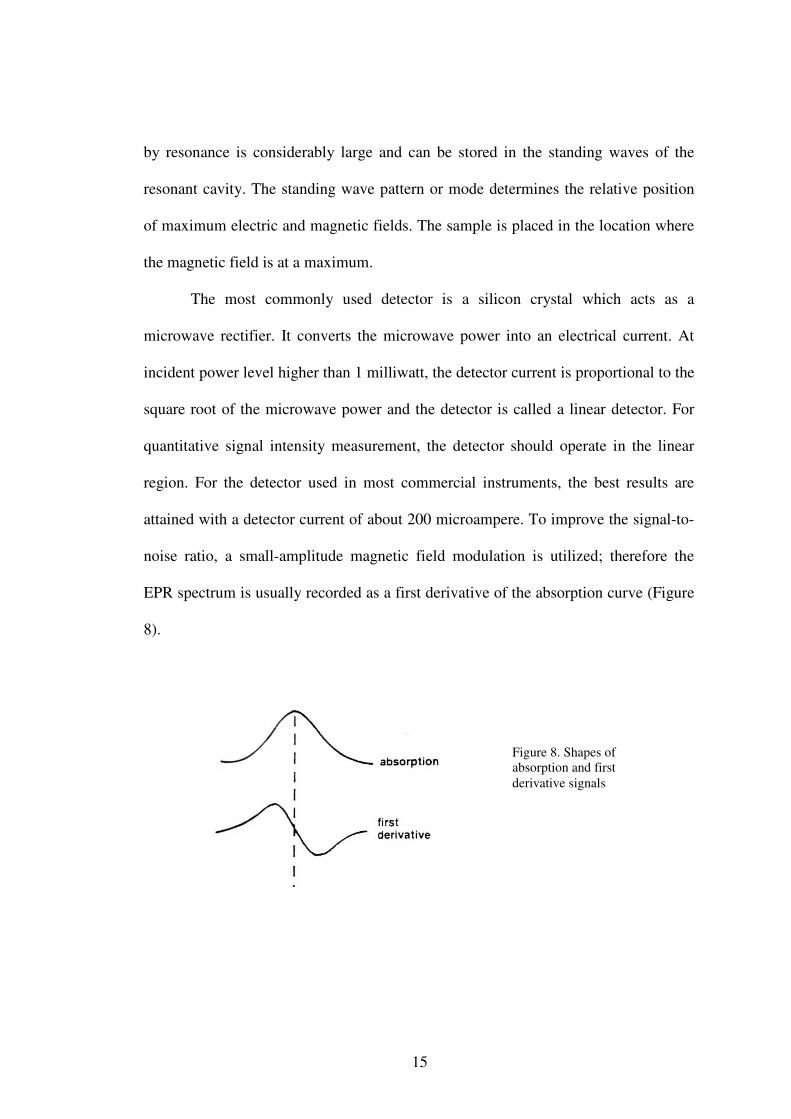
attained with a detector current of about 200 microampere. To improve the signal-to-
noise ratio, a small-amplitude magnetic field modulation is utilized; therefore the
EPR spectrum is usually recorded as a first derivative of the absorption curve (Figure
8).
Figure 8. Shapes of absorption and first derivative signals
16
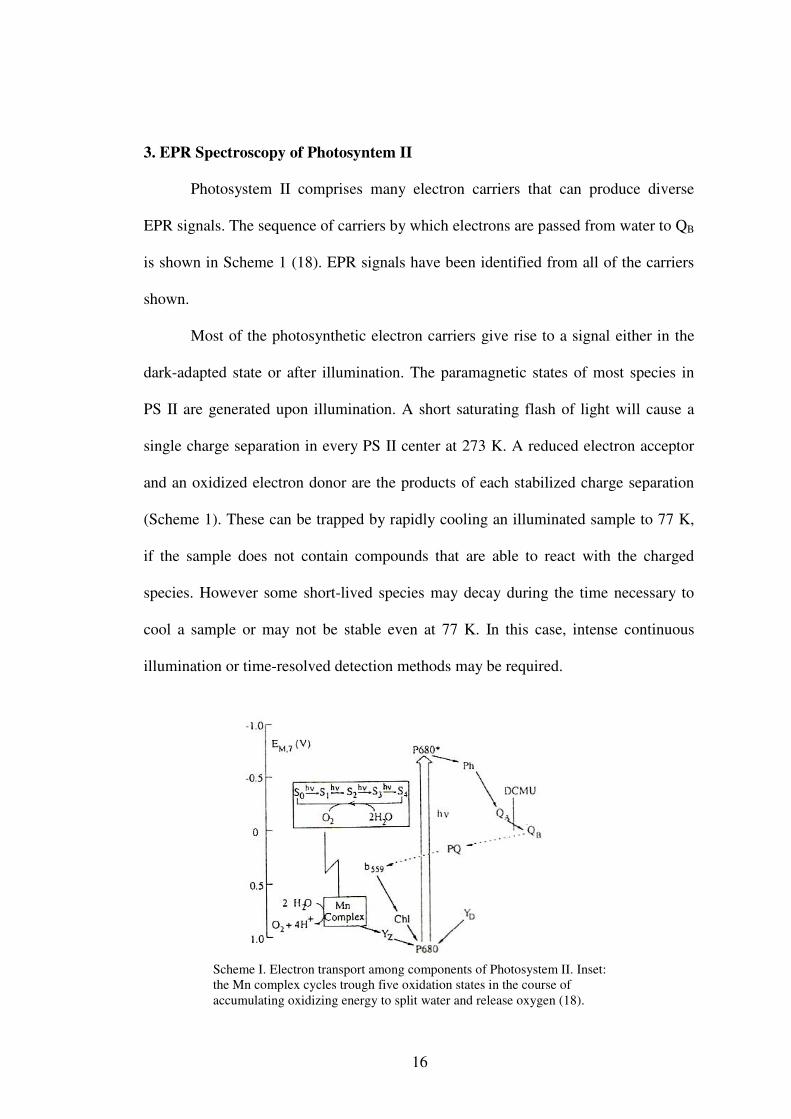
3. EPR Spectroscopy of Photosyntem II
Photosystem II comprises many electron carriers that can produce diverse
EPR signals. The sequence of carriers by which electrons are passed from water to QB
is shown in Scheme 1 (18). EPR signals have been identified from all of the carriers
shown.
Most of the photosynthetic electron carriers give rise to a signal either in the
dark-adapted state or after illumination. The paramagnetic states of most species in
PS II are generated upon illumination. A short saturating flash of light will cause a
single charge separation in every PS II center at 273 K. A reduced electron acceptor
and an oxidized electron donor are the products of each stabilized charge separation
(Scheme 1). These can be trapped by rapidly cooling an illuminated sample to 77 K,
if the sample does not contain compounds that are able to react with the charged
species. However some short-lived species may decay during the time necessary to
cool a sample or may not be stable even at 77 K. In this case, intense continuous
illumination or time-resolved detection methods may be required.
Scheme I. Electron transport among components of Photosystem II. Inset: the Mn complex cycles trough five oxidation states in the course of accumulating oxidizing energy to split water and release oxygen (18).
17
Tyrosine YD·
YD· can be generated in every PS II center by illumination at 273 K for a
minute, and trapped by cooling to 77 K. The YD· EPR signal has a g-value of 2.0046,
a linewidth of 1.9 mT, and partially resolved hyperfine peaks approximately 0.5 mT
apart. The 1:3:3:1 ratio of the lines of the YD· signal can be explained by hyperfine
coupling of the unpaired electron to two ring protons and one methylene proton. The
YD· signal is also called signal IIslow because it decays slowly in the dark. During
oxygen evolution, electron donation from YD is much slower than electron donation
by water, therefore the latter dominates.
Tyrosine Yz·
Yz is located on the D1 protein and links the one electron photochemical
reaction and water oxidation process. It donates one electron to P680+, forming the
Yz· radical. Because of the short life time of Yz
·, the EPR signal from Yz· is called IIf
or IIvf (fast or very fast), which decay on millisecond and microsecond timescales
respectively, depending on the PSII treatment. The EPR signal of Yz· has the same
lineshape as that of YD·.
The semiquinone (QA-) and semiquinone-iron complex (Fe2+QA
-)
Quinone A (QA) normally accepts one electron and passes it to quinone B
(QB) in the electron transport chain. By the time the electron reaches QA, the physical
separation of the reduced product and the oxidized product is great enough to
decrease the possibility of recombination between the two. If illumination is
performed at temperatures below 230 K, electron transport from QA to QB is very
slow, and the negative charge can be trapped on QA by rapid cooling. Alternatively,
DCMU (3-(3,4-dichlorophenyl)-1,1-dimethylurea) can be used to inhibit electron
18
transport beyond QA. The EPR signal of QA- has a g-value of 2.0044± 0.0003 with a
linewidth of 0.9 mT in the absence of the iron ion. In the presence of the Fe2+ ion, QA-
can interact with the nearby Fe2+ to produce a 40 mT wide signal at g = 1.9 and 1.64,
or a narrower signal at g = 1.82 and 1.67. These two signals represent different forms
of the Fe2+ QA- pair corresponding to higher and lower pH respectively.
Cytochrome b559
The function of cytochrome b599 remains unclear, although it is indispensable
for PSII. Different potential forms of cytochrome b599 are known: high potential,
intermediate potential, and low potential forms. The different redox forms are
characterized by small changes in the heme coordination (The heme group is ligated
by two histidine residues, which are located in the α and β subunits of cytochrome
b599, respectively). The EPR spectrum of oxidized cytochrome b559 is anisotropic
with gz ~ 3.00, gy ~ 2.20 and gx ~ 1.50, with small variations in these values
corresponding to the potential. Direct electron donation from cytochrome b559 to
P680+ bypassing the physiological donor, the Mn-cluster, is observed only under
prolonged illumination at 77 K (19, 20). It has recently been shown that electron
donation from the cytochrome occurs via a redox-active carotene (21) rather than via
a redox-active chlorophyll as previously thought.
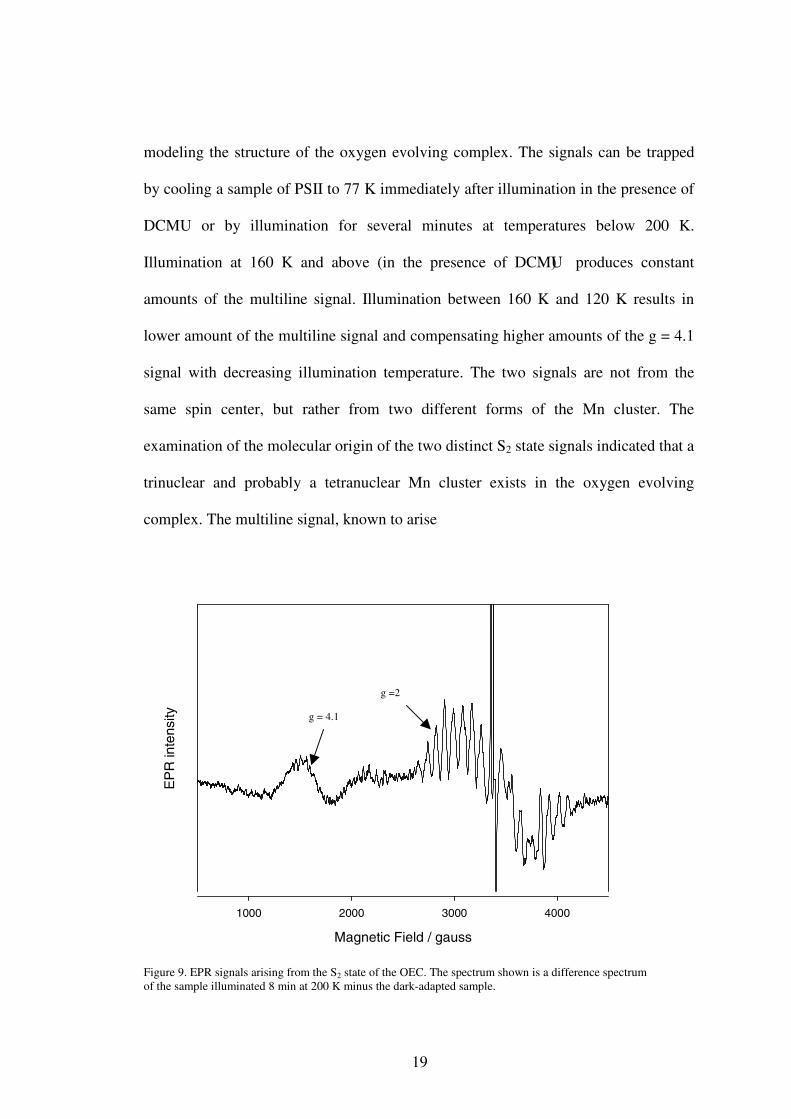
The S2 state of the Mn complex: the multiline signal and the g = 4.1 signal
The S2 state EPR signals, including a multiline signal centered at g = 2.0 and a
broad signal centered at g = 4.1, were the earliest characterized S-state signals (Figure
9) (22, 23). The g-values and overall widths of the signals, as well as the number of
hyperfine lines of the multiline signal, are indicative of a mixed-valence cluster of Mn
ions. The discovery of the S2 state EPR signals provided very useful information for
19
modeling the structure of the oxygen evolving complex. The signals can be trapped
by cooling a sample of PSII to 77 K immediately after illumination in the presence of
DCMU or by illumination for several minutes at temperatures below 200 K.
Illumination at 160 K and above (in the presence of DCMU) produces constant
amounts of the multiline signal. Illumination between 160 K and 120 K results in
lower amount of the multiline signal and compensating higher amounts of the g = 4.1
signal with decreasing illumination temperature. The two signals are not from the
same spin center, but rather from two different forms of the Mn cluster. The
examination of the molecular origin of the two distinct S2 state signals indicated that a
trinuclear and probably a tetranuclear Mn cluster exists in the oxygen evolving
complex. The multiline signal, known to arise
Magnetic Field / gauss
1000 2000 3000 4000
EP
R in
tens
ity
Figure 9. EPR signals arising from the S2 state of the OEC. The spectrum shown is a difference spectrum of the sample illuminated 8 min at 200 K minus the dark-adapted sample.
g =2
g = 4.1
20
from an S = 1/2 state, shows that at least two Mn ions are present in the OEC. For the
unique orientation where the membrane was oriented parallel to the magnetic field,
the g = 4.1 signal was itself shown to have ‘multiline’ character in ammonia treated
PSII, with at least 16 Mn hyperfine lines present. This showed that the g = 4.1 signal
also arises from a multinuclear Mn cluster (22). The ground state of an
antiferromagnetically-coupled dinuclear Mn cluster can’t give a signal in the g = 4
region (2). Thus at least three Mn ions must be present in OEC. The g = 4.1 signal
was further assigned to an S = 5/2 state by Haddy et al (23, 24) ruling out the
possibility that a single MnIV ion produced the signal. The tetranuclear Mn cluster
model is highly favored because of the possibilities for coupling and has been
reinforced by EPR spectral simulations of the multiline signal (25, 26, 27). The latest
OEC structural model resolved by X-ray crystallography has shown a distorted cubic
Mn cluster with three Mn ions at the corners of the cube and the fourth extending
from one corner, confirming the presence of four Mn ions (12).
It has been long reported that calcium depletion affects the magnetic
properties of the Mn cluster. The normal multiline signal is lost in Ca2+- depleted PSII
and is replaced by another type of multiline signal, which has partially resolved Mn
hyperfine lines (A = 5.5 mT, compare the normal A ≈ 8 mT) (28). Substitution of Sr2+
for Ca2+ also shows an altered form of the S2 multiline signal with smaller than
normal hyperfine splitting (A = 7 mT) and a stabilization of the g = 4.1 signal (29).
The recent crystal structure shows the close association of the Ca2+ ion with the cubic
Mn cluster: Ca2+ is on one corner of the cube and connected with Mn by three-µ-oxo
bridges. According to the coordination geometry of Ca2+, it is very likely that a water
molecule or hydroxide binds to Ca2+ at some stage (12).
21
The effects of chloride on the S2 state EPR signals have been investigated
extensively. Generally chloride is required for the formation of the multiline signal.
The removal of chloride induces a shift in the relative intensities of the S2 state
signals toward the g = 4.1 signal. The distribution of the S2 state signals is restored
after chloride is added back (30, 31, 32, 33, 34). The addition of other halide ions
such as Br- and I- to chloride depleted PS II samples can partially restore the S2 state
multiline signal. Competitive inhibition by F- causes a loss of the multiline signal
with a concomitant increase in the g = 4.1 signal (35, 36).
S2’ state of Mn cluster
Recently, low field EPR signals using both perpendicular and parallel mode
detection were observed from the S3 state. Interestingly the S3 state was sensitive to
near infrared (NIR) illumination. NIR-light excitation of the S3 state produced a
derivative-shaped EPR signal at g = 4.7. It was also found that the S3 state produced
the same signal after long-term incubation at 77 K. This g = 4.7 signal was correlated
with the decay of the S3-state signals and assigned to an S = 7/2 configuration of the
S2 state (denoted S2’) (37). This reported S2’ state signal is of interest because it has
not been investigated regarding the effects of chloride and other ions.
22
CHAPTER II
OVERVIEW OF EXPERIMENTS
The overall goals of the experiments performed here were to determine the Cl-
content in PSII and to examine the anion (Cl-/ I-) effects on the S2’ state.
1. Chloride Determination
The chloride requirement in oxygen evolution can be partially satisfied by
other anions such as Br-, I- and NO3-. Previous data showed that a fair amount of
oxygen evolution activity was retained after Cl- depletion (30-40%) (30).
Determination of the Cl- content in the buffers and in PSII is crucial to assessing
whether the residual activity is due to a small amount of bound Cl- after depletion. A
previous study employing radioactive 36Cl concluded that about one tightly bound Cl-
was present in each PSII and the dissociation constant of Cl- in intact PSII was 20 µM
(15). So far there has been no Cl- measurement done on a routine basis in PSII
samples. Therefore, the following several experiments were done for this research:
1. Chloride determination by AgCl colloid assay
a. The untreated and Cl- depleted PSII samples were wet-ashed with
concentrated HNO3, then the Cl- content was assayed by the AgCl colloid
assay.
b. The bound Cl- in PSII was released by Na2SO4 treatment at pH 7.5, then
the Cl- content in solution was assayed by the AgCl colloid assay.
23
2. Chloride determination by Cl- sensitive microelectrode
The Cl- content in untreated PSII was directly measured by a Cl- sensitive
microelectrode.
3. Chloride dissociation constant (Kd) determination in NaCl-washed PSII
Known concentrations of Cl- were added to NaCl-washed PSII samples, and
the concentrations of free Cl- were determined by Cl- sensitive microelectrode. A
Scatchard plot was employed to obtain the Kd for Cl- binding.
2. Anion Effects on the S2’ State
Chloride has been known to be required for the formation of the multiline
signal of the S2 state and for the S2-S3 and S3-S0 transitions (38, 39). The S2’ state, an
intermediate state between the S2 and S3 states, can be produced from the S3 state by
NIR illumination or long term incubation at 77 K. Cl- may also be required for the
formation of the S2’ state since it appears as a result of decay of the S3 state. Addition
of other ions (Br-, I-, NO3-) to Cl- depleted PSII can restore the S2 state partially. If Cl-
is required for the S2’ state, it is very possible that the S2’ state also shows an anion
effect.
1. Time dependence of S2’ signal formation
It has been reported that the S2’ signal accumulated during the decay of the S3
state at 77 K over a period of a week or two (40). A time dependence experiment was
done to determine the optimal incubation time, when the S2’ signal was maximally
developed. It was expected that the S2’ signal would increase at first during
incubation, and then decrease after reaching a maximum. This was done in both intact
and Cl- depleted PS II.
24
2. Chloride effect on the S2’ signal
After the optimal incubation time was found, the examination of the S2’ signal
was carried out in the presence and absence of chloride. Both Cl- depleted PSII and
PSII without the 17 and 23 kDa subunits were examined for the effect of Cl-.
3. Iodide effect on the S2’ signal
Iodide activates the OEC in the absence of Cl-, but is an inhibitor at all
concentrations in the presence of Cl-. It was found in a previous study that the
inhibition by I- occurred at a higher state than S2 (52). The effect of iodide on the S2’
signal was carried out using following samples:
a. Cl- depleted PS II with both Cl- and I- added. In this case, I- is an inhibitor.
b. Cl- depleted PS II with only a small amount (2 mM) of I-. Here I- is an
activator.
c. Cl- depleted PS II with an inhibitory amount (25 mM) of I-.
25
CHAPTER III
MATERIALS AND METHODS
1. Reagents
Unless otherwise stated, all chemicals were obtained from Fisher Scientific
(Fair Lawn, NJ). Potassium ferricyanide and bovine serum albumin (BSA) were
obtained from Sigma (St. Louis, MO). Atrazine was obtained from Supelco
(Bellefonte, PA). Phenyl-p-benzoquinone which was obtained from Aldrich
(Milwaukee, WI), was purified by recrystallization from ethanol. The water used in
the present experiments was filtered using a Barnstead Nanopure Diamond Lab
Water System.
2. General Methods for PSII
a. Intact PS II preparation
PS II-enriched thylakoid membranes were prepared from fresh market spinach
as in (42) with little modification. The spinach was first homogenized in Buffer I
containing 350 mM sucrose, 20 mM 2-(4-morpholino)-ethanesulfonic acid (MES)
and 10 mM NaCl at pH 6.3. Then the sample was centrifuged for 5 minutes at 4400 x
g and resuspended to 2.5 mg chlorophyll/ml (mgChl/ml) in Buffer II (20 mM MES, 5
mMgCl2·6H2O and 15 mM NaCl at pH 6.3). Then 1/4 volume of 25% Triton X-100
in Buffer II was added to the sample in the dark and incubated on ice for 30 mins to
extract PS II-enriched membranes. Finally the extracted membranes were washed in
Buffer IV (400 mM sucrose, 20 mM MES, 15 mM NaCl, pH 6.3) three times, each
26
for 20 mins. The washed membranes were suspended in Buffer IV and stored in
liquid nitrogen.
b. NaCl-washed PS II preparation
Intact PS II-enriched membranes were thawed from liquid nitrogen at room
temperature and resuspended in buffer containing 2 M NaCl, 0.4 M sucrose and 20
mM MES at pH 6.3 to a concentration of ~0.5 mgChl/ml. The sample was incubated
on ice in the dark for an hour or so. Then the treated sample was washed three times
with Cl- free buffer containing 0.4 M sucrose and 20 mM MES at pH 6.3. The PS II
pellet was resuspended in buffer containing 0.4 M sucrose, 40 mM MES, 15 mM
NaCl and 10 mM CaCl2 at pH 6.3 to a concentration of ~0.5 mgChl/ml for the
ferricyanide treatment. Ferricyanide was added to oxidize the non-heme iron Fe(II) to
Fe(III). The NaCl-wash treatment removes essentially all 17 and 23 kDa subunits. PS
II without the 17 and 23 kDa subunits probably does not retain Cl- after washing with
chloride free buffer.
c. Cl--depleted PS II preparation
Chloride depletion of PSII-enriched membranes retaining the 17 and 23 kDa
subunits were carried out by dialysis using a buffer containing 20 mM Mes-NaOH,
pH 6.3, and 0.40 M sucrose. PS II-enriched membranes were thawed from storage
and suspended in the buffer to a concentration of 0.5-0.8 mgChl/ml. The samples
were then centrifuged at 13,900 x g for 10 min to pellet. The pellets were resuspended
in the same buffer and centrifuged again. This wash step was repeated two more
times to remove the non-specifically bound chloride from the samples. The samples
were then resuspended to a concentration of ~2.1 mgChl/ml and placed in dialysis
tubing of molecular weight cut-off 15 kDa (Spectrum Laboratories, Laguna Hills,
27
CA). The samples were dialyzed against the Cl- free buffer at 4 ºC for ~25 hours in
the dark. These PS II membrane fragments will be referred to as Cl--depleted. The
estimated chloride concentration after dialysis was 20-40 µM based on measurements
by AgCl colloid assay. The Cl--depleted PSII membranes were then centrifuged and
stored in liquid N2.
d. Oxygen evolution assay
Oxygen evolution assays were carried out using a Clark-type oxygen electrode
(model 5331, Yellow Springs Instruments, Yellow Springs, OH). PS II samples were
thawed and suspended to the concentration of ~1.0 mgChl/ml in control buffer
containing 0.4 M sucrose, 20 mM MES-NaOH, pH 6.3, and 15 mM NaCl. Oxygen
concentration was calibrated using air-saturated distilled water and water purged of
O2 using N2 gas. Samples were exposed to saturating light using a Dolan-Jenner
(Lawrence, MA) model 180 Fiber-lite high intensity illuminator and a 500 W
projector lamp. OxyGen 3 (written by Sergei Baranov) was the program used to
accumulate data and calculate the oxygen evolution rates. The assays were carried out
at 25 ºC with 1 mM phenyl-p-benzoquinone (PPBQ) as electron acceptor added from
a 50 mM stock solution in dimethylsulfaxide. The oxygen evolution rates of PS II
samples were measured at least three times and the averages were taken to ensure the
accuracy of the measurement.
e. Determination of chlorophyll concentration
Chlorophyll was extracted from PSII by directly adding 80% of acetone. Then
the sample was mixed well and centrifuged for 2 min. The absorbance of the
supernatant was measured at 645 and 663 nm. The concentration of chlorophyll can
be obtained by following equation,
28
C = 20.2 A645 + 8.0 A663 (3-1)
Here C is the concentration of chlorophyll in mg/ml, A645 is the sample absorbance at
645 nm, and A663 is the absorbance at 663 nm.
3. Cl- Determination Procedures
a. Wet-ashed PSII assay
The PS II samples (~2.5 mgChl/ml) were wet-ashed overnight at 60ºC using 2
times the volume of concentrated HNO3. After the thick dark-green samples turned
clear yellow, the sample was neutralized with 10 M NaOH and then bleached with
30% H2O2.
b. Removal of 17, 23 kDa proteins and Cl- by sulfate treatment
Intact PS II stored in liquid nitrogen was thawed and suspended in chloride
free buffer containing 0.4 M sucrose and 20 mM MES (pH 6.3) in a 1: 30 volume
ratio. The samples were centrifuged at 20,000 rpm for 10 min in the JA20 Beckman
rotor, and the pellets were washed in the same buffer with the same volume three
times, each for 10 min, to remove all non-specifically bound Cl- ions. The final
pellets were then incubated in a buffer containing 50 mM Hepes (pH 7.5), 0.3 M
sucrose, and 50 mM Na2SO4 at a Chl concentration of 0.2 mg/ml in the dark for 30
min. The concentration of PS II in mol/l is estimated to be
[Chl]/ mg/ml * 1/ (900 g/mol) * 1/200 (3-2)
The molecular weight of chlorophyll in PSII is about 900 g/mol, and each PSII is
estimated to contain 200 chlorophylls.
29
The samples were then centrifuged at 20,000 rpm for 10 min. The supernatant
containing the 17 and 23 kDa proteins and chloride were saved for the determination
of the concentration of chloride.
c. AgCl colloid assay
The silver nitrate was added to the sample in order to determine the
concentration of chloride (15). A calibration curve was made using known
concentrations of Cl- (0-60 µM) in the same buffer added as NaCl. The absorbance
was measured at 400 nm 30 min after the addition of 2 mM AgNO3. At low
concentrations of Cl-, no clearly visible precipitate of AgCl was formed, but when
exposed to room light for 30 min, the solutions darkened due to photochemically-
formed colloidal silver in proportion to the amount of AgCl present.
d. Cl--sensitive electrode assay
A Cl- sensitive microelectrode (Lazar Research Laboratories, Los Angeles,
CA) was connected with an Accumet AR50 pH/mV/Ion/Conductivity meter (Fisher
Scientific). The AR50 meter was set to ion mode. The benefit of using a
microelectrode is that the sample size can be as small as 5 µl and the microelectrode
can be immersed only 1 mm below the sample surface to allow contact between the
solution and the electrode sensing element. The potential in millivolts detected by the
meter is proportional to the log of Cl- concentration. Given ideal conditions, the
lowest concentration that can be detected is about 10 µM. In the present experiments,
the calibration curve was prepared between 0.05 and 200 mM.
e. Determination of dissociation constant for chloride
For the study of chloride dissociation, intact PS II was thawed and treated with
2 M NaCl to remove the 17 and 23 kDa subunits as indicated. Then the samples were
30
washed three times by centrifugation in Cl- free buffer containing 0.4 M sucrose and
20 mM MES (pH 6.3) to remove the chloride. The final pellets were resuspended to a
concentration of ~3 mgChl/ml. The PSII sample was titrated with NaCl, with a total
change of volume of less than 10%. After each NaCl addition, the free chloride
concentration was measured using a Cl- sensitive microelectrode (Lazar, Los Angeles,
CA). Each data point was read 1 min after Cl- was added at 4°C.
If PSII has a single binding site for Cl-, then for the dissociation of Cl- from
PSII is given by
PS-Cl � PSII + Cl-
The dissociation constant (Kd) for chloride is
[PSII] [Cl-]Kd = (3-3)
[PSCl]The total PS II concentration, [PSII]tot, equals [PSII] plus [PSCl], so
[PSII] = [PSII]tot – [PSCl] (3-4)
Substituting equation (3-3) into (3-2)
([PSII]tot - [PSCl]) [Cl-]
Kd = (3-5) [PSCl] Equation (3-4) can be rearranged to
[PSCl] 1 [PSCl]= – (3-6)
[Cl-] [PSII]tot Kd Kd [PSII]tot
From equation (3-5), a plot of [PSCl]/[Cl-][PSII]tot versus [PSCl]/[PSII]tot yields a line
with a slope of 1/Kd from which Kd can be determined. This plot is called a Scatchard
plot (43).
31
If the enzyme has multiple binding sites and these sites are counted
independently, even though they may be on the same PSII molecule, the number of
binding sites can also be determined by Scatchard plot. In this case, the total
concentration of free Cl- sites is given by,
[PSII] = n [PSII]tot – [PSCl ]
where n is the number of the binding sites for Cl- per PSII and PSCl represents a
bound Cl-. Thus the dissociation constant (Kd) for chloride is
[PSII] [Cl-] (n[PSII]tot - [PSCl]) [Cl-]
Kd = = (3-7)
[PSCl] [PSCl]
In the same way, we obtain
[PSCl] n [PSCl]= – (3-8)
[Cl-] [PSII]tot Kd Kd [PSII]tot
If [PSCl]/([Cl-][PSII]tot is plotted versus [PSCl]/[PSII]tot, the intercept of the x axis is
n.
4. EPR Spectroscopy
a. Addition of Cl- and I- to the Cl- depleted PSII
The Cl--depleted PSII membranes were thawed at room temperature and
resuspended to a concentration of ~0.5 mgChl/ml. The sample was split into four
parts. Then they were treated with 15 mM NaCl, 2 mM NaI, 25 mM NaI and 15 mM
NaCl / 50 mM NaI, respectively. Then they were incubated on ice in the dark for ~30
min. Then the samples were ready for ferricyanide treatment.
32
b. Ferricyanide treatment
The ferricyanide treatment was carried out as in (37) with little modification to
oxidize the acceptor side iron, a prerequisite for S3 state production. The PS II-
enriched membrane fragments were treated with 2 mM ferricyanide added from a 20
mM stock solution and incubated on ice in the dark for 30 min to oxidize the
acceptor-side nonheme iron. The oxidant was subsequently removed by 3-4 wash
steps with corresponding ferricyanide-free buffer by centrifugation at 35,000 × g. The
final pellet was resuspended in ferricyanide-free buffer supplemented with 0.2 mM
atrazine to a concentration of 5-6 mgChl/ml. After incubating on ice in the dark for
~1 hour, the samples were transferred to EPR tubes.
c. Preparation of EPR samples
EPR samples were prepared in 4-mm outer diameter clear fused quartz tubes
(Wilmad Glass) at a concentration of 5-6 mgChl/ml or more. The samples were
loaded into the tubes using a 1cc syringe (Becton Dickinson & Company) with a
length of very thin intramedic tubing connected to the needle. The sample height was
about 3 cm. Samples were then dark adapted on ice for ~1 hour, frozen, and stored in
liquid nitrogen.
d. EPR spectroscopy
EPR spectroscopy was carried out at 9.5 GHz with a Bruker Instruments EMX
EPR Spectrometer (Billerica, MA). The spectrometer was equipped with a standard
ER4102ST cavity and the operating temperature was controlled by an Oxford
Instruments (Eynsham, UK) ESR 900 liquid helium cryostat. The spectra were
recorded at 10 K. The EPR settings were microwave power of 20 mW, modulation
frequency of 100 kHz, and modulation amplitude of 20 G. Frequency was monitored
33
using an EMX 048T frequency meter. Either six or four scans from 500 to 4500 G or
from 0 to 5000 G were averaged for each spectrum. The spectra of dark-adapted EPR
samples (S1 states) stored in liquid nitrogen were first recorded. Then the EPR
samples were rapidly transferred into a 195 K precooled ethanol bath for illumination.
Two Dolan-Jenner 180 Fiber-lite high intensity illuminators were used for the
illumination. To avoid warming up the samples, the light was filtered through a
solution of 5 mM CuSO4. The samples were advanced to the S2 state using 8 min
illumination, and then the spectra were recorded. Advancement to the S3 state was
achieved by illuminating the EPR samples for 8 min at 240 K (44). This procedure
yielded about 50-60% S3 and 50-40% S2 state (37). PSII centers that did not have
oxidized iron and S3 state PSII centers that were reduced by the YD radical during the
illumination were considered to account for the main contribution to the S2 state (37).
The S2’ state was produced by incubating the S3 state PS II at 77 K for several days.
The other way to generate the S2’ state is to illuminate the S3 state PS II using IR light
at 50 K for a total of 3 min with 30 s interval. This method was also tried, although it
did not work under present conditions, probably because of insufficient IR intensity
of the source.
e. Time dependence of formation of S2’ signal.
EPR samples in the S3 state were stored in liquid nitrogen to allow decay to
the S2’ state. The dependence of the S2’ state formation on the time of incubation was
determined by recording the spectra of the same sample every 2-3 days for a total of
29 days. The height of the S2’ state signals were measured to find the optimum
incubation time.
34
CHAPTER IV
RESULTS AND DISCUSSION: CHLORIDE DETERMINATION
Chloride has been known as an essential cofactor of the OEC and depletion of
chloride lowers oxygen evolution activity. EPR and Fourier transform infrared
difference spectroscopy (FTIR) show abnormal properties of the Cl--depleted OEC in
the S2 state, suggesting that chloride is closely associated with the Mn cluster but not
as a direct ligand (34, 45). However questions concerning the number of chloride ions
required for normal function and their location are still unanswered. An approximate
value of about 1 Cl-/PSII of slowly exchanging Cl- (time scale of hours) was obtained
by measuring the radioactively labeled 36Cl in PS II prepared from spinach grown in
radioactive Cl- (15, 46). Since there was no non-exchangeable chloride in PS II and
the radioactivity was not permanently associated with the PS II membranes, the
uncertainty involved in setting the zero time point for the release of chloride makes
the accurate determination of tightly bound chloride difficult.
The conclusion by the same authors that chloride is not absolutely required for
oxygen evolution is based on the experiment in which chloride-depleted PS II still
showed oxygen-evolving activity at low levels of 30-40% (30). However whether the
depletion of chloride was complete is still questionable since the radioactivity
measurement of chloride binding needs to be further confirmed. So, precise
determination of the chloride concentration in untreated and chloride-depleted PS II is
important for understanding the function of chloride in PS II.
35
1. Chloride Determination in PSII by AgCl Colloid Assay
a. Cl- content in wet-ashed PSII samples
We attempted to measure Cl- in untreated and Cl- depleted PS II after wet
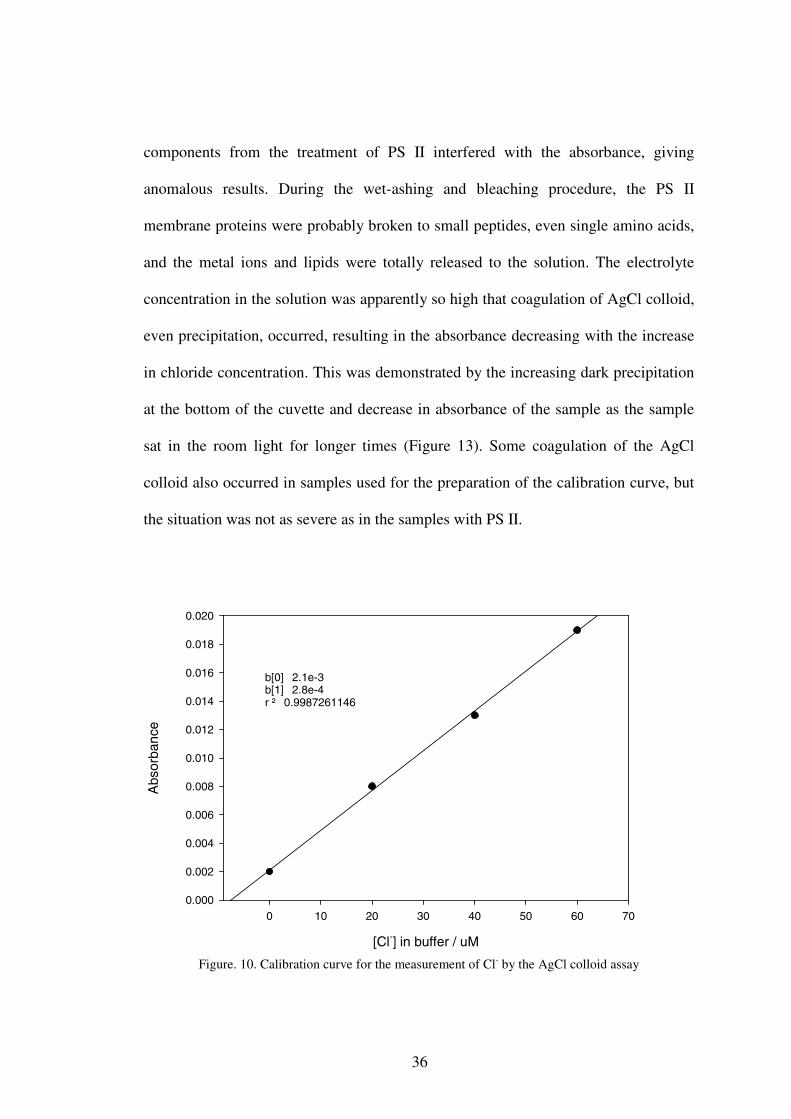
ashing using the AgCl colloid assay. The calibration curve was made in buffer
medium that contained all reagents added during sample preparation, but without the
sample (Figure 10). At low Cl- concentrations (<100 µM), the linear relationship
between the absorbance and concentration of Cl- was maintained very well according
Beer’s law. This assay is a little tricky because formation of the AgCl colloid is
photo-sensitive, therefore a consistent exposure time to room light is required to
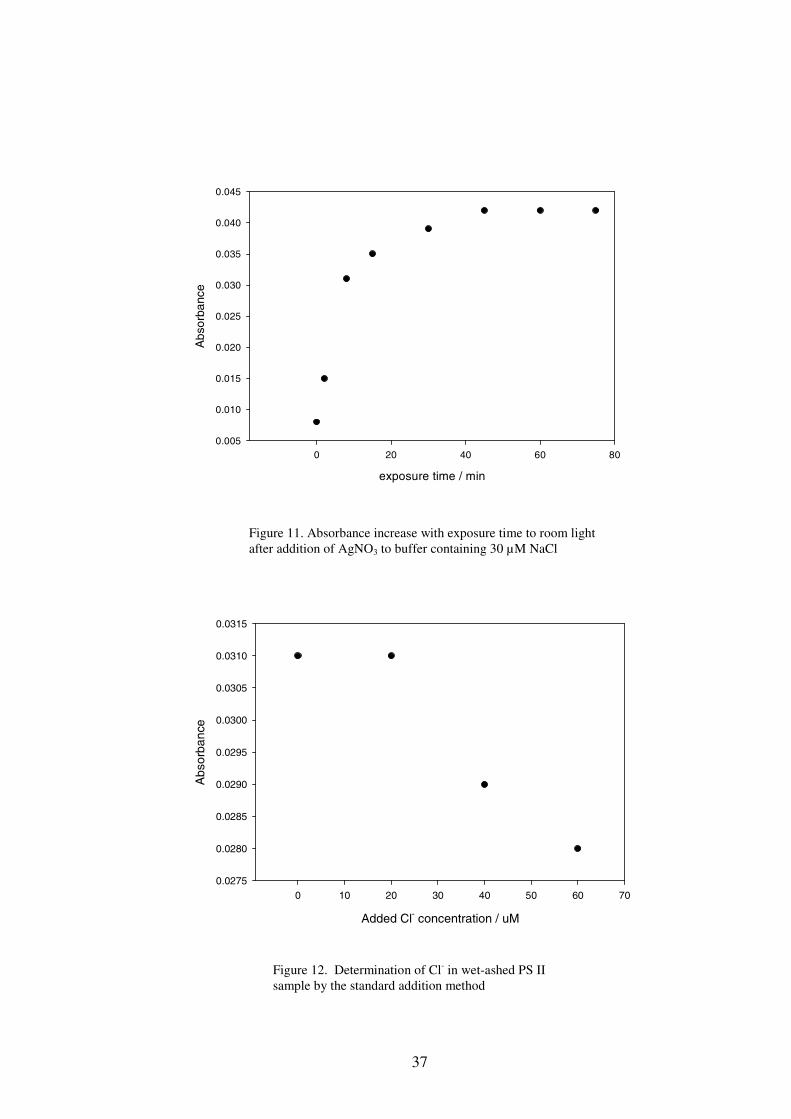
obtain accurate result. Increase in the absorbance of the standard solution containing
NaCl after addition of AgNO3 was observed with longer exposure times, and the
absorbance reached 93% of the maximum after 30 min exposure under room light
(Figure 11). In the present study, all absorbance readings were taken 30 min after the
addition of AgNO3 to the buffer medium or samples.
The concentration of Cl- in PS II samples that had been washed to remove
excess Cl- was expected to be in the micromolar range after the wet-ashing and
peroxide treatment of the sample, given one Cl- per PSII. To measure such trace
amounts of chloride, the method of standard additions is more reliable than direct
measurement in the presence of interfering species. Known concentrations of Cl- were
added to PS II samples with the expectation that the concentration of Cl- in the
original solution could be found by extrapolation of the absorbance readings to zero
addition. However this method did not give a satisfactory result (Figure 12), with the
absorbance decreasing with added Cl- instead of increasing. Since in the absence of
the PS II sample, the absorbance obeyed Beer’s law, it was thought that the
36
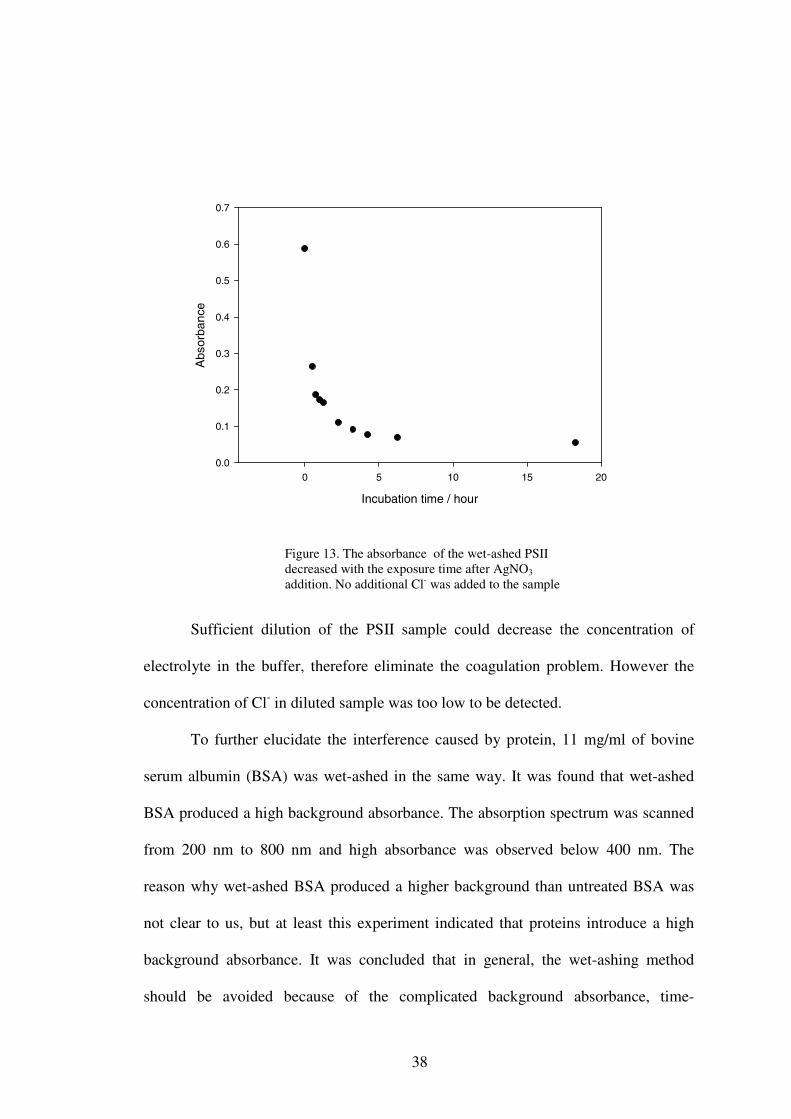
components from the treatment of PS II interfered with the absorbance, giving
anomalous results. During the wet-ashing and bleaching procedure, the PS II
membrane proteins were probably broken to small peptides, even single amino acids,
and the metal ions and lipids were totally released to the solution. The electrolyte
concentration in the solution was apparently so high that coagulation of AgCl colloid,
even precipitation, occurred, resulting in the absorbance decreasing with the increase
in chloride concentration. This was demonstrated by the increasing dark precipitation
at the bottom of the cuvette and decrease in absorbance of the sample as the sample
sat in the room light for longer times (Figure 13). Some coagulation of the AgCl
colloid also occurred in samples used for the preparation of the calibration curve, but
the situation was not as severe as in the samples with PS II.
Figure. 10. Calibration curve for the measurement of Cl- by the AgCl colloid assay
[Cl-] in buffer / uM
0 10 20 30 40 50 60 70
Abs
orba
nce
0.000
0.002
0.004
0.006
0.008
0.010
0.012
0.014
0.016
0.018
0.020
b[0] 2.1e-3 b[1] 2.8e-4
r ² 0.9987261146
37
Added Cl- concentration / uM
0 10 20 30 40 50 60 70
Abs
orba
nce
0.0275
0.0280
0.0285
0.0290
0.0295
0.0300
0.0305
0.0310
0.0315
Figure 12. Determination of Cl- in wet-ashed PS II sample by the standard addition method
Figure 11. Absorbance increase with exposure time to room light after addition of AgNO3 to buffer containing 30 µM NaCl
exposure time / min
0 20 40 60 80
Abs
orba
nce
0.005
0.010
0.015
0.020
0.025
0.030
0.035
0.040
0.045
38
Sufficient dilution of the PSII sample could decrease the concentration of
electrolyte in the buffer, therefore eliminate the coagulation problem. However the
concentration of Cl- in diluted sample was too low to be detected.
To further elucidate the interference caused by protein, 11 mg/ml of bovine
serum albumin (BSA) was wet-ashed in the same way. It was found that wet-ashed
BSA produced a high background absorbance. The absorption spectrum was scanned
from 200 nm to 800 nm and high absorbance was observed below 400 nm. The
reason why wet-ashed BSA produced a higher background than untreated BSA was
not clear to us, but at least this experiment indicated that proteins introduce a high
background absorbance. It was concluded that in general, the wet-ashing method
should be avoided because of the complicated background absorbance, time-
Figure 13. The absorbance of the wet-ashed PSII decreased with the exposure time after AgNO3
addition. No additional Cl- was added to the sample
Incubation time / hour
0 5 10 15 20
Abs
orba
nce
0.0
0.1
0.2
0.3
0.4
0.5
0.6
0.7
39
consuming preparation (at least 24 hours for wet-ashing and bleaching), and the
additional dilution factor introduced in the bleaching step.
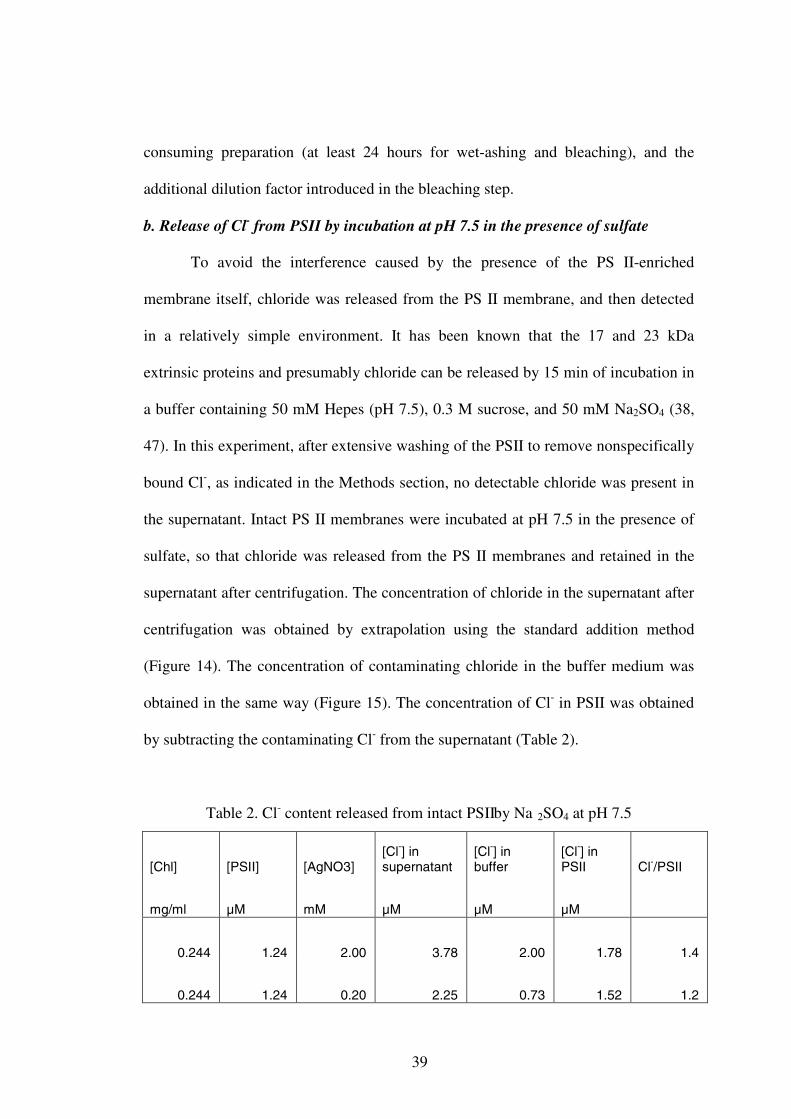
b. Release of Cl- from PSII by incubation at pH 7.5 in the presence of sulfate
To avoid the interference caused by the presence of the PS II-enriched
membrane itself, chloride was released from the PS II membrane, and then detected
in a relatively simple environment. It has been known that the 17 and 23 kDa
extrinsic proteins and presumably chloride can be released by 15 min of incubation in
a buffer containing 50 mM Hepes (pH 7.5), 0.3 M sucrose, and 50 mM Na2SO4 (38,
47). In this experiment, after extensive washing of the PSII to remove nonspecifically
bound Cl-, as indicated in the Methods section, no detectable chloride was present in
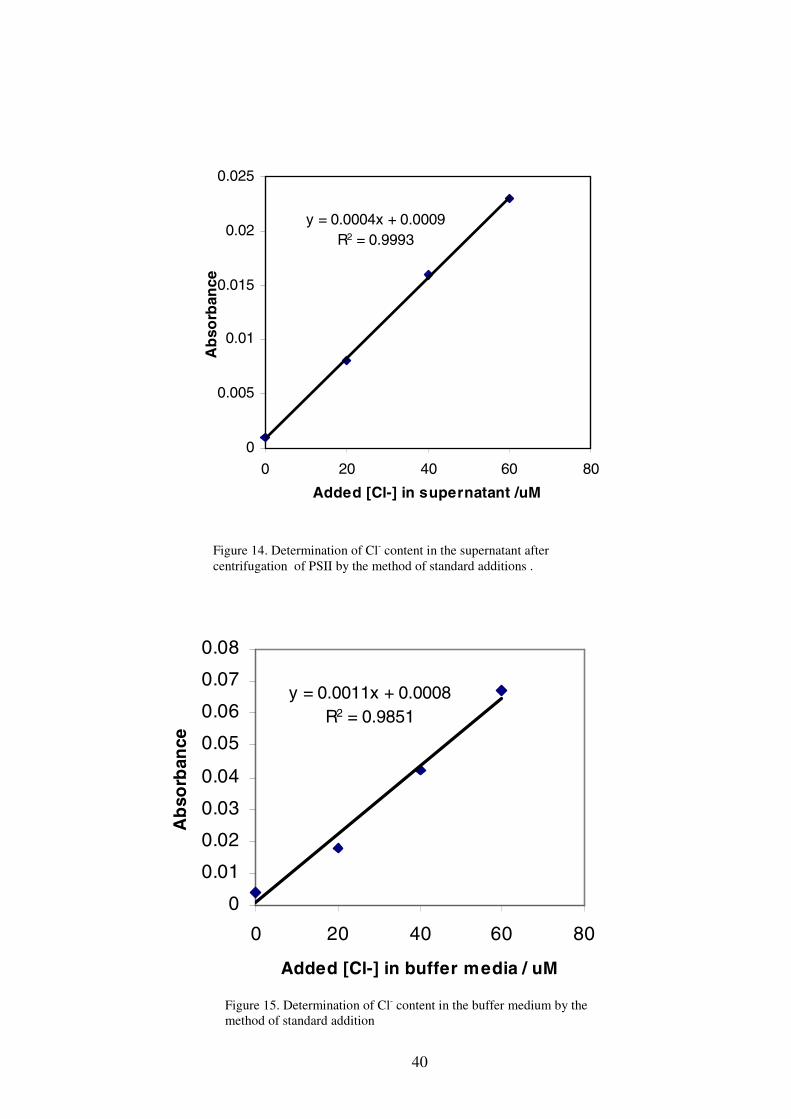
the supernatant. Intact PS II membranes were incubated at pH 7.5 in the presence of
sulfate, so that chloride was released from the PS II membranes and retained in the
supernatant after centrifugation. The concentration of chloride in the supernatant after
centrifugation was obtained by extrapolation using the standard addition method
(Figure 14). The concentration of contaminating chloride in the buffer medium was
obtained in the same way (Figure 15). The concentration of Cl- in PSII was obtained
by subtracting the contaminating Cl- from the supernatant (Table 2).
Table 2. Cl- content released from intact PSII by Na 2SO4 at pH 7.5
[Chl] [PSII] [AgNO3][Cl-] in supernatant
[Cl-] in buffer
[Cl-] in PSII Cl-/PSII
mg/ml µM mM µM µM µM
0.244 1.24 2.00 3.78 2.00 1.78 1.4
0.244 1.24 0.20 2.25 0.73 1.52 1.2
40
y = 0.0011x + 0.0008R2 = 0.9851
0
0.01
0.02
0.03
0.04
0.05
0.06
0.07
0.08
0 20 40 60 80
Added [Cl-] in buffer media / uM
Ab
sorb
ance
y = 0.0004x + 0.0009R2 = 0.9993
0
0.005
0.01
0.015
0.02
0.025
0 20 40 60 80
Added [Cl-] in supernatant /uM
Ab
sorb
ance
Figure 14. Determination of Cl- content in the supernatant after centrifugation of PSII by the method of standard additions .
Figure 15. Determination of Cl- content in the buffer medium by the method of standard addition
41
It was found that each PSII molecule contained approximately one high affinity Cl-
(1.4 and 1.2 Cl-/PSII respectively), which was consistent with the result obtained
from radioactive measurement (15).
The Cl- contamination of buffers was routinely found to be in the range 20-40
µM Cl- (38) which was also found in our lab. However, the chloride contamination
could be reduced by carefully rinsing the containers and equipment in the fresh
purified water before use, wearing gloves throughout the experiment, and using
highly purified reagents. It was found that the chloride contamination in buffer
without MES (< 5 µM usually) was much lower than in buffer containing MES (~20
µM). In addition, the chloride contamination could be further reduced by adding a
lower amount of AgNO3. Table 2 showed that the contaminating Cl- in the buffer was
lower when the final concentration of AgNO3 was 0.2 mM instead of 2.0 mM. There
were no detectable amounts of Cl- in the Nanopure water used in this experiment.
However one can question the accuracy of the result because the concentration of
chloride in this experiment was so close to the detection limit of the AgCl colloid
assay, which is 1 µM (15). Efforts to concentrate the sample were made by blowing
nitrogen over the sample, but the high viscosity caused by the concentrated sucrose in
the buffer limited the concentration of the samples. Although further improvement
needs to be made, the current method provided a regular, simple measurement of Cl-
released from the PS II membranes, and the result obtained matched that of the
previous radioactive 36Cl method (46).
It was thought that the Cl- concentration in Cl- depleted PSII samples would
be too low to be detected by releasing the Cl- from PSII to the buffer in the same way
as above. It was expected that the Cl- concentration in Cl- depleted sample would be
42
about the same as in the releasing buffer (50 mM Hepes, 0.3 M sucrose, and 50 mM
Na2SO4, pH 7.5), therefore it could not be detected by the AgCl colloid assay.
2. Chloride Determination in PSII Using a Cl- Sensitive Microelectrode
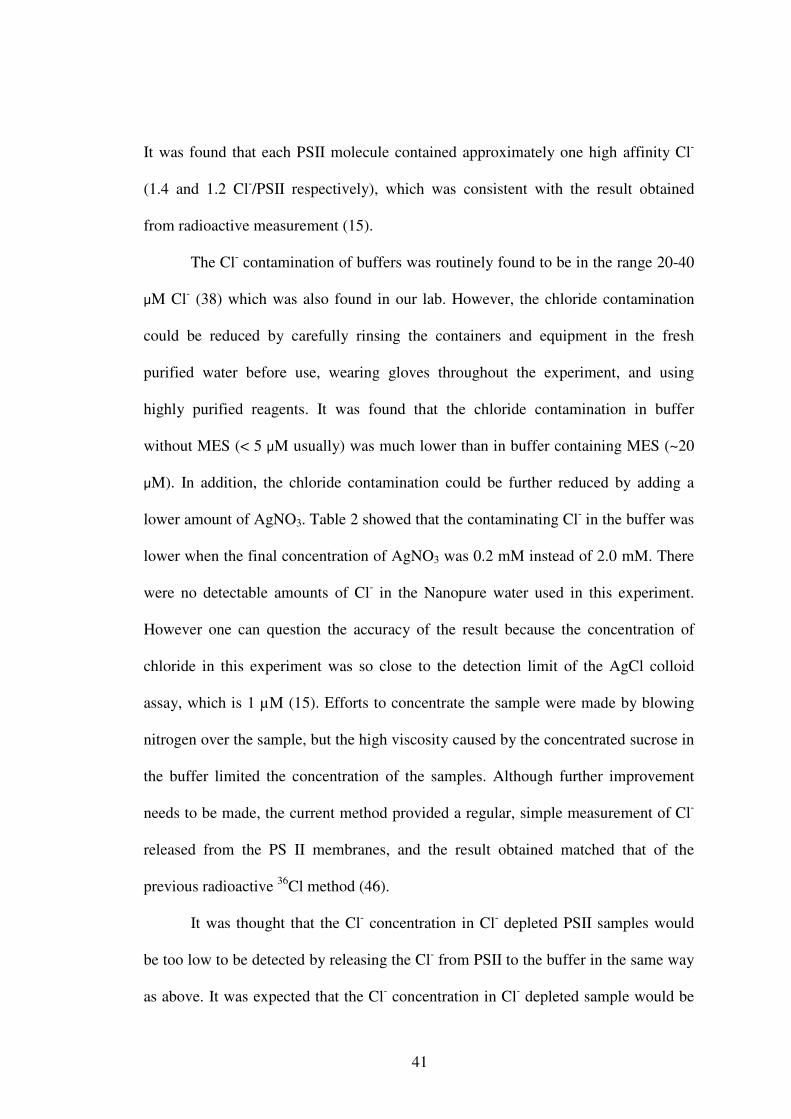
Under ideal conditions, the lowest concentration that can be detected using the
Cl- sensitive microelectrode is about 10 µM. In the present experiments, the
calibration curve was prepared between 0.05 and 200 mM (Figure 16). At
concentrations lower than 0.05 mM, the electrode readings were no longer consistent
and the experimental error became very large. In this case, to bring Cl- into the
detectable range, the PSII concentration must be higher than 0.05 mM (corresponding
to 9 mgChl/ml), given 1 Cl-/PSII. However the PSII samples were very thick at such
y = -45.943x + 153.03R2 = 0.994
0
50
100
150
200
250
-1.5 -1 -0.5 0 0.5 1 1.5
log [Cl] / mM
E /
mv
high concentrations, so that the response time of the electrode became longer and the
behavior the electrode was not predictable. No reliable data were obtained so far by
Figure 16. Calibration curve for Cl- determination by Cl- sensitive microelectrode
43
direct measurement of Cl- content in PSII using the Cl- microelectrode. Other
pretreatments such as wet-ashing and Cl- releasing tended to dilute the sample and
make the Cl- concentration even lower. In summary, the Cl- electrode was not
sensitive enough to detect the chloride in PSII samples directly.
3. Determination of Dissociation Constant for Chloride
In previous experiments (Lindberg et al.,1990), PS II membranes isolated
from spinach grown on medium containing Na36Cl were found to have a binding site
for one Cl- ion that is in slow exchange with the surrounding medium. This tightly
bound Cl- ion was found to have a dissociation constant of about 20 µM and a
dissociation time of 1 hour (15). This result was highly dependent on the integrity of
the PS II. Removal of the extrinsic 17 and 23 kDa proteins seems to accompany with
the loss of the high affinity, slow exchanging binding site. In a PS II preparation
depleted of the extrinsic 17 and 23 kDa proteins by incubation at pH 7.5 in the
presence of 50 mM sulfate, a dissociation constant of 6.5 mM for Cl- was estimated
based on O2 evolution assay (16). The Cl- binding and equilibrium took place within
10 s and 50 mM Cl- was saturating in this polypeptide-depleted PSII preparation (16).
In the present experiment, NaCl-washed PSII membranes, which did not
contain Ca2+, Cl-, or extrinsic 17 and 23 kDa proteins, were used to determine the Cl-
affinities. The free chloride in the PSII samples was measured using a chloride
sensitive microelectrode as indicated in the Methods section after addition of different
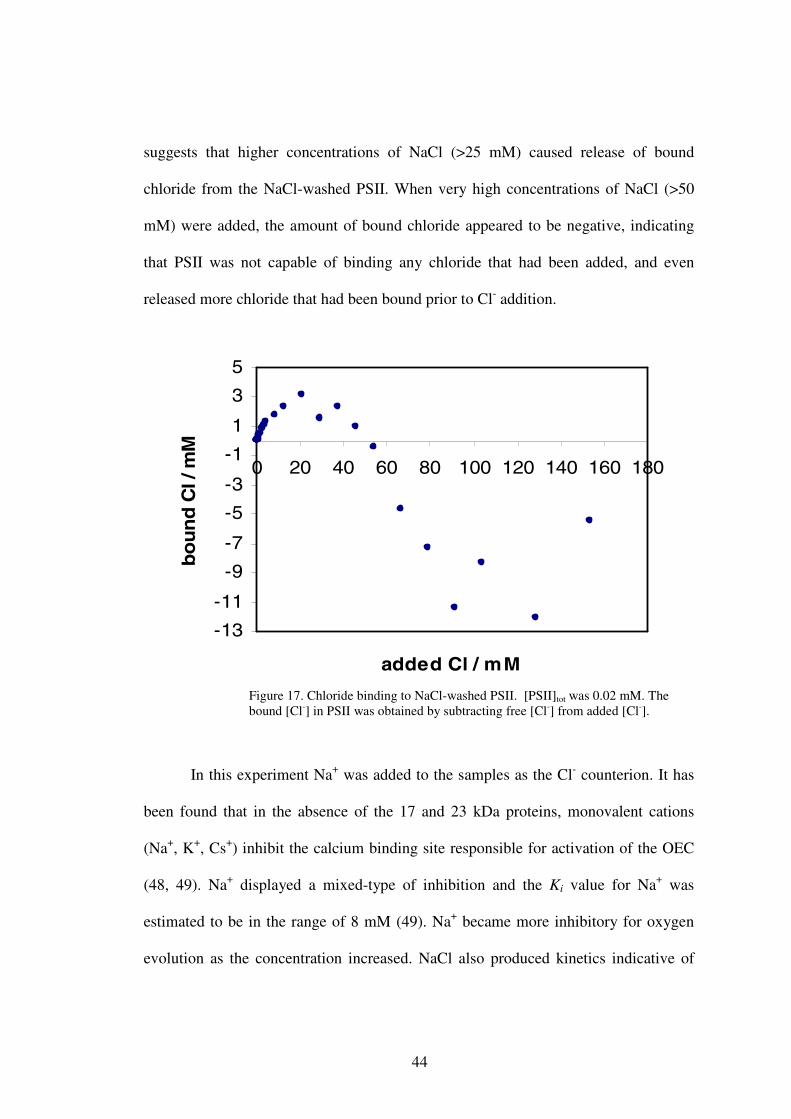
amounts of chloride in the form of NaCl. Data in Figure 17 showed that the
concentration of bound chloride reached a maximum after addition of 20 mM of
NaCl, and then decreased with further addition of NaCl. This unusual behavior
44
suggests that higher concentrations of NaCl (>25 mM) caused release of bound
chloride from the NaCl-washed PSII. When very high concentrations of NaCl (>50
mM) were added, the amount of bound chloride appeared to be negative, indicating
that PSII was not capable of binding any chloride that had been added, and even
released more chloride that had been bound prior to Cl- addition.
-13
-11
-9
-7
-5
-3
-1
1
3
5
0 20 40 60 80 100 120 140 160 180
added Cl / mM
bo
un
d C
l / m
M
In this experiment Na+ was added to the samples as the Cl- counterion. It has
been found that in the absence of the 17 and 23 kDa proteins, monovalent cations
(Na+, K+, Cs+) inhibit the calcium binding site responsible for activation of the OEC
(48, 49). Na+ displayed a mixed-type of inhibition and the Ki value for Na+ was
estimated to be in the range of 8 mM (49). Na+ became more inhibitory for oxygen
evolution as the concentration increased. NaCl also produced kinetics indicative of
Figure 17. Chloride binding to NaCl-washed PSII. [PSII]tot was 0.02 mM. The bound [Cl-] in PSII was obtained by subtracting free [Cl-] from added [Cl-].
45
non-competitive inhibition of the Cl- binding site. This inhibition can be attenuated by
increasing the concentration of Ca2+.
Here, the unusual binding results can be interpreted as resulting from Na+
inhibition. In the absence of Ca2+, as the concentration of Na+ increased, its non-
competitive inhibition for the Cl- binding site became more pronounced. When the
concentration of Na+ was higher than 20 mM, the inhibitory effects of Na+ on the Cl-
binding sites dominated the Cl- binding activity, resulting in the release of bound Cl-
from the PSII sites. Finally all bound Cl- was released from the PSII with the increase
in NaCl concentration. The NaCl-wash treatment was thought to remove all Cl- from
PSII membranes, but in this study it appeared that there was still Cl- in PSII after
NaCl-wash treatment because the amount of free Cl- in the solution was higher than
the amount of added Cl- after more than 50 mM Cl- was added. It is not sure whether
the extra chloride is from PSII or some unknown factors that affected the
measurement of Cl-.
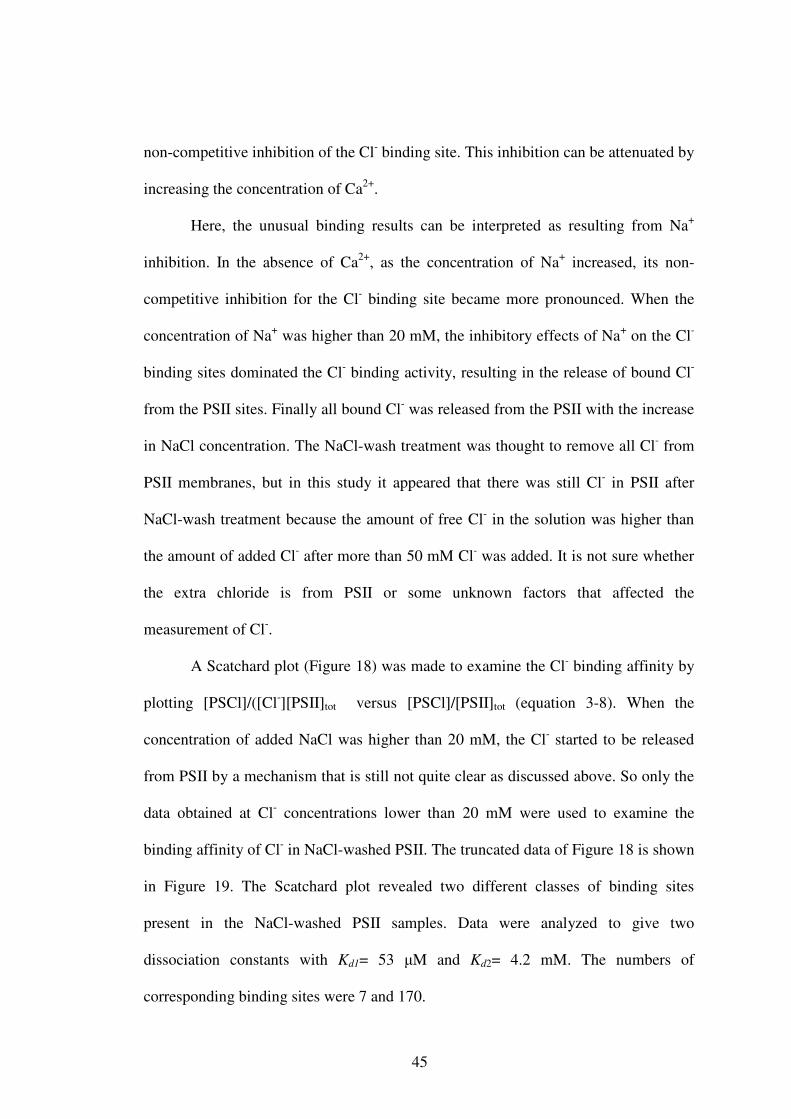
A Scatchard plot (Figure 18) was made to examine the Cl- binding affinity by
plotting [PSCl]/([Cl-][PSII]tot versus [PSCl]/[PSII]tot (equation 3-8). When the
concentration of added NaCl was higher than 20 mM, the Cl- started to be released
from PSII by a mechanism that is still not quite clear as discussed above. So only the
data obtained at Cl- concentrations lower than 20 mM were used to examine the
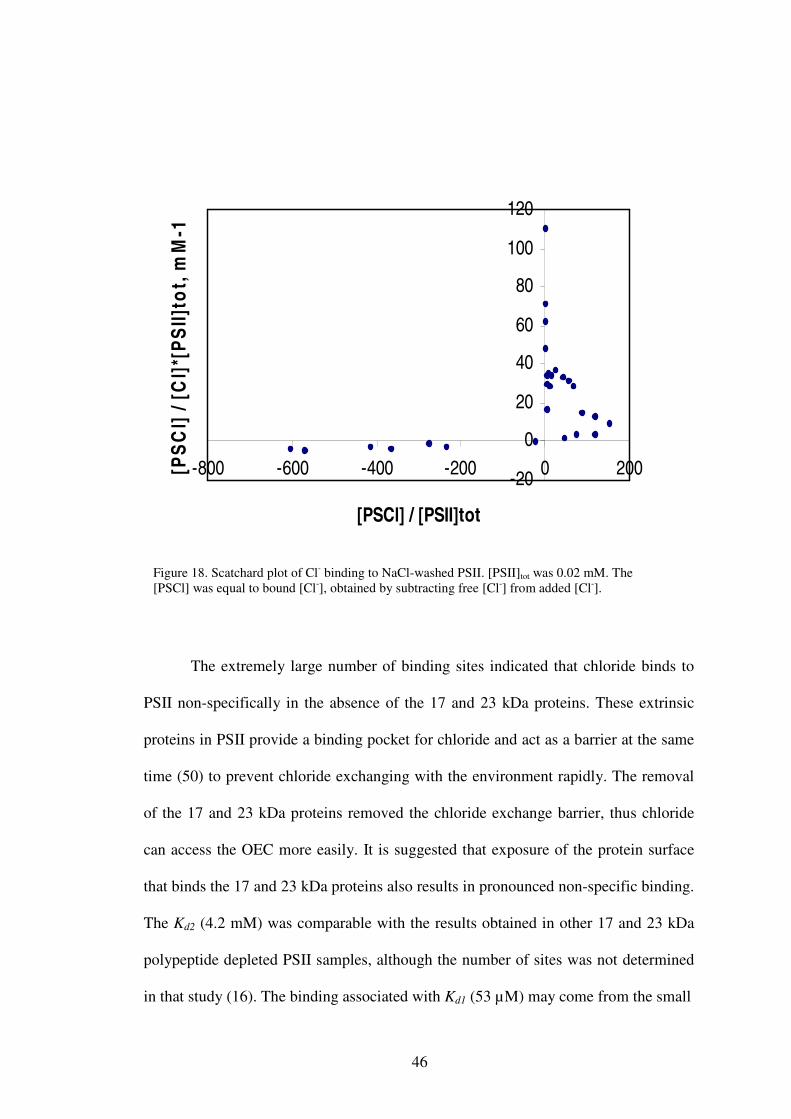
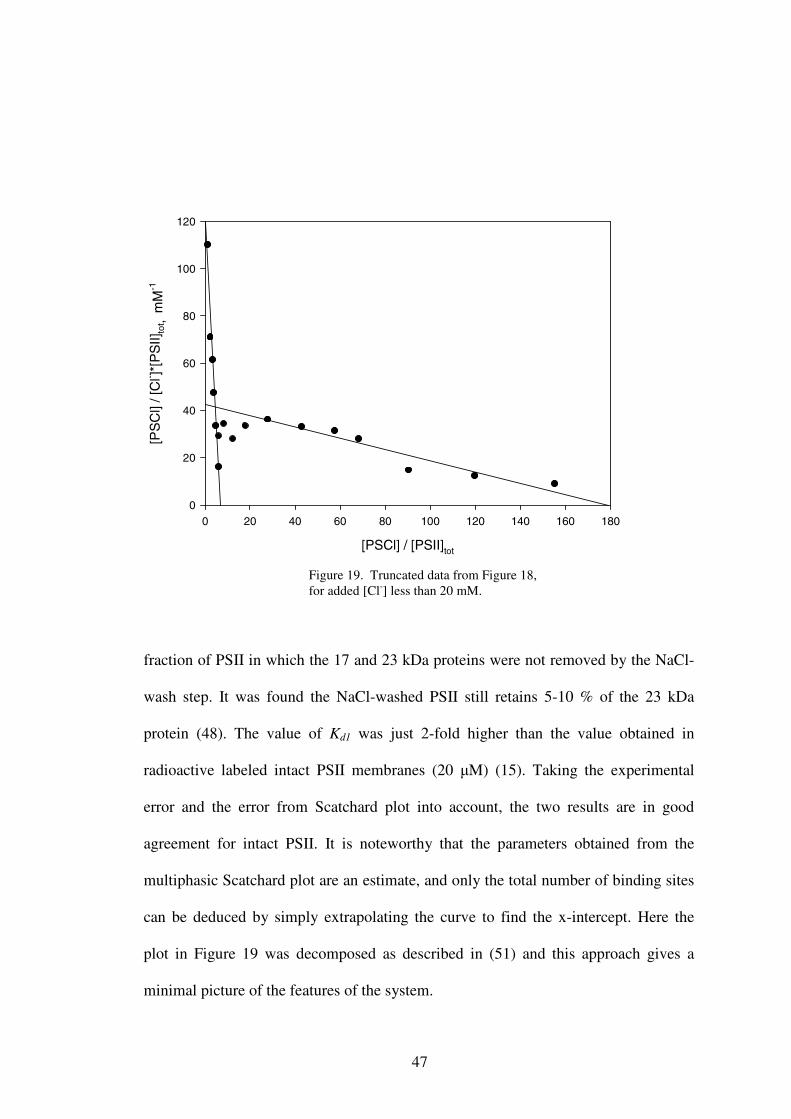
binding affinity of Cl- in NaCl-washed PSII. The truncated data of Figure 18 is shown
in Figure 19. The Scatchard plot revealed two different classes of binding sites
present in the NaCl-washed PSII samples. Data were analyzed to give two
dissociation constants with Kd1= 53 µM and Kd2= 4.2 mM. The numbers of
corresponding binding sites were 7 and 170.
46
-20
0
20
40
60
80
100
120
-800 -600 -400 -200 0 200
[PSCl] / [PSII]tot
[PS
Cl]
/ [C
l]*[
PS
II]to
t, m
M-1
The extremely large number of binding sites indicated that chloride binds to
PSII non-specifically in the absence of the 17 and 23 kDa proteins. These extrinsic
proteins in PSII provide a binding pocket for chloride and act as a barrier at the same
time (50) to prevent chloride exchanging with the environment rapidly. The removal
of the 17 and 23 kDa proteins removed the chloride exchange barrier, thus chloride
can access the OEC more easily. It is suggested that exposure of the protein surface
that binds the 17 and 23 kDa proteins also results in pronounced non-specific binding.
The Kd2 (4.2 mM) was comparable with the results obtained in other 17 and 23 kDa
polypeptide depleted PSII samples, although the number of sites was not determined
in that study (16). The binding associated with Kd1 (53 µM) may come from the small
Figure 18. Scatchard plot of Cl- binding to NaCl-washed PSII. [PSII]tot was 0.02 mM. The [PSCl] was equal to bound [Cl-], obtained by subtracting free [Cl-] from added [Cl-].
47
[PSCl] / [PSII]tot
0 20 40 60 80 100 120 140 160 180
[PS
Cl]
/ [C
l- ]*[P
SII]
tot ,
mM
-1
0
20
40
60
80
100
120
fraction of PSII in which the 17 and 23 kDa proteins were not removed by the NaCl-
wash step. It was found the NaCl-washed PSII still retains 5-10 % of the 23 kDa
protein (48). The value of Kd1 was just 2-fold higher than the value obtained in
radioactive labeled intact PSII membranes (20 µM) (15). Taking the experimental
error and the error from Scatchard plot into account, the two results are in good
agreement for intact PSII. It is noteworthy that the parameters obtained from the
multiphasic Scatchard plot are an estimate, and only the total number of binding sites
can be deduced by simply extrapolating the curve to find the x-intercept. Here the
plot in Figure 19 was decomposed as described in (51) and this approach gives a
minimal picture of the features of the system.
Figure 19. Truncated data from Figure 18, for added [Cl-] less than 20 mM.
48
CHAPTER V
RESULTS AND DISCUSSION: ANION EFFECTS ON THE S2’ STATE
The OEC cycles through five redox states denoted S0 to S4. EPR signals have
been detected from all S states, except the S4 state. The S2 state is characterized by the
extensively studied multiline signal at g = 2 and the alternative g = 4.1 signal (35).
The S3 state was characterized by recently discovered integer spin signals at g = 12
and 8 (52). Interestingly, the S3 state was found to be sensitive to near-infrared (NIR)
light. NIR excitation of the S3 state produced prominent EPR signals at about g = 4.7
and g ~3, which have been assigned to an intermediate state, denoted the S2’ state
(44). The S2’ state was associated with a proton-deficient S2 configuration with a 7/2
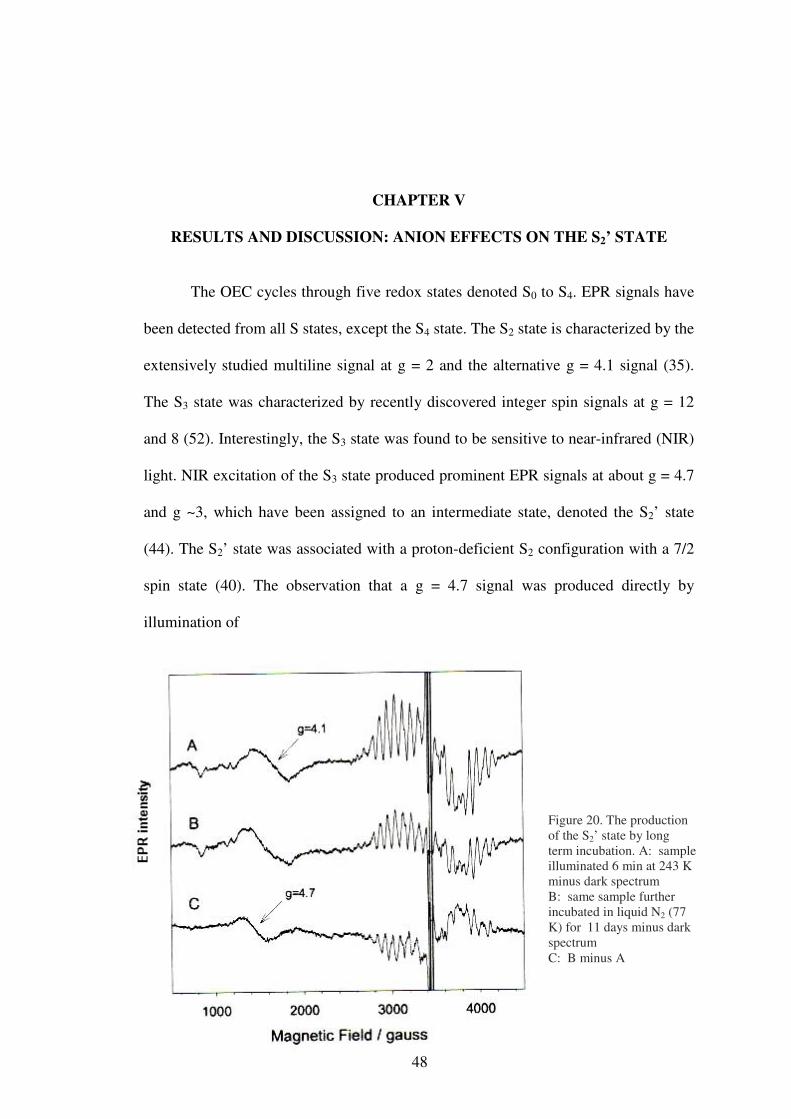
spin state (40). The observation that a g = 4.7 signal was produced directly by
illumination of
Figure 20. The production of the S2’ state by long term incubation. A: sample illuminated 6 min at 243 K minus dark spectrumB: same sample further incubated in liquid N2 (77K) for 11 days minus dark spectrumC: B minus A
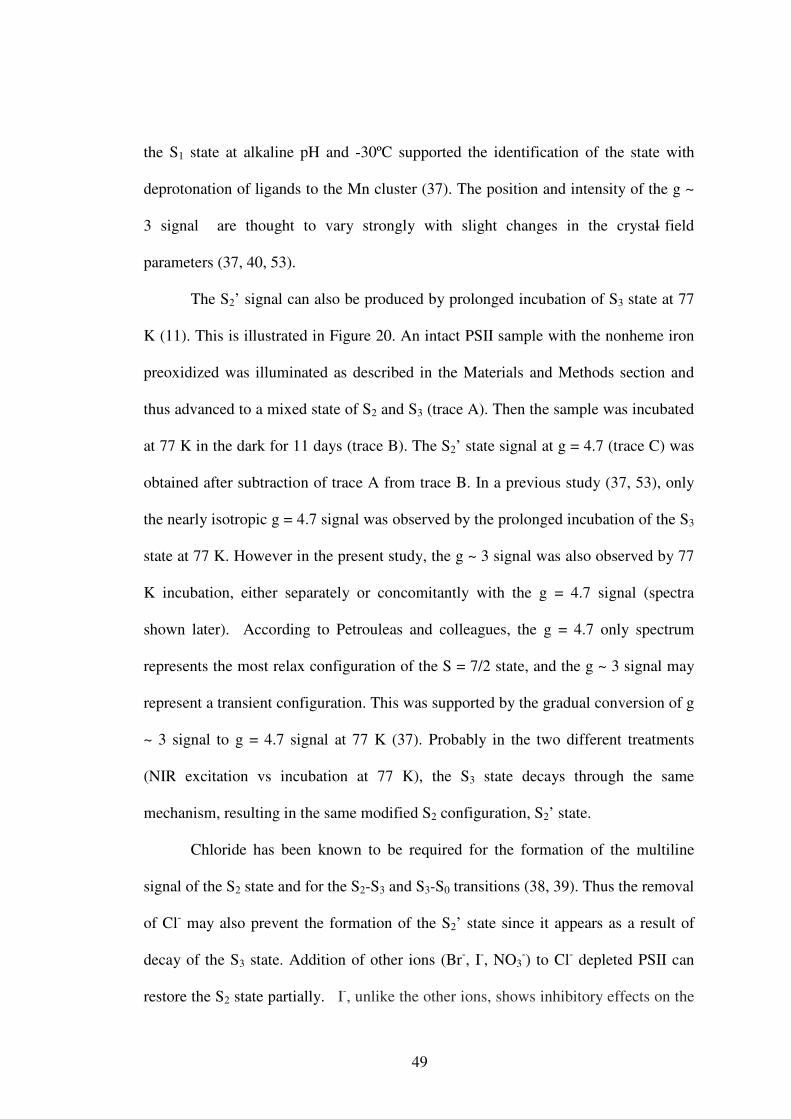
49
the S1 state at alkaline pH and -30ºC supported the identification of the state with
deprotonation of ligands to the Mn cluster (37). The position and intensity of the g ~
3 signal are thought to vary strongly with slight changes in the crystal- field
parameters (37, 40, 53).
The S2’ signal can also be produced by prolonged incubation of S3 state at 77
K (11). This is illustrated in Figure 20. An intact PSII sample with the nonheme iron
preoxidized was illuminated as described in the Materials and Methods section and
thus advanced to a mixed state of S2 and S3 (trace A). Then the sample was incubated
at 77 K in the dark for 11 days (trace B). The S2’ state signal at g = 4.7 (trace C) was
obtained after subtraction of trace A from trace B. In a previous study (37, 53), only
the nearly isotropic g = 4.7 signal was observed by the prolonged incubation of the S3
state at 77 K. However in the present study, the g ~ 3 signal was also observed by 77
K incubation, either separately or concomitantly with the g = 4.7 signal (spectra
shown later). According to Petrouleas and colleagues, the g = 4.7 only spectrum
represents the most relax configuration of the S = 7/2 state, and the g ~ 3 signal may
represent a transient configuration. This was supported by the gradual conversion of g
~ 3 signal to g = 4.7 signal at 77 K (37). Probably in the two different treatments
(NIR excitation vs incubation at 77 K), the S3 state decays through the same
mechanism, resulting in the same modified S2 configuration, S2’ state.
Chloride has been known to be required for the formation of the multiline
signal of the S2 state and for the S2-S3 and S3-S0 transitions (38, 39). Thus the removal
of Cl- may also prevent the formation of the S2’ state since it appears as a result of
decay of the S3 state. Addition of other ions (Br-, I-, NO3-) to Cl- depleted PSII can
restore the S2 state partially. I-, unlike the other ions, shows inhibitory effects on the
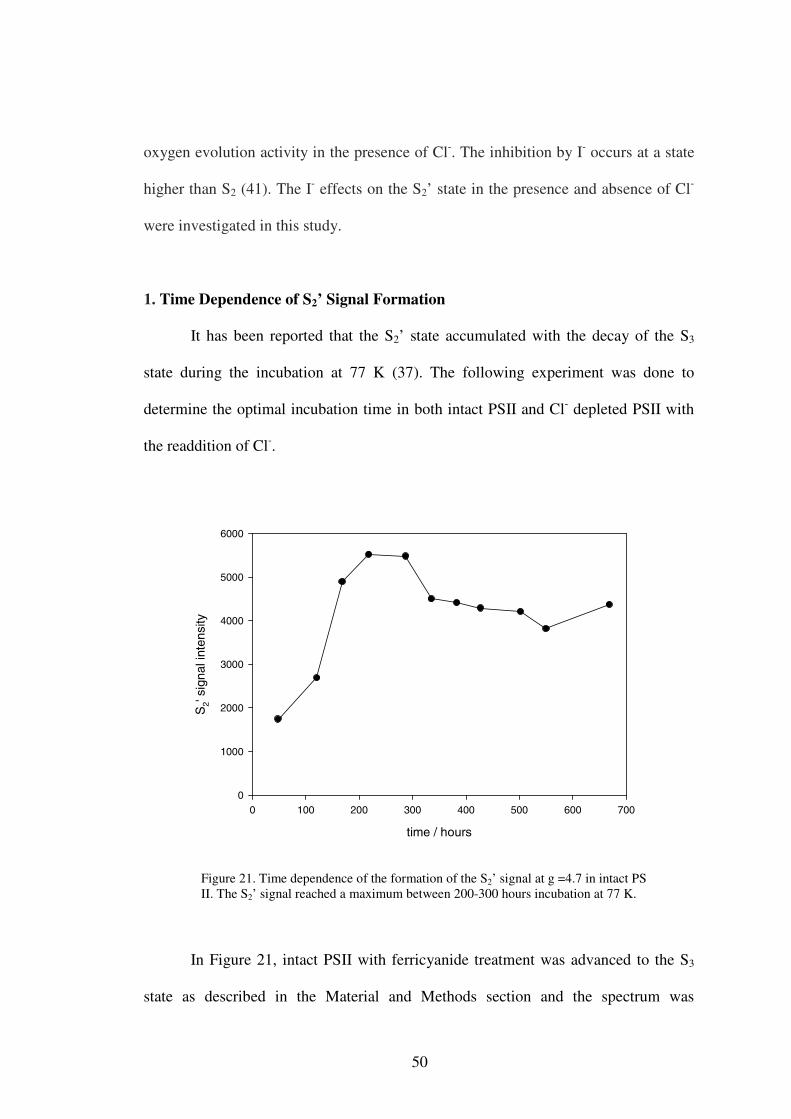
50
oxygen evolution activity in the presence of Cl-. The inhibition by I- occurs at a state
higher than S2 (41). The I- effects on the S2’ state in the presence and absence of Cl-
were investigated in this study.
1. Time Dependence of S2’ Signal Formation
It has been reported that the S2’ state accumulated with the decay of the S3
state during the incubation at 77 K (37). The following experiment was done to
determine the optimal incubation time in both intact PSII and Cl- depleted PSII with
the readdition of Cl-.
In Figure 21, intact PSII with ferricyanide treatment was advanced to the S3
state as described in the Material and Methods section and the spectrum was
time / hours
0 100 200 300 400 500 600 700
S2'
sign
al in
tens
ity
0
1000
2000
3000
4000
5000
6000
Figure 21. Time dependence of the formation of the S2’ signal at g =4.7 in intact PS II. The S2’ signal reached a maximum between 200-300 hours incubation at 77 K.
51
recorded. Then the sample was stored at 77 K in the dark, and spectra were collected
at different time points, ranging from 48 to 668 hours. The g = 4.7 S2’ state signals at
different time points were obtained by subtraction of the S3 state spectrum from the
spectra after incubation. The intensity of the S2’ signals reached a maximum between
200-300 hours incubation at 77 K. The S2’ state was fairly stable at 77 K, and after
very long incubation (>600 hrs), the intensity of the S2’ state signal stayed at a
relatively high level without decreasing.
A very similar pattern was observed in Cl- depleted PSII after readdition of Cl-
(Figure 22). The intensity of the S2’ state signal became maximal after 200-250 hours
incubation of the S3 state at 77 K. Therefore the optimal incubation time for the S2’
state was 8 - 10 days for both intact PSII and Cl- depleted PSII with added Cl-.
Time / hours
0 50 100 150 200 250 300 350 400
S2'
sign
al in
tens
ity
0
2000
4000
6000
8000
10000
12000
14000
Figure 22. Time dependence of the formation of the S2’ signal at g =4.7 in Cl- depleted PS II with added Cl- to a concentration of 15 mM. The S2’ signal reached a maximum between 200-250 hours incubation at 77 K.
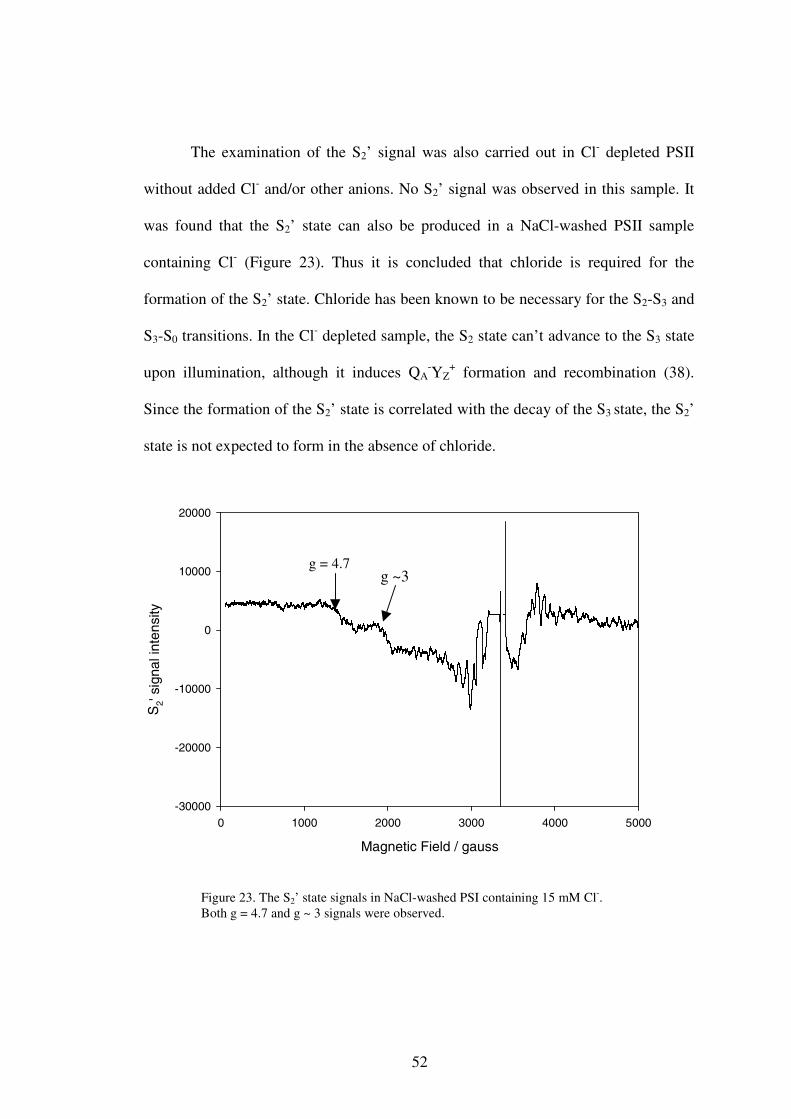
52
The examination of the S2’ signal was also carried out in Cl- depleted PSII
without added Cl- and/or other anions. No S2’ signal was observed in this sample. It
was found that the S2’ state can also be produced in a NaCl-washed PSII sample
containing Cl- (Figure 23). Thus it is concluded that chloride is required for the
formation of the S2’ state. Chloride has been known to be necessary for the S2-S3 and
S3-S0 transitions. In the Cl- depleted sample, the S2 state can’t advance to the S3 state
upon illumination, although it induces QA-YZ
+ formation and recombination (38).
Since the formation of the S2’ state is correlated with the decay of the S3 state, the S2’
state is not expected to form in the absence of chloride.
Magnetic Field / gauss
0 1000 2000 3000 4000 5000
S2'
sign
al in
tens
ity
-30000
-20000
-10000
0
10000
20000
Figure 23. The S2’ state signals in NaCl-washed PSI containing 15 mM Cl-. Both g = 4.7 and g ~ 3 signals were observed.
g = 4.7g ~3
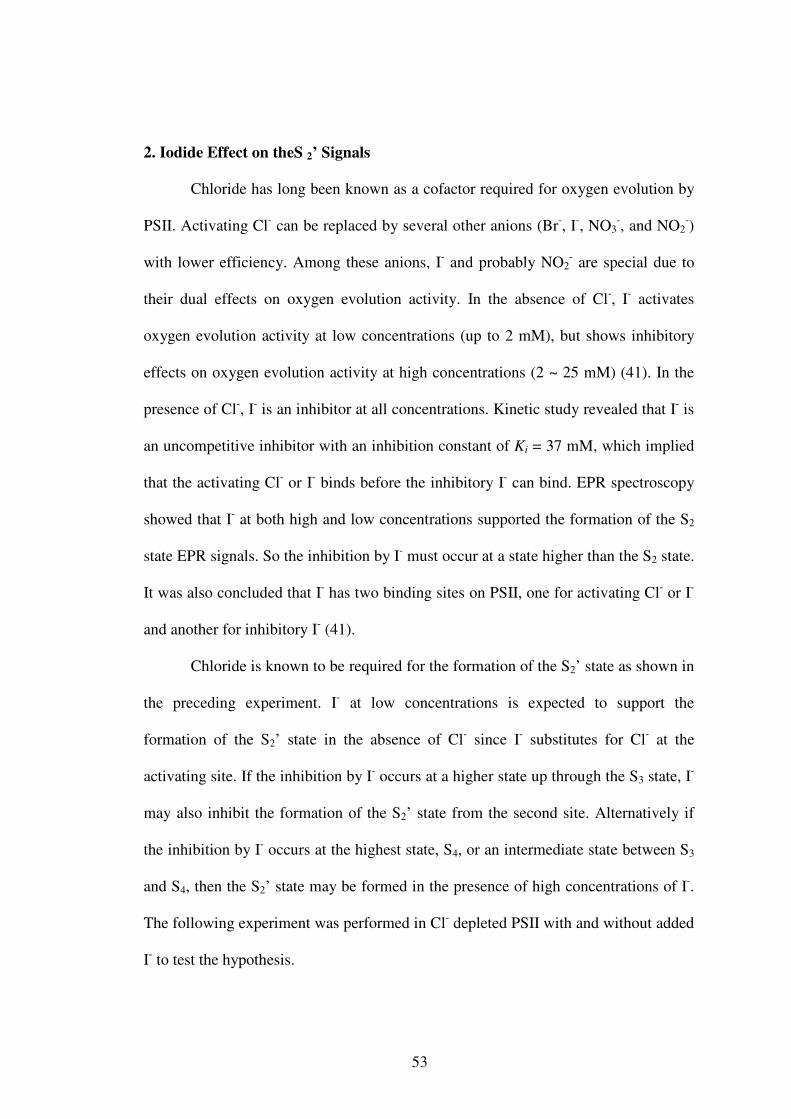
53
2. Iodide Effect on the S 2’ Signals
Chloride has long been known as a cofactor required for oxygen evolution by
PSII. Activating Cl- can be replaced by several other anions (Br-, I-, NO3-, and NO2
-)
with lower efficiency. Among these anions, I- and probably NO2- are special due to
their dual effects on oxygen evolution activity. In the absence of Cl-, I- activates
oxygen evolution activity at low concentrations (up to 2 mM), but shows inhibitory
effects on oxygen evolution activity at high concentrations (2 ~ 25 mM) (41). In the
presence of Cl-, I- is an inhibitor at all concentrations. Kinetic study revealed that I- is
an uncompetitive inhibitor with an inhibition constant of Ki = 37 mM, which implied
that the activating Cl- or I- binds before the inhibitory I- can bind. EPR spectroscopy
showed that I- at both high and low concentrations supported the formation of the S2
state EPR signals. So the inhibition by I- must occur at a state higher than the S2 state.
It was also concluded that I- has two binding sites on PSII, one for activating Cl- or I-
and another for inhibitory I- (41).
Chloride is known to be required for the formation of the S2’ state as shown in
the preceding experiment. I- at low concentrations is expected to support the
formation of the S2’ state in the absence of Cl- since I- substitutes for Cl- at the
activating site. If the inhibition by I- occurs at a higher state up through the S3 state, I-
may also inhibit the formation of the S2’ state from the second site. Alternatively if
the inhibition by I- occurs at the highest state, S4, or an intermediate state between S3
and S4, then the S2’ state may be formed in the presence of high concentrations of I-.
The following experiment was performed in Cl- depleted PSII with and without added
I- to test the hypothesis.
54
To investigate the effects of I- on the S2’ signals, a series of samples with
varying amounts of I- and Cl- were studied. Cl- depleted PSII samples were prepared
with 15 mM NaCl and no added anion as positive and negative controls, respectively.
Samples were also prepared with 2 and 25 mM NaI in the absence of Cl-. In addition,
one sample was prepared with both NaCl (15 mM) and NaI (50 mM) to investigate
the inhibition by I-. In the presence of added Cl-, the S2’ state signal at g ~ 3 was
formed, whereas in the absence of any added anion, only the g = 4.1 signal was
observed, which is consistent with previous observed effects of Cl- depletion on the
S2 state (Figure 24, trace A & B). The S2’ state signal at g ~ 3 and g = 4.7 were
observed in “I- containing only” PSII samples, for both high and low concentration
(Figure 24, trace C & E). Even in the presence of Cl-, there was no obvious inhibition
Figure 24. S2’ state spectra of Cl- depleted PS II resupplied with chloride and iodide. The anions were provided as the sodium salt. Spectra were obtained after 9 days incubation at 77 K.A: 15 mM Cl-; B: no anion added; C: 2 mM I-; D: 15 mM Cl- and 50 mM I-; E: 25 mM I-. Sample preparation and EPR spectroscopy were carried out as described in Materials and Methods.
55
due to I-, since the S2’ state signal at g ~ 3 was observed (Figure 24, trace D).
Quantification of the signals could not be made in this situation because of the high
error in signal heights and because the two S2’ state signals were not observed
simultaneously in any one spectrum. However we can conclude that I- can promote
formation of the S2’ state at both high and low concentrations and in the presence and
absence of Cl-. This indicates that the inhibition by I- occurred at a state higher than
the S2’ state. No S2’ state signal was observed in the absence of any anion, indicating
that I- substituted for Cl- at the Cl- activating binding site for formation of the S2’
state.
Of the two I- binding sites on PSII, one is associated with activation of oxygen
evolution, a role which is normally filled by Cl-. The functional role for the second I-
binding site, which is associated with inhibition, is not clear so far. The recent crystal
structure of PSII revealed that the OEC has the capacity for multiple binding sites for
water and ions (12). Previous research (37, 40, 53) and the study presented here have
shown that the S2’ state is produced by the decay of the S3 state through incubation at
77 K or NIR excitation of the S3 state at 50 K. Presumably, I- did not inhibit the
formation of the S3 state and the inhibition by I- occurred at a state higher than the S3
state. One possibility is that the inhibitory I- blocked the water or hydroxyl ion
binding at the S3 state or a state higher than S3. Another possibility is that the second
I- binding site is an anion site that facilitates the binding and exchange of Cl- at its site
of activation (41). Previous researchers have pointed out that the second I- site is
located in close proximity to Tyr Z of the OEC and may be normally occupied by
water or hydroxyl ion (41). The possibility that the S4 state is formally equivalent to
S3 + YZ· was suggested based on the observation that oxygen release and the final
56
electron transfer out of the OEC occur on the same 1 ms timescale (2). I- could
possibly be oxidized by the radical Yz in the S4 state, thereby resulting in the
iodination of the protein D1 and damage to the PSII, therefore inhibiting oxygen
evolution activity.
The production of the S2’ state by the straightforward illumination of the S1
state at -30 ºC at alkaline pH was accompanied by the formation of a g ~ 5 signal,
which supported the suggestion that the S2’ state is a proton deficient configuration of
the S2 state (37). The formation of the S2’ state in this case appeared not to require the
decay of the S3 state, but rather was attributed to the deprotonation of the S2 state. In
another study, the alkaline treatment of PSII was found to decrease the multiline
signal of the S2 state and inhibit the S3-S4 transition (54). The effect of I- on the S2’
state at alkaline pH would be an interesting area of future study.
57
CHAPTER VI
CONCLUSION
In summary, we confirmed that one PSII unit contains one Cl- trapped by the
17 and 23 kDa subunits based on a simple analysis, although the Cl- content in Cl-
depleted PSII remains further investigation. The EPR study of the S2’ state of PSII
suggested that Cl- is necessary for the formation of the S2’ state and that the inhibition
by I- occurs at a state higher than the S2’ state.
Lindberg et al. have reported that a high-affinity slow exchanging binding site
for chloride is present in PSII. They determined that the amount of chloride in this
site is 1 Cl-/PSII using radioactive 36Cl-labeled PSII (15, 46). No other Cl-
measurement in PSII was done before on a routine basis because of the difficulty in
pretreatment of the sample, the presence of background contaminating Cl-, and the
high detection limit of methods available. In the present study, the attempts that were
made to wet ash the PSII membranes and then measure Cl- content by the AgCl
colloid assay turned to be unsuccessful due to the high background from the PSII
membrane proteins themselves and the additional dilution factor introduced by the
bleach step. In addition, the fairly high concentration of acid needed to ash the PSII
membrane and followed by the large amount of base (NaOH) added to neutralize the
sample resulted in a high concentration of electrolyte in the samples, which was
probably responsible for the coagulation of AgCl.
To avoid the above problem, Cl- in PSII membranes was released using
sulfate treatment at pH 7.5 and separated from the PSII membranes by centrifugation.
58
The 17 and 23 kDa proteins and any chloride they retained was removed from PSII
membranes very rapidly (15 min) by this treatment (38, 47). After centrifugation,
chloride stayed in the supernatant, which was a relatively simple system containing
only the 17 and 23 kDa proteins plus buffer media. Then the Cl- content was
determined by AgCl colloid assay without the interference from the complicated PSII
membrane proteins and the high amount of electrolytes. However the Cl- content in
the supernatant was very low (µM range), so it was critical to keep the chloride
contamination as low as possible. The concentration of contaminating Cl- in the
buffer media was therefore controlled below 1 µM. Assuming that all high affinity
bound Cl- was released from PSII by sulfate treatment, we determined 1 Cl-/PSII,
which was consistent with Lindberg’s result.
Whether chloride is necessary for oxygen evolution is under debate. Cl-
depleted PSII still retained 30-40 % oxygen evolution activity (15), suggesting that
Cl- is not required for oxygen evolution. Conversely, NaCl-washed PSII in which Cl-
is not retained by the 17 and 23 kDa subunits loses almost all oxygen evolution
activity, strongly suggesting that Cl- is necessary for oxygen evolution. Accurate
measurement of Cl- content in both Cl- depleted and NaCl-washed PSII can resolve
this question. Unfortunately, the currently available methods in our lab including
AgCl colloid assay and Cl- sensitive microelectrode were not sensitive enough to
detect such trace amounts of Cl- in both Cl- depleted and NaCl-washed PSII directly.
Chloride is also very difficult to determine via Inductively Coupled Plasma Mass
Specetrometry (ICP-MS) because the ions formed by the ICP discharge are typically
positive ions, whereas chlorine prefers to form negative ions. Ion chromatography has
been used to analyze halogens efficiently and the detection limit can be as low as 0.01
59
mg/l. So ion chromatography may be a good choice to detect trace amount of Cl- in
PSII in future studies.
The study of chloride binding affinity in NaCl-washed PSII revealed two
classes of binding sites with dissociation constants of 53 µM and 4.2 mM
respectively. The extremely large number of binding sites indicated a large amount of
non-specifically bound Cl- in PSII membranes under Cl- sufficient conditions. It
should be noted that for the Scatchard analysis, extrapolation of a line drawn through
the lowest concentration points gives an overestimate of the number of high affinity
binding sites, rather than the actual number, if low affinity binding is also present.
Therefore the number of high affinity binding sites is probably lower than 7. Lindberg
et al. have proposed a one-site, two states model for chloride binding in PSII (30), but
the two site binding model was not ruled out. It is interesting that PSII membranes
started to lose chloride when an excess of Cl- (> 20 mM) was added. This result was
coincident with a separate finding in our laboratory that excess Cl- (> 20 mM)
inhibited the oxygen evolution activity (unpublished data, by Xiaoming Li). Na+,
which was added as the counter ion of Cl-, is known to non-competitively inhibit Cl-
binding at high concentrations (48). Furthermore at even higher concentrations, it is
possible that the excess chloride caused a conformational change of the PSII,
resulting in the release of sequestered chloride.
The S2’ state was produced in our lab by long term incubation of the S3 state
at 77 K. We discovered that both the g ~ 3 and g = 4.7 S2’ state signals could be
produced by long term incubation, whereas previous research (37, 40, 53) reported
that only the g = 4.7 signal was produced by incubation at 77 K, whereas the g ~ 3
signal was produced in addition to the g = 4.7 signal by NIR illumination. Moreover,
60
we found that the g ~ 3 signal could be detected either alone or along with the g = 4.7
signal. In previous studies, the g = 4.7 signal was assigned to the most “relaxed state”
because the g ~3 signal was able to convert to g = 4.7 signal at 77 K (40). Very small
differences in the crystal field parameters of the Mn cluster were thought to induce
the different forms of the S2’ state (53). The observation of both signals (g = 4.7 and g
~ 3) via different treatments (incubation at 77 K vs NIR illumination) may imply that
the decay of the S3 state to the S2’ state proceeds through the same pathway in each
case.
The study of the chloride requirement in the S2’ state indicated that Cl- is
necessary for formation of the S2’ state. I-, in the absence of Cl-, can substitute for Cl-
to promote the formation of the S2’ state at both high and low concentrations. It has
been known that in the presence of Cl-, I- inhibits oxygen evolution activity at all
concentrations, and that the inhibition by I- only occurs at high concentrations (> 2
mM) in the absence of Cl-. PSII membranes appear to have two I- binding sites: one
for activating oxygen evolution, another for inhibiting (41).
Even in the presence of Cl-, I- did not inhibit the formation of the S2’ state,
indicating that the inhibition by I-occurred at a state higher than the S2’ state. Since
the S2’ state is the decay product of the S3 state, I- probably did not inhibit the
formation of the S3 state. It is therefore suspected that the inhibition by I- occurs at the
S3 state or above.
The S3-to-S4 (S0) transition time is relatively long (1ms). So it is possible that
inhibitory I- acts after the S3 state is formed or at an intermediate state between the S3
and S4 (S0) states. The consideration that I- occupies the water or hydroxyl ion
binding site (41) suggests that water may bind after the S3 state is formed, although
61
the possibility that I- displaced water at an earlier state can not be ruled out. Hillier
and Wydrzynski have reported that a “slow” exchanging substrate-water molecule is
bound throughout the entire S state cycle and a “fast” exchanging substrate-water
molecule enters the reaction center after the formation of the S3 state (55, 56).
However the authors reported that the two substrate-water molecules were bound to
the S2 state in a following paper (57). Certainly, the water binding state of PSII is still
under debate. Another interpretation of the inhibitory effect of I- is that I- may be
oxidized by Yz·. The OEC is more positively charged in the S3 state, and the variation
of charge on the Mn cluster is expected to affect the oxidation/reduction potential of
Tyr Z. The oxidation potential of Yz· could be high enough to oxidize I-, thereby
inhibiting water oxidation.
62
REFERENCES
1. Szalai, V. A. & Brudvig, G. W. (1998) American Scientist 86, 542-551.
2. Britt, R. D.(1996) In Ort, D. R. & Yocum, C. F.(ed) Oxgenic Photosynthesis: The
Light Reaction, PP.137-164. Kluwer Academic Publishers, Dordrecht
3. Jon Nield’ website, hotsted by Dept. of Biological Science at Imperial College
London, SW7 2AZ, United Kingdom.
http://www.bio.ic.ac.uk/research/barber/psIIimages/PSII.html
http://www.bio.ic.ac.uk/research/nield/psIIimages/PSIIsubunits.html
4. Rutherford, A. W. and Boussac, A. (2003) Science 303,1782-1784
5. Bricker, T. M. & Frankel, L. K. (2002) Photosynthesis research 72, 131-146.
6. Bricker, T. M. & Frankel, L. K. (2003) Biochemstry 42 (7), 2056-2061.
7. Miyao, M & Murata, N. (1984) FEBS lett. 170, 350-354.
8. Ghanotakis, D. F., Babcock, G. T., & Yocum, C. F. (1984) FEBS lett. 167, 127-
130.
9. Andersson, B., Critchley, C., Ryrie, I., & Jannson, C. (1984) FEBS lett. 168, 113-
117.
10. Kok, B., Forbush, B., & McGloin, M. (1970) Photochem. Photobiol. 11, 457-475.
11. Jonathan H. A. Nugent, Sandra Turconi, & Michael C. W. Evans, (1997)
Biochemistry 36, 7086-7096
12. Ferreira, K. N., Iverson, T. M., Maghlaoui, K., Barber, J., and Iwata, S. (2004)
Science 303, 1831-1838.
63
13. Rutherford, A. W. & Boussac, A. (2004) Science 303, 1782-1784
14. Olesen, K & Andréasson, L. E. (2003) Biochemistry 42 (7), 2025-2035.
15. Lindberg, K., Vänngård, T. and Andréasson, L. E. (1993) Photosynthesis
Research 38, 401-408.
16. Wincencjusz, H., Yocum, C. F., & van Gorkom, H. J. (1998) Biochemistry 37,
8595-8604
17. Wertz, J. E. & Bolton, J. R., (1972) “Electron spin resonance elementary theory
and practical applications” pp 45, 47, 50, McGraw-Hill Book Company.
18. Miller, A. F. & Brudvig, G. W. (1991) Biochimica et Biophysica Acta 1056, 1-18
19. Butler, W. L, Visser, J. W. M., and Simmons, H. L (1973) Biochim. Biophys. Acta
292, 140-151
20. Thompson, L. K., and Brudvig, G. W. (1988) Biochemistry 27, 6653-6658
21. Hanley, J., Deligiannakis, Y., Pascal, A., Faller, P., and Rutherford, A. W. (1999)
Biochemistry 38, 8189-8195.
22. Hansson Ö, Aasa R and Vänngård T (1987) Biophys. J. 51, 825-832.
23. Haddy, A., W. R. Dunham, R. H. Sands, and R. Aasa. (1992) Biochim. Biophys.
Acta. 1099, 25-34.
24. Haddy, A., K. V. Lakshmi, G. W. Brudvig, and H. A. Frank (2004) Biophys. J.
87, 2885-2896.
25. Bonvoisin, J., Blondin, G., Girerd, JJ., & Zimmermann, JL. (1992) Biophys. J. 61,
1076-1086.
26. Kusunoki, M. (1992) Chem Phys Lett 197, 108-116.
27. Zheng, M and Dismukes, GC (1992) Murata N (ed) Research in Photosynthesis,
pp 305-308. Kluwer Academic Publishers, Dordrecht.
64
28. Boussac A, Zimmermann JL and Rutherford AW (1989) Biochemistry 28, 8984-
8989.
29. Boussac A and Rutherford AW (1988) Biochemistry 27, 3476-3483.
30. Lindberg, K., & Andréasson, L. E. (1996) Biochemistry 35, 14259-14267.
31. Ono, T. A., Hakayama, H., Gleite, H., Inoue, Y., and Kawamori, A. (1987)
Archives of Biochemistry and Biophysics 256, 618-624.
32. Yachandra, V. K., Guiles, R. D., Sauer, K., and Klein, M. P. (1986) Biochimica et
Biophysica Acta 850, 333-342.
33. Haddy, A., Kimel, R. A., and Thomas, R. (2000) Photosynthesis Research 63, 35-
45.
34. Ono, T., Zimmermann, J. L., Inoue, Y., and Rutherford, S. W. (1986) Biochimica
et Biophysica Acta 851, 193-201.
35. Casey, J. L., and K. Sauer. (1984) Biochim. Biophys. Acta. 767, 21-28
36. DeRose VJ, Latimer MJ, Zimmermann JL, Mukerji I, Yachandra VK, Sauer K
and Klein MP (1995) Chem. Phys. 194, 443-459.
37. Ioannidis, N. & Petrouleas, V. (2002) Biochemistry 41, 9580-9588.
38. Wincencjusz, H., Gorkom, H. V., & Yocum, C. F. (1997) Biochemistry 36, 3663-
3670.
39. Wincencjusz, H., Yocum, C. and van Gorkom, H. J. (1999) Biochemistry 38,
3719-3725.
40. Sanakis, Y., Ioannidis, N., Sioros, G. and Petrouleas, V. (2001) J. Am. Chem. Soc.
123, 10766-10767.
41. Bryson, D., Doctor, N., Johnson, R., Baranov, S., and Haddy, A. (2005)
Biochemistry 44 (19); 7354-7360.
65
42. Berthold, D.A., Babcock. G.T. and Yocum, C.F. (1981) FEBS Lett. 134, 231-234.
43. Segel, Irwin H. (1975) in Enzyme Kinetics Behavior and Analysis of Rapid
Equilibrium and Steady-State Enzyme Systems, pp.218-220, Wiley-interscience,
New York.
44. Ioannidis, N., and Petrouleas, V. (2000) Biochemistry 39, 5246-5254
45. Kimura, Y., Hasegawa, K., Yamanari, T. & Ono, T-A. (2005) Photosynthesis
research 84, 245-250.
46. Lindberg, K., Wydrzynski, T., Vänngård, T. and Andréasson, L. E. (1990) FEBS
264, 153-155.
47. Sandusky, P. O., Selvius DeRoo, C. L., Hicks, D. B., Yocum, C. F., Ghanotakis,
D. F., & Babcock, G. T. (1983) in The oxygen evolving system of photosynthesis
( Inoue, Y., Crofts, A. R., Fovindjee, Murate, N., Reger, G., & Satoh, K., Eds.) pp
189-200, Academic Press, Tokyo.
48. Waggoner, C., Pecoraro, V. and Yocum, C. (1989) FEBS Lett. 244, 237-240.
49. Waggoner, C. and Yocum, C. (1990) in Current Research in Photosynthesis (M.
Baltscheffsky Ed.), Vol. I, pp 733-736, Kluwer Academic Publishers,
Netherlands.
50. Miyao, M and Murata, N. (1985) FEBS Lett. 180, 303-308.
51. Cantor, C and Schimmel, P. (1980) in Biophysical chemistry Part III: The
behavior of biological macromolecules, pp 856-859, W. H. Freeman and
Company, New York.
52. Matsukawa, T., MIno, H., Yoneda, D., and Kawamori, A. (1999) Biochemistry
38, 4072-4077.
66
53. Petrouleas, V., Koulougliotis, D., and Ioannidis, N. (2005) Biochemistry 44,
6723-6728.
54. Geijer, P., Deák, Z., and Styring, S. (2000) Biochemistry 39, 6763-6772
55. Hillier, W., and Wydrzynski, T. (2000) Biochemistry 39, 4399-4405.
56. Hillier, W., Hendry, G., Burnap, R.L., and Wydrzynski, T. (2001) J. Biol. Chem.
276, 46917-46924.
57. Hendry, G., and Wydrzynski, T. (2002) Biochemistry 41, 13328-13334.