Embed Size (px)
Citation preview

Int. J. Mobile Network Design and Innovation, Vol. X, No. Y, XXXX 1
W-CDMA network design
Qibin Cai*Verizon Business,Network Engineering Systems,Richardson, TX, USAE-mail: [email protected]*Corresponding author
Joakim KalvenesSchool of Management,University of Texas at Dallas,Richardson, TX, USAE-mail: [email protected]
Jeffery Kennington and Eli V. Olinick
School of Engineering,Southern Methodist University,Dallas, TX, USAE-mail: [email protected]: [email protected]
Abstract: In this investigation, the W-CDMA network design problem is modelled as a discreteoptimisation problem that maximises revenue net the cost of constructing base stations, MobileTelephone Switching Offices (MTSOs) and the backbone network to connect base stations throughMTSOs to the Public Switched Telephone Network (PSTN). The formulation results in a very largescale integer programming problem with up to 18,000 integer variables and 20,000 constraints.To solve this large scale integer programming problem, we develop a pair of models, one forthe upper bound and one for the lower bound. The upper bound model relaxes integrality onsome of the variables while the lower bound model uses a 5% optimality gap to achieve earlytermination. Additionally, we develop a heuristic procedure that can solve the largest probleminstances very quickly with a small optimality gap. To demonstrate the efficiency of the proposedsolution methods, problem instances were solved with five candidate MTSOs servicing some11,000 simultaneous cellular phone sessions on a network with up to 160 base stations. In allinstances, solutions guaranteed to be within 5% of optimality were obtained in less than an hourof CPU time.
Keywords: mobile networks; network design; integer programming; W-CDMA.
Reference to this paper should be made as follows: Cai, Q., Kalvenes, J., Kennington, J. andOlinick, E. (XXXX) ‘W-CDMA network design’, Int. J. Mobile Network Design and Innovation,Vol. X, No. Y, pp.XXX–XXX.
Biographical notes: Qibin Cai graduated from Southern Methodist University with a PhD inOperations Research in August 2006. His research interest focuses on the design and analysis ofmathematical optimisation models for telecommunication network design problems. Advised byDr. Jeffery Kennington, he presents a set of optimisation-based design tools for W-CDMA cellularnetworks in his PhD dissertation. He is now employed by Verizon Business as an OperationsResearch Analyst in Richardson, Texas, developing and supporting optimisation algorithmsthat underlie a suite of domestic and global network planning systems. He holds Masters andBachelors degrees in Transportation Planning from Shanghai Maritime University.
Joakim Kalvenes is a Visiting Scholar at the University of Texas at Dallas. He received an MSc inApplied Mathematics from the Norwegian Institute of Technology in 1989, an MA in Economicsfrom the Norwegian School of Economics and Business Administration in 1992, an MBA inFinance and Operations Management and a PhD in Management Information Systems in 1994and 1996, respectively, from Vanderbilt University. His research interests include analysis anddesign of mobile communication systems, revenue management in communication servicesand design of mechanisms for providing transaction privacy and integrity in electronic market
Copyright © XXXX Inderscience Enterprises Ltd.

2 Q. Cai et al.
places. His research has appeared in journals such as Operations Research, Management Science,Information Systems Research, INFORMS Journal on Computing, Production and OperationsManagement and Wireless Networks.
Jeff Kennington received a BSIE from the University of Arkansas in 1968, an MSIE in 1970 and aPhD in 1973 from the Georgia Institute of Technology. He joined Southern Methodist Universityin June 1973 and has served in several Departments. He served as Chair of the Department ofOperations Research and Engineering Management for 12 years and Chair of the Department ofComputer Science and Engineering for five years. He serves as an Associate Editor for Networksand the INFORMS Journal on Computing and is on the Editorial Board of TelecommunicationSystems and Computational Optimisation and Applications.
Eli V. Olinick is an Associate Professor in the Department of Engineering Management, Systemsand Information at Southern Methodist University. He completed his BS inApplied Mathematics atBrown University and earned his MS and PhD in Industrial Engineering and Operations Research atthe University of California at Berkeley where he wrote his PhD thesis on ‘OptimisationAlgorithmsfor Survivable Network Design Problems’. His research interests are in applied optimisation andnetwork design problems. He currently serves as the Treasurer of the INFORMS Technical Sectionon Telecommunications.
1 Introduction
Third generation mobile communication systems currentlyunder development promise to provide subscribers withhigh-speed data services at rates up to a hundred timesthat of second generation voice channels. There are twoaccepted major standards for third generation mobile systems(W-CDMA and CDMA2000, respectively), both of whichare based on Code Division Multiple Access (CDMA)technology. This paper presents a comprehensive modelof the wideband CDMA network design problem. Modelfeatures include Mobile Telephone Switching Office (MTSO)and base station (tower) site selection, backbone networkdesign and customer service assignment to selected towers.CDMA network design problems differ considerably fromother wireless network design problems in that channelallocation is not an explicit issue. In each cell, all ofthe bandwidth available to the service provider can beused. The features in CDMA making this possible arestringent power control of all system devices (includinguser handsets) and the use of orthogonal codes toensure minimal interference between simultaneous sessions.Instead, however, the network design must take intoconsideration the system-wide interference generated by themobile users in the service area.
Previous work on CDMA system design has focusedon base station location and customer assignment. Galotaet al. (2001) proposed a profit maximisation model forbase station location and customer service assignmentbased on a limited interference model. Similarly, Matharand Schmeink (2001) developed a budget-constrainedsystem capacity maximisation model, in which theinterference model accounted for base stations utilisedinstead of the number of customers serviced by eachrespective base station. Amaldi et al. (2001a) provideda cost minimisation model that explicitly considers thesignal-to-interference conditions generated by the basestation location and customer service assignment choices bymeans of a penalty term in the objective function. Building
upon this work, Kalvenes et al. (2006) developed a profitmaximisation model in which the signal-to-interferencerequirements are enforced as constraints in the mathematicalprogramming model.
In another stream of work, researchers have modelled theselection of MTSOs and the assignment of base stations toMTSOs. Merchant and Sengupta (1995) developed a costminimisation model that includes base station to MTSOwiring cost and handoff cost for given traffic volume at thebase stations. The same concept was refined by Li et al.(1997). Neither investigation includes cost for connecting theMTSOs to one another or to the Public Switched TelephoneNetwork (PSTN).
This investigation expands previous work in the areaby combining the tower location and the backbone designproblems described above into a single, comprehensivemodel of W-CDMA network design. The resulting modelincludes the selection of base stations and MTSO locations,the assignment of customer locations to base stationsand the design of a spanning tree to connect the basestations, MTSOs and the PSTN gateway. The selectionof base stations and MTSOs combined with the designof the spanning tree is equivalent to a Steiner treeproblem (see, for instance, Beasley 1989). The modelpresented in this paper enhances the current industryapproach to wireless network design in two ways. Firstly,prevailing practice seeks to space towers uniformly inEuclidean space. Then, modifications of this tower locationchoice are based on ex-post calculations of coverage andcapacity. In our approach, the tower location decisionincorporates coverage and capacity. Secondly, prevailingpractice considers the backbone design problem only afterthe tower locations have been selected. In our approach,the cost of the backbone design is solved simultaneouslywith the tower location problem so that the potentialopportunity cost of problem partitioning is eliminated. Thedisadvantage of using a comprehensive model as proposedhere comes primarily in the form of potentially highcomputational cost.

W-CDMA network design 3
The contributions of this work are several. Firstly,we provide the first comprehensive discrete optimisationmodel for the W-CDMA network design problem.The model maximises the net revenue of service provisioningto mobile subscribers and takes into account the cost of towerconstruction, MTSO location, tower to MTSO connectionand MTSO to PSTN gateway connection. When selectingbase station locations, the revenue potential of each toweris balanced with its cost of installation and operation whilesimultaneously ensuring sufficient quality of service. Theselected base stations are then connected to a network ofMTSOs that is generated based on the cost of MTSO locationand the cost of wiring from the towers to the MTSO locations.Secondly, we develop a unique solution strategy that involvesthe application of discrete models to obtain both upperbounds and good feasible solutions. The solution proceduresexploit the problem structure through the addition of validinequalities to the model formulation. Thirdly, we developa new heuristic procedure that substantially reduces thecomputational burden for the most difficult problem instanceswhile resulting in only small reductions in objective functionvalue. Finally, we demonstrate the efficiency of our solutionprocedures by solving 40 randomly generated test cases andseven test cases from the North Dallas area, comparingthe three solution procedures proposed in this paper. Thevery reasonable computational times and the quality ofthe obtained solutions are very encouraging. The softwareimplementation of both our exact solution procedure and ourheuristic procedures have been placed in the public domainso that both practitioners and other research groups canexperiment with our software and compare computationalresults.
2 W-CDMA network design model
Our model differs from previous work in that itsimultaneously selects base station and MTSO locations,connects the towers and MTSOs to the PSTN access pointand provides service assignment of customer locations tobase stations based on a realistic interference model. Thus,this is the first comprehensive planning model for W-CDMAnetwork design.
2.1 Sets used in the model
Let L denote the set of candidate locations for towerconstruction. In practice, candidate tower locations areidentified through examiniation of databases listing existingtowers designated to other uses, examination of local mapsand review of city zoning restrictions. There is a set ofsubscriber locations, M . In practice, subscriber locations arefound in census data to determine demand from residentialareas and examination of local maps to determine demandfrom mobile customers and business premises. The setCm ⊂ L is the set of candidate towers that are able toservice customers in location m ∈ M , as determined bythe maximum handset transmission power. For every l ∈ L,Pl ⊂ M is the set of customer locations that can be servicedby tower l. Each selected tower location will be connectedto an MTSO. The set of candidate MTSO locations is K .
In addition, there is a gateway to the PSTN which is labelledlocation 0. The union of the PSTN gateway and the set K isdenoted K0.
2.2 Constants used in the model
The demand for service in customer area m ∈ M is denotedby dm. In practice, the demand parameters are determinedin conjunction with the subscriber locations m ∈ M . Thisvalue is the number of channel equivalents1 required toservice the population in the area at an acceptable servicelevel (call blocking rate). Let r denote the annual revenue(in $) generated by each channel equivalent utilised in acustomer area. The cost (amortised annually) of buildingand operating a tower at location l ∈ L and connectingit to the backbone network is given by the parameter al .Operating cost includes the cost of transmission power,marketing, accounting, customer aquisition and retentionand any other cost that is contingent upon operating a tower.When a subscriber in location m is serviced by tower l, thesubscriber’s handset must transmit with sufficient power sothat the tower receives it at the target power level Ptarget.Due to attenuation, the signal transmitted weakens over thepath from the handset to the tower based on the relativelocation of the origin and destination (depending on distance,topography, local conditions, etc.). The attenuation factorfrom subscriber location m to tower location l is givenby the parameter gml . To ensure proper received power,Ptarget, at the tower location, the handset will transmit withpower level Ptarget/gml . At each tower location, signals arereceived from many subscriber handsets in the surroundingneighbourhood. In order for the voice packets to be processedwith a reasonable error rate, the signal to interference ratiofor any active session must be more than the threshold valueSIRmin. The selected towers will be connected to an MTSO.The MTSOs are limited in the number of base stations theycan service. This limit is given by the parameter α. Theannualised cost of providing a link between tower locationl ∈ L and MTSO hub location k ∈ K is given by clk ,while hjk is the annualised cost of providing a link fromhub location j ∈ K to hub location k ∈ K0. Finally, bk isthe annualised cost of building and operating an MTSO inlocation k ∈ K .
2.3 Decision variables used in the model
The decision variables in this model include general integerand binary variables. The decision to build a tower at acandidate location is represented by variable yl , which isone if a tower is built at location l ∈ L; and zero, otherwise.The integer variable xml represents the capacity assignment(in channel equivalents) to tower l ∈ L for servicing ofcustomers in location m ∈ M . In other words,
∑m∈M xml
represents the instantaneous communication capacity oftower location l ∈ L. The variables are related so that xml ≥ 1only if yl = 1, that is, customers in location m can be assignedto tower l for service only if tower l is built. If an MTSO isestablished in location k ∈ K0, the variable zk is one; andzero, otherwise. Each tower must be linked to an MTSO.If tower l ∈ L is connected to MTSO k ∈ K , then slk is one;otherwise, it is zero. Finally, each MTSO location must have

4 Q. Cai et al.
a path to the PSTN gateway. We use a flow formulation tocreate a path from every selected MTSO location to the PSTNgateway. The integer variable ujk denotes the units of trafficflow on the link between MTSO location j ∈ K and MTSOlocation k ∈ K0. If there is any flow from MTSO locationj ∈ K to MTSO location k ∈ K0, then a link between j andk has to be established. The variable wjk is one if a link isestablished between locations j ∈ K and k ∈ K0; and zero,otherwise.
2.4 Quality of service constraint
In spread-spectrum system design, it is customary toexpress quality of a communication link in termsof a signal-to-interference ratio. A derivation of thesignal-to-interference ratio based on the available bandwidthand the link quality requirements can be found in Kalveneset al. (2006).
The total received power at tower location l, P TOTl , from
all mobile users in the service area is given by
P TOTl = Ptarget
∑m∈M
∑j∈Cm
gml
gmj
xmj (1)
In this expression, the signal level from customers assignedto tower l is Ptarget, while it is Ptargetgml/gmj from customersassigned to some other tower j . From a single customer’sperspective, the signals from other customers representinterference. Thus, for each session assigned to tower l,P TOT
l − Ptarget represents interference, while Ptarget is thesignal strength associated with the session (Amaldi et al.,2001b). Consequently, a quality of service constraint basedon the threshold signal to interference ratio for each sessionassigned to tower l is given by
Ptarget
P TOTl − Ptarget
≥ SIRmin (2)
provided that tower l is constructed. Since the tower is builtonly if yl = 1, this constraint can be written as follows:
∑m∈M
∑j∈Cm
gml
gmj
xmj
≤ 1 + 1
SIRmin+ (1 − yl)βl ∀� ∈ L (3)
where
βl =∑m∈M
dm
{max
m∈Cm\{�}
(gml
gmj
)}
and
maxj∈Cm\{�}
(gml
gmj
)= 0 if Cm\{�} = ∅
The second term on the right-hand side is zero when atower is built (yl = 1), so that the signal-to-interferencerequirement must be met at tower l. When yl = 0, theright-hand side is so large that the constraint is automaticallysatisfied.
2.5 Mathematical formulation
The base station and MTSO location with backbone networkdesign problem is formulated as follows.
max r∑m∈M
∑�∈Cm
xm�
︸ ︷︷ ︸Subscriber revenue
−∑�∈L
a�y�
︸ ︷︷ ︸Tower cost
−∑k∈K
bkzk
︸ ︷︷ ︸MTSO cost
−∑�∈L
∑k∈K
c�kS�k
︸ ︷︷ ︸Connection cost
−∑j∈K
∑k∈K0\{j}
hjkwjk
︸ ︷︷ ︸Backbone cost
(4)
There are 16 sets of constraints that define the model.The first set ensures that customers can be serviced only ifthere are towers that cover the demand area.
xm� ≤ dmy� ∀m ∈ M, � ∈ Cm (5)
The next set of constrains ensures that one cannot serve morecustomers in a location than there is demand for service.
∑�∈Cm
xm� ≤ dm ∀m ∈ M (6)
The next set of constraints enforce the quality of servicerestrictions on received signal quality at the towers.
∑m∈M
∑j∈Cm
gm�
gmj
xmj ≤ 1 + 1
SIRmin+ (1 − y�)β� ∀� ∈ L
(7)
The following two sets of constraints ensure that each basestation is connected to an MTSO and that an MTSO isinstalled if there is a base station connected to it.
∑k∈K
s�k = y� ∀� ∈ L (8)
s�k ≤ zk ∀� ∈ L, ∀k ∈ K (9)
The capacity constraint on the number of base stations thatcan be serviced by an MTSO is given by the set of constraints
∑�∈L
s�k ≤ αzk ∀k ∈ K (10)
The selected MTSO locations must be connected to the PSTNgateway either directly or indirectly via another selectedMTSO location. We use a flow formulation that results ina spanning tree with the PSTN gateway as its root. The firstset of constraints provides a link between MTSOs j ∈ K andk ∈ K0 if there is any flow over the link. The second set ofconstraints ensures that there can be traffic flow from MTSOlocation j to MTSO location k (or the PSTN gateway) onlyif MTSO location k is constructed. If zk = 1, then one unit offlow will be generated at MTSO location k. The third set ofconstraints represents flow conservation where the flow-outminus the flow-in equals the flow generated at each MTSOlocation k. The last constraint ensures that the flow into the

W-CDMA network design 5
PSTN gateway equals the number of MTSOs selected.
ujk ≤ |K|wjk ∀j ∈ K, k ∈ K0\{j} (11)
ujk ≤ |K|zk ∀j ∈ K, k ∈ K0\{j} (12)∑j∈K\{k}
(ukj − ujk) + uk0 = zk ∀k ∈ K (13)
∑k∈K
uk0 =∑k∈K
zk (14)
The next constraint states that the PSTN gateway is alwayspresent.
z0 = 1 (15)
The last five sets of constraints provide the domains for thevariables.
s�k ∈ {0, 1} ∀� ∈ L, k ∈ K (16)
ujk ∈ N ∀j ∈ K, k ∈ K0\{j} (17)
xm� ∈ N ∀m ∈ M, � ∈ L (18)
y� ∈ {0, 1} ∀� ∈ L (19)
zk ∈ {0, 1} ∀k ∈ K0 (20)
2.6 Model properties
In this section, we prove that our problem is NP-hard byshowing that it includes the Steiner tree problem as a specialcase. Recall that in the Steiner tree problem, which is knownto be NP-hard, one is given a graph G = (V , E) wih edgecosts for each edge (i, j) ∈ E and the problem is to find aminimum cost tree that connects a given subset of the nodesU ⊂ V . The tree may include any of the Steiner nodes V \U ,but is not required to do so.
Proposition 1: The problem (4)–(20) is NP-hard.
Proof: Consider the set of instances of our CDMA problemwhere the input is restricted to cases where L = M ,Cm = {m}, am = 0, bm = 0, dm = 1 ∀m ∈ M ,SIRmin < |M|, α > |M| and r >
∑m∈M
∑k∈M cmk +∑
j∈K
∑k∈K0\{j} hjk . Restrict the input further to cases where
L ⊂ K and c�k = 0 if � = k and c�k > r if � �= k.Observe that for these problems each unit of demand iseconomically attractive to serve since the revenue per channelequivalent is larger than the cost of building a tower toprovide the service and connecting that tower to the backbonenetwork. Therefore, an optimal solution will serve all of thedemand and profit is maximised by finding a minimum costbackbone. The backbone cost is minimised by connectingtower 1 to MTSO 1, tower 2 to MTSO 2 and so forth, andconnecting the PSTN gateway and MTSOs 1, 2, . . . , M toeach other via a minimum cost tree network which maypossibly include some of the other MTSOs. That is, theseproblems correspond to the set of all Steiner tree probleminstances; G is the graph induced by the MTSOs and thePSTN gateway, U = {0, 1, 2, . . . , M} and the cost of edge(i, j) = hij .
In terms of the formulation (4)–(20), xmm = ym =smm = 1 is optimal. Constraints (5)–(7) and (10) are triviallysatisfied, while (18) and (19) are redundant. The problem
reduces to
min∑m∈M
∑k∈K
cmksmk
∑j∈K
∑k∈K0\{j}
hjkwjk (21)
s.t.∑k∈K
smk = 1 ∀m ∈ M (22)
smk ≤ zk ∀m ∈ M, ∀k ∈ K (23)
ujk ≤ |K|wjk ∀j ∈ K,k ∈ K0
{j} (24)
ujk ≤ |K|zk ∀j ∈ K,k ∈ K0
{j} (25)
∑j∈K\{k}
(ukj − ujk) + uk0 = zk ∀k ∈ K (26)
∑k∈K
uk0 =∑k∈K
zk (27)
z0 = 1 (28)
smk ∈ {0, 1} ∀m ∈ M, k ∈ K (29)
ujk ∈ N ∀j ∈ K,k ∈ K0
{j} (30)
zk ∈ {0, 1} ∀k ∈ K0 (31)
This is the flow formulation of the Steiner tree problem wherethe tower locations and the PSTN gateway location representthe customer locations and the candidate MTSO locationsrepresent the Steiner nodes. The Steiner tree problem isknown to be NP-hard.
Kalvenes et al. (2006) showed that in the CDMA networkdesign problem, customers are always assigned to the nearesttower that is constructed so as to minimise overall systeminterference levels. That is, the following set of validconstraints can be added to the formulation:
xm� ≤ dm(1 − yj ) ∀m ∈ M, �, j ∈ Cm : gm� < gmj (32)
In order to improve computational performance, we adda set of valid inequalities to speed up the pruning of thebranch-and-bound tree in CPLEX. Constraint (7) limits thetotal received signal power at tower �, regardless of the signalsource. A subset of the total received power comes fromcustomers assigned to tower � for service, that is, thosecustomer locations m for which xm� ≥ 1. Thus, if (7) issatisfied, so is the following set of constraints:∑
m∈P�
xm� ≤ 1 + 1
SIRmin∀� ∈ L (33)
Also note that, in the formulation (4)–(20), the variable s
is integer. However, constraints (8)–(10) together with theobjective function ensure that s is either 0 or 1 even ifthe integrality restriction is relaxed. In our computationalprocedure, we therefore use 0 ≤ s�k ≤ 1 ∀� ∈ L, k ∈ K
instead of (16).
3 Empirical analysis
Our model is implemented in software using the AMPLmodelling language (Fourer et al., 2003) with a directlink to the solver in CPLEX. All test runs are made ona Compaq AlphaServer DS20E with dual EV 6.7(21264A)

6 Q. Cai et al.
667 MHz processors and 4096 MB of RAM. Upper andlower bound models are applied to obtain provablynear-optimal solutions for realistic-sized problem instances.The computational times increase substantially as the numberof candidate towers increases from 40 to 160. Therefore, wealso implemented a heuristic solution procedure to solve thelargest problems instances.
3.1 Solution procedure with error guarantee
Our solution procedure generates a feasible solution andan upper bound to demonstrate the quality of the feasiblesolution. The upper bound procedure solves to optimality theproblem (4)–(33) with the integrality constraint on variablesx, y and s relaxed. In the lower bound procedure, integralityis imposed, but an optimality gap of 5% is permitted.
We created two series of test problems for the empiricalevaluation of our proposed solution method. Both series oftest problems were based on the parameters listed in Table 1.While these data do not represent any service provider’sactual system, we have conferred with local service providerengineers to confirm the validity of the parameter valueranges.
Table 1 Parameters used in the computational experiments
Parameter Value or Range Description
r $4,282 Annual revenue for each customerchannel equivalent serviced
a� U [$70,000,$100,000]
Annualised cost for installing abase station in location �
bk U [$300,000,$375,000]
Annualised cost for installing anMTSO in location k
f $1.00 Annualised cost per foot of wiringα 225 Maximum number of base stations
that can be connected to an MTSO
In the first series of test problems, customer demand pointsand candidate tower locations were drawn from a uniformdistribution over a 13.5 km × 8.5 km rectangular servicearea. The number of demand points was 1,000 and 2,000,respectively, while the number of candidate tower locationswas 40, 80, 120 or 160. Six candidate MTSO locations(including the PSTN gateway) were drawn from a uniformdistribution over a 1.5 km×1.0 km rectangular area centeredon the 13.5 km × 8.5 km service area. Each demand pointhad demand drawn from a uniform distribution of integersbetween 1 and 10 channel equivalents. With a mean of5.5 units of demand in each customer location, the meandemand over the entire service area was 5,500 and 11,000,respectively. The attenuation factors gm� were then calculatedbased on Hata’s path loss model (Hata, 1980). A towerlocation � that was close enough to provide service tocustomer point m (given by the requirement that gm� >
10−15) would be included in the set Cm. Depending on thenumber of towers in the service area, the average size of thesets Cm varied between 2.0 and 8.4. The test problem dataare listed in Table 2 and problem instance R500 is displayedin Figure 1 with demand locations uniformly distributed overthe service area (circles are subscriber locations, triangles arecandidate tower locations and squares are candidate MTSOlocations).
Table 2 Problem data for uniformly distributed subscribers(dm ∼ U [1, 10])
Problem Number of Number of Total Averagename candidate customer number of size of
towers locations customers Cm
R110 40 1000 5620 2.1R120 40 1000 5637 2.0R130 40 1000 5638 2.0R140 40 1000 5626 2.1R150 40 1000 5625 2.2R160 80 1000 5609 4.2R170 80 1000 5598 4.2R180 80 1000 5608 4.1R190 80 1000 5593 4.2R200 80 1000 5608 4.2R210 120 1000 5665 6.4R220 120 1000 5676 6.4R230 120 1000 5686 6.3R240 120 1000 5669 6.4R250 120 1000 5695 6.4R410 160 1000 5612 8.4R420 160 1000 5630 8.4R430 160 1000 5628 8.3R440 160 1000 5642 8.3R450 160 1000 5650 8.3R260 40 2000 11,020 2.0R270 40 2000 11,031 2.1R280 40 2000 11,031 2.1R290 40 2000 11,036 2.1R300 40 2000 11,051 2.1R310 80 2000 11,038 4.3R320 80 2000 11,051 4.3R330 80 2000 11,041 4.3R340 80 2000 11,033 4.3R350 80 2000 11,033 4.3R360 120 2000 11,042 6.4R370 120 2000 11,030 6.4R380 120 2000 11,033 6.4R390 120 2000 11,015 6.4R400 120 2000 11,010 6.4R460 160 2000 11,001 8.4R470 160 2000 11,003 8.4R480 160 2000 11,001 8.4R490 160 2000 10,998 8.4R500 160 2000 10,987 8.4
The computational results for the 40 test problems withrandomly distributed customer locations are displayed inTable 3. The table shows that out solution procedure can findvery high quality solutions for realistic-sized problems withreasonable computational effort. The solution times variedfrom less than 30 sec for the smaller problem instances(R110–R150) to less than 60 min for the larger probleminstances (R460–R500). Thus, when we increased thenumber of customer locations from 1,000 to 2,000 andthe number of candidate tower locations from 40 to 160(implying a larger number of possible tower selections foreach customer location), the computational effort increasedby less than two orders of magnitude. In the smallerproblem instances, one MTSO was selected, while twoMTSOs were in the solution for most of the larger probleminstances.

W-CDMA network design 7
Table 3 Empirical results for test problems with uniformly distributed subscribers (dm ∼ U [1, 0])Problemname
Upper bound Best feasible solution (mipgap = 5%)
MTSOs Towers Customers Profit CPU time MTSOs Towers Customers Profit CPU time optimalitybuilt built serviced (%) ($M) (hh:mm:ss) built built serviced (%) ($M) (hh:mm:ss) gap %
R110 1 35.6 92.6 18.33 00:00:02 1 37 92.8 18.22 00:00:20 0.6R120 1 35.7 92.4 18.37 00:00:03 1 36 92.2 18.30 00:00:21 0.4R130 1 33.4 88.4 17.63 00:00:02 1 35 88.8 17.53 00:00:16 0.6R140 1 34.0 86.4 17.03 00:00:29 1 35 85.9 16.80 00:00:25 1.3R150 1 30.9 85.0 17.09 00:00:03 1 31 84.8 16.99 00:00:22 0.6R160 1 42.0 92.2 17.55 00:08:43 1 39 87.5 16.74 00:01:40 4.6R170 1 42.0 91.4 17.36 00:05:41 1 43 89.3 16.75 00:01:50 3.6R180 1 41.0 92.4 17.79 00:10:34 1 43 90.4 17.10 00:01:38 4.0R190 1 42.7 92.8 17.61 00:05:40 1 44 91.1 17.07 00:01:46 3.2R200 1 43.5 92.1 17.41 00:10:58 1 43 89.7 16.87 00:01:50 3.2R210 1 50.0 94.2 17.66 00:43:18 1 51 91.5 16.97 00:08:48 4.1R220 1 51.1 94.7 17.58 00:26:28 1 53 92.6 16.92 00:07:32 3.9R230 1 50.1 94.9 17.88 00:24:44 1 48 91.0 17.15 00:05:05 4.3R240 1 48.0 94.0 17.81 00:24:33 1 51 93.0 17.27 00:06:29 3.1R250 1 48.1 94.3 17.91 00:45:44 1 48 92.2 17.42 00:07:54 2.9R410 1 53.1 93.1 16.81 00:57:02 1 53 90.3 16.21 00:15:07 3.7R420 1 53.7 93.1 16.78 01:40:11 1 54 90.2 16.04 00:30:43 4.6R430 1 52.3 92.7 16.85 01:44:26 1 53 90.2 16.23 00:21:03 3.9R440 1 54.0 93.2 16.86 01:00:32 1 55 90.8 16.25 00:17:25 3.7R450 2 55.8 94.2 16.84 01:40:19 1 55 91.4 16.16 00:15:53 4.2R260 1 37.0 65.3 26.72 00:00:14 1 38 65.3 26.60 00:01:17 0.4R270 1 37.6 67.6 27.80 00:00:14 1 39 67.7 27.70 00:00:50 0.4R280 1 37.3 69.7 28.85 00:00:17 1 38 69.7 28.75 00:00:52 0.4R290 1 37.4 68.2 28.25 00:00:17 1 39 68.3 28.12 00:01:19 0.5R300 1 38.2 66.8 27.63 00:00:14 1 40 67.0 27.53 00:00:59 0.4R310 1 62.4 87.6 34.93 00:10:04 1 65 86.8 34.33 00:03:51 1.8R320 1 62.0 87.0 34.79 00:07:44 1 57 83.7 33.70 00:03:32 3.2R330 1 64.0 88.3 35.14 00:09:17 1 68 87.9 34.50 00:04:12 1.9R340 1 65.1 89.1 35.32 00:10:38 1 66 87.7 34.59 00:04:16 2.1R350 1 64.5 88.6 35.15 00:34:46 1 64 87.2 34.58 00:04:20 1.7R360 N/A N/A N/A N/A 02:00:00a 1 75 93.4 36.42 00:14:52 5.0R370 N/A N/A N/A N/A 02:00:00a 2 81 94.5 36.38 00:16:22 5.0R380 N/A N/A N/A N/A 02:00:00a 2 80 92.2 35.27 00:17:14 5.0R390 N/A N/A N/A N/A 02:00:00a 2 78 93.6 36.15 00:21:53 5.0R400 2 76.7 94.1 37.16 00:59:47 2 79 94.1 36.26 00:15:29 2.5R460 N/A N/A N/A N/A 02:00:00a 2 88 93.7 35.24 00:56:40 5.0R470 N/A N/A N/A N/A 02:00:00a 1 84 91.4 34.61 00:35:20 5.0R480 N/A N/A N/A N/A 02:00:00a 2 88 93.6 35.25 00:36:12 5.0R490 N/A N/A N/A N/A 02:00:00a 2 92 94.7 35.31 00:41:08 5.0R500 N/A N/A N/A N/A 02:00:00a 2 87 93.1 34.95 00:49:15 5.0
a terminated due to 2-hr time limit.
Figure 1 Graphical representation of problem R500 The upper bound problem was solved to optimality, whilethe best feasible procedure was terminated when a solutionwas found that was less than 5% less than the upperbound generated by the branch-and bound tree in CPLEX.Comparing the upper bound solution to the best feasiblesolution, we observe that the optimality gap did not increasesignificantly as the problem size increased. For nine of theten largest problem instances (R360–R400 and R460–R500),the upper bound procedure could not find a solution within2 hr of CPU-time. In these cases, we reported the errortolerance (mipgap) of the best feasible solution procedure(which was 5%). Figure 2 illustrates the solution for testproblem R500.
Next, we solved seven problem instances with datafrom the North Dallas service area. We created sample
8 Q. Cai et al.
problems with demand points concentrated along the majorthoroughfares. In addition, we created three hot spots ofdemand in the downtown district, the Galleria area andthe DFW airport. Residual demand was drawn from auniform distribution over the service area. In each customerlocation, demand was drawn from a uniform distribution withvalues between one and ten simultaneous users. In theseproblem instances, there are six candidate MTSO locations,120 candidate tower locations and 2000 customer locationswith the number of simultaneous calls in each locationdistributed uniformly between one and ten. Problem ND700is illustrated in Figure 3 with demand locations concentratedalong four major thoroughfares and in three hotspots in theNorth Dallas area.
Figure 2 Solution to problem R500
Figure 3 Graphical representation of problem ND700
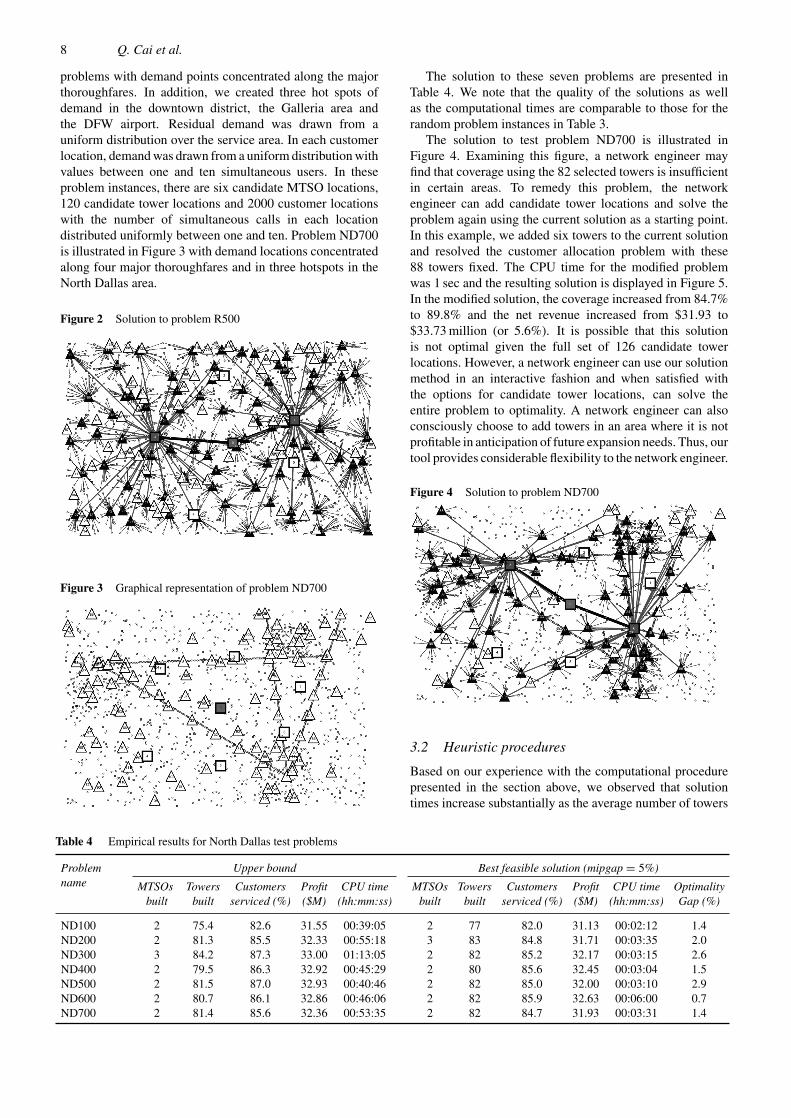
The solution to these seven problems are presented inTable 4. We note that the quality of the solutions as wellas the computational times are comparable to those for therandom problem instances in Table 3.
The solution to test problem ND700 is illustrated inFigure 4. Examining this figure, a network engineer mayfind that coverage using the 82 selected towers is insufficientin certain areas. To remedy this problem, the networkengineer can add candidate tower locations and solve theproblem again using the current solution as a starting point.In this example, we added six towers to the current solutionand resolved the customer allocation problem with these88 towers fixed. The CPU time for the modified problemwas 1 sec and the resulting solution is displayed in Figure 5.In the modified solution, the coverage increased from 84.7%to 89.8% and the net revenue increased from $31.93 to$33.73 million (or 5.6%). It is possible that this solutionis not optimal given the full set of 126 candidate towerlocations. However, a network engineer can use our solutionmethod in an interactive fashion and when satisfied withthe options for candidate tower locations, can solve theentire problem to optimality. A network engineer can alsoconsciously choose to add towers in an area where it is notprofitable in anticipation of future expansion needs. Thus, ourtool provides considerable flexibility to the network engineer.
Figure 4 Solution to problem ND700
3.2 Heuristic procedures
Based on our experience with the computational procedurepresented in the section above, we observed that solutiontimes increase substantially as the average number of towers
Table 4 Empirical results for North Dallas test problems
Problemname
Upper bound Best feasible solution (mipgap = 5%)
MTSOs Towers Customers Profit CPU time MTSOs Towers Customers Profit CPU time Optimalitybuilt built serviced (%) ($M) (hh:mm:ss) built built serviced (%) ($M) (hh:mm:ss) Gap (%)
ND100 2 75.4 82.6 31.55 00:39:05 2 77 82.0 31.13 00:02:12 1.4ND200 2 81.3 85.5 32.33 00:55:18 3 83 84.8 31.71 00:03:35 2.0ND300 3 84.2 87.3 33.00 01:13:05 2 82 85.2 32.17 00:03:15 2.6ND400 2 79.5 86.3 32.92 00:45:29 2 80 85.6 32.45 00:03:04 1.5ND500 2 81.5 87.0 32.93 00:40:46 2 82 85.0 32.00 00:03:10 2.9ND600 2 80.7 86.1 32.86 00:46:06 2 82 85.9 32.63 00:06:00 0.7ND700 2 81.4 85.6 32.36 00:53:35 2 82 84.7 31.93 00:03:31 1.4

W-CDMA network design 9
that can service a customer area increases. This observationled us to design two heuristic procedures that capitalise onlimiting the number of towers to which a customer areacan be assigned. The first heuristic solves the problem(4)–(20) with the valid constraints (32) and (33) but withCm limited to the nearest tower in the set |L|. The modifiedtest problem data are displayed in Table 5. Since somecustomer areas are too far from any tower to receive service,the average number of towers per demand area is slightlybelow one.
Figure 5 Modified solution to problem ND700
Table 6 gives the computational results for Heuristic 1compared to the feasible solution procedure presented in theprevious section. We observe that Heuristic 1 performs wellon the smaller problem instances, but that the optimalitygap increases substantially for larger problem instances.The reason is that Heuristic 1 will add too many towers tothe solution in order to service the customers. While it isbetter to service these customers from a larger number oftowers than not serving them at all, using such a large numberof towers is inefficient. It is interesting to note, though, thatHeuristic 1 performs better on problem instances with highdemand density per tower (i.e. the optimality gap is smallerfor the problem instances with 2000 customer locations thanfor those with 1000 customer locations with the same numberof candidate tower locations). This result stems from the factthat in the high density demand problem instances, a higherpercentage of the candidate towers will be constructed in theoptimal solution, resulting in a smaller difference in solutionbetween optimum and the solution obtained with Heuristic 1.Over all, we conclude that Heuristic 1 is too restrictive in thesolution space considered to be of any significant practicaluse.
In the second heuristic, we restrict the set of permissibletower assignments to at most two for each customer area.Table 7 displays the modified test data for Heuristic 2. Again,some of the customer service areas are not within the rangeof two towers (or not within the range of any tower) and thus,the average number of towers considered per demand area isslightly smaller than two.
The computational results for Heuristic 2 compared tothe feasible solution procedure are displayed in Table 8.Since the upper bound procedure failed to produce a solutionwithin two hr of computational time for problem instancesR360–R390 and R460–R500, we used the objective function
Table 5 Problem data for uniformly distributed subscribers(dm ∼ U [1, 10]) for Heuristic 1 with |Cm| ≤ 1
Problem Number of Number of Total Averagename candidate customer number of size of
towers locations customers Cm
R110 40 1000 5620 0.94R120 40 1000 5637 0.94R130 40 1000 5638 0.90R140 40 1000 5626 0.88R150 40 1000 5625 0.87R160 80 1000 5609 0.96R170 80 1000 5598 0.96R180 80 1000 5608 0.96R190 80 1000 5593 0.96R200 80 1000 5608 0.96R210 120 1000 5665 0.99R220 120 1000 5676 0.99R230 120 1000 5686 1.00R240 120 1000 5669 1.00R250 120 1000 5695 1.00R410 160 1000 5612 1.00R420 160 1000 5630 1.00R430 160 1000 5628 1.00R440 160 1000 5642 1.00R450 160 1000 5650 1.00R260 40 2000 11,020 0.90R270 40 2000 11,031 0.90R280 40 2000 11,031 0.90R290 40 2000 11,036 0.87R300 40 2000 11,051 0.81R310 80 2000 11,038 0.97R320 80 2000 11,051 0.98R330 80 2000 11,041 0.98R340 80 2000 11,033 0.97R350 80 2000 11,033 0.97R360 120 2000 11,042 0.98R370 120 2000 11,030 0.99R380 120 2000 11,033 0.99R390 120 2000 11,015 0.99R400 120 2000 11,010 0.99R460 160 2000 11,001 1.00R470 160 2000 11,003 1.00R480 160 2000 11,001 1.00R490 160 2000 10,998 1.00R500 160 2000 10,987 1.00
value obtained with the best feasible solution procedure inthe previous section, divided by 0.95 (1-mipgap) to generatean upper bound. Thus, the gap reported for Heuristic 2in Table 8 may be larger than the actual gap. However,the solutions based on Heuristic 2 are not quite as goodas the solution obtained with the best feasible solutionprocedure. We note that the computational times are shorterfor Heuristic 2 than for the best feasible solution procedurefrom the previous section, in particular for the larger probleminstances. At the same time, the difference in solution qualityis less than 5% in all problem instances. Thus, althoughHeuristic 2 does not provide an error guarantee, it is robustenough to produce good feasible solutions within reasonablecomputational times for very large problem instances. Thisis particularly true for the higher demand density probleminstances with 160 towers (R460–R500), for which the bestfeasible solution procedure requires the most computational

10 Q. Cai et al.
Table 6 Empirical results for Heuristic 1 applied to test problems with uniformly distributed subscribers(dm ∼ U [1, 0])
Problemname
Best Feasible Solution (mipgap = 5%) Heuristic 1(|Cm| ≤ 1)
MTSOs Towers Customers Profit CPU time Optimality MTSOs Towers Customers Profit CPU time Optimalitybuilt built serviced (%) ($M) (hh:mm:ss) gap % built built serviced (%) ($M) (hh:mm:ss) gap %
R110 1 37 92.8 18.22 00:00:20 0.6 1 40 93.5 18.09 00:00:01 1.3R120 1 36 92.2 18.30 00:00:21 0.4 1 39 92.6 18.08 00:00:01 1.6R130 1 35 88.8 17.53 00:00:16 0.6 1 39 89.5 17.28 00:00:01 2.0R140 1 35 85.9 16.80 00:00:25 1.3 1 38 86.6 16.69 00:00:01 2.0R150 1 31 84.8 16.99 00:00:22 0.6 1 40 86.3 16.48 00:00:01 3.6R160 1 39 87.5 16.74 00:01:40 4.6 1 67 92.4 15.05 00:00:01 14.2R170 1 43 89.3 16.75 00:01:50 3.6 1 67 91.4 14.90 00:00:01 14.2R180 1 43 90.4 17.10 00:01:38 4.0 1 70 94.0 15.21 00:00:01 14.5R190 1 44 91.1 17.07 00:01:46 3.2 1 69 93.2 15.06 00:00:01 14.4R200 1 43 89.7 16.87 00:01:50 3.2 2 69 92.5 15.95 00:00:01 8.3R210 1 51 91.5 16.97 00:08:48 4.1 2 94 93.0 13.03 00:00:01 26.2R220 1 53 92.6 16.92 00:07:32 3.9 2 98 95.0 13.10 00:00:01 25.5R230 1 48 91.0 17.15 00:05:05 4.3 2 96 94.0 13.20 00:00:01 26.2R240 1 51 93.0 17.27 00:06:29 3.1 2 98 94.7 13.02 00:00:01 26.9R250 1 48 92.2 17.42 00:07:54 2.9 2 95 94.5 13.40 00:00:01 25.2R410 1 53 90.3 16.21 00:15:07 3.7 1 94 83.9 10.53 00:00:01 37.4R420 1 54 90.2 16.04 00:30:43 4.6 2 102 86.4 10.42 00:00:01 37.9R430 1 53 90.2 16.23 00:21:03 3.9 2 104 87.4 10.63 00:00:01 36.9R440 1 55 90.8 16.25 00:17:25 3.7 2 106 89.4 10.79 00:00:01 36.0R450 1 55 91.4 16.16 00:15:53 4.2 2 104 88.0 10.62 00:00:01 36.9R260 1 38 65.3 26.60 00:01:17 0.4 1 40 65.3 26.38 00:00:03 1.3R270 1 39 67.7 27.70 00:00:50 0.4 1 40 67.0 27.29 00:00:03 1.8R280 1 38 69.7 28.75 00:00:52 0.4 1 40 69.7 28.55 00:00:05 1.0R290 1 39 68.3 28.12 00:01:19 0.5 1 40 68.0 27.91 00:00:03 1.2R300 1 40 67.0 27.53 00:00:59 0.4 1 40 66.6 27.35 00:00:02 1.0R310 1 65 86.8 34.33 00:03:51 1.8 1 79 89.8 33.90 00:00:02 2.9R320 1 57 83.7 33.70 00:03:32 3.2 2 77 87.7 33.62 00:00:02 3.4R330 1 68 87.9 34.50 00:04:12 1.9 2 80 89.6 34.15 00:00:02 2.8R340 1 66 87.7 34.59 00:04:16 2.1 2 80 90.3 34.47 00:00:02 2.4R350 1 64 87.2 34.58 00:04:20 1.7 2 78 89.8 34.27 00:00:03 2.5R360 1 75 93.4 36.42 00:14:52 5.0 2 113 96.5 34.39 00:00:01 10.3R370 2 81 94.5 36.38 00:16:22 5.0 2 113 96.6 34.34 00:00:01 10.3R380 2 80 92.2 35.27 00:17:14 5.0 2 117 96.7 33.96 00:00:01 8.5R390 2 78 93.6 36.15 00:21:53 5.0 2 117 96.5 33.86 00:00:01 11.0R400 2 79 94.1 36.26 00:15:29 2.5 2 115 96.8 34.11 00:00:01 8.2R460 2 88 93.7 35.24 00:56:40 5.0 2 141 96.4 31.51 00:00:01 15.1R470 1 84 91.4 34.61 00:35:20 5.0 2 140 95.7 31.26 00:00:01 14.2R480 2 88 93.6 35.25 00:36:12 5.0 2 140 96.0 31.39 00:00:01 15.4R490 2 92 94.7 35.31 00:41:08 5.0 2 138 95.7 31.46 00:00:01 15.4R500 2 87 93.1 34.95 00:49:15 5.0 2 142 96.4 31.20 00:00:01 15.2
Table 7 Problem data for uniformly distributed subscribers (dm ∼ U [1, 10]) for Heuristic 2 with|Cm| ≤ 2
Problem name Number of candidate towers Number of customer locations Total number of customers Average size of Cm
R110 40 1000 5620 1.62R120 40 1000 5637 1.61R130 40 1000 5638 1.51R140 40 1000 5626 1.48R150 40 1000 5625 1.50R160 80 1000 5609 1.81R170 80 1000 5598 1.81R180 80 1000 5608 1.83R190 80 1000 5593 1.81R200 80 1000 5608 1.85R210 120 1000 5665 1.95

W-CDMA network design 11
Table 7 Problem data for uniformly distributed subscribers (dm ∼ U [1, 10]) for Heuristic 2 with|Cm| ≤ 2 (Continued)
Problem name Number of candidate towers Number of customer locations Total number of customers Average size of Cm
R220 120 1000 5676 1.95R230 120 1000 5686 1.96R240 120 1000 5669 1.95R250 120 1000 5695 2.00R410 160 1000 5612 1.97R420 160 1000 5630 1.96R430 160 1000 5628 1.97R440 160 1000 5642 1.97R450 160 1000 5650 1.97R260 40 2000 11,020 1.49R270 40 2000 11,031 1.52R280 40 2000 11,031 1.51R290 40 2000 11,036 1.48R300 40 2000 11,051 1.42R310 80 2000 11,038 1.84R320 80 2000 11,051 1.85R330 80 2000 11,041 1.87R340 80 2000 11,033 1.88R350 80 2000 11,033 1.88R360 120 2000 11,042 1.95R370 120 2000 11,030 1.95R380 120 2000 11,033 1.95R390 120 2000 11,015 1.95R400 120 2000 11,010 1.94R460 160 2000 11,001 1.98R470 160 2000 11,003 1.97R480 160 2000 11,001 1.97R490 160 2000 10,998 1.96R500 160 2000 10,987 1.96
Table 8 Empirical results for Heuristic 2 applied to test problems with uniformly distributed subscribers(dm ∼ U [1, 10])
Problemname
Best Feasible Solution (mipgap = 5%) Heuristic 1(|Cm| ≤ 2)
MTSOs Towers Customers Profit CPU time Optimality MTSOs Towers Customers Profit CPU time Optimalitybuilt built serviced (%) ($M) (hh:mm:ss) gap % built built serviced (%) ($M) (hh:mm:ss) gap %
R110 1 37 92.8 18.22 00:00:20 0.6 1 37 92.8 18.22 00:00:14 0.6R120 1 36 92.2 18.30 00:00:21 0.4 1 36 92.2 18.30 00:00:15 0.4R130 1 35 88.8 17.53 00:00:16 0.6 1 35 88.8 17.53 00:00:10 0.6R140 1 35 85.9 16.80 00:00:25 1.3 1 35 86.3 16.90 00:00:14 0.7R150 1 31 84.8 16.99 00:00:22 0.6 1 34 85.6 16.90 00:00:13 0.6R160 1 39 87.5 16.74 00:01:40 4.6 1 47 90.4 16.53 00:00:33 3.6R170 1 43 89.3 16.75 00:01:50 3.6 1 52 91.7 16.44 00:01:00 3.2R180 1 43 90.4 17.10 00:01:38 4.0 1 49 91.7 16.87 00:00:46 3.1R190 1 44 91.1 17.07 00:01:46 3.2 1 49 90.9 16.52 00:00:33 4.0R200 1 43 89.7 16.87 00:01:50 3.2 1 53 92.0 16.47 00:01:00 3.3R210 1 51 91.5 16.97 00:08:48 4.1 1 67 93.9 15.88 00:01:14 4.1R220 1 53 92.6 16.92 00:07:32 3.9 2 66 94.0 16.06 00:01:34 3.0R230 1 48 91.0 17.15 00:05:05 4.3 1 66 94.6 16.11 00:01:42 3.8R240 1 51 93.0 17.27 00:06:29 3.1 1 63 92.7 16.08 00:01:08 3.6R250 1 48 92.2 17.42 00:07:54 2.9 1 65 93.4 15.99 00:01:15 4.6R410 1 53 90.3 16.21 00:15:07 3.7 1 76 92.1 14.26 00:00:54 14.3R420 1 54 90.2 16.04 00:30:43 4.6 1 77 92.3 14.11 00:01:30 15.9R430 1 53 90.2 16.23 00:21:03 3.9 2 77 91.8 14.20 00:00:51 15.7R440 1 55 90.8 16.25 00:17:25 3.7 1 75 91.7 14.32 00:00:49 15.1R450 1 55 91.4 16.16 00:15:53 4.2 1 77 93.6 14.69 00:01:11 12.8R260 1 38 65.3 26.60 00:01:17 0.4 1 38 65.3 26.60 00:00:45 0.4

12 Q. Cai et al.
Table 8 Empirical results for Heuristic 2 applied to test problems with uniformly distributed subscribers(dm ∼ U [1, 10]) (Continued)
Problemname
Best Feasible Solution (mipgap = 5%) Heuristic 1(|Cm| ≤ 2)
MTSOs Towers Customers Profit CPU time Optimality MTSOs Towers Customers Profit CPU time Optimalitybuilt built serviced (%) ($M) (hh:mm:ss) gap % built built serviced (%) ($M) (hh:mm:ss) gap %
R270 1 39 67.7 27.70 00:00:50 0.4 1 39 67.7 27.71 00:00:35 0.4R280 1 38 69.7 28.75 00:00:52 0.4 1 38 69.7 28.75 00:00:36 0.4R290 1 39 68.3 28.12 00:01:19 0.5 1 39 68.2 28.06 00:00:45 0.7R300 1 40 67.0 27.53 00:00:59 0.4 1 40 67.0 27.53 00:00:36 0.4R310 1 65 86.8 34.33 00:03:51 1.8 1 65 86.5 34.21 00:01:52 1.8R320 1 57 83.7 33.70 00:03:32 3.2 1 65 86.4 34.17 00:01:21 1.4R330 1 68 87.9 34.50 00:04:12 1.9 1 67 87.5 34.46 00:01:35 1.8R340 1 66 87.7 34.59 00:04:16 2.1 1 68 88.2 34.61 00:01:24 1.9R350 1 64 87.2 34.58 00:04:20 1.7 1 64 86.6 34.30 00:01:58 2.3R360 1 75 93.4 36.42 00:14:52 5.0 1 85 94.3 35.98 00:03:36 6.1R370 2 81 94.5 36.38 00:16:22 5.0 2 87 94.3 35.73 00:05:14 6.7R380 2 80 92.2 35.27 00:17:14 5.0 2 83 93.6 35.65 00:04:16 4.0R390 2 78 93.6 36.15 00:21:53 5.0 2 83 93.9 35.69 00:04:15 6.2R400 2 79 94.1 36.26 00:15:29 2.5 2 84 93.6 35.63 00:05:03 4.1R460 2 88 93.7 35.24 00:56:40 5.0 2 100 93.3 33.99 00:06:23 8.4R470 1 84 91.4 34.61 00:35:20 5.0 2 103 94.8 34.35 00:09:43 5.7R480 2 88 93.6 35.25 00:36:12 5.0 2 101 92.9 33.69 00:07:02 9.2R490 2 92 94.7 35.31 00:41:08 5.0 2 104 93.7 33.75 00:05:48 9.2R500 2 87 93.1 34.95 00:49:15 5.0 2 101 93.0 33.52 00:07:51 8.9
time (35–60 minutes compared to 5–10 min for Heuristic 2).We conclude that Heuristic 2 is a viable solution procedurefor very large problem instances with high demanddensity.
4 Conclusions
In this investigation, the W-CDMA network design problemis modelled as a discrete optimisation problem. The modelmaximises revenue from customers serviced by the networknet the cost of towers, switching facilities and backbonenetwork connecting the towers and switching facilitiesto the PSTN. The resulting integer programme is verylarge and standard commercial software packages cannotobtain optimal solutions to realistic-sized problem instances.Therefore, we developed a solution method based on a pairof models, one for the upper bound and one for the lowerbound. The solution method was implemented in softwareusing the AMPL/CPLEX system.
We tested our solution method on 40 large test problemswith 1,000–2,000 customer locations with an average of5.5 customers in each location, while the candidate towerlocations varied between 40 and 160 and the number ofcandidate switching locations was 5. We solved all of thesetest problems to within a guaranteed 5% of optimalityusing very reasonable computational effort. The largesttest problems required up to 60 min of CPU time. In aneffort to reduce the computational times for the largestand most difficult problem instances, we developed andtested two heuristic procedures. One of these proceduresproved efficient for the largest test problems, reducing thecomputational effort by one order of magnitude at a penaltyof less than 5% of the objective function value.
We also tested our solution method on seven test problemsbased on the infrastructure and travel patterns in the NorthDallas area. The results for these test problems were onpar with those for the randomly generated test problems.Additionally, we provided an example of how our tool canbe used in an interactive fashion in which a network engineercan manually modify the solution to expand the numberof candidate towers or to make use of specific parts of thenetwork infrastructure. Modifications to a solution can beevaluated in seconds with our solution method. Thus, itprovides network engineers with significant flexibility whenanalysing a network provisioning plan.
Acknowledgement
This research was supported in part by the Office of NavalResearch Award Number N00014-96-1-0315.
References
Amaldi, E., Capone, A. and Malucelli, F. (2001a) ‘DiscreteModels and algorithms for the capacitated locationproblems arising in UMTS network planning’, Proceedingsof the 5th International Workshop on Discrete Algorithms andMethods for Mobile Computing and Communications, Rome.ACM, pp.1–8.
Amaldi, E., Capone, A. and Malucelli, F. (2001b) ‘Improved modelsand algorithms for UMTS radio planning. IEEE 54th VehicularTechnology Conference Proceedings, IEEE, pp.920–924.
Beasley, J.E. (1989) ‘An SST-based algorithm for the steinerproblem in graphs’, Networks, Vol. 19, No. 1, pp.1–16.

W-CDMA network design 13
Fourer, R., Gay, D.M. and Kernighan, B.W. (2003) AMPL:A Modeling Language for Mathematical Programming, 2ndedition Brooks/Cole–Thomson Learning, Pacific Grove, CA.
Galota, M., Glasser, C., Reith, S. and Vollmer, H. (2001)‘A ploynomial-time approximation scheme for base stationpositioning in UMTS networks’, Proceedings of the 5thInternational Workshop on Discrete Algorithms and Methodsfor Mobile Computing and Communications, Rome, ACM,pp.52–59.
Hata, M. (1980) ‘Empirical formula for propagation loss inland mobile radio service’, IEEE Transactions on VehicularTechnology, Vol. 29, pp.317–325.
Kalvenes, J., Kennington, J. and Olinick, E. (2006) ‘Basestation location and service assignment in W-CDMAnetworks’, INFORMS Journal on Computing, Vol. 18,No. 3, pp.366–376.
Li, J., Kameda, H. and Itoh, H. (1997) ‘Balanced assignment of cellsin PCS networks’, Proceedings of the 1997 ACM Symposium onApplied Computing, pp.297–301, San Jose, CA: ACM Press.
Martello, S. and Toth, P. (1990) Knapsack Problems: Algorithmsand Computer Implementations, Wiley, Chichester, England.
Mathar, R. and M. Schmeink, (2001) ‘Optimal base stationpositioning and channel assignment for 3G mobile networks byinteger programming’, Annals of Operations Research Vol. 107,pp.225–236.
Merchant, A. and Sengupta, B. (1995) ‘Assignment of cellsto switches in PCS networks’, ACM/IEEE Transactions onNetworking, Vol. 3, No. 5, pp.521–526.
Pisinger, D. (1999) ‘Core Problems in Knapsack Algorithms’,Operations Research Vol. 47, pp.570–575.
Note
1CDMA does not utilize channels to allocate bandwidths to sessions,but an equivalent maximum transmission bit rate is allocated tosessions through the use of orthogonal spreading codes


![Searches arXiv:1803.09859v1 [cs.CV] 27 Mar 2018 › pdf › 1803.09859.pdf · WebSeg: Learning Semantic Segmentation from Web Searches Qibin Hou 1Ming-Ming Cheng Jiangjiang Liu Philip](https://img.pdfslide.net/doc/110x75/5f0f4a7b7e708231d4436e67/searches-arxiv180309859v1-cscv-27-mar-2018-a-pdf-a-180309859pdf-webseg.jpg)