Embed Size (px)
Citation preview

qqqq Nyadi Hydropower Limited (NHL)
Nyadi Hydropower Project (30 MW) Feasibility Study
Final Report
Volume I Main Report
October, 2010
Nyadi Hydropower Limited (NHL)
`
Nyadi Hydropower Project (30MW) Feasibility Study
Final Report
Volume I Main Report
October, 2010
Quality control Signature Date
Prepared by: Basanta Bagale
Basanta Man Shrestha
Uttam Dhakal
Sumin Shrestha
Rijan Poudyal
Govinda Chalise
Ujwol Phaiju
Checked by: Saroj Lal Shrestha
Approved by: Bharat Raj Pandey

Hydro Consult Nyadi Hydropower Project Volume I Main Report
Nyadi Hydropower Limited i
Report contents
EXECUTIVE SUMMARY
VOLUME 1 MAIN REPORT
VOLUME 2 INVESTIGATION ANNEX
APPENDIX A HYDROLOGY AND SEDIMENTOLGY
APPENDIX B TOPOGRAPHICAL SURVEY
APPENDIX C SITE INVESTIGATION (GEOLOGY AND GEOTECHNICAL)
VOLUME 3 TECHNICAL ANNEX
APPENDIX D DESIGN CALCULATION
APPENDIX E OPTIMIZATION STUDY
APPENDIX F COST ESTIMATE AND FINANCIAL ANALYSIS
APPENDIX G ACCESS ROAD DESIGN REPORT
APPENDIX H PHOTOGRAPHS
VOLUME 4 MAP AND DRAWINGS
APPENDIX J TOPOGRAPHICAL MAPS
APPENDIX K GEOLOGICAL MAPS
APPENDIX L CIVIL DRAWIGS
APPENDIX M ELECTRICAL DRAWINGS

Hydro Consult Nyadi Hydropower Project Volume I Main Report
Nyadi Hydropower Limited ii
Table of contents Page No.
1. INTRODUCTION .......................................................................................................... 1-1
1.1 Background ........................................................................................................................................... 1-1 1.2 Previous studies ................................................................................................................................... 1-2 1.3 Objective ............................................................................................................................................... 1-2 1.4 Report layout ........................................................................................................................................ 1-2 1.5 Project area ........................................................................................................................................... 1-3
1.5.1 Location .................................................................................................................................. 1-3 1.5.2 River basin .............................................................................................................................. 1-3 1.5.3 Accessibility ............................................................................................................................ 1-3 1.5.4 Electricity availability ............................................................................................................ 1-3
1.6 Data collection and review ............................................................................................................... 1-3 1.7 Field visit ................................................................................................................................................ 1-3 1.8 Field survey /investigation and data collection ............................................................................. 1-4
1.8.1 Hydrological investigation and sediment sampling ........................................................ 1-4 1.8.2 Topographical survey ........................................................................................................... 1-4 1.8.3 Geological / Geotechnical investigation .......................................................................... 1-4
1.9 Project description .............................................................................................................................. 1-6
2. NEA AND POWER SECTOR ....................................................................................... 2-1
2.1 Introduction .......................................................................................................................................... 2-1 2.2 Existing generation system & projects under construction ...................................................... 2-1 2.3 Load forecast ........................................................................................................................................ 2-4 2.4 Hydropower development and the private sector ..................................................................... 2-4 2.5 Conclusion ............................................................................................................................................ 2-5
3. LEGAL EVALUATION .................................................................................................. 3-1
3.1 Introduction .......................................................................................................................................... 3-1 3.2 Review of existing Policies, Acts and Regulations ....................................................................... 3-1
3.2.1 The Interim Constitution of Nepal, 2007 ....................................................................... 3-1 3.2.2 Hydropower Development Policy, 2001 ........................................................................ 3-1 3.2.3 Industrial Policy, 2010 .......................................................................................................... 3-2 3.2.4 Companies Act, 2006 .......................................................................................................... 3-3 3.2.5 The Industrial Enterprises Act, 1992 ............................................................................... 3-3 3.2.6 The Foreign Investment and Technology Transfer Act, 1992 ................................... 3-3 3.2.7 Water Resources Act, 1992 and Regulations, 1993 .................................................... 3-4 3.2.8 The Electricity Act, 1992 and Regulation, 1993 ............................................................ 3-4 3.2.9 Environment Protection Act, 1997 and Regulation, 1999 .......................................... 3-6 3.2.10 The Aquatic Animals Protection Act, 1961 .................................................................... 3-7 3.2.11 The Income Tax Act, 2000 ................................................................................................. 3-7 3.2.12 The Value Added Tax Act, 1995 ....................................................................................... 3-7 3.2.13 The Securities Act, 2007 and Securities Registration and Issue Regulations, 2008 3-7
3.3 Constraints and Challenges............................................................................................................... 3-8 3.3.1 Policy Related ........................................................................................................................ 3-8 3.3.2 Legislation Related ................................................................................................................ 3-9
3.4 Conclusion ......................................................................................................................................... 3-10
4. TOPOGRAPHICAL SURVEY ....................................................................................... 4-1
4.1 Control survey traverse .................................................................................................................... 4-1 4.2 Survey (1:5000 scale) .......................................................................................................................... 4-1 4.3 Detailed surveys................................................................................................................................... 4-2

Hydro Consult Nyadi Hydropower Project Volume I Main Report
Nyadi Hydropower Limited iii
4.4 Topographic maps ............................................................................................................................... 4-2 4.5 Station description cards ................................................................................................................... 4-2
5. HYDROLOGY AND SEDIMENTOLOGY ................................................................... 5-1
5.1 Introduction .......................................................................................................................................... 5-1 5.1.1 Previous studies .................................................................................................................... 5-1
5.2 Nyadi River data .................................................................................................................................. 5-1 5.2.1 DHM data ............................................................................................................................... 5-1 5.2.2 LEDCO and BPC data ......................................................................................................... 5-1
5.3 Regional DHM data ............................................................................................................................. 5-2 5.3.1 Water level and stream flow data .................................................................................... 5-3 5.3.2 Rainfall data ............................................................................................................................ 5-5
5.4 Nyadi River discharge ......................................................................................................................... 5-5 5.4.1 Rating curve staff gauge no.1 .............................................................................................. 5-6 5.4.2 Flow series staff gauge no.1 ................................................................................................ 5-6
5.5 Catchment correlation ....................................................................................................................... 5-6 5.5.1 Nyadi catchment ................................................................................................................... 5-7 5.5.2 Specific Discharge of Different Rivers ............................................................................. 5-9 5.5.3 Seti Khola catchment ........................................................................................................ 5-10 5.5.4 Generation of long term Average flow ........................................................................ 5-10 5.5.5 Extended Nyadi flows ....................................................................................................... 5-11 5.5.6 Comparison of actual and extended flows .................................................................. 5-12 5.5.7 Regional method ................................................................................................................ 5-13 5.5.8 Comparison with other similar catchment .................................................................. 5-13
5.6 Flow of Nyadi with Siuri Tail Water ............................................................................................ 5-14 5.6.1 Average monthly flows ..................................................................................................... 5-14 5.6.2 Flow duration Curves ....................................................................................................... 5-14
5.7 Extreme flood flows ......................................................................................................................... 5-16 5.7.1 Flood at Intake .................................................................................................................... 5-16 5.7.2 Flood at Tailrace ................................................................................................................ 5-16
5.8 Extreme low flow ............................................................................................................................. 5-16 5.9 Sedimentology ................................................................................................................................... 5-17
5.9.1 General ................................................................................................................................. 5-17 5.9.2 Studies carried out ............................................................................................................ 5-17 5.9.3 Sediment analysis ............................................................................................................... 5-23
6. WATER SHARING ........................................................................................................ 6-1
7. GEOLOGY AND GEOTECHNICAL ............................................................................ 7-1
7.1 Previous study ...................................................................................................................................... 7-1 7.2 Regional geology .................................................................................................................................. 7-1
7.2.1 Kuncha Formation ................................................................................................................ 7-2 7.2.2 Garnet Schist ......................................................................................................................... 7-2 7.2.3 Graphitic Schist ..................................................................................................................... 7-2 7.2.4 Carbonates ............................................................................................................................. 7-3 7.2.5 Kyanite Schists and Quartzites .......................................................................................... 7-5 7.2.6 Banded and Augen Gneisses .............................................................................................. 7-5 7.2.7 Geology of the project area ............................................................................................... 7-6 7.2.8 Banded and Augen Gneisses .............................................................................................. 7-6 7.2.9 Kyanite Schists and Quartzites .......................................................................................... 7-7 7.2.10 Palaeochannel deposits ........................................................................................................ 7-7 7.2.11 Headworks area .................................................................................................................... 7-8 7.2.12 Diversion weir ....................................................................................................................... 7-8 7.2.13 Inlet Portal, approach tunnel and settling chamber ...................................................... 7-9 7.2.14 Headrace tunnel .................................................................................................................... 7-9

Hydro Consult Nyadi Hydropower Project Volume I Main Report
Nyadi Hydropower Limited iv
7.2.15 Stretch from intake to Naiche adit ................................................................................... 7-9 7.2.16 Stretch from Naiche adit to Nana valley ...................................................................... 7-10 7.2.17 Stretch between Nana valley, surge shaft, and outlet portal .................................. 7-10 7.2.18 Surge shaft ........................................................................................................................... 7-11 7.2.19 Drop shaft, powerhouse and tailrace option .............................................................. 7-11 7.2.20 Surface penstock for surface powerhouse option ..................................................... 7-11 7.2.21 Penstock alignment for underground powerhouse option ...................................... 7-11 7.2.22 Powerhouse ........................................................................................................................ 7-12 7.2.23 Tailrace ................................................................................................................................. 7-13 7.2.24 Access Tunnel ..................................................................................................................... 7-13
7.3 Mass wasting ...................................................................................................................................... 7-14 7.4 Access road alignment ..................................................................................................................... 7-18
7.4.1 Alignment description ....................................................................................................... 7-18 7.4.2 Bridge abutment ................................................................................................................. 7-18 7.4.3 Soil types .............................................................................................................................. 7-19 7.4.4 Geological structures ........................................................................................................ 7-19 7.4.5 Headworks .......................................................................................................................... 7-22 7.4.6 Gravel trap and approach tunnel ................................................................................... 7-22 7.4.7 Settling basin ....................................................................................................................... 7-22 7.4.8 Tunnel alignment ................................................................................................................ 7-22 7.4.9 Naiche adit .......................................................................................................................... 7-24 7.4.10 Surge shaft ........................................................................................................................... 7-24 7.4.11 Outlet portal ....................................................................................................................... 7-25 7.4.12 Penstock alignment ............................................................................................................ 7-25 7.4.13 Powerhouse ........................................................................................................................ 7-26 7.4.14 Tailrace and Access tunnel .............................................................................................. 7-28
7.5 Anticipated geological problems ................................................................................................... 7-28 7.5.1 Overbreak and relocation of tunnel alignment .......................................................... 7-28 7.5.2 Rock squeezing ................................................................................................................... 7-28 7.5.3 Water leakage and ingress ............................................................................................... 7-28 7.5.4 Slope stability ...................................................................................................................... 7-29
7.6 Seismicity ............................................................................................................................................ 7-29 7.6.1 General ................................................................................................................................. 7-29 7.6.2 Tectonic Setting of Nyadi Hydropower Project ........................................................ 7-29 7.6.3 Historical seismic activity of greater magnitude ......................................................... 7-29 7.6.4 Seismic hazard assessment .............................................................................................. 7-30 7.6.5 Recommendation ............................................................................................................... 7-31
7.7 Core drilling ....................................................................................................................................... 7-31 7.7.1 General ................................................................................................................................. 7-31 7.7.2 Drilling rig ............................................................................................................................ 7-32 7.7.3 Boreholes logs .................................................................................................................... 7-32 7.7.4 Core tests ............................................................................................................................ 7-33 7.7.5 Uniaxial compressive strength test ............................................................................... 7-33 7.7.6 Point load test .................................................................................................................... 7-33 7.7.7 Permeability tests ............................................................................................................... 7-33
7.8 Construction material ..................................................................................................................... 7-34 7.8.1 Locations of sampling pits ................................................................................................ 7-34 7.8.2 Construction material testing ......................................................................................... 7-34 7.8.3 Gradation test .................................................................................................................... 7-35 7.8.4 Flakiness index .................................................................................................................... 7-35 7.8.5 Elongation index ................................................................................................................. 7-35 7.8.6 Soundness test .................................................................................................................... 7-36 7.8.7 Organic impurities ............................................................................................................. 7-36 7.8.8 Los Angeles Abrasion Test (LAAT) .............................................................................. 7-36 7.8.9 Mica content ....................................................................................................................... 7-36 7.8.10 Conclusion ........................................................................................................................... 7-36
7.9 Geophysical survey introduction .................................................................................................. 7-36

Hydro Consult Nyadi Hydropower Project Volume I Main Report
Nyadi Hydropower Limited v
7.9.1 Introduction (GRCS) ........................................................................................................ 7-36 7.9.2 Methodology (GRCS) ....................................................................................................... 7-38 7.9.3 Analysis and interpretation (GRCS) .............................................................................. 7-39 7.9.4 Conclusions (GRCS) ......................................................................................................... 7-44
8. PLANT CAPACITY OPTIMIZATION ......................................................................... 8-1
8.1 Introduction .......................................................................................................................................... 8-1 8.2 Objectives.............................................................................................................................................. 8-1 8.3 Approach and Methodology ............................................................................................................. 8-1 8.4 Hydrology .............................................................................................................................................. 8-1 8.5 Plant Capacity Ranges ......................................................................................................................... 8-2 8.6 Conceptual Layout .............................................................................................................................. 8-3 8.7 Energy Production ............................................................................................................................... 8-5 8.8 Cost Estimate ....................................................................................................................................... 8-5 8.9 Benefit Cost Analysis for Various Installed Capacities ............................................................... 8-6 8.10 Result of Benefit Cost Analysis ........................................................................................................ 8-6 8.11 Conclusion and Recommendation................................................................................................... 8-7
9. PROJECT ENGINEERING............................................................................................. 9-1
9.1 Headworks ............................................................................................................................................ 9-1 9.1.1 Location .................................................................................................................................. 9-1 9.1.2 Design concept ...................................................................................................................... 9-1 9.1.3 Proposed headworks arrangement .................................................................................. 9-2 9.1.4 Hydraulic model study ......................................................................................................... 9-2 9.1.5 Diversion weir with frontal intake and two radial bottom sluice gates .................. 9-2 9.1.6 Operational aspects of the radial gate ............................................................................. 9-3 9.1.7 RCC Bridge ............................................................................................................................ 9-3 9.1.8 Intake area .............................................................................................................................. 9-3 9.1.9 Stilling basin ............................................................................................................................ 9-3 9.1.10 Gravel trap unit ..................................................................................................................... 9-4 9.1.11 Intake stoplogs ....................................................................................................................... 9-4 9.1.12 Intake tunnel .......................................................................................................................... 9-4 9.1.13 Tunnel rock support ............................................................................................................ 9-4 9.1.14 Suspended sediment removal ............................................................................................ 9-4 9.1.15 Sediment removal options .................................................................................................. 9-4 9.1.16 Settling basin .......................................................................................................................... 9-5 9.1.17 Flushing arrangement ........................................................................................................... 9-6 9.1.18 Tunnel rock support ............................................................................................................ 9-7 9.1.19 River diversion ...................................................................................................................... 9-7 9.1.20 Fish ladder .............................................................................................................................. 9-7 9.1.21 Tunnel rock support ............................................................................................................ 9-8 9.1.22 Operators' facilities .............................................................................................................. 9-8 9.1.23 Access for operation and maintenance ........................................................................... 9-8 9.1.24 Access for construction ...................................................................................................... 9-8 9.1.25 Gates and operating equipment ........................................................................................ 9-8 9.1.26 Siuri Tail Race Water Pumping Arrangements ........................................................... 9-10
9.2 Waterways ......................................................................................................................................... 9-10 9.2.1 General ................................................................................................................................. 9-10 9.2.2 Headrace Tunnel ................................................................................................................ 9-11 9.2.3 Rock trap / Gravel Trap ................................................................................................... 9-11 9.2.4 Tunnel adits and portals ................................................................................................... 9-12 9.2.5 Spoil tip arrangement ........................................................................................................ 9-12 9.2.6 General ................................................................................................................................. 9-13 9.2.7 Surge analysis ...................................................................................................................... 9-13 9.2.8 Penstock ............................................................................................................................... 9-14 9.2.9 General ................................................................................................................................. 9-14
Hydro Consult Nyadi Hydropower Project Volume I Main Report
Nyadi Hydropower Limited vi
9.2.10 Pipe material ....................................................................................................................... 9-14 9.2.11 Anchor blocks and support piers .................................................................................. 9-15 9.2.12 Underground Powerhouse .............................................................................................. 9-16 9.2.12.1 General ................................................................................................................................. 9-16 9.2.12.2 Main powerhouse floor .................................................................................................... 9-16 9.2.12.3 Control room and other utility spaces......................................................................... 9-17 9.2.12.4 Access Tunnel ..................................................................................................................... 9-17 9.2.13 Switchyard area .................................................................................................................. 9-17 9.2.14 Heating and ventilation ..................................................................................................... 9-17 9.2.15 Drainage ............................................................................................................................... 9-17 9.2.16 Water supply ...................................................................................................................... 9-17 9.2.17 Sanitary and sewage system ............................................................................................ 9-17
9.3 Tailrace ................................................................................................................................................ 9-17 9.4 Hydro-mechanical works ................................................................................................................ 9-17
9.4.1 Coarse trashrack ............................................................................................................... 9-18 9.4.2 Bottom sluice stoplogs and radial gates ....................................................................... 9-18 9.4.3 Gravel trap flushing gate and tunnel intake gate ....................................................... 9-18 9.4.4 Water Level Monitor ........................................................................................................ 9-18 9.4.5 Settling Chamber Sounding Reel .................................................................................... 9-18 9.4.6 Settling Chamber Isolation Stoplog (inlet) ................................................................... 9-18 9.4.7 Settling Chamber Isolation Gates (inlet) ...................................................................... 9-18 9.4.8 Settling Chamber Stoplog (outlet) ................................................................................. 9-18 9.4.9 Settling Chamber Gate (outlet) ...................................................................................... 9-19 9.4.10 Settling Chamber Flushing Valves .................................................................................. 9-19 9.4.11 Water Pump........................................................................................................................ 9-19 9.4.12 Settling Chamber Sounding Reel .................................................................................... 9-19 9.4.13 Real Time Sediment Monitoring ..................................................................................... 9-19 9.4.14 Diversion Tunnel inlet portal stoplogs ......................................................................... 9-19 9.4.15 Bulkhead Gate at Naiche and surge Adit ..................................................................... 9-19 9.4.16 Portal Gate at Naiche adit, ventilation adit and Surge shaft adit (No water pressure) ............................................................................................................................................. 9-19 9.4.17 0.25m diameter Flushing Valves ..................................................................................... 9-19 9.4.18 0.5m diameter flushing valves ......................................................................................... 9-19 9.4.19 Pressure valve between Headrace tunnel and penstock .......................................... 9-20 9.4.20 Tailrace Gate ...................................................................................................................... 9-20 9.4.21 Powerhouse Door ............................................................................................................. 9-20 9.4.22 Penstock and Penstock Specials ..................................................................................... 9-20 9.4.23 Miscellaneous items ........................................................................................................... 9-20
9.5 Electromechanical ............................................................................................................................. 9-20 9.5.1 Turbine ................................................................................................................................. 9-20 9.5.2 Bearings ................................................................................................................................ 9-21 9.5.3 Main Inlet Valves (MIV) ..................................................................................................... 9-21 9.5.4 Cooling Water System ..................................................................................................... 9-21 9.5.5 Overhead Crane ................................................................................................................ 9-22 9.5.6 Governor ............................................................................................................................. 9-22 9.5.7 Generator ............................................................................................................................ 9-23 9.5.8 Generator Level ................................................................................................................. 9-23 9.5.9 Excitation and Automatic Voltage Regulator (AVR) ................................................. 9-24 9.5.10 Generator Grounding ....................................................................................................... 9-24 9.5.11 Power Transformers ......................................................................................................... 9-25 9.5.12 Auxiliary Transformer ...................................................................................................... 9-26 9.5.13 Isolation Transformer ....................................................................................................... 9-26 9.5.14 Vacuum Circuit Breaker (VCB) ...................................................................................... 9-27 9.5.15 SF6 Circuit Breaker ........................................................................................................... 9-28 9.5.16 Air Circuit Breaker ........................................................................................................... 9-29 9.5.17 Lightening Arrestor ........................................................................................................... 9-29 9.5.18 Diesel Generator ............................................................................................................... 9-29
Hydro Consult Nyadi Hydropower Project Volume I Main Report
Nyadi Hydropower Limited vii
9.5.19 High Voltage Switchyard .................................................................................................. 9-29 9.5.20 DC Power Supply .............................................................................................................. 9-29 9.5.21 Interconnection to grid .................................................................................................... 9-29
9.6 Transmission Line ............................................................................................................................. 9-30 9.7 Access Road and Bridge .................................................................................................................. 9-30 9.8 Housing ............................................................................................................................................... 9-32
10. POWER EVACUATION ............................................................................................. 10-1
11. ENVIRONMENTAL IMPACT ASSESSMENT (EIA) ................................................ 11-1
11.1 Description of the project .............................................................................................................. 11-1 11.2 Project location ................................................................................................................................. 11-1 11.3 Objective of the study ..................................................................................................................... 11-1 11.4 Methodologies used during EIA study ......................................................................................... 11-1 11.5 General project features ................................................................................................................. 11-1 11.6 Construction period ........................................................................................................................ 11-2 11.7 Description of the existing environment .................................................................................... 11-2
11.7.1 The Physical Environment ................................................................................................ 11-2 11.7.2 The Biological Environment ............................................................................................ 11-2 11.7.3 The Socio-economic and Cultural environment ........................................................ 11-3
11.8 Identification of Environmental Impacts ...................................................................................... 11-3 11.8.1 Impact on Physical Environment .................................................................................... 11-3 11.8.2 Impact on Biological Environment ................................................................................. 11-4 11.8.3 Impact on Socio-economic and Cultural Environment ............................................. 11-5 11.8.4 Beneficial Impacts ............................................................................................................... 11-6
11.9 Mitigation and Enhancement Measures ....................................................................................... 11-6 11.9.1 Physical Environment ........................................................................................................ 11-6 11.9.2 Biological Environment ..................................................................................................... 11-7 11.9.3 Socio-economic and Cultural Environment ................................................................ 11-7 11.9.4 Enhancement Measures for Beneficial Impacts ........................................................... 11-8
11.10 Environmental Management Plan (EMP) ..................................................................................... 11-8
12. CONSTRUCTION PLANNING AND SCHEDULE ................................................. 12-1
12.1 Introduction ....................................................................................................................................... 12-1 12.2 Construction Activities ................................................................................................................... 12-3
12.2.1 River diversion during construction .............................................................................. 12-3 12.2.2 Civil works .......................................................................................................................... 12-3 12.2.3 Electromechanical equipment ......................................................................................... 12-6 12.2.4 Transmission line ............................................................................................................... 12-6
12.3 Construction power ........................................................................................................................ 12-6 12.4 Construction Material ..................................................................................................................... 12-6
12.4.1 Sand ....................................................................................................................................... 12-6 12.4.2 Aggregate ............................................................................................................................. 12-7 12.4.3 Hard stone for weir lining ............................................................................................... 12-7
12.5 Contract package and construction schedule ........................................................................... 12-8 12.5.1 Contract package ............................................................................................................... 12-8 12.5.2 Construction schedule ..................................................................................................... 12-8
13. PROJECT COST ESTIMATION ................................................................................. 13-1
13.1 Introduction ....................................................................................................................................... 13-1 13.2 Assumptions ...................................................................................................................................... 13-1 13.3 General methodology ...................................................................................................................... 13-1
13.3.1 Main civil works estimate ................................................................................................. 13-2 13.3.2 Electrical and mechanical equipment ............................................................................ 13-2 13.3.3 Penstock and hydro mechanical ..................................................................................... 13-2

Hydro Consult Nyadi Hydropower Project Volume I Main Report
Nyadi Hydropower Limited viii
13.3.4 Switchyard and transmission line ................................................................................... 13-2 13.4 Engineering fees ................................................................................................................................ 13-3 13.5 Development cost ............................................................................................................................ 13-3 13.6 Contingency sums ............................................................................................................................ 13-3 13.7 VAT and taxes ................................................................................................................................... 13-3 13.8 Base project cost estimate ............................................................................................................. 13-3
14. ENERGY AND POWER .............................................................................................. 14-5
15. FINANCIAL ANALYSIS .............................................................................................. 15-1
15.1 Introduction ....................................................................................................................................... 15-1 15.2 Assumption in Financial Analysis ................................................................................................... 15-1
15.2.1 Base Project cost estimate .............................................................................................. 15-1 15.2.2 Construction Plan .............................................................................................................. 15-1 15.2.3 Financial Plan ....................................................................................................................... 15-2 15.2.4 Investment Requirement .................................................................................................. 15-2 15.2.5 Project life ........................................................................................................................... 15-2 15.2.6 Interest rate on debt capital ............................................................................................ 15-2 15.2.7 Loan Maturity...................................................................................................................... 15-2 15.2.8 Initial working Capital ....................................................................................................... 15-2 15.2.9 Operation and Maintenance cost ................................................................................... 15-3 15.2.10 Corporate overhead and Operation Insurance ......................................................... 15-3 15.2.11 Royalty .................................................................................................................................. 15-3 15.2.12 Corporate Tax ................................................................................................................... 15-3 15.2.13 Depreciation ....................................................................................................................... 15-3 15.2.14 Bonus .................................................................................................................................... 15-3 15.2.15 Energy and Energy price ................................................................................................... 15-3
15.3 Financial Evaluation of NHP ........................................................................................................... 15-4 15.3.1 Result of Financial Evaluation .......................................................................................... 15-4 15.3.2 Sensitivity analysis and its results ................................................................................... 15-6
15.4 Conclusion and Recommendation................................................................................................ 15-6
16. CONCLUSION AND RECOMMENDATIONS ......................................................... 16-1
16.1 Conclusion ......................................................................................................................................... 16-1 16.2 Recommendations ............................................................................................................................ 16-1
17. REFERENCES ............................................................................................................... 17-1
LIST OF TABLES .......................................................................................................... Page no.
Table 1-1 Details of 2D-ERT surveys, Nyadi Hydropower Project ................................................................... 1-5 Table 1-2 Salient features of the proposed NHP ..................................................................................................... 1-7 Table 2-1 Existing generating systems ....................................................................................................................... 2-1 Table 2-2 Power plants under construction ............................................................................................................ 2-3 Table 2-3 Load Forecast FY 2008-2026 .................................................................................................................... 2-4 Table 5-1 Water level and stream flow data available from DHM ....................................................................... 5-3 Table 5-2 Marsyangdi River average monthly flows in m3/s .................................................................................... 5-3 Table 5-3 Chepe Khola average monthly flows in m3/s ........................................................................................... 5-4 Table 5-4 Seti River average monthly flows in m3/s .................................................................................................. 5-5 Table 5-5 Rain gauges in the project area ................................................................................................................... 5-5 Table 5-6 Staff gauge no.1 average monthly flow in m3/s ........................................................................................ 5-6 Table 5-7 Characteristics of the Nyadi Khola catchment ....................................................................................... 5-7 Table 5-8 Catchment area of Nyadi Khola ................................................................................................................. 5-9 Table 5-9 Monthly average discharge of Different rivers ........................................................................................ 5-9 Table 5-10 Specific discharge of different rivers ...................................................................................................... 5-9

Hydro Consult Nyadi Hydropower Project Volume I Main Report
Nyadi Hydropower Limited ix
Table 5-11 Characteristics of the Seti Khola catchment ....................................................................................... 5-10 Table 5-12 Monthly discharge of Nyadi Khola Including Siuri Khola (location at Staff Gauge no. 1) ......... 5-11 Table 5-13 Nyadi Khola, average monthly flows in m3/s ..................................................................................... 5-11 Table 5-14 Intake site average monthly flows in m3/s .......................................................................................... 5-12 Table 5-15 Staff gauge no.1 comparison of extended and actual flows in m3/s ............................................. 5-13 Table 5-16 Intake site comparison of flows in m3/s ............................................................................................. 5-14 Table 5-17 Percentage exceedance flow at intake for combined discharge (Nyadi + Siuri Tailrace) in m3/s
.................................................................................................................................................................................... 5-15 Table 5-18 Flood estimates at intake ....................................................................................................................... 5-16 Table 5-19 Flood estimates at Tailrace ................................................................................................................... 5-16 Table 5-20 Low flow at the intake site .................................................................................................................... 5-17 Table 5-21 Suspended sediment concentration at sampling site no.1 ................................................................ 5-18 Table 5-22 Sediment concentration at sampling site no.2 (proposed intake) .................................................. 5-19 Table 5-23 Comparison of suspended sediments with other rivers .................................................................. 5-19 Table 5-24 Sand break analysis at sampling site no.1 ............................................................................................. 5-20 Table 5-25 Sand break analysis at sampling site no.2 (intake) .............................................................................. 5-20 Table 5-26 Particle size distribution and mineral content - sample 1 (1999) ................................................... 5-21 Table 5-27 Particle size distribution and mineral content – sample 2 (1999) .................................................. 5-21 Table 5-28 Particle size distribution and mineral content - sample A (1998) .................................................. 5-21 Table 5-29 Particle size distribution and mineral content - sample B (1998) .................................................. 5-22 Table 7-2 Rock mass quality of Left bank of Headworks area (based on surface rating) .............................. 7-9 Table 7-3 Rock mass quality of underground powerhouse area (based on surface rating) ......................... 7-12 Table 7-4 Rock mass quality of tailrace tunnel area (based on surface rating) ................................................ 7-13 Table 7-5 Rock mass quality of access tunnel area (based on surface rating) ................................................ 7-14 Table 7-6: Percentages of geological material distribution along the access road ......................................... 7-18 Table 7-7 Properties of weak zones ........................................................................................................................ 7-20 Table 7-9 Rock class around headworks area ........................................................................................................ 7-22 Table 7-11 Rock mass distribution along the headrace tunnel .......................................................................... 7-24 Table 7-12 Rock class at Naiche adit portal ............................................................................................................ 7-24 Table 7-14 Rock mass quality in the outlet portal ................................................................................................ 7-25 Table 7-15 Summary of larger magnitudes earthquakes of Nepal. ................................................................... 7-30 Table 7-16 Seismic design parameter for different hydropower projects. ..................................................... 7-31 Table 7-17 Dates of boreholes ................................................................................................................................... 7-32 Table 7-18 Boreholes summary data ......................................................................................................................... 7-32 Table 7-19 Uniaxial compressive strength ............................................................................................................... 7-33 Table 7-20 A summary of Lugeon Tests .................................................................................................................. 7-34 Table 7-21 Summary of sampling pits ........................................................................................................................ 7-34 Table 7-22 Summary of gradation tests .................................................................................................................... 7-35 Table 7-23 Electrical conductivity of spring water in the project area and seepage water in Adit Four in
Khimti I Hydropower Project ............................................................................................................................. 7-39 Table 7-24 Calculation of expected minimum resistivity for undisturbed rocks ........................................... 7-40 Table 7-25 List of electrical resistivity survey sections conducted on July 1999 .......................................... 7-41 Table 7-26 Details of 2D-ERT surveys conducted on Sep. – Oct. 2007 .......................................................... 7-42 Table 3.1 Intake site average monthly flows in m3/s ................................................................................................ 8-2 Table 3.2 Plant Capacity Ranges ................................................................................................................................... 8-2 Table 3.3 Project Structures Details ........................................................................................................................... 8-4 Table 3.4 Energy Production ........................................................................................................................................ 8-5 Table 3.5 Comparison of the Project Costs for Various Installed Capacities .................................................. 8-6 Table 3.6 Financial Indicators for various installed capacities .............................................................................. 8-7 Table 9-1 Intake tunnel and flushing culvert rock support ................................................................................... 9-4 Table 9-2 Settling chamber trapping efficiency ........................................................................................................ 9-6 Table 9-3 Settling chambers and tunnels rock support ......................................................................................... 9-7 Table 9-4 Nyadi diversion tunnel rock support ...................................................................................................... 9-8 Table 9-5 Parameters of Pelton turbine ................................................................................................................... 9-21 Table 9-6 Generator data for NHP ........................................................................................................................... 9-23 Table 9-7 Data for Power Transformer at NHP .................................................................................................... 9-25 Table 9-8 Data for Auxiliary Transformer at NHP ............................................................................................... 9-26 Table 9-9 Data for Isolation Transformer at NHP ................................................................................................ 9-26 Table 9-10 Data for Generator Circuit Breaker .................................................................................................... 9-27
Hydro Consult Nyadi Hydropower Project Volume I Main Report
Nyadi Hydropower Limited x
Table 9-11 Data for Circuit Breaker in Isolation Transformer and Delta side of Station Transformer ... 9-27 Table 9-12 Data for Circuit Breaker in Delta side (11kV) of Power Transformer ........................................ 9-28 Table 9-13 Data for Circuit Breaker in Star side (132kV) of Power Transformer ....................................... 9-28 Table 9-15 Salient features of the access road of NHP ...................................................................................... 9-31 Table 10-1 Optimization of Conductor .................................................................................................................... 10-2 Table 11-1 Costs for mitigation and enhancement measures, monitoring and internal auditing ................ 11-9 Table 13-1 Total base cost of project showing various items of the cost ....................................................... 13-4 Table 14-1 Monthly Availability Estimate of the Energy (MAE) based on Nepali Calendar Year ............. 14-5 Table 15-1 Summary of Investment ........................................................................................................................... 15-2 Table 15-2 Energy generated from the NHP ........................................................................................................... 15-3 Table 15-3 Financial Indicators of NHP ................................................................................................................... 15-4 Table 15-4 Sensitivity of EIRR on Cost Overrun and interest rate. ................................................................... 15-6
LIST OF FIGURES Page No.
Figure 1-1 Location map of NHP ............................................................................................................................... 1-11 Figure 1-2 General layout of NHP ............................................................................................................................. 1-12 Figure 5-1 Staff Gauge Location ..................................................................................................................................... 5-2 Figure 5-2 DHM Stations ................................................................................................................................................ 5-4 Figure 5-3 Catchment area ............................................................................................................................................ 5-8 Figure 5-4 Monthly flow hydrograph .......................................................................................................................... 5-12 Figure 5-5 Flow duration curve at Nyadi Intake ..................................................................................................... 5-15 Figure 5-6 Nyadi Khola location 1- suspended sediment concentration 1999 ................................................ 5-18 Figure 5-7 Nyadi Khola location 2- suspended sediment concentration 1999 ................................................ 5-19 Figure 5-8 Mineralogical analysis of Fine River deposits – sample 1 ................................................................. 5-23 Figure 5-9 Mineralogical analyses of fine river deposits – sample 2 .................................................................. 5-23 Figure 7-1 Part of the map of Kaligandaki–Marsyangdi area (Colchen et al. 1981) ........................................ 7-1 Figure 7-2 Regional geological map of the Nyadi Hydropower Project area .................................................. 7-4 Figure 7-3 Geological cross-section of the Nyadi Hydropower area showing main lithological units ...... 7-5 Figure 7-4 Carbonate bands and graphitic schist exposed on the right bank of the Marsyangdi River at
Kaule ........................................................................................................................................................................... 7-6 Figure 7-5: Exposures of massive banded and augen gneisses, schists and quartzites at the Naiche and
Tarachowk bridges .................................................................................................................................................. 7-7 Figure 7-6: Palaeochannel deposits at Bahundanda (a) rock clasts in the grey silty matrix of the
palaeochannel deposits (b) .................................................................................................................................... 7-8 Figure 7-7: Diversion weir ............................................................................................................................................. 7-8 Figure 7-8 Photograph showing geology and geomorphology of the right and left bank of Nyadi Khola
towards upstream from the powerhouse of Suiri Hydroelectric Project ................................................. 7-9 Figure 7-9 View of headrace tunnel level between Naiche adit and Nana ...................................................... 7-10 Figure 7-10 Geomorphology of the Powerhouse Area, a view from surge shaft Area ................................. 7-12 Figure 7-11 Geology of Access tunnel portal and Tailrace outlet portal Area ................................................ 7-13 Figure 7-12: Sketch of slide upstream of Headworks ............................................................................................ 7-15 Figure 7-13: Slide looking downslope ......................................................................................................................... 7-15 Figure 7-14: Sliding viewing toward crown ............................................................................................................... 7-16 Figure 7-15 Recent landslide in left bank of the Nyadi River upstream of the owerhouse ......................... 7-17 Figure 7-16 View of a shear or weak zone (a) and a steep fault (b) ................................................................. 7-21 Figure 7-17 Joint rossette showing the tunnel alignment ..................................................................................... 7-23 Figure 7-18 View of Naiche adit portal .................................................................................................................... 7-24 Figure 7-19 Outlet Portal area .................................................................................................................................... 7-25 Figure 7-20 View of surface penstock alignment and powerhouse site ........................................................... 7-26 Figure 7-21 Close view of surface powerhouse option 1 and 2 ........................................................................ 7-27 Figure 7-22 Close view of surface powerhouse option 1, 2 and 3 .................................................................... 7-27 Figure 3-3-1 Optimization Curves EIRR Vs percentage exceedance ................................................................... 8-7 Figure 10-1 Conductor optimization curve .............................................................................................................. 10-1 Figure 12-1 Proposed Construction Schedule for NHP ..................................................................................... 12-2 Figure 15-1 Financial Analysis Sheet of NHP ............................................................................................................ 15-5
Hydro Consult Nyadi Hydropower Project Volume I Main Report
Nyadi Hydropower Limited xi
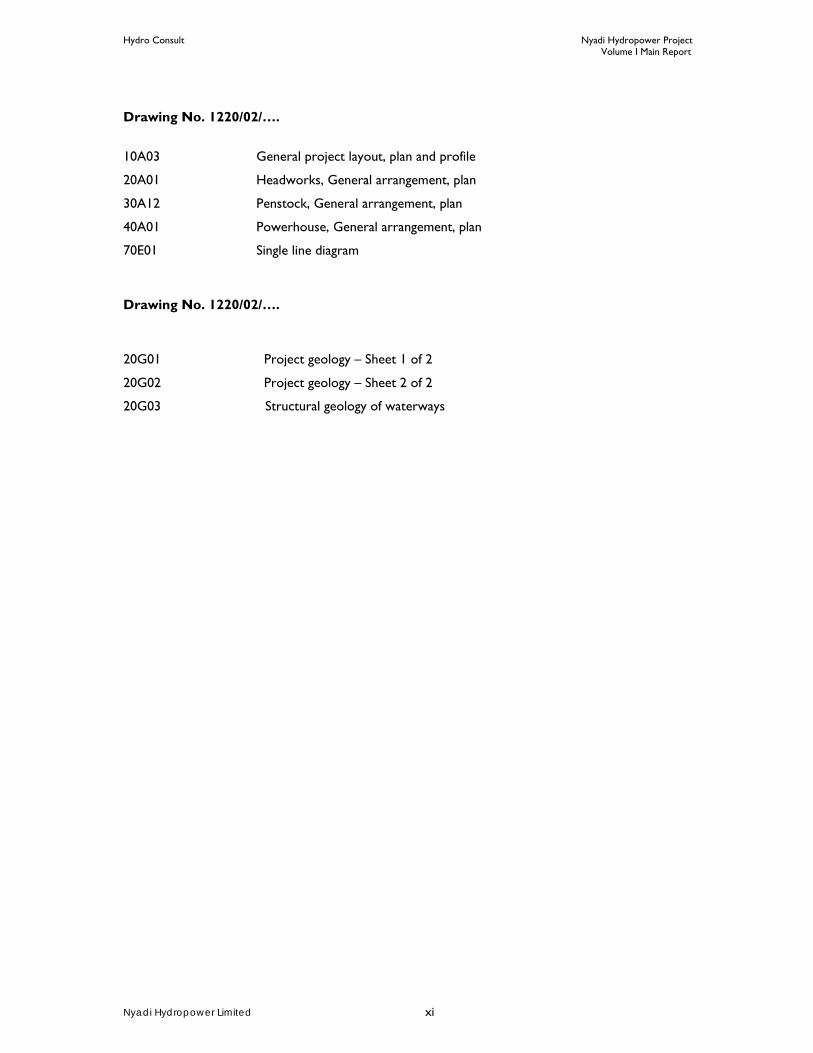
Drawing No. 1220/02/….
10A03 General project layout, plan and profile
20A01 Headworks, General arrangement, plan
30A12 Penstock, General arrangement, plan
40A01 Powerhouse, General arrangement, plan
70E01 Single line diagram
Drawing No. 1220/02/….
20G01 Project geology – Sheet 1 of 2
20G02 Project geology – Sheet 2 of 2
20G03 Structural geology of waterways

Hydro Consult Nyadi Hydropower Project Volume I Main Report
Nyadi Hydropower Limited xii
List of abbreviations BH Borehole BPC COD
Butwal Power Company Ltd. Commercial Operation Date
DHM Department of Hydrology and Meteorology Dia. Diameter DoR Department of Roads EIA Environmental Impact Assessment FITTA Foreign Investment and Technology Transfer Act 2049 GTZ German Technical Zusammendrbeit GWh Giga Watt hour HCPL Hydro Consult Pvt. Ltd. HEP Hydro electric project GON Government of Nepal INPS Integrated Nepal Power System IRR Internal rate of return km Kilometer kV Kilovolt kW Kilowatt kWh Kilowatt hour LT Low Tension Ltd. Limited LEDCO Lamjung Electricity Development Company m Meter m2 Square meter m3/s Cubic meter per second masl metre above sea level MCT Main Central Thrust MIP Medium Irrigation Project MW Megawatt MVA Mega Volt Ampere NEA Nepal Electricity Authority NHL Nyadi Hydropower Limited NHP Nyadi Hydropower Project NPC National Planning Commission NPV Net Present Value PPA Power purchase agreement PROR Peaking-run-of-the-river Q Rock quality index RMR Rock Mass Rating ROR Run of the river SMEC Snowy Mountains Engineering Corporation ST Storage VDC Village Development Committee Yrs Years Yr Year

Hydro Consult Nyadi Hydropower Project Volume I Main Report
Nyadi Hydropower Limited 1-1
1. INTRODUCTION
1.1 Background The Nyadi Hydropower Project (NHP) is a run-of-river type project, located in Lamjung District of Western Development Region of Nepal. The NHP was first identified in 1993 during the preparation of the Small Hydropower Master Plan. The study project was funded jointly by the Nepal Electricity Authority (NEA) and the German Development Agency (GTZ).
The entire project area (i.e. intake to powerhouse) is located within the Bahun Danda Village Development Committee (VDC), Lamjung District. The overall view of the project area can be seen in Drawing 1220/01/10A02 in appendix L. The NHP is located on the right bank of Nyadi Khola which is one of the tributaries of Marsyangdi River.
BPC Hydroconsult (hereafter also referred to as the Consultant) has undertaken updated feasibility study of NHP for Nyadi Hydropower Ltd., (hereafter also referred to as the Client) under the contract agreement signed on 8th July 2008 (2065/03/24). This report is the outcome of the review of feasibility study conducted by the Consultant for 30MW installed capacity including Siuri tail water. The overall project layout is shown in Drawing 1220/01/10A03.
PPA was applied on the basis of optimum project capacity of 20.0 MW based on flow of the Nyadi River only. However, the estimated cost of project based on prevailing rates indicated that the project was not feasible. Thereafter, the study team explored the options to minimize the cost and maximize the profit by changes in design. In latest development, the probability of tapping the tail water flow of nearest tributaries Siuri Khola has been explored and decided to use Siuri tailrace water from Siuri Khola Small Hydropower Project. Therefore, this report has incorporated the tail water flow of Siuri Khola Small Hydropower Project.
As per latest optimization using the additional tail water flow of Siuri Khola project, the project has an installed capacity of 30 MW and will generate 175.25 GWh of energy annually. The intake is located at the upstream of village of Naiche which is approximately 7 km upstream of the confluence with the Marsyangdi River. The waterway consists of about 3937 m long headrace tunnel, 476.00 m long surface steel penstock pipe and 200 m vertical shaft including horizontal portion steel penstock casing before bifurcation.
The underground powerhouse is located about 3 km downstream from Naiche, near the village of Thulobesi on the right bank of the Nyadi River. The generated power will be connected to the proposed NEA’s Hub at Tunikharka, about 7 km south of the powerhouse. Moreover, about 250 m long adit tunnels which include Naiche adit, surge adit and ventilation adit are also proposed to make 4 headings for excavation and construction of the headrace tunnel. Surge shaft is designed near the end of the headrace tunnel having diameter of 5.0 m and 29.60 m height.

Hydro Consult Nyadi Hydropower Project Volume I Main Report
Nyadi Hydropower Limited 1-2
1.2 Previous studies The following studies have already been carried out for the Nyadi Hydropower Project:
• Pre-feasibility study by COWEL International (P) Ltd., sponsored by GTZ • Project appraisal by BPC Hydroconsult, May 1995, sponsored by LEDCO • Topographical survey, January 1997, sponsored by LEDCO • Desk study by BPC Hydroconsult, July 1997, sponsored by LEDCO • Review of Feasibility study by BPC Hydroconsult, September 2007, sponsored by
Nyadi Hydropower Ltd. • Review of Updated Feasibility study by BPC Hydroconsult, November 2009
Several revisions have been carried out before this revision and finally concluded that 30MW with Siuri tail water discharge will make the project technically feasible and financially viable. In this time main focus is given to best utilize the optimum use of the river discharge so that the capacity of the plant would go higher there by able to generate the maximum energy in the year.
1.3 Objective The objective of this study is to undertake a technical revision, revision of quantity and cost estimates, update the previous feasibility study by including Siuri Tailrace flow and financial analysis on the basis of 2010 market price /interest and practices.
1.4 Report layout This Feasibility Study Review Report is presented in five volumes:
Executive Summary
The volume includes summary of the main report.
Volume I: Main Report
This volume includes Review of Feasibility Study Main Report covering mainly methodology of each and every studies carried out during the study. Other tabular data, graphical data, necessary maps, and drawings are presented in Volume II, III, and IV wherever appropriate.
Volume II: Investigation Appendices
This volume includes Appendices A, B and C. Available hydrological data and the analyses based on these data are documented in Appendix A along with the sediment analysis whereas Appendix B contains results and interpretations of the site investigations. Data of Topographical survey are documented in Appendix C
Volume III: Technical Appendices
This volume includes Appendices D, E, F, G and H. All design calculations and respective spreadsheets are presented in Appendix D. Optimization study of NHP are included in Appendix E. Calculations of detail cost estimate are presented in Appendix F with rate analysis of major items and bill of quantities. Access road design and its detail information are included in the Appendix G. All photographs showing locations of project components of the power plant and the project area are compiled in Appendix H.
Volume IV: Map and Drawings
This volume includes Appendices J, K, L, M and N. All drawings and maps of the project are presented in the Volume IV. In Appendix J all topographical survey maps, river cross-sections, and profiles are presented. Geological maps are presented in Appendix K. All civil drawings, which are the outcome of the feasibility level design, are incorporated in Appendix L. Electrical drawings and Access road drawings are presented in appendices M and N respectively.

Hydro Consult Nyadi Hydropower Project Volume I Main Report
Nyadi Hydropower Limited 1-3
1.5 Project area
1.5.1 Location
NHP is located in Bahun Danda Village Development Committee (VDC), at Lamjung District, Western Development Region of Nepal. The proposed project lies between 84° 25' 25” E to 84° 28' 00” E and 28°19' 20” N to 28°21' 07” N (541547 E, 3133700 N to 545750 E, 3137000 N) as shown in figure 1.1.
The headwork’s is located at about 2 km upstream of the Naiche Village (Ward No. 2), which is approximately 7 km upstream of the confluence of Nyadi Khola with the Marsyangdi River. The powerhouse is located about 3 km downstream from Naiche at the village of Thulobesi, (Ward No. 7).
1.5.2 River basin
The Marsyangdi River is one of the main rivers of the Sapta Gandaki basin of Nepal. Nyadi Khola is one of the major tributaries of Marsyangdi River, among the others such as Khudi, Dordi, Chepe and Chudi Kholas.
1.5.3 Accessibility
Previously, it took approximately a day’s walk to reach Naiche from Besisahar or half a day from the road head at “Upper Nyadi Bazaar” or Thakanbesi area. Now, the construction work for track opening is going on from the road head at Thakanbeshi upto the headworks through powerhouse area at Thulobeshi and Naiche village. Besides, a 52m long bailey bridge has been proposed to connect the both banks of Marsyangdi River with the road alignment at Thakanbeshi.
1.5.4 Electricity availability
At present, there is an availability of electricity in the Thulobesi village, which can be extended up to powerhouse and headworks site for construction purpose. The 33 KV transmission line of Siuri Khola SHP is under construction.
1.6 Data collection and review As per requirement of the study, following relevant materials of the project were collected;
• Available reports of Feasibility Study (March 2000, September 2007) of Nyadi Hydropower Project (20 MW).
• HMG-FINIDA Topo-sheets of the project area. Sheet Nos. 2884-07, 2884-10 2884-11, 2884-14Arial photographs
• District map of Lamjung ( Scale 1:125,000 )
• Topographical map of Siuri area
• Geological map of the Lamjung area
• Geological map of Nepal (Scale 1:1,000,000 )
• Updated district rate of Lamjung district
• District profile
1.7 Field visit The present study has utilized the data of previous field visit which is described in the following paragraph.
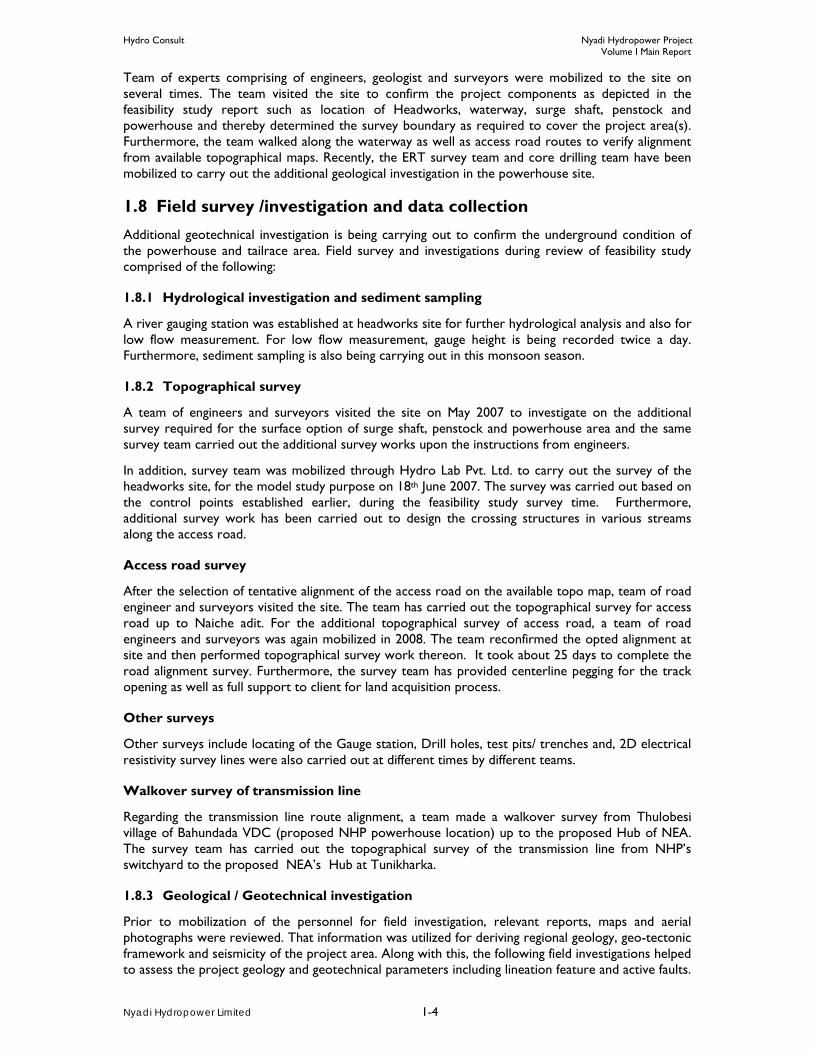
Hydro Consult Nyadi Hydropower Project Volume I Main Report
Nyadi Hydropower Limited 1-4
Team of experts comprising of engineers, geologist and surveyors were mobilized to the site on several times. The team visited the site to confirm the project components as depicted in the feasibility study report such as location of Headworks, waterway, surge shaft, penstock and powerhouse and thereby determined the survey boundary as required to cover the project area(s). Furthermore, the team walked along the waterway as well as access road routes to verify alignment from available topographical maps. Recently, the ERT survey team and core drilling team have been mobilized to carry out the additional geological investigation in the powerhouse site.
1.8 Field survey /investigation and data collection Additional geotechnical investigation is being carrying out to confirm the underground condition of the powerhouse and tailrace area. Field survey and investigations during review of feasibility study comprised of the following:
1.8.1 Hydrological investigation and sediment sampling
A river gauging station was established at headworks site for further hydrological analysis and also for low flow measurement. For low flow measurement, gauge height is being recorded twice a day. Furthermore, sediment sampling is also being carrying out in this monsoon season.
1.8.2 Topographical survey
A team of engineers and surveyors visited the site on May 2007 to investigate on the additional survey required for the surface option of surge shaft, penstock and powerhouse area and the same survey team carried out the additional survey works upon the instructions from engineers.
In addition, survey team was mobilized through Hydro Lab Pvt. Ltd. to carry out the survey of the headworks site, for the model study purpose on 18th June 2007. The survey was carried out based on the control points established earlier, during the feasibility study survey time. Furthermore, additional survey work has been carried out to design the crossing structures in various streams along the access road.
Access road survey
After the selection of tentative alignment of the access road on the available topo map, team of road engineer and surveyors visited the site. The team has carried out the topographical survey for access road up to Naiche adit. For the additional topographical survey of access road, a team of road engineers and surveyors was again mobilized in 2008. The team reconfirmed the opted alignment at site and then performed topographical survey work thereon. It took about 25 days to complete the road alignment survey. Furthermore, the survey team has provided centerline pegging for the track opening as well as full support to client for land acquisition process.
Other surveys
Other surveys include locating of the Gauge station, Drill holes, test pits/ trenches and, 2D electrical resistivity survey lines were also carried out at different times by different teams.
Walkover survey of transmission line
Regarding the transmission line route alignment, a team made a walkover survey from Thulobesi village of Bahundada VDC (proposed NHP powerhouse location) up to the proposed Hub of NEA. The survey team has carried out the topographical survey of the transmission line from NHP’s switchyard to the proposed NEA’s Hub at Tunikharka.
1.8.3 Geological / Geotechnical investigation
Prior to mobilization of the personnel for field investigation, relevant reports, maps and aerial photographs were reviewed. That information was utilized for deriving regional geology, geo-tectonic framework and seismicity of the project area. Along with this, the following field investigations helped to assess the project geology and geotechnical parameters including lineation feature and active faults.

Hydro Consult Nyadi Hydropower Project Volume I Main Report
Nyadi Hydropower Limited 1-5
Geophysical investigation
A team of Geophysicist and surveyors visited the site for carrying out 2D-ERT survey.
2D-ERT surveys were conducted in the areas of tunnel outlet portal, penstock alignment, tunnel alignment before surge shaft and powerhouse area. These areas were investigated by nine 2D-ERT profiles. The profiles are named by ERT-1 to ERT-9. The maximum median depths of investigation are 43.95 m, 58.6 m, 139.04 m and 208.56 m for different profiles. The total surface length of the profiles is 3224 m. The fieldwork was conducted during review of feasibity study. The length and other details of each profile are presented in Table 1-1 and the graphs and description are included in the appendix C.
Table 1-1 Details of 2D-ERT surveys, Nyadi Hydropower Project
Profile No. Location Length (m) Median depth (m)
ERT-1 Powerhouse 175 58.6
ERT-2 Powerhouse 168 43.95
ERT-3 Powerhouse 210 58.6
ERT-4 Penstock and Nana Valley 900 208.56
ERT-5 Penstock 600 208.56
ERT-6 Across Kholsi 266 43.95
ERT-7 Surge Outlet Portal 175 43.95
ERT-8 Along Surge Shaft Ridge 430 139.04
ERT-9 Across Nana Valley 300 139.04
Total 3224
The ERT survey report is presented in appendix C.
Geological mapping
A geological team visited the site for geological and engineering geological mapping. During the site visit, the team took traverse along the foot trails, gullies, river banks, spurs and ridges to collect the geological data. Detailed geological mapping of the project area was carried out. Rock mass classification was also carried out for the intake area, tunnel portal areas, headrace tunnel alignment, surge shaft and the powerhouse areas and some other locations of the project. The main focus was given to the instability features like slides, faults, shear zones, weak zones and palaeochannel deposits. The palaeochannel deposits were also mapped precisely. All the data were incorporated in the geological maps and a detailed geological review report was prepared.
Core drilling and laboratory testing
In the feasibility study level, altogether 3 bore holes were drilled namely BH1, BH3 and BH4. These holes were located at the weir axis, settling chamber area and at the surge adit area respectively. Similarly, laboratory tests were also performed during the feasibility study, details of which are presented in subsequent sections of the report. Recently, the core drilling team has been mobilized to the site to carryout drilling work at powerhouse site. The result of the investigation will be incorporated in details design phase. Following additional site investigation works are proposed to be carried out in the next phase of the study:
• Bearing capacity test of soil at anchor block foundations, powerhouse and tailrace
• Test pitting at powerhouse area
• Nyadi Khola construction material test

Hydro Consult Nyadi Hydropower Project Volume I Main Report
Nyadi Hydropower Limited 1-6
1.9 Project description In this report, we are mainly focused in underground powerhouse option based on decisions made in project review meetings.
Results and recommendations from the geophysical surveys and field observation and co-ordinate limitation indicate that surface plus vertical shaft penstock and underground powerhouse option would have relatively lower geological risks as compared to the underground option proposed in the previous feasibility study. The Geophysical surveys indicated the presence of shear zones in the area of inclined penstock and powerhouse. This result led to more uncertainties for the underground option of feasibility level. During the site visit for geological mapping by senior geologists and geotechnical engineers, the proposed location of underground powerhouse was chosen.
Following a number of analyses and field visits, an appropriate project configuration has been selected. The project is a run-of-river type in which water will be diverted from the Nyadi Khola at a point in a narrow 17 m wide rocky gorge, by constructing a 10 m high concrete weir with dressed stone lining. The weir crest level will be at 1381.50 masl. A maximum discharge of 11.08 m3/s including tail race water of Siuri Khola HPP at 40 % probability of exceedance level will be diverted for power generation through the frontal orifice intake located along the Nyadi River. This project utilizes a gross head of 333.90 m in between the intake at an elevation of 1381.50 masl and the turbine axis at an elevation of 1047.60 masl. The total length of the waterways including intake tunnel, settling basin, headrace tunnel, penstock pipe and tailrace tunnel will be about 5 km. The major components of the project can be visualized as the combination of the following hydraulic structures:
1. Weir with frontal intake and two radial bottom Sluice Gates
2. Orifice type Frontal intake (Himalayan Intake)
3. Gravel trap with bed load flushing arrangement
4. Approach intake tunnel
5. Underground settling basin with flushing arrangement
6. Headrace tunnel
7. Tunnel adit
8. Surge shaft with Ventilation adit
9. Surface penstock , drop shaft & horizontal penstock
10. Underground powerhouse and access tunnel to the powerhouse
11. Tailrace
12. Switching substation
13. Access road to the project site and
14. 132 kV transmission line
The design aspects of the above components are described in Section 9 of this report. General Layout, Plan of the NHP is presented in figure 1.2 and Drawing No. 1220/01/10A02 in Appendix L. Salient features of the proposed power plant are presented in Table 1-2.
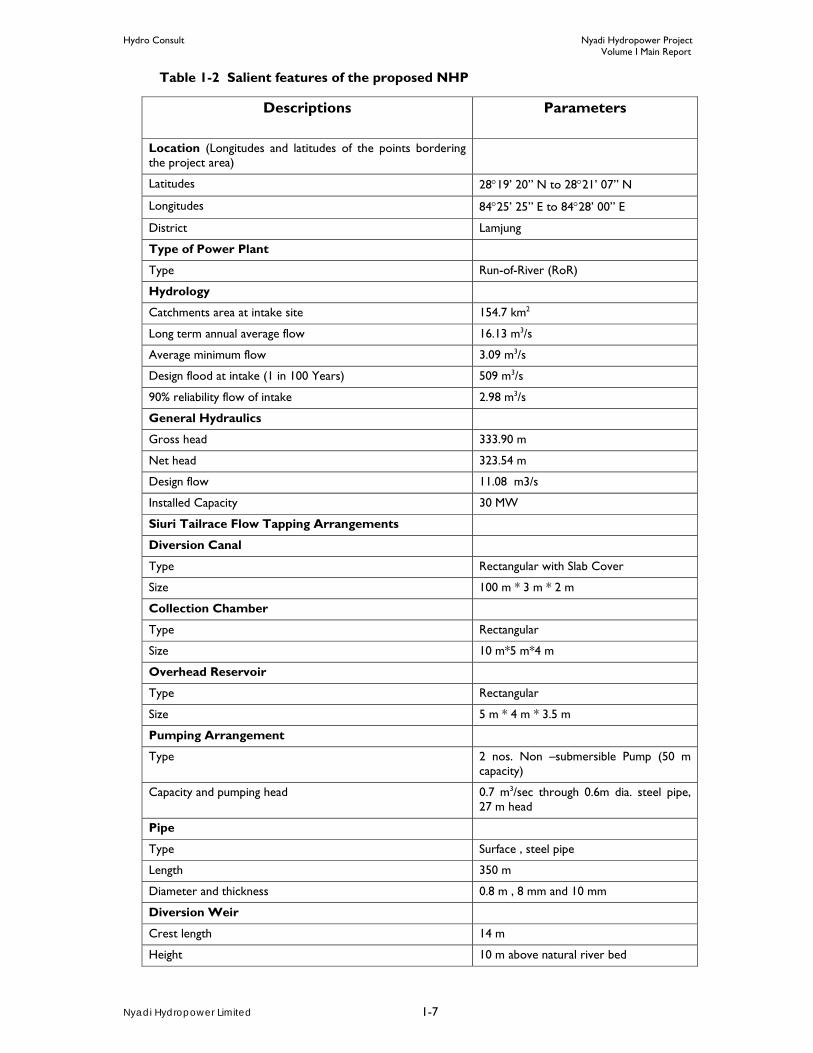
Hydro Consult Nyadi Hydropower Project Volume I Main Report
Nyadi Hydropower Limited 1-7
Table 1-2 Salient features of the proposed NHP
Descriptions Parameters
Location (Longitudes and latitudes of the points bordering the project area)
Latitudes 28°19’ 20” N to 28°21’ 07” N
Longitudes 84°25’ 25” E to 84°28’ 00” E
District Lamjung
Type of Power Plant
Type Run-of-River (RoR)
Hydrology
Catchments area at intake site 154.7 km2
Long term annual average flow 16.13 m3/s
Average minimum flow 3.09 m3/s
Design flood at intake (1 in 100 Years) 509 m3/s
90% reliability flow of intake 2.98 m3/s
General Hydraulics
Gross head 333.90 m
Net head 323.54 m
Design flow 11.08 m3/s
Installed Capacity 30 MW
Siuri Tailrace Flow Tapping Arrangements
Diversion Canal
Type Rectangular with Slab Cover
Size 100 m * 3 m * 2 m
Collection Chamber
Type Rectangular
Size 10 m*5 m*4 m
Overhead Reservoir
Type Rectangular
Size 5 m * 4 m * 3.5 m
Pumping Arrangement
Type 2 nos. Non –submersible Pump (50 m capacity)
Capacity and pumping head 0.7 m3/sec through 0.6m dia. steel pipe, 27 m head
Pipe
Type Surface , steel pipe
Length 350 m
Diameter and thickness 0.8 m , 8 mm and 10 mm
Diversion Weir
Crest length 14 m
Height 10 m above natural river bed

Hydro Consult Nyadi Hydropower Project Volume I Main Report
Nyadi Hydropower Limited 1-8
Descriptions Parameters
Size of radial gate 5.0 m x 3.0 m
No of radial gate 2
Thickness of guide wall 3.0 m
Crest elevation 1381.50 masl
Length of stilling basin 21 m
Intake Chamber
Type Frontal intake (Orifice type)
Size of opening 2.25 m x 3.5 m (3 nos.)
Coarse trash rack 2.25 m wide and 3.5 m high, 3 nos.
Gravel Trap
Type Rectangular
Gravel trap size 3 m x 1 m
Intake Tunnel
Type D-shaped
Size 3 m x 3 m
Length 57 m
Settling Basin (Underground)
No of bays 2 in parallel
Nominal size of trapped particle 0.2 mm
Trap efficiency 93%
Settling chamber outlet cross section 9.14 m2
Settling chamber inlet tunnel cross section 8.04 m2
Inspection/Access tunnel Inverted D-shape having area of 3.57 m2
Length of inlet transition 25 m
Length of uniform section 128.0 m
Length of outlet transition 12.5 m
Width of uniform section 8.0 m
Depth 10 m (average)
Headrace tunnel
Shape Inverted D-shaped
Length 3937 m
X-Section 3. 2 m wide x 3.2 m high
Cross-sectional area 9.14 m2
Naiche Tunnel Adit – 1
Shape Inverted D-shaped
Length 176 m long including curve
X-Section 3.2 m wide x 3.2 m high
Cross-sectional area 9.14 m2
Surge Shaft
Type Vertical shaft (Underground)
Internal diameter 5.0 m

Hydro Consult Nyadi Hydropower Project Volume I Main Report
Nyadi Hydropower Limited 1-9
Descriptions Parameters
Height of surge shaft 29.60 m
Connecting conduit size Circular with 3.2 m dia. and 6.6 m Height
Surge Shaft Adit -2
Shape Inverted D-shaped
Length 65 m
X-Section 3.2 m wide x 3.2 m high
Cross-sectional area 9.14 m2
Ventilation Adit
Shape Inverted D-shaped
Length 30 m
X-Section 3.2 m wide x 3.2 m high
Cross-sectional area 9.14 m2
Penstock
Type Surface and Vertical Shaft , steel penstock
Diameter 1750 mm
Length of surface penstock 476 m
Length of vertical shaft and horizontal portion before bifurcation
180m vertical shaft and 20 m horizontal penstock
Thickness 8, 12, 16, 22, 25, 28 and 30 mm
Powerhouse
Type Underground
Size 53.25 m long, 14.20 m wide and 14.90 m high
Access Tunnel
Shape D- shaped
Size (B X H) 4.80 m x 5.10 m
Length 130.60 m
Tailrace Tunnel
Shape D- shaped
Size (B X H) 3.60 m x 3.60 m
Length 225.85 m
Slope 1 in 750
Turbines
Type Pelton turbine
Turbine axis elevation 1047.60 masl
Turbine rated output 10460 kW x 3
Turbine efficiency 89.00 %
No of units 3 Nos.
Running Speed 473 rpm
Tail water level 1043.91 masl
Max. discharge 3 X 3.69 m3/s

Hydro Consult Nyadi Hydropower Project Volume I Main Report
Nyadi Hydropower Limited 1-10
Descriptions Parameters
Generators
Type Brushless Synchronous
Capacity 12 MVA
Voltage 11 kV
Power factor 0.85
Operating range 0.85(lag)- unity – 0.85(lead)
Efficiency 97%
Transmission Line
Length 7 km (Nyadi Switchyard to proposed 132 kV NEA Hub at Marsyangdi Corridor)
Voltage 132 kV
No. of Circuits Single
Configuration Three phase, three wire
Tower Type Steel lattice Tower
Transformer
Type Single phase, 4 no.
Rating 12 MVA
Vector group YNd5
Power factor 0.85
Voltage ratio 11/132 ±10% in step of 2.5
Frequency 50 Hz
Efficiency 99%
Energy Generation
Mean annual energy per year 175.25 GWh
Dry energy 27.82 GWh
Wet energy 147.43 GWh
Access Road
Road Class District Rural Road Class 'A' (DRRA)
Beshishar-Manang road to Bridge site at Marsyangdi River 447 m
Bridge Span (Bailey Bridge) 52 m
From Bridge site to Headwork’s site 10.615 km
From Thulobeshi to Surge shaft 2.393 km
Total length 13.50 km
Construction Period 4 Years
Project Cost
Project cost US$ 58.842 million
Project cost after capitalization US$ 74.218 million

Hydro Consult Nyadi Hydropower Project Volume I Main Report
Nyadi Hydropower Limited 1-11
Figure 1-1 Location map of NHP
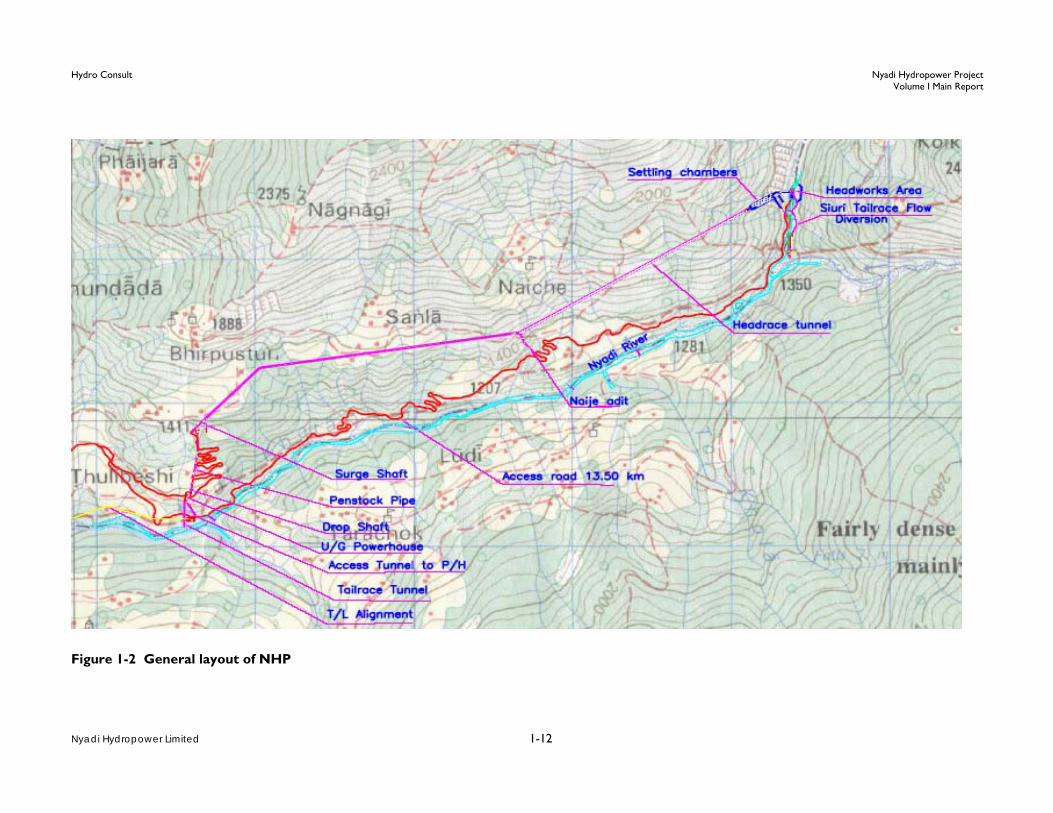
Hydro Consult Nyadi Hydropower Project Volume I Main Report
Nyadi Hydropower Limited 1-12
Figure 1-2 General layout of NHP
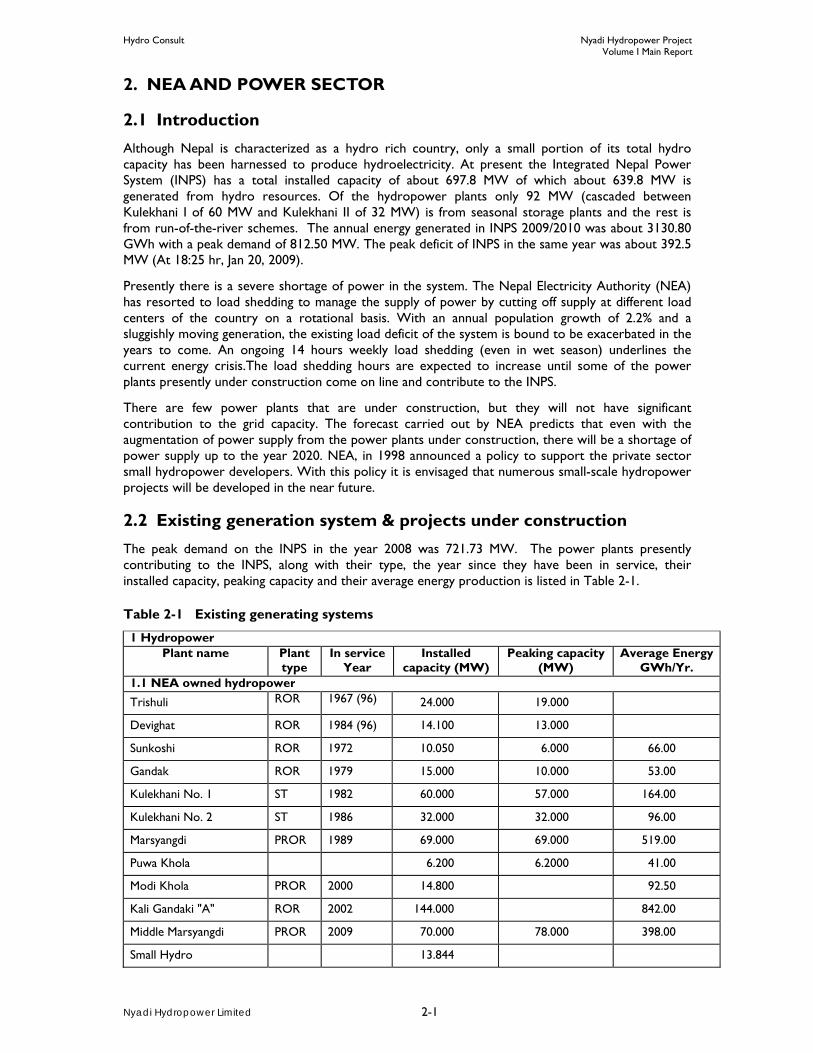
Hydro Consult Nyadi Hydropower Project Volume I Main Report
Nyadi Hydropower Limited 2-1
2. NEA AND POWER SECTOR
2.1 Introduction Although Nepal is characterized as a hydro rich country, only a small portion of its total hydro capacity has been harnessed to produce hydroelectricity. At present the Integrated Nepal Power System (INPS) has a total installed capacity of about 697.8 MW of which about 639.8 MW is generated from hydro resources. Of the hydropower plants only 92 MW (cascaded between Kulekhani I of 60 MW and Kulekhani II of 32 MW) is from seasonal storage plants and the rest is from run-of-the-river schemes. The annual energy generated in INPS 2009/2010 was about 3130.80 GWh with a peak demand of 812.50 MW. The peak deficit of INPS in the same year was about 392.5 MW (At 18:25 hr, Jan 20, 2009).
Presently there is a severe shortage of power in the system. The Nepal Electricity Authority (NEA) has resorted to load shedding to manage the supply of power by cutting off supply at different load centers of the country on a rotational basis. With an annual population growth of 2.2% and a sluggishly moving generation, the existing load deficit of the system is bound to be exacerbated in the years to come. An ongoing 14 hours weekly load shedding (even in wet season) underlines the current energy crisis.The load shedding hours are expected to increase until some of the power plants presently under construction come on line and contribute to the INPS.
There are few power plants that are under construction, but they will not have significant contribution to the grid capacity. The forecast carried out by NEA predicts that even with the augmentation of power supply from the power plants under construction, there will be a shortage of power supply up to the year 2020. NEA, in 1998 announced a policy to support the private sector small hydropower developers. With this policy it is envisaged that numerous small-scale hydropower projects will be developed in the near future.
2.2 Existing generation system & projects under construction The peak demand on the INPS in the year 2008 was 721.73 MW. The power plants presently contributing to the INPS, along with their type, the year since they have been in service, their installed capacity, peaking capacity and their average energy production is listed in Table 2-1.
Table 2-1 Existing generating systems
1 Hydropower Plant name Plant
type In service
Year Installed
capacity (MW) Peaking capacity
(MW) Average Energy
GWh/Yr. 1.1 NEA owned hydropower Trishuli ROR 1967 (96) 24.000 19.000
Devighat ROR 1984 (96) 14.100 13.000
Sunkoshi ROR 1972 10.050 6.000 66.00
Gandak ROR 1979 15.000 10.000 53.00
Kulekhani No. 1 ST 1982 60.000 57.000 164.00
Kulekhani No. 2 ST 1986 32.000 32.000 96.00
Marsyangdi PROR 1989 69.000 69.000 519.00
Puwa Khola 6.200 6.2000 41.00
Modi Khola PROR 2000 14.800 92.50
Kali Gandaki "A" ROR 2002 144.000 842.00
Middle Marsyangdi PROR 2009 70.000 78.000 398.00
Small Hydro 13.844

Hydro Consult Nyadi Hydropower Project Volume I Main Report
Nyadi Hydropower Limited 2-2
NEA installed capacity 472.994
Source: Nepal Electricity Authority, Fiscal year 2009/2010 – A year in review
Plant name Plant type
In service Year
Installed capacity (MW)
Peaking capacity (MW)
Average Energy GWh/Yr.
1.2 IPPs owned hydropower
Andhi Khola (BPC) ROR 1991 5.100 4.000 38.00
Jhimruk (BPC) ROR 1994 12.000 7.000 72.00
Khimti I (HPL) ROR 2000 60.000 23.000 353.00
Bhotekoshi(BKPC) ROR 2001 36.000 16.000 250.00
Syange Khola (Syange HP)
ROR 0.183
Indrawati (NHPC) ROR 7.500
Chilime ROR 22.00 20.000 101.000
Piluwa Khola (AVHP) ROR 3.000
Chaku Khola (APCo) ROR 1.500
Sunkoshi Small (Sanima HP)
ROR 2005 2.500
Rairang (Rairang HPD)
ROR 2004 0.500
Khudi Khola HEP (KHL) ROR 2006 3.450
Baramchi (UHC) ROR 2007 0.980
Thoppal Khola ROR 2007 1.650
Pheme Khola HP ROR 2007 0.995
Sisne Khola ROR 2008 0.750
Salinadi ROR 2008 0.232
Patikhola ROR 0.996
Seti II ROR 0.979
Ridi Khola ROR 2.400
Upper Hadi Khola ROR 0.991
Mardi Khola ROR 3.100
IPPs installed capacity 166.806
Total Hydro 639.800
2 Thermal/Diesel
Hetauda 14.410
Duhabi Multifuel-1 26.000
Duhabi Multifuel-2 1983 13.000
Total thermal 53.410
Source: Nepal Electricity Authority, Fiscal year 2009/2010 – A year in review

Hydro Consult Nyadi Hydropower Project Volume I Main Report
Nyadi Hydropower Limited 2-3
Total Generated Power
Total Major Hydro (NEA) – Grid Connected 472.994
Total Small Hydro (NEA) – Isolated 4.536
Total Hydro (NEA) 477.530
Total Hydro (IPP) 166.806
Total Hydro (Nepal) 644.336
Total Thermal (NEA) 53.410
Total Solar (NEA) 0.100
Total Installed Capacity (Including Private and Others) 697.846
ROR run-of-the-river, PROR peaking run-of-the-river, ST Storage
• 1967(96) – Upgrading of Trisuli
• 1984 (96)- Replacement of EM equipments of Devighat A list of projects under construction is presented in Table 2-2.
Table 2-2 Power plants under construction
S.N. Under construction Powerstations Installed Capacity, MW
1 Upper Tamakoshi HEP 456.000
2 Chameliya HEP 30.000
3 Kulekhani III 14.000
4 Gamgad 0.400
Projects under construction, NEA 500.400
1 Lower Indrawati Khola 4.500
2 Lower Piluwa 0.990
3 Mai Khola 4.455
4 Hewa Khola 4.455
5 Lower Modi I 9.900
6 Sipring Khola 9.658
7 Siuri Khola 4.950
8 Ankhu Khola 8.400
Projects under construction, IPP 47.308
Total Projects under construction in Nepal 547.708
Total capacity of PPA concluded projects (including upgradation of some existing projects) 136.228
Projects in Pipe line Installed Capacity, MW
1 Upper Seti (storage) 128
2 Upper Trishuli 3A HEP 60
3 Upper Trishuli 3B HEP 37
4 Rahughat HEP 27
5 Bhudi Gandaki 600
6 Seti Trisuli (storage) 128
7 Upper Modi ‘A’ 42
8 Nalsyagu Gad (storage project) 400
Projects in Pipeline, NEA 1422.00
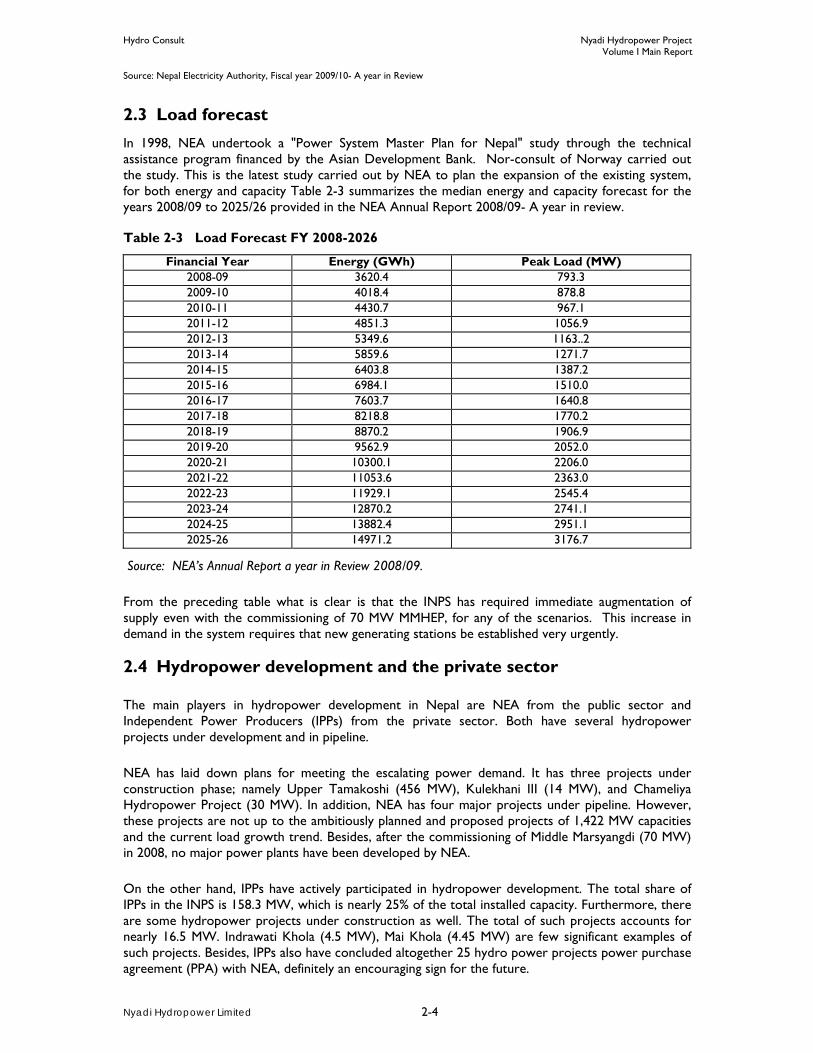
Hydro Consult Nyadi Hydropower Project Volume I Main Report
Nyadi Hydropower Limited 2-4
Source: Nepal Electricity Authority, Fiscal year 2009/10- A year in Review
2.3 Load forecast In 1998, NEA undertook a "Power System Master Plan for Nepal" study through the technical assistance program financed by the Asian Development Bank. Nor-consult of Norway carried out the study. This is the latest study carried out by NEA to plan the expansion of the existing system, for both energy and capacity Table 2-3 summarizes the median energy and capacity forecast for the years 2008/09 to 2025/26 provided in the NEA Annual Report 2008/09- A year in review.
Table 2-3 Load Forecast FY 2008-2026
Financial Year Energy (GWh) Peak Load (MW) 2008-09 3620.4 793.3 2009-10 4018.4 878.8 2010-11 4430.7 967.1 2011-12 4851.3 1056.9 2012-13 5349.6 1163..2 2013-14 5859.6 1271.7 2014-15 6403.8 1387.2 2015-16 6984.1 1510.0 2016-17 7603.7 1640.8 2017-18 8218.8 1770.2 2018-19 8870.2 1906.9 2019-20 9562.9 2052.0 2020-21 10300.1 2206.0 2021-22 11053.6 2363.0 2022-23 11929.1 2545.4 2023-24 12870.2 2741.1 2024-25 13882.4 2951.1 2025-26 14971.2 3176.7
Source: NEA’s Annual Report a year in Review 2008/09.
From the preceding table what is clear is that the INPS has required immediate augmentation of supply even with the commissioning of 70 MW MMHEP, for any of the scenarios. This increase in demand in the system requires that new generating stations be established very urgently.
2.4 Hydropower development and the private sector
The main players in hydropower development in Nepal are NEA from the public sector and Independent Power Producers (IPPs) from the private sector. Both have several hydropower projects under development and in pipeline.
NEA has laid down plans for meeting the escalating power demand. It has three projects under construction phase; namely Upper Tamakoshi (456 MW), Kulekhani III (14 MW), and Chameliya Hydropower Project (30 MW). In addition, NEA has four major projects under pipeline. However, these projects are not up to the ambitiously planned and proposed projects of 1,422 MW capacities and the current load growth trend. Besides, after the commissioning of Middle Marsyangdi (70 MW) in 2008, no major power plants have been developed by NEA.
On the other hand, IPPs have actively participated in hydropower development. The total share of IPPs in the INPS is 158.3 MW, which is nearly 25% of the total installed capacity. Furthermore, there are some hydropower projects under construction as well. The total of such projects accounts for nearly 16.5 MW. Indrawati Khola (4.5 MW), Mai Khola (4.45 MW) are few significant examples of such projects. Besides, IPPs also have concluded altogether 25 hydro power projects power purchase agreement (PPA) with NEA, definitely an encouraging sign for the future.

Hydro Consult Nyadi Hydropower Project Volume I Main Report
Nyadi Hydropower Limited 2-5
Focusing on all the projects under construction and those with PPA, it seems imperative that both private sector and NEA look for additional projects to meet the growing power demand. As for the aforementioned projects under development, even if they materialize within a period of 5 years, would only add 378 MW to the INPS, which cannot meet the demand in the same year 2015. By then, the peak load would be an estimated 1,387 MW. Still there would be the power deficit of about 210 MW. Hence, encouraging IPPs for hydropower development is of utmost importance.
2.5 Conclusion The NHP is designed with flow of 40% reliability. NEA should encourage private sector participation in the power sector and facilitate the purchase of power from IPP’s to meet the growing demand of electricity in the country. Projects such as the NHP can contribute to the INPS from the year 2014. The NHP will have a firm generating capacity of 9.25 MW which is near about 30.83% of its installed capacity. This is significantly higher than other medium sized projects such as Khimti, Bhotekoshi developed by the private sector. Likewise the plant load factor for this design is over 0.67, which is very attractive for the INPS, because this is significantly higher than the load factor of other projects initiated by the private sector, for which NEA has committed to buy energy.

Hydro Consult Nyadi Hydropower Project Volume I Main Report
Nyadi Hydropower Limited 3-1
3. LEGAL EVALUATION
3.1 Introduction
A liberal policy to participate the private sector in the development of hydropower sector and other infrastructure sector has been adopted after 1990. Sectoral policies, laws and regulations were enacted and amended to enable the private investors, both the domestic and foreign, invest in the infrastructure development sectors.
In this section, the existing policies, laws, regulations and regulatory requirements have been analysed in general and the implication in Nyadi Hydropower Project in particular.
3.2 Review of existing Policies, Acts and Regulations
3.2.1 The Interim Constitution of Nepal, 2007
The Interim Constitution of Nepal, 2008 Article 35 envisions raising of standard of living of the public through the development infrastructures with aim of developing country economy through governmental, cooperative and private sectors by attracting the foreign capital and technology as well. Commitments have been made to pursue a policy of according priority to the local communities while mobilizing the natural resources for the benefits of the nation and to keep environment clean through preventing the impact in the environment from physical development activities, raising awareness to the people and protection of the environment and special safeguard of rare wildlife.
Though these policy statements cannot be questioned before any court of law, the locals of the project area may claim for share in the project before or during the construction period.
3.2.2 Hydropower Development Policy, 2001
The Government of Nepal issued a new hydropower policy in 2001for reform and development of the hydropower sector. The first hydropower policy was issued in 1992 with objective to enhance the development of hydropower to meet the energy needs required for the industrial and domestic use; to help promotion of the conservation of environment through the development of hydropower, which is considered to be a clean energy source, and to involve the national & foreign investors in the development and operation of hydropower projects either through joint ventures or foreign and local investors, or solely by foreign or local investors, or through partnership with the government.
The Hydropower Development Policy, 2001 has following objective:
• To generate electricity at low cost by utilizing the water resources available in the country. • To extend reliable and qualitative electric service throughout the country at a reasonable price. • To tie-up electrification with the economic activities. • To render support to the development of rural economy by extending the rural electrification. • To develop hydropower as an exportable commodity.
The government has adopted a strategy to pursue investment friendly, clear, simple and transparent procedures so as to promote private sector participation in the development of hydropower, also taking into account internal consumption and export possibility of hydropower. Further, attracting the private investment in hydropower sector has been mentioned one of the strategies of the government. The Hydropower Development Policy, 2001 has declared 22 point policies. The policies give focus on using hydro potentiality for meeting domestic need of electricity, development of hydropower projects on competitive basis, encouraging the implementation of the hydropower projects on build, own, operate and transfer (BOOT) basis, providing appropriate incentives and following transparent

Hydro Consult Nyadi Hydropower Project Volume I Main Report
Nyadi Hydropower Limited 3-2
process to attract the domestic and foreign investment, maximizing benefits from large storage and multipurpose projects, protection of environment and mitigation of adverse impact to the environment with appropriate project displaced families, internal capital market mobilization, rural electrification, leakage control, appropriate benefits to the locals while operating the project, minimization of risks in hydropower sector, export of electricity, restructuring of existing public sector, reliable and qualitative electricity on reasonable price, rational and transparent electrification process, utilization of local labour and skill, establishment of training and research institution, and demand side management of electricity.
3.2.3 Industrial Policy, 2010
The Industrial Policy, 2010 has envisaged the vision for reduction of poverty in the country through industrial development. It’s objectives are to increase the qualitative and competitive products and productivity for increase of income, employment and exports of industrial products, to mobilize the local resource, skill, raw materials and tools for contribution of regional and national industrial development, to adopt the newer technology and investment friendly production process for establishing the industrial sector sustainable and reliable, to develop the productive workforce and managerial capabilities as a base for efficient investment and establish the country as the best destination of the investment in the world, and to protect the industrial intellectual property. The following policy provisions are more relevant to hydropower sector: • No work no pay; • Establishment of a system will be established so as to monitor that the issue or amendment of
other sectoral policies don’t contradict with this policy: • Promotion and protection of foreign direct investment including the investment from non
resident Nepali; • Establishment of Industrial Investment Protection Fund to protect from non-commercial and
non-business risk; • Establishment of single point service centre for facilitating to licensing, establishment, extension,
exit and providing facilities to the industries in a clear way and within defined timeline; • Improvement in policies and institutional arrangements with provision of incentives for attracting
the foreign investment in the hydropower sector.
The policy has defined hydropower sector as one of the prioritized sectors of the government. The facilities and concessions provisioned in the policies are:
• For income tax purpose, o the expense made for the long term benefits or welfare of the employee can be set off
with the income; o the amount equivalent to 5% of the total revenue income can be expensed for training,
research and development; o the amount equivalent to 10% of the total revenue income can be expensed for market
promotion, advertisement; o the cost of insurance of assets can be set off with the taxable income. o the amount of donation or financial support provided others to the extent permitted can
be set off; • can claim depreciation expenses at the rate adding one third in the prevalent rate prescribed by
the Income Tax Act; • In case of re-investment, 40% of the physical assets so created can be set off for income tax
purpose within one or five years; • one percent custom duty on equipment and machinery; • government to facilitate for acquisition of land required for the industry; • 100% income tax exemption for seven years and 50% income tax exemption for additional three
years; • 50% income tax exemption on income from technology transfer and managerial service to the
foreign investors.

Hydro Consult Nyadi Hydropower Project Volume I Main Report
Nyadi Hydropower Limited 3-3
3.2.4 Companies Act, 2006
The Companies Act, 2006 provides legal provisions for incorporation and operation of the limited liability company, one of the business vehicles in Nepal. The company can be either private limited company or public limited company. The Act has provisioned following operational requirements for the public limited company:
• As per Section 76, the annual general meeting of the company should be convened within six months after end of every fiscal year;
• As per Section 78, a status report should be submitted to the Office of the Company Registrar at least 21 days before the annual general meeting date;
• As per Section 80, the minutes of annual general meeting, financial statements, Board of Directors Report and Auditor’s Report should be submitted within 30 days after annual general meeting of the company;
• As per Section 111, the information regarding appointment of auditor should be communicated to the Office of the Company Registrar within 15 days;
• As per the Section 81, any eventuality of not submitting the documents and information within the specified time, the penalty has to be paid as per the delay.
3.2.5 The Industrial Enterprises Act, 1992
The Industrial Enterprises Act, 1992 was enacted based on the Industrial Policy, 1992 to make arrangements for fostering industrial enterprises in a competitive manner through the increment in the productivity by making the environment of industrial investment more congenial, straightforward and encouraging. Section 10 provisions that for registration of an industry, an application setting out the nature, the classification of the industry, the place where the industry is to be situated, the machinery to be employed by the industry, raw materials, auxiliary raw materials, chemicals, packaging goods and the name of the industrialist, and the Department of Industry shall provide the industry registration certificate within 21 days. The facilities applicable for hydropower sector as provisioned in the Section 15 are as follows: • While calculation depreciation on the fixed assets, industries shall be entitled to add on third to
the rate or depreciation allowed under the existing income tax laws. • After an industry comes into operation, 10 percent of the gross profit shall be allowed as a
deduction against taxable income on account of expenses related with technology, product development and efficiency improvement.
• An industry will be entitled, for the purpose of the income tax, to deduct the amount of expenses incurred by it for the long-term benefit provided to its workers and employees including housing, life, insurance, health facilities, education and training.
Section 17 and 18 set out the provision for formation of One Window Committee and the power and functions of the committee for facilitation to avail the facilities and concession provided by the Act. Further, Section 21 has assured that the industry will not be nationalized.
3.2.6 The Foreign Investment and Technology Transfer Act, 1992
The Foreign Investment and Technology Transfer Act (FITTA) 1992 aims at promoting foreign investment and technology transfer for making the economy viable, dynamic and competitive through the maximum mobilization of the limited capital, human and the other natural resources.
Section 2 (b) defines foreign investment as the equity investment, reinvestment and loan facilities.

Hydro Consult Nyadi Hydropower Project Volume I Main Report
Nyadi Hydropower Limited 3-4
Section 2 (c) defines technology transfer as the use of any technological right, specialization, formula, process, patent or technical know-how of foreign origin; use of any trademark of foreign ownership; and acquiring any foreign technical, consultancy, management and marketing service.
Section 3 requires that any foreign investor desiring to invest in Nepal or transfer of technology in Nepal has to take the permission from Department of Industry in case fixed assets of the industry are proposed to be five hundred million rupees. In case the fixed assets of the industry are proposed to be more than five hundred million rupees, the permission of Industrial Promotion Board has to be obtained. However, to facilitate the industry registration process, the Industrial Promotion Board has delegated it authority to Department of Industry for granting permission for foreign investment worth two thousand million rupees.
Section 5 provides repatriation facilities to the foreign investor. The foreign investor can repatriate the amount received from the sale of shares, profit or dividend from the investment, principle and interest in case of loan investment and the amount against the transfer of technology.
Section 6 provides visa facilities to the foreign investor and the dependent and authorized representatives of the foreign investor.
3.2.7 Water Resources Act, 1992 and Regulations, 1993
The Water Resources Act, 1992 aims at making arrangements for the rational utilization, conservation, management and development of the water resources.
As per Section 4, the user has to obtain license for use of water resources except for (i) one’s own drinking and other domestic use on an individual or collective basis, (ii) the irrigation of one’s own land on an individual or collective basis, (iii) the purpose of running water-mill or water-grinder as cottage industry, (iv) the use of boat on personal basis for local transportation, and (v) For the use, as prescribed, of the water resources confined to a land by the owner of such land. Further, the user of water resources has to make beneficial use without causing damage to other.
For the beneficial use of water resources, Section 7 has ranked use of water resources for generation of electricity as fourth priority, whereas the utilization of water resources for drinking water and domestic use, irrigation and agricultural use have been ranked in the first, second and third priority. Any conflict between the users for utilization of water resources shall be decided based on the priority ranking set by the Section 7 by the Water Resource Committee to be constituted as per Rule 8 under the chair of Chief District Officer.
Section 9 provisions that the licensing requirement for utilization of water resources for generation of electricity shall be as prescribed in the prevalent laws. The Electricity Act, 1992 is the special law dealing with licensing requirement of hydropower projects.
As per Section 12, contract may be signed between the Government of Nepal and developer for utilization of water resources for generation of electricity as per the terms and conditions contained therein.
Section 15, 16 and 17 respectively provides the right to enter into premises of any person for survey and utilization of water resources after giving prior notice to the owner of the premises, the government facilitation for acquisition of land required for the project and the government assurance for security of structure on the cost of developer.
Section 19 provisions that the utilization of water resources should be done so in such a manner that no substantial adverse effect be made on environment by way of soil erosion, flood, landslide or similar other cause.
3.2.8 The Electricity Act, 1992 and Regulation, 1993
The Electricity Act, 1992 was enacted to develop electric power by regulating the survey, generation, transmission and distribution of electricity and to standardize the quality of electricity.

Hydro Consult Nyadi Hydropower Project Volume I Main Report
Nyadi Hydropower Limited 3-5
As per Section 3, license has to be taken before for survey, generation, transmission and distribution of electricity for more than 1000 kW. Rule 5, 6, 7, 8 and 9 provision the details to be provided along with the application, procedures for screening application and issuance of license for survey, generation, transmission and distribution of electricity. The Ministry of Energy has issued “License Management Procedures” on May 28, 2010 to further clarify the licensing requirements and procedures for issuance of survey license and production license of the project. The Procedures have categorized the hydropower projects as small hydropower project (1-25MW), medium hydropower project (25-100 MW) and large hydropower project (above 100 MW) and has specified the requirements for all projects in terms of application requirements, priority if there is more than two applications is submitted, use of hydrological data and determination of installed capacity, financial capability requirements, technical capability requirements and renewal of survey license. The Procedures have two more important provisions regarding issuance and cancellation of generation license of the hydropower project. If the connection agreement has been signed after completing all necessary studies and PPA is yet to sign generation license may be issued with the condition that the developer must submit the copy of PPA within one year. Further, if PPA is cancelled for the reason whatsoever, the generation license shall be cancelled. Rule 11 assures that license will not given to the another person or corporate body for conducting the survey of the same project or in the same area.
As per Section 4 and 5, the license will be provided within 30 days and 120 days respectively for survey and generation of electricity and the tenure of license may be respectively for 5 years and 35 years. Rule 12, 13 and 14 provision for application requirements for generation, transmission and distribution electricity respectively. As per Rule 15, the application will be examined by DoED and if any document or information has not been submitted which ought to have been submitted, DoED has to give notice to the applicant within 45 days from the date of application. Upon satisfaction of the information or document submitted by the applicant, the DoED publishes a 35 days public notice to the public to submit their opinion stating the reasons if the project affects adversely. Based on the public opinion, the DoED may put compliance requirements in the generation, transmission or distribution license.
As per Section 10, if there is less than fifty percent ownership of the project is held by the foreign national or corporate body, the licensee company has been granted the right to operate or manage the power plant by entering into an agreement with the government.
Section 11 has provisioned two kinds of royalty to be paid by the developer the government. One is the capacity royalty, which is Rs. 100 per installed kW for fifteen years from the commercial operation date and thereafter Rs. 1000 per installed kW. Another is the energy royalty calculated based on the average tariff, which is 2% of the average annual tariff for fifteen years from commercial operation date and thereafter 10% of the average annual tariff.
Section 12(7) allows for only one percent customs duties to be levied for the import of construction equipment, machines, tools etc. required for repair, maintenance for hydroelectricity generation, transmission or distribution which is not produced in Nepal, and no charge for import license and sales tax shall be levied for such imports.
Section 13 provisions that the government shall make available necessary foreign currency at the prevailing market rate of foreign exchange for repatriation of investment or repayment of principal or interest of loan.
With regards to the facilities provided by the government through various laws and regulations, Section 14 clarifies that the licensee shall enjoy the facilities provided by the other laws and regulations without repeating the facilities provided by the Electricity Act. This means the licensee will have option to chose the higher facilities provided by the Electricity Act and other laws.
Section 15 has made special provision regarding housing and bonus for the employees involved in the generation, transmission and distribution works. As per rule 86, a residential quarter has to be provided to the employees involved in generation, transmission and distribution of electricity, and 2% of the net profit has to be set aside for distribution of bonus to the employees and the amount entitled by the employee as bonus shall not exceed the twelve months salary of the respective

Hydro Consult Nyadi Hydropower Project Volume I Main Report
Nyadi Hydropower Limited 3-6
employee. Any amount balance after distribution of dividend has to be deposited to the Employee Welfare Fund.
Section 24 requires that the generation, transmission and distribution of electricity is to be carried out in a manner that no adverse effect be made on environment by way of soil erosion, flood, landslide, air pollution etc.
Section 29 provides protection against nationalization of the project. Section 31 provisions that the government will provide the security of the project upon request of licensee and the cost associated with the security service has to be incurred by the licensee.
As per Section 33, upon request of licensee, the government makes available the land required for the project through acquisition from the private party or leasing the government owned land. The cost associated with purchase or lease of land has to be incurred by the licensee.
Rule 20 has granted right on water resources to the licensee to the extent mentioned in the license.
Rule 23 requires that permission is required for import of electricity. Rule 92 has enabled the licensee to transmit the electricity to any part of Nepal through using existing grid system if there is no technical problem for transmission.
3.2.9 Environment Protection Act, 1997 and Regulation, 1999
Environment Protection Act, 1997, has been enacted by the Parliament to make legal provisions for the protection of environment so as to maintain clean & healthy environment by minimizing, as far as possible, adverse impacts likely to be caused from environmental degradation on human beings, wildlife, plants, nature or physical objects.
Section 3 and Rule 3 require that IEE has to be carried out for the development of the project from 1Mw to 50 MW, the execution of project that affect cutting forest, the construction of transmission line of 132 KV or higher capacity and the construction of outdoor substation by tapping in 220 KV or more capacity line. In the case of development of the project more than 50 MW, EIA has to be conducted.
Rule 4 states that a notice requesting for suggestions regarding the impacts of the project in the environment has to be published by specifying 15 days timeline for them while carrying out EIA. As per Rule 5, terms of reference of the study has to be approved by the ministry for conducting IEE or EIA study. As per Rule 7, the IEE or EIA has to be conducted as per the approved ToR; a 15 days notice has to be published in national daily newspaper and post the same in the notice board of respective village development committee/municipality, district development committee, schools, hospital and health post for comments and suggestion of the public and incase of EIA a public hearing program has to be conducted in the project area and the opinions of the locals from the respective village development committee or municipality regarding the impact of the project in the environment have to be collected; and the IEE or EIA report has to be prepared in the format prescribed in the schedule 5 and 6 respectively. Rule 10 stipulates that fifteen copies of IEE or EIA Report have to be submitted to the concerned authority (i.e. through DoED) with the recommendation letter of the concerned village development committee or municipality office. As per Section 4, the project has to be executed only after receipt of approval from the concerned authority. Rule 12 requires that all the provisions of the IEE or EIA report and other terms and conditions prescribed by the concerned ministry have to be complied with.
As per Rule 14, the EIA of the project has to be updated by carrying out the environmental examination regarding the impact of the project on environment and the measures adopted to minimize the impact etc. after two years from the date of start of operation of the generation, distribution and service delivery. Section 7 states that the project should not create pollution in such a manner as to cause significant adverse impacts on the environment or likely to be hazardous to public life and people's health, or

Hydro Consult Nyadi Hydropower Project Volume I Main Report
Nyadi Hydropower Limited 3-7
dispose or cause to be disposed sound, heat radioactive rays and wastes from any mechanical devices, industrial enterprises, or other places contrary to the prescribed standards.
3.2.10 The Aquatic Animals Protection Act, 1961
The Aquatic Animals Protection Act, 1961 aims at protection of aquatic animals for the benefit and economical interest of the general public.
Section 3 prohibits for use of electric current, explosive materials or poison with the intention to catch or hunting any aquatic animals.
As per Section 5B, fish ladder has to be constructed in the dam of hydropower project to ensure the movement of fish, if possible or arrangement of nursery or hatchery for breeding of aquatic life close to the structure has to be made and informed to the Technical Official (in DoED) before carrying out construction/ arrangement for the same.
3.2.11 The Income Tax Act, 2000
The Income Tax Act, 2000 aims at enhancing the revenue mobilization. This Act has been enacted with reform in the then Income Tax Act, 1974 and amending revenue related provisions contained in different laws, including the Industrial Enterprises Act, 1992, the Foreign Investment and Technology Transfer Act, 1992 and the Electricity Act, 1992.
Section 11 (3D) provides the income tax exemption in the income from generation, transmission and distribution of electricity for seven years from the date of commercial operation date of the project and thereafter fifty percent income tax exemption for additional three years if the project if the commercial operation of the project is started within Chaitra end 2075 B.S.
Section 11B states that the source of income shall not be asked until the Chaitra end, 2075 B.S. in the case of investment made in the hydropower projects.
As per Section 20 (1) (b), the loss in the hydropower project can be carried forward for 12 years.
As per Section 40, the transfer of the project to the government after expiry of the license also constitute the disposal of assets by the project company, and in such a case, the value of appreciation or depreciation due transfer of the project will be counted as per Section 7 while calculating the income of the project company.
As per Schedule 1, the corporate tax rate applicable to the hydropower project is 20%.
3.2.12 The Value Added Tax Act, 1995
The Value Added Tax Act, 1995 Schedule 1 has granted value added tax exemption for import of electricity and hydro-mechanical and electromechanical equipment including the machinery and their spare parts and tools which are not manufactured in Nepal on the recommendation of DoED. As per Schedule 2, zero VAT rate will be applicable in the sale of such equipment and machinery on the recommendation of DoED if it is manufactured in Nepal.
3.2.13 The Securities Act, 2007 and Securities Registration and Issue Regulations, 2008
The Securities Act, 2007 was enacted for managing and mobilizing the capital market for economic development of the nation. Section 27 requires that the securities have to be registered with the Securities Board of Nepal before issuing to public. Rule 3(2) further clarifies that securities registration with the Securities Board of Nepal shall have to be done if the body corporate intends to issue the portion of securities remaining to be subscribed after being subscribed by the promoters as according to the terms of memorandum and articles of association or issues additional securities or is to sale securities to someone other than the promoters or in case securities hold by the promoters is to be sold. As per Section 29, if the securities are to be issued to more than fifty persons at a time, it has to be sold or distributed through the public issue.

Hydro Consult Nyadi Hydropower Project Volume I Main Report
Nyadi Hydropower Limited 3-8
Rule 7 (3) requires that the body corporate aiming to issue shares to the public has to provisioned 10% shares of the issued capital to the project affected area people with lock in period of three years and 15% shares of the issued capital to the general public. Rule 7 (6) has prescribed following pre-requisite for issue of shares to the public. • One year of operation after start of business as per the objectives of the body corporate; • Completed audit and shareholders’ meeting as per articles of association; • License is obtained, if required; • Completion of land procurement and start of construction of the facilities such as office building,
store etc.; • Procurement process for purchase of equipment and machinery has started; • Financial closure is completed; • Power purchase agreement is signed and tenders are invited for construction of power house
and other infrastructures; • Agreed to maintain the debt equity ratio as prescribed in the Securities Issue Directives; • The shares committed to subscribe by the promoters have been paid in full; and • Underwriting of shares is done as prescribed in the Securities Issue Directives.
Before issue of the Securities Registration and Issue Regulations, 2008 (including amendment 2010), raising share capital from market during the construction period of the hydropower project was not possible. This reform in the capital market regulation has paved for mobilizing the capital market for the development of hydropower sector as committed in the Hydropower Policy, 2001.
3.3 Constraints and Challenges Though the hydropower sector in Nepal has taken headway after 1990 with adoption of liberal policy, expected MW could not be added because of various reasons, and policy and legal constrains are one of them. The succeeding paragraphs deal with the policy and legal constrains:
3.3.1 Policy Related
The Interim Constitution of Nepal, 2008 has made policy direction for adoption a policy of according priority to the local communities while mobilizing the natural resources but the Hydropower Policy, 2001 only talks about the benefits sharing with the locals. It is further not clear how the project benefits will be shared between the developer and the locals.
Nine years have elapsed after issuance of the Hydropower Policy, 2001 and the policy is yet to be implemented in full fledge.
The Industrial Policy, 2010 has made some provisions related with the development of hydropower sector. The Industrial Policy, 2010 has declared itself as the main policy for industrial development and appropriate attention will be given while revising other policies like fiscal policy, revenue policy, local tax etc. so as to avoid the conflict. However, considering the experience in implementation of policies and coordination between the implementing institutions, the policy provisions affecting the hydropower development scattered in the different policies do not seem appropriate.
The Hydropower Policy, 2001 states that internal capital market will be mobilized for the development of hydropower projects but it is not clear how the developer will be facilitated for utilization of internal capital market. Further, the facilities thus provided to the projects are uniform to all projects without looking into the merits and demerits arising out from the size, nature, national needs, participation of people and other attributes of the projects.

Hydro Consult Nyadi Hydropower Project Volume I Main Report
Nyadi Hydropower Limited 3-9
3.3.2 Legislation Related
The Income Tax Act, 2000 repealed some of the benefits clauses in the Electricity Act, 1992 without discussion with the interested parties, which gave altogether negative message to the developers who were due to start the construction of the project.
Section 4(2) of the Electricity Act, 1992 has prescribed the timeline for issuance of license to the developer. However, the developers hardly get the license within the stipulated time.
As per Rule 93 of the Electricity Act, 1992, industry registration with the Department of Industries under the Industrial Enterprises Act, 1992 is a must for obtaining the generation license of the hydropower project. However, the Department of Electricity Development has been made governmental agency to facilitate the developers for availing the facilities provided to them under the Electricity Act, 1992. At the same time, the Department of Industries has been made responsible governmental agencies for availing facilities to the developers under the Industrial Enterprises Act, 1992. This multi-door procedural approach has not only impacted for loss of time and energy but also disappointed the developers.
Any project being developed by foreign investor solely or through the joint venture has to be registered with the Department of Industries for feasibility study as well. The industry registration requirement at the feasibility study phase does not make any business sense. As the ownership of the feasibility study reports comes to the government if application is not made by the developer within the feasibility study license period, it is not appropriate to impose upon the industry registration requirement for the project having foreign investor involved.
Generation of electricity at low cost is one of the objectives of the Hydropower Policy, 2001. To this end the government has introduced the income tax exemption facility to the developers who bring the hydropower project into commercial operation by Chaitra end, 2075 and VAT exemption has been granted in the hydro mechanical and electromechanical equipment including their spare parts. Still the developers are not encouraged to tap this opportunity stating the reason that the tariff rate offered by Nepal Electricity Authority, the state owned enterprises, is not sufficient to get minimum rate of return. The Electricity Act, 1992 has not made any provision for ensuring the minimum rate of return to the developer and has not made any institutional provision for determining such minimum rate of return from the project.
Section 20 of Electricity Act 1992 states that His Majesty's Government may specify National Transmission Line or Grid by Notification published in Nepal gazette. Nepal Electricity Authority presently owns such transmission line or grid. Specific guidelines or other norms concerning the use of such line have not yet been formulated.
As per Section 22 (3) of the Electricity Act 1992, the exporter of electricity shall have to pay export tax as prescribed by the government. The exact percentage of such tax has not been specified.
The schedules of the Electricity Regulations are lacking of specific provisions, in detail.
Electricity Act 1992 and Electricity Regulations 1993 are lacking details on plant safety, quality control and inspection procedures etc.
Various rules provide for the acquisition of land for building of the infrastructure for the power plant. But the norms for acquiring land or providing compensation for transmission line towers has not been specified. This could be a problem if some land owners refuse to provide right of way for the installation of transmission line towers.
Rule 86(2) of the Electricity Regulations states that the amount equal to two percent of net profit shall have to be distributed as bonus to the employees every year. With this provision the developer of hydropower project shall have to distribute a large amount of money as bonus, because even 2% could be a very high amount earned by power projects. This provision could reduce the developers` motivation towards developing hydropower projects because of the reduction in return on investment. Further, as per the exiting Bonus Act, bonus has to be paid twice in case of re-investment situation: one in the project company and another in the mother company.

Hydro Consult Nyadi Hydropower Project Volume I Main Report
Nyadi Hydropower Limited 3-10
The provision of Rule 7(3) of the Securities Registration and Issue Regulations to have allocated 10% of the issued capital to the project affected area people is difficult to implement in all the projects as development of hydropower project is a capital intensive activity. Commitment to maintain the debt equity ratio as prescribed in the Securities Issue Directives has to be made for issue of shares to the public, but the Directives are silent in this respect. As the developers are unable to utilize the capital market effectively and financial market is also not matured enough for financing the hydropower sector, imposing the debt equity ratio as pre-requisite for issue shares to the public could create problem for utilizing the capital market for the development of the hydropower in Nepal.
3.4 Conclusion In view of above deliberations, the existing policy and legal measures are supportive to the private investors for investment in the hydropower sector in Nepal though there are some policy and legal constraints and challenges. The stability and implementation of policies and laws are major concerns. Further, harmonization of different policy and legal measures is also area of improvement.
Therefore, for Nyadi Hydropower Project, it will be more appropriate to sign a concession agreement with the government protecting the benefits provided by the existing policies and laws, and also describing details on the possible implementation and procedural issues to be involved during construction and operation and maintenance stages.
Hydro Consult Nyadi Hydropower Project Volume I Main Report
Nyadi Hydropower Limited 4-1
4. TOPOGRAPHICAL SURVEY The same topographic survey data and maps from the feasibility study have been used during the review of feasibility study. However, the Consultant had to carry out a number of additional survey works at different times and for different purposes. A team of engineers and surveyors was visited the site for additional survey required for the surface option of surge shaft, penstock and powerhouse area. Similarly, a survey team was mobilized through Hydro Lab Pvt. Ltd. to carry out the survey of the headworks site, for the model study purpose. The survey was carried out based on the control points established earlier, during the feasibility study survey time. In addition, after the selection of tentative alignment of the access road on the available topo map, road alignment survey was carried out. Furthermore to incorporate the Siuri Tailrace water trapping, additional survey was also conducted after site verification from the design team.
This chapter will discuss on the topics:
• Ground control points plan • Survey maps • Control point description cards
During the feasibility study, March 2000, a detailed topographic survey contract was let with Auto Carto Consult, a local consultant, to carry out detailed topographic survey of the project area. The Consultant also carried out additional survey work of Siuri Khola for the potential diversion site. The survey data was produced in a digital format. From the data an Auto civil model was prepared.
The additional surveys of upstream of headworks area for physical modeling purpose had been carried out survey support for establish the centerline of road for track opening, core drilling and 2D-ERT survey is being provided.
4.1 Control survey traverse A control loop over the project area was established which linked to the Department of Survey third order control points. The loop traverse was established so that it can be used to develop further surveying if so required. It can also be used as the setting out control loop for tunneling. The control survey was established between the intake, powerhouse and upper adit sites in order to fix reference control stations for the detailed survey.
The control traverse is shown in Drawing No. 1220/02/10T01 contained in the Appendix J.
All permanent main control loop traverse control points (ST) were marked on the ground by permanent bolts cast-in bedrock or concrete for centering and elevation reference. At the intake site, the powerhouse site and the surge shaft adit site at least three permanent concrete benchmarks were constructed so that they can be easily interconnected.
Stations T-35 to T-46 and O-12 were temporary wooden stations for the purpose of surveying contour detail above the line of the tunnel. Description cards for these points are not provided.
The coordinates and levels of the stations on Drawing 1220/02/10T01 are shown in Table B.2 in Appendix B.
4.2 Survey (1:5000 scale) A general survey of the tunnel alignment was carried out from the river bed of the Nyadi River up to a point which is approximately 300 m north of the line of the tunnel.
The accuracy of the survey was sufficient for 1:5000 scale drawings, 10 m contour interval of the entire project area which included the overall survey control loop traverse, the river alignment and the hillside. It was also suitable for the production of 1:1000 scale drawings for general use only.
Hydro Consult Nyadi Hydropower Project Volume I Main Report
Nyadi Hydropower Limited 4-2
4.3 Detailed surveys The following detailed surveys were undertaken:
• Intake site 1:500 and 1:200 scale maps at 1 m contour interval,
• Naiche adit 1:500 scale maps at 1 m contour interval,
• Surge adit 1:500 scale maps at 1 m contour interval,
• Penstock 1:1000 maps, 5 m contour interval
• Powerhouse 1:500 and 1:200 scale maps at 1 m contour interval.
The plane table method was used for the detailed mapping. The contours were then digitized.
4.4 Topographic maps The maps listed in Table B.1 in Appendix B are presented in the Appendix J.
4.5 Station description cards Description cards for each of the stations on the main control loop traverse and additional cross reference check points are included. All description cards have been produced by Auto Carto Consult.
Hydro Consult Nyadi Hydropower Project Volume I Main Report
Nyadi Hydropower Limited 5-1
5. HYDROLOGY AND SEDIMENTOLOGY
5.1 Introduction During the review of feasibility study, the discharge data of gauged stations were collected, discharges for different return periods have been re-calculated for Headworks and PH sites (ungauged stations of Nyadi) by using the method outlined in WECS & DHM Report, 1990. In addition, Hec-Ras modeling has been carried out to verify the flood levels in the river using new topographical survey data. Regarding the hydrology of Siuri khola, the catchment area of Siuri khola at the headworks of Siuri khola Small HPP is 21.1km2 with average basin slope of about 1 in 6 based on Updated Detailed Feasibility Report of Siuri khola Small HPP.
However, all hydrological and sediment data, calculations and analyses are kept as it is in the feasibility study report of March 2000.
This section provides an overview of the hydrology and sedimentology studies. Detailed data is described in Appendix A.
An accurate assessment of long-term hydrology is of key importance to any major hydropower project. The longer the hydrological record the more reliable is the estimation of design parameters for the project. In the case of either limited or no stream flow records, it is necessary to study the catchments in the vicinity with similar hydro-meteorological characteristics and long term data record. This is the case with the Nyadi Hydropower Project.
In the presence of only a short period of stream flow record, the flow record can be extended to a long term record by correlation of stream flow with another basin having similar hydro-meteorological conditions with a longer term record. Where there are very limited or no stream flow records the flows can be estimated based upon relative drainage basin areas.
5.1.1 Previous studies
A detailed hydrological study of the Nyadi basin has not been conducted previously. A desk study was carried out by BPC in 1997. In feasibility level study a brief hydrological investigation of the Nyadi basin was conducted. Since no stream flow data at Nyadi was available, the monthly flows at the proposed intake site were estimated using the Department of Hydrology and Meteorology/Water and Energy Commission Secretariat (DHM/WECS) methodology for estimating hydrological characteristics of ungauged catchments (HYDEST Program). This gave an approximate estimate of the flows at the proposed intake site.
5.2 Nyadi River data
5.2.1 DHM data
In the northern hilly regions of Nepal, very few gauging stations have been established. DHM installed a gauging station near Nyadi Bazaar in October 1981. This gauge was in operation from the end of 1981 through to the beginning of 1988. The water level was recorded three times a day at 8 a.m., noon and 5 p.m. Daily average water level records are available from DHM for the period 1982 – 1988.
The available water level data is not complete. Only three discharge measurements were made during the period. Owing to the limited discharge measurements no discharge series were computed by DHM. Consequently the water level data is of little use.
5.2.2 LEDCO and BPC data
In March 1997 LEDCO started to record the water level data at Naiche using a temporary gauging station. The water level was read from a boulder two times a day. This was a very crude method of recording water levels and a lot of discrepancies were noticed in the records. In May 1998, LEDCO installed a staff gauge (Staff gauge no.1, refer to figure 5-1) close to the boulder at the Naiche
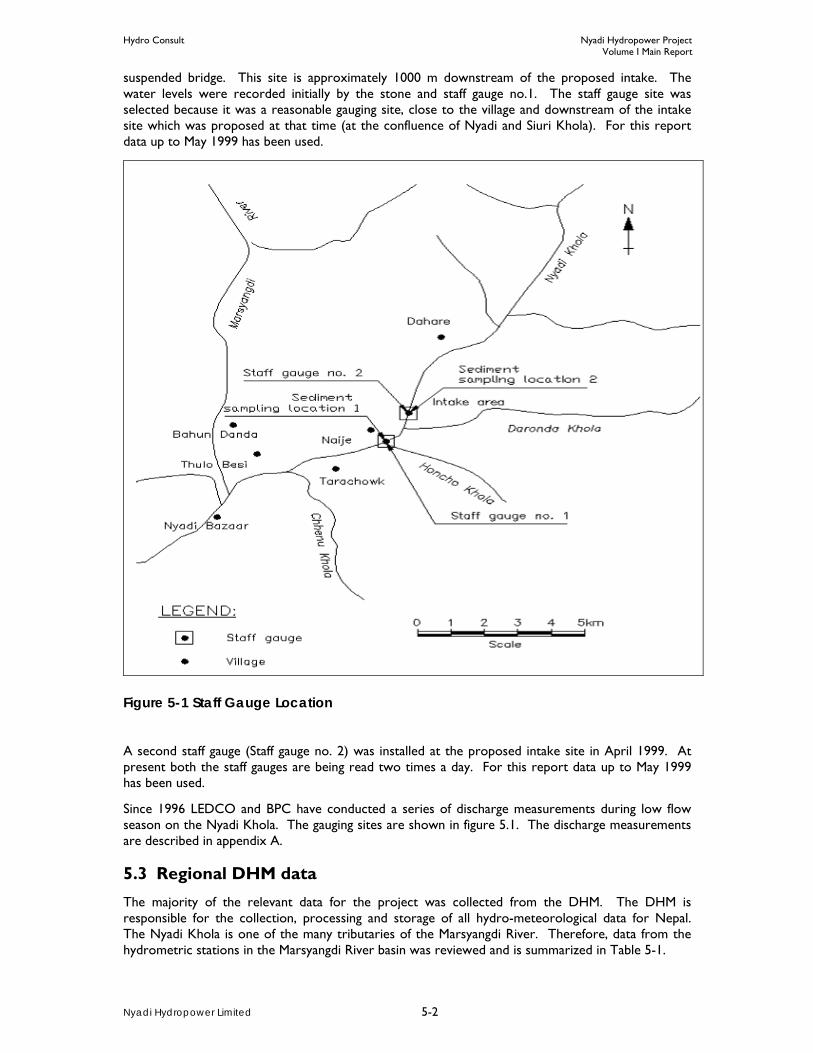
Hydro Consult Nyadi Hydropower Project Volume I Main Report
Nyadi Hydropower Limited 5-2
suspended bridge. This site is approximately 1000 m downstream of the proposed intake. The water levels were recorded initially by the stone and staff gauge no.1. The staff gauge site was selected because it was a reasonable gauging site, close to the village and downstream of the intake site which was proposed at that time (at the confluence of Nyadi and Siuri Khola). For this report data up to May 1999 has been used.
Figure 5-1 Staff Gauge Location
A second staff gauge (Staff gauge no. 2) was installed at the proposed intake site in April 1999. At present both the staff gauges are being read two times a day. For this report data up to May 1999 has been used.
Since 1996 LEDCO and BPC have conducted a series of discharge measurements during low flow season on the Nyadi Khola. The gauging sites are shown in figure 5.1. The discharge measurements are described in appendix A.
5.3 Regional DHM data The majority of the relevant data for the project was collected from the DHM. The DHM is responsible for the collection, processing and storage of all hydro-meteorological data for Nepal. The Nyadi Khola is one of the many tributaries of the Marsyangdi River. Therefore, data from the hydrometric stations in the Marsyangdi River basin was reviewed and is summarized in Table 5-1.
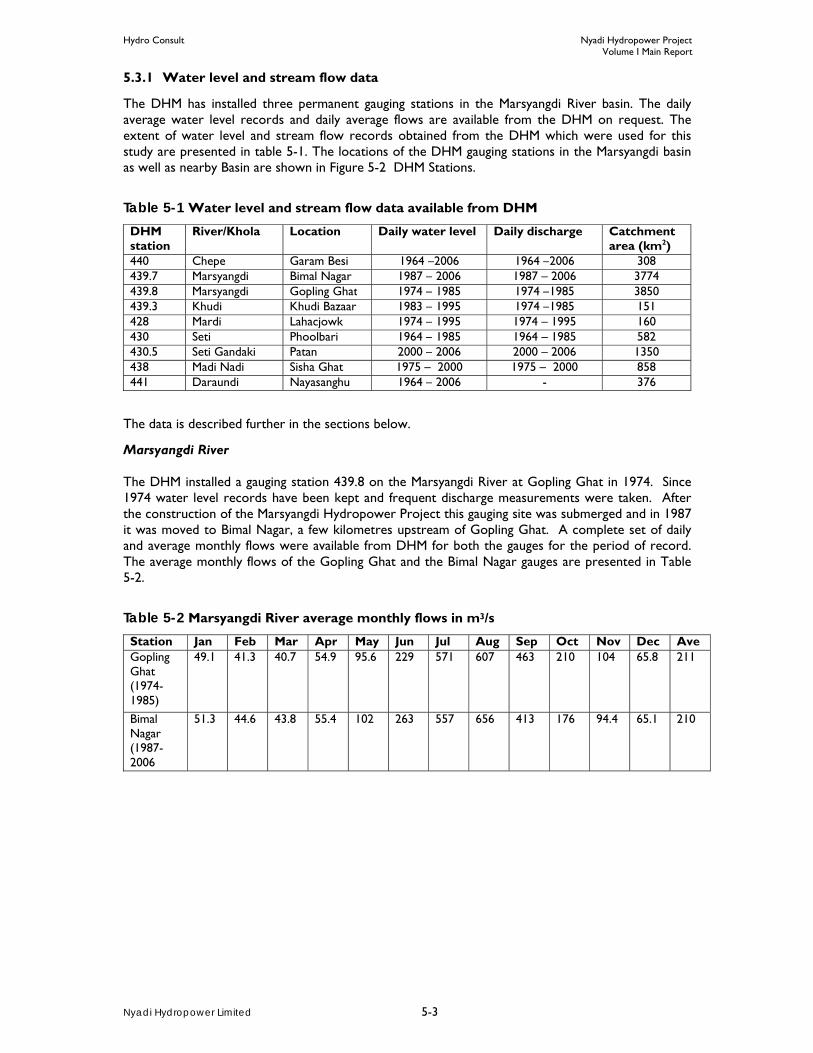
Hydro Consult Nyadi Hydropower Project Volume I Main Report
Nyadi Hydropower Limited 5-3
5.3.1 Water level and stream flow data
The DHM has installed three permanent gauging stations in the Marsyangdi River basin. The daily average water level records and daily average flows are available from the DHM on request. The extent of water level and stream flow records obtained from the DHM which were used for this study are presented in table 5-1. The locations of the DHM gauging stations in the Marsyangdi basin as well as nearby Basin are shown in Figure 5-2 DHM Stations.
Table 5-1 Water level and stream flow data available from DHM
DHM station
River/Khola Location Daily water level Daily discharge Catchment area (km2)
440 Chepe Garam Besi 1964 –2006 1964 –2006 308 439.7 Marsyangdi Bimal Nagar 1987 – 2006 1987 – 2006 3774 439.8 Marsyangdi Gopling Ghat 1974 – 1985 1974 –1985 3850 439.3 Khudi Khudi Bazaar 1983 – 1995 1974 –1985 151 428 Mardi Lahacjowk 1974 – 1995 1974 – 1995 160 430 Seti Phoolbari 1964 – 1985 1964 – 1985 582 430.5 Seti Gandaki Patan 2000 – 2006 2000 – 2006 1350 438 Madi Nadi Sisha Ghat 1975 – 2000 1975 – 2000 858 441 Daraundi Nayasanghu 1964 – 2006 - 376
The data is described further in the sections below.
Marsyangdi River The DHM installed a gauging station 439.8 on the Marsyangdi River at Gopling Ghat in 1974. Since 1974 water level records have been kept and frequent discharge measurements were taken. After the construction of the Marsyangdi Hydropower Project this gauging site was submerged and in 1987 it was moved to Bimal Nagar, a few kilometres upstream of Gopling Ghat. A complete set of daily and average monthly flows were available from DHM for both the gauges for the period of record. The average monthly flows of the Gopling Ghat and the Bimal Nagar gauges are presented in Table 5-2.
Table 5-2 Marsyangdi River average monthly flows in m3/s
Station Jan Feb Mar Apr May Jun Jul Aug Sep Oct Nov Dec Ave Gopling Ghat (1974-1985)
49.1 41.3 40.7 54.9 95.6 229 571 607 463 210 104 65.8 211
Bimal Nagar (1987-2006
51.3 44.6 43.8 55.4 102 263 557 656 413 176 94.4 65.1 210

Hydro Consult Nyadi Hydropower Project Volume I Main Report
Nyadi Hydropower Limited 5-4
Figure 5-2 DHM Stations
Chepe Khola
The Chepe Khola is one of the tributaries of the Marsyangdi River. The DHM installed a gauging station at Garam Besi in 1964. Since then water level records have been kept and discharges measured regularly. The data has been processed up to 1999 and daily as well as average monthly flow data is available from the DHM for the period from 1964 to 1999. Table 5-3 presents the average monthly flows for the period of record.
Table 5-3 Chepe Khola average monthly flows in m3/s
Period Jan Feb Mar Apr May Jun Jul Aug Sep Oct Nov Dec Ave 1964 – 2006
5.93 4.9 4.47 4.72 6.77 21.4 68.3 75.9 57.8 26.2 12.6 7.75 24.6
Khudi Khola
A gauging station was installed by the DHM on the Khudi Khola at an altitude of 990 m. Daily water level and discharge data is available from the DHM. However, this station has fragmented data series and the published average monthly flows appear to be inconsistent. The data was not considered suitable for further analysis.
Hydro Consult Nyadi Hydropower Project Volume I Main Report
Nyadi Hydropower Limited 5-5
Seti River
The Seti River is a tributary of the Trisuli River in the Gandaki River System. The DHM installed a gauging station at Phoolbari in 1964. Since then water level records have been kept and discharges measured are recorded to year 1984. The summary of monthly mean discharge is shown in Table 5-4.
Table 5-4 Seti River average monthly flows in m3/s
Period Jan Feb Mar Apr May Jun Jul Aug Sep Oct Nov Dec Ave 1964 – 1984
12.9 11.4 11.3 13.0 19.1 49.8 130 147 103 54.5 25.3 16.9 49.5
5.3.2 Rainfall data
The DHM has published monthly rainfall data for stations throughout Nepal for the period up to 1994. Daily data for the period of record is available only in hardcopy. The stations that have been reviewed for the present study are presented in Table 5-5. The locations of the rain gauges close to the project area are shown in. Since no rainfall data of the Nyadi catchment is available for comparison, this data was of limited use.
Table 5-5 Rain gauges in the project area
Station number
Name Elevation, (m)
Annual precipitation (mm)
Period of record
801 Gorkha, Jagat Setibas 1334 971 1981-1990 802 Khudi Bazaar, Lamjung 823 3316 1971-1994 806 Gorkha, Larke Samdo 3065 1435 1978-1990 807 Kunchha, Lamjung 855 2726 1971-1990 809 Gorkha, Gorkha 1097 1814 1971-1994 816 Chame, Manang 2680 902 1974-1994 823 Gharedhunga, Lamjung 1120 2917 1977-1990 1002 Arughat, Dhading 518 2671 1981-1990
The closest rain gauge to the project area is located at Khudi Bazaar about 10 km south-west of Naiche (station no. 802). Data from this station could be used to correlate with the Nyadi catchment. There is also a rain gauge station at Gharedhunga in the Chepe Khola catchment (station no. 823). The seasonal distribution of rainfall at Gharedhunga can be to some extent representative of the middle Nyadi area. This distribution is uni-modal and reflects a single monsoon rain season lasting from the middle of June to the end of September. Refer to Figure 5-2.
To better understand the effect of rainfall on stream flow a rain gauge station needs to be installed in the project area, preferably a little upstream of the intake as soon as possible.
5.4 Nyadi River discharge LEDCO and BPC have taken measurements of the Nyadi Khola since 1996. In 1999 discharges were measured using current meter method.
The salt dilution method is applicable to turbulent flow especially in steep rivers. However, the Nyadi Khola has a high base conductivity and abnormal errors have been noticed in the results. Depending on the suitability of the location more accurate measurements were obtained in 1999 using a current meter.
Owing to the longer period of available data rating curves and flow series for staff gauge no.1 were developed. For staff gauge no.2 data for two months only (April and May 1990) was considered too short a period to develop meaningful rating curve and flow series.

Hydro Consult Nyadi Hydropower Project Volume I Main Report
Nyadi Hydropower Limited 5-6
During this phase, Gauge has been established in May 2008 to acquire daily flow data from Nyadi headworks site for further hydrological analyses. The dry season flow at the headworks site was measured in May 2007 using current meter to verify the design discharge.
5.4.1 Rating curve staff gauge no.1
The discharge measurement data of the Nyadi Khola from 1997 was compiled and closely inspected. Some evidently erroneous records were dropped and a set of ten discharges was selected for rating curve development. Owing to a lack of discharge measurements at Naiche (staff gauge no.1) all the discharges measured on the Nyadi Khola at various locations were considered for the development of the rating curve.
The discharge measurements at the proposed intake site (staff gauge no.2) were translated to the discharges at staff gauge no.1 (below Naiche) using a direct area relationship. The water levels for the corresponding discharge measurements were available from the gauge. With these limited discharge measurements and corresponding water level data a rating curve for the Nyadi Khola at staff gauge no.1 was developed. Further details are supplied in Appendix A.
The form of the rating equation is as follows:
Q = C (H+Ho)n
Where:
Q is the rated discharge H is the gauge height C = 10.281 and n = 1.0747 are constants Ho = 0.02 is the datum correction
Owing to the steep gradient of the river each year a lot of deposition and scour of bed materials takes place. Hence the line of the low flow channel and the river cross section changes from year to year. For an accurate definition of the rating curve, to incorporate all the changes caused by the shifting flow, discharge measurements and regular cross section measurements need to be continued.
5.4.2 Flow series staff gauge no.1
Water levels at staff gauge no.1 were available for the period from March 1997 to May 1999. The above rating equation was applied to the water levels to obtain the daily flows at the gauge.
There are no high flow discharge measurements. This prevents accurate definition of the upper tail of the rating curve. The rating curve has thus been applied to the low and transition flow period from November to May only. For the high flow period from June through to October the flows have been computed using the direct area ratio of the Chepe Khola and Nyadi Khola at staff gauge no.1.
The average monthly flow at Naiche for the period April 1997 to May 1999 is presented in Table 5-6 .
Table 5-6 Staff gauge no.1 average monthly flow in m3/s
Year Jan Feb Mar Apr May Jun Jul Aug Sept Oct Nov Dec 1997 4.7 6.4 6 19.9 23.3 16.4 8.8 8.0 4.1 1998 3.7 3.5 3.5 5.0 5.4 8.5 38.3 54.3 28.3 12.5 7.1 5.4 1999 4.1 3.4 3.2 3.3 4.4 Ave 3.9 3.4 3.4 4.3 5.4 7.2 29.1 38.8 22.4 10.6 7.6 4.8
5.5 Catchment correlation The Nyadi Khola has very limited flow data. There is only a short period of record from April 1997 to May 1999. This stream flow record can be extended to a longer period by correlating the existing stream flows with another basin having similar hydro-meteorological conditions and a longer period

Hydro Consult Nyadi Hydropower Project Volume I Main Report
Nyadi Hydropower Limited 5-7
of record. In this method of extending the flow data the overlap period is of key importance. With a longer period of overlap the extended flows will be more representative of the actual flows. This correlation can be done on a monthly, seasonal and annual basis.
The overlapping stream flow record for Nyadi is for sixteen months from April 1997 to May 1999 excluding the monsoon period (from June to October). The nearby catchments having long term flow data which were considered for this study are the Marsyangdi River and Seti River.
5.5.1 Nyadi catchment
The Nyadi Khola originates from the Himalayan peaks at an elevation of more than 7000 m and flows south-west to join the Marsyangdi River about 7 km downstream of the proposed intake area. The length of the catchment area is 20.5 km and the average width is 7.5 km. The catchment area has been measured from a 1:50,000 scale topographical map published by the Indian Army. The catchment characteristics of the basin are summarized in Table 5-7.
Table 5-7 Characteristics of the Nyadi Khola catchment
Elevation Area (km2)
Percentage of total area
General characteristics
Area > 5000 m 24.5 15.8 Alpine, no active glaciers 5000 m > area > 3000 m 92.8 60.0 Higher and Lesser Himalayas Area < 3000 m 37.4 24.2 Lesser Himalayas Total 154.7 100.0
The Nyadi Khola catchment has very steep valleys and a steep river profile and is shown in Figure 5-3.
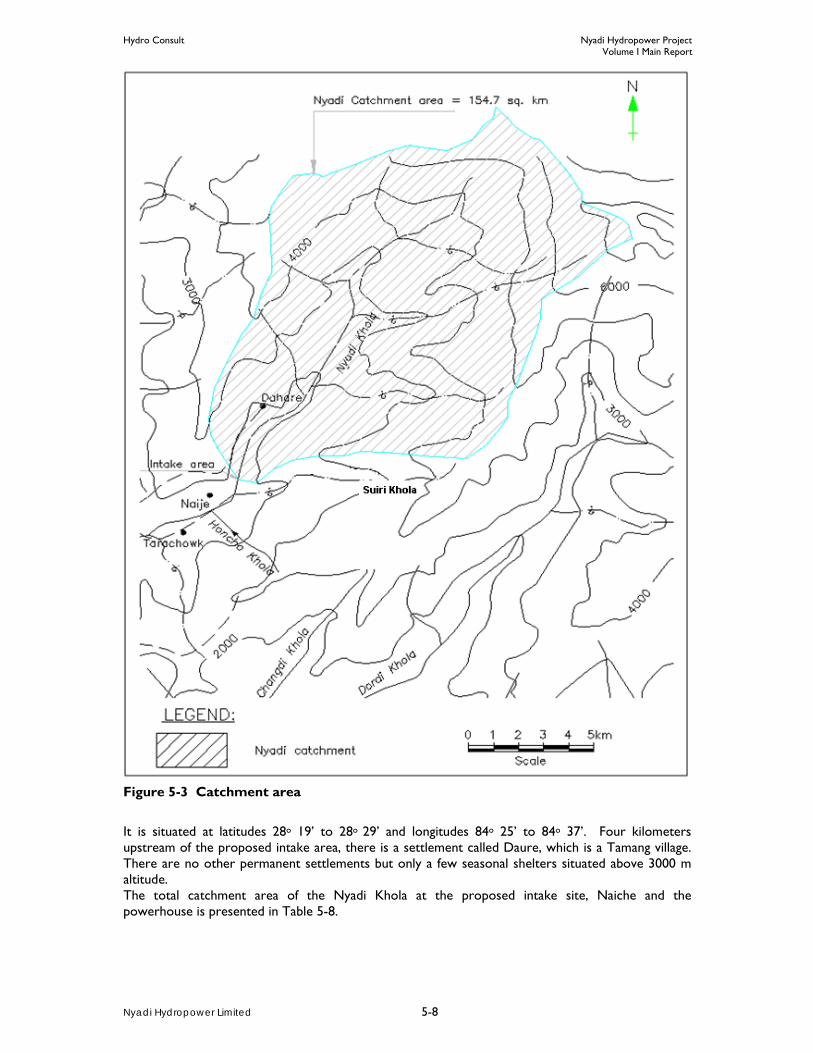
Hydro Consult Nyadi Hydropower Project Volume I Main Report
Nyadi Hydropower Limited 5-8
Figure 5-3 Catchment area
It is situated at latitudes 28o 19’ to 28o 29’ and longitudes 84o 25’ to 84o 37’. Four kilometers upstream of the proposed intake area, there is a settlement called Daure, which is a Tamang village. There are no other permanent settlements but only a few seasonal shelters situated above 3000 m altitude. The total catchment area of the Nyadi Khola at the proposed intake site, Naiche and the powerhouse is presented in Table 5-8.

Hydro Consult Nyadi Hydropower Project Volume I Main Report
Nyadi Hydropower Limited 5-9
Table 5-8 Catchment area of Nyadi Khola
Location Area, km2 Proposed intake site - staff gauge no.2 154.7 Gauging site at Naiche - staff gauge no.1 181.0 Proposed powerhouse site 211.5
5.5.2 Specific Discharge of Different Rivers
Sapta Gandaki River basin has number of major and minor rivers. A few rivers are gauged and good records of hydrometric Station. Rivers having comparative physiographic characters with Nyadi Khola are chosen to generate the long series of discharge data. For this purpose, the selected rivers are Mardi Khola, Seti Khola, Madi Nadi, Khudi Khola, Chepe Khola and Daraundi Khola. The long term average discharges of these rivers are given in Table 5-9.
Table 5-9 Monthly average discharge of Different rivers
Station Mardi Seti Madi Khudi Chepe Daraundi Nyadi Khola Name Khola Khola Nadi Khola Khola Khola Measured Station No. 428 430 438 439.3 440 441 Intake Site Year of Data 1974-95 1964-84 1975-00 1983-95 1964-06 1964-06 1997-99 C.A. (km2) 160 582 858 151 308 376 181 January 3.38 12.9 17.1 3.89 5.94 6.98 3.9 February 2.89 11.4 15 3.53 4.90 5.67 3.4 March 2.78 11.3 15.1 3.61 4.47 5.40 3.4 April 2.8 13 17.8 3.92 4.72 5.82 4.3 May 3.94 19.1 28.8 4.98 6.77 7.69 5.4 June 14.7 49.8 80.9 9.24 21.35 25.53 7.2 July 48.2 130 215 21.4 68.28 78.76 29.1 August 60 147 225 27.9 75.91 91.59 38.8 September 42 103 156 21.2 57.81 70.91 22.4 October 17.5 54.5 64.9 11.8 26.24 32.33 10.6 November 7.13 25.3 32.1 6.86 12.58 15.69 7.6 December 4.35 16.9 22.2 4.53 7.75 9.70 4.8 Average Flow 17.47 49.52 74.16 10.24 24.73 29.67 11.74
The specific discharge are calculated on these rivers and compared with the Specific discharge of measured values of Nyadi Khola. The catchment area of Nyadi Khola at the gauge site is 181 km2. The specific discharge of these rivers is shown in Table 5-10. It is noted that the Seti Khola gives the equivalent specific discharge compared to other rivers considered in the Sapta Gandaki Basin.
Therefore, the river flow of Seti River is used to generate the long term discharge of Nyadi Khola at the dam site.
Table 5-10 Specific discharge of different rivers
Station Mardi Seti Madi Khudi Chepe Daraundi Nyadi Khola Name Khola Khola Nadi Khola Khola Khola Measured
Station No. 428 430 438 439.3 440 441 Intake Site Year of Data 1974-95 1964-84 1975-00 1983-95 1964-06 1964-06 1997-99 C.A. (km2) 160 582 858 151 308 376 181 January 0.0211 0.0222 0.0199 0.0258 0.0193 0.0186 0.0215 February 0.0181 0.0196 0.0175 0.0234 0.0159 0.0151 0.0188 March 0.0174 0.0194 0.0176 0.0239 0.0145 0.0144 0.0188 April 0.0175 0.0223 0.0207 0.0260 0.0153 0.0155 0.0238 May 0.0246 0.0328 0.0336 0.0330 0.0220 0.0204 0.0298

Hydro Consult Nyadi Hydropower Project Volume I Main Report
Nyadi Hydropower Limited 5-10
June 0.0919 0.0856 0.0943 0.0612 0.0693 0.0679 0.0398 July 0.3013 0.2234 0.2506 0.1417 0.2217 0.2095 0.1608 August 0.3750 0.2526 0.2622 0.1848 0.2465 0.2436 0.2144 September 0.2625 0.1770 0.1818 0.1404 0.1877 0.1886 0.1238 October 0.1094 0.0936 0.0756 0.0781 0.0852 0.0860 0.0586 November 0.0446 0.0435 0.0374 0.0454 0.0408 0.0417 0.0420 December 0.0272 0.0290 0.0259 0.0300 0.0252 0.0258 0.0265 Mean Flow 0.11 0.09 0.09 0.07 0.08 0.08 0.06
5.5.3 Seti Khola catchment
The Seti Khola is one of the tributaries of the Trisuli River. The Seti Khola originates at an elevation of about 4000 m. The river flows in a southerly direction. A significant part of the Seti Khola basin lies above 5000 m elevation. The catchment characteristics of the basin are summarized in Table 5-11 and for comparison purpose, catchment characteristics of Nyadi Khola are shown also.
Table 5-11 Characteristics of the Seti Khola catchment
Station G.S. 430 Seti Nyadi Khola at dam
Catchment Area 582 km2 154.7 km2
Area Below 5000 m 519 km2 130.2 km2
Area Below 3000 m 352 km2 37.4 km2
Main Channel Length 42.8 km 20.5 km
5.5.4 Generation of long term Average flow
The catchment area of Seti Khola is 582 km2. The flow records available are from the year 1964 to 1984, 21 years of record. The monthly flow generations have been carried out by direct multiplication of catchment factor. Table 5-12 shows the monthly flow data at the Nyadi Intake including Siuri Khola. The total catchment area of Nyadi Khola at gauge station 1 considered is181 km2.

Hydro Consult Nyadi Hydropower Project Volume I Main Report
Nyadi Hydropower Limited 5-11
Table 5-12 Monthly discharge of Nyadi Khola Including Siuri Khola (location at Staff Gauge no. 1)
Months Jan Feb Mar Apr May Jun Jul Aug Sep Oct Nov Dec Year 1964 4.6 4.4 4.3 4.6 9.9 11.2 19.3 66.1 45.0 16.1 11.8 7.7 17.1 1965 4.9 4.2 4.3 4.7 5.2 21.7 42.1 52.9 27.3 9.0 6.7 4.5 15.6 1966 3.5 3.2 3.0 2.8 3.2 9.1 32.8 37.3 22.9 9.5 5.5 3.7 11.4 1967 3.0 3.0 2.9 3.3 3.5 8.3 33.2 30.6 26.7 11.1 6.3 4.9 11.4 1968 3.6 2.9 3.6 3.6 5.0 20.4 48.3 41.2 32.0 46.9 6.0 3.4 18.1 1969 2.6 2.1 2.2 2.1 2.4 4.9 18.4 45.3 37.9 11.4 5.8 3.7 11.6 1970 2.9 2.5 2.3 3.5 5.1 13.1 54.7 59.2 29.0 15.2 8.2 4.8 16.7 1971 3.4 2.7 2.7 4.2 5.7 27.0 41.8 43.2 30.6 20.9 9.7 5.7 16.5 1972 3.7 2.9 2.8 2.9 7.6 15.3 46.8 52.1 36.1 15.6 7.4 4.8 16.5 1973 3.6 2.5 2.6 3.7 5.6 25.3 35.0 55.9 38.1 37.3 10.7 5.6 18.8 1974 5.3 4.8 4.7 5.9 5.6 13.2 49.3 59.1 36.5 18.9 6.3 4.9 17.9 1975 4.7 4.6 4.3 3.3 3.4 12.2 61.3 47.2 43.9 20.0 7.8 4.4 18.1 1976 3.2 3.3 2.8 3.6 5.9 27.3 54.6 49.2 31.0 12.7 6.3 4.9 17.1 1977 3.3 2.9 3.0 4.3 6.7 13.3 41.4 58.7 35.7 16.1 10.7 6.2 16.9 1978 5.2 5.1 4.3 4.1 10.7 23.6 49.5 43.0 26.1 12.5 8.9 6.9 16.7 1979 5.6 4.9 4.4 5.8 7.3 11.4 34.9 44.9 27.9 16.8 10.1 5.8 15.0 1980 4.3 4.1 4.5 4.7 7.1 19.9 54.4 50.2 40.1 13.6 7.7 4.5 17.9 1981 3.1 2.6 2.8 5.1 6.7 14.4 54.2 50.0 37.5 15.9 7.8 6.5 17.2 1982 6.1 5.7 6.5 7.3 8.7 14.5 37.2 57.5 33.2 11.4 6.5 5.6 16.7 1983 5.1 4.8 4.2 4.2 30.9 34.9 33.3 18.5 6.1 1984 4.4 3.6 3.6 3.9 7.1 17.3 52.4 38.8 34.4 11.1 6.5 4.8 15.7 Mean 4.11 3.66 3.61 4.17 6.12 16.16 42.51 48.44 33.58 17.17 7.75 5.17 16.13
5.5.5 Extended Nyadi flows
Staff gauge no.2 Based on the Seti Khola flows the extended flow of Nyadi Khola at staff gauge no.1 is presented in Table 5-12 . The average annual discharge for the period from 1964 to 1984 is 16.13 m3/s. The proposed intake site is located approximately 1 km upstream of Naiche. The basin of Nyadi Khola at Naiche, staff gauge no.2 is 154.7 km2 (at the proposed intake site). There is only one tributary between the two locations which is the Siuri Khola. A small difference between the areas allows for translation of discharge series between the respective sites with ratio between catchments area.
The flow at the intake site was determined by multiplication factor of Seti Khola to intake site of Nyadi. The extended average annual discharge for the period from 1964 to 1984 at the intake site is 13.79 m3/s. The summary of extended flow at intake site of Nyadi Khola (without Siuri) is shown in Table 5-13.
Table 5-13 Nyadi Khola, average monthly flows in m3/s
Period Jan Feb Mar Apr May Jun Jul Aug Sep Oct Nov Dec 1964 – 1984 3.51 3.13 3.09 3.56 5.23 13.81 36.33 41.40 28.70 14.68 6.63 4.42
The design discharge of Siuri Khola is 1.40 m3/sec. The adopted average monthly flows at the intake site are shown in Table 5-14. The average annual hydrograph at the proposed intake site is shown in Figure 5.4.

Hydro Consult Nyadi Hydropower Project Volume I Main Report
Nyadi Hydropower Limited 5-12
Table 5-14 Intake site average monthly flows in m3/s
Month Nyadi at intake (m3/sec)
Siuri Tailrace (m3/sec)
Combined discharge (m3/sec)
Baishakh 4.38 0.64 5.02 Jestha 9.31 1.40 10.71 Ashar 24.95 1.40 26.35 Shravan 40.12 1.40 41.52 Bhadra 35.34 1.40 36.74 Asoj 21.44 1.40 22.84 Kartik 9.94 1.40 11.34 Mangsir 5.45 1.32 6.77 Poush 3.75 1.00 4.75 Magh 3.38 0.75 4.13 Falgun 3.08 0.54 3.62 Chatra 3.34 0.39 3.73
Monthly Flow Hydrograph(m3/s)
0
5
10
15
20
25
30
35
40
45
50
Jan Feb Mar Apr May Jun Jul Aug Sep Oct Nov Dec
Months
Dis
char
ge (m
3 /s)
Figure 5-4 Monthly flow hydrograph
5.5.6 Comparison of actual and extended flows
The extended flows at Naiche on the Nyadi Khola for each month for the period from April 1997 to May 1999 were compared with the actual average flows for the same period for the low and transition flow period. It is found that there is a reasonable agreement between the extended and the actual flows. Table 5-15 shows the comparison.
Hydro Consult Nyadi Hydropower Project Volume I Main Report
Nyadi Hydropower Limited 5-13
Table 5-15 Staff gauge no.1 comparison of extended and actual flows in m3/s
Period Jan Feb Mar Apr May Nov Dec Actual average (’97 – ’99) 3.9 3.4 3.4 4.3 5.4 7.6 4.8 Extended average (‘64-’84) 4.11 3.66 3.61 4.17 6.12 6.63 4.42
Since there is very little data available the quality of the extension is only fair. In the future more data has to be collected and discharge measurements conducted to improve the correlation of the data. It is recommended, with more data, the process of long term data generation has to be reviewed. Even though at present Seti Khola is taken for long term data generation, a better methods shall be available to generate the long term data.
5.5.7 Regional method
In 1992 Snowy Mountains Engineering Corporation (SMEC) initiated a detailed hydrological study of various river basins as part of the Greater Kathmandu Water Supply Project. The hydrological investigations included a regional method of estimation of runoff. Using basic data from the WECS/DHM (1990) report, regional runoff estimation equations were derived for two groups of Nepalese catchments:
• High altitude catchments, those with more than 30% of their catchments above 3000 metres above sea level (masl)
• Medium altitude catchments, those with maximum altitudes of less than 3000 masl.
High altitude catchments
SMEC selected eight catchments with more than 30% of their drainage area above 3000 masl. The data from these catchments was used to derive regression equations for average monthly flows. For all the months the average monthly runoff was a function of the total catchment area only. The Marsyangdi River is one of the stations selected for the analysis.
The Nyadi catchment has much more than 30% of its drainage area above 3000 masl and hence can be categorized as a high altitude catchment. For the purpose of comparison the regional equations developed by SMEC for high altitude catchments were also used. The results of applying these equations are presented inTable 5-16.
5.5.8 Comparison with other similar catchment
As a further check the estimated flows of the Nyadi Khola were compared with the flows of the Melamchi Khola. The Melamchi Khola catchment is a high altitude catchment and is very similar to the Nyadi catchment. The Melamchi Khola catchment has 20% of its drainage area less than El. 3000 m and Nyadi Khola has 24%. The area between the elevation 3000 masl and 5000 masl is also very similar. Both the rivers are flowing from north to south and have comparable drainage area size. The rainfall pattern and total annual precipitation of two catchments are comparable. Hence it seems appropriate to say that both the rivers have similar geographic, topographic and hydro-meteorological conditions and hence can be compared.
The comparison suggests that the extended flow predictions are reasonable and are suitable for adopted Nyadi Khola flows.
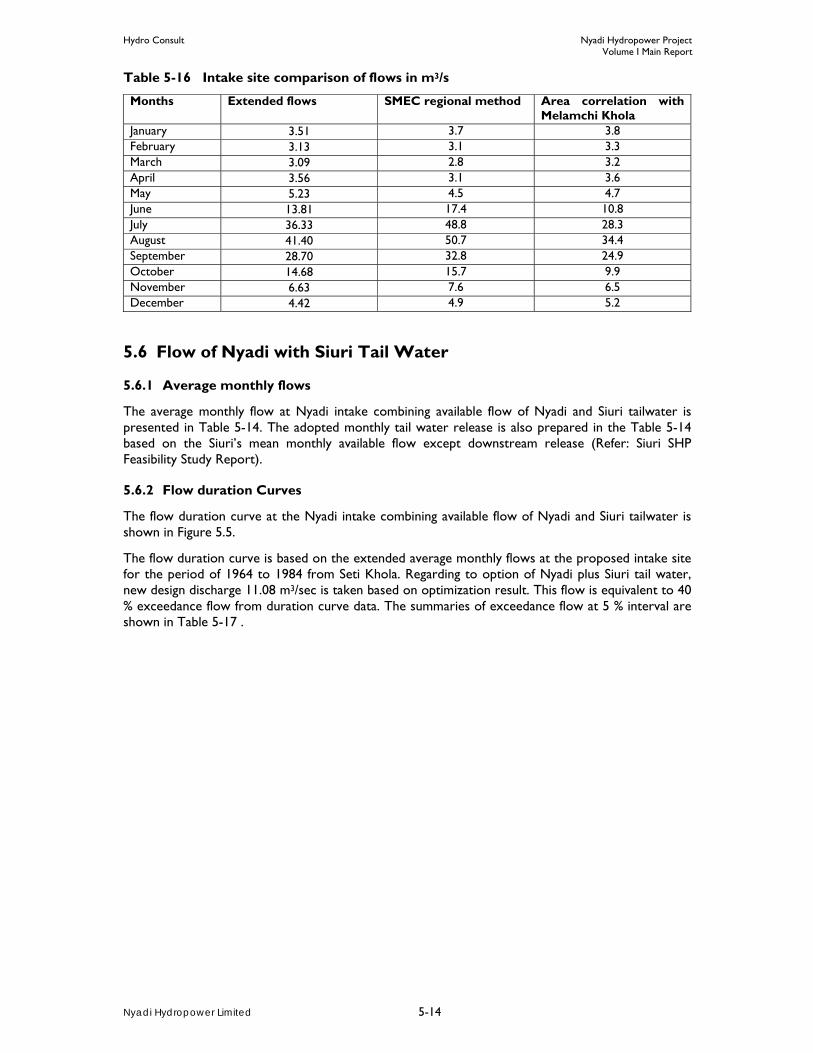
Hydro Consult Nyadi Hydropower Project Volume I Main Report
Nyadi Hydropower Limited 5-14
Table 5-16 Intake site comparison of flows in m3/s
Months Extended flows SMEC regional method Area correlation with Melamchi Khola
January 3.51 3.7 3.8 February 3.13 3.1 3.3 March 3.09 2.8 3.2 April 3.56 3.1 3.6 May 5.23 4.5 4.7 June 13.81 17.4 10.8 July 36.33 48.8 28.3 August 41.40 50.7 34.4 September 28.70 32.8 24.9 October 14.68 15.7 9.9 November 6.63 7.6 6.5 December 4.42 4.9 5.2
5.6 Flow of Nyadi with Siuri Tail Water
5.6.1 Average monthly flows
The average monthly flow at Nyadi intake combining available flow of Nyadi and Siuri tailwater is presented in Table 5-14. The adopted monthly tail water release is also prepared in the Table 5-14 based on the Siuri’s mean monthly available flow except downstream release (Refer: Siuri SHP Feasibility Study Report).
5.6.2 Flow duration Curves
The flow duration curve at the Nyadi intake combining available flow of Nyadi and Siuri tailwater is shown in Figure 5.5.
The flow duration curve is based on the extended average monthly flows at the proposed intake site for the period of 1964 to 1984 from Seti Khola. Regarding to option of Nyadi plus Siuri tail water, new design discharge 11.08 m3/sec is taken based on optimization result. This flow is equivalent to 40 % exceedance flow from duration curve data. The summaries of exceedance flow at 5 % interval are shown in Table 5-17 .

Hydro Consult Nyadi Hydropower Project Volume I Main Report
Nyadi Hydropower Limited 5-15
Table 5-17 Percentage exceedance flow at intake for combined discharge (Nyadi + Siuri Tailrace) in m3/s
0.00
10.00
20.00
30.00
40.00
50.00
60.00
70.00
0 20 40 60 80 100
Percent Exceedance
Dis
char
ge (m
3 /s)
Figure 5-5 Flow duration curve at Nyadi Intake
S. No. Percent Nyadi Khola Exceedance Combined with Siuri 1 0 66.15 2 5 52.43 3 10 44.97 4 15 37.48 5 20 33.21 6 25 26.68 7 30 18.50 8 35 13.26 9 40 11.08 10 45 8.16 11 50 6.74 12 55 6.04 13 60 5.60 14 65 4.89 15 70 4.68 16 75 4.33 17 80 3.71 18 85 3.45 19 90 2.98 20 95 2.69 21 100 2.10
11.08 m3/sec

Hydro Consult Nyadi Hydropower Project Volume I Main Report
Nyadi Hydropower Limited 5-16
5.7 Extreme flood flows
5.7.1 Flood at Intake
There is no flood data available for the Nyadi Khola. Therefore, maximum instantaneous flow at Phoolbari of Seti River was used to estimate the flood flow at intake and powerhouse sites of Nyadi Hydropower Project. Different distribution methods were used and result was presented in Table 5-18.
Table 5-18 Flood estimates at intake Distribution
Type Return periods
2 5 10 20 50 100 200 500 1000 Log normal 116 206 279 357 471 567 673 826 955 Log Pearson III 111 219 311 417 579 720 880 1122 1330 Gumbel 124 207 270 337 431 509 592 710 808
As the Gumbel Distribution method has given the best fit curve, result from this method is adopted.
5.7.2 Flood at Tailrace
In order to find the flood flow at powerhouse site where there is outlet of tail water, Different distribution method was used. Table 5-19 shows flood flows at tailrace outlet for different return period.
Table 5-19 Flood estimates at Tailrace Distribution
Type Return periods
2 5 10 20 50 100 200 500 1000 Log normal 159 282 381 488 644 776 920 1130 1305 Log Pearson III 152 299 426 570 791 984 1203 1533 1818 Gumbel 170 283 370 460 590 695 809 971 1104
In this case also, the result from Gumbel method is adopted.
5.8 Extreme low flow No extreme low flow analysis has been made in the past for the Nyadi Khola. Therefore, low flow analysis was carried out by analyzing the derived daily inflow series (1964-1984) at the intake site of Nyadi HP and extracting the annual 1-day, 7-day, 15-day and 30-day minimum flows. A number of probability distribution functions were fitted to each minimum flow series and the result from Weibull method was adopted. The result is presented in Table 5-20.
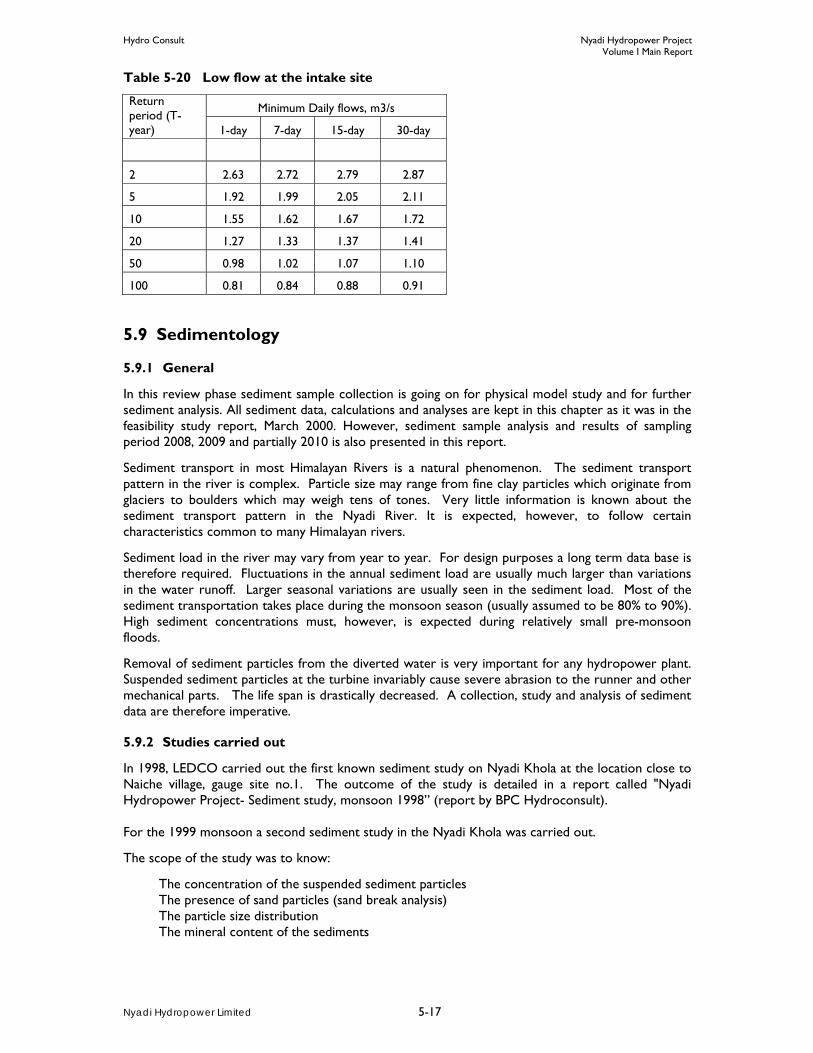
Hydro Consult Nyadi Hydropower Project Volume I Main Report
Nyadi Hydropower Limited 5-17
Table 5-20 Low flow at the intake site
Return period (T-year)
Minimum Daily flows, m3/s
1-day 7-day 15-day 30-day
2 2.63 2.72 2.79 2.87
5 1.92 1.99 2.05 2.11
10 1.55 1.62 1.67 1.72
20 1.27 1.33 1.37 1.41
50 0.98 1.02 1.07 1.10
100 0.81 0.84 0.88 0.91
5.9 Sedimentology
5.9.1 General
In this review phase sediment sample collection is going on for physical model study and for further sediment analysis. All sediment data, calculations and analyses are kept in this chapter as it was in the feasibility study report, March 2000. However, sediment sample analysis and results of sampling period 2008, 2009 and partially 2010 is also presented in this report.
Sediment transport in most Himalayan Rivers is a natural phenomenon. The sediment transport pattern in the river is complex. Particle size may range from fine clay particles which originate from glaciers to boulders which may weigh tens of tones. Very little information is known about the sediment transport pattern in the Nyadi River. It is expected, however, to follow certain characteristics common to many Himalayan rivers.
Sediment load in the river may vary from year to year. For design purposes a long term data base is therefore required. Fluctuations in the annual sediment load are usually much larger than variations in the water runoff. Larger seasonal variations are usually seen in the sediment load. Most of the sediment transportation takes place during the monsoon season (usually assumed to be 80% to 90%). High sediment concentrations must, however, is expected during relatively small pre-monsoon floods.
Removal of sediment particles from the diverted water is very important for any hydropower plant. Suspended sediment particles at the turbine invariably cause severe abrasion to the runner and other mechanical parts. The life span is drastically decreased. A collection, study and analysis of sediment data are therefore imperative.
5.9.2 Studies carried out
In 1998, LEDCO carried out the first known sediment study on Nyadi Khola at the location close to Naiche village, gauge site no.1. The outcome of the study is detailed in a report called "Nyadi Hydropower Project- Sediment study, monsoon 1998” (report by BPC Hydroconsult). For the 1999 monsoon a second sediment study in the Nyadi Khola was carried out.
The scope of the study was to know:
The concentration of the suspended sediment particles The presence of sand particles (sand break analysis) The particle size distribution The mineral content of the sediments
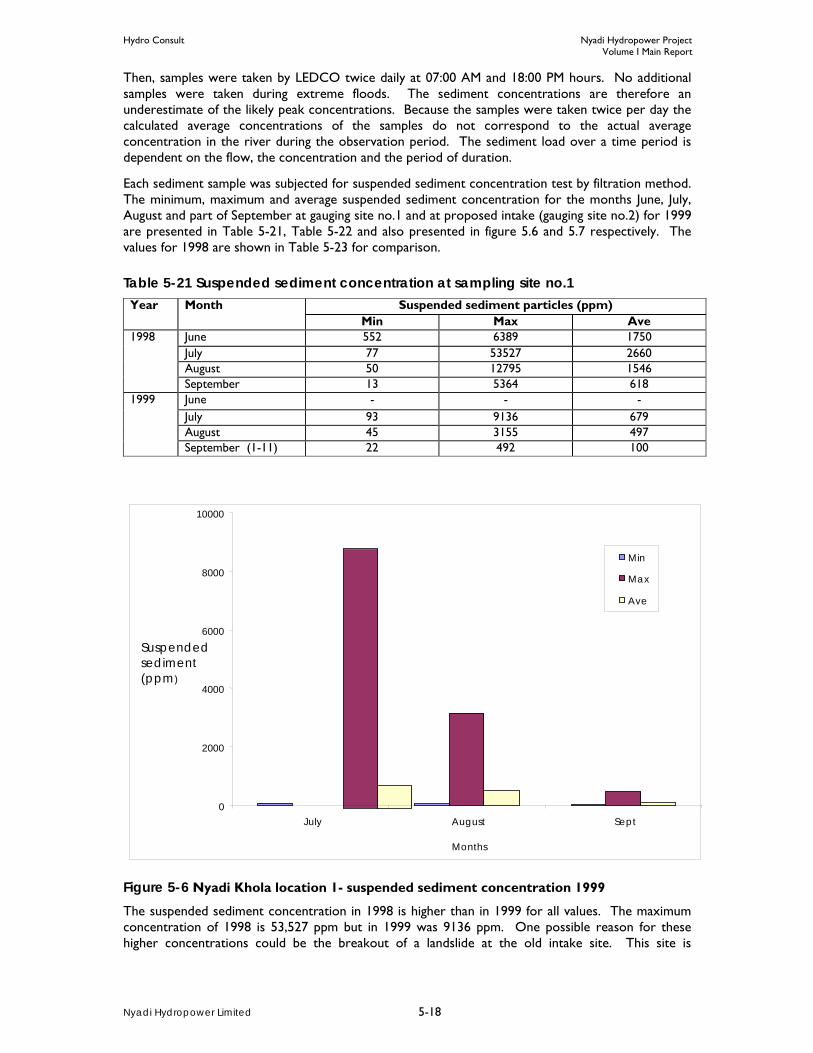
Hydro Consult Nyadi Hydropower Project Volume I Main Report
Nyadi Hydropower Limited 5-18
Then, samples were taken by LEDCO twice daily at 07:00 AM and 18:00 PM hours. No additional samples were taken during extreme floods. The sediment concentrations are therefore an underestimate of the likely peak concentrations. Because the samples were taken twice per day the calculated average concentrations of the samples do not correspond to the actual average concentration in the river during the observation period. The sediment load over a time period is dependent on the flow, the concentration and the period of duration.
Each sediment sample was subjected for suspended sediment concentration test by filtration method. The minimum, maximum and average suspended sediment concentration for the months June, July, August and part of September at gauging site no.1 and at proposed intake (gauging site no.2) for 1999 are presented in Table 5-21, Table 5-22 and also presented in figure 5.6 and 5.7 respectively. The values for 1998 are shown in Table 5-23 for comparison.
Table 5-21 Suspended sediment concentration at sampling site no.1 Year Month Suspended sediment particles (ppm)
Min Max Ave 1998 June 552 6389 1750
July 77 53527 2660 August 50 12795 1546 September 13 5364 618
1999 June - - - July 93 9136 679 August 45 3155 497 September (1-11) 22 492 100
Figure 5-6 Nyadi Khola location 1- suspended sediment concentration 1999
The suspended sediment concentration in 1998 is higher than in 1999 for all values. The maximum concentration of 1998 is 53,527 ppm but in 1999 was 9136 ppm. One possible reason for these higher concentrations could be the breakout of a landslide at the old intake site. This site is
0
2000
4000
6000
8000
10000
July August Sept
Months
Suspended sediment (ppm)
Min
Max
Ave
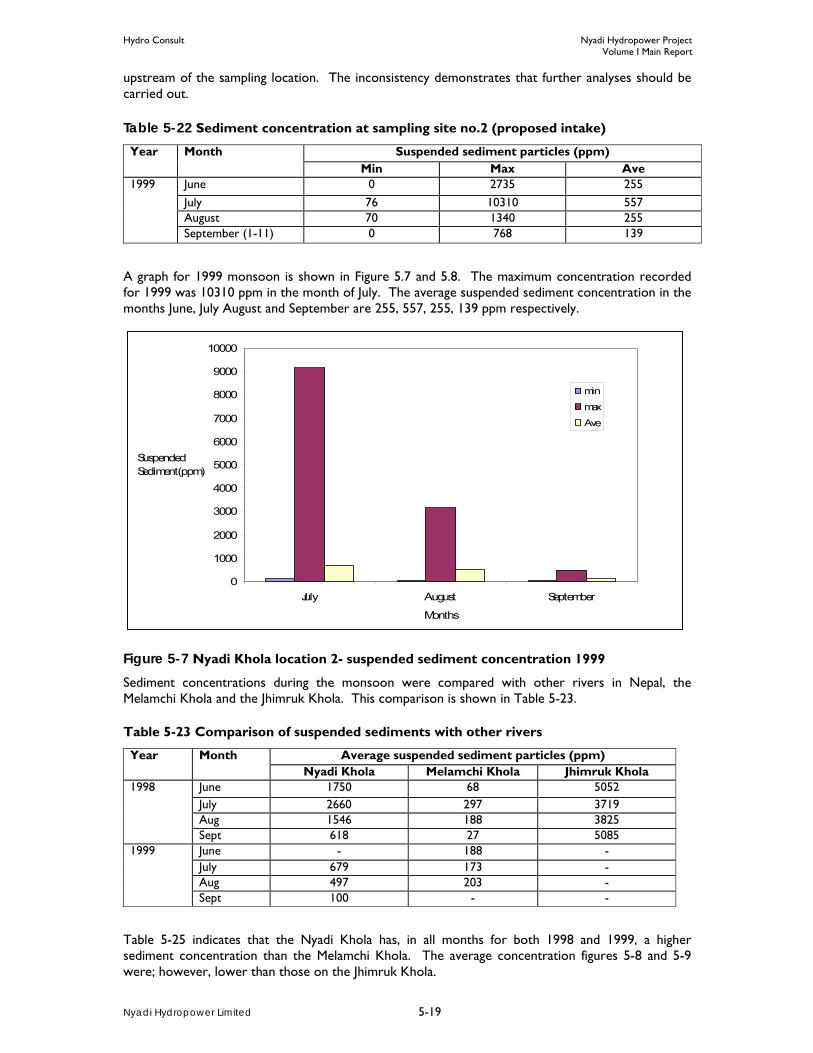
Hydro Consult Nyadi Hydropower Project Volume I Main Report
Nyadi Hydropower Limited 5-19
upstream of the sampling location. The inconsistency demonstrates that further analyses should be carried out.
Table 5-22 Sediment concentration at sampling site no.2 (proposed intake)
Year Month Suspended sediment particles (ppm) Min Max Ave
1999 June 0 2735 255 July 76 10310 557 August 70 1340 255 September (1-11) 0 768 139
A graph for 1999 monsoon is shown in Figure 5.7 and 5.8. The maximum concentration recorded for 1999 was 10310 ppm in the month of July. The average suspended sediment concentration in the months June, July August and September are 255, 557, 255, 139 ppm respectively.
0
1000
2000
3000
4000
5000
6000
7000
8000
9000
10000
July August September
Months
Suspended Sediment(ppm)
min
max
Ave
Figure 5-7 Nyadi Khola location 2- suspended sediment concentration 1999
Sediment concentrations during the monsoon were compared with other rivers in Nepal, the Melamchi Khola and the Jhimruk Khola. This comparison is shown in Table 5-23.
Table 5-23 Comparison of suspended sediments with other rivers
Year Month Average suspended sediment particles (ppm) Nyadi Khola Melamchi Khola Jhimruk Khola
1998 June 1750 68 5052 July 2660 297 3719 Aug 1546 188 3825 Sept 618 27 5085
1999 June - 188 - July 679 173 - Aug 497 203 - Sept 100 - -
Table 5-25 indicates that the Nyadi Khola has, in all months for both 1998 and 1999, a higher sediment concentration than the Melamchi Khola. The average concentration figures 5-8 and 5-9 were; however, lower than those on the Jhimruk Khola.
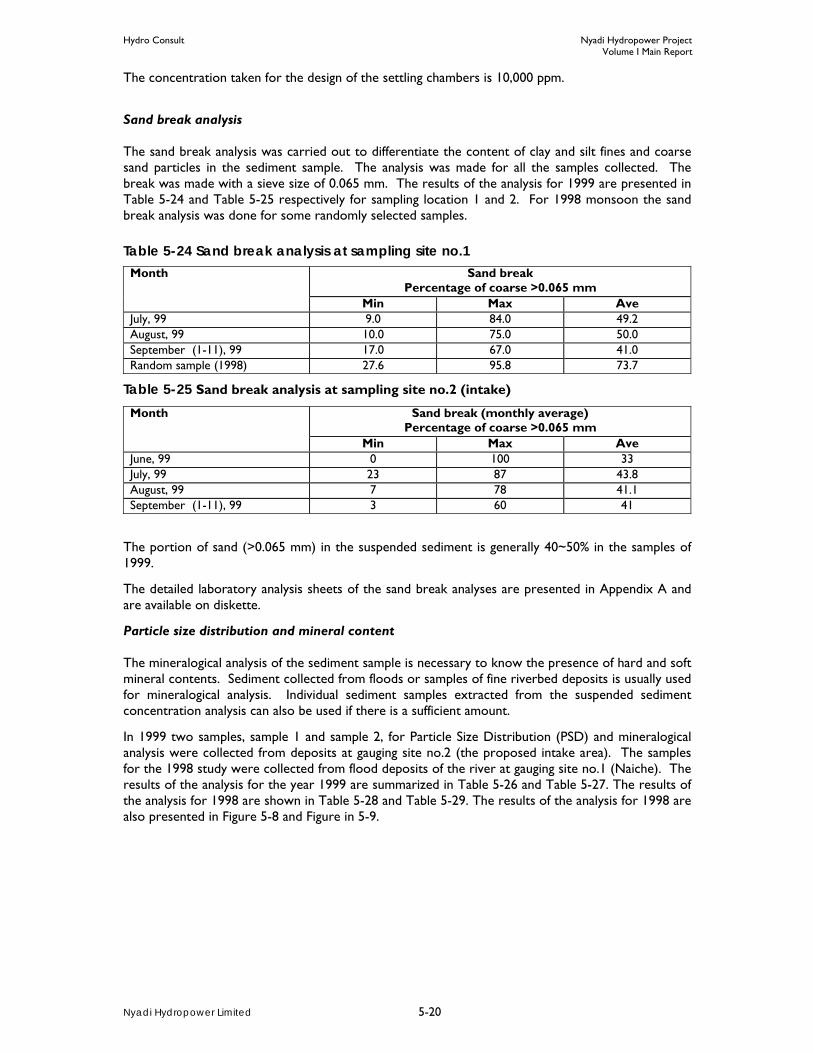
Hydro Consult Nyadi Hydropower Project Volume I Main Report
Nyadi Hydropower Limited 5-20
The concentration taken for the design of the settling chambers is 10,000 ppm.
Sand break analysis The sand break analysis was carried out to differentiate the content of clay and silt fines and coarse sand particles in the sediment sample. The analysis was made for all the samples collected. The break was made with a sieve size of 0.065 mm. The results of the analysis for 1999 are presented in Table 5-24 and Table 5-25 respectively for sampling location 1 and 2. For 1998 monsoon the sand break analysis was done for some randomly selected samples.
Table 5-24 Sand break analysis at sampling site no.1 Month Sand break
Percentage of coarse >0.065 mm Min Max Ave
July, 99 9.0 84.0 49.2 August, 99 10.0 75.0 50.0 September (1-11), 99 17.0 67.0 41.0 Random sample (1998) 27.6 95.8 73.7
Table 5-25 Sand break analysis at sampling site no.2 (intake)
Month Sand break (monthly average) Percentage of coarse >0.065 mm
Min Max Ave June, 99 0 100 33 July, 99 23 87 43.8 August, 99 7 78 41.1 September (1-11), 99 3 60 41
The portion of sand (>0.065 mm) in the suspended sediment is generally 40~50% in the samples of 1999.
The detailed laboratory analysis sheets of the sand break analyses are presented in Appendix A and are available on diskette.
Particle size distribution and mineral content The mineralogical analysis of the sediment sample is necessary to know the presence of hard and soft mineral contents. Sediment collected from floods or samples of fine riverbed deposits is usually used for mineralogical analysis. Individual sediment samples extracted from the suspended sediment concentration analysis can also be used if there is a sufficient amount.
In 1999 two samples, sample 1 and sample 2, for Particle Size Distribution (PSD) and mineralogical analysis were collected from deposits at gauging site no.2 (the proposed intake area). The samples for the 1998 study were collected from flood deposits of the river at gauging site no.1 (Naiche). The results of the analysis for the year 1999 are summarized in Table 5-26 and Table 5-27. The results of the analysis for 1998 are shown in Table 5-28 and Table 5-29. The results of the analysis for 1998 are also presented in Figure 5-8 and Figure in 5-9.
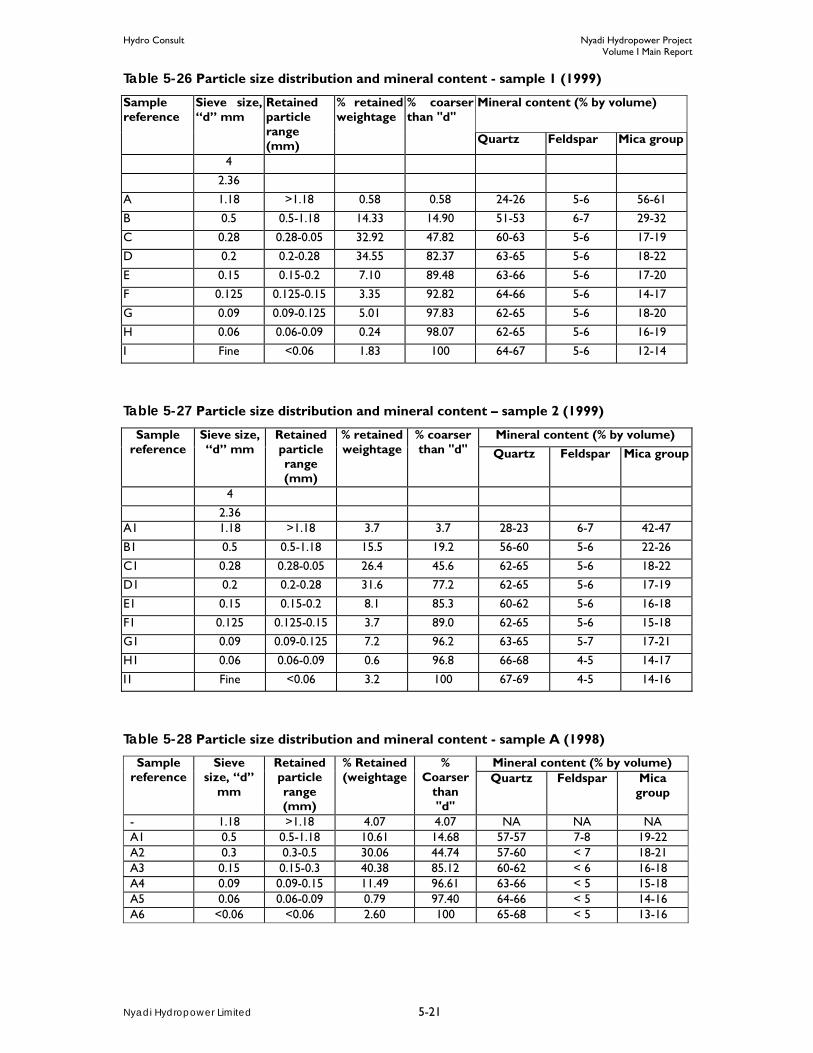
Hydro Consult Nyadi Hydropower Project Volume I Main Report
Nyadi Hydropower Limited 5-21
Table 5-26 Particle size distribution and mineral content - sample 1 (1999)
Sample reference
Sieve size, “d” mm
Retained particle range (mm)
% retained weightage
% coarser than "d"
Mineral content (% by volume)
Quartz Feldspar Mica group
4
2.36
A 1.18 >1.18 0.58 0.58 24-26 5-6 56-61
B 0.5 0.5-1.18 14.33 14.90 51-53 6-7 29-32
C 0.28 0.28-0.05 32.92 47.82 60-63 5-6 17-19
D 0.2 0.2-0.28 34.55 82.37 63-65 5-6 18-22
E 0.15 0.15-0.2 7.10 89.48 63-66 5-6 17-20
F 0.125 0.125-0.15 3.35 92.82 64-66 5-6 14-17
G 0.09 0.09-0.125 5.01 97.83 62-65 5-6 18-20
H 0.06 0.06-0.09 0.24 98.07 62-65 5-6 16-19
I Fine <0.06 1.83 100 64-67 5-6 12-14
Table 5-27 Particle size distribution and mineral content – sample 2 (1999)
Sample reference
Sieve size, “d” mm
Retained particle range (mm)
% retained weightage
% coarser than "d"
Mineral content (% by volume) Quartz Feldspar Mica group
4
2.36 A1 1.18 >1.18 3.7 3.7 28-23 6-7 42-47
B1 0.5 0.5-1.18 15.5 19.2 56-60 5-6 22-26
C1 0.28 0.28-0.05 26.4 45.6 62-65 5-6 18-22
D1 0.2 0.2-0.28 31.6 77.2 62-65 5-6 17-19
E1 0.15 0.15-0.2 8.1 85.3 60-62 5-6 16-18
F1 0.125 0.125-0.15 3.7 89.0 62-65 5-6 15-18
G1 0.09 0.09-0.125 7.2 96.2 63-65 5-7 17-21
H1 0.06 0.06-0.09 0.6 96.8 66-68 4-5 14-17
I1 Fine <0.06 3.2 100 67-69 4-5 14-16
Table 5-28 Particle size distribution and mineral content - sample A (1998)
Sample reference
Sieve size, “d”
mm
Retained particle range (mm)
% Retained (weightage
% Coarser
than "d"
Mineral content (% by volume) Quartz Feldspar Mica
group
- 1.18 >1.18 4.07 4.07 NA NA NA A1 0.5 0.5-1.18 10.61 14.68 57-57 7-8 19-22 A2 0.3 0.3-0.5 30.06 44.74 57-60 < 7 18-21 A3 0.15 0.15-0.3 40.38 85.12 60-62 < 6 16-18 A4 0.09 0.09-0.15 11.49 96.61 63-66 < 5 15-18 A5 0.06 0.06-0.09 0.79 97.40 64-66 < 5 14-16 A6 <0.06 <0.06 2.60 100 65-68 < 5 13-16
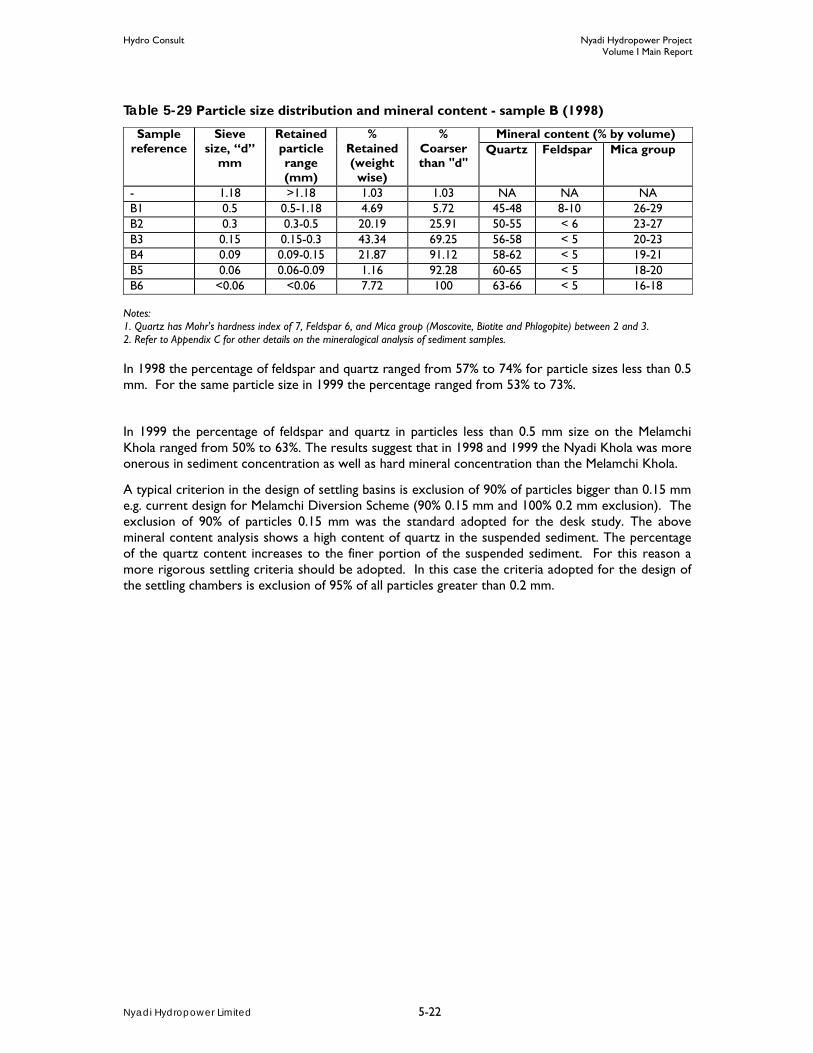
Hydro Consult Nyadi Hydropower Project Volume I Main Report
Nyadi Hydropower Limited 5-22
Table 5-29 Particle size distribution and mineral content - sample B (1998)
Sample reference
Sieve size, “d”
mm
Retained particle range (mm)
% Retained (weight
wise)
% Coarser than "d"
Mineral content (% by volume) Quartz Feldspar Mica group
- 1.18 >1.18 1.03 1.03 NA NA NA B1 0.5 0.5-1.18 4.69 5.72 45-48 8-10 26-29 B2 0.3 0.3-0.5 20.19 25.91 50-55 < 6 23-27 B3 0.15 0.15-0.3 43.34 69.25 56-58 < 5 20-23 B4 0.09 0.09-0.15 21.87 91.12 58-62 < 5 19-21 B5 0.06 0.06-0.09 1.16 92.28 60-65 < 5 18-20 B6 <0.06 <0.06 7.72 100 63-66 < 5 16-18
Notes: 1. Quartz has Mohr's hardness index of 7, Feldspar 6, and Mica group (Moscovite, Biotite and Phlogopite) between 2 and 3. 2. Refer to Appendix C for other details on the mineralogical analysis of sediment samples.
In 1998 the percentage of feldspar and quartz ranged from 57% to 74% for particle sizes less than 0.5 mm. For the same particle size in 1999 the percentage ranged from 53% to 73%.
In 1999 the percentage of feldspar and quartz in particles less than 0.5 mm size on the Melamchi Khola ranged from 50% to 63%. The results suggest that in 1998 and 1999 the Nyadi Khola was more onerous in sediment concentration as well as hard mineral concentration than the Melamchi Khola.
A typical criterion in the design of settling basins is exclusion of 90% of particles bigger than 0.15 mm e.g. current design for Melamchi Diversion Scheme (90% 0.15 mm and 100% 0.2 mm exclusion). The exclusion of 90% of particles 0.15 mm was the standard adopted for the desk study. The above mineral content analysis shows a high content of quartz in the suspended sediment. The percentage of the quartz content increases to the finer portion of the suspended sediment. For this reason a more rigorous settling criteria should be adopted. In this case the criteria adopted for the design of the settling chambers is exclusion of 95% of all particles greater than 0.2 mm.

Hydro Consult Nyadi Hydropower Project Volume I Main Report
Nyadi Hydropower Limited 5-23
0
10
20
30
40
50
60
70
1.18 0.5 0.28 0.2 0.15 0.125 0.09 0.06 Finer
Paricle size, sieve size (mm)
perc
etag
e of
tota
l sam
ple
QuartzFeldsparMica Group
Figure 5-8 Mineralogical analysis of Fine River deposits – sample 1
0
10
20
30
40
50
60
70
80
1.18 0.5 0.28 0.2 0.15 0.125 0.09 0.06 Finer
Paricle size, sieve diameter (mm)
Pece
tage
of t
otal
sam
ple
QuatzFeldsparMica group
Figure 5-9 Mineralogical analyses of fine river deposits – sample 2
5.9.3 Sediment analysis
Hydro Lab Pvt. Ltd. carried out the laboratory analysis of the sediment samples of Nyadi Hydropower Project in 2008 and 2009. Furthermore the sediment analysis of year 2010 is ongoing.

Hydro Consult Nyadi Hydropower Project Volume I Main Report
Nyadi Hydropower Limited 5-24
Suspended sediment concentration In this review phase, sediment sample collection is going on for physical model study and for further sediment analysis. Sediment transport in most Himalayan Rivers is a natural phenomenon. The sediment transport pattern in the river is complex. Particle size may range from fine clay particles which originate from glaciers to boulders which may weigh tens of tones. Very little information is known about the sediment transport pattern in the Nyadi River. Removal of sediment particles from the diverted water is very important for any hydropower plant. A collection, study and analysis of sediment data are therefore imperative and being carried out for the purpose of detail design. Hydro Lab Pvt. Ltd. conducted the laboratory analysis of the sediment samples of Nyadi Hydropower Project in 1998 and 1999. Suspended sediment concentration in 1998 is higher than in 1999 for all values. The maximum concentration 1999 was 9136 ppm. The inconsistency demonstrates that further analyses should be carried out. Therefore, the laboratory analysis of the sediment samples in 2008 , 2009 and 2010 were conducted. Furthermore the sediment analysis of year 2011 is going on. The results of sediment analysis at proposed intake site (2008, 2009 and 2010(partial)) are summarized below:
o The average sediment concentration is calculated 464.59 ppm.
o It was observed that the sediment concentration among the 412 samples only 2 samples has exceeded the 10,000 ppm.
o On an average 86 percent of suspended sediment contain sand fraction and 14 percent of it contains fine fraction.
o It was also observed that about 79 percent of suspended sediment contain hard minerals and remaining 21 percent are carbonates, mica, chlorites and other minerals.

Hydro Consult Nyadi Hydropower Project Volume I Main Report
Nyadi Hydropower Limited 6-1
6. WATER SHARING There is no downstream water right issues related to the river use. Only minimum downstream release will need to be provided for environmental reason. The EIA study of the project will address all these and the other water right issues. The assessment for downstream release for environmental aspect has been done in this study. The downstream release @ 10 % of the driest mean monthly flow (0.31m3/sec) will need to be provided to the downstream of the intake.

Hydro Consult Nyadi Hydropower Project Volume I Main Report
Nyadi Hydropower Limited 7-1
7. GEOLOGY AND GEOTECHNICAL
7.1 Previous study Hagen (1969) reported that the Nawakot Nappes of central Nepal are made up of low-grade metamorphic rocks separated by the medium- to high-grade metamorphic rocks of the Kathmandu Nappes. The boundary between them was called the Main Central Thrust (MCT).
A team of geologists from Japan came to Nepal and studied various parts of the country. They produced a report supervised by S. Hashimoto. In this report, the area around Marsyangdi was studied by Ohta et al. (1973). They identified the crystalline schist, mica gneiss, garnet-mica gneiss, kyanite-mica gneiss, and augen gneiss.
Based on aerial photo interpretation and fieldwork, Stöcklin and Bhattarai (1977) and Stöcklin (1980) divided the rocks of central Nepal into the Nawakot Complex and the Kathmandu Complex separated by the Mahabharat Thrust (MT). They correlated the MT with the MCT in the north. They also prepared large-scale (1:63000) geological maps of central Nepal.
Colchen et al. (1981, 1986) carried out detailed mapping of the area between the Kaligandaki River in the west and the Marsyangdi River in the east and delineated the MCT in the project area (Figure 7-1 Part of the map of Kaligandaki–Marsyangdi area (Colchen et al. 1981)).
Figure 7-1 Part of the map of Kaligandaki–Marsyangdi area (Colchen et al. 1981)
7.2 Regional geology The rocks of the Project area (Figure 7-2 and Figure 7-3) are classified into two large units named as the Lesser Himalayan succession and the Higher Himalayan succession. The essential difference between the two rock successions is in their lithostratigraphy. The Higher Himalayan succession is made up of medium- to high-grade metamorphic rocks such as sillimanite gneisses, kyanite schists and gneisses, and augen and banded gneisses, whereas the Lesser Himalayan succession contains essentially phyllites, quartzites, garentiferous schists, graphitic schists, and marbles. The Higher
MCT
Higher Himalayan Succession
Lesser Himalayan Succession
MCT
N
0 4 km2
Scale

Hydro Consult Nyadi Hydropower Project Volume I Main Report
Nyadi Hydropower Limited 7-2
Himalayan rocks overlie the Lesser Himalayan rocks along the Main Central Thrust (Figure 7-2 & Figure 7-3).
The Lesser Himalayan metamorphic rocks in the Marsyangdi valley constitute a rather monotonous and thick succession, which was called Série de Kunchha by Bordet (1961). The Project area lies in the north flank of the Kunchha–Gurkha Anticlinorium zone of Ohta et al. (1973) or Kunchha–Gorkha Anticlinorium of Pêcher (1977). The rocks belong to the Midland Metasediment Group and Himalayan Gneisses of Arita et al. (1973). A large portion of the present area belongs to the Kuncha Formation, Fagfog Quartzite, Dandagaon Phyllites, and Benighat Slates of Stöcklin (1980), whereas the area above the MCT is represented by his Bhimphedi Groups of rocks with augen and banded gneisses. Colchen et al. (1981, 1986) made a geological map of the Kaligandaki–Marsyangdi area. Part of the map is depicted in Figure 7-1.
The main lithological units in the Project area are the following from south to north, respectively:
− Kuncha Formation, − Garnet Schist, − Graphitic Schist, − Carbonates, − Kyanite Schists and Quartzites, and − Banded and Augen Gneisses.
7.2.1 Kuncha Formation
The rocks of the Kuncha Formation are extensively distributed in the area south of Khudi. They are delimited in the north by pale yellow quartzites and alternating grey-green garnetiferous schists and quartzites. When weathered, the Kuncha Formation yields orange, red, and yellow-brown coloured soil.
The Kuncha Formation is a thick (more than 4 km) succession of green-grey, dark grey, and bluish grey phyllite, phyllitic metasandstone, granular phyllite, and quartzite. Sometimes, tiny muscovite flakes (0.5–1 mm) are observed along the foliation plane in phyllite and metasandstone. Rarely, pebbly phyllite with stretched clasts is present. Occasionally, a few amphibolite bands are also found in it.
7.2.2 Garnet Schist
The rocks between Khudi and Nyadi Bazaar are represented by garnet-muscovite-biotite schists and quartzites. They give rise to light grey to grey coloured soil. The size of garnets in the schist varies widely. Often, the garnets are from 1 to 2 mm in diameter, but may reach up to 6 mm. Frequently rolled garnets of 2–5 mm in diameter are also seen. They are surrounded by about 1 cm long lens-shaped biotite and muscovite envelopes. Generally, grey and dark grey schist and quartzite bands alternate with each other and their thickness varies from 10 to 30 cm and rarely exceeds 5 m. There are also a few bands (1–2 m thick) of graphitic schist and white quartzite. Numerous generations of quartz veins are common in the schist and often they are stretched and boudinaged. Rare pegmatite veins with tourmaline are also seen.
The grade of metamorphism in this unit varies widely. Around Khudi, dark grey slate, phyllite, and garnetiferous schist are observed alternating with crystalline dolomite, marble, and calcareous quartzite, whereas in the area north of Tunikharka large kyanite crystals are encountered in the quartz veins.
7.2.3 Graphitic Schist
The succession of garnetiferous schist is followed upsection by intensely deformed and gently dipping zone of graphitic schist. When weathered, the graphitic schist gives rise to orange, red, brown, and grey soil.
In the graphitic schist unit, grey, green-grey, light grey, and white calcareous schist is alternating with light grey, green-grey, and white calcareous quartzite, dolomitic marble, and dark grey to black

Hydro Consult Nyadi Hydropower Project Volume I Main Report
Nyadi Hydropower Limited 7-3
graphitic schist. Quartz and calcite veins of several generations ramify the rocks. In the area NW of Nyadi Bazaar, kyanite blades are seen in the graphitic schist.
7.2.4 Carbonates
In the area NW of Nyadi Bazaar, a thick carbonate band is observed (Figure 7-2) in the vicinities of Kaule (Figure 7-4) and Usta. In this area, the calcareous quartzite and dolomite bands are from 10 cm to 1.5 m thick and are alternating with 1 mm to 50 cm thick schist bands. Light grey, white, and cream coloured quartzite bands are up to 5 m thick. Generally, schist, quartzite, and marble bands are alternating.

Hydro Consult Nyadi Hydropower Project Nyadi Hydropo Volume I Main Report Volume I Main R
Nyadi Hydropower Limited
7-4
Figure 7-2 Regional geological map of the Nyadi Hydropower Project area

Hydro Consult Nyadi Hydropower Project Volume I Main Report
Nyadi Hydropower Limited
7-5
Figure 7-3 Geological cross-section of the Nyadi Hydropower area showing main lithological units
7.2.5 Kyanite Schists and Quartzites
The Main Central Thrust (MCT) abruptly overrides the carbonates (Figure 7-2, Figure 7-3 & Figure 7-4) and brings with it grey and dark grey, parallel-banded, coarse-grained, schist and quartzite containing kyanite, garnet, biotite, K-feldspar, muscovite, and quartz. Generally, the rock is massive to blocky. In the schist, kyanite and garnet crystalloblasts range in size from less than 1 mm to 5 mm.
7.2.6 Banded and Augen Gneisses
The banded and augen gneisses occupy most of the area north of Bahundanda and east of Thulibesi. They are represented by highly deformed and disrupted leucocratic bands as well as lenses containing feldspar, quartz, and muscovite alternating with melanocratic bands of biotite, tourmaline, and hornblende. They exhibit flow structures and many small-scale folds.

Hydro Consult Nyadi Hydropower Project Volume I Main Report
Nyadi Hydropower Limited
7-6
Figure 7-4 Carbonate bands and graphitic schist exposed on the right bank of the Marsyangdi River at Kaule
7.2.7 Geology of the project area
In the Project area (Figure 7-2, Figure 7-3), the Lesser and Higher Himalayan rocks are represented by medium- to high-grade metamorphic of Precambrian age. Owing to metamorphism, intense deformation, and changes in facies as well as the presence of various types of gneisses, it is not possible to trace out all the rock formations of central Nepal. Therefore, the following rock units are separated on the basis of stratigraphy and lithology (Table 7-1, Figure 7-2).
Table 7-1 Main lithological subdivisions in the Project area
Rock unit Lithology Thickness, m Age Banded and augen gneisses
Grey to dark grey feldspathic schist and banded gneiss with bands of quartzite; sporadically augen gneisses and highly lineated gneisses are also observed. Garnet and kyanite abundant
>2000
Precambrian MCT
Kyanite schist and quartzite
Light grey to dark grey, intensely deformed, and folded schists and quartzites containing kyanite and garnet
800 – 1000
Carbonates Grey to light grey, very thick-banded, massive to laminated marble with mica parting and schist bands with garnet and kyanite
600 – 800 Precambrian Graphitic
schist Thin- to thick-banded, light grey to grey, laminated quartzite with mica partings, and bands of feldspathic schist, garnetiferous biotite schist and gneiss with sporadic kyanite zone
400 – 500
Garnet schist and quartzite
Dark grey feldspathic schist, banded gneiss, and laminated quartzite with garnet and rate kyanite
>2000 m
A short lithological description of rock types representing the above-mentioned formations and units at respective location points are given in Appendix C. The geological cross-section through the various rock successions of the Project area is depicted in ERT maps in Appendix C. A short description of the rock units which lie in the project area is the following.
7.2.8 Banded and Augen Gneisses
The banded and augen gneisses are well-exposed at Nana, Naiche, and in the banks of the Nyadi
Graphitic schist
Carbonates

Hydro Consult Nyadi Hydropower Project Volume I Main Report
Nyadi Hydropower Limited
7-7
River at the Naiche suspension bridge (Figure 7-5). The schist is dominant in and around Nana (Surge shaft area) whereas gneisses are abundant at Naiche and in the intake area. The rocks of this unit are represented by grey to dark grey, coarse-grained, thickly banded to massive, medium strong to strong schists and gneisses. Kyanite and garnet are abundant in this rock unit. The contact with the underlying kyanite schist and quartzite is a gradual transition. The thickness in the type area is more than 2000 m. The distribution of different rock types is the following: Schists = 40–50% and Gneisses = 50–60%.
Figure 7-5: Exposures of massive banded and augen gneisses, schists and quartzites at the Naiche and Tarachowk bridges
This rock unit is expected throughout the tunnel alignment, from intake to surge shaft. Expected rock quality of this formation is fair to good. However, due to a high percentage of mica and schist bands, rock quality may be degrading in some sections of the tunnel alignment.
7.2.9 Kyanite Schists and Quartzites
The schists and quartzites are well exposed in the both banks of the Nyadi River below Tarachok, east of Thulibesi, and below Nana. They are composed essentially of very thick-banded to massive, medium- to coarse-grained, grey, strong quartzite and medium strong schist. The quartzite is frequently laminated (Figure 7-5). Garnet is abundant. The total thickness of this unit is about 800–1,000 m. This rock unit will not be encountered in the headrace tunnel and surge shaft area. The distribution of different rock types is as follows: Schist = 40 – 50% and Quartzite = 50 – 60%.
7.2.10 Palaeochannel deposits
One of the unique features of the Project area is the occurrence of a thick (from 50 to about 200 m) palaeochannel deposits (Figure 7-2 & Figure 7-3). It is distributed around Nana (at the surge shaft, penstock, and powerhouse), west of Bhirpustung, around Thulibesi, in the vicinity of Bahundanda and Tarachok. The deposits contain large (up to 5 m and more) subangular boulders of augen gneiss, banded gneiss, and marble.
They also contain fine (sandy to silty), light grey to white matrix which is moderately compact (Figure 7-6). The proportion of matrix and the clasts varies widely. Generally the matrix constitutes to about 50 to 60% of the volume. There are also sporadic mudstone lumps in the palaeochannel deposits, especially in the area west of Thulibesi and Bahundanda.
Massive gneisses Massive schist and quartzite
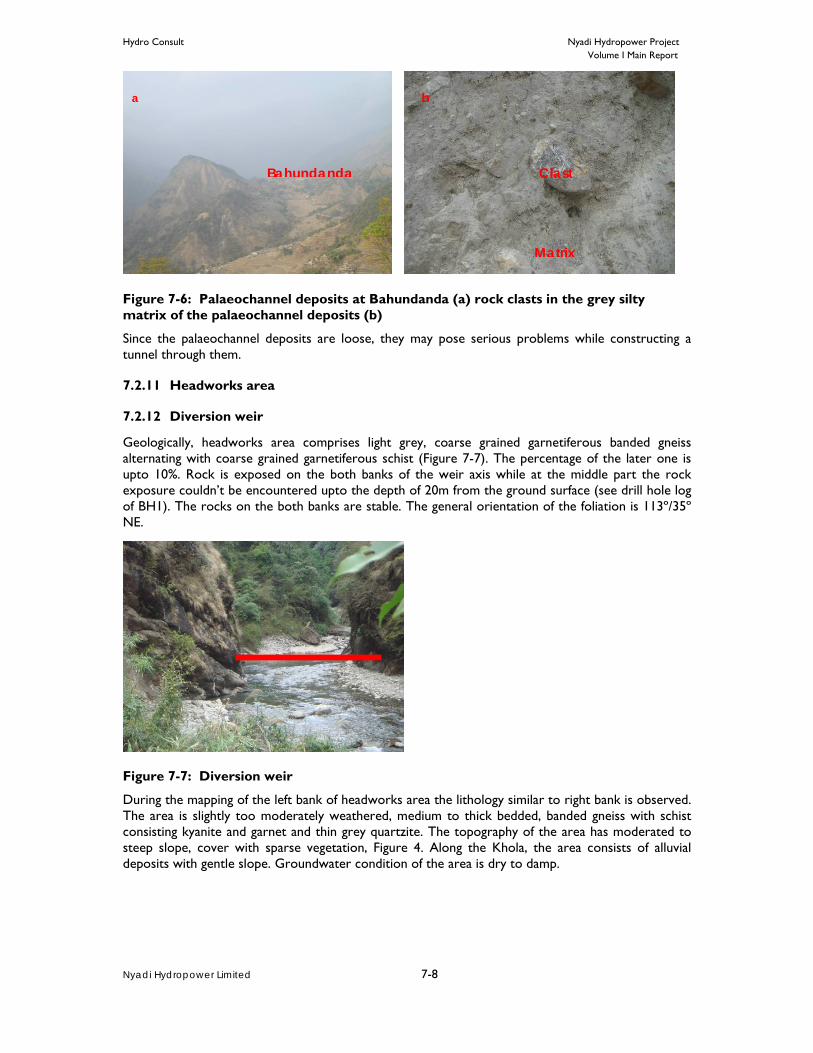
Hydro Consult Nyadi Hydropower Project Volume I Main Report
Nyadi Hydropower Limited
7-8
Figure 7-6: Palaeochannel deposits at Bahundanda (a) rock clasts in the grey silty matrix of the palaeochannel deposits (b)
Since the palaeochannel deposits are loose, they may pose serious problems while constructing a tunnel through them.
7.2.11 Headworks area
7.2.12 Diversion weir
Geologically, headworks area comprises light grey, coarse grained garnetiferous banded gneiss alternating with coarse grained garnetiferous schist (Figure 7-7). The percentage of the later one is upto 10%. Rock is exposed on the both banks of the weir axis while at the middle part the rock exposure couldn’t be encountered upto the depth of 20m from the ground surface (see drill hole log of BH1). The rocks on the both banks are stable. The general orientation of the foliation is 113º/35º NE.
Figure 7-7: Diversion weir
During the mapping of the left bank of headworks area the lithology similar to right bank is observed. The area is slightly too moderately weathered, medium to thick bedded, banded gneiss with schist consisting kyanite and garnet and thin grey quartzite. The topography of the area has moderated to steep slope, cover with sparse vegetation, Figure 4. Along the Khola, the area consists of alluvial deposits with gentle slope. Groundwater condition of the area is dry to damp.
Bahundanda
a
Clast
Matrix
b

Hydro Consult Nyadi Hydropower Project Volume I Main Report
Nyadi Hydropower Limited
7-9
Figure 7-8 Photograph showing geology and geomorphology of the right and left bank of Nyadi Khola towards upstream from the powerhouse of Suiri Hydroelectric Project
Based on the computed RMR and Q values the rock mass could be classified into good to poor rock, table 7-2. Similarly, Geological Strength Index for the exposed rock in left bank area is 64.
Table 7-2 Rock mass quality of Left bank of Headworks area (based on surface rating)
Classification system Rating Rock class RMR 62 Good rock
Q value 3.4 Poor rock
7.2.13 Inlet Portal, approach tunnel and settling chamber
The approach tunnel and settling chamber is located underground. The area around headworks consists of light grey, slightly weathered, moderately strong, banded gneiss intercalated with the garnetiferouns schist. The exposed rock is oriented with 1310/400 NE.
7.2.14 Headrace tunnel
The proposed 3,955 m long headrace tunnel passes through the Banded and Augen gneisses consisting of gneisses and schists (97%), and shear zones (3%) (Drawing No. 1220/02/20G01, 2 and 3; Appendix K). Most of the tunnel alignment (060º–080º) will be oriented oblique (40º–60º) to the foliation plane (090º–130º) (Figure 7-17). In addition to this, a very small stretch around the surge shaft area will be almost perpendicular to the foliation plane. Hence, the tunnel driving conditions are fair.
Based on the surface rock mass classification, about 20% of the headrace tunnel length runs through very poor to extremely poor rock and 80% through fair to good rock.
The orientation of foliation is 090º–130º/25º–40º N with two prominent joint sets of attitude 010º– 015º/80º–82ºE and 110º–115º/65º–70º SW.
7.2.15 Stretch from intake to Naiche adit
The rocks in this stretch are grey to dark grey, coarse-grained, thickly banded to massive, medium

Hydro Consult Nyadi Hydropower Project Volume I Main Report
Nyadi Hydropower Limited
7-10
strong to strong schists and gneisses. Gneisses are more dominant in this stretch. Most of major shear or weak zones (Table 7-7) are located between the intake and Naiche adit of the headrace tunnel (Drawing No. 1220/02/20G01, 2 and 3; Appendix K). The weak zones occupy about 90 m length of the headrace tunnel alignment. They will create problems like overbreak, rock squeezing, and water ingress. In addition, more than two steeply dipping faults are likely to be encountered in the tunnel and they will induce water ingress problems.
7.2.16 Stretch from Naiche adit to Nana valley
The major rock types in this stretch of tunnel are gneisses and schists. In general, the rock mass quality in this stretch is of poor to good category up to the start of the Nana valley except in faults and shear zones. According to the geophysical survey and surface geological data, the valley around the Nana village is covered by the deep palaeochannel deposits which may be encountered at the tunnel level. The coverage length of the deposits on the surface over the tunnel alignment is about 800 m (Drawing No. 1220/02/20G01, 2 and 3; Appendix K).
In this section, the tunnel excavation may be problematic below the Nana valley due to either shallow rock cover or the occurrence of palaeochannel deposits. Sub-surface investigation such as drilling is necessary especially in crossing of the Nana valley to find out the depth of rock head. No major shear or weak zones were observed in between the Naiche Adit and Nana valley. However, there are three vertical faults in this stretch which will create water ingress problems. In addition, 10–50 cm thick weak or shear zones along the foliation are also common within this rock unit.
Water leakage problems are expected in this section (Figure 7-9) due to the proximity of the tunnel alignment towards the valley with open and steep joints. Hence, grouting is necessary to prevent water leakage.
Figure 7-9 View of headrace tunnel level between Naiche adit and Nana
7.2.17 Stretch between Nana valley, surge shaft, and outlet portal
The Nana valley is covered by the palaeochannel deposits. About 50 m high rock cliff is present near the surge shaft and outlet portal area. The exposed rocks are grey to dark grey, coarse-grained, thickly banded to massive, medium strong to strong schists and gneisses.
Tunnel level
Nana

Hydro Consult Nyadi Hydropower Project Volume I Main Report
Nyadi Hydropower Limited
7-11
According to the 2-D Electric Resistivity Tomography (ERT) data, the thickness of the palaeochannel deposits ranges from 50 to 110 m along the tunnel alignment (Drawing No. 1220/02/20G01, 2 and 3; Appendix K). The expected minimum rock cover along the tunnel section is about 40 m where the maximum depth of palaeochannel is 110 m. However, the depth of palaeochannel may be more than expected. In that case, the tunnel may lie in the palaeochannel deposits, and there could be serious construction problems.
A tunnel outlet portal for the surface penstock is proposed in the palaeochannel deposits just below about 50 m high rock cliff. To meet the rock face at the outlet portal, the palaeochannel deposits of about 35 m thickness should have to be excavated from the tunnel invert level.
7.2.18 Surge shaft
Surge shaft area is located at the rock cliff of Nana village. The exposed rock is grey to dark grey coarse grained kyanite-garnet schist and gneiss. The flat area around the outlet portal is whit to light grey palaeochannel deposit with gneiss boulders. The attitude of foliation is 1060/350 NE.
7.2.19 Drop shaft, powerhouse and tailrace option
Drop shaft, powerhouse, and tailrace option were proposed in the Feasibility Study. Geophysical survey at the area shows vertical penstock alignment is favorable for the underground construction as it can avoid shear zones and palaeochannel deposits. However, the possibility of occurrence of palaeochannel deposits or weak zone at the depth of penstock and tailrace tunnel is still there. This may create major problems such as tunnel collapse and construction delay resulting the project cost high. It is also a big concern to the safety of tunnel crew. Hence, underground option has uncertainities which will increase the construction time and project cost.
7.2.20 Surface penstock for surface powerhouse option
The surface penstock passes mainly through soil (palaeochannel deposits and colluvium) except about 200 m stretch in steeply dipping (<70°) rock cliff. The first stretch, about 100 m of the penstock alignment, runs through a steeply standing slope (<60°).
Likewise, the segment between the first stretch and start of rock cliff is moderately to gently dipping (<25°) and it contains colluvium deposits and palaeochannel sediments. The penstock has to cross a small gully at the lower section of the alignment and it requires especial design for gully crossing. The rock in this stretch of the penstock alignment (Figure 7-20) is strong and massive with dips towards the hillside, which is a very favourable condition for box cutting. Rock cutting and anchoring are needed for installing the penstock. Finally, the last stretch runs through the moderately dipping (<25°) colluvium deposits which have formed a stable slope where minor slope protection works are needed.
7.2.21 Penstock alignment for underground powerhouse option
Geomorphologically, the area has moderate slope in the uphill side portion whereas gentle in the lower portion towards powerhouse area. The alignment consist paleo-channel deposits varying in depth form 3 m to more than 30 m towards uphill side. The rounded to sub-rounded boulder up to 1.5 m to 2 m in diameter can be observed around the penstock area. The old deposits of alluvial soil can be observed along the stream along the penstock pipe which are moderately to highly weathered. The paleo-channel deposits of sub- rounded to rounded cobble, pebble and boulders of gneiss, quartzite, schist and phyllite, etc supported by the sandy and silty matrix is observed. It is light grey to white and yellowish white in color, non cohesive and somewhere low plasticity silty clay is noted. It is noted that the soil sample consists of 60-70% of coarse soil and 30-40% of fine soil. Moreover, the recent colluvial deposits are found over the paleo-channel deposits which are moderately weathered. It is distributed along the power house area and portion of penstock alignment. The material consists of about 30-40 % of coarse soil and 60-70% of fine soil of various particle size distributions. The colluvial deposit consists of angular, sub- angular to sub-rounded particle size distribution of gneiss, schist, quartzite etc. The thickness of the colluvail deposits varies from 1m to 4
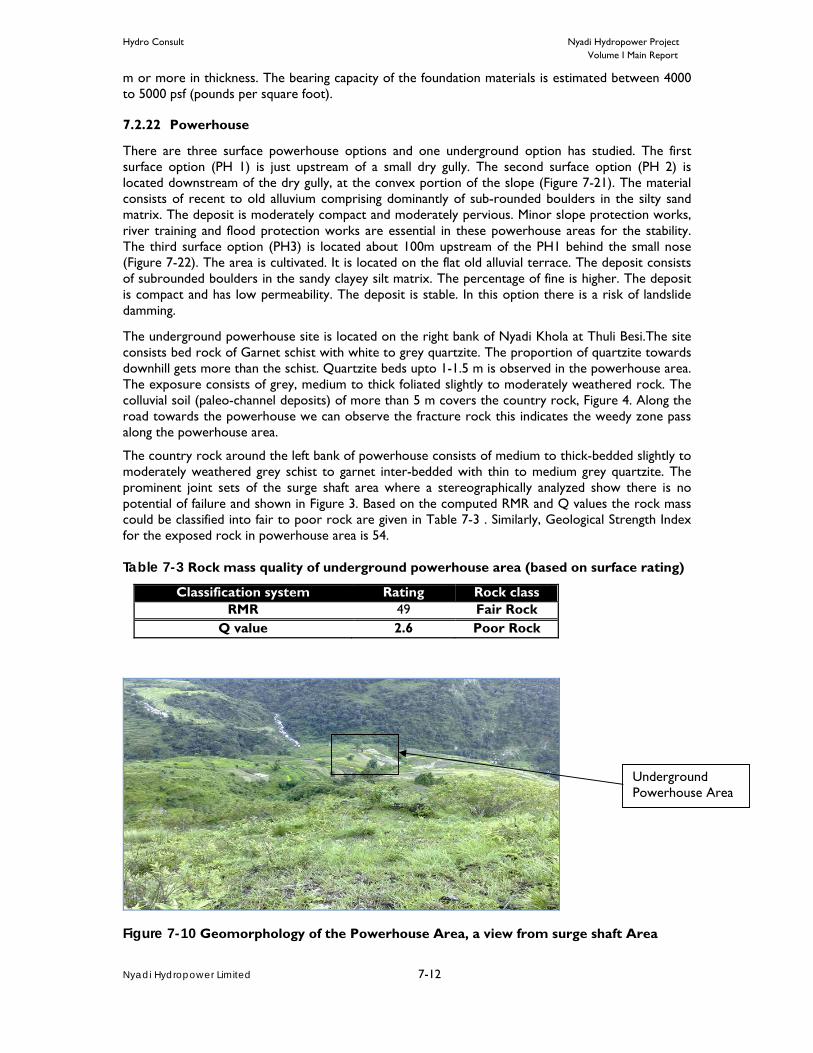
Hydro Consult Nyadi Hydropower Project Volume I Main Report
Nyadi Hydropower Limited
7-12
m or more in thickness. The bearing capacity of the foundation materials is estimated between 4000 to 5000 psf (pounds per square foot).
7.2.22 Powerhouse
There are three surface powerhouse options and one underground option has studied. The first surface option (PH 1) is just upstream of a small dry gully. The second surface option (PH 2) is located downstream of the dry gully, at the convex portion of the slope (Figure 7-21). The material consists of recent to old alluvium comprising dominantly of sub-rounded boulders in the silty sand matrix. The deposit is moderately compact and moderately pervious. Minor slope protection works, river training and flood protection works are essential in these powerhouse areas for the stability. The third surface option (PH3) is located about 100m upstream of the PH1 behind the small nose (Figure 7-22). The area is cultivated. It is located on the flat old alluvial terrace. The deposit consists of subrounded boulders in the sandy clayey silt matrix. The percentage of fine is higher. The deposit is compact and has low permeability. The deposit is stable. In this option there is a risk of landslide damming.
The underground powerhouse site is located on the right bank of Nyadi Khola at Thuli Besi.The site consists bed rock of Garnet schist with white to grey quartzite. The proportion of quartzite towards downhill gets more than the schist. Quartzite beds upto 1-1.5 m is observed in the powerhouse area. The exposure consists of grey, medium to thick foliated slightly to moderately weathered rock. The colluvial soil (paleo-channel deposits) of more than 5 m covers the country rock, Figure 4. Along the road towards the powerhouse we can observe the fracture rock this indicates the weedy zone pass along the powerhouse area.
The country rock around the left bank of powerhouse consists of medium to thick-bedded slightly to moderately weathered grey schist to garnet inter-bedded with thin to medium grey quartzite. The prominent joint sets of the surge shaft area where a stereographically analyzed show there is no potential of failure and shown in Figure 3. Based on the computed RMR and Q values the rock mass could be classified into fair to poor rock are given in Table 7-3 . Similarly, Geological Strength Index for the exposed rock in powerhouse area is 54.
Table 7-3 Rock mass quality of underground powerhouse area (based on surface rating)
Classification system Rating Rock class RMR 49 Fair Rock
Q value 2.6 Poor Rock
Figure 7-10 Geomorphology of the Powerhouse Area, a view from surge shaft Area
Underground Powerhouse Area

Hydro Consult Nyadi Hydropower Project Volume I Main Report
Nyadi Hydropower Limited
7-13
7.2.23 Tailrace
The alignment consist moderate to gentle slope. The alignment consist grey schist with garnet inter-bedded with thin to medium bedded white quartzite up to 1-1.5 m thick. Moreover, the alignment consists of alluvial and colluvial deposits greater than 10 m thick towards the downhill side along the alignment, Figure 7-10. The outlet portion of tailrace consist quartzite rocks with garnet schist. The exposures observed along the alignment are slightly to moderately weathered and damp to dry condition. If the estimated thickness of colluvial and alluvial soil on the base of surface observation increases along the alignment, it may create problem during the construction phase. So, 2D- ERT study will enhance further to predict the exact depth of rock and soil.
Based on the computed RMR and Q values the rock mass could be classified into fair to poor rock are given in Table 7-4. Similarly, Geological Strength Index for the exposed rock in surge shaft area is 59.
Table 7-4 Rock mass quality of tailrace tunnel area (based on surface rating)
Classification system Rating Rock class RMR 49 Fair Rock Q value 2.6 Poor Rock
Colluvium soil encountered in the project area composed of light grey, angular to sub-angular cobble, pebble and gravels of schist, quartzite and gneiss supported in the clay and fine sandy matrix. The soil consists of about 60% of coarse materials and about 40% fine materials. Fine materials consist of low plastic sandy clay. The estimated thickness of colluvial soil varies depending upon the topography.
Similarly, the recent and old deposits of alluvial soil are present along the bank of Nyadi Khola. The terrace deposits of sub- rounded to rounded cobble, pebble and boulders of gneiss, quartzite and schist etc supported by the sandy and silty matrix. It is light grey in color, non cohesive and somewhere low plasticity silty clay is noted. It is noted that the soil sample consists of 65% of coarse soil and 35% of fine soil. Moreover, the recent deposits are found along the existing river bank.
Figure 7-11 Geology of Access tunnel portal and Tailrace outlet portal Area
7.2.24 Access Tunnel
Topographically, the area consists of moderated to steep slope. The exposure consist thick bedded quartzite in the basal part and medium to thin bedded in the upper portion of exposure inter-bedded
Access
Tailrace tl t

Hydro Consult Nyadi Hydropower Project Volume I Main Report
Nyadi Hydropower Limited
7-14
with granetoferrous grey schist. The outcrops are slightly to moderately weathered and cover with colluvial deposits less than 50 cm in thickness. The coverage is sufficient for access tunnel. Based on the computed RMR and Q values the rock mass could be classified into fair to poor rock, Table 7-5. Similarly, Geological Strength Index for the exposed rock in access tunnel area is 59.
Table 7-5 Rock mass quality of access tunnel area (based on surface rating)
Classification system Rating Rock class
RMR 49 Fair Q value 2.6 Poor
7.3 Mass wasting The right bank slope is counter dip slope and the left bank slope is dip slope. The right bank slope is relatively stable and landslides have not been observed along the slope. But the problems of mass wasting have been observed along the left bank slope and are frequent downstream from the headworks area.
Both old and recent wedge failure, debris flow, translational slide and rotational slides are common and observed on the rock, colluvial and palaeochannel deposits. Wedge failures are rarely observed along the tunnel alignment. Other slope failures are mainly located on the left bank of the river.
The slide is located about 1km upstream of Nyadi headworks area and about 2 km upstream of confluence of the Nyadi River and Siuri (Doranda) Khola on the right bank. Due to steep topography and intense rainfall during monsoon, mass wasting phenomenon in the Himalayan region is frequent. We observed a wedge controlled debris slides on the way to Dahare from Naiche. The slide is wedge controlled debris dominant (Figure 7-12). The slide follows the small tributary. The slide has length of 350- 400 m, width of 50-60 m and height of 5-10 m. The existing slope of the slided material is about 40-500. The slide has occurred recently and seems to be more active. The material is yellowish brown, coarse grained (large angular boulder dominant) with very little percentage of silty sand. The deposit is loose with very high porosity. The boulders with diameter of about 1m are frequent and range upto 5m (Figure 7-13, Figure 7-14). Large boulders are scattered and mostly observed at the toe part of the slide and partially upto the middle portion of the Nyadi River. The deposit is non- cohesive.

Hydro Consult Nyadi Hydropower Project Volume I Main Report
Nyadi Hydropower Limited
7-15
Figure 7-12: Sketch of slide upstream of Headworks
Figure 7-13: Slide looking downslope

Hydro Consult Nyadi Hydropower Project Volume I Main Report
Nyadi Hydropower Limited
7-16
Figure 7-14: Sliding viewing toward crown
The geology of the upstream of intake is banded kyanite-garnet gneiss which is grey, massive, strong and medium grained. Thin beds (1-5m) of micaceous garnet schist is intercalated with the banded gneiss. These layers are yellowish brown, moderately weathered and relatively weak. The joint planes are planer, slightly rough with continuity length of >10m.
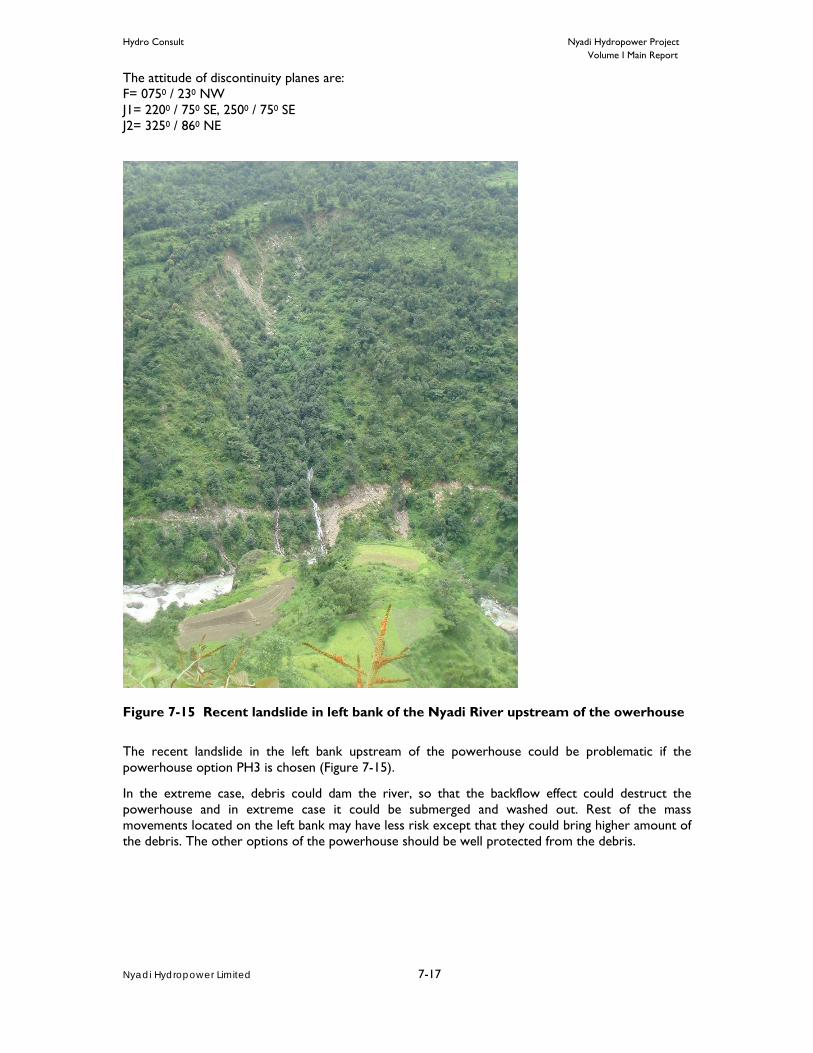
Hydro Consult Nyadi Hydropower Project Volume I Main Report
Nyadi Hydropower Limited
7-17
The attitude of discontinuity planes are: F= 0750 / 230 NW J1= 2200 / 750 SE, 2500 / 750 SE J2= 3250 / 860 NE
Figure 7-15 Recent landslide in left bank of the Nyadi River upstream of the owerhouse
The recent landslide in the left bank upstream of the powerhouse could be problematic if the powerhouse option PH3 is chosen (Figure 7-15).
In the extreme case, debris could dam the river, so that the backflow effect could destruct the powerhouse and in extreme case it could be submerged and washed out. Rest of the mass movements located on the left bank may have less risk except that they could bring higher amount of the debris. The other options of the powerhouse should be well protected from the debris.
Hydro Consult Nyadi Hydropower Project Volume I Main Report
Nyadi Hydropower Limited
7-18
7.4 Access road alignment
7.4.1 Alignment description
A traverse was taken along the access road alignment during the geological mapping and a brief description of the alignment is presented in the following paragraph.
The access road up to the Headworks has a length of about 13.50 km. The road alignment diverts from the Besishahar – Manang road at Thakanbeshi. It descends from there to reach the Marsyangdi River. The geology of the area is old to recent alluvial deposit comprising of rounded to sub-rounded boulders of gneiss and quartzite in a finer matrix. Large boulders of 5m dia. are also observed.
7.4.2 Bridge abutment
After the initial stretch of about 400m, a bridge is proposed over the Marsyangdi River. The span of the bridge is about 52 m. There is alluvial terrace on both sides of the Marsyangdi River. On the right bank there is a large boulder which can be used as the abutment support for bridge whereas abutment foundation is necessary on the left bank. The lithology is boulder dominant soil.
After crossing the bridge, the road ascends through the recent to old alluvial terrace. Then small stretch of this part meets the schist rock and follows the existing foot trail near chautaro at the western end of big flat terrace. The road then continues the foot trail upto the beginning of Thulobeshi. In this stretch the road mainly passes through rock comprising alternation of gneiss and schist up to the beginning of the village. The road then follows the palaeochannel in and around the Thulobeshi. After the Thulobeshi, the road nearly follows the foot trail to Naiche. The road to powerhouse splits from the end of Thulobeshi. This road runs over the colluvial deposit and alluvial deposit. The road to surge shaft runs through the compact cultivated terrace and loose palaeochannel deposit. The details of distribution of geological material along the road are presented in the Table 7-6, and engineering geological map.
The road alignment to weir axis runs through the right bank of the Nyadi River. The alignment will pass along the anti-dip slope and parallel to the foliation plane. Therefore, the problem of slope failure during road cut is less expected, but there is possibility of wedge failure.
Table 7-6: Percentages of geological material distribution along the access road
S.N. Geological material Percentage
1 Alluvial deposit 16
2 Colluvial deposit 55
3 Rock 25
4 Palaeochannel deposit 3
5 Landslide 1
Due to the presence of slightly weathered, hard gneiss, the rock cutting during construction of road is difficult. The landslide and mass movements are located along the left bank of the Nyadi River. Still during the cutting of the soft soil like palaeochannel and colluvium, due attention should be paid.
There is a colluvial deposit near the Naiche village. It continues upto 1km downstream of Naiche. After crossing the Naiche village, the road climbs and runs along the middle reach of the rocky cliff (gneiss and schist). Again the road meets the Nyadi River at flat land about 300m downstream of weir axis. Then it follows the bank of the river for the Headworks access.

Hydro Consult Nyadi Hydropower Project Volume I Main Report
Nyadi Hydropower Limited
7-19
7.4.3 Soil types
The following are five types of soil observed in the project area.
Alluvial soil
Recent and old alluvial soils are found along the both banks of the Nyadi River. Naiche, upslope of powerhouse area are covered by the old alluvial deposits. It comprises sub-rounded to well rounded boulders (<1 m dia.), cobbles, pebbles and gravels in sandy clayey silt matrix. The soil is light grey and contains about 40-50% fine materials and 50-60% coarse materials. Recent alluvial deposits are observed along the River. It comprises rounded to well rounded boulders (<1 m dia.), cobbles, pebbles and gravels in silty sand matrix. The soil is light grey and contains about 40% fine materials and 60% coarse materials. Fine material is non-cohesive and contains sand. Estimated thickness of the alluvial soil varies from 3 m to15 m. This deposit formed flat to gentle topography in the area.
Colluvial soil
Colluvium deposits are mostly located along the left bank and occasionally at right bank of the Nyadi River over moderately steeply dipping slopes. It comprises angular big boulders (<4 m dia.) and gravels in clayey silt matrix. Colluvium is brown in colour and contains about 60% coarse materials and 40% fine materials. Cultivated colluvium contains higher percentages of fine materials. Shape of coarse materials is angular to sub-angular. Finer material contains low plastic sandy silt. Estimated thickness of colluvium varies from 5 m to 40 m depending upon the nature of slope. The soil is moderately compact and moderately previous.
Residual soil
Residual soil is red in colour and is developed over weathered rock mostly in the top of the ridge. The soil is rarely observed. It is cohesive and possesses clay mixed sand and silt and occasionally contains angular gravels of parent rock. Thickness of the soil varies from 1 m to 5 m.
Palaeochannel deposit
One of the unique features of the Project area is the occurrence of a thick (from 50 to about 200 m) palaeochannel deposits (Figure 7-2, Figure 7-3). It is distributed around Nana (at the surge shaft, penstock, and powerhouse), west of Bhirpustung, around Thulibesi, in the vicinity of Bahundanda and Tarachowk. The deposits contain large (up to 5 m and more) subangular boulders of augen gneiss, banded gneiss, and marble.
They also contain fine (sandy to silty), light grey to white matrix which is moderately compact (Figure 7-6). The proportion of matrix and the clasts varies widely. Generally the matrix constitutes to about 50 to 60% of the volume. There are also sporadic mudstone lumps in the palaeochannel deposits, especially in the area west of Thulibesi and Bahundanda.
Since the palaeochannel deposits are loose, they may pose serious problems while constructing a tunnel through them.
Talus deposit
Talus deposit is observed at the toe of the slope 50m downstream of weir axis, in and around adit portal, about 200m downstream of adit portal, upslope of Nana village. The deposits consist of angular big boulders of gneiss, schist and quartzite. The diameter ranges from 2- 5 meters.
7.4.4 Geological structures
The study area constitutes the footwall and hanging wall of the MCT. Geological cross-sections through the Project area are depicted in Figure 7-2 and Figure 7-3. The MCT is parallel to the foliation plane of the hanging and footwall rocks. Apart from the MCT, there are also several major and minor shear or weak zones (5 to 50 m thick) and steep faults (1 to 5 m thick). Shear or weak
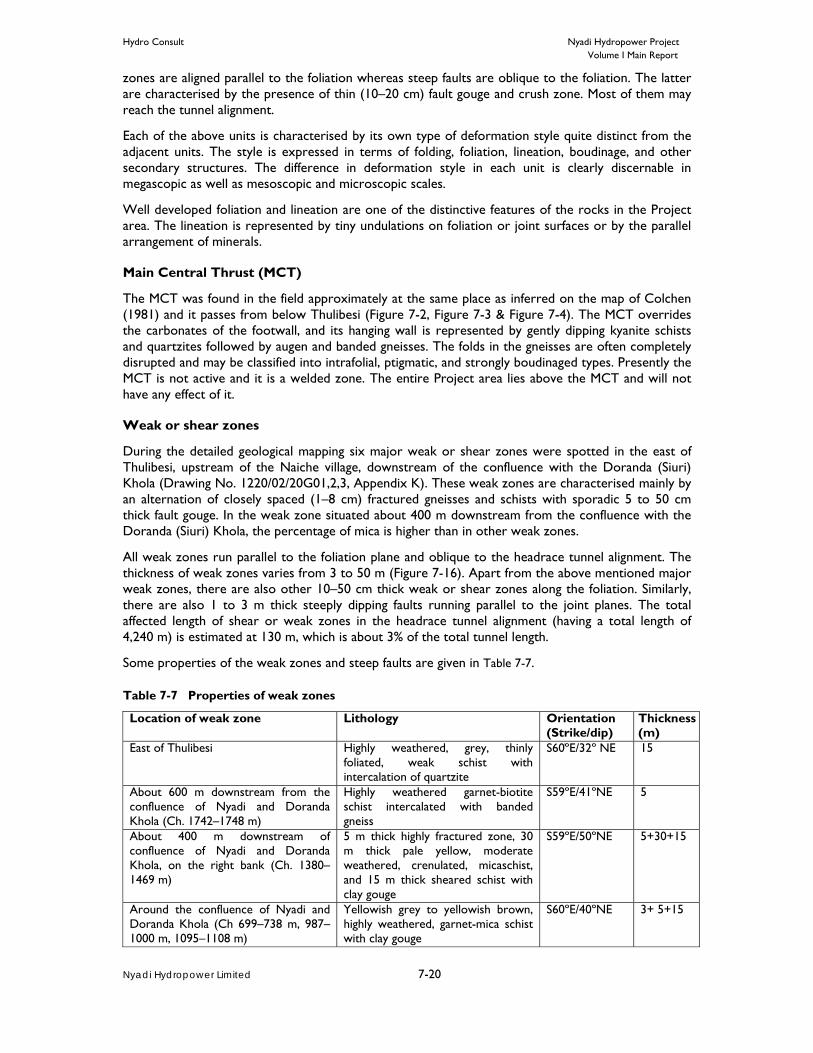
Hydro Consult Nyadi Hydropower Project Volume I Main Report
Nyadi Hydropower Limited
7-20
zones are aligned parallel to the foliation whereas steep faults are oblique to the foliation. The latter are characterised by the presence of thin (10–20 cm) fault gouge and crush zone. Most of them may reach the tunnel alignment.
Each of the above units is characterised by its own type of deformation style quite distinct from the adjacent units. The style is expressed in terms of folding, foliation, lineation, boudinage, and other secondary structures. The difference in deformation style in each unit is clearly discernable in megascopic as well as mesoscopic and microscopic scales.
Well developed foliation and lineation are one of the distinctive features of the rocks in the Project area. The lineation is represented by tiny undulations on foliation or joint surfaces or by the parallel arrangement of minerals.
Main Central Thrust (MCT)
The MCT was found in the field approximately at the same place as inferred on the map of Colchen (1981) and it passes from below Thulibesi (Figure 7-2, Figure 7-3 & Figure 7-4). The MCT overrides the carbonates of the footwall, and its hanging wall is represented by gently dipping kyanite schists and quartzites followed by augen and banded gneisses. The folds in the gneisses are often completely disrupted and may be classified into intrafolial, ptigmatic, and strongly boudinaged types. Presently the MCT is not active and it is a welded zone. The entire Project area lies above the MCT and will not have any effect of it.
Weak or shear zones
During the detailed geological mapping six major weak or shear zones were spotted in the east of Thulibesi, upstream of the Naiche village, downstream of the confluence with the Doranda (Siuri) Khola (Drawing No. 1220/02/20G01,2,3, Appendix K). These weak zones are characterised mainly by an alternation of closely spaced (1–8 cm) fractured gneisses and schists with sporadic 5 to 50 cm thick fault gouge. In the weak zone situated about 400 m downstream from the confluence with the Doranda (Siuri) Khola, the percentage of mica is higher than in other weak zones.
All weak zones run parallel to the foliation plane and oblique to the headrace tunnel alignment. The thickness of weak zones varies from 3 to 50 m (Figure 7-16). Apart from the above mentioned major weak zones, there are also other 10–50 cm thick weak or shear zones along the foliation. Similarly, there are also 1 to 3 m thick steeply dipping faults running parallel to the joint planes. The total affected length of shear or weak zones in the headrace tunnel alignment (having a total length of 4,240 m) is estimated at 130 m, which is about 3% of the total tunnel length.
Some properties of the weak zones and steep faults are given in Table 7-7.
Table 7-7 Properties of weak zones
Location of weak zone Lithology Orientation (Strike/dip)
Thickness (m)
East of Thulibesi Highly weathered, grey, thinly foliated, weak schist with intercalation of quartzite
S60۫ºE/32º NE 15
About 600 m downstream from the confluence of Nyadi and Doranda Khola (Ch. 1742–1748 m)
Highly weathered garnet-biotite schist intercalated with banded gneiss
S59ºE/41ºNE 5
About 400 m downstream of confluence of Nyadi and Doranda Khola, on the right bank (Ch. 1380–1469 m)
5 m thick highly fractured zone, 30 m thick pale yellow, moderate weathered, crenulated, micaschist, and 15 m thick sheared schist with clay gouge
S59ºE/50ºNE 5+30+15
Around the confluence of Nyadi and Doranda Khola (Ch 699–738 m, 987–1000 m, 1095–1108 m)
Yellowish grey to yellowish brown, highly weathered, garnet-mica schist with clay gouge
S60ºE/40ºNE 3+ 5+15

Hydro Consult Nyadi Hydropower Project Volume I Main Report
Nyadi Hydropower Limited
7-21
Between intake and surge shaft section (Ch 681 m, 1072 m, 1305 m, 1412 m, 1938 m, 3857 m)
1 to 3 m thick steeply dipping fault with highly fractured zone
N10ºE/80ºE 2x 6
Figure 7-16 View of a shear or weak zone (a) and a steep fault (b)
Joint
Foliation and stress relief joints are well developed and prominent in the area. Other joints are non-persistence. Some properties of joint in the banded gneiss intercalated with schist are given in Table 7-8.
Table 7-8 Properties of joints in banded gneiss and schist
Descriptions Foliation (F1) Joint (J1) Orientation (dip/dip direction) 35º/106º NE 110º/65º SW Spacing (cm) 10 - 60 >60 Aperture (mm) 1 - 5 >5
Roughness Planar, rough Planar rough Filling Sand Sand Weathering Slightly Slightly Persistence (m) >10 > 5 Water Dry - Damp Dry - Damp
Foliation joint is more problematic in all aspect as compared to other joints.
a b

Hydro Consult Nyadi Hydropower Project Volume I Main Report
Nyadi Hydropower Limited
7-22
Geomorphology
The Nyadi River area is a narrow V- shaped valley, which was formed mainly by vertical rock cliff at right bank and moderately steep dipping colluvium, flat to gently dipping palaeochannel deposit and rock at left bank. Somewhere flat river terraces are also observed. The shape of the valley is structurally controlled by joints and foliation of rock. Vertical rock cliff at right bank was formed by stress relief joint in counter dipping beds (foliation of rock dips inside hill side). Due to the high strength of the standing rock, the slope on the right bank forms the vertical cliff of rugged nature. Recent and old gently dipping alluvial deposits were observed along the River bank. The tributaries are concentrated mainly on the right bank forming waterfalls. At Tarachowk, Nana and Thulibesi area, flat terrains formed by the palaeochannel deposit are also observed. Flat to moderately steep slopes are used as cultivation. Somewhere the land is covered by forest and others are left barren.
Engineering geological study
7.4.5 Headworks
The weir is proposed at about 500 m upstream of confluence of Nyadi River and Doranda (Siuri) Khola. The headworks site consists of very steep slope to vertical rocky cliff. At the center of the weir axis the river deposit is present. The alluvial deposit consists of larger rounded boulders with minor percentage of finer material. The expected thickness of the alluvial deposit is greater than 20m (reference: Drilling log of BH1). The exposed rock is grey to light grey, fresh to slightly weathered, strong, coarse-grained banded gneiss intercalated with garnetiferous schist. The rock mass classification is given in Table 7-9.
Table 7-9 Rock class around headworks area
Classification system Rating Rock class RMR 54-67 Fair rock Q- value >4 Poor rock
Both banks are stable but the central portion of the weir should be well protected by curtain grouting.
7.4.6 Gravel trap and approach tunnel
The water from the weir with frontal intake is diverted to the gravel trap. It is also underground. The rock of gravel trap consists of banded gneiss alternated with garnetiferous schist. Then the approach tunnel begins which has the length of about 75m. The approach tunnel has also the same lithology as the gravel trap.
7.4.7 Settling basin
The settling basin of 170m long is also proposed underground. It consists of two bays of diameter 8m. The rock is grey to light grey, fresh to slightly weathered, moderately strong, medium to thickly foliated banded gneiss intercalated with the garnetiferous schist. The rock falls under the poor rock class according to the Q-value. There is an inspection gallery running parallel from the middle part of these two bays which is about 4m above from the crown of the settling chamber. 7.4.8 Tunnel alignment
The proposed headrace tunnel alignment of about 3830m long (after settling chamber) will run through the monotonous lithology. The main lithology of the tunnel alignment is banded gneiss, kyanite-garnet schist, and quartzite and shear zone (Table 7-10). Estimated minimum and maximum overburden are 75 m and 475 m. In general, the orientation of tunnel alignment is N60˚E – S60˚W and will be 40˚-75˚ oblique to the foliation plane which is fair excavation condition Figure 7-17.

Hydro Consult Nyadi Hydropower Project Volume I Main Report
Nyadi Hydropower Limited
7-23
Figure 7-17 Joint rossette showing the tunnel alignment
The Banded gneiss observed in most of places is grey to dark grey, slightly to moderately weathered, medium to coarse -grained, moderately to thickly foliated and strong with two sets of joints. These gneisses are intercalated with the grey to greenish grey (somewhere pale yellow at mineralized zone), moderately weathered, moderately strong, thinly foliated, medium to coarse grained kyanite-garnet schist. The quartzite bands are white to light grey, slightly weathered, medium bedded, strong, fine to medium grained. The shear zone is observed at five different places which are tabulated above (Table 7-7).
Table 7-10 Rock type distribution along the headrace tunnel
Rock Type Percentages Grey to dark grey, slightly to moderately weathered, medium to coarse - grained, moderately to thickly foliated and strong augen and banded gneiss
60 - 70
grey to greenish grey (somewhere pale yellow at mineralized zone), moderately weathered, moderately strong, thinly foliated, medium to coarse grained kyanite-garnet schist
25 - 30
white to light grey, slightly weathered, medium bedded, strong, fine to medium grained quartzite
7 - 10
Pale yellow to brownish yellow, Highly weathered shear zone 3 - 4
The Nana valley is covered by the palaeochannel deposits. About 50 m high rock cliff is present near the surge shaft and outlet portal area. The exposed rocks are grey to dark grey, coarse-grained, thickly banded to massive, medium strong to strong schists and gneisses.
According to the 2-D Electric Resistivity Tomography (ERT) data, the thickness of the palaeochannel deposits ranges from 50 to 110 m along the tunnel alignment (Drawing No. 1220/02/20G01, 2 and 3; Appendix K). The expected minimum rock cover along the tunnel section is about 40 m where the maximum depth of palaeochannel is 110 m. However, the depth of palaeochannel may be more than expected. In that case, the tunnel may lie in the palaeochannel deposits, and there could be serious construction problems.
According to the surface observation the quality of rock mass distribution at the level of the proposed tunnel alignment was estimated (Table 7-11).
This estimated quality of rock mass distribution is mainly based on rock mass rating at different rock exposures. The rock mass quality distribution is as given in the Table 7-11.
Nana to Outlet
Intake to Naiche
Naiche to Nana
N

Hydro Consult Nyadi Hydropower Project Volume I Main Report
Nyadi Hydropower Limited
7-24
Table 7-11 Rock mass distribution along the headrace tunnel
Rock class Q- value Percentages I Fair rock >4.0 56 II Poor rock 4.0 -1.0 21 III Very poor rock 1.0 – 0.1 16 IV Extremely poor rock 0.1 – 0.01 4 V Exceptionally poor rock <0.01 3
Hence the tunnel alignment runs mainly through the fair to poor rock.
7.4.9 Naiche adit
The Adit portal lies in the western slope of Naiche village. It is located about 100 m southwest of primary school of Naiche (Figure 7-18). The length of adit is about 175m. The rocks of the adit portal are grey to dark grey, medium grained, strong to very strong, thickly bedded kyanite banded gneiss. Quartz veins are also present. The attitude of foliation is 117º/33º NE. Table 7-12 represents the rock mass class near Naiche adit portal.
Table 7-12 Rock class at Naiche adit portal
Figure 7-18 View of Naiche adit portal
7.4.10 Surge shaft
A surge shaft is proposed 30m before the outlet portal. It is diverted about 25m in SW direction of the tunnel alignment. The rocks in the area are grey to dark grey, medium foliated, coarse grained, medium strong kyanite-garnet gneiss intercalated with schist. The attitude of foliation is 135º/40º NE.
The rock mass quality is as shown in the Table 7-13 .
Table 7-13 Rock mass quality in the Surge Shaft area
Classification system Rating Rock class RMR 56 Fair rock Q value 2.7 – 3.2 Poor rock
Classification system Rating Rock class RMR 47 - 54 Fair rock Q value 1 - 4 Poor rock

Hydro Consult Nyadi Hydropower Project Volume I Main Report
Nyadi Hydropower Limited
7-25
7.4.11 Outlet portal
The proposed outlet portal is located at base of the exposed rock on the east of Nana village (Figure 7-19). Presently the outlet portal is covered by the white, boulder mixed, moderately compact palaeochannel deposit. The deposit has to be cut about 10m to encounter the rock face. The rock in the area is grey to dark grey, medium foliated, coarse grained, medium strong kyanite-garnet gneiss intercalated with schist. The attitude of foliation is 1060/350 NE and prominent joint set is 110º/65º SW.
The rock mass quality of the portal is presented in Table 7-14.
Table 7-14 Rock mass quality in the outlet portal Classification system Rating Rock class RMR 56 Fair rock Q value 2.7 – 3.2 Poor rock
Figure 7-19 Outlet Portal area
7.4.12 Penstock alignment
The surface penstock passes mainly through soil (palaeochannel deposits and colluvium) except about 200 m stretch in steeply dipping (<70°) rock cliff. The first stretch, about 100 m of the penstock alignment, runs through a steeply standing slope (<60°) which needs a toe excavation and hillside cutting for foundation works. There is a high risk of slope stability and requires a huge amount of cutting and a number of retaining structures for slope stabilization. Trimming of uphill slope and protection of the gully by constructing check dams could reduce the risk.
Likewise, the segment between the first stretch and start of rock cliff is moderately to gently dipping (<25°) and it contains colluvium deposits and palaeochannel sediments. This stretch is stable and has no major risk. However, the penstock has to cross a small gully at the lower section of the alignment and it requires especial design for gully crossing. The rock in this stretch of the penstock alignment (Figure 7-20) is strong and massive with dips towards the hillside, which is a very favourable condition for box cutting. Rock cutting and anchoring are needed for installing the penstock. Finally, the last stretch runs through the moderately dipping (<25°) colluvium deposits which have formed a stable slope where minor slope protection works are needed. The alignment crosses a small dry gully which needs a special design for the crossing.
Outlet Portal
Nana

Hydro Consult Nyadi Hydropower Project Volume I Main Report
Nyadi Hydropower Limited
7-26
Figure 7-20 View of surface penstock alignment and powerhouse site
7.4.13 Powerhouse
There are three surface powerhouse options. The first option (PH 1) is just upstream of a small dry gully (Figure 7-20, Figure 7-21 & Figure 7-22). The risk of slope instability associated with this gully in the rainy season seems to be very high for the powerhouse. Likewise, slope cutting in steeply dipping palaeochannel is necessary for building the powerhouse and needs massive retaining structures and making of proper drainage systems. The second option (PH 2) is located downstream of the dry gully, at the convex portion of the slope (Figure 7-21). In this area, slope cutting in moderately dipping colluvium is necessary which needs retaining structures and drainage systems. However, this area has less risk of slope stability as compare to the first option. But in this location, there is a high possibility of bank cutting by the Nyadi River. Hence, river training and flood protection works are essential in this powerhouse area.
Adoption of proper slope stabilization and protection measures, provision of sufficient drainage structures along the slopes in order to prevent gully erosion or landslide, improvement of the weaker foundation soil by applying suitable ground improvement techniques, selection of proper foundation type, sufficient and carefully designed river training works, trenching the part of penstock in the steep rocky slope and placing of automatic safety valve at the start of penstock for emergency protection in case of pipe bursting are some of the possible mitigation measures for the uncertainties associated with the surface option.
PH 2
Penstock alignment
Rock cliff
Portal
Nana
PH 3
PH 1
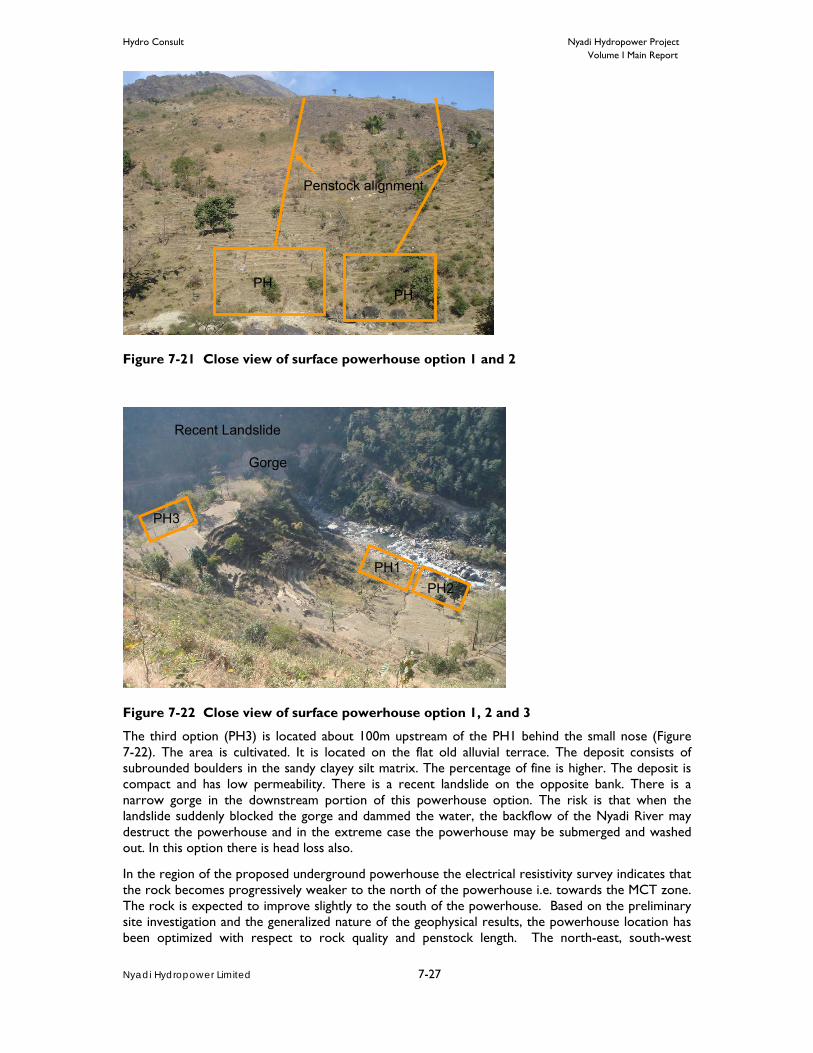
Hydro Consult Nyadi Hydropower Project Volume I Main Report
Nyadi Hydropower Limited
7-27
Figure 7-21 Close view of surface powerhouse option 1 and 2
Figure 7-22 Close view of surface powerhouse option 1, 2 and 3
The third option (PH3) is located about 100m upstream of the PH1 behind the small nose (Figure 7-22). The area is cultivated. It is located on the flat old alluvial terrace. The deposit consists of subrounded boulders in the sandy clayey silt matrix. The percentage of fine is higher. The deposit is compact and has low permeability. There is a recent landslide on the opposite bank. There is a narrow gorge in the downstream portion of this powerhouse option. The risk is that when the landslide suddenly blocked the gorge and dammed the water, the backflow of the Nyadi River may destruct the powerhouse and in the extreme case the powerhouse may be submerged and washed out. In this option there is head loss also.
In the region of the proposed underground powerhouse the electrical resistivity survey indicates that the rock becomes progressively weaker to the north of the powerhouse i.e. towards the MCT zone. The rock is expected to improve slightly to the south of the powerhouse. Based on the preliminary site investigation and the generalized nature of the geophysical results, the powerhouse location has been optimized with respect to rock quality and penstock length. The north-east, south-west
Recent Landslide
Gorge
PH3
PH1 PH2
PHPH
Penstock alignment

Hydro Consult Nyadi Hydropower Project Volume I Main Report
Nyadi Hydropower Limited
7-28
orientation of the powerhouse has been selected based on a preliminary rock joint analysis. Further detailed analysis is required for the final optimum alignment at detailed design stage.
The rock at the powerhouse is expected to be poor quality schist. Excavation of the powerhouse may need to be split into small headings, supported after excavation before progressing to the next section. Two long core drills, one into the powerhouse area and one further south on the line of the tailrace tunnel would give a better indication of rock and ground water conditions and determine whether it is economically viable to move the powerhouse further south.
7.4.14 Tailrace and Access tunnel
The tail water for surface options will be conveyed through a tailrace canal of about 75 m length and will drop in Nyadi. In order for the fixing of level of tailrace canal, 100 years flood is taken into consideration. The canal runs through the recent alluvial deposit comprising of large boulder in the fine silty sand matrix. The percentages of coarser and finer are 60-70 and 30-40 respectively. For underground option, the tailrace consists of 356.5 m long tunnel. The tunnel passes through the rock. Tunnelling for the access tunnel will be in the general line of the dip direction. Tunneling the tailrace from the powerhouse area will be against the general line of the dip direction.
The electrical resistivity survey of the tailrace tunnel area indicates a resistivity value of around 2100 ohm-m. Rock quality is expected to be poor. Only few minor local faults were observed at the surface therefore similar conditions are assumed at tunnel level.
7.5 Anticipated geological problems Some geological problems anticipated during construction of this project are presented below:
7.5.1 Overbreak and relocation of tunnel alignment
Overbreak problems are expected in fault and shear or weak zone containing fractured and sheared rock with clay gouge having very less stand up time in presence of seepage. In addition, the weak zone (schist band) is impermeable and hold huge amount of water above it which helps to trigger major overbreak. Similarly, the method of excavation and application of rock support are other causes of overbreak.
Overbreak problems can be solved by application of pre-reinforcement such as spilings and umbrella grouting before excavation, reducing pull length, heading and benching excavation method, pilot drilling to know the ground condition and drain ground water. The selection of a proper excavation method in such faults and weak or shear zones is very important to control the overbreak. Hence, to predict this problem a precise geological map showing faults and shear or weak zones is essential.
7.5.2 Rock squeezing
Rock squeezing is a common problem in the Nepal Himalayas while tunneling through low-strength rocks, fault and shear or weak zone (Sunuwar 2002). It reduces the cross-section of a tunnel by time-dependent deformation of rock. In a worse case, the tunnel can collapse. Therefore, reshaping and re-supporting of the tunnel is a time consuming and expensive endeavor.
Rock squeezing problem is expected mainly in the shear zones where there is a considerable amount of clay. Hence, it is essential to predict rock squeezing to finalize rock support design in such sections of the tunnel.
7.5.3 Water leakage and ingress
Water leakage problem in permeable ground and jointed rock with open joints across saddle and near valley side areas where water table is likely to be below tunnel elevation is experienced. The problem is expected in between Naiche adit and Nana. Grouting is the necessary in this section.
Hydro Consult Nyadi Hydropower Project Volume I Main Report
Nyadi Hydropower Limited
7-29
7.5.4 Slope stability
Slope stability problem is expected in outlet portal, surface penstock and powerhouse areas due to cutting in palaeochannel and colluvium deposit for making space during construction. Retaining structures and other additional mitigation works such as drainage system, bio-engineering etc. have to be designed to stabilize the slope cutting.
7.6 Seismicity
7.6.1 General
Nepal Himalayas is considered to be seismically active zone due to continuous subduction of Indian Plate underneath Tibetan Plate. The existence of major tectonic boundaries such as Main Central Thrust (MCT), Main Boundary Thrust (MBT) and Himalayan Frontal Thrust (HFT) further accelerates the rate of seismic risk. Therefore, Nepal has experienced a number of large earthquakes over the past few decades, which has caused the substantial damages to the life and property. The epicenter map of Nepal Himalayas and adjoining countries shows that the seismic events are mainly concentrated in Far Western and Eastern parts of Nepal.
The seismicity study of other Hydropower projects in Nepal is based on seismic-tectonic features of the project area and data on historical earthquakes of the region. The seismicity study carried out in Middle Marsyangdi Hydroelectric Project is closest to the Project area.
7.6.2 Tectonic Setting of Nyadi Hydropower Project
Thrust and faults are major tectonic boundaries for seismicity. The Main Central Thrust (MCT), Main Boundary Thrust (MBT) and Himalayan Frontal Thrust (HFT) are major tectonic boundaries in the Nepal Himalayas. Therefore, proximity to such structural features is important while assessing the seismicity of the Project.
Main Central Thrust (MCT) The MCT is a major lithological, metamorphic and structural discontinuity, which passes about 2 km south of the project area. It is represented by high-grade metamorphic rock sequences formed in ductile condition in deeper parts of the crust. The MCT was active during the early phases of Himalayan orogeny but it is now considered to be inactive. The largest earthquake of 8 magnitudes was recorded in 1833 around the MCT area. Based on both micro seismic and geodetic data of the Central Nepal the more frequent medium sized earthquakes of 6 to 7 magnitudes are confined either to flat decollment beneath the Lesser Himalayas or the upper part of the middle crustal ramp (Pandey et. al., 1995). The ramp is occurring between 10 and 20 km depth below the foothills of the Higher Himalayas in the south of the MCT surface exposures.
7.6.3 Historical seismic activity of greater magnitude
Nepal has experienced several large earthquakes over the past centuries that have resulted in substantial property damage and loss of life. Earthquakes of larger magnitudes occurred in Nepal are summarized in Table 7-15.

Hydro Consult Nyadi Hydropower Project Volume I Main Report
Nyadi Hydropower Limited
7-30
Table 7-15 Summary of larger magnitudes earthquakes of Nepal.
S.N. Location of epicenter Year Magnitudes Approx. distance from the project
1. Udaypur, Eastern Nepal 1988 6.6 280 km east 2. Chainpur, Eastern Nepal 1934 8.3 300 km east 3. Dolakha, Central Nepal 1834 6.8 180 km east 4. Sindhupalchok, Central Nepal 1833 8.0 140 km east 5. Kaski, Western Nepal 1954 6.4 50 km west 6. Myagdi, Western Nepal 1936 7.0 90 km west 7. Bajhang, Far Western Nepal 1980 6.5 280 km west 8. Dharchula, Far Western Nepal 1966 6.1 400 km west 9. Dharchula, Far Western Nepal 1966 6.3 410 km west 10. Dharchula, Far Western Nepal 1916 7.3 420 km west
The latest recorded earthquake of 6.4 magnitudes in 1954 was Kaski situated about 50km west from the Project area. Similarly, the Nepal-Bihar earthquake (Chainpur) of 8.3 magnitudes occurred in 1934, which is located about 300 km in the east direction. The earthquake destroyed more than 80,000 houses in Nepal. Likewise, the closest earthquakes to the Project area are Dolakha in 1834, Sindhupalchok in 1833, Chainpur in 1934, and Udayapur in 1988 (Table 7-15). Chainpur and Udayapur earthquakes were more destructive earthquakes in Eastern Nepal based on historic data.
7.6.4 Seismic hazard assessment
The specific project related seismic studies were not carried out so far. The records of seismic activities are limited in the Nepal Himalayas and hence correlation of seismic events with adjacent Himalayan Region would be a useful source of information for designing the major components of project. Several seismicity studies have been carried out for the various projects in the country during the study of engineering design phases and seismic design coefficients are derived for those projects. A seismicity study was carried out in Middle Marsyangdi HEP which is about 30 km southeast. Based on the seismic design code of Nepal, Middle Marsyangdi HEP is located in the third seismic risk zone of Nepal. The basic horizontal coefficient of 0.06 is considered for design.
Based on such information and theoretical methods the basic earthquake design coefficient for the project can be derived from other projects at the feasibility study phase. Seismic coefficient for Nyadi is evaluated based on Nepalese and Indian Standards and compared and derived from Middle Marsyangdi HEP.
Nepalese Standard Nyadi HEP is situated in seismic zone three based on BCDP. All major structures like dam, reservoir, and settling basin are mainly proposed underground and powerhouse is proposed surface. Therefore basic horizontal coefficient of 0.06 (soft soil) can be considered for the design.
The effective design seismic coefficient is determined by applying the following equation:
980RA
a effmax=
Where, aeff = effective design seismic coefficient
R = Reduction factor (empirical value, R = 0.50 – 0.65)
A max = Maximum acceleration
The calculated effective design seismic coefficient is approximately 0.13 to 0.16 by considering the maximum acceleration of 250 gal (Seismic Hazard Map of Nepal, 2002) and the reduction of 0.50 – 0.65.

Hydro Consult Nyadi Hydropower Project Volume I Main Report
Nyadi Hydropower Limited
7-31
Indian Standard The Nyadi HEP is located in the Zone V in the seismic risk map of India. The basic horizontal seismic coefficient a0, therefore shall be taken as 0.08.
The design horizontal seismic coefficient is defined in the Indian Standard by the equation:
ah = b * I * a0
Where, ah = design horizontal seismic coefficient
B = soil foundation factor (1.0 for dam)
I = importance factor (2.0 for dam)
Therefore, the design horizontal seismic coefficient for the Nyadi HEP weir is 0.16
7.6.5 Recommendation
The seismic coefficients recommended based on deterministic approach and probabilistic approaches for different projects in Nepal are as follows (Table 7-16):
Table 7-16 Seismic design parameter for different hydropower projects.
S.N. Name of Project Study conducted by Recommended Seismic Coefficient 1. Arun III JICA 0.12 g for all components design 2. Upper Arun MKE, Lahmeyer, TEPSCO
& NEPECON 0.12 g for dam 0.062 for underground powerhouse
3. Mulghat (Tamur) Electrowatt 0.20 g 4. Tamur-Mewa MSHP, CIWEC MDE = 0.25 g – 0.24 g
OBE = 0.16 g – 0.15 g 5. Dush Koshi I MHSP, CIWEC MDE = 0.37 g
OBE = 0.22 g – 0.23 g 6. Kaligandaki Morrison-Knudsen OBE = 0.30 g 7. Khimti I Beca Carter Hollings &
Ferner OBE = 0.25 g for Type I soil (BCDP) OBE = 0.30 g for Type II soil (BCDP)
8. Middle Marsyandi Statkraft Groner & NEA MDE = 0.33 g – 0.32 g for soil = 0.25 for bedrock OBE = 0.29 g – 0.27 g for soil = 0.22 for bedrock
9. Upper Tama Koshi Norconsult MDE = Expected PGA 5.05 (m/s2) for 500 yrs. OBE = Expected PGA 3.46 (m/s2) for 200 yrs.
Note: OBE = Operation Basis Earthquake, MDE = Maximum Design Earthquake, PGA = Peak ground acceleration.
The project area falls in the Class having fair to high seismic risk; since according to the Nepalese and Indian Standards, the horizontal seismic coefficient for the dam has been estimated in 0.13 – 0.16.
7.7 Core drilling
7.7.1 General
The intent and purpose of the core drilling is to obtain the sub-surface information on foundation materials and conditions. On the basis of the Geological/Engineering geological mapping, the location, estimated length and type of diamond core drilling is proposed. The drilling sites were located on major project component location to know the foundation depth, foundation material and rock mass quality. The holes were drilled using the rotary method.
The starting and completion dates of different boreholes are given in Table 7-17.
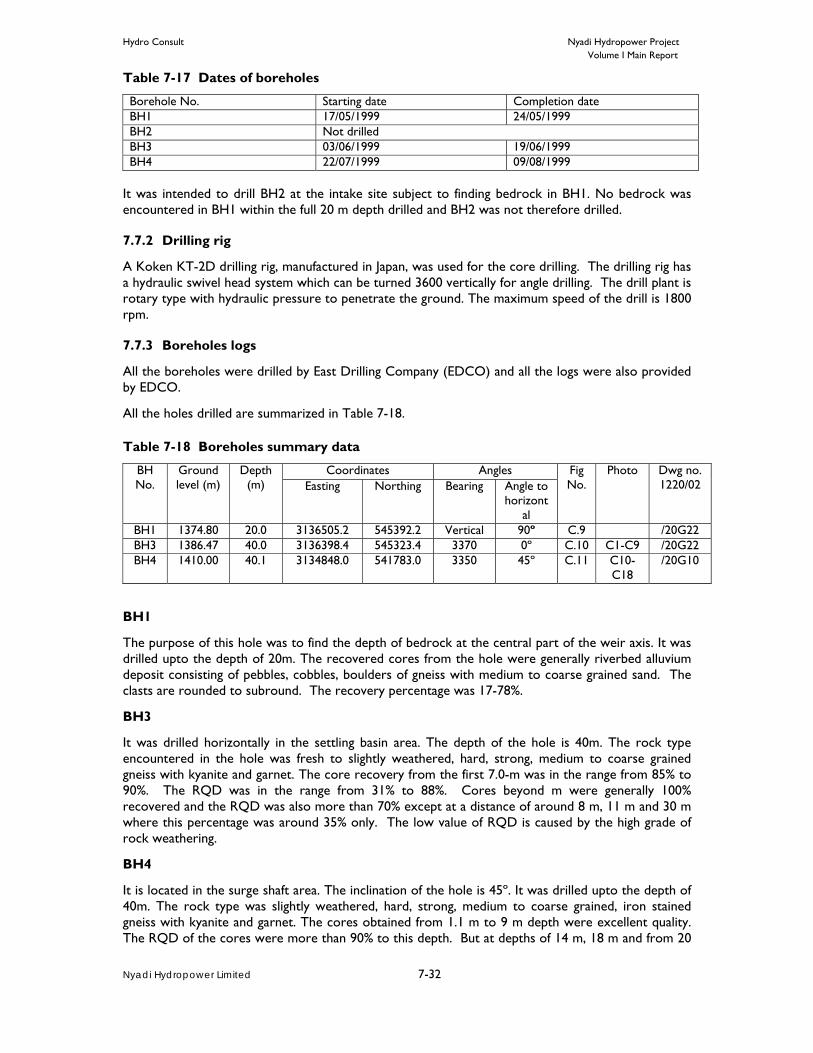
Hydro Consult Nyadi Hydropower Project Volume I Main Report
Nyadi Hydropower Limited
7-32
Table 7-17 Dates of boreholes
Borehole No. Starting date Completion date BH1 17/05/1999 24/05/1999 BH2 Not drilled BH3 03/06/1999 19/06/1999 BH4 22/07/1999 09/08/1999
It was intended to drill BH2 at the intake site subject to finding bedrock in BH1. No bedrock was encountered in BH1 within the full 20 m depth drilled and BH2 was not therefore drilled.
7.7.2 Drilling rig
A Koken KT-2D drilling rig, manufactured in Japan, was used for the core drilling. The drilling rig has a hydraulic swivel head system which can be turned 3600 vertically for angle drilling. The drill plant is rotary type with hydraulic pressure to penetrate the ground. The maximum speed of the drill is 1800 rpm.
7.7.3 Boreholes logs
All the boreholes were drilled by East Drilling Company (EDCO) and all the logs were also provided by EDCO.
All the holes drilled are summarized in Table 7-18.
Table 7-18 Boreholes summary data
BH No.
Ground level (m)
Depth (m)
Coordinates Angles Fig No.
Photo Dwg no. 1220/02 Easting Northing Bearing Angle to
horizontal
BH1 1374.80 20.0 3136505.2 545392.2 Vertical 90º C.9 /20G22 BH3 1386.47 40.0 3136398.4 545323.4 3370 0º C.10 C1-C9 /20G22 BH4 1410.00 40.1 3134848.0 541783.0 3350 45º C.11 C10-
C18 /20G10
BH1
The purpose of this hole was to find the depth of bedrock at the central part of the weir axis. It was drilled upto the depth of 20m. The recovered cores from the hole were generally riverbed alluvium deposit consisting of pebbles, cobbles, boulders of gneiss with medium to coarse grained sand. The clasts are rounded to subround. The recovery percentage was 17-78%.
BH3
It was drilled horizontally in the settling basin area. The depth of the hole is 40m. The rock type encountered in the hole was fresh to slightly weathered, hard, strong, medium to coarse grained gneiss with kyanite and garnet. The core recovery from the first 7.0-m was in the range from 85% to 90%. The RQD was in the range from 31% to 88%. Cores beyond m were generally 100% recovered and the RQD was also more than 70% except at a distance of around 8 m, 11 m and 30 m where this percentage was around 35% only. The low value of RQD is caused by the high grade of rock weathering.
BH4
It is located in the surge shaft area. The inclination of the hole is 45º. It was drilled upto the depth of 40m. The rock type was slightly weathered, hard, strong, medium to coarse grained, iron stained gneiss with kyanite and garnet. The cores obtained from 1.1 m to 9 m depth were excellent quality. The RQD of the cores were more than 90% to this depth. But at depths of 14 m, 18 m and from 20

Hydro Consult Nyadi Hydropower Project Volume I Main Report
Nyadi Hydropower Limited
7-33
m to 24 m, both of the above parameters were less than 60%. This might be due to the low quality cores of weathered rocks. The cores obtained from rest of the hole depth were satisfactory.
The RQD is the percentage of core pieces having more than 10 cm in length to the total length of the core. The minimum, maximum and weighted average RQD values for BH3 and BH4 are shown in Volume 2.
The full details of drilling logs and report are provided in Appendix C, Volume 2.
7.7.4 Core tests
Cores obtained from the boreholes were taken to Kathmandu by EDCO for laboratory testing. Tests carried out are described below.
7.7.5 Uniaxial compressive strength test
Uniaxial compression (UCS) tests were carried on core samples from BH3 and BH4. The stress strain curves are shown in Table 7-19
The results of the tests show that the rock of BH4 having UCS 10.1 N/mm2 has very low strength. Rock cores from BH3 (having UCS 40 N/mm2) have low strength according to Deere and Millers classification of intact rock strength. The results are summarised in Table 7-19.
Table 7-19 Uniaxial compressive strength
Test No. Borehole Depth (m) Uniaxial compressive strength N/mm2
Figure
1 BH3 16.78-17.00 37.6 Figure C.19 in Appendix C. 2 BH3 34.70-34.85 39.8 Figure C.20 in Appendix C. 3 BH4 7.15-7.32 10.1 Figure C.21 in Appendix C. 4 BH4 37.65-37.80 9.25 Figure C.22 in Appendix C. Petrographic study The petrographic analysis shows that the rock contains a high content of micaceous minerals. Almost all the rocks contained more than 50% quartz, about 10% orthoclase, 10% plagioclase feldspar, 5-10% biotite, 5-10% muscovite and few grains of garnet and opaque minerals.
The petrographic test results are given in Table C.10 in appendix C.
7.7.6 Point load test
The point load tests had been done on the borehole BH3 and BH4 cores at two different depths. Taking these point loads as a base, the compressive strength was calculated. The rocks have CS range of 25-80 MPa and are fair to good quality. The results are given in Table C.11 and Table C.12 in Appendix C.
7.7.7 Permeability tests
The contractor had attempted several in-situ testing in the boreholes.
In-situ permeability testing in BH1 had been attempted but failed owing to high porosity of river sediments.
An in-situ permeability test was attempted in BH3. Owing to a large open spaced joint it was not possible to carry out the test.
In-situ permeability testing in BH4 was carried out. The result of the test is given in Figure C.12 in Appendix C.

Hydro Consult Nyadi Hydropower Project Volume I Main Report
Nyadi Hydropower Limited
7-34
The obtained lugeon values are presented in the Table 7-20.
Table 7-20 A summary of Lugeon Tests
S.N. Drill Hole No. Location Depth of test, m Lugeon Value Flow Type 1 BH - 4 Surge Shaft 37.00 – 40.10 0.25 Laminar
Currently the drilling team has been mobilized and core drilling work in powerhouse area is going on. The result of drilling work will be incorporated in subsequent stage of report.
7.8 Construction material Construction material sites are located mostly along the right bank of Nyadi River and left bank of Marsyangdi River. All are alluvial deposits which consist of boulder mixed sands. Most of construction materials required for the project will be procured from the domestic producers/ suppliers. Materials such as sand, aggregates, block stones are available locally where as other materials has to be transported.
The main lithology of the area is Gneiss, quartzite and schist. For coarse aggregate the quartzite and gneisses boulder scattered along the banks of the river within the project area can be crushed, either by hand crushing or by crushing machine, depending upon the volume of the amount required. This can be done in both headworks and powerhouse sites.
Fine aggregates can be extracted from the Intake area, Naiche, Dule odar and Male Bagar. They fall under the category poorly graded sand according to Unified Soil Classification System (USCS). Downstream of powerhouse area also posses fine materials, but the area falls under the license area of other project.
As the forest is in the tropical zone, high quality timbers like Salla, Chilaune, Simal, Utis, Khayer are the mainly available trees. Bamboo for the project use will be obtained easily.
7.8.1 Locations of sampling pits
Samples of construction aggregates were taken from six different locations. These are Male Bagar, Dule Odar, Chanaute Bagar, Naiche and the intake site. The sampling locations of TP1, TP2 and TP3 are within the project area and are indicated on the geological drawings. All the sampling locations are shown in Figure C.18 in Appendix C. Samples from TP1 to TP3 were taken by EDCO. Samples from TP4 to TP6 were taken by the Consultant.
The summary of the sampling pits is shown in Table 7-21.
Table 7-21 Summary of sampling pits
TP Location Quantity of sample Kg
Size Depth from surface
1 Naiche 25 1.00 m2 0.50 m 2 Intake 25 1.00 m2 0.50 m 3 Intake 30 1.00 m2 0.60 m 4 Chanaute Bagar 30 0.75 m2 0.75 m 5 Dule Odar 25 0.50 m2 0.50 m 6 Male Bagar 16 Sample was taken from the
existing cross slope 0.50 m - 4.0 m
7.8.2 Construction material testing
All the laboratory tests were carried out by EDCO. All result sheets were also provided by EDCO.

Hydro Consult Nyadi Hydropower Project Volume I Main Report
Nyadi Hydropower Limited
7-35
7.8.3 Gradation test
Gradation tests were carried out on the total sample from all the test pits. Separate tests were carried out for the coarse and fine aggregates for test pits TP1 and TP2. A summary of the tests is given in Table 7-22. A reference is provided to the test result tables and gradation curves.
Table 7-22 Summary of gradation tests
TP Location Depth (m)
All aggregate Fine aggregate Coarse aggregate
1 Intake site, Pit No.1
Table C.13 Figure C.1 Appendix C.
Table C.14 Table C.15
2 Intake site, Pit No.2
Table C.16 Figure C.2 Appendix C.
Table C.17 Table C.18
3 Intake site, Pit No.3
Table C.19 Figure C.3 Appendix C.
No test No test
4 Chanaute Bagar Table C.20 Figure C.4 Appendix C.
No test No test
5 Dule Odar Table C.21 Figure C.5 Appendix C.
No test No test
6 Male Bagar 0.3-1.8 Table C.22 Figure C.6 Appendix C.
No test No test
1.8-2.8 Table C.23 Figure C.7 Appendix C.
2.8-3.3 Table C.24 Figure C.8 Appendix C.
According to Unified Soil Classification System the tested samples can be named as below:
TP1-poorly graded gravels (GP)
TP2-poorly graded sands (SP)
TP3-well graded gravels (GW)
TP4-poorly graded silty sand (SP-SM)
TP5-poorly graded sand (SP)
TP6 (0.3-1.8m)-sand poorly graded
TP6 (1.8-2.8m)-poorly graded gravel (GP)
TP6 (2.8-3.8m)-poorly graded silty sand
7.8.4 Flakiness index
Test results are presented in Table C.25 and Table C.26 in Appendix C. The flakiness index of samples taken from the TP1 and TP2 is the same and is 28%.
It is generally recommended that the flakiness index should not exceed 30% for concrete. From this data it can be concluded that the indices are within the limits. Elongated and flaky aggregates lower the workability and durability of the concrete.
7.8.5 Elongation index
Test results are presented in Table C.27 and Table C.28 in Appendix C. The elongation index for the test pits TP1 and TP2 are 15% and 14% respectively.
The elongation index should not exceed 15% for concrete. From this data it can be concluded that both of the indices are within the recommended limits but approach the maximum recommended level.

Hydro Consult Nyadi Hydropower Project Volume I Main Report
Nyadi Hydropower Limited
7-36
7.8.6 Soundness test
Test results are presented in Table C.29 and Table C.30 in Appendix C. The maximum permissible loss in sodium soundness test after 5 cycles with sodium sulphate for aggregate is 12%.
The results of the tests ranged from 0.75% (TP1) to 1.24% (TP2) indicate that sodium sulphate soundness is not a concern.
7.8.7 Organic impurities
The test results are presented in Table C.31 and Table C.32 in Appendix C.
The results of tests of two samples from TP1 and TP2 exhibited a lighter colour than the standard, which suggests that organic impurities are within the permissible range.
7.8.8 Los Angeles Abrasion Test (LAAT)
The test results are presented in Table C.33 and Table C.35 in Appendix C. Results of these tests show that all of the samples exceed 30% (56% for TP1 and 40% for TP2 and 38% for TP4). 30% is the maximum desirable limit for the concrete used for wearing surface and 50% for other concrete work.
All of the tested samples show that the aggregate has a low resistance to abrasion. The results indicate that it is not recommended that these aggregates be used for concrete required for a durable road wearing surface, or subject to abrasion from sediment load. The results of TP2 and TP4 suggest that the aggregate can be used for the other concrete structures.
7.8.9 Mica content
The test results are presented in Table C.36 and Table C.37 in Appendix C. Mica content of the samples tested from range 5 to 18% by volume. The approximate mica content by weight range from 1.7 to 6% by weight (converting factor is taken 3).
The desirable mica content for the use in concrete should not exceed 1% by weight. In Nepal this is a very onerous figure and 3% is a commonly adopted limit. Mica content of the aggregates of TP1, TP2 and TP5 exceed the recommended limit of 3% by weight, while the sample of TP4 and TP6 top layer are within the recommended range. It is known that the mineral and physical properties of mica vary considerably and by so doing could give irregular results when included in concrete. Therefore, before any blanket limitations are widely applied, each type of mica should be investigated. It is imperative that a thorough concrete testing programme be carried out before any concrete is used in the works.
7.8.10 Conclusion
From analysis of the tests results received so far it is concluded that the aggregate of Chanaute Bagar (TP4) is the best aggregate source site for concrete with comparatively low abrasion value, low mica content, sufficient in quantity and low transportation cost.
7.9 Geophysical survey introduction The electrical resistivity survey was carried out by Geophysical Research and Consultancy Service (GRCS) in two stages.
7.9.1 Introduction (GRCS)
Nyadi Hydropower Project is located on the Nyadi River, which is one of the tributaries of the Marsyangdi River. It is 20 MW capacity project. The entire project area is within Bahundanda Village Development Committee (VDC), Lamjung District, and Western Development Region of Nepal. The study area lies on and around the proposed tunnel alignment of Nyadi Hydropower Project.
Hydro Consult Nyadi Hydropower Project Volume I Main Report
Nyadi Hydropower Limited
7-37
2-D electrical resistivity method is also known by the name electrical resistivity tomography (ERT). Electrical resistivity survey was conducted at the location of penstock alignment, access tunnel alignment, powerhouse, surge adit location, headrace tunnel low cover point and adit tunnel at Naiche. To measure the electrical resistivity of the subsurface 2-D electrical profiling was applied. This report deals with the fieldworks and interpretations of the 2D-ERT survey in the areas of Nyadi Hydropower Project.
Preliminary processing of the data was carried out in the field. Final processing of the data was carried out in Kathmandu. This report includes electrical tomograms and geoelectric sections of five traverses.
Rock type and electrical resistivity
Electrical resistivity method is very sensitive to rock and other material type change. Because of the wide variation in electrical resistivity of different rock types and other unconsolidated materials the electrical resistivity method is widely used in site investigation, hydrogeology and mineral exploration. The method is capable of detecting watertable, dry layers from saturated, fractured and weathered rock from intact rock, contact between different rock types and electronically conducting minerals from ionic conduction rocks.
The study area is formed by metamorphic rocks. Predominant rock types are metamorphic rocks of pelitic origin (schist, phyllite and gneiss) and quartzite. Unaltered metamorphic and intrusive rocks have low porosity (usually 0.1%-3%, rarely reaches to 5%) and very few pores are interconnected. Pores in metamorphic rocks resemble very fine capillary tubes. Below the zone of weathering even if the regional water table is at depth the water will rise in these capillary tubes. In other words due to fine pore structure these rocks have good moisture holding capacity than the parent sedimentary rocks. Low value of porosity is the main cause that the electrical resistivities of fresh metamorphic rocks heavily depends on the rock matrix and in less extend to the mineralization of water in the capillary.
A question is always raised that the electrical resistivity of a rock highly depends on the water saturating the rock and its mineralization. Unsuccessful interpretation of electrical resistivity data is attributed to this cause. This is an oversimplified and generalized conclusion. Researchers conducted in the field of petrophysics reveal that for different landscape and for different rock type there is no such abrupt changes in the mineralization of water saturating pore space of the fresh rocks. In plain landscape, resistivity changes more quickly both in aerial and depth. However, electrical resistivities of water saturating the fresh rocks are fairly homogeneous both in aerial and depth for many kilometers in the mountain area.
The grade of metamorphism also has the influence on electrical resistivity. The grade of metamorphism has direct impact on the porosity and there will be progressive increase in rock resistivity as grade of metamorphism increases. In pelitic rocks a sequence of increasing metamorphic grade may be traced from shale through slate, then phyllite, schist, gneiss and eventually granulite and migmatite. In other sequences quartz sandstones becomes quartzite, limestone becomes marble.
Within the rock types found in the project area there is minor variation in porosity. Although very small amount of porosity is present the percentage of porosity varies with in these rock types. Both combined effect of rock matrix and porosity produces different electrical resistivity effect for different rock types: high for quartzite and gneiss and lower for schist and phyllite.
Study objectives
The objectives of the present study were to investigate the geological conditions of the project penstock tunnel, access tunnel, powerhouse, surge shaft adit, headrace tunnel at low cover and Naiche adit.

Hydro Consult Nyadi Hydropower Project Volume I Main Report
Nyadi Hydropower Limited
7-38
7.9.2 Methodology (GRCS)
Data acquisition 2-D electrical resistivity profiling
In a conventional electrical resistivity profiling only lateral variation in electrical resistivity is measured. In conventional method of data acquisition the distance between electrodes are kept fixed and moved along a profile. This method has a constant depth of investigation. A new method of data acquisition and processing which is called by different names such as 2-D electrical profiling, electrical imaging or electrical resistivity tomography (ERT) shows both vertical and lateral variations in electrical resistivity. In this method by increasing the distance between current and potential electrodes, one can get information from the deeper part of the subsurface, and by shifting both current and potential electrodes along a profile it is possible to record lateral change in electrical resistivity that is related with the change in geology in the subsurface.
Proper design of the field layouts of electrodes is necessary to obtain reliable field data. The design of the method is also dictated by geological problems to be solved and depth requirement. In the present study ERT was conducted by using pole-pole configuration.
In pole-pole configuration one of the current electrode (B) and one potential electrode (N) is placed at remote. The potential difference measured between M and N electrodes is equivalent to the potential created by electrode A. The electrical resistivity is calculated by using following formula:
IVka =ρ
where;
K =2πa, is called geometrical coefficient in m a = electrode spacing in m V = potential in mV I = current in mA ρa = apparent resistivity measured in Ohm.m
Measurements in all profiles were carried out by using pole-pole arrangement. In pole-pole arrangement field layout of cables is laborious and takes much time. However pole-pole arrangement has got greater penetration effect simple relationship with topography than other electrode arrangements of common practice. This was the simple reason that the pole-pole electrode arrangement was preferred.
Measurements were carried out by using a resistivity meter TERRAMETER SAS300C an ABEM product, Sweden. The equipment has very high input impedance suitable for unfavorable grounding conditions. The equipment uses very low frequency about 0.4 Hz which is equivalent to resistivity measurements in DC. The equipment has very high capability of natural and cultural noise rejection.
Contact resistance in the project area was very low (less than 2 kOhm.). There was no problem of current leakage. Leakage test indicated that the measured resistivity values differed in less than 1%.
Data processing
Data were processed in two stages: electrical imaging (smooth model inversion) and polygon modeling.
Image processing
The resistivity images were processed by using software for smooth model inversion RES2DINV ver. 2. This computer program automatically determines a two-dimensional resistivity model for the subsurface using the data obtained from electrical imaging surveys. The depth of the bottom row of blocks is set to be approximately equal to the equivalent depth of investigation of the datum points with the largest electrode spacing. A finite difference forward modeling subroutine is used to calculate the apparent resistivity values, and a non-linear least-squares optimization technique is used
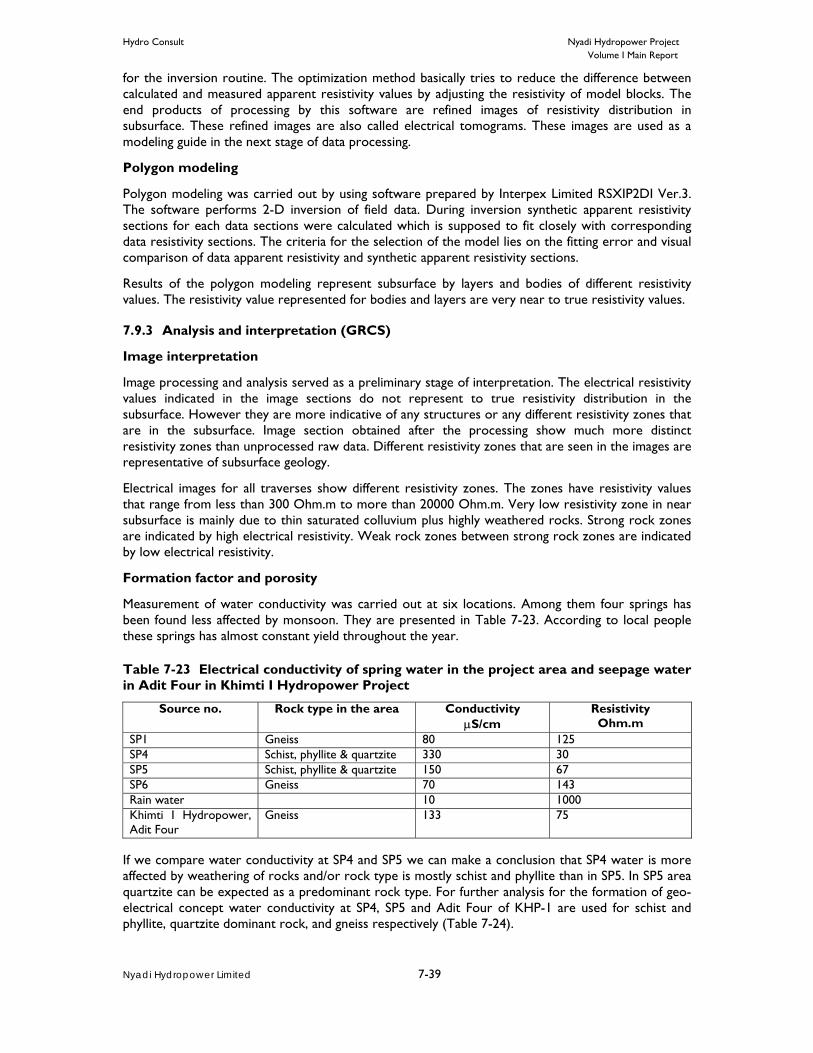
Hydro Consult Nyadi Hydropower Project Volume I Main Report
Nyadi Hydropower Limited
7-39
for the inversion routine. The optimization method basically tries to reduce the difference between calculated and measured apparent resistivity values by adjusting the resistivity of model blocks. The end products of processing by this software are refined images of resistivity distribution in subsurface. These refined images are also called electrical tomograms. These images are used as a modeling guide in the next stage of data processing.
Polygon modeling
Polygon modeling was carried out by using software prepared by Interpex Limited RSXIP2DI Ver.3. The software performs 2-D inversion of field data. During inversion synthetic apparent resistivity sections for each data sections were calculated which is supposed to fit closely with corresponding data resistivity sections. The criteria for the selection of the model lies on the fitting error and visual comparison of data apparent resistivity and synthetic apparent resistivity sections.
Results of the polygon modeling represent subsurface by layers and bodies of different resistivity values. The resistivity value represented for bodies and layers are very near to true resistivity values.
7.9.3 Analysis and interpretation (GRCS)
Image interpretation
Image processing and analysis served as a preliminary stage of interpretation. The electrical resistivity values indicated in the image sections do not represent to true resistivity distribution in the subsurface. However they are more indicative of any structures or any different resistivity zones that are in the subsurface. Image section obtained after the processing show much more distinct resistivity zones than unprocessed raw data. Different resistivity zones that are seen in the images are representative of subsurface geology.
Electrical images for all traverses show different resistivity zones. The zones have resistivity values that range from less than 300 Ohm.m to more than 20000 Ohm.m. Very low resistivity zone in near subsurface is mainly due to thin saturated colluvium plus highly weathered rocks. Strong rock zones are indicated by high electrical resistivity. Weak rock zones between strong rock zones are indicated by low electrical resistivity.
Formation factor and porosity
Measurement of water conductivity was carried out at six locations. Among them four springs has been found less affected by monsoon. They are presented in Table 7-23. According to local people these springs has almost constant yield throughout the year.
Table 7-23 Electrical conductivity of spring water in the project area and seepage water in Adit Four in Khimti I Hydropower Project
Source no. Rock type in the area Conductivity µS/cm
Resistivity Ohm.m
SP1 Gneiss 80 125 SP4 Schist, phyllite & quartzite 330 30 SP5 Schist, phyllite & quartzite 150 67 SP6 Gneiss 70 143 Rain water 10 1000 Khimti I Hydropower, Adit Four
Gneiss 133 75
If we compare water conductivity at SP4 and SP5 we can make a conclusion that SP4 water is more affected by weathering of rocks and/or rock type is mostly schist and phyllite than in SP5. In SP5 area quartzite can be expected as a predominant rock type. For further analysis for the formation of geo-electrical concept water conductivity at SP4, SP5 and Adit Four of KHP-1 are used for schist and phyllite, quartzite dominant rock, and gneiss respectively (Table 7-24).
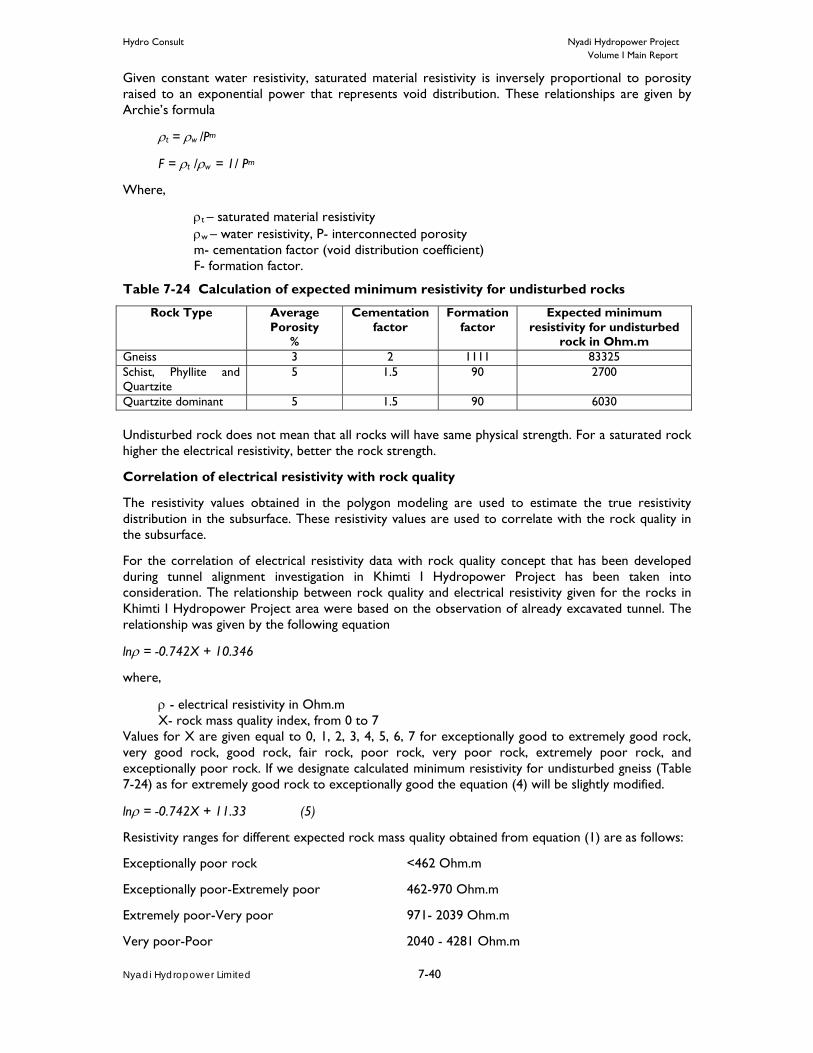
Hydro Consult Nyadi Hydropower Project Volume I Main Report
Nyadi Hydropower Limited
7-40
Given constant water resistivity, saturated material resistivity is inversely proportional to porosity raised to an exponential power that represents void distribution. These relationships are given by Archie’s formula
ρt = ρw /Pm
F = ρt /ρw = 1/ Pm
Where,
ρt – saturated material resistivity ρw – water resistivity, P- interconnected porosity m- cementation factor (void distribution coefficient) F- formation factor.
Table 7-24 Calculation of expected minimum resistivity for undisturbed rocks
Rock Type Average Porosity
%
Cementation factor
Formation factor
Expected minimum resistivity for undisturbed
rock in Ohm.m Gneiss 3 2 1111 83325 Schist, Phyllite and Quartzite
5 1.5 90 2700
Quartzite dominant 5 1.5 90 6030
Undisturbed rock does not mean that all rocks will have same physical strength. For a saturated rock higher the electrical resistivity, better the rock strength.
Correlation of electrical resistivity with rock quality
The resistivity values obtained in the polygon modeling are used to estimate the true resistivity distribution in the subsurface. These resistivity values are used to correlate with the rock quality in the subsurface.
For the correlation of electrical resistivity data with rock quality concept that has been developed during tunnel alignment investigation in Khimti I Hydropower Project has been taken into consideration. The relationship between rock quality and electrical resistivity given for the rocks in Khimti I Hydropower Project area were based on the observation of already excavated tunnel. The relationship was given by the following equation
lnρ = -0.742X + 10.346
where,
ρ - electrical resistivity in Ohm.m X- rock mass quality index, from 0 to 7
Values for X are given equal to 0, 1, 2, 3, 4, 5, 6, 7 for exceptionally good to extremely good rock, very good rock, good rock, fair rock, poor rock, very poor rock, extremely poor rock, and exceptionally poor rock. If we designate calculated minimum resistivity for undisturbed gneiss (Table 7-24) as for extremely good rock to exceptionally good the equation (4) will be slightly modified.
lnρ = -0.742X + 11.33 (5)
Resistivity ranges for different expected rock mass quality obtained from equation (1) are as follows:
Exceptionally poor rock <462 Ohm.m
Exceptionally poor-Extremely poor 462-970 Ohm.m
Extremely poor-Very poor 971- 2039 Ohm.m
Very poor-Poor 2040 - 4281 Ohm.m

Hydro Consult Nyadi Hydropower Project Volume I Main Report
Nyadi Hydropower Limited
7-41
Poor-Fair 4282 - 8991 Ohm.m
Fair-Good 8992- 18883 Ohm.m
Good-Very good 18884-39656 Ohm.m
Very good-Extremely good 39657-83325 Ohm.m
Extremely good -Exceptionally good >83325 Ohm.m
Above ranges are approximate and may overlap with the nearby range. This fact is necessary to bear in the mind during an interpretation of geo-electric section. Geo-electric sections are prepared to present the expected rock quality.
Geo-electric sections
The first study was conducted on July 1999 and the second study was carried out on Sept. - Oct. 2007. The interpretation and figures were supplied by GRCS.
The list of electrical resistivity survey sections conducted on July 1999 is indicated in Table 7-25. The output profiles are indicated by the figure number.
Table 7-25 List of electrical resistivity survey sections conducted on July 1999
Traverse no.
Location Section horizontal length (m)
Figure no.
1 Nana village to Powerhouse 1174.5 C.13 2 Across to the underground powerhouse 479.12 C.14 3 Across the old surge shaft 319.69 C.15 4 Across the tunnel near Nana village 393.94 C.16 5 Parallel to the Naiche adit 181.00 C.17
Locations of the electrical resistivity survey traverses are shown on the geological drawings
Five geo-electric sections were prepared for five 2-D electrical profiles. These geo-electric sections are used to present rock mass quality in the subsurface. These sections are presented in Figure C.13 to Figure C.17 in Appendix C.
Traverse one
The section of this traverse is shown in Figure C.13 in Appendix C.
Lower part of the traverse one will meet very poor to poor rock mass. This area seems to be dominated mostly by quartzite. Tailrace tunnel will run mostly through this area. Tailrace tunnel will meet highly sheared rock mass in the central part of the area. Powerhouse area is at boundary between extremely poor to very poor rock mass and very poor to poor rock mass area. Extremely poor to very poor rock mass area may form by phyllite and schist. Further up along the penstock an exceptionally poor to extremely poor rock mass area indicated by very low resistivity. This zone separates tow fair to good rock mass condition. This is typical for shearing rock mass zone. Fair to good rock mass condition is characteristic for gneiss and quartzite.
Very low resistivity effects near the surface to shallow depth are mainly from saturated thin colluvium and highly weathered rocks.
Traverse two
The section of this traverse is shown in Figure C.14 in Appendix C.
Access tunnel will meet in general very poor to poor rock mass condition. Traverse two indicates that powerhouse area is in slightly better rock mass condition than in traverse one. This higher resistivity effect can be attributed to the side effect from higher resistivity rock mass from tailrace and access tunnel areas.
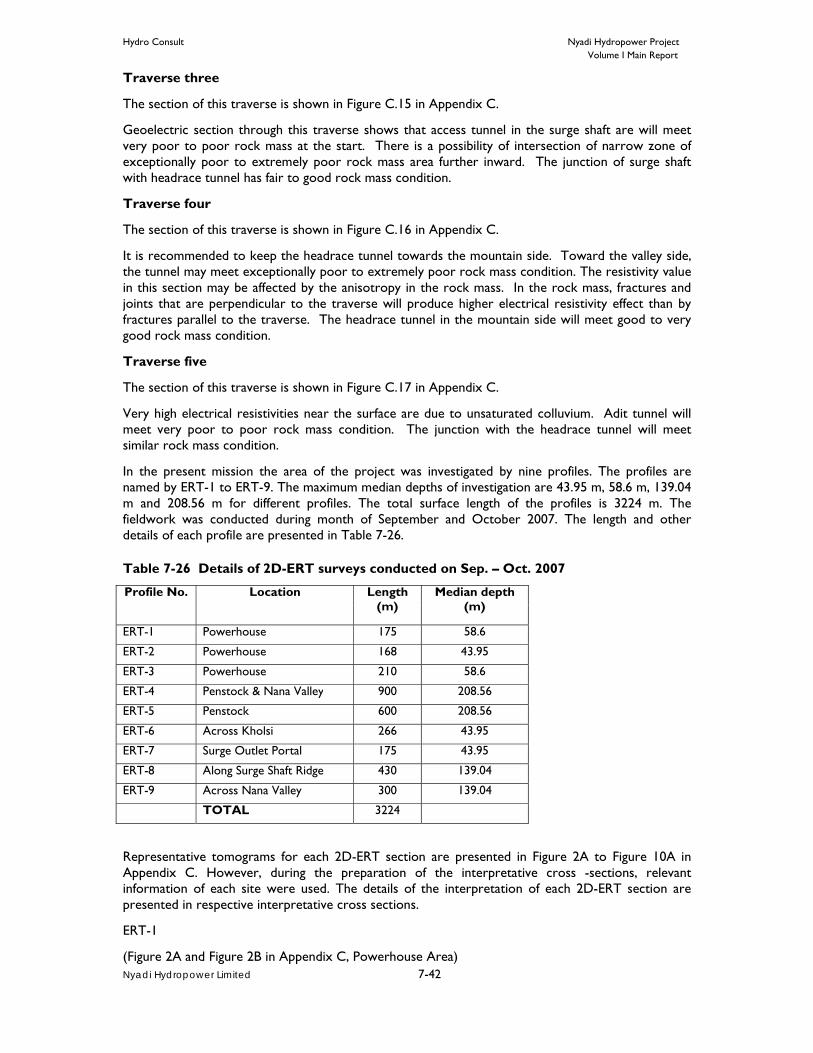
Hydro Consult Nyadi Hydropower Project Volume I Main Report
Nyadi Hydropower Limited
7-42
Traverse three
The section of this traverse is shown in Figure C.15 in Appendix C.
Geoelectric section through this traverse shows that access tunnel in the surge shaft are will meet very poor to poor rock mass at the start. There is a possibility of intersection of narrow zone of exceptionally poor to extremely poor rock mass area further inward. The junction of surge shaft with headrace tunnel has fair to good rock mass condition.
Traverse four
The section of this traverse is shown in Figure C.16 in Appendix C.
It is recommended to keep the headrace tunnel towards the mountain side. Toward the valley side, the tunnel may meet exceptionally poor to extremely poor rock mass condition. The resistivity value in this section may be affected by the anisotropy in the rock mass. In the rock mass, fractures and joints that are perpendicular to the traverse will produce higher electrical resistivity effect than by fractures parallel to the traverse. The headrace tunnel in the mountain side will meet good to very good rock mass condition.
Traverse five
The section of this traverse is shown in Figure C.17 in Appendix C.
Very high electrical resistivities near the surface are due to unsaturated colluvium. Adit tunnel will meet very poor to poor rock mass condition. The junction with the headrace tunnel will meet similar rock mass condition.
In the present mission the area of the project was investigated by nine profiles. The profiles are named by ERT-1 to ERT-9. The maximum median depths of investigation are 43.95 m, 58.6 m, 139.04 m and 208.56 m for different profiles. The total surface length of the profiles is 3224 m. The fieldwork was conducted during month of September and October 2007. The length and other details of each profile are presented in Table 7-26.
Table 7-26 Details of 2D-ERT surveys conducted on Sep. – Oct. 2007
Profile No. Location Length (m)
Median depth (m)
ERT-1 Powerhouse 175 58.6
ERT-2 Powerhouse 168 43.95
ERT-3 Powerhouse 210 58.6
ERT-4 Penstock & Nana Valley 900 208.56
ERT-5 Penstock 600 208.56
ERT-6 Across Kholsi 266 43.95
ERT-7 Surge Outlet Portal 175 43.95
ERT-8 Along Surge Shaft Ridge 430 139.04
ERT-9 Across Nana Valley 300 139.04
TOTAL 3224
Representative tomograms for each 2D-ERT section are presented in Figure 2A to Figure 10A in Appendix C. However, during the preparation of the interpretative cross -sections, relevant information of each site were used. The details of the interpretation of each 2D-ERT section are presented in respective interpretative cross sections.
ERT-1
(Figure 2A and Figure 2B in Appendix C, Powerhouse Area)

Hydro Consult Nyadi Hydropower Project Volume I Main Report
Nyadi Hydropower Limited
7-43
The subsurface of the area has two layers. The first layer is supposed to be of high flood or glacier origin, and mixed with materials of slope origin. The electrical resistivity of this layer indicates that the layer is predominated by finer materials. The second layer has high electrical resistivity and it is interpreted as bedrock. The bedrock is close to the surface towards the end of the profiles and its face steeply dipping towards the valley. There is no bedrock at shallow depth in the area of proposed powerhouse.
ERT-2
(Figure 3A and Figure 3B in Appendix C, Powerhouse Area)
This section is close to the proposed powerhouse site. This section does not show any continuous presence of bedrock at the depth. Very small patches of high resistivity zones at depth and towards the end of the profile could be the effect from the bedrock. However this information is not sufficient to tell about the presence of bedrock.
ERT-3
(Figure 4A and Figure 4B in Appendix C, Powerhouse Area)
The result of this section is very similar to ERT-1. The bedrock is expected at greater depth. The face of the bedrock is steeply dipping towards the valley side. There is no bedrock expected at shallow depth in the area of proposed powerhouse site.
ERT-4
(Figure 5A and Figure 5B in Appendix C, Penstock & Nana Valley)
The tomogram can be interpreted as two layered subsurface. The first layer has two bodies of contrasting resistivity: low resistivity in the lower and central portion of the section and high resistivity towards the end of the profile. The low resistivity effect in the first layer is considered mainly due to the presence flood and glacier deposits where as high resistivity towards the end of the profile is mainly due to talus deposit. In the second layer three major low resistivity zones can be identified with in the high resistivity bedrock. These low resistivity zones in the bedrock is mainly due to the presence of sheared zones.
ERT-5
(Figure 6A and Figure 6B in Appendix C, Penstock)
This section shows a two layered model. The first layer has low electrical resistivity possibly of flood and glacier origin. The second layer is bedrock. The bedrock indicates two major low electrical resistivity zones which are due to the presence of sheared zones. These sheared zones could be related with the sheared zones found in the lower and central portion of ERT-4.
ERT-6
(Figure 7A and Figure 7B in Appendix C, Across Kholsi)
This section crosses two other sections ERT-4 and ERT-5. This section seems to run very close to sheared rock mass zones revealed in ERT-4 and ERT-5. It may include some off line effects. So the model indicated in this section could be distorted effects of the sheared and intact bedrock. The model towards the start of the profile is dubious.
ERT-7
(Figure 8A and Figure 8B in Appendix C, Surge Outlet Portal)
The lower portion of the section indicates that the bedrock is covered by overburden predominated by finer materials. The bedrock is covered by thin soil or exposed in the central and in the end of the profile. Low resistivity zone with in the bedrock is possibly due to the presence of the zone formed due to the gravitational deformation of the slope.
Hydro Consult Nyadi Hydropower Project Volume I Main Report
Nyadi Hydropower Limited
7-44
ERT-8
(Figure 9A and Figure 9B in Appendix C, Along Surge Shaft Ridge)
Similar to previous sections this profile also shows a two layered model. The first layer has low electrical resistivity. The material of the first layer seems to be of glacier origin. The bedrock is indicated by higher electrical resistivity and the sheared zone by low electrical resistivity zones. The sheared zone indicated at depth towards the end of the profile is most likely the effect from the major shear zone that runs along the Nana Valley.
ERT-9
(Figure 10A and Figure 10B in Appendix C, Across Nana Valley)
ERT-9 indicates two layered model. The material of the first layer is most likely to be glacier origin with the mixture of different particle size. Towards the end of the profile a small patch of the talus deposit is indicated by very high electrical resistivity. The second layer indicates that there is a low electrical resistivity zone between two high electrical resistivity zones. This low resistivity zone is the indication of sheared rock mass zone which is along the Nana Valley.
7.9.4 Conclusions (GRCS)
Followings are the general conclusions drawn after the first stage investigation (July 1999):
Underground Powerhouse is located at very poor to poor rock mass area. Extremely poor to very poor rock mass condition may be met towards the upstream of powerhouse area.
Tailrace tunnel in general will meet very poor to poor rock mass area. There is a possibility of meeting exceptionally poor rock mass area in the central part of the tailrace tunnel.
Underground Penstock will pass through a zone of exceptionally poor to extremely poor rock mass area. However, fair to good rock mass will meet at the start and end of the penstock.
Tunnel at Traverse Three will met fair to good rock condition.
Tunnel at Traverse Four will meet good to very good rock condition.
Adit Tunnel at Traverse Five will meet very poor to poor rock mass condition.
Followings are the general conclusions drawn after the second stage investigation (Sept. – Oct. 2007):
Surface Powerhouse Area There is no bedrock at shallow depth in the proposed powerhouse site. The bedrock head dips steeply towards the valley side. The overburden material seems to be of high flood and/or glacier origin and materials of slope origin. It consists of considerable amount of fine materials.
Penstock and Underground Powerhouse Area This area seems to be made of blocks of good rock mass quality separated by a number of sheared rock mass zones. It seems that the area could have a number of sheared rock mass zones.
Surge Outlet Portal The bedrock in the portal area seems to be in good condition. Low resistivity zone with in the bedrock seems to be formed due to the gravitational deformation of the bedrock in the slope. It seems that this is not a fully developed sheared plane.
Surge Shaft Ridge Area The thickness of the overburden in the Surge Shaft Ridge Area may reach up to 50 m. This ridge may have some effects from the sheared planes towards the upstream (as indicated by ERT-8).

Hydro Consult Nyadi Hydropower Project Volume I Main Report
Nyadi Hydropower Limited
7-45
Nana Valley The investigation across Nana Valley indicates that the valley is most likely to be formed due the development of sheared rock mass zones.
Currently the 2D ERT Survey team has been mobilized and ERT survey in powerhouse area has been carried out and report preparation of ERT is going on. The result of 2D ERT survey work will be incorporated in subsequent stage of report.

Hydro Consult Nyadi Hydropower Project Volume 1 Main Report
Nyadi Hydropower Limited
8-1
8. PLANT CAPACITY OPTIMIZATION
8.1 Introduction The plant capacity is dependent primarily on the discharge in the river if other factors are pre-assumed to be constant. Discharge of varying exceedance is required for determining the size of structures which ultimately impact on the associated costs and benefits. Thus this optimization chapter deals with the study of comparative costs and benefits of various discharges of varying exceedance flows in order to determine the most economical installed capacity of the plant.
8.2 Objectives The main objective of optimization is to determine the optimum plant capacity at which the discharge will produce maximum benefit. The benefit is revenue from sales of the generated energy of the power plant. It is a comprehensive analysis of cost benefits analysis and fixing the optimum capacity of project.
8.3 Approach and Methodology The selection of the optimum plant capacity is determined from the economic and financial indicators such internal rate of return, benefit cost ratio and optimum utilisation of natural resources.
The Nyadi Khola is a steep River with perennial discharge and gross head available within the study area is sufficient to produce power ranging from 18.50 MW to 50.10 MW. From the flow duration curve as discussed in section 2.3, it has been determined that the discharges available to divert at the intake vary from 6.74 m3/sec to 18.50 m3/sec (including the tailrace water of Siuri Hydroelectric Project) for the optimization purpose which would produce plant capacities from 18.50 MW to 50.10 MW respectively. In general practice, more discharge is diverted than design discharge for flushing, which will not consider for optimization purposes. It was assumed that plant capacity below and above these discharges would yield relatively lower returns, therefore the optimization study was limited to the above range.
The procedure followed for each option during the optimization is described below:
1. Determination of conceptual layout of the scheme.
2. Determination of discharge options (as explained above) based on hydrology of the river at headworks and additional flow available from Siuri tailrace.
3. Determination of gross head of the scheme.
4. Preliminary design of the structures like weir with orifice type frontal intake and bottom sluice with two radial gates, gravel trap, intake tunnel, settling basin with flushing arrangement, surge shaft, underground powerhouse with access tunnel and tailrace tunnel and Provision of tapping Siuri tailrace flow.
5. Determination of optimum size of headrace tunnel and penstock pipe.
6. Determination of head loss and computation of energy based on the diversion discharge.
7. Determination of the cost of individual structure and the total cost of the project.
8. Computation of benefit-cost analysis and determination of financial indicators for each option.
8.4 Hydrology Hydrology is the prime factor on which energy and revenue are based. The main purpose of the optimization is to determine the optimum discharge from techno-economic point of view. The optimization has been carried out based on mean daily flow available in the river. Long-term average

Hydro Consult Nyadi Hydropower Project Volume 1 Main Report
Nyadi Hydropower Limited
8-2
monthly flow of Nyadi intake is calculated by correlating with flow data (DHM) of Seti River, gauge reading data of Nyadi HP and available flow data in Siuri tailrace (as per feasibility report of Siuri SHP), which are presented in Table 8.1.
Table 8.1 Intake site average monthly flows in m3/s
Month Nyadi at intake (m3/sec)
Siuri Tailrace (m3/sec)
Combined discharge (m3/sec)
Baishakh 4.38 0.64 5.02 Jestha 9.31 1.40 10.71 Ashar 24.95 1.40 26.35 Shravan 40.12 1.40 41.52 Bhadra 35.34 1.40 36.74 Asoj 21.44 1.40 22.84 Kartik 9.94 1.40 11.34 Mangsir 5.45 1.32 6.77 Poush 3.75 1.00 4.75 Magh 3.38 0.75 4.13 Falgun 3.08 0.54 3.62 Chaitra 3.34 0.39 3.73 There will be downstream riparian release of 10% of the minimum mean monthly flow for fish and aquatic life which is equivalent to 0.31 m3/sec.
8.5 Plant Capacity Ranges For optimization, different options are determined for probability of exceedance flow ranging from 30% to 50%. It is obvious that lower the probability of exceedance, the higher will be the plant capacity and hence higher energy generation. It is however not mandatory that the highest plant capacity will be most optimum scheme. Thus, the ranges of plant capacities were determined by the design discharge at various probabilities of exceedance, the corresponding net head and overall efficiency (85.47%). The plant capacity for different probability of exceedance have been presented and listed in Table 8.2. Table 8.2 Plant Capacity Ranges
Plant capacity(MW)
Rated Discharge (m3/s)
Probability of exceedance (%)
Gross Head (m)
Head loss (m)
Net Head (m)
18.50 6.74 50 333.90 5.76 328.13
22.40 8.16 45 333.90 5.63 328.27
30 11.08 40 333.90 10.36 323.54
36.30 13.26 35 333.90 7.351 326.59
50.10 18.50 30 333.90 10.66 323.24

Hydro Consult Nyadi Hydropower Project Volume 1 Main Report
Nyadi Hydropower Limited
8-3
8.6 Conceptual Layout The concept of project layout is proposed to maximize the discharge and head within the project boundary. The headworks area lies at upstream of the confluence of Nyadi and Siuri Khola. Tailrace water of Siuri Khola Hydropower Project is also used in this project along the left bank of the Nyadi River via pumping mechanism.
The headworks structures will comprise of concrete diversion weir with bottom sluice and two radial gates, frontal intake with orifices, gravel trap and intake tunnel. All of these structures lie on the right bank of the Nyadi Khola. There will be two bifurcating tunnels to feed the diverted water to underground settling basins with flushing arrangement. Then, discharge will be passed through 3,937m long headrace tunnel following the ridge of the hill Sangla and Nana village. A surge shaft with surge shaft adit will be provisioned at the end of Headrace tunnel near Nana village. Steel penstock pipe with surface penstock and drop shaft will connect the headrace tunnel with underground powerhouse located inside the hill on the right bank near Thulobeshi village. The powerhouse comprises of three units of horizontal axis pelton turbines, generators, transformers and other necessary accessories. A switchyard located at foot of the hill on the right bank close to powerhouse will connect to 132 kV Transmission lines of length of about 7km which will evacuate the generated electricity to the proposed NEA Hub at Tunikharka.
A 10.50 km long access road is required to connect the headworks with powerhouse and existing Besishahar- Chame road at Thakanbeshi at the right bank of the Marsyangdi River. Additionally, 3 km link road will be required to connect surge adit outlet from the road to Headworks. Besides, a 52 m long bridge has been proposed to connect the two sides of the Marsyangdi River along the road alignment at Thakanbeshi. The details of structures for each of the options are presented in Table 3.3.

Hydro Consult Nyadi Hydropower Project Volume 1 Main Report
Nyadi Hydropower Limited
8-4
Table 8.3 Project Structures Details
Description 18.50 MW 22.40 MW 30.00 MW 36.30 MW 50.10 MW Weir Crest Level 1381.50 masl 1381.50 masl 1381.50 masl 1381.50 masl 1381.50 masl
Weir Crest Length 14 m 14 m 14 m 14 m 14 m Weir Type Concrete Weir Concrete Weir Concrete Weir Concrete Weir Concrete Weir
Bottom Sluice Unit Two Two Two Two Two Intake Frontal with
orifice Frontal with
orifice Frontal with
orifice Frontal with
orifice Frontal with
orifice No. of Orifice 2 3 3 4 4 Orifice Size 2.25m*3.50m 2.25m*3.50m 2.25m*3.50m 2.25m*3.50m 2.25m*4.50m
Intake Tunnel 57m*2.4m*2.4m 57m*2.6m*2.6m 57m*3m*3m 57m*3.4m*3.4m 57m*4m*4m Settling Basin
Cavern 84m*8m*8.50m 101m*8m*9m 128m*8m*10.3m 165m*8m*11.3m 230m*8m*12.8m
Headrace Tunnel Length
3981 m 3964 m 3937m 3900 m 3835m
Headrace Tunnel Diameter
3.2m 3.2m 3.2 m 3.5 m 3.8m
Surge Shaft Height 26.26m 27.63 m 29.66m 32.08 m 32.64m Surge Shaft Diameter
5m 5m 5m 5m 5m
Surface Penstock 476 m 476 m 476 m 476 m 476m Drop Shaft and Horizontal parts
200m 200m 200m 200m 200m
Diameter 1550mm 1750mm 1750mm 2150mm 2250mm Average Thickness
19.00 mm 19.00mm 19.00mm 22.00mm
22.00mm Powerhouse U/G U/G U/G U/G U/G Turbine Type Horizontal Axis
Pelton Turbine Horizontal Axis Pelton Turbine
Horizontal Axis Pelton Turbine
Horizontal Axis Pelton Turbine
Horizontal Axis Pelton Turbine
No of Units 3 nos. 3nos. 3nos. 4nos. 4nos.
Powerhouse Cavern Size (B*L) 12m*53 m 14m*53 m 14m*53 m 15m*64 m
15m*64 m
Tailrace Tunnel (L*B*H)
225.85m*3.2m*3.2 m
225.85m*3.4m*3.4m
225.85m*3.6m* 3.6m
225.85m* 3.8m*3.8m
225.85m* 4.2m*4.2m
Access road 13.5 KM 13.5 KM 13.5 KM 13.5 KM 13.5 KM Bridge Over
Marsyangdi River 52m 52m 52m 52m 52m
Transmission Line 132kV, 7 KM, NEA Hub
132kV, 7 KM, NEA Hub
132kV, 7 KM, NEA Hub
132kV, 7 KM, NEA Hub
132kV, 7 KM, NEA Hub

Hydro Consult Nyadi Hydropower Project Volume 1 Main Report
Nyadi Hydropower Limited
8-5
8.7 Energy Production Based on the net head, turbine discharge and overall efficiency of the plant, the energy production in a year has been calculated. An outage of 4% has been estimated for transmission loss, self consumption and plant shut down during maintenance periods. Estimated power consumption for rural electrification in project affected area is 0.09 GWh in dry season and 0.18 GWh in wet season. Estimated power consumption for pumping of Siuri tailrace water is 0.99 GWh in dry season and 0.79 GWh in wet season. After deduction of total energy for rural electrification and pumping of Siuri tailrace water, net energy available for sale has been calculated and tabulated below.
Table 8.4 Energy Production
Plant Capacity 18.50 MW 22.40 MW 30MW 36.30 MW 50.10 MW
Total Energy generation (GWh) after deduction of 4% outage
128.97 145.97 177.30 192.40 223.01
Energy for rural electrification (GWh)
0.27 0.27 0.27 0.27 0.27
Energy for pumping (GWh) 1.78 1.78 1.78 1.78 1.78
Net Energy available for sale (GWh)
126.92 143.92 175.25 194.45 234.06
8.8 Cost Estimate The cost components for various capacities on varying exceedance flow are estimated as per the feasibility level design. The size and crest elevation of weir structures remains same in the various discharge, but nos. and size of intake orifice opening is changed as per the design discharges of various exceedance flows. The size of gravel trap, intake tunnel and underground settling basin change with discharges of different option, which have significant impact on the total project cost of various options. From the recent technological development and practices, the tunnel with diameter of around 3.2 m can be mechanically constructed with proper working space and ventilation. Therefore, same size of tunnel is adopted for discharge with the exceedance 40% to 50%. But headrace tunnel size is found optimum for higher discharge based on cost and revenue loss. The size of surge shaft increases with discharge of various capacities and cost of each capacity estimated separately.
Penstock diameter increases with increase of discharge and has significant impact on the total project cost. Although an increase in penstock pipe diameter raises initial cost, the energy output will be increased due to reduction of headloss. So, the penstock is optimized for most cost effective combination of the penstock diameter and thickness. Penstock pipe was adopted for corresponding discharges and associated costs. The thickness of each penstock pipe has been estimated. The cost of anchor blocks and support piers are slightly affected by change in discharge and diameter of the penstock which is estimated accordingly.
Other hydro-mechanical costs like radial gates, bulk head gates, stoplogs, and trashrack etc have been estimated as per the prevailing market rate.
Based on design discharge and rated head, the type and size of turbine are calculated. Sizes of powerhouse caverns are determined accordingly. Then the cost estimate of powerhouse of each option is estimated accordingly. The cost of electro-mechanical parts including turbine, governor, generator, transformers, etc. are estimated based on prevailing practice and market prices.

Hydro Consult Nyadi Hydropower Project Volume 1 Main Report
Nyadi Hydropower Limited
8-6
The estimated base costs of project include transportation, installation and custom duties as well as other applicable taxes. Similarly the cost of transmission line has been estimated based on per kilometre cost of construction of 132kV transmission line and it also includes interconnection arrangement at delivery location. Other cost like tapping of tailrace water of Siuri SHP, access road, environmental mitigation, land acquisition, infrastructures, owner development cost and contingencies have been proportionately increased for the respective plant capacities
Table 8.5 Comparison of the base project costs for various installed Capacities
50.10 MW 36.30 MW 30.00 MW 22.40 MW 18.50 MW
Civil works 34.94 26.70 23.87 21.53 21.05
Electromechanical works 19.16 14.15 10.33 8.95 7.75
Penstock and Hydromechanical works 3.86 3.66 3.26 3.15 2.88
Transmission line works 1.35 1.35 1.35 1.35 1.35
Marsyangdi Bridge and Access Road 2.47 2.47 2.47 2.47 2.47
Siuri Tailrace Flow Diversion 1.41 1.41 1.41 1.41 1.41
Socio-environmental mitigation costs 0.91 0.68 0.45 0.45 0.45
Infrastructure development costs 1.79 1.23 1.02 1.02 1.02
Land acquisition and direct costs 0.54 0.54 0.54 0.54 0.54
Rural Electrification Costs 0.37 0.37 0.37 0.37 0.37
Total contact cost 66.80 52.56 45.06 41.24 39.30
Engineering fees 5.34 4.20 3.61 3.30 3.14
1.5 % insurance,tax and 10% VAT 7.48 5.92 5.22 4.81 4.66
Owner's development cost 3.08 2.82 2.15 2.15 2.15
Total Project cost for year 2010 82.70 65.50 56.04 51.50 49.25
Total Project cost for year 2011 based on price escalation @ 5 p.a. 86.84 68.77 58.84 54.08 51.71
Summary of project contract costs for various installed capacities
Amout in US$ Milion
8.9 Benefit Cost Analysis for Various Installed Capacities The different options with various plant capacities and their corresponding construction costs and benefits are compared by financial analysis based on discounted cash flow. Financial analysis has been performed to find the capacity at which the benefits are maximized. The analysis is carried out in Nepalese Rupees (NRs.) as the price for the energy that will be sold from this project to the bulk power purchaser after finalizing the power purchase agreement (PPA). The relevant specific parameters applied for the financial analysis in this study are adapted as given in section 15.2.
8.10 Result of Benefit Cost Analysis Financial indicators such as IRR on equity and IRR on Project for various installed capacities are shown in Table 8.6 . IRR on equity versus percentage exceedance are shown in figure 3-1.

Hydro Consult Nyadi Hydropower Project Volume 1 Main Report
Nyadi Hydropower Limited
8-7
Table 8.6 Financial Indicators for various installed capacities
Descriptions 18.50 MW 22.40 MW 30MW 36.30 MW 50.10 MW
IRR on Equity 11.28% 13.63% 17.13% 15.47% 14.12%
IRR on Project 13.67% 15.04% 16.995 16.08% 15.32%
Figure 8-1 Optimization Curves EIRR Vs percentage exceedance
8.11 Conclusion and Recommendation Based on the financial analysis of all the options corresponding to different exceedance flow, the project has been found to be optimized at 30 MW corresponding to 40% exceedance.
Thus project engineering works (design and drawings), quantity estimation, costing and financial analysis have been carried out for 30 MW.

Hydro Consult Nyadi Hydropower Project Volume 1 Main Report
Nyadi Hydropower Limited 9-1
9. PROJECT ENGINEERING Nyadi Hydropower Project is a run-of-the-river type project. The proposed system of the power plant will run with its full capacity of 30 MW for about 5 months of the year having the design discharge of 11.08 m3/s at 40% of exceedance.This optimized capacity can be achieved through additional discharge of 1.4 m3/s obtained by tapping the tail race water of Siuri Khola Hydropower Project. The Nyadi river gradient is quite steep and thus it will carry relatively big boulders. The proposed project layout is the best option selected amongst the various alternatives during the study. The project layout is finalized based on the findings of the site observation and recommendation from Hydraulic Model Study.
The main components of the project comprises of diversion weir with frontal intake and two radial bottom sluice gates, gravel trap, intake tunnel, underground settling basin, headrace tunnel, surge shaft, surface steel penstock with drop shaft, underground powerhouse with access tunnel and tailrace tunnel along with the provision of pumping tailrace water of Siuri SHP (Diversion canal, collection reservoir, overhead reservoir and steel pipe) to the Nyadi intake. Furthermore, there is one adit at Naiche Village for sequential tunneling. This adit act as accesses to the headrace tunnel and are so positioned that the tunnel construction can be expedited.
9.1 Headworks The headworks layout is shown on Drawings 1220/01/20A01 to A09 in Appendix L.
9.1.1 Location
The location of headworks (weir, intake, gravel trap and inlet tunnel location) has been proposed at the slightly change to further downstream from the previous the feasibility study. In this study, the general arrangement for Siuri Khola diversion has been also included, additional civil structures for trapping of Siuri tailrace water is also presented.
The intake site in the feasibility study was located further downstream from the point chosen during the previous feasibility study. The main reason behind this is that the river meandering pattern and flow direction as started in draft final report of Hydraulic Model Study.
The present location is approximately 15 m downstream of the original site (proposed in previous feasibility study). An additional head of approximately 2m can be gained by moving the intake to this location by raising the weir crest by the new Himalayan intake concept. The average river gradient at the proposed location is approximately 1 in 35.
The proposed weir is located in a narrow 17 m wide rock gorge. Access to this new site is slightly difficult but in this stage RCC Bridge is also recommend just above the weir axis for gate operation, inspection and maintenance purposed.
Drilling at this site upto 20 m depth (BH-1) has shown that there is no bedrock within the desired depth to form a weir foundation or cutoff (Refer to Section 7). The weir structure will be founded on the river bed colluvium and bridges the two rock walls on either bank. Cutoff walls into the colluvium have been proposed at the upstream and downstream end of the weir. A curtain grout will be formed to control any additional seepage in the weir section.
9.1.2 Design concept
Design criteria The design of the headworks has been changed at this stage after testing in different location and flow condition. Such changes in design concept have been made by Hydro Lab Pvt. Ltd for final verification of headworks design, its performance and layout. All these design concepts and assumptions have been illustrated in the “Hydraulic Model Study of the Headworks of Nyadi Hydropower Project”, Hydro Lab Pvt. Ltd.
Hydro Consult Nyadi Hydropower Project Volume 1 Main Report
Nyadi Hydropower Limited
9-2
After modifying for different option and location of the headworks components, new Himalayan Intake concept has been incorporated for Nyadi Hydropower Project. The client (NHL) and the design team (consultant) agreed to proceed as per this new concept with the following assumptions:
• The size (dimension) of the each hydraulic component provided by the Hydro Lab Pvt. Ltd. is tested and optimized to achieve the best performance.
• Vertical construction joints between the abutment walls are provided on both banks and the main weir body to allow free vertical movement to cope the possible deformation of the foundation.
9.1.3 Proposed headworks arrangement
After careful analysis and carrying out the hydraulic model study, the team from Hydro Lab Pvt. Ltd. and Hydro Consult Pvt. Ltd concluded to carry out further design considering the 'Himalayan Intake' concept. Due to high sediment and river meandering pattern this new concept has been proposed, which will definitely reduce the damage of headworks structure and easily pass the sediment even during the 100 yrs flood period. In general, high weir would require significant energy dissipating structure and also the extra length of stilling basin at the downstream of the weir, but considering this new concept, design team reduce the length of stilling basin. The borehole (BH1) drilled at the intake indicates that bedrock does not exist at the required low depth for this type of weir. In addition, based on the recommendation and the result of tests for different options in hydraulic model study, previous option was discarded and the Himalayan Intake concept has been considered.
The following arrangement is, therefore, proposed:
• Weir with frontal intake and two radial bottom sluice gates • Frontal intake with coarse trashrack • RCC Bridge • Gravel trap • Fine trashrack • Intake tunnel, bifurcation upstream of settling chambers • Two underground settling chambers with S4-system flushing arrangement • Diversion tunnel and fish ladder • Tunnel intake
9.1.4 Hydraulic model study
As per the recommendation to conduct hydraulic model study for the headworks arrangement in the feasibility study, Hydro Lab Pvt. Ltd. performed the model study of headworks arrangement. After observing the different scenarios, Hydro Lab has suggested for the new Himalayan Intake concept. The detail report was produced from the Hydro Lab Pvt. Ltd. (Please refer the Hydraulic Model Study of the headworks of Nyadi Hydropower Project, Final Report). Now, the previous design concept has been discarded and this new concept has been adopted as discussed in the consecutive part of this report.
9.1.5 Diversion weir with frontal intake and two radial bottom sluice gates
The proposed weir is a concrete dam with crest level of 1381.50 masl and 1382.50 masl for the left half and right half respectively. The adopted weir crest axis is located approximately 10m downstream of the previous alternatives.
It has two radial bottom sluice gates below the crest within the weir body each having size of 5 m width and 3 m height. The sill level of the gates is 1371.50 masl. These gates are separated by 3 m thick central pier. 1 m thick concrete central pillar is also recommended just above the center of the weir to increase the head during the low flow condition by using the gate. The gates cover almost whole width of the river along the weir axis. The gate is provided mainly for controlling bed load movements and also regulating the water level upstream of the weir crest. Access arrangements to
Hydro Consult Nyadi Hydropower Project Volume 1 Main Report
Nyadi Hydropower Limited
9-3
the gate chamber and ventilation facilities are made through the right bank flood wall (Refer the Drawing).
The recommended intake location is on the left half with two bifurcated and one in right half of the upstream weir slope orifice opening of 2.25 m wide each and 3.5 m long (slanting length). The invert level of the intake is 1379.25 masl and the top level is at the elevation of 1381.25 masl.
Inclined coarse trash rack with bar spacing of 250 mm centre to centre at the intake orifice are provided. The net openings between the bars are about 150 mm in order to avoid the floating debris entering into the intake. For the maintenance purpose, the stoplog is provided in front of the radial gate.
Checking for stability against piping, uplift and seepage that has not been done during hydraulic model study has been done during preparation of this report and drawing. The details of thickness and cutoff are shown in Drawing (Appendix L). As per the recommendation of Hydraulic Model Study, the vertical construction joints between the abutment walls on the both banks and the main weir body are provided to allow free vertical movement to cope with the possible deformation of the foundation.
9.1.6 Operational aspects of the radial gate
The operational aspect of the radial gate is shown in “Hydraulic Model Study of the Headworks of Nyadi Hydropower Project” Final Report, Hydro Lab Pvt. Ltd. (November 2010) in different flow condition.
9.1.7 RCC Bridge
One RCC Bridge, 2.5m width by 25m length is also recommended in the feasibility review phase to smooth handling of stoplog, cleaning the trashrack and regular inspection of the weir.
9.1.8 Intake area
It is not necessary to build the major river training structure upstream and downstream considering that there is rock, on the both banks, however, boulder riprap is proposed 10 m upstream and 15 m downstream of the intake structure. As the immediate upstream and downstream area of intake are exposed to high velocity and turbulent flow during flood, during full radial gate opening mode, the high strength concrete or riprap is proposed in this stage which is strong and stable enough to withstand abrasion and also impact of boulder. For the same purposed it is used the boulder size ranging from 1.5 m to 2.0 m. The boulder riprap is elevated at 1:3 slope from the toe of the concrete topping at radial gate sill level (1371.50 masl) and flushed with the exiting river bed level (approximately 1373.00 masl). The monitoring mechanism of this area for repair and maintenance after each monsoon period is recommended.
9.1.9 Stilling basin
The stilling basin was verified during model study and shows the satisfactory in terms of energy dissipation for the entire selected flow situations including design flood. The final proposed stilling basin is observed to be adequate enough to handle the design floods with all possible radial gate operation conditions which included only one gate opened, both gates full opened and both gates fully closed. However, opening of both the gates are recommended to avoid skewed flow in the stilling basin and also better energy dissipation.
Stilling basin is approximately 21 m long and 14 m wide located at immediate downstream of the gate chambers. The slope of 2:9 starts from the radial gate sill level of 1371.50 masl until the invert level of the basin is met at 1369.00 masl. This sloping surface area and the beginning of the stilling basin face turbulence with air entrainment flow and high velocity flow of approximately 10 m/sec during major floods. Thus extra attention is to be given for high abrasion resistance surface and periodic maintenance in this area. The 21 m long basin ends at the end sill which has the crest elevation of 1371.00 masl. A transition section with slope 1:1 connects the stilling basin floor/invert with the end
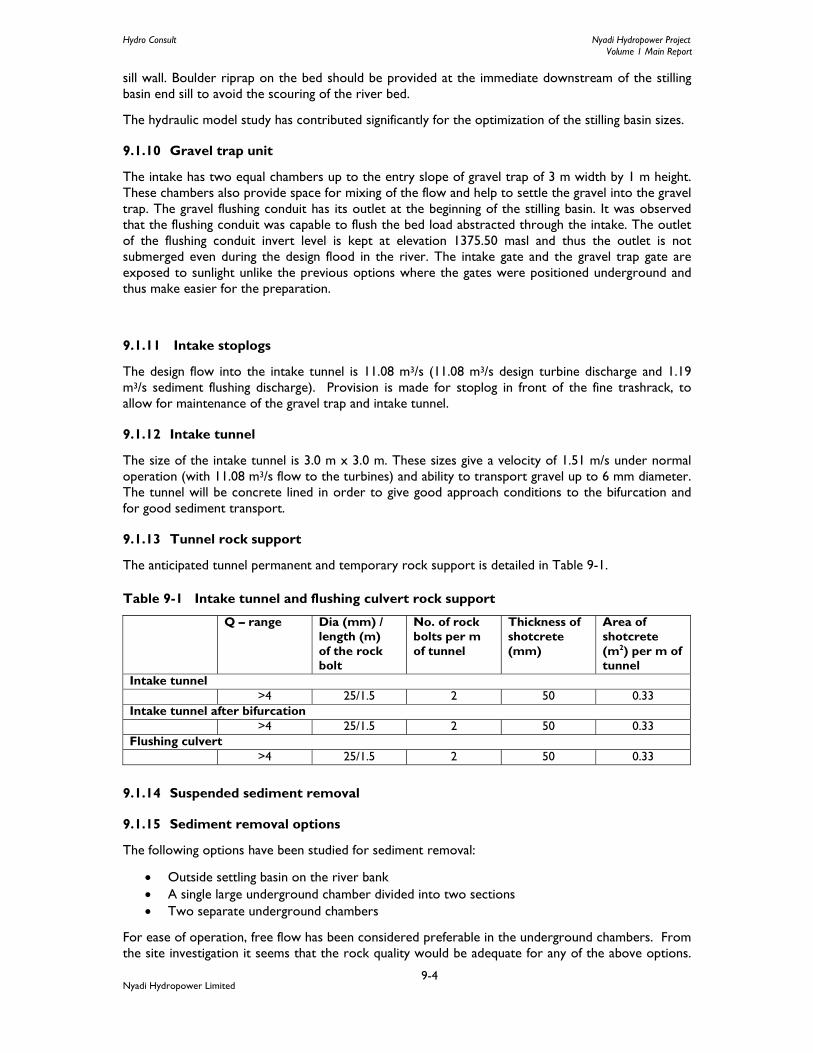
Hydro Consult Nyadi Hydropower Project Volume 1 Main Report
Nyadi Hydropower Limited
9-4
sill wall. Boulder riprap on the bed should be provided at the immediate downstream of the stilling basin end sill to avoid the scouring of the river bed.
The hydraulic model study has contributed significantly for the optimization of the stilling basin sizes.
9.1.10 Gravel trap unit
The intake has two equal chambers up to the entry slope of gravel trap of 3 m width by 1 m height. These chambers also provide space for mixing of the flow and help to settle the gravel into the gravel trap. The gravel flushing conduit has its outlet at the beginning of the stilling basin. It was observed that the flushing conduit was capable to flush the bed load abstracted through the intake. The outlet of the flushing conduit invert level is kept at elevation 1375.50 masl and thus the outlet is not submerged even during the design flood in the river. The intake gate and the gravel trap gate are exposed to sunlight unlike the previous options where the gates were positioned underground and thus make easier for the preparation.
9.1.11 Intake stoplogs
The design flow into the intake tunnel is 11.08 m3/s (11.08 m3/s design turbine discharge and 1.19 m3/s sediment flushing discharge). Provision is made for stoplog in front of the fine trashrack, to allow for maintenance of the gravel trap and intake tunnel.
9.1.12 Intake tunnel
The size of the intake tunnel is 3.0 m x 3.0 m. These sizes give a velocity of 1.51 m/s under normal operation (with 11.08 m3/s flow to the turbines) and ability to transport gravel up to 6 mm diameter. The tunnel will be concrete lined in order to give good approach conditions to the bifurcation and for good sediment transport.
9.1.13 Tunnel rock support
The anticipated tunnel permanent and temporary rock support is detailed in Table 9-1.
Table 9-1 Intake tunnel and flushing culvert rock support
Q – range Dia (mm) / length (m) of the rock bolt
No. of rock bolts per m of tunnel
Thickness of shotcrete (mm)
Area of shotcrete (m2) per m of tunnel
Intake tunnel >4 25/1.5 2 50 0.33
Intake tunnel after bifurcation >4 25/1.5 2 50 0.33
Flushing culvert >4 25/1.5 2 50 0.33
9.1.14 Suspended sediment removal
9.1.15 Sediment removal options
The following options have been studied for sediment removal:
• Outside settling basin on the river bank • A single large underground chamber divided into two sections • Two separate underground chambers
For ease of operation, free flow has been considered preferable in the underground chambers. From the site investigation it seems that the rock quality would be adequate for any of the above options.
Hydro Consult Nyadi Hydropower Project Volume 1 Main Report
Nyadi Hydropower Limited
9-5
An objective for all the options will be to provide continuous operation during sediment flushing. In this way loss of power during flushing will be avoided.
Outdoor settling basin
Insufficient land on the riverbank downstream of the inlet is the biggest constraint to an outdoor settling basin. Owing to the steepness of the hillside above the riverbank site it is not possible to make a cutting for an outdoor basin. Also owing to potentially loose rock on the hillside above the site in the long term there is a risk of damage to an outdoor basin. Recent rock falls were noted at the site. Therefore, this option was discarded in favors of an underground chamber system.
Single large underground chamber divided into two sections
A single large chamber that would provide the full settling capacity required would potentially be an economical solution in good rock conditions. Access tunnels for this option would be simpler than for a multi-chamber option. Due to huge amount of concrete in the central/inspection section, this option is more costly then the double chamber. The geological risk is also high in this option compare to double cavern. So this option has therefore been rejected.
Two separate underground chambers
This arrangement has two chambers, each with half the required settling capacity and constructed with a ‘rock wall’ between. Rock support in each chamber will be less onerous than for a single large span cavern. The temporary support of smaller span caverns will be easier.
During isolation and maintenance of one chamber free flow could be maintained in the other operational chamber. To ensure this each chamber would be fitted with an upstream isolation gate. Downstream stoplog would be more economical than a gate yet adequate for occasional maintenance.
Access tunnels would be more complex than for a single compartment chamber. Each chamber would have tunnels to the upstream gate, a downstream stoplog and intermediate sediment sampling points. The access tunnel level would be set according to design flood level. Access to the chambers would be achieved by means of vertical shafts, access ladders and operating platforms.
This is the preferred option which is discussed further below.
9.1.16 Settling basin
As part of this study, a sediment transport measurement programme has been carried out (refer to Section Hydrology and Sedimentology). The criteria adopted for the design of the settling chambers are summarized as follows:
• Maximum suspended sediment concentration of 10,000 ppm (w/w) • Removal of particles larger than 0.2 mm with an efficiency of at least 90%.
In line with these criteria each chamber is designed to handle 50% of the maximum flow to the settling chambers. The expected performance of the designed chambers, as shown in Table 9-2, is calculated using Vetter's equation. The chosen length of a chamber is 128 m and surface area is 1024 m2 each with width of 8 m and depth of 10.30 m including hopper. Table 9.2 shows the trap efficiency is 93.0 % for 0.20 mm particle size.

Hydro Consult Nyadi Hydropower Project Volume 1 Main Report
Nyadi Hydropower Limited
9-6
Table 9-2 Settling chamber trapping efficiency
Particle size (mm)
Fall velocity (mm/s) at 15 °C Efficiency for 11.08 m3/s + 1.108 m3/s
flushing discharge 0.1 10 77.0% 0.15 15 89 % 0.2 20 93.0% 0.3 37 99.6% 0.4 45 100.0%
A trapping efficiency of 93% for 0.20 mm particles are selected based on the results of:
• Mineralogical analysis of sediments • Particle size distribution (PSD) of sediments
This is justified at the feasibility study stage, because of high quartz content in the sediment and PSD result showing higher percentage of sediment in the lower range. This criterion will be further refined during the detailed design stage. A further optimization should be carried out at detailed design phase based on:
• Increase in settling chambers size versus loss in turbine maintenance and power production due to sediment induced wear.
Sediment storage volume adopted at this stage is sufficient for 7 hours for the river water with maximum suspended sediment concentration (10,000 ppm).
The hydraulic performance of the settling basin was observed to be satisfactory after several tests using color dyes, extremely fine sediment and velocity measurements. The flow distribution in both the basin was acceptable. However, turbulent flow was observed at the inlet of the settling basins because of secondary current. To minimize such turbulence some modifications to inlet section of the left basin were carried out. After testing the basin’s hydraulic performance it was observed that gradual increase of the settling basin inlet tunnel height. As per the recommendation from Hydraulic model study the inlet tunnel size in increase to size 3.0 m x 3.0 m for the smooth flow in the inlet transition area. As the flow splitter is kept at straight portion of the approach tunnel, the flow distribution was almost equal in both of the basins.
The settling basin’s model was tested in the previous set up when crest was about 2 m lower than the new crest level (1381.50 masl) and therefore settling basin level is also raised accordingly in this stage.
9.1.17 Flushing arrangement
The actual sediment capacity for the settling chambers depends on the concept used for flushing. The following two concepts are available:
Conventional flushing
Conventional flushing implies that one chamber at a time is closed off and de-watered while the sediment deposits are flushed out of the chamber, which reduces the power output by half during flushing. After rising the weir crest level now it is also possible to use a conventional flushing mechanism but the main concern is the inward flushing. The detail of this flushing and cost comparison will be done before detail design.
The “Serpent Sediment Sluicing System” (S4)
The “Serpent Sediment Sluicing System” (S4) is a concept proven at the Andhi Khola and Jhimruk Hydropower Projects in Nepal. This concept permits continuous flushing without de-watering or interruption in the operation of the chamber.
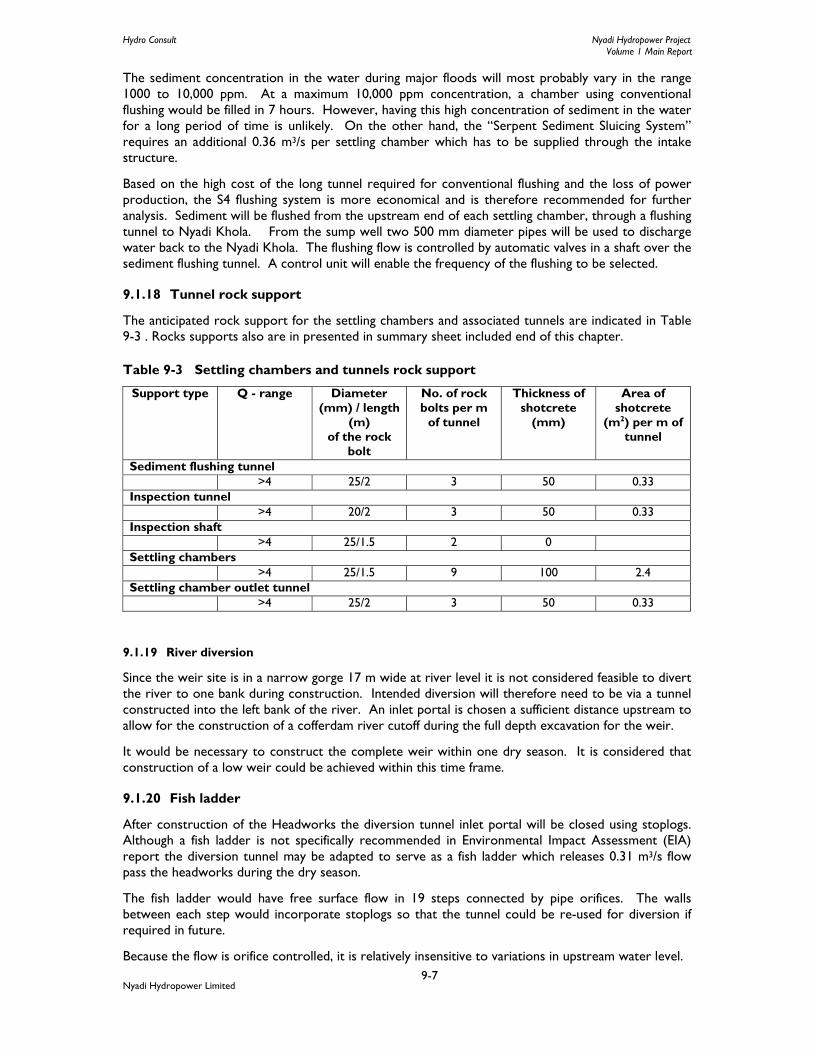
Hydro Consult Nyadi Hydropower Project Volume 1 Main Report
Nyadi Hydropower Limited
9-7
The sediment concentration in the water during major floods will most probably vary in the range 1000 to 10,000 ppm. At a maximum 10,000 ppm concentration, a chamber using conventional flushing would be filled in 7 hours. However, having this high concentration of sediment in the water for a long period of time is unlikely. On the other hand, the “Serpent Sediment Sluicing System” requires an additional 0.36 m3/s per settling chamber which has to be supplied through the intake structure.
Based on the high cost of the long tunnel required for conventional flushing and the loss of power production, the S4 flushing system is more economical and is therefore recommended for further analysis. Sediment will be flushed from the upstream end of each settling chamber, through a flushing tunnel to Nyadi Khola. From the sump well two 500 mm diameter pipes will be used to discharge water back to the Nyadi Khola. The flushing flow is controlled by automatic valves in a shaft over the sediment flushing tunnel. A control unit will enable the frequency of the flushing to be selected.
9.1.18 Tunnel rock support
The anticipated rock support for the settling chambers and associated tunnels are indicated in Table 9-3 . Rocks supports also are in presented in summary sheet included end of this chapter.
Table 9-3 Settling chambers and tunnels rock support
Support type Q - range Diameter (mm) / length
(m) of the rock
bolt
No. of rock bolts per m
of tunnel
Thickness of shotcrete
(mm)
Area of shotcrete
(m2) per m of tunnel
Sediment flushing tunnel >4 25/2 3 50 0.33
Inspection tunnel >4 20/2 3 50 0.33
Inspection shaft >4 25/1.5 2 0
Settling chambers >4 25/1.5 9 100 2.4
Settling chamber outlet tunnel >4 25/2 3 50 0.33
9.1.19 River diversion
Since the weir site is in a narrow gorge 17 m wide at river level it is not considered feasible to divert the river to one bank during construction. Intended diversion will therefore need to be via a tunnel constructed into the left bank of the river. An inlet portal is chosen a sufficient distance upstream to allow for the construction of a cofferdam river cutoff during the full depth excavation for the weir.
It would be necessary to construct the complete weir within one dry season. It is considered that construction of a low weir could be achieved within this time frame.
9.1.20 Fish ladder
After construction of the Headworks the diversion tunnel inlet portal will be closed using stoplogs. Although a fish ladder is not specifically recommended in Environmental Impact Assessment (EIA) report the diversion tunnel may be adapted to serve as a fish ladder which releases 0.31 m3/s flow pass the headworks during the dry season.
The fish ladder would have free surface flow in 19 steps connected by pipe orifices. The walls between each step would incorporate stoplogs so that the tunnel could be re-used for diversion if required in future.
Because the flow is orifice controlled, it is relatively insensitive to variations in upstream water level.

Hydro Consult Nyadi Hydropower Project Volume 1 Main Report
Nyadi Hydropower Limited
9-8
9.1.21 Tunnel rock support
The anticipated required rock support is indicated in Table 9-4. Rocks supports also are in presentedin summary sheet included end of this chapter
Table 9-4 Nyadi diversion tunnel rock support
Support type Q – range Diameter (mm) / length (m) of the rock bolt
No. of rock bolts per m of tunnel
Thickness of shotcrete (mm)/spilling
Area of shotcrete (m2) per m of tunnel
I >4 25/2 3 50 (at fractured area)
0.33
II 1-4 25/2 4 50 0.33 III 0.1-1.0 25/2 6 50-100 0.478 IV 0.01-0.1 25/2 7 100-150 1.27 V <0.01 25/2 10 150-200/6 1.78 V <0.01 Thickness of concrete lining - 300 mm 1.78
9.1.22 Operators' facilities
The headworks will be manned full-time during the monsoon. Permanent housing will be established for two operators on the right bank of the Nyadi Khola below the headworks. An office will be incorporated into the housing unit near to intake structure.
9.1.23 Access for operation and maintenance
Footpaths with steps and safety hand railing will be provided as necessary. Inspection tunnels 3.5 m x 3.5 m will be provided above maximum flood level for access to essential personnel access points.
9.1.24 Access for construction
A low level construction access tunnel will be required for the excavation of the settling chambers and tunnels. One option would be to excavate the sediment flushing tunnel big enough for use as construction access based on the contractor’s chosen method. Alternatively, an independent access tunnel can be excavated. This is not shown in the drawings since it depends largely on the contractor's choice of construction method.
9.1.25 Gates and operating equipment
The gates and other operating equipment and the general plant operation procedures for the designed headwork structures, waterway and powerhouse are presented in Table 9.5.
Table 9.5 Gates and operating equipment
Equipment Qty Size (m) Purpose Operation Intake Coarse trashrack 3 set 2.5 x 3.0 To exclude large floating debris,
large cobbles and boulders from the intake
Normally self-cleaning. If necessary debris may be cleared using a pole handled from the intake platform.
Bottom sluice stoplog
1 set 6.15 x10 Maintenance of Under sluice bed load canal and radial gate
Installed from intake platform
Bottom sluice radial gate
2 set 5.0 x3.0 Seal the under sluice canal during dry season and removal of bed load in front of intake during monsoon
Operated from platform over Intake platform
Gravel trap flushing gate
1 set 5x3.2 Maintenance of gravel flushing casing pipe and radial gate
Installed from platform over shaft

Hydro Consult Nyadi Hydropower Project Volume 1 Main Report
Nyadi Hydropower Limited
9-9
Gravel trap intake tunnel gate
1 set 2.1x3.1 Seal the gravel flushing during no bed load and removal of Bedload inside the gravel trap
Operated from platform over shaft
Water level monitors
2 set - a) Warning of low river level, and need to reduce flow to powerhouse
b) Warning of excessive Head loss across coarse trashrack and need to clean the trashrack
c) Warning of excessive Head loss across fine trashrack, and need to clean the trashrack
Electronic differential gauges upstream and downstream of coarse and fine trashrack. Linked to alarm /display at powerhouse and operators' building
Settling chambers Settling chamber isolation stoplog (Inlet)
1 set 3 x 3 Used to isolate one settling chamber for maintenance
Installed from platform in shaft
Settling chamber isolation gates (Inlet)
2 3 x 3 Used to isolate one settling chamber for maintenance
Operated from platforms over shafts
Settling chamber isolation stoplog (Outlet)
1 3.5 x 3.5 Used to isolate one settling chamber for maintenance
Operated from platforms over shafts
Settling chamber isolation gates (Outlet)
2 3.5 x 3.5 Used to isolate one settling chamber for maintenance
Operated from platforms over shafts
Settling chamber flushing valves
2 500 mm dia. Used for controlling the flushing discharge and dewatering the settling chambers
Operated from a platform above the sediment flushing tunnel
Pump 2 5.2 l/s, 670 W To complete dewatering of the settling chambers
At the settling chamber flushing valves
Settling chambers sounding reel
1 - Monitoring sediment levels in the settling chambers, and need for flushing
Portable. Used at each inspection shaft
Real – time sediment monitoring
1 - Warning of high sediment concentration entering headrace tunnel, and need to shut down the power plant
Linked to alarm/display at powerhouse
Diversion tunnel Diversion tunnel inlet portal stoplogs
1 set 3.0 x 3.0 Nyadi Khola diversion control Installed from diversion tunnel inlet portal
Bulkhead Gate at Naijhe Adit
1 set 2.5 x 2 Access for repair & maintenance
Operated from platforms over shafts
Bulkhead Gate at Surge Adit
1 set 2.5 x 2 Access for repair & maintenance
Operated from platforms over shafts
Portal Gate at Naijhe adit, ventilation adit and Surge adit (No water pressure)
3 set 2 x 2.2 No person are enter without permission, normally closed
Operated from platforms over shafts
Powerhouse Water tight stop logs tailrace and access tunnel near to P/H
1 set 3.2 x 3.2
0.25m dia Flushing 2 set 0.25 m dia For the flushing of the gravels
Hydro Consult Nyadi Hydropower Project Volume 1 Main Report
Nyadi Hydropower Limited
9-10
Valves 0.5m dia flushing valves
2 set 0.5 m dia For the flushing of the gravels
Tailrace Gate 3 set 1.2 x 2.1 To prevent the powerhouse from flooding and unit wise maintenance of turbines
Operated from platforms over shafts
9.1.26 Siuri Tail Race Water Pumping Arrangements
Due to power deficit and possibility to generate electricity Nyadi Hydropower Limited request the consultant to cheek the viability of the Siuri tailrace pumping mechanism. After preliminary checking in the previous phase the design team has incorporated the “Siuri Tailrace Water Tapping Option" in this updated feasibility study report. The design discharge of 1.4 m3/sec is collected from the tailrace of Siuri SHP and diverted into the upstream of headworks of NHP by pumping mechanism. The following civil and hydro mechanical equipment are suggested to incorporate this option:
1. Tailrace water diversion canal
2. Tailrace water collection chamber with spillway mechanism
3. Two sets of pump with pump house
4. Two steel pipes with 0.6 m diameter
5. Overhead reservoir
6. Steel pipe (diameter 0.8 m) with anchor blocks and support piers.
Tailrace water diversion canal
The 110m long tailrace diversion canal is proposed to divert the water from Siuri tailrace to the collection chamber. The 3.0 m width and 2.0 m height with 1:250 slope open canal is proposed for this purpose.
Tailrace water collection chamber with spillway mechanism
After the diversion canal, water collection chamber (10 m x 5 m x 4 m) is proposed at the left bank of the Nyadi River. River protection structure is adequately provided for the safety reason. Spillway length of 5 m is also proposed while pumping mechanism is not required.
Pump set with pump house
Two non submersible pumps are proposed to lift the water from elevation 1364.00 masl of collection chamber to elevation 1390.00 masl of overhead reservoir. A small pump house with 5 m length, 3.70 m width and 3.0 m height is also proposed for safety reason and for easy operating mechanism.
Overhead reservoir
One small reservoir of size 5 m x 4 m x 3.5 m is proposed to collect the water from collection chamber. This reservoir collects the water and supply to the Nyadi Headworks via 0.8m steel pipe acting as a gravity flow after this reservoir. The 0.6 m diameter two steel pipe pump the water from collection chamber to overhead reservoir. After this reservoir gravity flow mechanism occur upto the upstream of Nyadi Headworks.
9.2 Waterways
9.2.1 General
Right bank is selected as suitable alignment for headrace tunnel of the project to convey the flow from the outlet of underground settling basin to the penstock inlet. The two converging tunnels each of 30m length is proposed from the end of settling basin. To maintain minimum submergence in the

Hydro Consult Nyadi Hydropower Project Volume 1 Main Report
Nyadi Hydropower Limited
9-11
headrace tunnel, the drop intake (7.2 m depth) is proposed after 10 m long tunnel. The total length of headrace tunnel is 3937.
Design criteria
The design of the headrace has been based on the following criteria:
• The maximum design discharge is 11.08 m3/s at the headrace tunnel inlet. The minimum discharge is 2.98 m3/s.
• Low pressure tunnel with separate penstock
9.2.2 Headrace Tunnel
The headrace tunnel is headed by tunnel inlet and conveys the flow to the penstock pipe and thereby to the turbines. Design flow of 11.08 m3/s will be conveyed through the headrace tunnel of NHP. Considering constructability aspect required for mechanized excavation, 3.2 m wide and 3.2 m high inverted D-shaped headrace tunnel is selected with 1.60 m height to spring line. Thus, the inverted D shaped tunnel having cross-sectional area of 9.141 m2 is chosen due to which velocity in the headrace tunnel is low.
The total length of the tunnel from the intake of headrace tunnel to the penstock pipe inlet is 3937 m. For easy drainage (gravity flow) during construction, the bed slope of headrace tunnel will be 1 in 56.04 downwards up to adit tunnel at Naiche. From Naiche adit tunnel it will continue to upward slope of 1 in 37.60 up to horizontal bend of tunnel and again downward slope in 1 in 60.40 until it ends at penstock pipe inlet. The level of tunnel invert at the intake of headrace tunnel is 1369.20 masl and similarly at portal outlet will be 1355.50 masl. There will be one intermediate adit in between the intake portal and the outlet portal near Naiche village. The tunnel excavation will be commenced from four headings: inlet portal (desilting outlet), outlet portal (surge shaft adit) and two faces from the intermediate adit tunnel at Naiche.
Even the length of tunnel plays vital role in the overall cost of the project, the tunnel alignment is more or less limited by the topographical and geological features. The proposed alignment was selected based on the sufficient rock cover, rock mass quality including hydraulic gradient of the proposed waterway. The headrace tunnel alignment crosses schist and gneiss, quartzite, no of faults and shear zones. Upon completion of tunnel excavation, adit plug at tunnel Naiche adit, surge shaft adit and at the start point of penstock pipe will be constructed and bulkhead doors will be provided in these adits. Tunnel rock supports are provided as shown in table 9-6 below.
Table 9-6 Tunnel Rock Supports
Q-value Rock class Percentage >4.0 I (Spot bolting + 5cm sfr at fractured area +30 cm invert concrete lining) 56
1.0-4.0 II (4 bolts+ 5cm sfr+30 cm invert concrete lining) 21 0.1-1.0 III (6 bolts +5-10cm sfr+30 cm invert concrete lining) 16 0.01-0.1 IV (7 bolts +10-15cm sfr+30 cm conc. slab) 4 <0.01 V (10 bolts +15-20cm sfr+CCA+6 spilling+30 cm conc. slab) 3
Total 100
Refer Drawing No. 1220/01/10A03 in Appendix L for General project layout, plan and profile and drawing no 1220/01/30A01 in Appendix L for typical headrace tunnel rock support. Rocks supports also are in presented in summary sheet included end of this chapter
9.2.3 Rock trap / Gravel Trap
The rock trap is designed to trap the sediment from unlined portion of the tunnel during commissioning phase and it is anticipated that the sediment/rock falls can be expected 3–5 years of plant operation from the date of commissioning. Its’ function is to collect those rock falls or grit at

Hydro Consult Nyadi Hydropower Project Volume 1 Main Report
Nyadi Hydropower Limited
9-12
before the location of surge shaft connected with headrace tunnel so that entering of those foreign materials into the turbine can be minimized. The rock trap is located at upstream of the penstock inlet. The size of the rock trap is 7.50 m x 3.2 m x 1.5 m. Pressurized flushing system is designed to flush out the deposited sediment from the rock trap. Such arrangement works under pressure head and certain size of sediment particles will be flushed through the 500 mm diameter pipe which discharges near the open channel at downstream of the tunnel portal. Remaining bigger sized sediments have to be removed manually during maintenance.
Refer Drawing No. 1220/01/30A08 and 9 in Appendix L, Surge Adit and Bell mouth Area, Sections.
9.2.4 Tunnel adits and portals
A potential portal site of Naiche adit has been identified at 1344.96 m level. This is a little lower than Naiche village. Access to the site is by motor able road. The gradient of Naiche adit is 1 in 100 uphill from the portal. The length of the adit including the curves is 176 m. The potential adit of length 57 m is design at side of headrace portal near about Nana Village. The size of the portal will be 3.2 m wide, 3.2 m high. The outlet portal also known as surge shaft adit will be constructed together with the surge shaft and penstock bell mouth. For further inspection and maintenance works, access is provided through gated bulkheads in adits. For self draining purpose, beneath of the tunnel section, drainage pipe will be provided from gravel trap to outlet of surge adit to drain water during construction as well as flushing of water in maintenance period.
Refer Drawing No. 1220/01/30A01, 30A02, 30A03 and 30A08 in Appendix L for Tunnel rock support, Plan and profile of Naiche adit, Naiche adit details and tunnel portal at Surge adit. Rocks supports also are in presented in summary sheet included end of this chapter
9.2.5 Spoil tip arrangement
The spoils from settling basin with flushing tunnel, access tunnel, Headworks components: weir and intake parts, gravel trap and intake tunnel, diversion tunnel, two adits of headrace tunnel, underground powerhouse with access tunnel, tailrace tunnel and other spoil from surface excavation should be managed properly. There will be five numbers of spoil tip areas: Headworks area, Naiche Adit Area, Surge shaft Adit Area, Penstock alignment and outdoor area of underground power house.
The total volume of spoil at headwork area will be about 56,853.91 m3 which incorporate the component of diversion tunnel, weir parts, gravel trap, intake tunnel, flushing tunnel with settling basin, access tunnel with inspection gallery and 17% of headrace tunnel. At headworks, spoil tip area has been designed at flat area on the Right bank of the Nyadi Khola. Some of volume of excavated material will be used as backfilling material.
The total volume of spoil at Naije adit area will be about 38,690.61 m3 which incorporate the Naije adit and 50% of headrace tunnel. The spoil tip area has been designed at nearby Kholsi and flat area at right bank of Nyadi Khola. Likewise for surge adit, the total volume of spoil is about 21,396.00 m3
which incorporate the surge component and 25% of headrace tunnel. The spoil tip area has been proposed at khosi near by the surge adit. Further 1 m x 1 m of peripheral drain will be provided for drainage facility, which will drain to the Kholsa.
Required slope of the spoil tip area is maintained as 1 in 2. As per the site condition, the toe of spoil tip is protected by stone masonry retaining wall. In additions sufficient drainage systems has also been proposed.
For penstock alignment the total volume of spoil is about 11,007.99 m3 which incorporate the component of anchor block /support piers and vertical shaft. The spoil tip area has been proposed at khosi nearby penstock alignment. Required slope of the spoil tip area is maintained as 1 in 2. As per the site condition, the toe of spoil tip is protected by stone masonry retaining wall. In additions sufficient drainage systems has also been proposed. Some of volume of excavated material will be used as backfilling material.

Hydro Consult Nyadi Hydropower Project Volume 1 Main Report
Nyadi Hydropower Limited
9-13
In the powerhouse area, the total quantity of spoil is 20,794.52 m3 which includes the spoil quantity of the components like main powerhouse area, control building area, tailrace and access tunnel. Among them, some quantity of excavated material will be used for backfilling in the switchyard area. At the outlet of powerhouse, spoil tip area has been proposed at flat area on the Right bank of the Nyadi Khola.
9.2.6 General
The hydraulic stability of the water conveyance system is a very important factor to be considered in a hydropower project. At the time of load acceptance and rejection, needle valves are opened or closed, which will produce mass oscillation of water and cause water hammer effect or pressure rises in the penstock and headrace tunnel. Though deflectors are provided close to the turbines but for the safety reason, restricted orifice type surge shaft with connecting circular conduit has to be provided to minimize the potential risk of failure. To minimize these effects, a restricted orifice surge shaft has been provided at the beginning of penstock pipe to allow stable governing system to be maintained in the turbine and keep pressure rises to an acceptable limit.
Refer Drawing No. 1220/01/30A08 and 30A09 in Appendix L for the general arrangement and respective profile of the surge shaft including tunnel outlet sections.
Due to the placement location and the better functioning of the water hammer pressure in the headrace tunnel, it is decided to put a cylindrical type surge shaft in the system, about 26m offset to left side from headrace tunnel. Offset of surge shaft is provided considering free access during construction and better geological conditions. Based on the topography and geological condition of the area the surge shaft is located on the left side of headrace tunnel at surface elevation of 1430 masl. Surge shaft is underground type with Ventilation adit tunnel (3.2m diameter) and clear diameter of surge shaft is 5 m. The height of surge shaft is calculated 29.60 m with 6.6 m high connecting circular conduit. For rock supports, refer drawing no.1220/02/30A07 in Appendix L. Rocks supports also are in presented in summary sheet included end of this chapter
9.2.7 Surge analysis
The surge analysis of the proposed restricted orifice type surge shaft for two scenarios (all three valves closed and all three valves opened) has been conducted as per the procedures recommended by Mosonyi to cope both upsurge and down surge effect. It is therefore the orifice stype surge shaft has been designed according to the critical down surge condition. According to E. Mosonyi, sign conventions: negative sign for upsurge and positive sign for down surge in graphical expression is adopted. The surge analysis was carried out considering various cases of up surge and down surge.
Using the equations of the mass balancing, the surge analysis of the system has been checked. In the analysis, closure of all valves of turbine for the upsurge and opening of all valves for the down surge was considered. The results of the analysis for the proposed surge arrangement are as follows:
• The upsurge reaches to 1390.058 masl in the surge shaft for the instantaneous total closer of all three units.
• The down surge reaches to 1368.297 masl in the surge tank for the instantaneous total opening of all three units.
As per the surge analysis, a cylindrical type of surge shaft with 5.0 m diameter is proposed for the stability of the surges. This surge analysis showed that the down surge reaches to 1368.297 masl, which is higher than the soffit level (1360.20 masl) of the headrace tunnel. The result of the surge analysis for the total instantaneous closer of the all units shows that the upsurge reaches to 1390.058 masl. So the top level of the surge shaft is fixed to 1392.00 masl providing free board of maximum upsurge (2 m) for safety purpose so that the water will not get spilled even in worst case of upsurge. A steel wire mesh with manhole towards ventilation adit on top of the surge shaft is provided for access during maintenance.
Based on the surge analysis, the study came to propose the surge tank with following features:
Hydro Consult Nyadi Hydropower Project Volume 1 Main Report
Nyadi Hydropower Limited
9-14
• Shape of surge shaft : Circular
• Diameter: 5.0 m
• Height: 29.60 m
• Static Water Level: 1381.50 masl
• Normal water Level: 1381.276 masl
• Minimum Water Level: 1380.150 masl
• Surge Tank Top Level: 1392.00 masl
• Maximum upsurge level: 1390.058 masl
• Maximum down surge level: 1368.297 masl
In order to provide sufficient submergence head above the penstock inlet, the soffit level of penstock inlet is kept at 1358.70 masl which is 9.60 m below the maximum down surge level.
9.2.8 Penstock
9.2.9 General
The penstock pipe is used to convey water from headrace tunnel to the turbine. For underground powerhouse option, the penstock starts at an elevation of 1355.50 masl, passes through surface penstock as well as vertical drop shaft to underground powerhouse and terminates at the connection to the turbine at an elevation of 1034.00 masl. The penstock pipe arrangement consists of about 676.00 m long (surface 476.00 m and 200 m Vertical shaft of diameter 2.5m and horizontal section in hard rock zone encased with concrete) steel pipe of internal diameter 1750mm with varying thickness. Altogether, the penstock alignment has 8 numbers of concrete anchor blocks among which last block is at vertical shaft point. There are total 51 numbers of piers and concrerte pad to support the pipe along the surface penstock alignment. The spacing between the saddle supports is kept at 8 m except at the upstream and downstream of the pipe junctions or bends.
Refer Drawing No. 1220/01/30A12 to 30A19 in Appendix L for the general arrangement of the penstock arrangement, plan and profile, Typical supports, Anchor blocks and Vertical Shaft details.
9.2.10 Pipe material
The pipe will be manufactured from Plate of Standard SAILMA 350 or equivalent. The thickness was calculated by taking the effect of water hammer by 15% along with the 2 mm corrosion allowance. The total length of the penstock is 676.00 m excluding the penstock pipe length after trifurcation. The penstock contains 9 numbers of bends before branching.
The thickness of the pipe has been calculated to withstand surge head, corrosion and the hydrostatic head keeping in view of material specification and its availability. The wall thickness of pipe varies from 8 mm at the top portion to 30 mm at the bottom portion. The thickness of pipe is designed in such a way that it is able to withstand the surge pressures and the hydrostatic pressure. Extra thickness 2 mm is considered as corrosion allowance. The selection of minimum pipe thickness is based on buckling and handling thickness requirement criteria as mentioned in ASCE penstock design manual.
In fact the optimum penstock diameter for the given design discharges of 11.08 m3/s on the basis of optimization study comes close to 1750 mm. Hence, the pipe diameter is maintained at 1750 mm, constant throughout the alignment length, for construction purpose because the Indian Standard steel available on size 2.5 m x 5.0 m is suitable for the minimal wastage of steel for the adopted diameter of 1750 mm. The study of varying diameter for different stretches found that there is no significant

Hydro Consult Nyadi Hydropower Project Volume 1 Main Report
Nyadi Hydropower Limited
9-15
difference on investment for steel over penstock losses. However, the option of having varying diameters versus constant diameter will be studied during detail design. The size of the material available with steel manufacturers, scrap and difficulties on fabrication will also be analyzed on detail study.
Expansion joints are proposed just after downstream face of the anchor blocks. Total number of sleeve type expansion joints shall be 7. Allowable expansion or contraction for the expansion joints will be fixed as per corresponding pipe length between anchor to anchor and temperature variation data during detail design phase. Steel pipes and expansion joints are considered to be locally fabricated in Nepal.
During this study, the pipe thickness has been varied in eight stretches as per the design criteria.
Table 9-6 Shows the thickness of the pipe for different gross head. The optimization study of penstock pipe for different arrangement and different operating modes are carried out and presented in table below.
Table 9-6 Thickness of the pipe for different head
Length of penstock of section, m 159.22 124.02 176.63 75.75 35.00 35.00 69.76 Static Head, m 49.10 105 157 232.8 267.8 302.75 349.15 Surge Head, m 7.4 15.80 23.60 34.90 40.20 45.40 52.37 Total Head, m 56.49 120.75 180.55 276.66 307.91 348.16 401.32 Pipe Thickness. mm 8 12 16 22 25 28 30 Pipe weight. Ton 58 68 129 76 40 45 96
9.2.11 Anchor blocks and support piers
This study investigated a surface plus vertical shaft penstock arrangement as it is the most suitable arrangement for the given site condition. surface penstock section is exposed (above ground) and vertical shaft of the penstock section are hard rock zone and is supported on a series of anchor blocks, saddle supports and concrete blocks in surface section and concrete casing in vertical shaft zone. Because of topography and landmarks, the alignment requires 8 anchor blocks. Among them, 6 blocks have been designed for vertical bends only. Two blocks has combined vertical and horizontal bends. The horizontal bends are necessary to align the pipe along a more stable geological slope. In addition, numerous vertical bends along the alignment minimize excavation and the height of the saddle supports.
The alignment of the penstock in the terraced fields will require excavation and grading to prevent a too frequent change in the slope of the penstock.
The alignment of penstock from anchor block VB1 to anchor block VB8 shows terraced field and minimizes tree cutting. The alignment of penstock from anchor block VB8 to powerhouse has sound geological conditions and vertical part of penstock. The lower reach near the powerhouse which is in bed rock in horizontal portion requires sound rock excavation to meet the turbine axis elevation.
Anchor blocks are of C20 concrete with 40 % plums and nominal reinforcement to avoid uneven settlement & cracking. The blocks have been designed to provide stability against sliding, overturning and bearing pressure.
Refer Drawing No. 1220/01/30A15 to30A19 in Appendix L for details of the anchor blocks and drop shaft.
The penstock pipe rests on a series of saddles supports in above ground and concrete blocks in buried parts and steep section above ground provided uniformly in the sections between anchor blocks. To avoid overstressing the penstock pipes the spacing is maintained at not more than 8 m. There are 51 support piers and concrete blocks in total.

Hydro Consult Nyadi Hydropower Project Volume 1 Main Report
Nyadi Hydropower Limited
9-16
Saddle supports and concrete blocks are of C25 concrete. The size and shape of the saddles and concrete blocks depend on the topography. The saddles have been designed to provide stability against sliding, overturning and bearing pressure.
Refer Drawing No. 1220/01/30A13 in Appendix L for the typical details of the saddle supports.
9.2.12 Underground Powerhouse
9.2.12.1 General
The proposed underground powerhouse is located 130.60 m inside the hill at the right bank of the Nyadi River. The elevation of the turbine axis is set at 1047.60 masl.
The location of the powerhouse has been chosen so as to protect the powerhouse from the risk of flood in the Nyadi River that can arise in the monsoon season. Furthermore, size and location of the powerhouse cavern has been decided as per geological recommendation. Considering the head and flow available in the site, twin jet Pelton turbine with horizontal shaft alignment has been selected.
Powerhouse cavern onhouse inlet valve, turbines, generators and electromechanical accessories. The electro-mechanical aspects of the powerhouse complex are described in Section 9.5. Only the civil structures and corresponding hydraulic parameters are described here.
The Underground Powerhouse structure consists of the machine floor, control section and all the mechanical and electrical apparatus. The powerhouse is of 53.25 m long, 14.20 m wide and 14.90 m high with CGI sheet roofing including control buildings at the side of the main entrance gate of size 5m x 5m. Ventilation openings will be provided for the necessary air circulation through tailrace tunnel and ventilation pipe.
A security gate will be provided in front of access tunnel to the underground powerhouse area. Normal access to the powerhouse will be through main entrance door that opens into the machine floor. Retaining structures and riprap works at right bank of Nyadi River are proposed in order to protect the tailrace and switchyard from the flood of Nyadi River.
The general arrangement of the powerhouse and the control section are shown on Drawing No. 1220/01/40A01 and 40A02 respectively. The rock support system to stabilize the powerhouse cavern are shown in the drawing No. 1220/01/40A07 and 40A08 respectively. Rocks supports also are in presented in summary sheet included end of this chapter.
9.2.12.2 Main powerhouse floor
The main powerhouse floor consists of:
a) machine hall;
b) erection bay;
c) workshop, store, rest room, and common room
The main floor of the powerhouse is 53.25 m long and 14.20 m wide. It contains three 10460 kW horizontal aligned pelton turbines and generator assembly with the axis at an elevation of 1047.60 masl. A 14.20 m x 6.10 m maintenance bay is located next to the turbine-generator area. Power cables from the generator will be connected to the control panel through under floor ducts and Vertical wall ducts. Control cables will also run through under floor ducts and vertical ducts. The transformer will be located in the Switchyard area.
A 32-tonne overhead bridge crane will run on two parallel crane beams supported on a series of concrete columns along the long sides of the powerhouse.
The penstock in the powerhouse is anchored with a concrete anchor block attached to the North – east side of the powerhouse.
Hydro Consult Nyadi Hydropower Project Volume 1 Main Report
Nyadi Hydropower Limited
9-17
9.2.12.3 Control room and other utility spaces
The first floor of the powerhouse consists of control room and high voltage switchgear room.
9.2.12.4 Access Tunnel
An access tunnel of inverted D-shape will be required to connect the powerhouse from the tunnel portal at the side of the access road to the powerhouse entrance gate. The length of the tunnel will be 130.6m with size of 4.8mX5.1m (BXH). The rock support will be provided by the use of shotcrete and rock bolts depending upon the rock condition and the details have been shown in the respective drawings.
9.2.13 Switchyard area
The proposed switchyard area is located at the right bank of Nyadi River as shown in drawing 1220/01/40A02. The switchyard covers 50m x 40 m area. The security fence with an entrance gate will be built in the switchyard area to prevent unauthorized access during operation.
9.2.14 Heating and ventilation
The machine floor does not require any special heating and ventilation system as the powerhouse is proposed to build on surface. The control room will be equipped with AC facilities.
9.2.15 Drainage
A side drain in the North – East side of the powerhouse will trap any flowing water from the hillside slope, through penstock alignment and others kholsi and discharges it into the Nyadi river.
Rainwater from the roof will be collected in a peripheral gutter, which empties into the drainage arrangement on the outside of the powerhouse through a series of vertical downpipes.
A small peripheral drain along the base of the powerhouse walls will collect any water within the powerhouse floor and drain it into the tail water channel.
9.2.16 Water supply
The supply of potable water to the powerhouse can use the natural springs near powerhouse area. A holding tank on the hillside will be constructed for all water needed in the powerhouse area.
9.2.17 Sanitary and sewage system
A toilet will be located inside control section on the machine floor. A septic tank and a soak pit will be located to the North West of the powerhouse area. This facility should be among the first construction in the powerhouse area to allow its use during the construction phase.
9.3 Tailrace In underground powerhouse option, the tailrace consists of 225.85 m long, 3.6 m wide and 3.6 m high inverted D-shaped free flow tunnel. The slope of tailrace is maintained at 1:750 to keep velocity less than 2.0 m/s. Necessary riverbank protections will be provided as per site conditions. The 1000 years flood level in tailrace outlet is 1040.89 m. So, invert level of tailrace outlet is maintained at 1041.89 m taking 1 m free board. Invert level of tailrace at turbine outlet is 1042.81 m.
9.4 Hydro-mechanical works To control the flow and remove the debris/ silt from the water way and its accessories different gates, stoplogs and trash rack are provided on spillway, intake and settling basin area. The size of each hydro mechanical component is determined with reference from the Hydraulic design calculation. Each gate is provided with the sealing arrangement, hoisting, steel supports, dogging

Hydro Consult Nyadi Hydropower Project Volume 1 Main Report
Nyadi Hydropower Limited
9-18
device, position indicator, lifting beam, appurtenant parts and guide frame including track, seal beam, lintel etc as required.
9.4.1 Coarse trashrack
Three set of coarse trashrack of size 2.5m x 3.0m shall be installed at just behind the orifice stoplog to exclude large floating debris, logs and boulders from the intake. The clearance between two bars will be maintained 150mm.
9.4.2 Bottom sluice stoplogs and radial gates
A gantry crane operated stoplog of size (6.15m x 10.0m) and a hydraulically operated radial gate of size (5.0 m x 3 m) are proposed at bedload flushing channel at right bank of river above weir axis adjacent to intake orifice. Gate helps to seal the bottom sluice channel and control sedimentation in front of the intake while stoplog helps for the maintenance of bottom sluice channel and the radial gate.
9.4.3 Gravel trap flushing gate and tunnel intake gate
A gravel trap flushing gate motorized hoisting of size (5.0m x 3.2m) and tunnel intake gate motorized hoisting of size (2.1m x 3.1m) are proposed at start point of gravel flushing gate. Gate helps to seal the gravel flushing channel and control gravel in gravel trap.
9.4.4 Water Level Monitor
Electronic differential gauge upstream and downstream of coarse and fine trashrack will be installed for the warning of low river level and need to reduce the flow to power house. It will be linked to alarm display at powerhouse and operators building. It also used as a warning system for excessive head loss across coarse and fine trashrack and need to clean the trashrack.
9.4.5 Settling Chamber Sounding Reel
The sounding reel will be installed at intake and gravel trap for the monitoring of sediment level in the intake hopper and gravel level in the gravel trap so that the flushing can be done accordingly. Each sounding reel will be operating from the intake platform.
9.4.6 Settling Chamber Isolation Stoplog (inlet)
Settling Chamber Isolation Stoplog chain pulley operated of size 3.0m x 3.0m will be installed upstream of settling chamber Isolation Gates for the provision of maintenance of each gates. Two set of frames will be provided in each isolation chamber of stoplogs while a single stoplog panel will be used in both of the Chamber in the concept that one gate will be in maintenance at a time. Special trolley will be provided to move the stoplog panel from one chamber to the next.
9.4.7 Settling Chamber Isolation Gates (inlet)
Two sets of Settling Chamber Isolation Gates motor operated hoisting (3.0m x 3.0m) will be provided to isolate the settling chamber for maintenance. It also helps to control the flow to the settling chamber. Each gate will be operated from the platforms over shaft.
9.4.8 Settling Chamber Stoplog (outlet)
Just after the completion of the settling hopper, settling chamber stoplog chain pulley operated (outlet) will be provided to stop the backflow of the water during the maintenance of the settling chamber. Two set of frames will be installed while a single stoplog panel will be used in both of the Chamber in the concept that one chamber will be in maintenance at a time. Special trolley will be provided to move the stoplog panel from one chamber to the next. The size of the outlet stoplog will be 3.5m x 3.5m.

Hydro Consult Nyadi Hydropower Project Volume 1 Main Report
Nyadi Hydropower Limited
9-19
9.4.9 Settling Chamber Gate (outlet)
Two sets of Settling Chamber Isolation Gates motor operated (3.5m x 3.5m) will be provided to isolate the settling chamber for maintenance. It also helps to control the flow to the settling chamber. Each gate will be operated from the platforms over shaft.
9.4.10 Settling Chamber Flushing Valves
Two sets of 500mm diameter flushing valves will be installed in each flushing pipe for controlling the flushing discharge and dewatering the settling chamber.
9.4.11 Water Pump
For the complete dewatering of the settling chamber two sets of pumps having discharge 5.2 lit/ sec will be provided nearby flushing valves.
9.4.12 Settling Chamber Sounding Reel
To monitor the sediment levels in the settling chamber and the flushing of the same, portable type of sounding reel will be provided so that inspection can be done from each inspection shaft during the operation period.
9.4.13 Real Time Sediment Monitoring
A warning system will be installed to warn for the high sediment concentration entering into the headrace tunnel so that the power plant can be shutdown properly. The system will be linked to alarm and will display in powerhouse.
9.4.14 Diversion Tunnel inlet portal stoplogs
At the inlet portal of diversion tunnel 3.5m x 3.5m size chain pulley operated one number of stoplog will be installed to control the diversion of Nyadi Khola during the construction period and can also be used in future. The frame of the stoplog will be installed at the beginning before diverting the river.
9.4.15 Bulkhead Gate at Naiche and surge Adit
Two sets of 2.5m x 2.0m size motor operated bulkhead gate will be provide in each Naiche and surge audit so that the team can go inside the power tunnel with the repairing equipment during the maintenance of the tunnel as necessary. These gates will be in closed position during normal operation.
9.4.16 Portal Gate at Naiche adit, ventilation adit and Surge shaft adit (No water pressure)
Three sets of non pressurized simple gates will be provided at the portal of Naiche adit, ventilation adit and surge adit so that the no one can enter the adit without permission both during construction and also at the time of operation. The size of each gate will be 2m x 2.2m.
9.4.17 0.25m diameter Flushing Valves
Two set of 250 mm diameter manually operated flushing valves will be provided in series on the flushing pipe come from the sand trap at Naiche adit for the flushing of the gravels trap nearby adit.
9.4.18 0.5m diameter flushing valves
Two set of 500 mm diameter manually operated flushing valves will be provided in series on the flushing pipe come from the gravel trap at surge adit for the flushing of the gravels trap nearby adit.
Hydro Consult Nyadi Hydropower Project Volume 1 Main Report
Nyadi Hydropower Limited
9-20
9.4.19 Pressure valve between Headrace tunnel and penstock
One set of hydraulically operated Butterfly valve is provided downstream of the surge shaft. The necessary parts of the valves such as by-pass valve, air release valve, expansion joint and inlet pipe are also included. The main purpose of the valve is to reduce the watering and dewatering time of the tunnel for all the repair and maintenance downstream to the surge shaft i.e. penstock and powerhouse. The size of the valve is 1.75m in diameter.
9.4.20 Tailrace Gate
Three motor operated gates of size 1.2 m x 2.1 m shall be installed at the inlet of tailrace. These gates are proposed to prevent the powerhouse from flooding and also for unit wise maintenance of turbines. Each gate will be manually operated.
9.4.21 Powerhouse Door
A manually operated shutter (rolling gate) will be provided at the entrance of the powerhouse faced towards the access tunnel. The size of this door is 4.8 m x 5.0 m so that the lorry loaded with the equipment can pass easily.
9.4.22 Penstock and Penstock Specials
After the surge shaft on the water way, a steel penstock pipe is provided to convey water under pressure to turbine. From the optimization the inside diameter of penstock is 1.75 m and wall thickness of pipe varies from 8 mm to 30 mm. The pipe will be manufactured from Plate of Standard SAILMA 350 or equivalent. The thickness was calculated by taking the effect of water hammer by 15% along with the 2 mm corrosion allowance. The total length of the penstock is 675 m excluding the penstock pipe length after trifurcation. The penstock contains 9 numbers of bends before branching.
The design flow velocity in the main penstock pipe is 4.607 m/sec and total head loss in penstock is found to be 5.691m.
Saddle supports are used along straight runs of exposed pipe to prevent it from sagging and becoming overstressed. The average distance of saddle support is 8.0 m center to center. Anchor blocks are provided at each change of direction of the penstock pipe to provide necessary weight to counter act the resultant to all forces and to transmit then safely to the ground. Expansion joints are provided just downstream of each anchor blocks to cope the problem caused by thermal expansion. Manholes will be provided in the exposed part of penstock at about 175m stretch each.
9.4.23 Miscellaneous items
Flushing pipes, ladders, stairs, fence, railing etc will be provided as required by the projects in the standard forms.
9.5 Electromechanical
9.5.1 Turbine The power house will install 3 units of horizontal shaft, single runner, Pelton type turbine with 10460 kW unit turbine size. The turbine will be connected directly to the flange at the end of the generator shaft. The turbine will be connected to the flywheel of adequate size. The material of the runner shall be of an integrally solid casting steel of minimum 13 per cent Cr and 4 per cent Ni.
Each turbine will have two jets/nozzles and one number of Braking Nozzle, all controlled hydraulically through servo motor and electronic governor. The turbine housing will be fabricated from steel plates. The runner hub and buckets will be integrally casted.
The parameter of the Pelton turbine is presented in Table 9-5.

Hydro Consult Nyadi Hydropower Project Volume 1 Main Report
Nyadi Hydropower Limited
9-21
Table 9-5 Parameters of Pelton turbine
Description Parameters
Turbine rated output, P 10.46 x 3 MW
Turbine Axis Level 1047.60 m
Gross head, Hg 333.90 m
Rated net head, Hn 323.54 m
Rated water flow, Q 3.69 m3/s x 3
Running speed, n 473 rpm
Efficiency, η 89%
9.5.2 Bearings The bearings shall be of white metal type (Babbitt faced surface) for both Drive-end Pedestal and Non-drive end Pedestal. The bearing system shall consist of Drive end pedestal bearing as guide bearing combined with thrust bearing at the turbine side of the generator and Non-Drive end pedestal bearing as guide bearing at the exciter end of the generator.
Three double contact thermometers for alarm and trip shall be provided drilled in the bearing segments. Also three RTDs for temperature monitoring shall be provided drilled on bearing segments other than those which contain double contact thermometers. Both thermometers and RTDs shall be placed uniformly distributed among the bearing segments such that temperature monitoring and control becomes more accurate. All temperature monitoring devices shall be perfectly insulated from the bearing segments with suitable insulating material which shall not be affected by the hot lubricating oil.
9.5.3 Main Inlet Valves (MIV) Spherical type main inlet valves will be used for each unit. The valves are operated by oil pressure to be supplied from the pressure oil servomotor of the governor. The valve shall be closed by counter weight. Each inlet valve shall be provided with a pressure oil operated by-pass valve. The by-pass valve shall be of needle valve type and operated by pressure oil to be supplied form the governor system.
9.5.4 Cooling Water System Due to the risk of high content of suspended sediment in the “raw” water during the monsoon period, two circuit cooling system has been chosen.
The primary circuit, common for all units, will have water supply from the tailrace for cooling the main heat exchangers which are located on the powerhouse floor above the tailrace tunnel so that the cooling water can be directly discharge back to the tailrace culvert. This system incorporates AC operated circulation pumps, DC operated circulation pumps, intake strainer, level control equipment, pipes, and valves.
A separate primary circuit is established for cooling the heat exchangers for the air conditioning in the powerhouse consisting of AC operated circulation pump, filter, pipes and valves.
The secondary circuit, for each unit, is a closed system for cooling the heat exchangers for the generator rotor and stator, oil lubrication unit for the bearings and for cooling the governor. This

Hydro Consult Nyadi Hydropower Project Volume 1 Main Report
Nyadi Hydropower Limited
9-22
system incorporates AC operated circulation pumps, DC operated circulation pumps, water expansion tank, pipes, valves, and other accessories.
9.5.5 Overhead Crane A double girder Electric Overhead Travelling (EOT) crane having main hook capacity 50 tons shall be installed inside the powerhouse which is used for lifting and handling any equipment during installation, maintenance, and operation of the plant. Basic data and governing dimensions of powerhouse crane are shown below:
Main data Unit Quantity
Main Hook capacity Tons 55
Auxiliary Hook capacity Tons 5/10
Heaviest part to be lift (Generator Rotor)
Tons 30
Available Power
3 Phase, 400V, 50Hz
9.5.6 Governor Each unit will be provided with an efficient automatic governing system of adequate capacity to control the turbine under all conditions. Control and operation of the turbines shall be possible either from the General control room or from the unit local control panel for the purpose of commissioning and testing.
Control of the turbine shall be accomplished by controlling the position of the nozzle tip, with minimum loss of water and so that pressure in the penstock never exceed given limit. The governors shall be designed and equipped for taking the unit automatically to rated speed no-load operation. When the generator is connected to the grid, the regulating parameters shall be changed and load setting shall be possible. The governors shall allow proper sharing of load between the two units under any condition of load and speed without hunting. When the power house is interconnected with the existing power system, the units shall be capable of operating with the other power stations in the system.
Each unit shall be consisting of a Digital Electronic Governor with PID action while running on isolated as well as on Load Sharing Module, driver cards for the hydraulic proportional valves, some basic control and display functions, and starters for both the Lube oil motor and the HCM motor.
The governor will control the speed of the turbine via modulation of the deflector. The governing system should be highly accurate and rugged.
The turbine governor system will include the following control functions:
1. Frequency control
2. Load control
3. Main inlet valve control
4. Spear (needle) control
5. Jet deflector control
6. Manual mode operation
7. Local and remote operation

Hydro Consult Nyadi Hydropower Project Volume 1 Main Report
Nyadi Hydropower Limited
9-23
The governor system will consist of the following main units:
1. Digital turbine governor
2. Hydraulic control unit
3. Oil pressure system
4. Accumulator system
5. Mechanical/hydraulic over-speed trip device
9.5.7 Generator
Self-excited, self-regulated, horizontal axis, three phases, salient pole rotor, brushless, synchronous generators built in accordance with IEC standard will be used. The generator cooling consists of totally enclosed, air cooled (TEWAC), with air to water heat exchangers located in the generator frame.
The generators will have capacity to incorporate sufficient flywheel inertia to achieve stable frequency control when running in isolated mode.
Table 9-6 Generator data for NHP
S.No. Description Parameters
1 Type Salient pole, synchronous
2 Capacity 12 MVA
3 Power Factor 0.85
4 Generating Voltage 11kV
5 Frequency 50Hz
6 Class of Insulation F
7 Protection IP54
8 Cooling TEWAC
9 Efficiency 97%
10 Heating class B
11 Mechanical Braking Applied at 25% of rated speed
12 Temperature monitoring of stator winding
3X3 Pt 100 type at stator windings between the coils bars (3 in each phase winding), 2 as working 1 as spare
13 Temperature monitoring of Magnetic Circuit
3X3 Pt 100 type, 2 as working 1 as spare
9.5.8 Generator Level
11 kV switchgears shall be located near the control room together with switchgear components (like CBs, CTs, and PTs etc.). These switchgear panels will have inbuilt bus bar cabinets housed in its back.
Hydro Consult Nyadi Hydropower Project Volume 1 Main Report
Nyadi Hydropower Limited
9-24
Each generator’s output terminals shall be connected to this 11 kV bus bar system with XLPE AL. cable of adequate size. The switchgear and other protection and control components will accompany them in the switchgear panel to complete the incoming generation power circuit. Individual Switchgear panels for each generator incomer and outgoing feeder will be provided to complete the generation level switchgear system. This switchgear system will work in co-ordination with the control panels accommodated in the control room.
9.5.9 Excitation and Automatic Voltage Regulator (AVR)
Each generator will be equipped with brushless excitation system consisting of a 3-phase AC exciter and silicon diode type rotating Rectifier Bridge mounted on the generator shaft extension. The system shall be complete along with surge suppressor, automatic voltage regulator of solid-state type with Thyristor Bridge and field suppression equipment etc.
The number of Rectifier Bridge shall be so chosen such that one bridge is always available as spare. The protection against voltage spikes shall be provided. The AVR shall have fast response and anti-hunting features. The AVR shall be provided with cross compensating devices for parallel operation of generators.
The excitation transformer shall be 5-7kVA, with 11kV on primary side. The Transformer shall be of dry type.
The excitation shall be suitable for maintaining the voltage for a grid voltage variation of ± 5% & for a frequency variation of ± 3%. The AVR shall be sensitive enough to track and respond the changes up to +/- 0.5% of normal voltage (average of 3 phases) of the Generator when operating under steady load conditions (for any load) or excitation within operating range and shall initiate corrective action without hunting. The response time of excitation system shall be less than 20ms.
After the initial maximum voltage following any load rejection up to 100% of rated load, the AVR shall restore the terminal voltage to a value not more than 5% above or below the voltage being held before load rejection and shall maintain the voltage within these limits throughout the period of generator over speed.
The AVR shall have the following features:
a) Two auto channel with one manual mode for voltage control
b) Voltage / frequency during accelerating and decelerating of machine
c) Power factor / KVAR control mode
d) Reactive power shedding
e) KVAR limit
g) Short circuit maintenance
h) Diode failure indication
Besides these, equipment for limiting and regulating (both automatic/manual mode) on generator rotor current shall be included. Voltage setting devices and necessary control switches shall be included. These equipments shall be of a tropical design and shall work satisfactorily at a temperature of maximum 40oC.
9.5.10 Generator Grounding Each generator unit will be equipped with self ventilated, dry, resistive type grounding system. The rated voltage of resistor shall be 11kV and shall be made up of alloy of Chrome, Aluminum and Iron.

Hydro Consult Nyadi Hydropower Project Volume 1 Main Report
Nyadi Hydropower Limited
9-25
9.5.11 Power Transformers
The main transformer will be four (4) single phase, outdoor, oil immersed, ONAN type, each of 12000 kVA, to form single three phase bank and one spare unit for stepping up the voltage at Nyadi Plant from 11kV to 132/√ 3kV.
Table 9-7 Data for Power Transformer at NHP
S.No Description Parameters
1 Number of Transformers 1 PhaseX4
2 Type Outdoor, oil immersed
3 Cooling ONAN
4 Rating 12 MVA
5 Maximum Voltage Primary side - 12kV and Secondary Side -145kV
6 Rated Voltage (Line to Line) Primary side - 11kV and Secondary Side -132kV
7 Rated Lightning Impulse withstand Voltage
Primary side - 75kV and Secondary Side -650kV
8 Power Frequency Induced Over Voltage
Primary side - 28kV and Secondary Side -275kV
9 Type of Tap changing Off Load on High Voltage side
10 Tap Changing Range ±10% in Steps of 2.5
11 Principal tapping 132kV
12 Vector Group reference YNd5
13 Mimimum Short Circuit Impedance 8%
14 Noise Level dB(A) 62-63
Following Protections are implemented in Power Transformers at NHP
1. Transformer differential Protection (87T)
2. Restricted Earth fault Protection (64T)
3. Neutral earth fault protection (51NT)
4. Thermal Protection (49)
5. Pressure Relief device (63)
6. Buchholtz (gas operated relays) protection
7. Low Oil level alarm

Hydro Consult Nyadi Hydropower Project Volume 1 Main Report
Nyadi Hydropower Limited
9-26
9.5.12 Auxiliary Transformer
The auxiliary transformer, used for station power supply, will be three phase indoor, dry type of 500kVA.
Table 9-8 Data for Auxiliary Transformer at NHP
S.No Description Parameters
1 Number of Transformers 3 PhaseX1
2 Type Indoor
3 Cooling AN
4 Rating 500kVA
5 Maximum Voltage Primary side - 12kV and Secondary Side – 0.44kV
6 Rated Voltage (Line to Line) Primary side - 11kV and Secondary Side -0.4kV
7 Power Frequency Induced Over Voltage
Primary side - 28kV and Secondary Side -3kV
8 Type of Tap changing Off Load
9 Tap Changing Range ±5% in Steps of 2.5
10 Principal tapping 0.4kV
11 Vector Group reference Dyn11
12 Minimum Short Circuit Impedance 4%
9.5.13 Isolation Transformer
The isolation transformer will be of 11kV/11kV, three phases, 1000kVA, oil immersed, ONAN, outdoor use type, and delta/star connected supply feeder for Dam site, camp and Local supply.
Table 9-9 Data for Isolation Transformer at NHP
S.No Description Parameters
1 Number of Transformers 3 PhaseX1
2 Type Outdoor, oil immersed
3 Cooling ONAN
4 Rating 1000kVA
5 Maximum Voltage Primary side - 12kV and Secondary Side – 12kV
6 Rated Voltage (Line to Line) Primary side - 11kV and Secondary Side -11kV

Hydro Consult Nyadi Hydropower Project Volume 1 Main Report
Nyadi Hydropower Limited
9-27
7 Rated Lightning Impulse withstand Voltage
Primary side - 75kV and Secondary Side -75kV
8 Power Frequency Induced Over Voltage
Primary side - 28kV and Secondary Side -28kV
9 Type of Tap changing Off Load
10 Tap Changing Range ±5% in Steps of 2.5
11 Principal tapping 11kV
12 Vector Group reference Dyn11
13 Minimum Short Circuit Impedance 5%
14 Noise Level dB(A) <52
9.5.14 Vacuum Circuit Breaker (VCB)
Metal Enclosed, Cubicle Indoor type, three phase vacuum circuit breakers are used in the 11kV side of Power house equipments. This includes, Generator Circuit Breaker (3 Nos), Delta and Star Side of Isolation Transformer (2 Nos), Delta side of Station auxiliary Transformer (1 Nos) and Delta side of Power Transformer (1 Nos).
Table 9-10 Data for Generator Circuit Breaker
S.No. Description Parameters
1 Type Vacuum, Metal Enclosed, Cubicle Indoor Type
2 Rated Continuous Current 1250A
3 Rated Short Circuit Breaking Current 25kA
4 Number of Circuit Breakers 3
5 Rated Peak Withstand current 62.5kA
6 Rated Lightning Impulse Withstand Voltage
60kV
7 Operating Sequence O-3min-CO-3min-CO
Table 9-11 Data for Circuit Breaker in Isolation Transformer and Delta side of Station Transformer
S.No Description Parameters
1 Type Vacuum, Metal Enclosed, Cubicle Indoor Type
2 Rated Continuous Current 630A
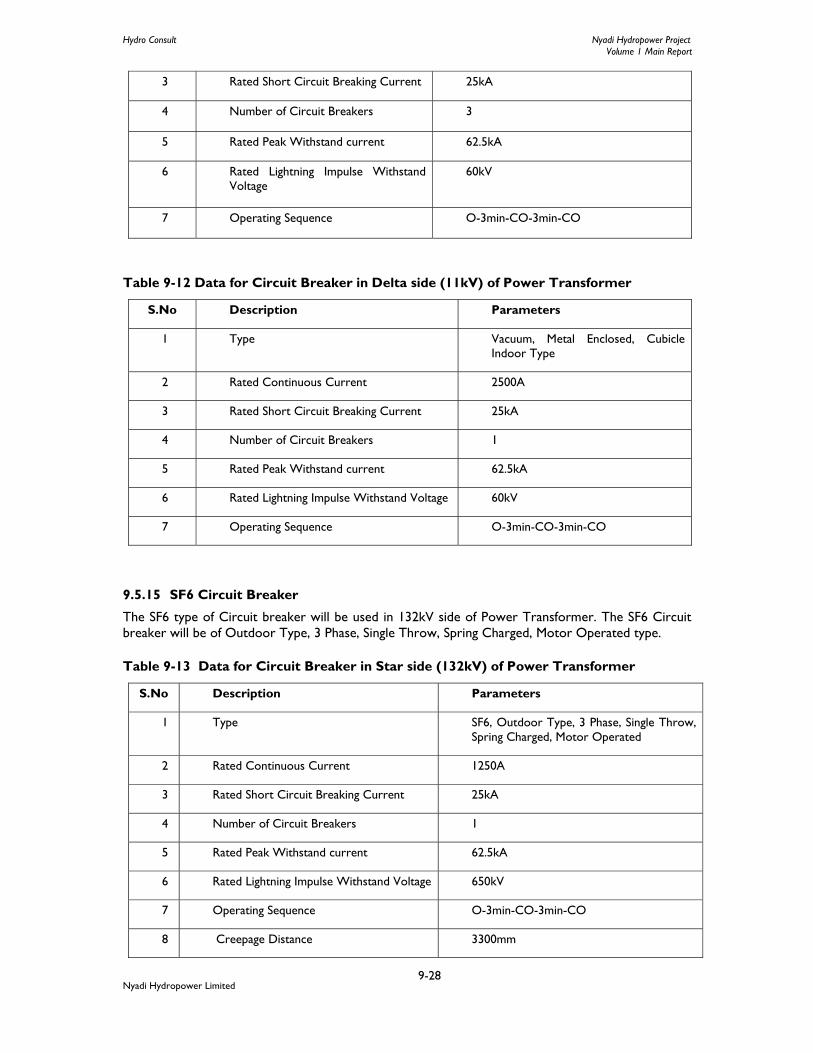
Hydro Consult Nyadi Hydropower Project Volume 1 Main Report
Nyadi Hydropower Limited
9-28
3 Rated Short Circuit Breaking Current 25kA
4 Number of Circuit Breakers 3
5 Rated Peak Withstand current 62.5kA
6 Rated Lightning Impulse Withstand Voltage
60kV
7 Operating Sequence O-3min-CO-3min-CO
Table 9-12 Data for Circuit Breaker in Delta side (11kV) of Power Transformer
S.No Description Parameters
1 Type Vacuum, Metal Enclosed, Cubicle Indoor Type
2 Rated Continuous Current 2500A
3 Rated Short Circuit Breaking Current 25kA
4 Number of Circuit Breakers 1
5 Rated Peak Withstand current 62.5kA
6 Rated Lightning Impulse Withstand Voltage 60kV
7 Operating Sequence O-3min-CO-3min-CO
9.5.15 SF6 Circuit Breaker
The SF6 type of Circuit breaker will be used in 132kV side of Power Transformer. The SF6 Circuit breaker will be of Outdoor Type, 3 Phase, Single Throw, Spring Charged, Motor Operated type.
Table 9-13 Data for Circuit Breaker in Star side (132kV) of Power Transformer
S.No Description Parameters
1 Type SF6, Outdoor Type, 3 Phase, Single Throw, Spring Charged, Motor Operated
2 Rated Continuous Current 1250A
3 Rated Short Circuit Breaking Current 25kA
4 Number of Circuit Breakers 1
5 Rated Peak Withstand current 62.5kA
6 Rated Lightning Impulse Withstand Voltage 650kV
7 Operating Sequence O-3min-CO-3min-CO
8 Creepage Distance 3300mm

Hydro Consult Nyadi Hydropower Project Volume 1 Main Report
Nyadi Hydropower Limited
9-29
9.5.16 Air Circuit Breaker
Cubicle Indoor type, three phase Air circuit breakers are used in the 0.4kV side of Power house equipments. This includes breaker for Low voltage side of Station Auxiliary Transformer and Output of Diesel Generator.
Table 9-14 Data for Circuit Breaker in 0.4kV side of Power Station
S.No Description Parameters
1 Type ACB, Cubicle Indoor Type
2 Rated Continuous Current 1000A
3 Rated Short Circuit Breaking Current 25kA
4 Number of Circuit Breakers 2
5 Rated Peak Withstand current 62.5kA
6 Rated Lightning Impulse Withstand Voltage <20kV
9.5.17 Lightening Arrestor
Lightning arrester for 11kV will be Indoor type with service voltage of 11kV and arrester rated voltage of 10kVrms. The temporary over voltage will be 12kVrms for 10sec. Similarly, lightning arrester for 132kV side will be outdoor type with service voltage of 132kV and arrester rated voltage of 120kVrms. The temporary over voltage for this type will be 132kVrms for 10sec.
9.5.18 Diesel Generator
The diesel Generator for power house purpose will be of 350kVA, 400V, 50Hz, 3 Phase type. The diesel generator will have heating class B, insulation class F and IP23 type of Protection of enclosure.
9.5.19 High Voltage Switchyard
A 132 kV outdoor type switchyard will be constructed near the powerhouse to evacuate the generated power. The switchyard components shall be suitable for hot, humid and moderately polluted environment. The switchgear system for this switchyard shall be equipped with Circuit breakers, Current transformers, potential transformers, disconnecting switches with/without earthing and Lightning Arrestors and synchronous check relay etc. for 132 kV incoming and outgoing circuits. The switchgear system here will work in coordination with the associated control panels accommodated in the control room and shall ensure the overall protection of the switchyard.
9.5.20 DC Power Supply The DC Auxiliary system in Nyadi Hydro Power will have 110V DC and 24V DC battery bank. A DC–DC converter shall generate 48V DC, from110V DC system. Vented Type Lead Acid batteries are used for DC Auxiliary system of NHP.
9.5.21 Interconnection to grid
The proposed NHP shall be integrated to national grid through 132 kV switchyard of proposed Hub of NEA with 132 kV Switching Arrangement. The proposed 132 kV NEA Hub at Tunikharka is about 7 km from the Nyadi Switchyard, downstream of Nyadi confluence at the Marsyangdi Corridor.
Hydro Consult Nyadi Hydropower Project Volume 1 Main Report
Nyadi Hydropower Limited
9-30
9.6 Transmission Line Considering that NEA will construct a substation at the Marsyangdi corrider, desk study and the walkover survey has been done on 28th May 2010 and 6-7th 2010 June respectively. The power evacuation from the Nyadi switchyard the Steel Lattice Transmission Tower to INPS via. Thulobesi, Usta danda, dhobanchaur, Nyadi bazaar, Nandeswara and the proposed 132 kV NEA’s Hub at Tunikharka. The transmission line length is approximately 7 km and the average span of the tower is considered as 252 m. The detail survey will be conducted during the detail design.
9.7 Access Road and Bridge Two different alignments of the access road have been chosen and studied. Evaluating the merits and demerits of both options, we concluded to select alternative-2. It is the best alignment of project road. From the viewpoint of construction as well as repair and maintenance cost, the alternative-2 seems to be economical than other options. So, it is the best alignment considering long term stability and serviceability to more people and overall economy as well. (Ref. Drawing 1220/01/90A00, Volume IV, Appendix N)
The access road of Nyadi Hydropower Project is designed as a district level road of Lamjung District. This road links Beshishar - Chame road at Thakanbeshi of Khudi VDC through Power House site in Thulobesi along the Naiche village to Headworks area of Nyadi Hydropower Project in the same VDC. As the geology of the site is unstable, the alignment was chosen so as to provide long term stability as well as reduce repair and maintenance cost from economic viewpoint. Moreover, the alignment of this road will encompass several villages along its route besides being the shortest as far as practicable. The alignment of this road runs from the highest altitude of 1375m at Headworks Site to the lowest altitude of 912m at Marsyangdi River Bridge Site. Parts of the road alignment passes through cultivated land mostly Corn and Paddy fields in Thulobesi and Naiche while the most of it passes through steep slopes and even hard cliff in few areas.
A permanent bridge of 52 m length over Marsyangdi River is required to be constructed along this stretch. Detailed structural design report of Bridge over Marsyangdi is in separate reports of Bridge and drawings are presented in Appendix N, Volume IV.
The length of road from the starting point at Besisahar-Chame Road to the End point at Headworks Site is 11.11 km and 2.39 km road is needed for surge shaft access from Thulobesi. Hence the total length of the Access road is 13.50 km. The width of road is kept 4.50 m as per standard of district road recommended by Department of Local Infrastructure Development and Agricultural Road (DOLIDAR).
The gradient of the road is kept under ruling as far as possible. As the length of this road is about 13.5 Km, and it follows middle part of hill slope and partly lower river valley range, there are numerous cross drainage structures. These cross drainages are mostly provided as dry stone causeways so as to economize the cost. These cross drainages are provided at the natural drainage points as far as possible. One major bridge is to be constructed in Marsyangdi River at 1.10km upstream from the confluence of Marsyangdi and Nyadi Khola. The side slope of filling and cutting of the road is chosen to ensure the stability of the road.
The design has been kept optimum for the balance of cutting and filling of earthwork quantities. In order to maintain the slope of formation level of access road within the permissible slope, about 18 hairpin bends along the whole length are provided. The cross sections of road along rocky cliff part will require massive excavation employing blasting techniques. Except in rocky and steep portion of alignment, most of the retaining and breast walls provided are dry stone masonry and gabion structures with due consideration of environment friendliness, economy as well as requirement of less expertise for construction. But in rocky portion to maintain homogeneity stone masonry retaining walls with 1: 4 cement mortar is used wherever required.
Quantity and Cost Estimation has been done as per the following the latest norms of Road Department of Nepal together with the recent district rate analysis. However, owing to the
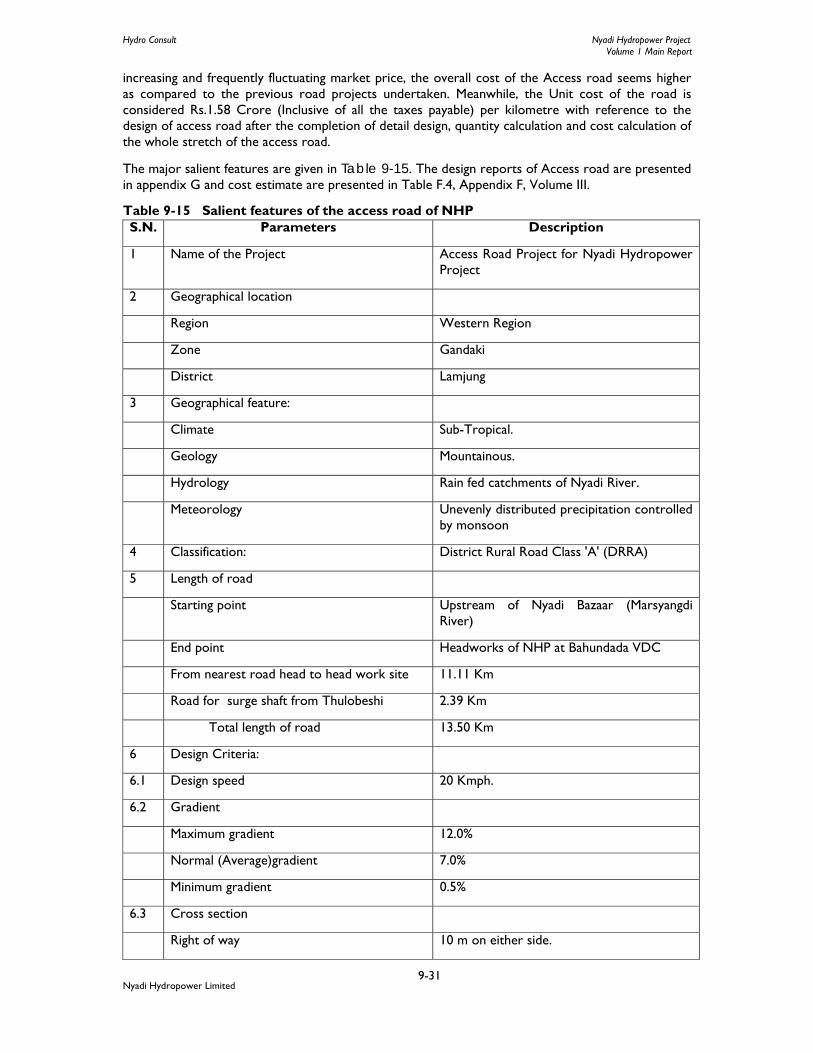
Hydro Consult Nyadi Hydropower Project Volume 1 Main Report
Nyadi Hydropower Limited
9-31
increasing and frequently fluctuating market price, the overall cost of the Access road seems higher as compared to the previous road projects undertaken. Meanwhile, the Unit cost of the road is considered Rs.1.58 Crore (Inclusive of all the taxes payable) per kilometre with reference to the design of access road after the completion of detail design, quantity calculation and cost calculation of the whole stretch of the access road.
The major salient features are given in Table 9-15. The design reports of Access road are presented in appendix G and cost estimate are presented in Table F.4, Appendix F, Volume III.
Table 9-15 Salient features of the access road of NHP S.N. Parameters Description
1 Name of the Project Access Road Project for Nyadi Hydropower Project
2 Geographical location
Region Western Region
Zone Gandaki
District Lamjung
3 Geographical feature:
Climate Sub-Tropical.
Geology Mountainous.
Hydrology Rain fed catchments of Nyadi River.
Meteorology Unevenly distributed precipitation controlled by monsoon
4 Classification: District Rural Road Class 'A' (DRRA)
5 Length of road
Starting point Upstream of Nyadi Bazaar (Marsyangdi River)
End point Headworks of NHP at Bahundada VDC
From nearest road head to head work site 11.11 Km
Road for surge shaft from Thulobeshi 2.39 Km
Total length of road 13.50 Km
6 Design Criteria:
6.1 Design speed 20 Kmph.
6.2 Gradient
Maximum gradient 12.0%
Normal (Average)gradient 7.0%
Minimum gradient 0.5%
6.3 Cross section
Right of way 10 m on either side.

Hydro Consult Nyadi Hydropower Project Volume 1 Main Report
Nyadi Hydropower Limited
9-32
S.N. Parameters Description
Formation width 4.5 m.
Carriage way 3.0 m.
Shoulder 0.75 m.
Cross fall 3%
6.4 Side drain Trapezoidal Earthen/Unlined Drain
6.5 Minimum horizontal curve radius 12.5m
7 Pavement Gravel (15 cm Thick)
Refer drawings of plan, profile and cross sections along with typical drawings of cross drainage structures and retaining structures in separate volume. 9.8 Housing Temporary and permanent housings in Nyadi Hydropower Project for construction purpose as well operation purpose have been designed based on manpower requirement in this capacity of project. All design, drawings and estimation of staff housings and offices are put in separate volume.

Hydro Consult Nyadi Hydropower Project Volume 1 Main Report
Nyadi Hydropower Limited
10-1
10. POWER EVACUATION Previously, Power Evacuation study for the Nyadi Hydropower Project (20 MW) was conducted by Engineering Services of NEA and the study showed that the 132 kV s/c Wolf-Conductor transmission line was found to be most economical and the connection point was set at Middle Marsyangdi switchyard. Recently the proposed Nyadi Hydropower project is optimized in 30MW installed capacity including tailwater discharge of Siuri Small Hydropower Project. The proposed NEA Hub nearby Marsyangdi corridor downstream of Nyadi confluence is considered for the evacuation of power from switchyard of Nyadi Hydropower Project.
Spreadsheet Analysis: Spreadsheet analysis for the optimization of the conductor was carried with different types of options. No of options used were:
a) 33 kV Double Circuit Wolf Conductor b) 33 kV Double Circuit Panther Conductor c) 132 kV Single Circuit Wolf Conductor d) 132 kV Single Circuit Panther Conductor e) 132 kV Single Circuit Bear Conductor f) 132 kV Double Circuit Wolf Conductor g) 33 kV Double Circuit Panther Conductor h) 33 kV Double Circuit Bear Conductor
Figure 10-1 Conductor optimization curve
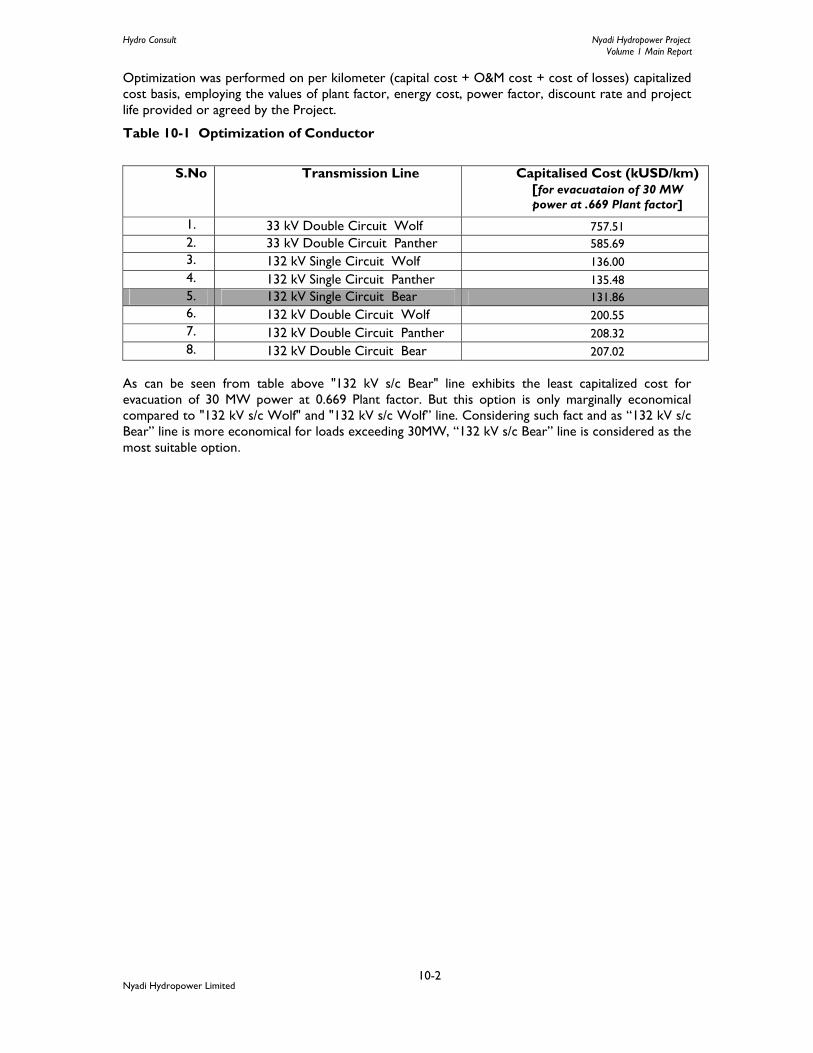
Hydro Consult Nyadi Hydropower Project Volume 1 Main Report
Nyadi Hydropower Limited
10-2
Optimization was performed on per kilometer (capital cost + O&M cost + cost of losses) capitalized cost basis, employing the values of plant factor, energy cost, power factor, discount rate and project life provided or agreed by the Project.
Table 10-1 Optimization of Conductor
S.No Transmission Line Capitalised Cost (kUSD/km)
[for evacuataion of 30 MW power at .669 Plant factor]
1. 33 kV Double Circuit Wolf 757.51 2. 33 kV Double Circuit Panther 585.69 3. 132 kV Single Circuit Wolf 136.00 4. 132 kV Single Circuit Panther 135.48 5. 132 kV Single Circuit Bear 131.86 6. 132 kV Double Circuit Wolf 200.55 7. 132 kV Double Circuit Panther 208.32 8. 132 kV Double Circuit Bear 207.02
As can be seen from table above "132 kV s/c Bear" line exhibits the least capitalized cost for evacuation of 30 MW power at 0.669 Plant factor. But this option is only marginally economical compared to "132 kV s/c Wolf" and "132 kV s/c Wolf” line. Considering such fact and as “132 kV s/c Bear” line is more economical for loads exceeding 30MW, “132 kV s/c Bear” line is considered as the most suitable option.

Hydro Consult Nyadi Hydropower Project Volume 1 Main Report
Nyadi Hydropower Limited
11-1
11. ENVIRONMENTAL IMPACT ASSESSMENT (EIA)
11.1 Description of the project
The Nyadi Hydropower Project (NHP) is one of the main projects of the Nyadi Hydropower Limited (NHL), which was established by the consortium of Butwal Power Company (BPC) Limited, SCP hydro Inc. Canada and Lamjung Electricity Development Company (LEDCO). Butwal Power Company Hydroconsult (BPCH) is carrying out the feasibility and EIA studies of the NHP on behalf of NHL. The proposed install capacity of NHP is 30 MW. This updated EIA of the NHP has been prepared on the basis of a previous approved EIA report of NHP and the EPR 2054 and second amendment 2064.
11.2 Project location
NHP is located in Bahundada and Bhulbhule Village Development Committees (VDCs) of Lamjung District. Thus, these VDCs are considered as project affected VDCs. All structural components of the project are located in Bahundada VDC. The intake is located approximately 2.5 km upstream of the village of Naiche, which is approximately 9 km upstream of the Nyadi-Marshyangdi confluence. Similarly, the powerhouse is proposed to be constructed about 3 km downstream of Naiche, at the village of Thulobeshi of Bahundada VDC.
11.3 Objective of the study
The main objective of the study is to identify the beneficial and adverse impacts associated with the project; suggest proper mitigation measures to mitigate the adverse impacts and enhancement measures to enhance the beneficial impacts.
11.4 Methodologies used during EIA study
The methodology adopted for this EIA study are the review of published and unpublished reports, questionnaire survey, group discussion, PRA, checklist and vegetation survey.
11.5 General project features
Detailed project features of the NHP have been outlined in the main text of this report. The salient features of the project include:
• Diversion weir of crest elevation 1381.50 masl.
• 3.95 Km long Tunnel
• 676 m long Penstock pipe
• Underground Powerhouse
• Camp for accommodation of staffs.
Hydro Consult Nyadi Hydropower Project Volume 1 Main Report
Nyadi Hydropower Limited
11-2
11.6 Construction period
The project is targeted to be completed in 3.5 years time. The construction of the access road, staff quarters, water supply and other infrastructure needed for the project will be carried out along with the construction of the main project structures. Three shifts, each of eight hours, are scheduled for the construction of the major structures like weir, tunnel and powerhouse, all of which will be carried out simultaneously. About 400-500 workers will be required for the construction work, with priority given to workers from the project affected VDCs based on their qualifications.
11.7 Description of the existing environment
The baseline information on the physical, biological and socio-economic environment is a prerequisite of any EIA report. Baseline information is essential for environmental monitoring and auditing to assess the actual impacts and effectiveness of mitigation measures. Information on the physical, biological and socio-economic environment was collected during the EIA field visit.
11.7.1 The Physical Environment
Although the project area is located between an altitude of 1020 masl and 1380 masl, the river basin extends up to an altitude of 7000 m. Therefore, the project area lies in the sub-tropical climatic zone (1000 m to 2000 m).
The wet monsoon (predominant period of rainfall) generally commences around mid-June and lasts till mid-August, although some pre-monsoon precipitation can occur during the month of May.
Schist and quartzite are the dominant rock type of the project area. The air and noise quality of the project area are found to be in good condition. The catchment area has a dendritic drainage pattern and the total catchment area of the Nyadi River at the intake is 154.7 km2.
11.7.2 The Biological Environment
The project area lies in the sub-tropical climatic zone. Mixed type of forest is found in the project area. Tropical deciduous riverine forest, sub-tropical grassland, and sub-tropical evergreen forest are the forest types in the project area. Altogether thirteen community forests exist around the project area. The dominant tree species of the project area are Simal (Bombax cebia), Siris (Albazzia procera), Uttis (Alnus nepalensis), Chilaune (Schima wallichii), etc. Similarly, the ground vegetation mainly comprises of Titepati (Artenusia dubia), Sisnu (Girardinia palmata), Bhat (Clerodendron infortunatum), Khar (Typha angustata), etc.
Nineteen different species of mammals have been recorded in and around the project area. Among these, the common species are Rhesus macaque (Macaca mullatta), Jackal (Canis aureus), Porcupine (Hystrix indica) Common langur (Presbytes entellus), etc. Local people have reported occasional sightings of Tiger (Panthera tigris), Leopard (Panthera paradus) and Ghoral (Noemorhaedus ghoral) in the surrounding forests.
Cuckoos (Cuculus spp.), Jungle crow (Corvus macrorhychos), Green woodpecker (Picus squamatus) and Kalij pheasants (Lophura leucomelana) are the prominent bird species reported from the project area. Reptiles found in the project area are Snake (Ptyas mucosus) and Garden lizard (Calotes versicolor). The common fish species are Snow trout (Schizothoraichthys progastus), Catfish (Pseudecheneius sulcatus) and Copper mahseer.

Hydro Consult Nyadi Hydropower Project Volume 1 Main Report
Nyadi Hydropower Limited
11-3
11.7.3 The Socio-economic and Cultural environment
The total population of Lamjung district is 177,149 and the average household size is 4.85. Bahundada and Bhulbhule are the project affected VDCs with a combined population of 6,033 and 1,205 households. Gurung, Brahmin and Chhetri are the dominant caste groups in the project area. By religion, the population constitutes of 51 % Hindu, 44 % Buddhist and 5 % Christian. Mainly, people from rural areas migrate to cities for employment and business purposes. Usually, people migrate to Besisahar, Kathmandu, India and Malaysia. During the study, it was found that about 3% of population has migrated from the project area. Agriculture is the main occupation and more than 82% of the population are involved in this field for their primary livelihood. The average per capita income of Rs. 26,268 ($416) was reported during the household survey. Paddy, Maize and Potato are the major crops produced in the area. Wood is the main source of fuel and about 90% of the people use firewood for cooking and heating purposes. In total, 54% of the sampled populations in the project area are literate, which is less than the district average of 74% (DDC, 2004). The supply of tapped drinking water is satisfactory in the project area; however, sanitary conditions are not good and only 40 % households have toilet facilities.
11.8 Identification of Environmental Impacts
11.8.1 Impact on Physical Environment
Landslide and soil erosion Access road construction and other excavation activities may destabilize ground slopes which may cause landslides and soil erosion. Also, due to the high intensity of noise during blasting activities, the nearby rocks and slopes might crack and fall down. This is expected to be much localized and temporary. Similarly, landslides and soil erosion might also be caused by the movement of heavy vehicles such as dozers, drilling machines, vibrators and blasting activities during the construction of the project structures. Air and noise pollution
Construction activities and vehicle movements along the access road will increase the noise pollution, dust and air pollutant such as suspended particles and carbon monoxide in the local environment that may have adverse effects on human health, plant species and agricultural crops.
Water pollution
Construction waste, excavated material and toxic material, if not properly disposed of, will cause adverse impacts on the local environment. Further, if the muck is directly disposed into the river it will decrease dissolved oxygen, increase turbidity and BOD in the river and will have an adverse impact on aquatic life
Muck disposal and its impacts The excavation of tunnels, adits and surge shaft will produce approximately 90,000 m3 of loose soils and rocks; if not properly disposed; it will affect surrounding agriculture land, forest land and water resources. Impact due to stockpiling of construction materials
The improper stockpiling of construction materials like brick, cement and aggregates will reduce the aesthetic beauty of the area.

Hydro Consult Nyadi Hydropower Project Volume 1 Main Report
Nyadi Hydropower Limited
11-4
Land use impact
The project will acquire 21.82 ha of land at different locations for construction purposes, out of which 17.74 ha will be acquired permanently and the rest will be leased for temporary use. Out of the 17.74 ha, about 14.89 ha is agriculture land, 2.65 ha is barren or grass land and 0.2 ha is forest area. The land to be leased for temporary use will be cultivated land.
Impact of toxic materials
Construction equipment and vehicles use significant amount of toxic chemicals such as diesel, petrol, grease, paints etc. The leakage of these materials may have impacts on the river and soil.
Change in water quality due to reduced flow
Due to the low volume of water flow, sedimentation might increase which will consequently reduce the dissolved oxygen level of the downstream area.
Impact on micro climate
The diversion of Nyadi River will eventually result in some microclimatic changes in the downstream dewatered zone.
Impact on forest/vegetation
In total, 28 trees will have to be cut during the implementation of the project. Similarly, 3 Simal (Bombax ceiba) trees will be lost, which are listed as protected under the forest regulation.
Impact on fauna
Construction works are expected to disturb the normal movement, feeding and other activities of local fauna. Excavation, grading and filling activities may kill small species such as frogs, lizards and small mammals. Further, illegal hunting and poaching is also expected to some extent during the construction and operation phase of the project.
Impact on fish
Construction activities (removal of boulder, excavation of weir foundation, disposal of spoil and muck, etc.) may affect fish habitat (spawning site, shelter, increase water turbidity, etc.) and disturb the free movements of midrange migrant fish. Also, fishing may increase throughout the duration of the project construction due to the influx of workers.
11.8.2 Impact on Biological Environment
Impact on forest/vegetation
In total, 28 trees will have to be cut during the implementation of the project. Similarly, 3 Simal (Bombax ceiba) trees will be lost, which are listed as protected under the forest regulation.
Impact on fauna
Construction works are expected to disturb the normal movement, feeding and other activities of local fauna. Excavation, grading and filling activities may kill small species such as frogs, lizards and small mammals. Further, illegal hunting and poaching is also expected to some extent during the construction and operation phase of the project.
Impact on fish
Construction activities (removal of boulder, excavation of weir foundation, disposal of spoil and muck, etc.) may affect fish habitat (spawning site, shelter, increase water turbidity, etc.) and disturb

Hydro Consult Nyadi Hydropower Project Volume 1 Main Report
Nyadi Hydropower Limited
11-5
the free movements of midrange migrant fish. Also, fishing may increase throughout the duration of the project construction due to the influx of workers.
11.8.3 Impact on Socio-economic and Cultural Environment
Impact of land acquisition
The project will acquire about 21.82 ha of land, out of which 17.74 ha will be permanently acquired and the remaining 4.08 ha will be leased for 3.5 years. Out of the 17.74 ha of land, 14.89 ha is agriculture, 2.65 ha is barren and 0.2 ha is forest land.
Potential change in agriculture production
The construction of project will have impact on the agricultural production of the area. As per the local production trends, there will be annual decline of about 54.88 ton paddy, same amount of wheat and approximately about 43.07 ton maize due to the acquisition of the agriculture land.
Anti-social behavior
Introduction of projects with a considerable influx of workforce tend to bring about a number of impacts on the social environment. The occurrence and significance of these impacts are a function of the workforce size and composition; the larger and more foreign the workforce, the higher the anticipated social disturbances.
Impact on health and sanitation
The public health and sanitation situation in the project area is not good and the influx of workers in the project area will result in added pressure on existing limited health and sanitation infrastructures. This will further worsen the situation unless the project makes an effort to improve the health and sanitation conditions in the area.
Demographic pressure
The influx of workers will result in added pressure on the local infrastructures like health posts, schools, public taps as well as on the local economy and environment. The increase in population will further deteriorate efficiency of the existing local services. If not managed properly, the increase in population will create shortages of goods and services. Sharing of limited resources and public facilities with outsiders may create problems and conflicts between the outsiders and the locals.
Law and order
Cases of anti-social behaviour and violations of law and order are likely to occur due to the influx of external workforce during the construction of the project. In addition, the negligible administrative presence of the Government in the project area will further worsen the law and order situation of the project area.
Occupational health and safety
Occupational accident risks are common in the construction projects primarily because of the unsafe construction practices. If not supervised carefully, construction activities such as blasting, use of heavy equipment, tunnel excavation and working on steep slopes may cause work related injuries and vehicle accidents.
Inflation of market price
The existing market infrastructures of the project area are limited and there are not enough shops to cater to the added demand for food and commodities of additional work force. The influx of large
Hydro Consult Nyadi Hydropower Project Volume 1 Main Report
Nyadi Hydropower Limited
11-6
number of workers will add pressure for supply thus increasing the price of goods during the construction period.
Child labor
Despite GoN’s ban on child labor, it remains a potential temptation in an economically poor region such as the proposed project area for children to be exploited to pursue menial jobs.
11.8.4 Beneficial Impacts
The implementation of this project will provide several beneficial impacts in the project area and society. People of the area will have advantage of the access road and local people may establish their own business which will help to improve the local economy. During the construction phase, the project will provide employment opportunities to about 400-500 unskilled, semiskilled and skilled manpower. Further, the completion of construction work provides basis for rural electrification program.
11.9 Mitigation and Enhancement Measures
The following mitigation measures are proposed by the project to mitigate the adverse impacts on the physical, biological and socio-economic environment.
11.9.1 Physical Environment
Landslide and soil erosion
• Erosion control methods will be implemented
• Erosion/landslide area will not be disturbed
• Plantation will be carried out to control soil erosion
Air, water and noise pollution
• Regular maintenance of vehicular engines and stationary combustion engines will be done
• Water will be sprayed before the starting of the day work in the dusty area of road and surroundings.
• A waste collection and disposal mechanism will be developed
• Crushing plant and its operation will be isolated from settlements
• Blasting works will be avoided at night time
Disposal of muck
• The project will buy land for dumping of the spoils generated from different activities
• Suitable rocks from the excavations will be reused
Impact due to stockpiling of construction materials
• All construction materials such as cement, aggregates, etc. will be stored properly
Land use impact
• Appropriate compensation will be provided to the affected families whose land will be occupied by the project

Hydro Consult Nyadi Hydropower Project Volume 1 Main Report
Nyadi Hydropower Limited
11-7
• Plantation will be done in nearby areas to compensate forest loss
Impact of toxic materials
• Vehicles and construction equipment which use chemical substances like petrol, diesel, grease, etc. will be regularly monitored to detect leakage
Change in water quality due to reduced flow
• Downstream water flow will be maintain at least 10 % of the lowest mean monthly flow
11.9.2 Biological Environment
Forest and vegetation
• Loss of 28 trees will be compensated by plantation of 700 trees which is 25 times of the
actual loss.
• The project will cut down trees and shrubs that are only essential to be cleared for construction activities.
Impact on fauna
• Hunting and poaching of wildlife will be prohibited around the project area
• Awareness programs related to environmental conservation and importance of wildlife will be conducted
Impact on fish
• A fish ladder will be constructed for free migration of migratory fishes
• To minimize the dewatering impact, a riparian flow of 10 percent of total flow during dry period is recommended
11.9.3 Socio-economic and Cultural Environment
Land acquisition
• Compensation will be provided for those who are likely to lose their land based on the market price and the Land Acquisition Act, 2034.
• Counseling services will be provided for the local people for the proper utilization of the cash compensation.
Potential decrease in agriculture production • Training on improved agriculture technology will be given and improved seed will be
provided to the local people. Anti social behavior
• A counseling session on local culture and environment will be given for the project workers.
• Workers’ behavior will be regularly monitored
• Awareness campaigns will be conducted
Health and sanitation
• The project area will be made clean and hygienic.

Hydro Consult Nyadi Hydropower Project Volume 1 Main Report
Nyadi Hydropower Limited
11-8
• Public taps will be installed
• Adequate drains will be constructed in order to avoid stagnant pools of wastewater
• Toilet facilities will be provided at a ratio of 1 for 20 construction workers
• Proper solid waste management practices will be implemented.
Demographic pressure
• To discourage inflow of outsiders, priority will be given to local people during construction period as far as possible
Project will provide fund for the improvement of existing local services.
Law and order • Workers’ behavior will be regularly monitored.
• A mechanism will be set up to limit the activities of outside workforce within their camp.
• Alcohol and gambling will be prohibited to the project labourers in project work sites, camps and nearby villages.
Occupational health and hazard Adequate training programs in relevant fields will be given to all construction workers,
Protective clothing such as helmets, boots, gloves and masks will be provided to the construction workers,
Emergency equipment such as fire extinguishers, first-aid kits, etc. will be made available on site at all times,
Local people will be made aware about the potential danger areas and associated works,
Potentially dangerous areas and activities will be notified by putting up relevant sign boards at required locations
Child labour • Child employment in the project will be strictly prohibited
11.9.4 Enhancement Measures for Beneficial Impacts
• Project will provide the environment to establish industries in the project area
• Local people will be employed in construction works as far as possible
• Project affected families will be given priority for employment
• Trainings on skill development and capacity building program will be organized
11.10 Environmental Management Plan (EMP)
EMP refers to the activities of environmental monitoring and auditing of the project impacts. Three types of monitoring have been proposed during the project construction and operation. These include:
• Baseline monitoring
• Impact monitoring
• Compliance monitoring
Each type of monitoring activity will take place during the project construction. Parameters to be considered, methods of measurement, locations, schedules and agencies responsible for the

Hydro Consult Nyadi Hydropower Project Volume 1 Main Report
Nyadi Hydropower Limited
11-9
execution of the above monitoring have been given in EIA report. The estimated cost for mitigation and enhancement, baseline monitoring, monitoring during construction phase, monitoring during operation phase and internal auditing are given in Table 11-1 below:
Table 11-1 Costs for mitigation and enhancement measures, monitoring and internal auditing
Monitoring and Mitigation cost
Item Total cost (In NRs) Mitigation and Enhancement measures cost 16,464,000 Cost for base line monitoring 963,750 Cost for Environmental Monitoring during construction phase 11,795,000 Environmental Monitoring during operation phase 2,255,000 Internal Environmental Auditing Cost 846,250
Sub-total 32,324,000 Land Aqusition 38,416,858
Total 70,740,858
In words: Seventy Million Seven Hundred fourty Thousand and eight Hundred fifty eight Nepalese Rupees Only.

Hydro Consult Nyadi Hydropower Project Volume 1 Main Report
Nyadi Hydropower Limited
12-1
12. CONSTRUCTION PLANNING AND SCHEDULE
12.1 Introduction
This section of the report describes the anticipated construction technology applied for various works and presents a work planning and implementation schedule for the execution of the project. Construction schedule has been prepared for the major construction activities. Critical activities as well as milestone have been identified.
Previously, it took approximately a day’s walk to reach Naiche from Besisahar or half a day from the road head at “Upper Nyadi Bazaar” or Thakanbesi area. Now, the construction work for track opening is going on from the road head at Thakanbeshi upto the headworks through powerhouse area at Thulobeshi and Naiche village. Besides, a bailey bridge of 52m long has been proposed to connect the two sides of Marsyangdi River along the road alignment at Thakanbeshi. The agreement with the contractor has been done and the contractor has been mobilized for the construction of the proposed Bailey bridge at site.
The contractors are responsible for the construction of camps for its work force. The construction camps shall be well-managed to comply with the environmental integrity. It is envisaged that two such camps will be required, one at the headworks area, and another at the powerhouse area. Separate permanent housings have to be constructed by the employer which shall be converted to permanent facilities for operation and maintenance later on.
It is estimated that electricity supply from the NEA feeder as well as contractors generator power will be used to provide power for the construction works and other activities.
The average length of daylight in the project area is roughly 8 to 10 hours so that surface constriction activities have been assumed to extend over the same period. A margin for time loss due to adverse weather or other unforeseen delaying conditions has been allowed in the adopted production rate.
With regard to underground works, proper lighting and ventilation will be required. This work is assumed to continue uninterrupted for 24 hours in three shifts a day with each eight hours shifts resulting in a total working time of six hundred hours per months for 25 working days.
The construction of the project will involve works at Four sites simultaneously that is work at headworks, work at Naiche Adit (two faces simultaneously), works at surge adit and work at penstock and powerhouse area.

Hydro Consult Nyadi Hydropower Project Volume 1 Main Report
Nyadi Hydropower Limited
12-2
Figure 12-1 Proposed Construction Schedule for NHP
Hydro Consult Nyadi Hydropower Project Volume 1 Main Report
Nyadi Hydropower Limited
12-3
12.2 Construction Activities
12.2.1 River diversion during construction
Construction of the weir and side intake on the river will require keeping the working area dry during the construction period. The main responsibility for the design and construction methodology for cofferdams is envisioned to be laid at the part of the contractor; however a conceptual plan is proposed for the construction of cofferdam. For this purpose, the flow in the river will be required to be diverted and protect the area by means of cofferdams in two subsequent phases. In first phase, it is proposed to construct the cofferdam before the proposed weir axis to divert water through diversion tunnel in left bank of river and the working area is proposed at right bank of the Nyadi river and will start construction of intake, gravel flushing tunnel, intake tunnel, settling chamber and diversion weir. The cofferdams are kept at a height, which shall safely pass 1 in 5 year return period flood. Downstream cofferdam will also be required to prevent backwater to the working area. The crest levels of cofferdam at upstream of weir axis is 1381.50 masl. For details, refer to Drawing No. 1220/01/20A01, Appendix L, Volume IV
12.2.2 Civil works
HEADWORKS SITE
Weirs with frontal intake and two radial bottom sluice gate, gravel trap and gravel flushing conduit and Intake Tunnel
The weir will be constructed by excavating along weir axis upto required depth. The construction of weir will take about nine months.The intake and gravel flushing tunnel will be constructed by excavating on the right riverbank up to required depth as per the site condition. This excavation will include the excavation for gravel trap. Coarse trash racks will be fitted to control the flow into intake tunnel. Downstream of the gravel trap up to the settling basin, a intake tunnel will be constructed. This tunnel will convey the diverted water into the settling basin. Gravel flushing tunnel will also be constructed to pass the flush out sediment back to the Nyadi khola downstream of the intake.
The excavation of the headworks site will be completed in 45 days and thereafter concreting work will commence and the whole construction works will be envisaged to be completed in 314 days. The excavation work for intake tunnel and gravel trap will take about 134 days including site clearance. After this, concreting work with placement of reinforcement bars will be carried out to construct D-shaped concrete lining tunnel. The time for such work is anticipated to about 55 days. The gate and flushing mechanism installation will take 95 days.
Settling Chamber
The excavation for Settling Chamber will be carried out in two faces. The first face will be flushing tunnel. The second face will be excavation from the upper portion of the settling basin where it is exposed to access tunnel. From the first face, flushing tunnel will be excavated with require supports upto settling basin outlet as procedure and methodology used in tunnel (mechanised method) and from the second face, access tunnel will be excavated upto top of settling basin. And boring pilot shaft from access tunnel to flushing tunnel and excavation will be in done in different stages by heading and benching method.
The excavation of the settling basin will commence after the excavation of the access tunnel, which will require 55 days and to complete and excavation flushing tunnel and settling chamber will take 501days. The concrete works will be carried out in two phases. The concreting will commence immediately after the excavation and will take 95 days to finish of the settling chamber. The erection and commissioning of all hydraulic structures will be completed in 100 days.
Hydro Consult Nyadi Hydropower Project Volume 1 Main Report
Nyadi Hydropower Limited
12-4
WATERWAY
Headrace Tunnel
The waterways of the project constitute combination tunnel, surface penstock and Drop shaft. But the major part of the water way includes the tunnel. The headrace tunnel starts from the outlet of the settling basin bifurcating tunnels. Headrace tunnel runs along the waterway alignment to feed water to penstock located at the end of the headrace tunnel.
Generally, excavation of headrace tunnel in four faces can run parallel. However, before commencing the tunnel excavation, intake portals should be excavated first. The 3955 m long tunnel will be inverted D shaped tunnel with 3.2 m base width and 3.2 m height with 1.60 m above spring line. The tunnel excavation will proceed from four headings: headrace tunnel intake side, tunnel outlet side (surge adit portal) and two heading upon completion of Naije adit tunnel.
The excavation of the headrace tunnel can be done by mechanized tunneling method. Design length of holes will be drilled over the face based on design blasting pattern and charged with gelatine. Blasting will be done to break the solid rock into small pieces in the required tunnel area. Fresh air will be supplied at face by process of ventilation to remove gas and dust produced by blasting. The blasted material i.e. muck will be cleared by using trolleys or trailers. The excavated muck will be disposed in spoil tip area by trolleys. After mucking, scaling process will be carried out in newly blasted area. An engineering geologist will be involved to determine rock mass classification, support requirement to held rock in place and geological logging of the tunnel. During tunneling work, ventilation, lighting, compressors and dewatering pumps will be needed.
The duration of tunnelling will be based on average advance rate of 12.5 m per week per face and will take about 667 days from each face to complete tunnel excavation. After excavation, temporary support such as shotcrete and rock bolt will be provided immediately and afterwards support will be provided depending on the rock mass quality. The recommended permanent support will be provided based on rock class (Drawing No. 1220/01/30A01, Appendix L). Spalling, umbrella grouting, reduction of pull length, water draining etc. techniques will be applied in extremely poor to exceptionally poor rock class to avoid over breaks.
In Headrace tunnel, two adits have been provided. One of adit is Naiche adit from where major mucks are disposed other is in surge shaft area. The total length of adit including curve portion is 176 metres. It will take about 103 days to reach headrace tunnel.
Before start of the penstock pipe, rock trap will be constructed by lowering tunnel floor by a metre or so. Flushing pipe will be laid parallel with the surge adit. The total length of this adit is 45 metres. It will take about 15 days to reach headrace tunnel. Adit plug and bulkhead door will be placed upon completion of permanent lining of tunnel.
Surge shaft
The surge shaft will be located at the left side of the headrace tunnel after gravel trap. The length from headrace tunnel to surge shaft is 26 metres. The excavation for surge shaft will be carried out in two consecutive stages. The first stage will consist of boring a pilot shaft using an Alimak raise climber and will be completed in 95 days. The second stage will be excavation from the upper portion of the shaft where it is exposed to Ventilation adit. The total length of ventilation adit is 30 metres and it will take about 17 days to reach surge shaft from outlet. Construction of dome of surge shaft will take 45 days and installation of winch will take 12 days. Shotcrete and grouted rock bolt in pattern will be provided after excavation. The access to the upper portion of the shaft will be available through proposed access road upto ventilation adit. Approximately, the excavation will be carried out for four months. The spoils from the shaft will be disposed at the spoil tip area located adjacent to the tunnel outlet portal. Upon completion of the surge shaft excavation, permanent lining will be provided as demanded by rock quality in 90 days.

Hydro Consult Nyadi Hydropower Project Volume 1 Main Report
Nyadi Hydropower Limited
12-5
Surface Penstock and Drop Shaft
Steel penstock pipe of 1.75 m diameter will be laid on the slope of the hill from the end of headrace tunnel. In underground powerhouse option, surface penstock is followed by a drop shaft towards the underground powerhouse. The penstock pipe is 676 m long and will be supported on 8 anchor blocks and 51 number of saddle supports spaced at 8.0 m interval. 7 months will require excavation and concreting works at surface penstock alignment. Another 12 months will require for concreting, laying, finishing and erection of penstock pipes.
Underground drop shaft of diameter 2.55 m will be excavated from top of Shaft. Firstly, hole of diameter 0.5 m will be drilled upto horizontal portion of penstock before bifurcation. After drilling of hole finished, enlargement of whole upto 2.55m by excavation and temporaray support method based on rate of excavation. Mucking of excavated material will fall into drill hole if it is impossible or progress of less than required. It will take 7 months for excavation and temporary supports with excavation rate 5 m/week and total 1.5 years will take for concrete and installation of penstock pipes in vertical shaft portion.
UNDERGROUND POWERHOUSE AND ACCESS TUNNEL
The construction of the powerhouse consists of two main parts: civil works and electromechanical works. This section briefly discusses about the construction activities on civil parts only. The main civil works in the powerhouse consists of excavation, rock support and concreting works. First of all, the excavation and supports of the access tunnel upto entrance gate of main floor area of powerhouse will be done by mechanized tunneling method which will take about 120 days. After the construction of access tunnel, excavation of power house cavern will be started in upward slope to reach the farthest crown portion of the cavern. After reaching the farthest crown, the excavation work will be progressed towards the entrance in order to achieve full section of the power house cavern. The rock supports required for the stability of the cavern will be provided at different stages depending on the rock conditions while the rock supports for the crown portions will be provided from early stage of excavation. The whole cavern construction activity will take about 360 days. In case of underground powerhouse option, it will take about 180 days for super structure construction of powerhouse cavern.
The sub-structure concrete will be placed first before erection of the Pelton turbine units. The erection of the units will follow one after other for efficient use of manpower and to save erection time. The size and position of columns, beams and roofs are designed such that there will be enough space for the installation and movement of the powerhouse crane. The remaining part of the superstructure can then be completed with the use of the main crane. As soon as the finishing works are completed, the erection of the auxiliary equipments will be started.
TAILRACE
In underground powerhouse option, 356.50 m long inverted D-shaped tunnel has been proposed. The excavation and supports for the construction of tailrace tunnel will be done by mechanized tunneling method. The excavation of the tailrace will take about 95 days and shotcreting will take another two months.
SWITCHYARD
The outdoor switchyard will have surface area of 45 m x 22.5 m. In surface powerhouse options, the bus ducts connecting the generator to the step up transformer in the switchyard will be accommodated in a cable trench and exhaust shaft from the control bay. While in underground powerhouse option, cable duct passes through the access tunnel before connecting to the switchyard.

Hydro Consult Nyadi Hydropower Project Volume 1 Main Report
Nyadi Hydropower Limited
12-6
Site preparation for the switchyard by levelling can be carried out independent of other works. The civil works for the switchyard will be completed in five months.
12.2.3 Electromechanical equipment
The construction activities of electromechanical works will involve design and manufacturing of the auxiliaries by the supplier itself at its factory. The supplier will be responsible for the erection, installation and commissioning at the project site. The successful bidder/s will take 450 days for design, fabrications and delivery of the equipment. After the necessary completion of civil foundation works, the erection of electromechanical equipment like turbine, generators, transformer and auxiliaries will commence. The erection of electromechanical equipment may take about 5 months.
12.2.4 Transmission line
Transmission facilities can be viewed as a separate entity of the project. About 4 months have been allocated following the contract award for the supplier/s. Design, fabrication and commencement of delivery of transmission towers and conductors will be made therein. One year has been scheduled for the erection of the transmission line, construction of substation and interconnection facilities.
12.3 Construction power The construction power to this project shall be supplied from the 33 kV bus bar of the proposed Thulobeshi 33/11 kV area substation. For this about 5 km of 33 kV line shall be constructed up to the project site. The construction power of 500 kVA has been proposed to operate the machinery and camp supply. This line should be designed keeping in mind that later on, it will be used to transmit the NHP generated power up to the 33 kV bus bar. Currently, the 33 KV transmission line of Siuri SHP is under construction which can be used for construction power purposes.
12.4 Construction Material The most of the construction materials required for the project will be procured from the domestic producers/ suppliers. The main construction materials required are as follows:
• Blasting materials and detonators • Cement • Brick or concrete blocks • Steel pipe, angles and plates • Stone/boulders • Gabion • Geo-textiles • Reinforcement bars and timber • Fuels • Sand • Coarse and fine aggregate • Cohesive materials and admixtures • Backfill and rock fill materials • Rock bolts • Mechanical and electrical items such as conductor wires
12.4.1 Sand
Samples of total aggregate were taken during the feasibility study. The location, quality and quantity of the aggregate at these locations are indicated in Appendix C, volume II Investigation Annex.
Owing to the steep gradient of the Nyadi Khola few suitable sand deposits have been identified on the river bank. Close to the headworks there are small deposits of sand downstream on the river bank below Naiche village. Samples taken are indicated by TP1, TP2 and TP3 on Figure D.18, Volume 2 and Appendix C. Owing to the high mica content the sand would be only be suitable for low grade

Hydro Consult Nyadi Hydropower Project Volume 1 Main Report
Nyadi Hydropower Limited
12-7
concrete after sieving out the gravel. However, the quantities available here are considered to be insufficient for the amount required at headworks.
For the Naiche adit the nearest available sand is indicated by TP1. Quantities available here are also small and insufficient.
Close to the powerhouse site no suitable sand was found.
The main sources of sand were found on the Marsyangdi River. Three samples of sand were taken from the banks of the Marsyangdi River. Sample locations are indicated by TP4, TP5 and TP6. Sand taken from TP4 area would require an additional length of access road from the bridge crossing site and up the left bank of the Marsyangdi River. Sand taken from TP5 area, north of Bhulbhule, would require a ropeway across the river to connect the source to the Besisahar to Chame road. Alternatively the sand would have to be portered up the left bank of the Marsyangdi River to a connecting point on the project access road. Sand in largest quantities was identified at TP6, a point which is very close to the existing road alignment between Besisahar and Khudi Bazaar.
The project will have to allow for importing most of the sand requirement from the Marsyangdi River by truck.
Further comments on the analysis of the sand samples are discussed in Appendix C, volume II Investigation annex.
12.4.2 Aggregate
For the headworks construction it is expected that most of the aggregate will come from selected crushed boulders. A crushing plant will have to be installed at the site. It is expected that some blasted material from the tunnels may be suitable for re-use as aggregate.
For the headrace tunnelling from Naiche adit some of the excavated material is expected to be good enough for crushing and re-use as aggregate. Where this is not the case boulders will have to be selected from the river bed and crushed. Options for delivery to this site are:
• Crush boulders at headworks and transport by road to Naiche adit. • Crush boulders on the Marsyangdi River or at the powerhouse site and transport by
road. • Crush boulders in the Nyadi Khola below Naiche and transport it by large Drum
trucks to the site.
For construction from the surge adit, small quantities of excavated material may be suitable for reuse as aggregate. It is anticipated that the rock here will not be as suitable as for example at Naiche adit. As above, boulders will have to be selected from the river bed and crushed. Options for delivery to this site are:
• Crush boulders on the Marsyangdi River or at the powerhouse site and transport by road.
• Crush boulders in the Nyadi Khola below the powerhouse site and transport to the site via the road.
Further comments on the aggregate samples are discussed in Appendix C, Volume II Investigation Annex.
12.4.3 Hard stone for weir lining
Hard stone for lining the weir (Refer to Drawing 1220/01/20A02) will be selected from the hardest quartzite stone near to the intake site. Bedrock at the Siuri Khola intake site was noted for its hardness. Selected stone will either be taken from the river bed or excavated stone from the tunnel.
Hydro Consult Nyadi Hydropower Project Volume 1 Main Report
Nyadi Hydropower Limited
12-8
12.5 Contract package and construction schedule
12.5.1 Contract package
For the smooth execution of the project following main contract packages shall be made.
Contract C1: Preliminary site works including: Bridge over Marsyagdi River Access road Construction camps
Contract C2: Main civil works
Contract C3: Penstock and hydro mechanical works
Contract C4: Electromechanical works
Contract C5: 132 kV transmission line
For civil works, one main contractor will be preferred so that necessary co-ordination between different activities will easily be managed. For electromechanical works, most of the works will be carried out in the contractors’ workshop and should be divided into sub packages. One contractor will be awarded the access road construction and infrastructure development so that access road construction could be completed in time before mobilization of the main civil contractor.
12.5.2 Construction schedule
The anticipated construction schedules are shown in figure 12.1 for construction stage. The schedule has been written taking into account a possible construction contract package. Contract lots have been used to divide up the construction work. The package is arranged so that the critical path works and basic site infrastructure can be established as early as possible assuming that financing can be arranged for these parts. This is indicated in section 12.5.2. Critical path pre-contract works are included in the schedule. The contract packages are as follows:
Contract C1: Preliminary site works including: Bridge over Marsyagdi River Access road Construction camps
Contract C2: Main civil works
Contract C3: Penstock and hydro mechanical works
Contract C4: Electromechanical works
Contract C5: 132 kV transmission line
Following assumptions were made in the preparation of this schedule
• One team will construct the weir and intake with gravel flushing tunnel. • One team will construct the settling chamber with flushing tunnel. • One team will construct the headrace tunnel from the headworks adit and other two
teams will work from the intermediate adit and last one team will work from the surge adit, expected average progress in the headrace tunnel at 25 m/wk per heading,
• Two teams will erect the penstock at 50 m/wk each, the transfer end stations and the penstock pipe
• The overall estimated construction time is 4 years.
In preparation of the schedule, additional contingency time has also been allowed for training local labour to work on the project, for festivals and lost time caused by the monsoon season. Further,
Hydro Consult Nyadi Hydropower Project Volume 1 Main Report
Nyadi Hydropower Limited
12-9
for the construction schedule of the project major critical activities are also anticipated. These critical activities are listed below:
• Team mobilization • Construction of the access road • River diversion works • Construction of weir • Construction of tunnel intake • Construction of headrace tunnel • Penstock pipe laying • Construction of powerhouse foundation • Electromechanical equipment installations • Connection of transmission line to the national grid
The contractor might choose other methods as constructions get underway, but this should shorten rather than prolonged the construction period.

Hydro Consult Nyadi Hydropower Project Volume I Main Report
Nyadi Hydropower Limited
13-1
13. PROJECT COST ESTIMATION
13.1 Introduction This section of the report describes the methodology used for derivation of the project cost. The estimate is the final and shall be considered different from the cost estimates presented in Project Optimization (Section 8).
The costing of the project has been carried out based on the detailed feasibility study carried out by consultants experience in this field. Wherever possible, current costs of equipment and material have been taken from manufacturers. Where these have not been available, restructured costs have been taken based on past projects carried out in Nepal.
The estimation process was carried out in parallel with construction planning presented in Section 12.5.2, as these two activities are complementary to each other.
13.2 Assumptions The following criteria and assumptions are the basis of the cost estimate:
The cost estimate and financial analysis have been based on the US dollar.
The exchange rate used for cost estimate is US $ 1 = NRs 75
Price level
The cost estimate has been made at the price level of 2010. All costs have been first estimated on unit basis for each of the components. These have been added to obtain the entire project cost. Lump sum costs have been allocated for components where, a detailed breakdown of costs is not available or worthwhile.
Material price and labor cost
Material costs reflect real costs incurred at other projects of similar size or having similar scope of works. The prices have been calculated for 2010. It is assumed that the bulk of the construction material can be obtained in the local market whereas some of the steel items and cement and all of the electromechanical equipments need to be imported.
Some skilled and all of the semi-skilled and unskilled manpower can be obtained locally.
Indirect cost
The unit costs include profit, and overhead, which the contractor would charge. Along with that, Value Added Tax (VAT) will be applicable to all construction materials procured. Therefore, 13% VAT has been included in the cost estimates, which the contractor would be subjected to. However, 1% of custom duty and 0.1% of go down charges have been applied to the imported material. A contingency sum has been added to the total civil and electro-mechanical cost as shown in detailed cost estimate presented in Appendix E, Volume III.
It is anticipated that an open competitive bidding is recommeded for awarding the contracts and the project will not be forced to use higher rates for any reason.
13.3 General methodology The project is divided into a number of major components for the estimating process as follows:
• Main civil construction works o Weir, intake, Boulder trap and gravel trap, Intake tunnel, settling basin
o Headrace tunnel and surge shaft
o Surface Penstock/drop Shaft, powerhouse and tailrace tunnel
Hydro Consult Nyadi Hydropower Project Volume I Main Report
Nyadi Hydropower Limited
13-2
• Powerhouse electro-mechanical equipment o Turbines
o Generators
o Transformers
o Auxiliary equipment • Switchyard and transmission line • Gates, valves and hoisting devices • Construction camp and access road • Engineering and management costs • Resettlement, land acquisition and environmental provisions • Physical contingencies
13.3.1 Main civil works estimate
The sequence for estimate preparation constitutes following steps:
• Breakdown of the total project into a number of distinct structures like Weir, Intake, settling basin, approach canal, headrace tunnel, surge shaft, penstock and drop shaft, Underground powerhouse and tailrace.
• Identification of distinct construction tasks or measurable pay items, such as overburden excavation, rock excavation, underground excavation, backfill work, concrete works, etc.
• Calculation of appropriate quantity of each item from maps and drawings. • Development of unit rate of construction works based on prevailing market rates
appropriately adjusted for the project area and standard norms and practices of the country. • Calculation of cost for each activity by summing up costs of different works required for the
structures. • Resources Cost
o For estimating purposes, the labour force was subdivided into four categories of workers, namely unskilled, semi skilled, skilled and highly skilled.
o Considering the overall construction requirements for the project, a 6 days x 10 hours workweek was selected as the basis for planning and estimating the major construction activities.
• Construction material o It has been assumed that most of the construction materials like cement,
reinforcement steel will be supplied from the local market and specific materials like penstock liners, gates, and cement will be imported from India or overseas. The more complex items such as drill material and steel fibres will be imported from overseas industrial countries.
13.3.2 Electrical and mechanical equipment
The cost includes supply, installation, testing and commissioning of all mechanical and electrical equipment from the powerhouse to the outdoor switchyard. The powerhouse electromechanical costs are based on budgetary proposal provided by some of the potential suppliers.
13.3.3 Penstock and hydro mechanical
Fabrication, transportation and erection costs of the penstock, gates, stop logs, trash racks etc are included in this package. All the rates used are based on information provided by local manufactures/suppliers.
13.3.4 Switchyard and transmission line
This cost package includes all electrical and civil costs of the proposed approximate 7 km long 132 kV transmission line joining the powerhouse with the NEA’s proposed switching station at the Marsyangdi corridor, downstream of Nyadi Confluence.
Hydro Consult Nyadi Hydropower Project Volume I Main Report
Nyadi Hydropower Limited
13-3
The cost estimate of the switching substation is based on BPC’s experiences of the past projects and some additional information provided by relevant parties consulted.
The detailed cost estimate is presented in Appendix E, Volume III.
13.4 Engineering fees Eight percentages of the total contracts sum has been allocated for engineering fees. This engineering fee includes all studies as well as additional studies, all detailed design and construction supervision of the project.
13.5 Development cost Two percentages of the total cost is assumed as development cost to cover owner’s all cost including mitigation costs not covered in the Contract C1 (Refer Section 12.5.1).
13.6 Contingency sums Different percentages of total amount have been allocated for contingency sum in case of uncertainties and other variations, if applicable (refer Table 13-1 for details of cost summary and contingencies).
13.7 VAT and taxes As per the VAT practices in Nepal, 13% of the VAT has been considered as shown in Table 13-1 . Furthermore, 1% of custom duty and 0.1% of go down charges have been applied to the amount of imported goods.
13.8 Project cost estimate The summary of project cost estimate for 2011 is given in Table 13-1. The costs in Table 13-1 are the outcome of above assumptions and various fees, contingencies as described in previous sections. The detail cost estimate is presented in Appendix F, Volume III. Project base cost should be revised based on price escalation and construction plan of project.

Hydro Consult Nyadi Hydropower Project Volume I Main Report
Nyadi Hydropower Limited
13-4
Table 13-1 Total base cost of project showing various items of the cost
Exchange Rate (US$) 75Installed capacity 30.0 MW
SUMMARY OF DIFFERENT
CONTRACT COSTS % NRs US$ NRs Total US$ TotalVAT
complyingVAT complyingNRs equivalent
Item Allocations
Civil works 337,075,604 17,203,070Contingency sum 10 33,707,560 1,720,307
Sub - Total 370,783,164 18,923,377 81% 1,449,929,510 42.59%
Electromechanical works 9,560,289Contingency sum 8 764,823
Sub - Total 10,325,112 8% 61,950,673 18.42%
Penstock and Hydromechanical works 109,701,337 1,497,023Contingency sum 10 10,970,134 149,702
Sub - Total 120,671,471 1,646,725 44% 106,216,494 5.81%
Transmission line works 35,272,100 780,401Contingency sum 8 2,821,768 62,432
Sub - Total 38,093,868 842,833 100% 101,306,375 2.41%
Marsyangdi Bridge and Access Road 134,441,099 449,509Contingency sum 10 13,444,110 44,951
Sub - Total 147,885,209 494,460 100% 184,969,677 4.40%
Siuri Tailrace Flow Diversion 16,225,634 1,065,773Contingency sum 10 1,622,563 106,577
Sub - Total 17,848,197 1,172,351 56% 59,233,723 2.52%
Socio-environmental mitigation costs 32,324,000 Contingency sum 5 1,616,200
Sub - Total 33,940,200 100% 33,940,200 0.81%
Infrastructure development costs 41,730,729 419,602Contingency sum 5 2,086,536 20,980
Sub - Total 43,817,266 440,582 100% 76,860,923 1.83%
Land acquisition and direct costs 38,416,858 Contingency sum 5 1,920,843
Sub - Total 40,337,701 0% 0 0.96%
Rural Electrification Costs 28,000,000 28,000,000 0% 0 0.67%
TOTAL CONTRACT COSTS SEPARATE 841,377,075 33,845,440
TOTAL CONTRACT COSTS US$ 45,063,801
ENGINEERING FEES 8 3,605,104 100% 270,382,806 6.43%
TOTAL CONTRACTS & ENGINEERING COST US$ 48,668,905 2,344,790,381
1.5 % INSURANCE COST 0.015 730,034Sub- Total (A) 49,398,939
TOTAL VAT COMPLYING US$ EQUIVALENTVAT 13 4,064,303TDS on Engineering fees 1.5 54,077
Total Taxes (1% custom duty & 0.1%
godown charge ) 1.1 372,300TOTAL TAX AND VAT (B) 4,490,680TOTAL CONTRACTS & ENGINEERING COST INC. VAT & TDS 53,889,618Owner's development costs 2,149,590
TOTAL PROJECT COST (Nearest $1000) for 2010 56,040,000
Cost escalation@5% p.a. 5% 2,802,000
TOTAL PROJECT COST (Nearest $1000) for 2011 58,842,000Notes:Unit rates are based at the site local to construction. 1,961 per KWUnit rates include cost of labour plant and materialsContingency sum cover forseen and unforseen risks. It does not cover cost overrun.Risks - ground conditions, strikes, material shortage, political instability, delay in license, manpower shortage
Unit Cost US$
Nyadi Hydropower Project (NHP)PROJECT COST ESTIMATE
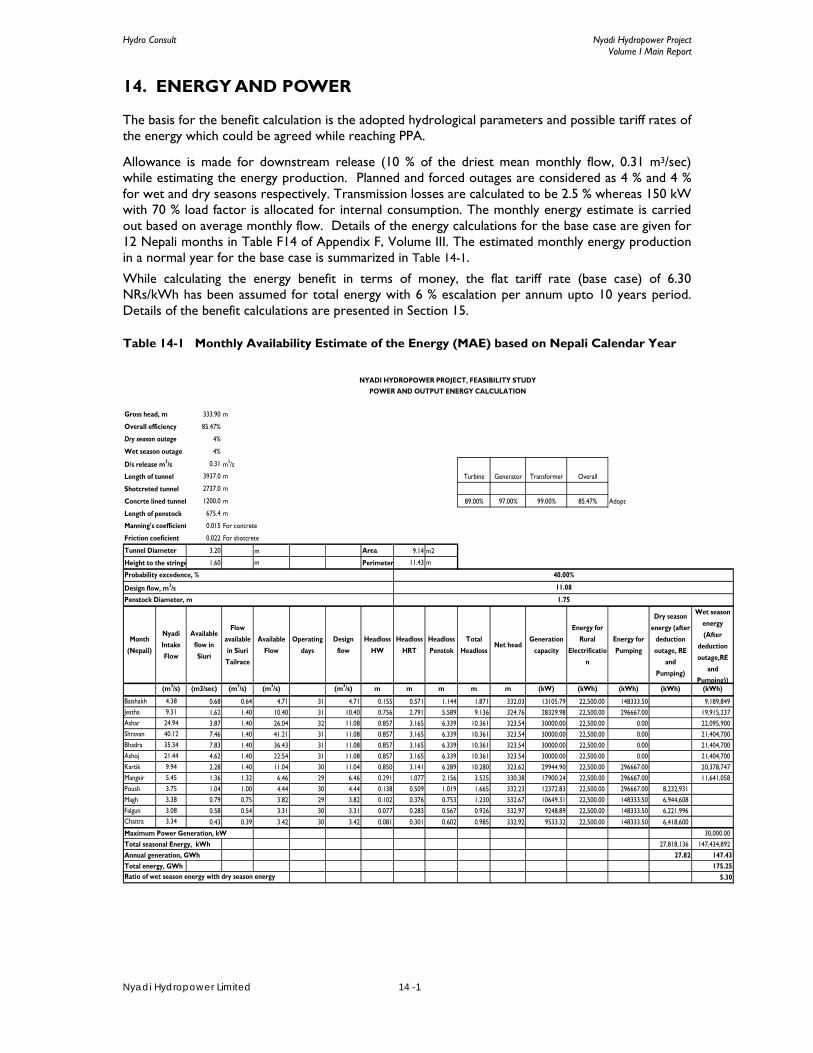
Hydro Consult Nyadi Hydropower Project Volume I Main Report
Nyadi Hydropower Limited 14 -1
14. ENERGY AND POWER
The basis for the benefit calculation is the adopted hydrological parameters and possible tariff rates of the energy which could be agreed while reaching PPA.
Allowance is made for downstream release (10 % of the driest mean monthly flow, 0.31 m3/sec) while estimating the energy production. Planned and forced outages are considered as 4 % and 4 % for wet and dry seasons respectively. Transmission losses are calculated to be 2.5 % whereas 150 kW with 70 % load factor is allocated for internal consumption. The monthly energy estimate is carried out based on average monthly flow. Details of the energy calculations for the base case are given for 12 Nepali months in Table F14 of Appendix F, Volume III. The estimated monthly energy production in a normal year for the base case is summarized in Table 14-1.
While calculating the energy benefit in terms of money, the flat tariff rate (base case) of 6.30 NRs/kWh has been assumed for total energy with 6 % escalation per annum upto 10 years period. Details of the benefit calculations are presented in Section 15.
Table 14-1 Monthly Availability Estimate of the Energy (MAE) based on Nepali Calendar Year
NYADI HYDROPOWER PROJECT, FEASIBILITY STUDY
POWER AND OUTPUT ENERGY CALCULATION
Gross head, m 333.90 m
Overall efficiency 85.47%
Dry season outage 4%
Wet season outage 4%
D/s release m3/s 0.31 m3/s
Length of tunnel 3937.0 m
Shotcreted tunnel 2737.0 m 90.50% 97.00% 99.50% 87.35%
Concrte lined tunnel 1200.0 m 89.00% 97.00% 99.00% 85.47% Adopt
Length of penstock 675.4 m
Manning's coefficient 0.015 For concrete
Friction coeficient 0.022 For shotcrete
Tunnel Diameter 3.20 m Area 9.14 m2
Height to the stringe 1.60 m Perimeter 11.43 m
Month (Nepali)
Nyadi Intake Flow
Available flow in Siuri
Flow available in Siuri Tailrace
Available Flow
Operating days
Design flow
Headloss HW
Headloss HRT
Headloss Penstok
Total Headloss
Net headGeneration
capacity
Energy for Rural
Electrification
Energy for Pumping
Dry season energy (after
deduction outage, RE
and Pumping)
Wet season energy (After
deduction outage,RE
and Pumping))
(m3/s) (m3/sec) (m3/s) (m3/s) (m3/s) m m m m m (kW) (kWh) (kWh) (kWh) (kWh)
Baishakh 4.38 0.68 0.64 4.71 31 4.71 0.155 0.571 1.144 1.871 332.03 13105.79 22,500.00 148333.50 9,189,849 Jestha 9.31 1.62 1.40 10.40 31 10.40 0.756 2.791 5.589 9.136 324.76 28329.98 22,500.00 296667.00 19,915,237 Ashar 24.94 3.87 1.40 26.04 32 11.08 0.857 3.165 6.339 10.361 323.54 30000.00 22,500.00 0.00 22,095,900 Shravan 40.12 7.46 1.40 41.21 31 11.08 0.857 3.165 6.339 10.361 323.54 30000.00 22,500.00 0.00 21,404,700 Bhadra 35.34 7.83 1.40 36.43 31 11.08 0.857 3.165 6.339 10.361 323.54 30000.00 22,500.00 0.00 21,404,700 Ashoj 21.44 4.62 1.40 22.54 31 11.08 0.857 3.165 6.339 10.361 323.54 30000.00 22,500.00 0.00 21,404,700 Kartik 9.94 2.28 1.40 11.04 30 11.04 0.850 3.141 6.289 10.280 323.62 29944.90 22,500.00 296667.00 20,378,747 Mangsir 5.45 1.36 1.32 6.46 29 6.46 0.291 1.077 2.156 3.525 330.38 17900.24 22,500.00 296667.00 11,641,058 Poush 3.75 1.04 1.00 4.44 30 4.44 0.138 0.509 1.019 1.665 332.23 12372.83 22,500.00 296667.00 8,232,931 Magh 3.38 0.79 0.75 3.82 29 3.82 0.102 0.376 0.753 1.230 332.67 10649.31 22,500.00 148333.50 6,944,608 Falgun 3.08 0.58 0.54 3.31 30 3.31 0.077 0.283 0.567 0.926 332.97 9248.89 22,500.00 148333.50 6,221,996 Chaitra 3.34 0.43 0.39 3.42 30 3.42 0.081 0.301 0.602 0.985 332.92 9533.32 22,500.00 148333.50 6,418,600 Maximum Power Generation, kW 30,000.00 Total seasonal Energy, kWh 27,818,136 147,434,892 Annual generation, GWh 27.82 147.43Total energy, GWh 175.25Ratio of wet season energy with dry season energy 5.30
Penstock Diameter, m
40.00%
11.08
1.75
OverallTurbine Generator Transformer
Probability excedence, %
Design flow, m3/s
Hydro Consult Nyadi Hydropower Project Volume I Main Report
15-1
15. FINANCIAL ANALYSIS
15.1 Introduction Financial analysis refers to an assessment of the viability/ profitability of a project or business. The financial analysis involves detail financial assessment starting from evaluation of project cost (input parameter) to financial evaluation of the project considering the revenue structure, project cash flow and the return to investment. This is done considering different legal provisions prevalent.
Investing in a Hydropower project is similar to investment in any other business and hence the expected return is guided by the risk associated with it. Hence an investor should take into different factors that influence the cash flow to the project and the return to equity holders. Different factors such as tax rates, royalty, interest rate, and cost of capital are important parameters that affect the return to the project and investment.
Hence, taking reference of Total Cost assessed and the total energy evaluated and taking into consideration different legal provisions affecting hydropower development in Nepal, this report presents the financial analysis of the Nyadi Hydropower Project (NHP).
15.2 Assumption in Financial Analysis Different assumptions form a critical part of the evaluation of the financial analysis. Some of the important assumptions used in the financial analysis of NHP are as follows:
15.2.1 Base Project cost estimate
The base year for project cost evaluation is 2010. The following costs are included in total project cost:
1. Costs incurred for construction and development: The base project cost for the project (2010) is estimated at 56.040 million USD at 40% exceedance. This cost includes the cost for construction and development of the project but excludes the cost for financing for the project.
2. Cost incurred to finance the project: Financing cost include the management fee, provision for bank charges and commission for loan management and associated charges to manage such capital. Financing cost is assumed at 2% of the costs incurred for construction and development.
The total base project cost of the project considering the financing cost and construction insurance cost is sum of 1 and 2 above and estimated at 57.161 million USD. The capitalized cost of the project including interest during construction for the loan is 68.296 million USD. However, considering the plan to start the construction of project in 2011, the updated base project cost will be increased tentatively by 5% considering inflation from 2010 to 2011. Hence the cost of project incurred for construction and development in 2011 to be estimated at 58.842 million USD and with the financing cost of 2%, the total base cost of the project shall stand at 60.01 million USD.
15.2.2 Construction Plan
The total construction period required for the project is assumed to be 4years. It is assumed that the construction shall be started in the year 2011 and the commercial Operation date shall be achieved by 2015.

Hydro Consult Nyadi Hydropower Project Volume I Main Report
15-2
Based on the construction plan, investment outlay requirement is determined as 1.5% (development cost) and 18.5%, 20%, 30% and 30% for the construction period. The development cost is incurred from the equity portion of capital. Accordingly, disbursement of capital investment is determined.
15.2.3 Financial Plan
The debt equity ratio considered for financing is assumed at 70:30. For the calculation of annual debt servicing amount, it is assumed that a commercial loan shall be available for 10 years. Also, interest during construction is capitalized in total capital requirement. It is also assumed that the loan shall be available from local banks in Nepali rupees hence foreign exchange risk is not considered in the calculation.
15.2.4 Investment Requirement
On the basis of financing plan and the capital investment requirement, Investment outlays for the project construction period in terms of equity and debt including Interest during construction (IDC) is calculated. Summary of investment is presented in the following table:
Table 15-1 Summary of Investment
15.2.5 Project life
The period of operation for financial analysis is considered to be 30 years from the commercial Operation date.
15.2.6 Interest rate on debt capital
Interest rate is assumed at 14%. This is taken considering the prevailing commercial interest rate as indicated by Nepal Rastra Bank.
15.2.7 Loan Maturity
Loan duration of 10 years is considered for the debt capital. Debt servicing amount (principal and interest) is assumed to be on equal installment payments.
15.2.8 Initial working Capital
An amount equivalent to operations and maintenance cost for one month of total operation and maintenance expenditure is assumed to be the working capital requirement of the project.
Construction Period Years 4 Investment Outlays
Total Project Cost 0th
year 1st
Year 2nd Year
3rd Year
4th Year
Cost % 1.5% 18.5% 20.0% 30.0% 30.0%
Amount (USD '000) 964
11,892
12,856
19,284
19,284
Debt Debt % 0.0% 20.0% 20.0% 30.0% 30.0%
Amount (USD '000) -
8,403
8,403
12,604
12,604
Equity Equity % 20.0% 20.0% 30.0% 30.0%
Amount (USD '000) 964
3,489
4,453
6,680
6,680

Hydro Consult Nyadi Hydropower Project Volume I Main Report
15-3
15.2.9 Operation and Maintenance cost
Operations and Maintenance cost is assumed to be 2% of total project cost.
15.2.10 Corporate overhead and Operation Insurance
Corporate overhead and Operation Insurance cost is assumed to be 1. 5 % of the total project cost.
15.2.11 Royalty
Royalty cost is based on the Nepal electricity Act. As per the act the generator has to pay a fixed capacity charge royalty of 100 per KW and variable energy royalty charge of 2 % of revenue for the first 15 years and then after 1000 per KW and 10 % of revenue respectively.
15.2.12 Corporate Tax
Corporate Tax has been considered taking reference of prevalent government policy of a tax holiday of 7 years and a tax concession of 50 percent for next three years after the Commercial Operation Date. The tax is taken at 21.5%.
15.2.13 Depreciation
Depreciation rate is taken at 4 % straight line to fully depreciate the project cost at the end of 25 years.
15.2.14 Bonus
A bonus of 2 percent is considered, as is provision in the bonus act.
15.2.15 Energy and Energy price
The total energy generated from the NHP is presented in Table 15-2:
Table 15-2 Energy generated from the NHP
For the calculation of sales revenue, energy price is assumed as following:
Percentage Exceedance (%)
Installed capacity(MW)
Sellable Dry
(GWh)
Sellable WET
(GWh)
Total Sellable Energy, GWh
Base Project cost, US$ Million
40 30.00 27.82 147.43 175.25 58.84
Dry Energy Wet Energy
COD Tariff NRs/kWh 6.3 6.3
Escalation of Tariff 6% 6%
Escalation years after COD 10 years 10 years
Type of escalation Simple Simple

Hydro Consult Nyadi Hydropower Project Volume I Main Report
15-4
15.3 Financial Evaluation of NHP Financial Evaluation of the project has been done using Free Cash Flow to Equity (FCFE) method of evaluation. This method is recommended and is used to consider for opportunity cost and time value of money. As a general practice, a discount rate of 10 % is taken to calculate the NPV of a hydropower project. Since the discount rate represents the weighted average cost of capital and with a capital structure of 70:30, it is estimated at 15% taking into consideration prevalent interest rate of 14% and a required rate of return for investors at 18% plus. However for analysis purpose, the cost of capital is assumed at 14% (corresponding to prevalent interest rate) only. The FCFE method of project evaluation recommends the following:
Estimation of cash flow stream from the project and comparison of cash inflow stream from the project against the cash outflows committed for the project;
Discount the cash outflow and cash inflow with the weighted average cost of Capital to obtain Net Present Value (NPV) of cash outflow and cash inflow.
Estimate the NPV of the project by deducting NPV of Cash outflow from NPV of Cash Inflow for both the project and equity holders.
Estimate the return to project (PIRR) and return to equity (EIRR). Estimation of Benefit-Cost Ratio (B-C) ratio
15.3.1 Result of Financial Evaluation
On the basis of aforementioned important assumptions, the following important financial results are observed for NHP:
Table 15-3 Financial Indicators of NHP
Project Input Parameters Percentage Exceedance (%) 40 Installed capacity (MW) 30 Dry Energy (GWh) 27.82 Wet Energy (GWh) 147.43 Total Energy (GWh) 175.25 Project cost, US$ Million 58.841 Financial Summary PIRR 16.99% EIRR** 17.13% Benefit Cost Ratio 1.41 Total Benefits (NPV Equity) in '000 USD) $5762
The NPV Project is positive; IRR is greater than cost of capital and BC ratio is much more than unity. Hence the financial analysis of the NHP shows that the project is lucrative for investment based on the assumptions discussed above.

Hydro Consult Nyadi Hydropower Project Volume I Main Report
15-5
Figure 15-1 Financial Analysis Sheet of NHP
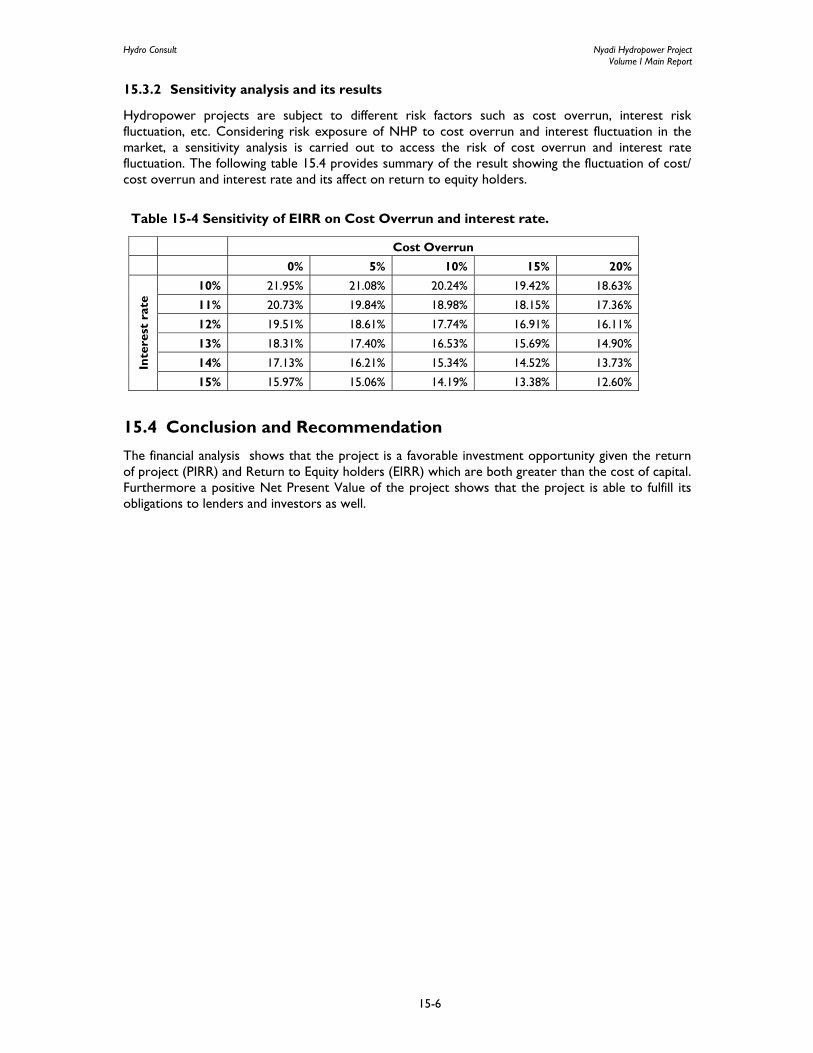
Hydro Consult Nyadi Hydropower Project Volume I Main Report
15-6
15.3.2 Sensitivity analysis and its results
Hydropower projects are subject to different risk factors such as cost overrun, interest risk fluctuation, etc. Considering risk exposure of NHP to cost overrun and interest fluctuation in the market, a sensitivity analysis is carried out to access the risk of cost overrun and interest rate fluctuation. The following table 15.4 provides summary of the result showing the fluctuation of cost/ cost overrun and interest rate and its affect on return to equity holders.
Table 15-4 Sensitivity of EIRR on Cost Overrun and interest rate.
15.4 Conclusion and Recommendation The financial analysis shows that the project is a favorable investment opportunity given the return of project (PIRR) and Return to Equity holders (EIRR) which are both greater than the cost of capital. Furthermore a positive Net Present Value of the project shows that the project is able to fulfill its obligations to lenders and investors as well.
Cost Overrun 0% 5% 10% 15% 20%
Inte
rest
rat
e
10% 21.95% 21.08% 20.24% 19.42% 18.63%
11% 20.73% 19.84% 18.98% 18.15% 17.36%
12% 19.51% 18.61% 17.74% 16.91% 16.11%
13% 18.31% 17.40% 16.53% 15.69% 14.90%
14% 17.13% 16.21% 15.34% 14.52% 13.73%
15% 15.97% 15.06% 14.19% 13.38% 12.60%

Hydro Consult Nyadi Hydropower Project Volume I Main Report
16-1
16. CONCLUSION AND RECOMMENDATIONS
16.1 Conclusion Techno-commercial viability of Nyadi Hydropower Project (NHP) has been checked. After the detail study of the project and field investigations the project cost has been estimated. Financial evaluations were also carried out to determine the viability of the project. Overall evaluation of the project indicates that the Project is technically feasible, financially viable and environmentally friendly. Based on the various studies as described in this report, following conclusions can scientifically be drawn:
• On the Nyadi River, a concrete diversion weir can be constructed to divert 11.08 m3/s of discharge to the power plant. The tailrace water of Siuri Khola Small Hydropower Project will be pumped to the head pond of NHP to make the project financially viable.
• The implementation of the project will help to enhance the socio-economic status of the local communities. The adverse impacts due to project will be properly mitigated.
• Considering the topographical, environmental as well as geological conditions of the site, it is decided to propose underground settling basin and underground powerhouse.
• There are no settlements in the project vicinity except upper-mid hill areas and therefore there are no major consumptive water use facilities.
• The project will have three Pelton turbines with an optimum installed capacity of the 3 x 10.46 MW that can generate 175.25 GWh of annual energy.
• The power generated from the project shall be evacuated to the switchyard of NEA Hub at Marsyangdi corridor with Switching arrangement about 7 Km long 132 KV transmission line.
• The project is expected to be completed at a base cost of 58.84 million US dollars within about 4 years after the mobilization of contractors at site.
• The project is financially viable at the proposed tariff rate of NRs. 6.30/KWh with internal rate of return on project and equity of 16.99 % and 17.13 % respectively.
• The 13.50 Km long access road of Nyadi Hydropower Project is a district level road of
Lamjung district. This road will start from Thankanbesi (Besisahar-Chame Road) to the end point at headwork site.
16.2 Recommendations In addition to conclusions, some recommendations are necessary to draw some guidelines of the critical activities that should be carried out to support and as part of the detailed design processes. Hence, followings are few recommendations for further study to be conducted before construction of the project:
• The Nyadi Hydropower Project (NHP) is recommended for implementation as it is found to be viable from the technical, economic, financial and environmental aspects.

Hydro Consult Nyadi Hydropower Project Volume I Main Report
16-2
• Nyadi Khola catchment is an ungauged catchment and an accurate assessment of long-term
hydrology is necessary for the project. Even different methods have been used to determine the hydrological data of the river with limited measurements during this study; it is highly recommended to continue flow measurements for the updating of hydrological data. Basically the hydrological data shall be updated with regular records of gauge heights and regular discharge measurements along with sediment sampling at the gauging station established during present study.
• It is recommended to consult about the flushing (S4) system in settling chamber with the
concerned expert.
• Regarding the water sharing, a healthy understanding to be made with local communities.
• In the feasibility study some of the equipment such as water level monitor, real time sediment monitoring system, and sounding reel at intake, gravel trap and settling chamber has been purposed for the better operation and to increase the life span of the power plant equipment. Further study on its requirement and the possible supplier along with its compatibility need to be done.
• Dual purpose of diversion tunnel as a fish ladder need further studies with the coordination
with fish biologist and its Hoisting System/ Operating Mechanism of Gates and Stop logs can be revised taking the input from the possible supplier.
• Opening of the fine trash rack can only be finalized from the input of the possible turbine
supplier. The cleaning mechanism of trashrack can be the mechanical or electrical in place of manual.
• The financial analysis is based on the assumption that the project will start construction in 2011. If the project is delayed, the project cost should be updated to accommodate the inflation.
Hydro Consult Nyadi Hydropower Project Volume I Main Report
17-1
17. REFERENCES Arita, K., Ohta, Y, Akiba, C., and Maruo, Y., 1973, Kathmandu Region, In S. Hashimoto (Supervised by)
Geology of the Nepal Himalayas, pp. 35–40. Aydan O, Akagi T., and Kawamoto T., 1991, the squeezing potential of rocks around a tunnel: theory and
prediction. Rock Mechanics and Rock Engineering, v. 26(2), pp137-163. Barton et. al., 1978, “Suggested methods for the quantitative description of discontinuities in rock mass.”
International Journal of Rock Mechanics and Mining Sciences & Geomechanics Abstract, vol.15, No.6. pp. 319-368.
Bhasin R. and Grimstad E., 1996, The use of stress-strength relationships in the assessment of tunnel stability, Tunneling and Underground Space Technology, v. 11, pp. 93-98.
BPC Andhi Khola Hydel and Rural Electrification Project, Feasibility and Preliminary Design Report, January 1982.
BPC Civil works guidelines for Micro-Hydropower in Nepal, With International Technology Group (ITDG), May 1996
BPC Nyadi Hydropower Project, Feasibility Study, Volume 1- Main Report March 2000
BPC; Norpower A.S. Khimti Khola Hydroelectric Project, Feasibility Study Final Report, Volume 1- Main Report, April 1993
Chow, V. T. 1998 Applied Hydrology, McGraw-Hill International Edition DHM.1969-1988 Hydrological Records of Nepal. Stream flow summary (7 volumes). HMGN
Ministry of Water Resources, Department of Hydrology, and Meteorology, 1988
DHM.1972-1994 Data of Gauge Stations 446.3, 446.8, 447, Department of Hydrology and Meteorology, 1988
DoLIDar, 1998 Technical Specifications for Agricultural and Rural Roads. Ministry of Local Development, Transport Division. 1998
Elizabeth M. Shaw Hydrology in Practice, Third Edition, Stanley Thornes (Publishers) Ltd. HAAKON STOLE Withdrawal of Water From Himalayan Rivers, Sediment Control at Intake,
Trondheim, April 1993, Ivb Report B-2-1993-3 HMGN 1972 Plant Protection Act HMGN 1973 National Parks and Wildlife Conservation Act HMGN 1977 Land Acquisition Act 1977 HMGN 1982 Soils and Watershed Conservation Act HMGN 1992 Electricity Act HMGN 1992 Forest Act 1992; HMGN 1993 Aquatic Animals Protection Act HMGN 1993 Electricity Regulations HMGN 1993 Hydropower Development Policy HMGN 1993 National Environmental Impact Guidelines HMGN 1993 Water Resources Act HMGN 1993 Water Resources Regulations HMGN 1997 Environment Protection Regulations (EPR) and (it’s Amendment 1999). HMGN 1997 Environment Protection Act (EPA) HMGN 1999 Local-Self Governance Act HMGN 2000 Local-Self Governance Regulation HMGN Design Manuals for Irrigation in Nepal, M.7 Headworks, River Training
Works and Sedimentation Manual. HMGN Forest Policy ICIMOD 1996 Climatic and Hydrological Atlas of Nepal, International Centre for Integrated
Mountain Development, Kathmandu, Nepal, 1996 IHP/UNESCO.1994 Applied Hydrology for Technicians, Vol IV, International Hydrological
Programme, United Nations Educational, Scientific and Cultural Organization, Paris, 1994
Hydro Consult Nyadi Hydropower Project Volume I Main Report
17-2
Jethwa J. L., Singh B. and Singh B., 1984, Estimation of ultimate rock pressure for tunnel linings under squeezing rock conditions, A new approach. ISRM Symp. Design and performance of underground excavations (E.T Brown and J.A. Hudson eds.). Cambridge, U.K. Thomas Telford. pp. 231-238.
NEA 1998 Feasibility Study of Kabeli – A Project Main Report (Volume 1 of 6), Prepared by NepalConsult (P) Ltd. in association with Hydro Engineering Services (P) Ltd. November 1998
NEA, 2004 Report on Transmission Planning Study 2004. Nepal Electricity Authority (NEA), Planning and Information Technology, System Planning Department. February 2004
Seismic Harzard Map of Nepal, 2002. Published by National Seismological Centre, Department of Mines and Geology, HMGN. September 2002
Sharma, K. P. et. al. Hydrological Estimations in Nepal. Department of Hydrology and 1984 Meteorology, HMGN.2004 Subramanya, K. 1984 Engineering Hydrology. Tata McGraw-Hill Publishing Company. New Delhi.
Second Edition.1994 Sunuwar, S. C., 2002, Squeezing tunnels in Nepal: Case studies. Proceedings of ISRM Regional
Symposium on “Advancing Rock Mechanics Frontiers to Meet the Challenges of 21st Century”, New Delhi.
Sunuwar, S. C., 2005, Geological problems in the hydropower development of Nepal: Case studies” Proceedings of 6th International Conference on Development of Hydropower: A Major Source of Renewable Energy, June 7-9, 2005, Kathmandu, organized by Irrigation Board of India & Nepal Electricity Authority, pp. 130-141.
Sunuwar, S. C., 2005, Rock Support Design Practice - Case studies: Hydropower Projects in Nepal. Journal for Engineering Geology, Geomechanics and Tunneling in Austria, Felsbau, April, 2/2005, pp. 44-50.
Talalov, V. A., 1972, Geology and ores of Nepal, UN/UNDP special report. In: Sharma C.C., Geology of Nepal Himalayas and adjacent area, 1990, pp. 479.
Varshney, R. S. 1974 Engineering Hydrology. New Chand & Bros. Roorkee (U.P). Third Edition. 1985
WECS / DHM.1990 Methodologies for estimating hydrological characteristics of ungauged locations in Nepal (2 volumes). HMGN Ministry of Water Resources. Water and Energy Commission Secretariat and Department of Hydrology and Meteorology. July 1990.


![a… · qqqq Cl C] < O n o o o](https://img.pdfslide.net/doc/110x75/5b14e8d17f8b9a7d068c97ab/a-qqqq-cl-c-o-n-o-o-o.jpg)