Embed Size (px)
Citation preview
1 Cairn India Ltd.
10th Biennial International Conference & Exposition
P 328
Qualitative and Quantitative Analysis of a reservoir by Waveform
Classification – A case study, Aishwariya field, Barmer Basin
Namita Pahwa*1, Harshvardhan1, Anil Malkani1 and Peter Hansen1
Summary
Seismic attributes are extensively used for predicting the lithological and petro-physical properties of the reservoir, which
helps in hydrocarbon exploration. The waveform classification technique uses the wave shape of these seismic attributes as a
classifying parameter. In this technique, an interval of interest is defined with the help of interpreted horizons. And then a
suite of waveforms is generated that best expresses the wave shapes of all the seismic traces within that interval. Upon
classification into these classifiers, self-organized maps are generated which may depict depositional and structural patterns
which thereby infer reservoir properties.
The Aishwariya Field, situated within the RJ-ON-90/1 Contract Area, was discovered in March 2004. It is currently the third
largest onshore field discovered in the Barmer Basin of Rajasthan, India. In the present study, waveform classification is
carried out within the interval of interest defined by two horizons picked in the field. The high density 3D seismic data is being
represented through low density self-organized maps which are generated through Neural Network Training of the wave
shapes. These maps are then utilized to estimate the geology of the area as a different wave-shape can mean a different
geology. Waveform maps often unravel the depositional environment. It is demonstrated that once a geological understanding
of the seismic signatures is achieved, the semi-quantitative or quantitative interpretation of seismic facies is conceivable with
the help of supervised waveform classification. The Net/Gross of the reservoir is calibrated with the shape of the seismic
signature and hence NtG model is inferred in Aishwariya Field using this technique.
Keywords: Net/Gross (NtG), Waveform Classification (WFC), Self-Organized maps (SOM), Neural Network Training
Introduction
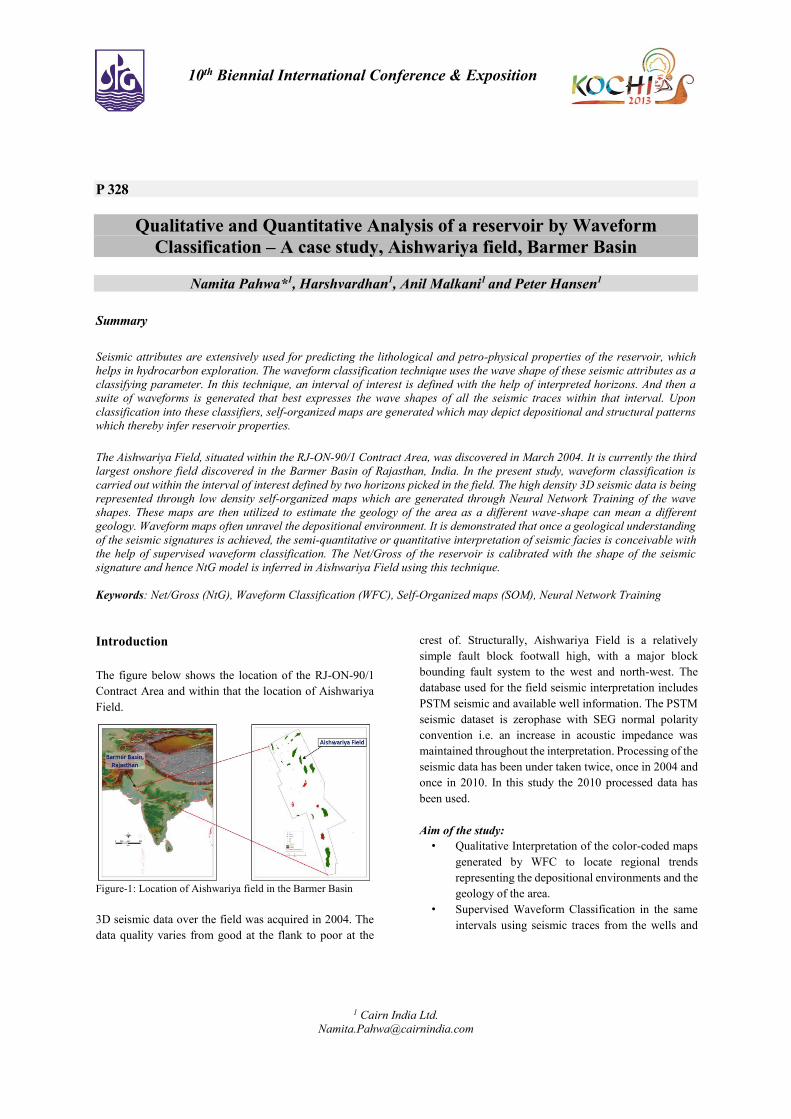
The figure below shows the location of the RJ-ON-90/1
Contract Area and within that the location of Aishwariya
Field.
Figure-1: Location of Aishwariya field in the Barmer Basin
3D seismic data over the field was acquired in 2004. The
data quality varies from good at the flank to poor at the
crest of. Structurally, Aishwariya Field is a relatively
simple fault block footwall high, with a major block
bounding fault system to the west and north-west. The
database used for the field seismic interpretation includes
PSTM seismic and available well information. The PSTM
seismic dataset is zerophase with SEG normal polarity
convention i.e. an increase in acoustic impedance was
maintained throughout the interpretation. Processing of the
seismic data has been under taken twice, once in 2004 and
once in 2010. In this study the 2010 processed data has
been used.
Aim of the study:
• Qualitative Interpretation of the color-coded maps
generated by WFC to locate regional trends
representing the depositional environments and the
geology of the area.
• Supervised Waveform Classification in the same
intervals using seismic traces from the wells and

2
knowledge of Net/Gross values for each well, for
the quantitative interpretation.
• Calibration of Net/Gross with the seismic trace
shape and verifying these results by taking one well
with known Net/Gross as a blind well and checking
the correlation of the seismic trace shape in that
well with its Net/Gross.
Methodology
Unsupervised Waveform Classification
Figure-2 depicts the workflow of the unsupervised
waveform classification technique. 3D seismic volumes,
interpreted horizons at two levels (Upper Fatehgarh and
Lower Fatehgarh) and attribute maps namely P-
impedance, Variance etc. are used as inputs to the
waveform analysis. The next step is to classify the
classifier using Neural Network and finally self-organized
maps are created with the defined classes. The key to the
success of a waveform analysis work is a well interpreted
horizon that mimics the subsurface. As a result it is
desirable that the horizon should snap to peak, trough or
zero crossing.
Figure-2: WFC workflow
Interval Definition
The study Intervals are defined using the interpreted
horizons R1 (Top Fatehgarh), R2 (Top Lower Fatehgarh)
and R3 (base Fatehgarh). Table-1 summarizes the interval
definitions for four intervals. Intervals 1 to 3 were used for
unsupervised and 4 for supervised classification.
Figure-3: Interval Definition for waveform
Table 1: Interval Definition
Classifying the Classifier and Seismic
The WFC process starts with fixing the number of classes
envisaged in the study area. Neurons are generated from
the input seismic traces by Neural Network process and
they change their wave-shapes to represent the input
seismic. In this fashion the classes are formed.
To create the self-organized map from the input seismic, a
trace is selected (Figure-4) and correlated with the existing
classes. The best correlated class is assigned to this trace
keeping the topological structure of the input data intact.
This process is repeated for all the traces within the zone
of interest.
Various seismic attributes have been used in combination
to achieve the best classification. Figure-5 illustrates the
comparison of two SOM (self-organized maps) generated
by using reflectivity and a combination of reflectivity and
variance. The reflectivity and variance SOM has more
noise resulting in blurred definition of the structural
features whereas the reflectivity SOM has properly
mapped the faults at the crest and flank of the structure.
Also, one can observe the apparent lateral facies variation
from the crest to the flank.

3
Figure - 4: Classification process, every trace is being classified
based on the Neurons
Figure-5: Comparison of two SOM – Reflectivity and
Reflectivity & Variance.
Figure-6: Facies variation across the field.
Comparing the two maps in Figure-5, we observe that
using only reflectivity provides more apparent geological
details as compared to the combination of reflectivity and
variance. Hence using reflectivity attribute is desirable for
waveform analysis within interval-1. Figure-6 shows an
extra loop appearing near the flank which pinches out
towards the crest. This is attributed to a change in facies
from the crest to the flank.
Figure-7 depicts the WFC carried out for different
intervals. The depositional environment and facies are
changing from the Upper Fatehgarh to Lower Fatehgarh.
Notice the channel feature present in interval-3 (Lower
Fatehgarh) representative of fluvial deposition. Interval-2
is mainly deposited as marginal lake formation.
Figure-7: Comparison of final maps of all intervals

4
Supervised Waveform Classification and
Estimation of Net/Gross
Figure-8: Supervised WFC workflow
Supervised waveform analysis is carried out to estimate
the NtG in Aishwariya Field. NtG values at well locations
and un-supervised SOM are the main inputs for this
analysis. Usually the number of classes are fixed one less
than the number of wells to test the results on a blind well.
Subsequently, the classes are replaced from actual traces
from well. This incorporates the wells’ NtG data into the
classes. Finally the seismic is classified into these classes.
Table 2 provides the NtG values in Interval-4 for five wells
in the field. For estimation of NtG in this interval, the
number of classes considered is four, which are indexed to
the traces from four of the wells. Classification run
generates an SOM in which the blind well is assigned the
class to which it best correlates. It was consistently
observed that this waveform class represented NtG values
closest to the blind well. All wells were used in turn as
blind wells, with good results. Consider the example
illustrated by Figure-9 in which A-6z is a blind well. The
wave-shape and NtG values corresponding to the blind
well are best correlated to Well A-5 (refer Table-2). This
indicates that wave shapes do relate to NtG. This facilitates
the estimation of NtG away from the Wells.
Table 2: Net/Gross values for Interval 4
Figure-9: Supervised Classification in Interval-4 (Well A-6z as
blind well)
The unsupervised waveform classification is also carried
out within this interval (Figure-10). It is observed that
wells A-5 and A-6z lie in the same class (dark red color)
with high NtG. Similarly, A-2z and A-3 lie in the same
class (red color) with low NtG. Whereas Well A-1z with
medium NtG falls in a different class (light blue color).
To validate the WFC model, the wave shapes versus NtG
of two new Wells (A-10 and A-12) are analyzed. The
Wells A-10 and A-12 have NtG values 0.50 and 0.49
respectively. Notice that these Wells lie in the same class
(dark red color) representing the high NtG (Figure-10).
The classes from the SOM maps and NtG measurements
within the blind wells are converging. The depositional
environment at this interval is fluviatile.

5
Figure-10: Unsupervised classification for Interval-4, Notice the
regions of high NtG highlighted by the class with dark red color.
Conclusions
This study helps us to identify the advantages of waveform
classification for carrying out reservoir analysis. With the
help of unsupervised waveform classification, we can
observe many structural and stratigraphic features like
faults, facies changes across the horizon, some channel
features etc. Although there are imaging issues at the crest
of the field, WFC provides a reasonable framework to help
understand varying depositional features in the field.
Unsupervised and supervised waveform classifications
can be used for the qualitative and quantitative analysis of
the reservoir to locate the regions of high NtG. The good
NtG values encountered by the blind wells A-10 and A-12
validate the WFC model. Hence, SOM maps can be used
as an effective tool to map the NtG regions during well
planning and reservoir model building. WFC analysis
should be used as additional evidence along with other
geophysical and geological measurements, and not in
isolation.
Acknowledgement
The authors thank key subsurface professionals at Cairn
India who contributed to this work, particularly
Ananthakrishnan B., Sanjay Kumar and Sujoy Mukherjee
for supporting our work. The authors also acknowledge the
full support of Joint Venture partner, Oil and Natural Gas
Corporation to carry out this study. We thank the
management of Cairn India for their encouragement &
permission to publish the work.
References
A.Williamson, Quantitative Interpretation of Seismic
Facies- A case study, Oriente Basin Ecuador,EnCana
Corporation, Calgary.
Baaske et al., 2007, Using multi-attribute neural networks
classification for seismic carbonate facies mapping: a
workflow example from mid-cretaceous Persian Gulf
deposits, Geol. Soc. London, 277 (2007), pp. 105–120.